Embed Size (px)
Citation preview

Valuation and Deal Structuring
BIO
Advanced Business Development Course
April 2013
Prepared for:
Joe Dillon, MBA, CLP
President
℠ Bringing money to medicine©
DILLONCAPITAL S T R A T E G I E S

DILLONCAPITAL S T R A T E G I E S
Copyright 2013. All Rights Reserved. Synerphysics, Inc.
Any unauthorized reproduction, distribution or presentation of this work is strictly prohibited. Furthermore, the
information in this work has been obtained from a variety of sources and, as such, all statements, facts,
information, analyses, interpretations, and opinions contained in the report are provided “As Is” and are made
without representation or warranty of any kind by course organizers or the Authors as to accuracy,
completeness, usefulness, merchantability, fitness for a particular purpose, or otherwise.
A Word from the Attorneys

DILLONCAPITAL S T R A T E G I E S
“The only thing that you can guarantee about any
valuation is that it is wrong.”
– Pharma Exec
A Word from Grizzled Deal Makers

DILLONCAPITAL S T R A T E G I E S
5
08:30 Valuation Concepts and Discounted Cash Flow Models
09:45 Break
10:00 Valuation Tools and Techniques
11:00 Case study work
12:30 Lunch
13:30 Forecasting and Market Analysis
14:30 Case study work (and break)
16:00 Value Sharing and Deal Terms Structuring
17:00 Networking Reception
Valuation and Deal Structuring Program

DILLONCAPITAL S T R A T E G I E S
6
Before We Get Started
Your colleagues here – Know them & learn from them
You are part of the learning experience here

DILLONCAPITAL S T R A T E G I E S
7
Before We Get Started
Your colleagues here – Know them & learn from them
People’s expertise differ – Be patient and grow
You are part of the learning experience here

DILLONCAPITAL S T R A T E G I E S
8
Before We Get Started
Your colleagues here – Know them & learn from them
People’s expertise differ – Be patient and grow
The case study – Listen for helpful hints during lecture
You are part of the learning experience here

DILLONCAPITAL S T R A T E G I E S
9
Before We Get Started
Your colleagues here – Know them & learn from them
People’s expertise differ – Be patient and grow
The case study – Listen for helpful hints during lecture
The model – Essential, but its not just the math
You are part of the learning experience here

DILLONCAPITAL S T R A T E G I E S
10
Before We Get Started
Your colleagues here – Know them & learn from them
People’s expertise differ – Be patient and grow
The case study – Listen for helpful hints during lecture
The model – Essential, but its not just the math
Timing – Keep moving, no analysis paralysis
You are part of the learning experience here

DILLONCAPITAL S T R A T E G I E S
11
Before We Get Started
Your colleagues here – Know them & learn from them
People’s expertise differ – Be patient and grow
The case study – Listen for helpful hints during lecture
The model – Essential, but its not just the math
Timing – Keep moving, no analysis paralysis
Checkpoints – Make goals and observe checkpoints
Today
Tomorrow
Last day
You are part of the learning experience here

DILLONCAPITAL S T R A T E G I E S
12
Before We Get Started
Your colleagues here – Know them & learn from them
People’s expertise differ – Be patient and grow
The case study – Listen for helpful hints during lecture
The model – Essential, but its not just the math
Timing – Keep moving, no analysis paralysis
Checkpoints – Make goals and observe checkpoints
Today
Tomorrow
Last day
Case study solution – there is no one correct answer
You are part of the learning experience here

DILLONCAPITAL S T R A T E G I E S
13
Before We Get Started
Your colleagues here – Know them & learn from them
People’s expertise differ – Be patient and grow
The case study – Listen for helpful hints during lecture
The model – Essential, but its not just the math
Timing – Keep moving, no analysis paralysis
Checkpoints – Make goals and observe checkpoints
Today
Tomorrow
Last day
Case study solution – there is no one correct answer
The Ultimate Goal – Learn, make a deal and have fun.
You are part of the learning experience here

DILLONCAPITAL S T R A T E G I E S
14
My Background
Consulting – 2003 to 2013. Strategy and Analytics.
Small pharma – 1996 to 2003. Positions of CFO, COO,
CEO and Board member.
Big Pharma – 1987 to 1996. Business Development,
Evaluation and Analysis, R&D Portfolio Strategy, Long-
range Planning, Forecasting and Finance.
Education – Finance degree, MBA and several years
teaching at the graduate level. Certified Licensing
Professional (CLP).
Focus: Partnering/BD, strategic planning, deal strategy, deal
structuring, forecasting and valuations

DILLONCAPITAL S T R A T E G I E S
15
First……
let’s talk a little about deal trends and
the reality of value before we worry
about the math.
Valuations Challenges

DILLONCAPITAL S T R A T E G I E S
16
Deal Multiple Trends
0.0
1.0
2.0
3.0
4.0
5.0
Pric
e/R
ev
en
ue
Pharmaceutical Product Acquisition Multiples
Time
Multiples are a result, not a tool.
Value
Gap

DILLONCAPITAL S T R A T E G I E S
17
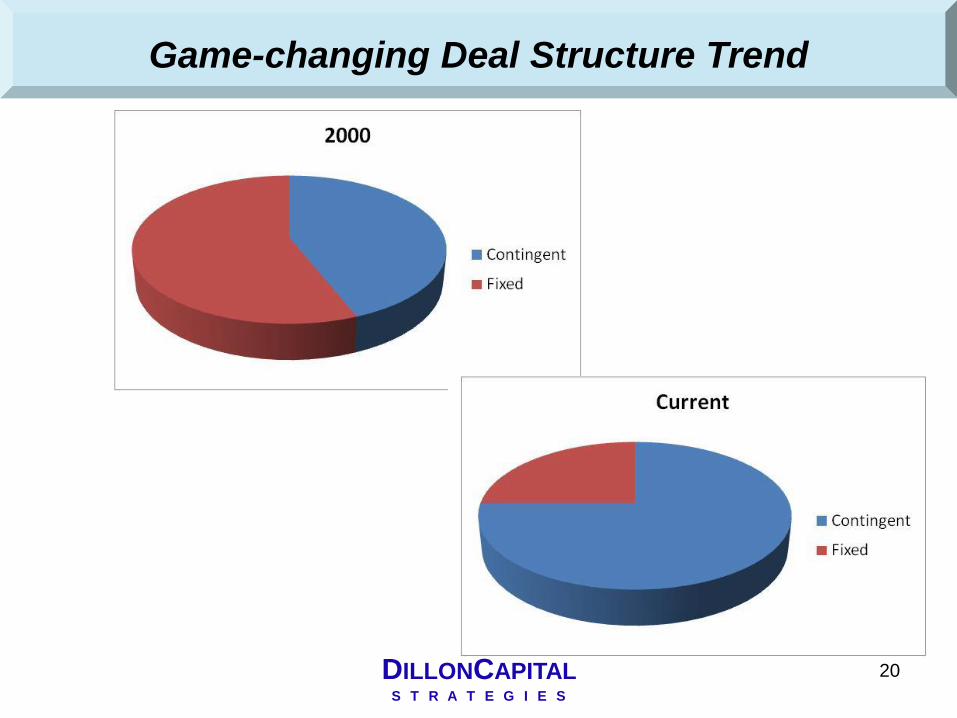
Number of Biotech Out-licensing Deals – Pipeline
acquisitions and alliances trending down 50% since 2006.
Value of those Deals – Tripled between 2004 and 2009, down
in 2010, but on the rise again 2011 & 2012.
Survival of the Bigs – “Biobuck” acquisitions in vogue. Re-
entering early stage market. Partnering with CVC and VCs.
Emerging market’s higher growth an attractive target. Pricing,
access and IP protection increasingly a major valuation factor.
Survival of the Smalls – New technology in high demand, “me-
toos” are a tough sell. Option deals and earnouts the new
reality. Credit and capital markets expanding.
Racing toward the cliff – Pharma falling off a 2011 – 2014
patent cliff that is erasing $78 billion in revenue on top of the
$32 billion it started losing in years just prior to the cliff.
Deal Trends
Risk sharing is the structure du jour

DILLONCAPITAL S T R A T E G I E S
18
Game-changing Deal Structure Trend

DILLONCAPITAL S T R A T E G I E S
19
Game-changing Deal Structure Trend
DILLONCAPITAL S T R A T E G I E S
20
Game-changing Deal Structure Trend

DILLONCAPITAL S T R A T E G I E S
21
2006 to 2012 Deal Trends *
2012 Deals Relative to 2006-2012 Averages
Preclinical – Value significantly up at ~$280M, upfronts down at
~10%.
Phase I – Value significantly down at ~$210M, upfronts down at
~10%.
Phase II – Value slightly up at ~$310M, upfronts down at ~15%.
Phase III – Value about average at ~$270M, upfronts down at
~16%.
* Important Note: Published deal values do not include the value of potential royalty steams and other
valuable consideration which the parties agreed not to make the monetary value of public.

DILLONCAPITAL S T R A T E G I E S
Reality Set In…………
"A lot of people become pessimists
from financing optimists."
— CT Jones
DILLONCAPITAL S T R A T E G I E S
23
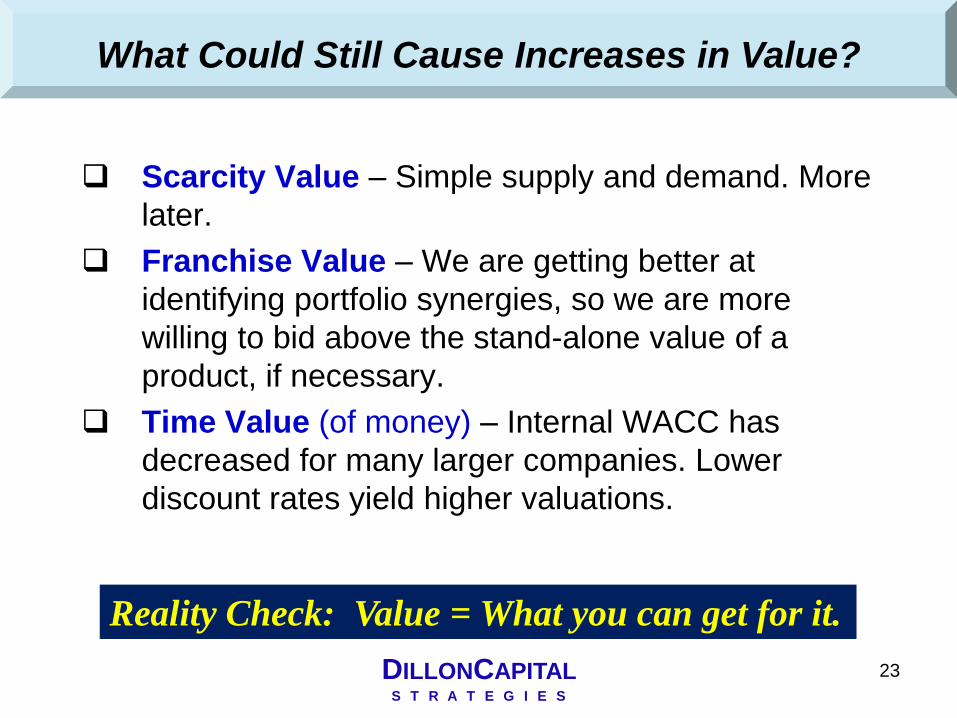
Scarcity Value – Simple supply and demand. More
later.
Franchise Value – We are getting better at
identifying portfolio synergies, so we are more
willing to bid above the stand-alone value of a
product, if necessary.
Time Value (of money) – Internal WACC has
decreased for many larger companies. Lower
discount rates yield higher valuations.
What Could Still Cause Increases in Value?
Reality Check: Value = What you can get for it.

DILLONCAPITAL S T R A T E G I E S
24
Endangered List
Near-term launch
Safe and efficacious (minimal baggage)
Peak revenues >$500MM, bonus points if >$1B
Manageable development costs and risk
Strong IP position and longevity
“Specialty” areas with pricing and reimbursement comfort
Gaps - Several Pharmas are forecasting “gaps” that
occur simultaneously.
Feed the Beast - Portfolios must “turn” due to aging
products and shorter periods of market domination.
Scarcity Value
Whomever has the gold rules!

DILLONCAPITAL S T R A T E G I E S
25
More Acquisitions, especially “earn-outs”
Still many collaborative deals
A twist on traditional “Option deals”
More gambles and rewards being shared
Timing and risk assignment increasing in importance
Co-marketing/promotion deals far less common
More early stage deals
Forecasting can be dicey at best
Values are being bid up, but pay-offs are contingent
- Require more sophisticated valuations and deal
structures
Trends in Managing Risk and Sharing Value
Enter the new “norms”

DILLONCAPITAL S T R A T E G I E S
26
The Sobering Fact
Most Deals Fail
Depending on who you cite the number is 50 – 75%
DILLONCAPITAL S T R A T E G I E S
27
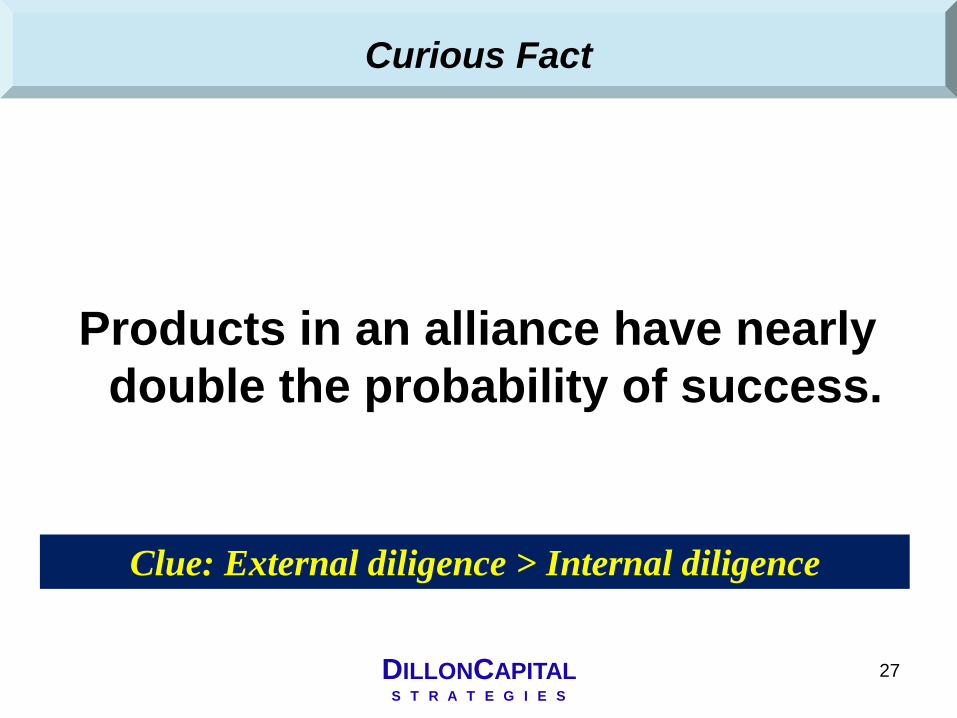
Curious Fact
Products in an alliance have nearly
double the probability of success.
Clue: External diligence > Internal diligence

DILLONCAPITAL S T R A T E G I E S
28
Why do different parties usually give the same deal
a different valuation?
How are these values being calculated?
What assumptions will have to be made?
What is the best time to do a deal?
What is the right amount to receive/pay and how
can it be structured to reduce my risk?
How do you strike a balance between what is
offered and what works for both parties?
Valuations Challenges

DILLONCAPITAL S T R A T E G I E S
29
Major Quantitative Drivers in Deal Timing
Time Value of Money
Development Risk
Evolving “Proof of Concept”
Development Cost Sharing
Partner Specific Needs (cash flow, expertise, facilities,
etc.)
Others as Applicable to the Specific Deal
Optimizing Development Product Deal Timing
DILLONCAPITAL S T R A T E G I E S
30
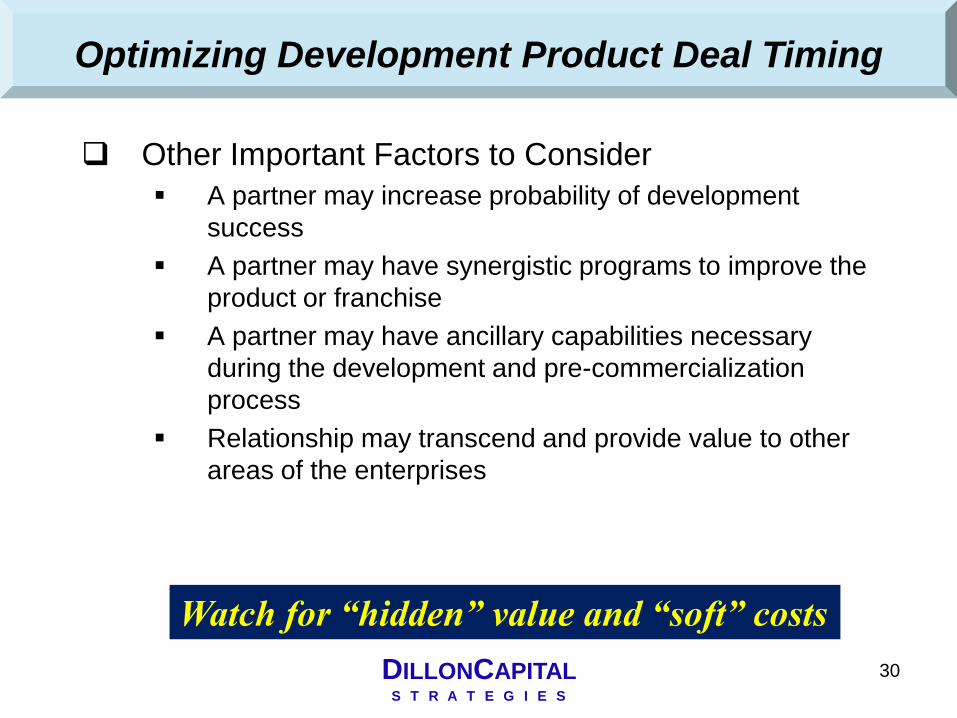
Other Important Factors to Consider
A partner may increase probability of development
success
A partner may have synergistic programs to improve the
product or franchise
A partner may have ancillary capabilities necessary
during the development and pre-commercialization
process
Relationship may transcend and provide value to other
areas of the enterprises
Optimizing Development Product Deal Timing
Watch for “hidden” value and “soft” costs

DILLONCAPITAL S T R A T E G I E S
31
First – What drives value?
Meeting an unmet need
Discovering a need and satisfying it
More effective product (efficacy)
Safer or easier to use product
Lower costs
Risk mitigation
IP protection
Scarcity, franchise, and time values
What Drives Value?
Value is in the wallet of the beholder.
DILLONCAPITAL S T R A T E G I E S
32
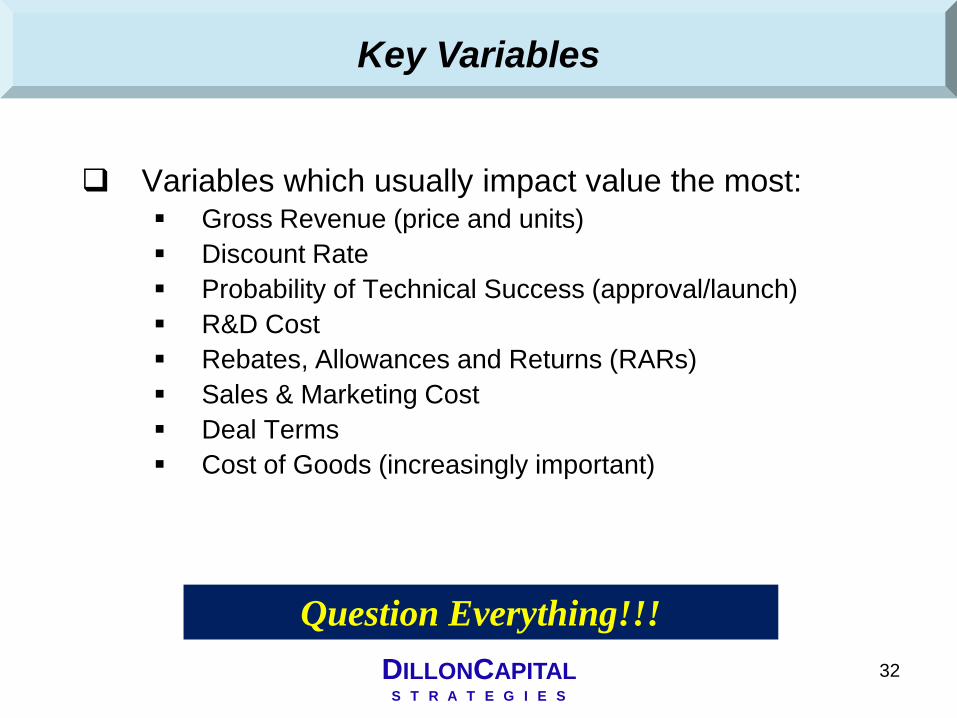
Key Variables
Question Everything!!!
Variables which usually impact value the most: Gross Revenue (price and units)
Discount Rate
Probability of Technical Success (approval/launch)
R&D Cost
Rebates, Allowances and Returns (RARs)
Sales & Marketing Cost
Deal Terms
Cost of Goods (increasingly important)

DILLONCAPITAL S T R A T E G I E S
33
Valuation Methodology
Focus on Risk and Return (“Cash is King”)
Comparables?
True comps are rare. Critical info often not made public.
Multiples?
Variance from average ~2x. Irrelevant unless launched.
Cost Basis?
Prior R&D spending is not an indicator of future value.
Payback?
Ignores product lifecycle after payback.
Income (Discounted Cash Flow - NPV)
Most appropriate for high tech projects
Risk-adjusting a must for deal structuring
Used by all In-licensors polled in a large survey

DILLONCAPITAL S T R A T E G I E S
34
Why Do Analysis and Valuations?
The “devil” really is in the details.
Provides defendable claim of value (98% of “buy-side
says they use rNPV on all PC and later deals)
Solid basis for negotiations
Real-time deal terms strategy simulation
Basis for comparison to other opportunities
Support go / no-go decisions
Develop operating plans / budgets
Flush-out issues and “surprises”
NPV can easily be back-calculated to get IRR

DILLONCAPITAL S T R A T E G I E S
35
Deal Team Concept
Strategic Planning &
Business Development
Sales and Marketing
Strategy
Manufacturing
Operations
Opportunity
Analysis and
Negotiation Team
Parent Company &
Affiliate Operations
Finance and
Accounting
Research and
Development
Legal and
Regulatory
Executive
Sponsorship

DILLONCAPITAL S T R A T E G I E S
36
Build-up from detail Patient-based
Dosing frequency / units / pricing strategy
Life cycle (patents, equivalents, population)
---- more later
Revenue
This is usually the dominating value driver

DILLONCAPITAL S T R A T E G I E S
37
Usually requires multiple scenarios for early stage technology
R&D, launch, sales & marketing, G&A, etc.
Estimate scale-up capital costs
Variable and new fixed costs
Working capital burden
Marginal tax impact (non-cash deductions)
Include deal costs (fees, amortization, etc.)
Costs and Expenses
Think incrementally

DILLONCAPITAL S T R A T E G I E S
38
Components of the discount rate
Inflation (when using nominal or current dollars)
Real risk-free rate (T-bill premium, same maturity)
Company’s incremental cost of capital (risk premiums)
Considerations
Use probability of success for project risk
Use care when mixing real and nominal figures
Rates differ widely by company
- Possible higher values with established deal partners
Discount Rates
Repeat – Leave project risk out of it!
DILLONCAPITAL S T R A T E G I E S
39
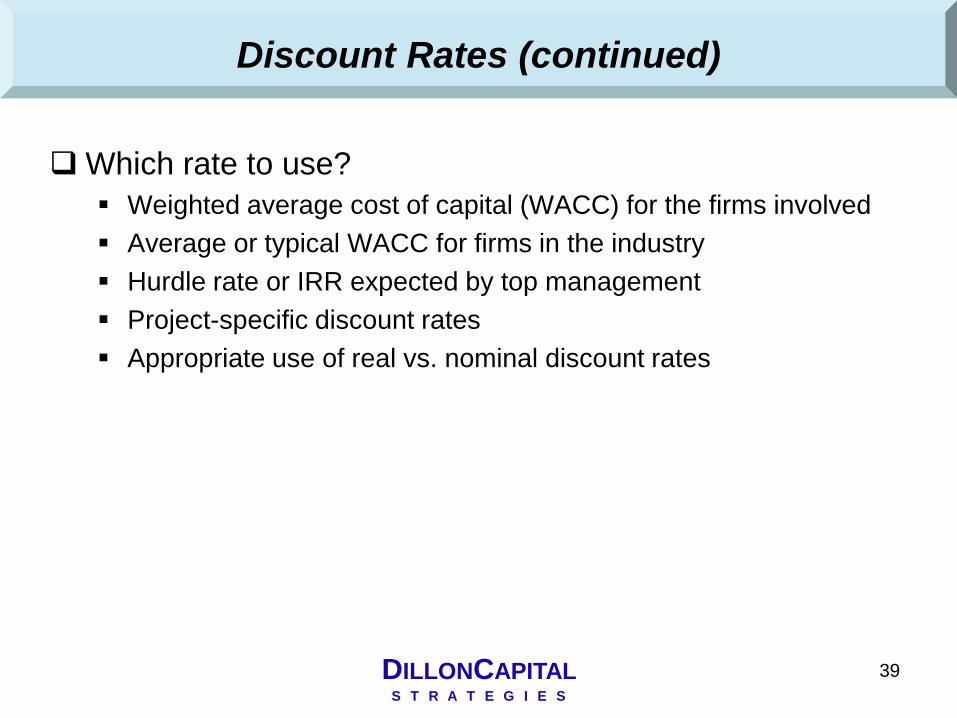
Which rate to use?
Weighted average cost of capital (WACC) for the firms involved
Average or typical WACC for firms in the industry
Hurdle rate or IRR expected by top management
Project-specific discount rates
Appropriate use of real vs. nominal discount rates
Discount Rates (continued)

DILLONCAPITAL S T R A T E G I E S
40
Discount Rates (continued)
Cost of Equity Capital
E = I + (M - I) + S + IP =
Return for a specific Investment E
Risk-free rate I 3.32% 10 year Treasury
Return for the equity market as a whole M 10.72%
Market risk premium (M - I) 7.40%
Small company/Liquidity premium S 0.00%
Industry Premium IP 4.00%
Total Cost of Equity Capital 14.72%
Rounded Cost of Equity Capital 14.7%
Weighted Average Cost of Capital (WACC)
(IRR Debt * (1-Tax Rate) * Debt:Capital Ratio) + IRR Equity * Equity:Capital Ratio
IRR Debt 7.90% Baa bond yield
Average Tax Rate 38.00%
Average Debt:Capital Ratio 4.00%
WACC (Discount Rate) 14.33%
Rounded Discount Rate 14.3%
Marginal Tax Rate 34%

DILLONCAPITAL S T R A T E G I E S
41
Probabilities of Success Categories
Development (will the science work?)
Regulatory (will it be approved for marketing?)
Commercial (will the market be as we expected?)
Considerations
Qualitative and quantitative rating system
Specific to the project being considered
Consider the resources and capabilities available
Break down by phase or decision points
Risk Assessment
Risk changes over time
DILLONCAPITAL S T R A T E G I E S
42
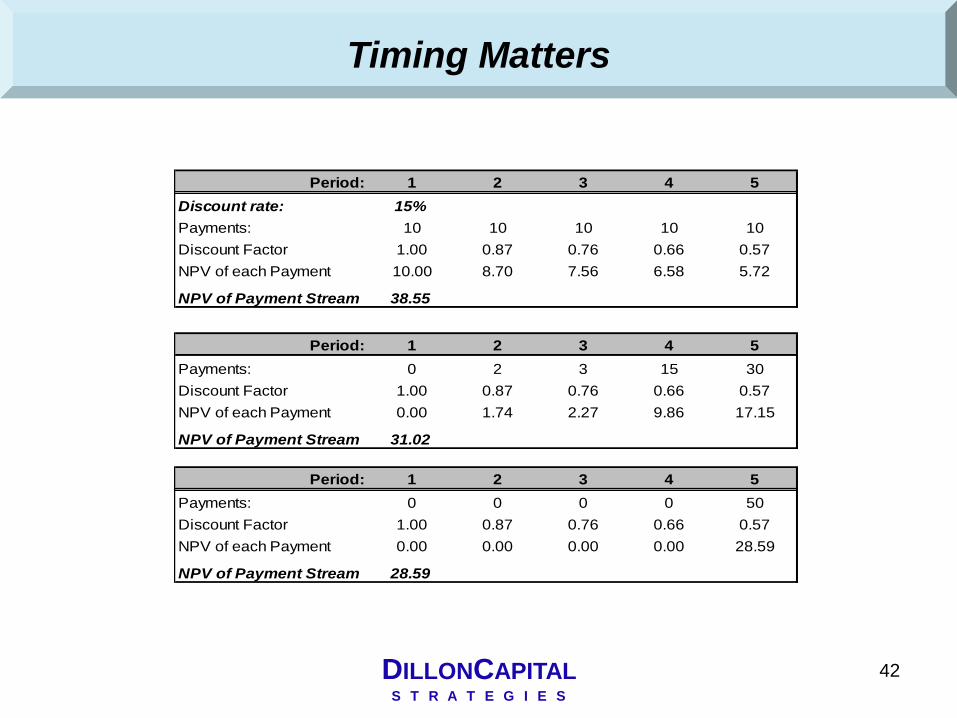
Period: 1 2 3 4 5
Discount rate: 15%
Payments: 10 10 10 10 10
Discount Factor 1.00 0.87 0.76 0.66 0.57
NPV of each Payment 10.00 8.70 7.56 6.58 5.72
NPV of Payment Stream 38.55
Period: 1 2 3 4 5
Payments: 0 2 3 15 30
Discount Factor 1.00 0.87 0.76 0.66 0.57
NPV of each Payment 0.00 1.74 2.27 9.86 17.15
NPV of Payment Stream 31.02
Period: 1 2 3 4 5
Payments: 0 0 0 0 50
Discount Factor 1.00 0.87 0.76 0.66 0.57
NPV of each Payment 0.00 0.00 0.00 0.00 28.59
NPV of Payment Stream 28.59
Timing Matters

DILLONCAPITAL S T R A T E G I E S
43
Period: 0 1 2 3 4
Discount rate: 5%
Payments: 10 10 10 10 10
Discount Factor 1.00 0.95 0.91 0.86 0.82
NPV of each Payment 10.00 9.52 9.07 8.64 8.23
NPV of Payment Stream 45.46
Discount rate: 25%
Payments: 10 10 10 10 10
Discount Factor 1.00 0.80 0.64 0.51 0.41
NPV of each Payment 10.00 8.00 6.40 5.12 4.10
NPV of Payment Stream 33.62
Discount rate: 50%
Payments: 10 10 10 10 10
Discount Factor 1.00 0.67 0.44 0.30 0.20
NPV of each Payment 10.00 6.67 4.44 2.96 1.98
NPV of Payment Stream 26.05
Discount Rate Matters

DILLONCAPITAL S T R A T E G I E S
44
War-gaming Tools
Seat of the pants…………….
Sopwith Camel

DILLONCAPITAL S T R A T E G I E S
45
War-gaming Weapons
…………..or “heads up display”
F-14 Tomcat

DILLONCAPITAL S T R A T E G I E S
Space Shuttle
…………..or world domination
War-gaming Weapons

DILLONCAPITAL S T R A T E G I E S
47
Step into the Cockpit

DILLONCAPITAL S T R A T E G I E S
48
BREAK! (return at 10:00am)

DILLONCAPITAL S T R A T E G I E S
49
We’ll spend a few minutes here
to walk through the case study
valuation model.
Model Orientation

DILLONCAPITAL S T R A T E G I E S
50
Today’s Program
08:30 Valuation Concepts and Discounted Cash Flow Models
09:45 Break
10:00 Valuation Tools and Techniques
11:00 Case study work
12:30 Lunch
13:30 Forecasting and Market Analysis
14:30 Case study work (and break)
16:00 Value Sharing and Deal Terms Structuring
17:00 Close

DILLONCAPITAL S T R A T E G I E S
51
Sell-side Forecasting Process

DILLONCAPITAL S T R A T E G I E S
52
Commonly used
Net present value, NPV
Probability-adjusted (rNPV) or expected NPV (eNPV)
Decision tree analysis (DTA), quasi option analysis
Internal rate of return, IRR
Less frequently used (and frequently misused)
Payback period (in conjunction with other methods)
Real Options, using option valuation formulas
Monte Carlo Simulation (covered after lunch)
Valuation Tools
Nearly all “buy-siders” use NPV and rNPV

DILLONCAPITAL S T R A T E G I E S
53
Net Present Value (NPV)
Definition
Present value of a project’s cash flows – including the invested capital (project
cost) discounted at the firm’s cost of capital
Equation
Example
Project A costs $20 M upfront, and CF are projected to be $10 M, $8 M,
$6 M, and $2 M in years 1-4 respectively; the firm’s cost of capital is 10%
Decision Rule
If NPV is positive, consider doing the project; the more positive, the better.

DILLONCAPITAL S T R A T E G I E S
54
Pros
Assumes that the reinvestment rate of the cash flows is the cost of capital
which is conceptually correct
If mutually exclusive projects are being considered and the NPV and IRR
give different ranking results, the NPV method is considered by financial
experts to be superior, since it maximizes shareholders’ wealth
Cons
Does not explicitly consider size of the return in relation to the amount
invested
Highly sensitive to WACC, and this can be difficult to calculate accurately;
also WACC changes over time
IRR is preferred to NPV by many corporate executives
NPV Pros and Cons

DILLONCAPITAL S T R A T E G I E S
55
NPV
WACC = 7% Discount
Rate
Feasibility: Project must have NPV>0
Internal Rate of Return (IRR): Discount rate at which NPV=0
NPV vs. Discount Rate

DILLONCAPITAL S T R A T E G I E S
56
Definition
Same as NPV, except that future cash flows are probability-adjusted
prior to discounting them at WACC
Pros
For projects with significant uncertainties in CFs, such as drugs in
various stages of development, results are more accurate than NPV
Is a kind of decision tree model that reflects managers’ ability to stop
the project in case of technological failure
Cons
Same as NPV, except that future cash flows are probability-adjusted
prior to discounting them at WACC
Not as widely used and understood as NPV
Risk-adjusted Net Present Value (rNPV)

DILLONCAPITAL S T R A T E G I E S
57
Decision Tree Analysis
DILLONCAPITAL S T R A T E G I E S
58
Decision Tree Pros and Cons
Pros
Forces a process to consider all possible outcomes
Is a fairly simple and familiar technique to many people
Cons
Real life choices not always clear cut.
Models can become cumbersome and trees “bushy”
Arguably better for project management or simple option selection
than for valuations

DILLONCAPITAL S T R A T E G I E S
59
Definition
The overall rate of return on a project, determined by solving for the rate
of return for which the NPV of a project is zero
Equation
Example
Project A costs $20 M upfront, and CF are projected to be $10 M, $8 M,
$6 M, and $2 M in years 1-4 respectively
Decision Rule
If IRR > WACC, consider accepting the project; note that WACC may be
adjusted up or down to compensate for risk. The higher the IRR, the better
Internal Rate of Return
DILLONCAPITAL S T R A T E G I E S
60
Pros
Measures profitability as a percentage, showing the return on each
dollar invested
Tells you how much the project return could fall (in percentage terms)
before the firm’s capital is at risk
IRR is preferred to NPV by many corporate executives
Cons
Assumes that the reinvestment rate of the cash flows is the IRR; this
can be less realistic than using WACC as the reinvestment rate
If mutually exclusive projects are being considered and the NPV and
IRR give different ranking results, the NPV method is considered by
financial experts to be superior, because it measures incremental
stakeholder wealth once the minimum IRR hurdle is cleared
IRR Pros and Cons

DILLONCAPITAL S T R A T E G I E S
61
Definition
The number of years required to recover the costs of the investment
Equation
Payback period = yrs before full recovery + unrecovered cost at start of
last yr / CF during the last yr
Example
Decision Rule
If payback period < benchmark payback period, consider accepting the
project; the shorter the payback period, the better.
Payback Period
DILLONCAPITAL S T R A T E G I E S
62
Pros
Is a good measure of project liquidity and riskiness: the shorter the payback,
the greater the liquidity; also, distant cash flows are riskier than near cash
flows
Cons
Ignores the time value of money
Ignores cash flows beyond the payback period
Payback Period Pros and Cons

DILLONCAPITAL S T R A T E G I E S
63
Definition
The right, but not the obligation, to undertake or abandon a future project
as a result of incurring the cost of a current one
Equation
Black-Scholes equation (to be discussed further)
Example
Company is building a pilot plant
Cost of plant buys “right” to expand
Anticipates expanding capacity in 3 years
Anticipates entering new markets
Decision rule: If NPV of pilot project + call option value of expansion
project > 0, undertake project.
Real Options

DILLONCAPITAL S T R A T E G I E S
64
Pros
When applied properly, can capture value of having choices later as a result
of making certain decision(s) today
Uses a well-established pricing model (Black-Scholes equation) by analogy
to financial options
Cons
Difficult to “map” real option variables onto financial option variables
Difficult to estimate variability accurately, leading to wide variation in real
option pricing
Not routinely used outside of academic / financial expert circles
Real Options Pros and Cons

DILLONCAPITAL S T R A T E G I E S
65
S = Stock Price (Present value of assets)
K = Strike Price (Expenditure to acquire assets)
t = Time to expiration at T (Time decision may be deferred)
r = Risk-free rate (Time value of money)
σ2= Variance on return of underlying (Riskiness of project assets)
Variables for Option Pricing

DILLONCAPITAL S T R A T E G I E S
66 Primbs, MS&E 345, Spring 2002 15
The Black-Scholes equation
(European Call Option)
Solution:
rccSrScc SSSt 22
21
)(),( KSTSc
)()(),( 2
)(
1 dNKedSNtSc tTr
tT
tTrKSd
))(()/ln( 2
21
1
tTdd 12
where:
)(N
distribution function for a standard Normal (i.e. N(0,1))
We will derive this solution later in the course...(If you like, you can verify it now.)
Used thousands of time daily on options exchanges
Based on stochastic differential equations
Widely available as calculator feature or add-in
X
X
Black-Scholes Equation

DILLONCAPITAL S T R A T E G I E S
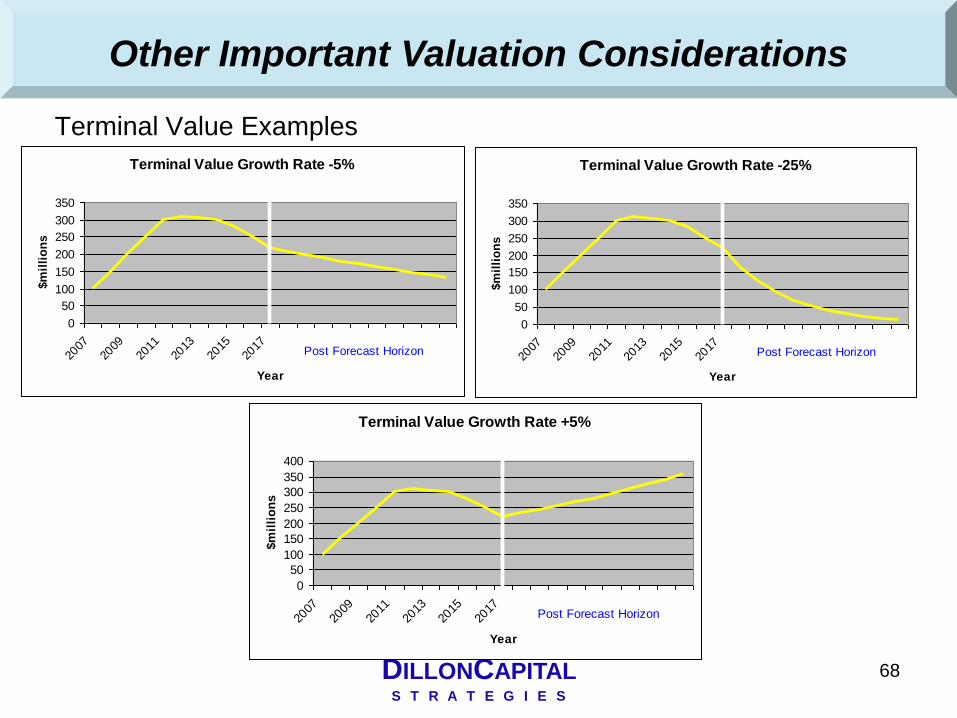
67
Terminal Value Estimates the total value of the program for the years after the
last year of the cash flow forecast.
Our model uses a perpetuity calculation (preferred method).
The model input is expressed as a percentage growth (i.e. 5% indicates 5% cash flow growth forever, -5% indicates 5% decline annually until zero is theoretically reached)
Terminal value can be a substantial value component, so be careful using and interpreting it.
Other Important Valuation Considerations
DILLONCAPITAL S T R A T E G I E S
68
Terminal Value Examples
Other Important Valuation Considerations
Terminal Value Growth Rate -5%
0
50
100
150
200
250
300
350
2007
2009
2011
2013
2015
2017
Year
$m
illi
on
s
Post Forecast Horizon
Terminal Value Growth Rate -25%
0
50
100
150
200
250
300
350
2007
2009
2011
2013
2015
2017
Year
$m
illi
on
s
Post Forecast Horizon
Terminal Value Growth Rate +5%
0
50
100
150
200
250
300
350
400
2007
2009
2011
2013
2015
2017
Year
$m
illi
on
s
Post Forecast Horizon

DILLONCAPITAL S T R A T E G I E S
69
Working Capital Working capital is (current assets – current liabilities).
It’s considered an “investment” to support daily operations.
As operations grow, more working capital investment is required.
A typical pharma company adds working capital at a rate or 10% - 15% of incremental revenue.
Our model accepts inputs expressed as a percentage and adds it as a separate line after tax.
Other Important Valuation Considerations

DILLONCAPITAL S T R A T E G I E S
70
Inflation Factor For purposes of our model, we use this to calculate the proper
discount rate to use.
Remember, the nominal rate includes inflation and the real rate does not.
If our forecast has inflation incorporated in it, then we should use the nominal rate. If the forecast does not have inflation in it, then we should use the real rate.
The model defaults to the nominal rate unless we enter an “inflation factor” to calculate the real rate.
IRR is usually expressed as a rate including inflation (nominal).
If you want to achieve the IRR, but have a forecast without inflation, input the inflation factor and the real rate will be calculated.
To input 3% inflation, type the factor “1.03” in the field provided.
I’ll describe this more during the case study………………….
Other Important Valuation Considerations

DILLONCAPITAL S T R A T E G I E S
71
“Price is what you pay. Value is
what you get."
— Warren Buffet

DILLONCAPITAL S T R A T E G I E S
72
CASE STUDY – until 12:30
------
LUNCH – 12:30 – 13:30

DILLONCAPITAL S T R A T E G I E S
73
Today’s Program
08:30 Valuation Concepts and Discounted Cash Flow Models
09:45 Break
10:00 Valuation Tools and Techniques
11:00 Case study work
12:30 Lunch
13:30 Forecasting and Market Analysis
14:30 Case study work (and break)
16:00 Value Sharing and Deal Terms Structuring
17:00 Close

DILLONCAPITAL S T R A T E G I E S
74
Epidemiology (patient basis)
- Prevalence, incidence and patient flow
Treatment protocol - Doctor’s preference and managed care requirements
Dosing regimen
Compliance and persistence
Competitive set (market basis) - Marketed and in-development
- Historical and forecast usage
Pricing and reimbursement
Market lifecycle - Line extensions and generic entry
Major Revenue Forecasting Considerations
Watch for trends
DILLONCAPITAL S T R A T E G I E S
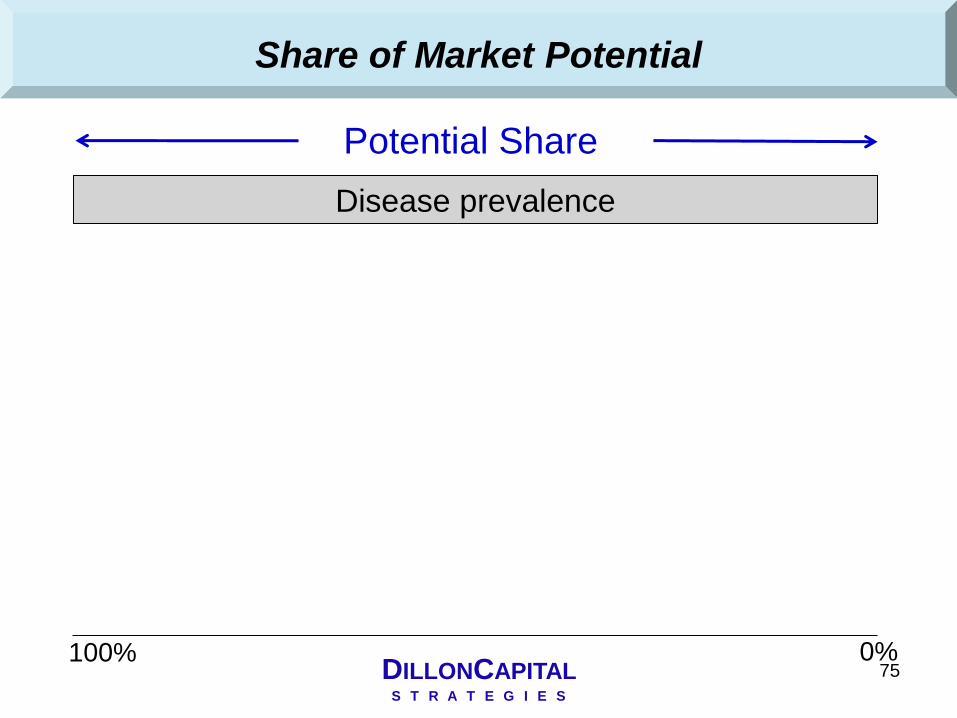
Share of Market Potential
Disease prevalence
Potential Share
75 100% 0%

DILLONCAPITAL S T R A T E G I E S
76
Share of Market Potential
Disease prevalence
Presentation rate
Potential Share
76 100% 0%

DILLONCAPITAL S T R A T E G I E S
77
Share of Market Potential
Disease prevalence
Presentation rate
Diagnosis rate
Potential Share
77 100% 0%

DILLONCAPITAL S T R A T E G I E S
78
Share of Market Potential
Disease prevalence
Presentation rate
Diagnosis rate
Treatment rate
Potential Share
78 100% 0%
DILLONCAPITAL S T R A T E G I E S
79
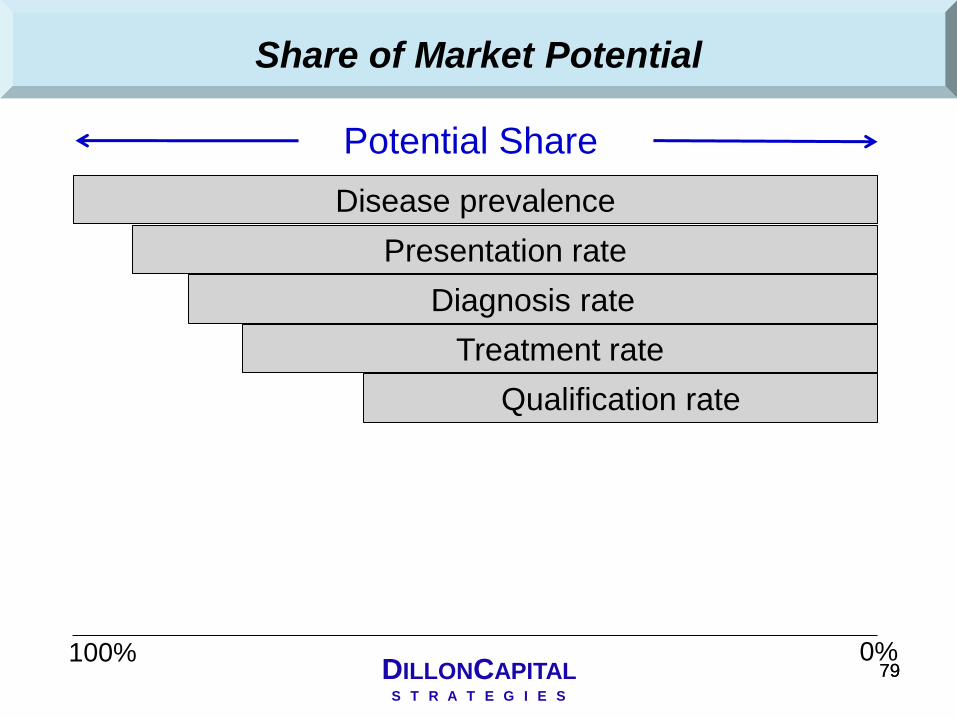
Share of Market Potential
Disease prevalence
Presentation rate
Diagnosis rate
Treatment rate
Qualification rate
Potential Share
79 100% 0%

DILLONCAPITAL S T R A T E G I E S
80
Share of Market Potential
Disease prevalence
Presentation rate
Diagnosis rate
Treatment rate
Qualification rate
Potential Share
Share of scripts
80 100% 0%

DILLONCAPITAL S T R A T E G I E S
81
Share of Market Potential
Disease prevalence
Presentation rate
Diagnosis rate
Treatment rate
Qualification rate
Potential Share
Share of scripts
Dosing regimen
81 100% 0%

DILLONCAPITAL S T R A T E G I E S
82
Share of Market Potential
Disease prevalence
Presentation rate
Diagnosis rate
Treatment rate
Qualification rate
Potential Share
Share of scripts
Dosing regimen
Compliance
82 100% 0%

DILLONCAPITAL S T R A T E G I E S
83
Share of Market Potential
Disease prevalence
Presentation rate
Diagnosis rate
Treatment rate
Qualification rate
Potential Share
Share of scripts
Dosing regimen
Compliance
Persistence Realized Share
100% 0%

DILLONCAPITAL S T R A T E G I E S
84
Reconciling Market and Patient Basis
≠ Possible causes
Inaccurate epidemiology data
Miscalculated patient flow
Misunderstood usage
Inaccurate sales audit data
Wrong sales audit data pulled
Expected usage
based on treatable
population
Usage based on
audited sales data

DILLONCAPITAL S T R A T E G I E S
85
Taking history into account: curve fitting and “eventing”
approach to forecasting and use of comparables
Curve fitting of historical data using statistical methods
“Eventing” of the fitted curve into the future, being informed by
historical data on comparable products
Data: historical scrip and sales data on product(s) and
comparables of interest as well as historical “events” and their
impact on the above
Sources: IMS or WK data, confidential data from client, public
company reports
Trending

DILLONCAPITAL S T R A T E G I E S
86
Curve fitted + evented forecast example
0
500000
1e+006
1.5e+006
2e+006
2.5e+006
3e+006
History Baseline Evented Forecast
PRILOSEC TRx
Trend Breaking

DILLONCAPITAL S T R A T E G I E S
87
Analogs or Comparables
The key to “event-based” forecasting is the use of
analogs or comparables
Uses for analogs
“Sanity check” peak penetration
Fit uptake curve to already forecast peak
Affect of generic competition and other IP challenges
Pricing and reimbursement outcomes
Labeling (product profile) assumptions
Common variables often sought in analogs:
Same indication, therapeutic area
Similar product profile (efficacy, safety, administration, dosing)
Same physician subgroup
Similar marketing strategy (e.g. PCP, hospital, DTC)

DILLONCAPITAL S T R A T E G I E S
88
Competitors can expand a market as well as compete for
market share
Include pipeline products as well as marketed products in
competitive analysis
Major considerations are:
Product profile (mechanism of action, efficacy, safety, side effects,
dosing)
Indications obtained / likely to be obtained; also product label
Likelihood of being used 1st line, 2nd line, etc.
Clinical unmet need
IP strength
Pricing / reimbursement
Marketer strength
Order of entry
Competitive Analysis

DILLONCAPITAL S T R A T E G I E S
89
0%
10%
20%
30%
40%
50%
60%
70%
80%
90%
100%
Ma
rket
Sh
are
1 2 3 4 5 6 7 8 9 10
Number of Products in the Market
Entry Order and Share
Tenth
Ninth
Eighth
Seventh
Sixth
Fifth
Fourth
Third
Second
First
Market Entry Importance

DILLONCAPITAL S T R A T E G I E S
90
Projected Patient Shares
0.0%
5.0%
10.0%
15.0%
20.0%
25.0%
30.0%
35.0%
40.0%
45.0%
1/1
/2005
7/1
/2005
1/1
/2006
7/1
/2006
1/1
/2007
7/1
/2007
1/1
/2008
7/1
/2008
1/1
/2009
7/1
/2009
1/1
/2010
7/1
/2010
1/1
/2011
7/1
/2011
1/1
/2012
7/1
/2012
1/1
/2013
7/1
/2013
1/1
/2014
7/1
/2014
1/1
/2015
7/1
/2015
1/1
/2016
7/1
/2016
1/1
/2017
7/1
/2017
1/1
/2018
7/1
/2018
1/1
/2019
7/1
/2019
1/1
/2020
Launched Competitor A Launched Competitor B Launched Competitor B Pipeline Competition A
Pipeline Competition B Pipeline Competition C Pipeline Competition D Our Product
Pipeline Competition E Pipeline Compitition F
Stealing Matrix in Use
DILLONCAPITAL S T R A T E G I E S
91
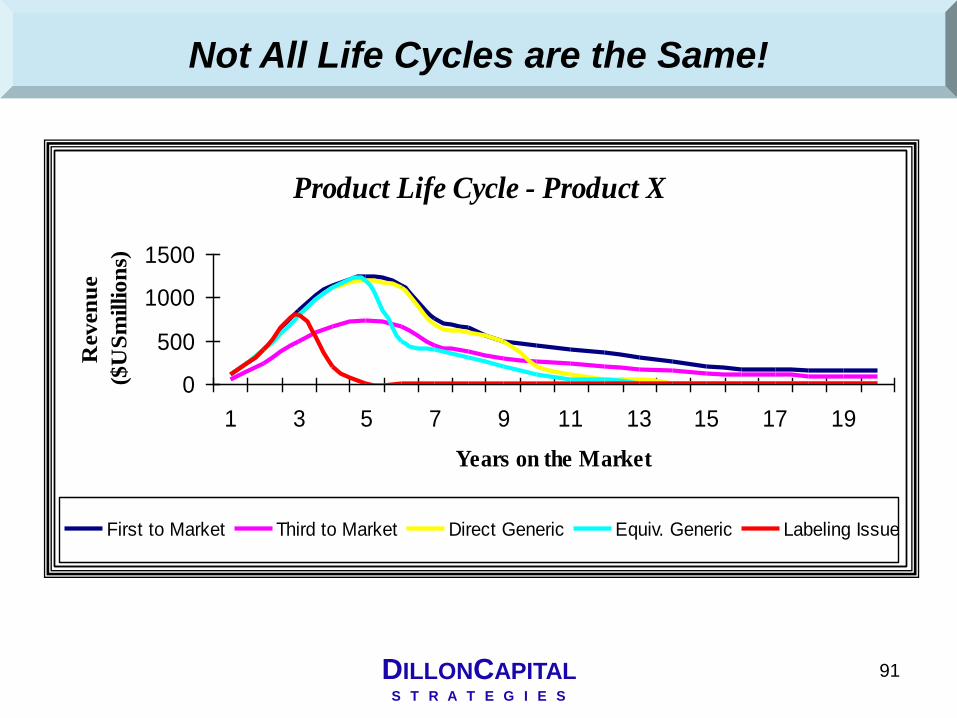
Product Life Cycle - Product X
0
500
1000
1500
1 3 5 7 9 11 13 15 17 19
Years on the Market
Rev
en
ue
($U
Sm
illio
ns)
First to Market Third to Market Direct Generic Equiv. Generic Labeling Issue
Not All Life Cycles are the Same!

DILLONCAPITAL S T R A T E G I E S
92
Sensitivity Analysis
Changing one variable at a time:
Price: $ 2.00 => $ 3.00
Rx Share: 4 % => 8 %
Discount Rate: 12% => 18%
Identifies the impact that different variables have on key financial measures, such as NPV and IRR

DILLONCAPITAL S T R A T E G I E S
93
Scenario Analysis
Changing multiple variables to establish a “case”
Worst Case: Price $ 2.00/tab
Market Share: 4%
Discount Rate: 18%
Best Case: Price $ 3.00/tab
Market Share: 8%
Discount Rate: 12%
Tests your base case assumptions and identifies the range
of potential outcomes

DILLONCAPITAL S T R A T E G I E S
94
What is it?
A procedure that uses a random number generator to create
sets of variables from user-specified probability distributions
How do you do it?
Using a software add-on to your spreadsheet program (e.g.,
Forecast Architect® or Crystal Ball):
1. Specify probability distributions, e.g., mean and standard
deviation of a normal distribution, for one or more variables in
your forecast
2. Specify output parameters for your forecast and/or valuation
3. Run the Monte Carlo simulation
Advanced Simulation Tools – Monte Carlo

DILLONCAPITAL S T R A T E G I E S
95
What can you learn from it?
Which variables contribute the most to your outputs or results
(i.e., sensitivity analysis)?
What is the range and distribution of likely outcomes given
the variable distributions assigned?
What are the major risks and the magnitude of those risks?
Advanced Simulation Tools – Monte Carlo

DILLONCAPITAL S T R A T E G I E S
96
Monte Carlo Distribution Curves

DILLONCAPITAL S T R A T E G I E S
97
Monte Carlo – A Few More Curves

DILLONCAPITAL S T R A T E G I E S
98
65% probability 35% probability
23.4% probability 76.6% probability
Monte Carlo Simulation Example

DILLONCAPITAL S T R A T E G I E S
99
Pros
Relatively inexpensive to evaluate decisions before implementation
Reveals critical components of the system
Gives range and probability of results rather than point estimates
Cons
Results are sensitive to the accuracy of input data
One must know variable value ranges and the unique distribution curves
If you can’t model it, you can’t use Crystal Ball to simulate it
Does not provide easy answers to complex problems
Monte Carlo Simulation Pros and Cons

DILLONCAPITAL S T R A T E G I E S
100
Case Study Work and Break! (return at 4:00pm)

DILLONCAPITAL S T R A T E G I E S
101
Today’s Program
08:30 Valuation Concepts and Discounted Cash Flow Models
09:45 Break
10:00 Valuation Tools and Techniques
11:00 Case study work
12:30 Lunch
13:30 Forecasting and Market Analysis
14:30 Case study work (and break)
16:00 Value Sharing and Deal Terms Structuring
17:00 Close

DILLONCAPITAL S T R A T E G I E S
102
The good deal results in an arrangement where both parties share in the value created in such a way that each is motivated to maximize that value.
Pharmaceutical deal value is made up of two basic components Value of the technology
Value of the ability generate positive cash flows by commercializing or otherwise applying the technology
Pharmaceutical deals often span many years with multiple gambles, bets and payoffs to be shared by the partners.
The Art of the Deal
It’s not just the math!

DILLONCAPITAL S T R A T E G I E S
103
Determine the needs / goals of your company and your partner’s Current cash position
- Payouts may be designed to match needs
Earnings requirements
- Consider accretion, gap filling, etc.
Hurdle rate
- Can make a huge valuation difference
Corporate Development Goals
- Franchise development
- Expertise development
Investment goals of stakeholders
Value Sharing Considerations
Know your partner well

DILLONCAPITAL S T R A T E G I E S
Up-front payments Lump-sum
Prepaid royalties
Direct R&D re-funding
R&D expense subsidies
Milestone payments Development
Commercial
Running royalties Fixed % of sales
Graduated royalty % based on volume
Variable royalty % to account for rights and contingencies
Definition of a royalty base (e.g., reach-through royalties, stacking)
Manufacturing payments Cost plus mark-up
% of resale price
Deal Terms Examples
DILLONCAPITAL S T R A T E G I E S
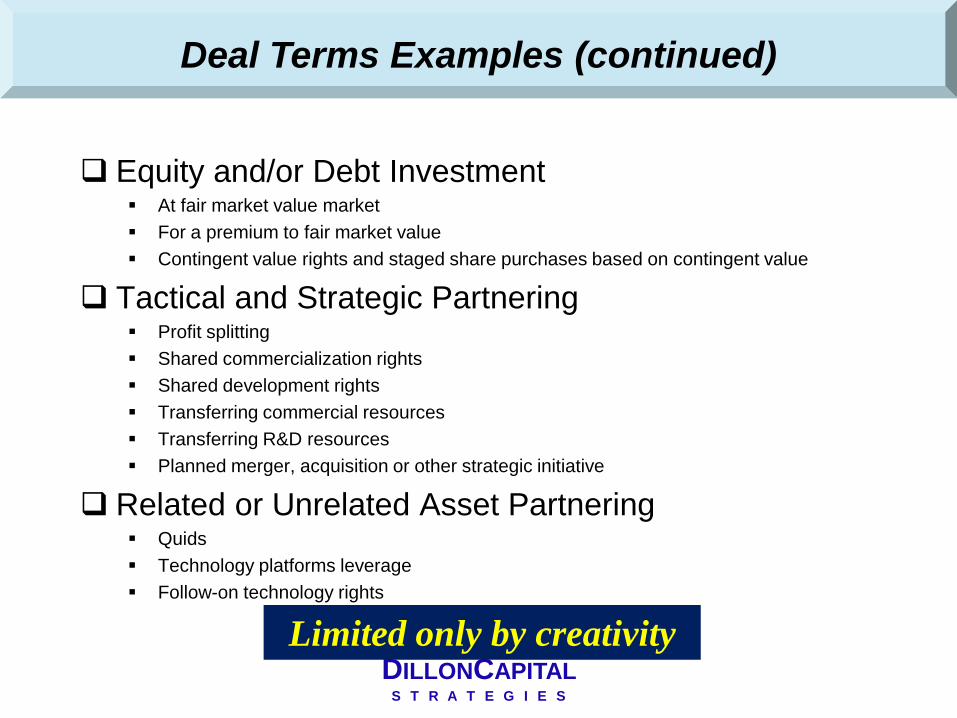
Equity and/or Debt Investment At fair market value market
For a premium to fair market value
Contingent value rights and staged share purchases based on contingent value
Tactical and Strategic Partnering Profit splitting
Shared commercialization rights
Shared development rights
Transferring commercial resources
Transferring R&D resources
Planned merger, acquisition or other strategic initiative
Related or Unrelated Asset Partnering Quids
Technology platforms leverage
Follow-on technology rights
Limited only by creativity
Deal Terms Examples (continued)

DILLONCAPITAL S T R A T E G I E S
106
Identifying Comparables

DILLONCAPITAL S T R A T E G I E S
107
Deal Term Mix - As Announced
$100 million Deal
Milestones
50%
Upfront 50%
$100 million? When? How? What-if?
Careful Using Comparables

DILLONCAPITAL S T R A T E G I E S
108
Actual Deal Terms Mix (including Royalty Payments)
Milestones - 10%
NPV of Royalty
Payments - 80%
Upfront - 10%
A different perspective!
Careful Using Comparables

DILLONCAPITAL S T R A T E G I E S
109
Actual Deal Term Mix Probability-adjusted
Milestones - 6%
Upfront - 49%
NPV of Royalty
Payments - 44%
Getting Clearer?
Careful Using Comparables

DILLONCAPITAL S T R A T E G I E S
110
How Much to Pay and Deal Structuring?
Cash Flow vs Risk
-50
25
100
175
250
-8 -6 -4 -2 0 2 4 6 8 10 12 14 16 18
Year (Launch = 0)
Ca
sh
Flo
w
($U
Sm
illi
on
s)
-20%
0%
20%
40%
60%
80%
100%
Pro
ba
bil
ity
of
Do
wn
sid
e
Cash Flow
Risk
Fees / Milestones
vs.
Costs / Risk
Royalties
vs.
Op. Profits

DILLONCAPITAL S T R A T E G I E S
111
Example Deal

DILLONCAPITAL S T R A T E G I E S
112
Opportunity: Stage of Development Pre-clinical
Probability of Launch 11%
R&D $284 Million
Launch Year 2012
Forecast Peak Net Sales $808 million
Proposed Deal: Licensor (Partner) pays R&D
Fees and Milestones
– Upfront $50 million
– Enter Phase III $10 million
– Launch $40 million
Royalty 10%
Drug Candidate Licensing Deal

DILLONCAPITAL S T R A T E G I E S
113
Forecast and Deal Structure Control Panel

DILLONCAPITAL S T R A T E G I E S
114
Cash Flow Forecast Excerpts
Cash Flow Statement 2004 2005 2006 2007 2008 2009 2010 2011 2012 2013 2014 2015
Partner:
Net Revenue 0.0 - - - - - - - - 193.1 499.5 704.0 760.9
Royalty - - - - - - - - 19.3 49.9 70.4 76.1
Cost of Goods Sold - - - - - - - - 8.9 23.1 32.6 35.2
Gross Profit - - - - - - - - 164.8 426.4 601.0 649.6
Total Operating Expenses 6.8 20.3 33.8 64.0 54.0 54.0 54.0 46.8 15.4 16.8 17.8 18.0
EBITDA (6.8) (20.3) (33.8) (64.0) (54.0) (54.0) (54.0) (46.8) 149.4 409.6 583.3 631.6
Terminal Value (to Partner) PV = $43.2 - - - - - - - - - - - -
Net Cash Flow - Partner NPV = 819.9 (54.5) (13.4) (22.3) (42.2) (35.6) (35.6) (35.6) (30.9) 69.7 224.4 354.3 408.3
Originator:
Cash Flows
Royalty Earned 0.0 - - - - - - - - 19.3 49.9 70.4 76.1
Research and Development - - - - - - - - - - - -
Sales & Marketing - - - - - - - - - - - -
Taxable Milestones Earned - - - 10.00 - - - 40.00 - - - -
Other Expenses (Includes deal costs) - - - - - - - - 0.1 0.2 0.4 0.4
Net EBITDA - - - 10.0 - - - 40.0 19.2 49.7 70.1 75.7
Capitalized Fees and Costs to Originator 50.0 - - - - - - - - - - -
Terminal Value PV = $5.2 - - - - - - - - - - - -
Net Cash Flow - Originator 50.0 - - 6.6 - - - 26.4 9.8 28.2 43.2 49.1
NPV = 181.6
Product Total:
Product EBITDA (6.8) (20.3) (33.8) (54.0) (54.0) (54.0) (54.0) (6.8) 168.6 459.3 653.3 707.3
Terminal Value PV = $48.41 - - - - - - - - - - - -
Net Cash Flow - Total Product (4.5) (13.4) (22.3) (35.6) (35.6) (35.6) (35.6) (4.5) 79.4 252.6 397.4 457.4
NPV = 1,001.5
This cash flow was made smaller by hiding some rows and deleting some columns to make the image readable on this slide.

DILLONCAPITAL S T R A T E G I E S
115
Partner’s Cash Flow Timing
Cash Flow Share
-100
0
100
200
300
400
500
2004
2006
2008
2010
2012
2014
2016
2018
2020
2022
2024
($U
S m
illio
ns
)
Partner Originator
Fees / Milestones
vs.
Costs / Risk
Royalties
vs.
Op. Profits

DILLONCAPITAL S T R A T E G I E S
116
Resulting Shares of the Pie
Total Net Present Value ($US millions)
18%
82%
Originator Partner
$182
Total Value = $1002
$820

DILLONCAPITAL S T R A T E G I E S
Investment and Milestone Risk Gaming
Phase
PreClinical Phase I Phase II Phase III Registration Launch
Program's Probability of Launch
11%
Probability of Progressing
59% 52% 57% 70% 90%
Probability of Failure in Phase
41% 48% 43% 30% 10%
Probability of Phase's Cashflow
100.0% 59.0% 30.7% 17.5% 12.2% 11%
0.0%
20.0%
40.0%
60.0%
80.0%
100.0%
PreClinical Phase I Phase II Phase III Registration Launch
Probability of Phase's Cashflow

DILLONCAPITAL S T R A T E G I E S
118
Risk and Value Sharing
Cash Flow Share
-100
0
100
200
300
400
500
($U
S m
illio
ns)
-20%
0%
20%
40%
60%
80%
100%
Pro
bab
ilty
of
Cash
Flo
w
Partner Originator Probability of Cash Flow

DILLONCAPITAL S T R A T E G I E S
119
Adjusted Value Sharing
Probabalized and Discounted Cash Flow Share
-60
-40
-20
0
20
40
60
2004
2006
2008
2010
2012
2014
2016
2018
2020
2022
2024
($U
S m
illio
ns
)
Partner Originator

DILLONCAPITAL S T R A T E G I E S
120
Shares of the Pie – Simple Method
Total Net Present Value ($US millions)
18%
82%
Originator Partner
$182
Total Value = $1002
$820

DILLONCAPITAL S T R A T E G I E S
121
Risk-adjusted Net Present Value ($US millions)
67%
33%
Originator Partner
Total Value = $91
$61
$30
Resulting Shares of the Pie – Phased Method

DILLONCAPITAL S T R A T E G I E S
122
Even with this skewed deal structure,
it exceeds the partner’s investment
hurdle rate of 13.4% nominal.
Interesting Note

DILLONCAPITAL S T R A T E G I E S
123
Using the Phased Method is Worth the Effort
33%
67%
82%
18%
0%
20%
40%
60%
80%
100%
Phased Simple
Comparison of Phased and Simple Probability Adjusting
Share of Risk-adjusted Value
Originator
Partner

DILLONCAPITAL S T R A T E G I E S
124
Impact of Changing Fees and Milestones
Risk-adjusted Net Present Value ($US millions)
50% 50%
Originator Partner
Total Value = $91
$45.5 $45.5
Moved $18MM from Upfront to Phase III milestone
and reduced launch milestone to $20MM
DILLONCAPITAL S T R A T E G I E S
125
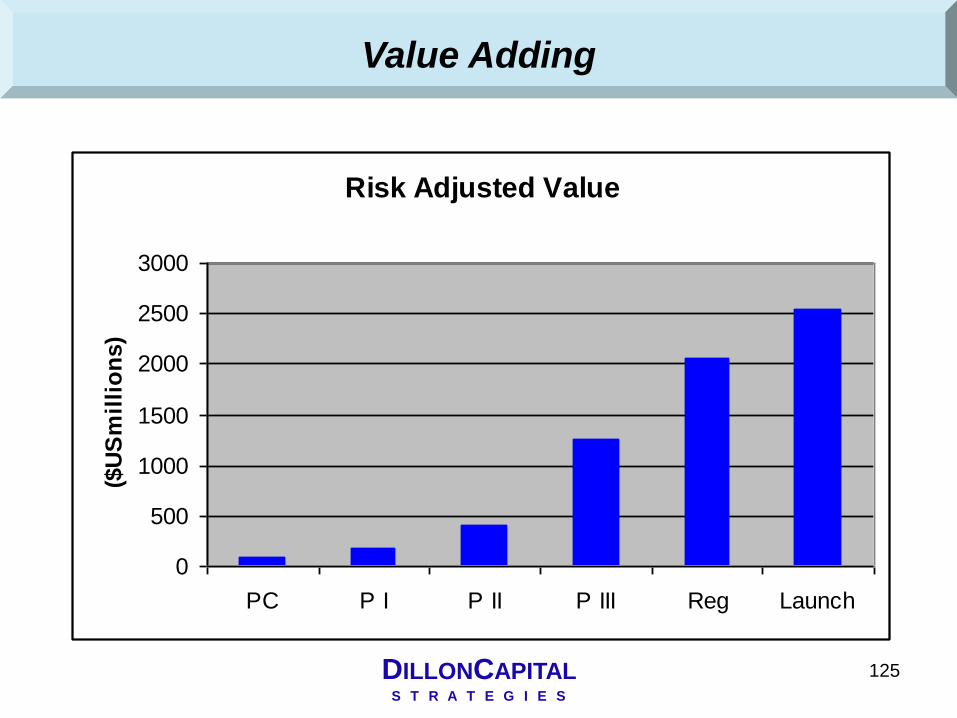
Value Adding
Risk Adjusted Value
0
500
1000
1500
2000
2500
3000
PC P I P II P III Reg Launch
($U
Sm
illi
on
s)

DILLONCAPITAL S T R A T E G I E S
126
Partnering Timing - Shifting Value Shares
Risk Adjusted Share of Value
0%
20%
40%
60%
80%
100%
PC P I P II P III Reg Launch
Partner Originator

DILLONCAPITAL S T R A T E G I E S
127
Development Cost vs Value ($USMM)
0
500
1000
1500
2000
2500
3000
PC P I P II P III Reg Launch
Ris
k A
dju
ste
d V
alu
e
0
50
100
150
200
250
300
Devel
op
men
t S
pen
d
Risk Adjusted Value Development Spend
Pre-Partnering - Investment vs. Return

DILLONCAPITAL S T R A T E G I E S
128
Pre-Partnering - Investment vs. Return
Development Cost vs Value ($USMM)
0
100
200
300
400
500
PC P I P II
Ris
k A
dju
ste
d V
alu
e
0
10
20
30
40
50
60
70
80
Devel
op
men
t S
pen
d
Risk Adjusted Value Development Spend
321 61 IIR = 99%
P(s) 11% 36%

DILLONCAPITAL S T R A T E G I E S
129
Model Strengths and Weaknesses
Strengths of robust models
Transparency of key assumptions and variables
Flexibility in setting/changing parameters
Allows war-gaming and real-time negotiation back-up
Speaks decision maker’s language
Provides charts and graphs for presentations
Weaknesses of some models
Sensitive to discount rate and terminal value
Discount rates sometimes arbitrary
Scenario testing can be time-consuming
May not handle risk well
May not handle options and “what-ifs” well
Formula errors can lurk without being noticed

DILLONCAPITAL S T R A T E G I E S
130
Remember - It’s Not the Math
“Beware of geeks bearing formulas."
— Warren Buffet
DILLONCAPITAL S T R A T E G I E S
131
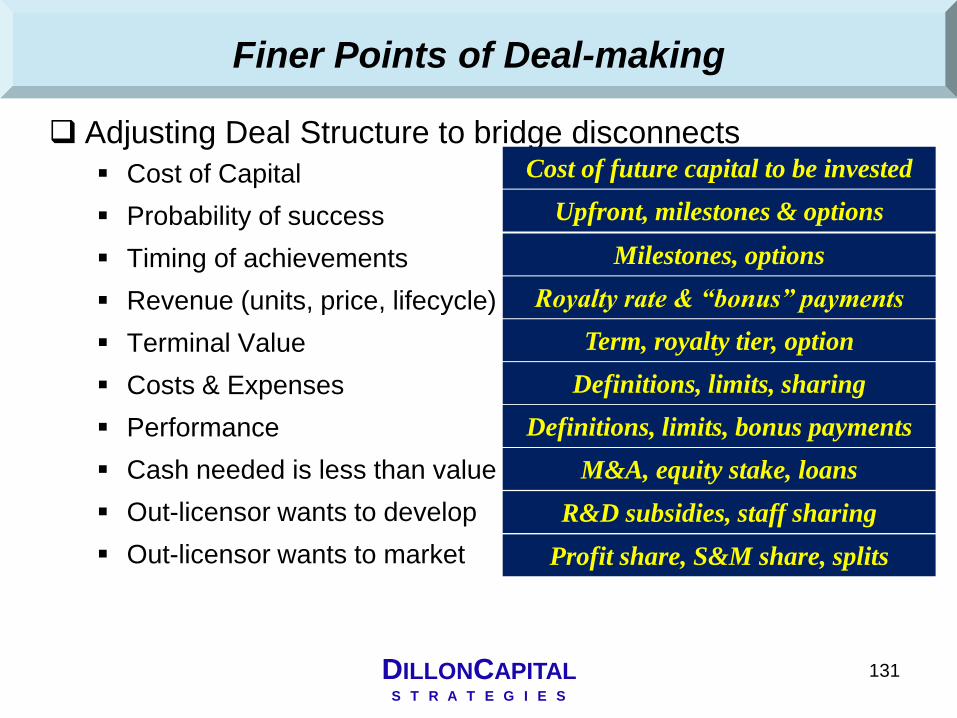
Adjusting Deal Structure to bridge disconnects
Cost of Capital
Probability of success
Timing of achievements
Revenue (units, price, lifecycle)
Terminal Value
Costs & Expenses
Performance
Cash needed is less than value
Out-licensor wants to develop
Out-licensor wants to market
Finer Points of Deal-making
Cost of future capital to be invested
Royalty rate & “bonus” payments
Term, royalty tier, option
Upfront, milestones & options
Definitions, limits, sharing
Definitions, limits, bonus payments
Milestones, options
M&A, equity stake, loans
R&D subsidies, staff sharing
Profit share, S&M share, splits

DILLONCAPITAL S T R A T E G I E S
132
Thank You
Joe Dillon President
202.255.3780
℠ Bringing money to medicine©
DILLONCAPITAL S T R A T E G I E S