Embed Size (px)
Citation preview
v a l l e y m e t r o . o r g
2015FISC AL YE AR E N DE D J U N E 30
Valley Metro Rail, Inc., Phoenix, AZCOMPREHENSIVE ANNUAL FINANCIAL REPORT

VALLEY METRO RAIL, INC. Phoenix, Arizona
Comprehensive Annual Financial Report For the fiscal year ended
June 30, 2015
Prepared by: Finance Division
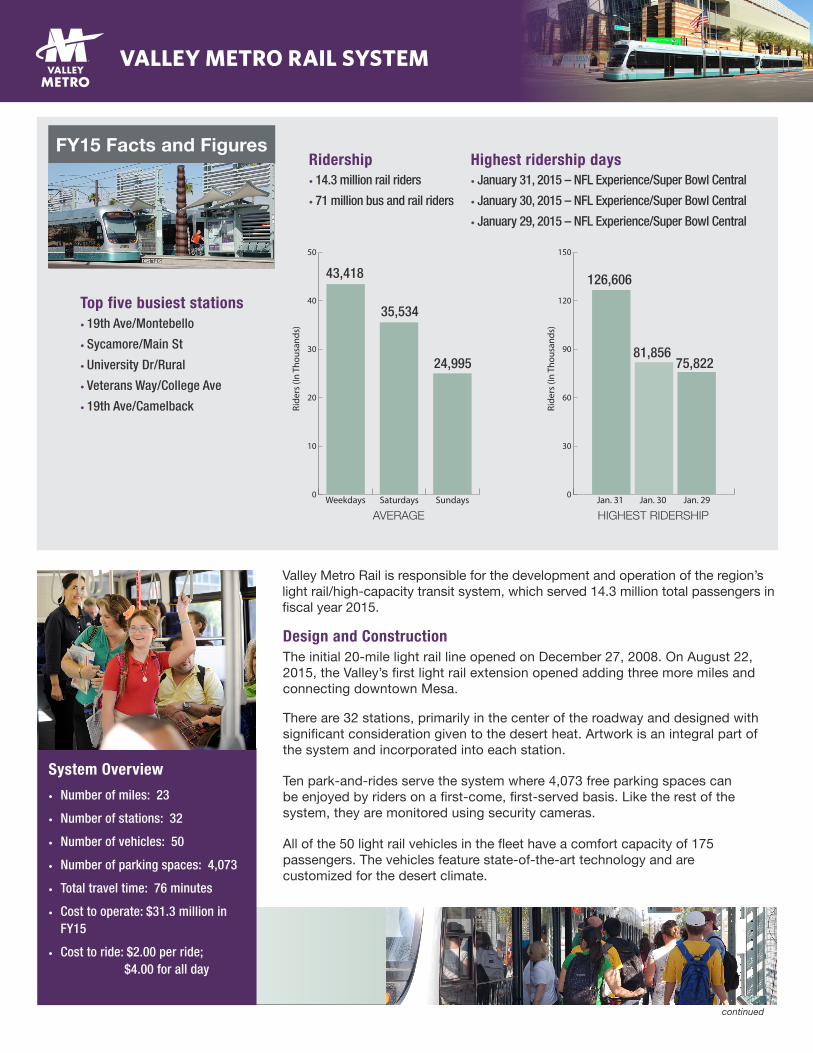
System Overview
• Number of miles: 23
• Number of stations: 32
• Number of vehicles: 50
• Number of parking spaces: 4,073
• Total travel time: 76 minutes
• Cost to operate: $31.3 million in FY15
• Cost to ride: $2.00 per ride; $4.00 for all day
Valley Metro Rail is responsible for the development and operation of the region’s light rail/high-capacity transit system, which served 14.3 million total passengers in fiscal year 2015.
continued
There are 32 stations, primarily in the center of the roadway and designed with significant consideration given to the desert heat. Artwork is an integral part of the system and incorporated into each station.
Ten park-and-rides serve the system where 4,073 free parking spaces can be enjoyed by riders on a first-come, first-served basis. Like the rest of the system, they are monitored using security cameras.
All of the 50 light rail vehicles in the fleet have a comfort capacity of 175 passengers. The vehicles feature state-of-the-art technology and are customized for the desert climate.
Design and ConstructionThe initial 20-mile light rail line opened on December 27, 2008. On August 22, 2015, the Valley’s first light rail extension opened adding three more miles and connecting downtown Mesa.
FY15 Facts and Figures
• 14.3 million rail riders
• 71 million bus and rail riders
Ridership Highest ridership days
43,418
35,534
24,995
AVERAGE
• January 31, 2015 – NFL Experience/Super Bowl Central
• January 30, 2015 – NFL Experience/Super Bowl Central
• January 29, 2015 – NFL Experience/Super Bowl Central
Top five busiest stations• 19th Ave/Montebello
• Sycamore/Main St
• University Dr/Rural
• Veterans Way/College Ave
• 19th Ave/Camelback
HIGHEST RIDERSHIP
0
10
20
30
40
50
Ride
rs (I
n Th
ousa
nds)
Weekdays Saturdays Sundays0
30
60
90
120
150
Ride
rs (I
n Th
ousa
nds)
Jan. 31 Jan. 30 Jan. 29
126,606
81,85675,822
VALLEY METRO RAIL SYSTEM
LRT
2417
/10.
15
VALLEY METRO RAIL SYSTEM
10
17
101
17
101
202
143
202
202
51
10110
McKellips Rd
University Dr
Southern Ave
Guadalupe Rd
Warner Rd
Bell Rd
Indian School Rd
McDowell Rd
Broadway Rd
Buckeye Rd
Thunderbird Rd
Peoria Ave
Bethany Home Rd
Northern Ave
Baseline Rd
Paradise Valley
Scottsdale
Tempe
Glendale
Mesa
Chandler
Peoria
Phoenix
Tolleson
Gilbert
Avondale
Phoenix
99th
Ave
83rd
Ave
67th
Ave
51st
Ave
35th
Ave
19th
Ave
Cent
ral A
ve
24th
St
40th
St
56th
St
Rura
l Rd
Pric
e Rd
Alm
a Sc
hool
Rd
Mes
a D
r
Gilb
ert R
d
Val V
ista
Dr
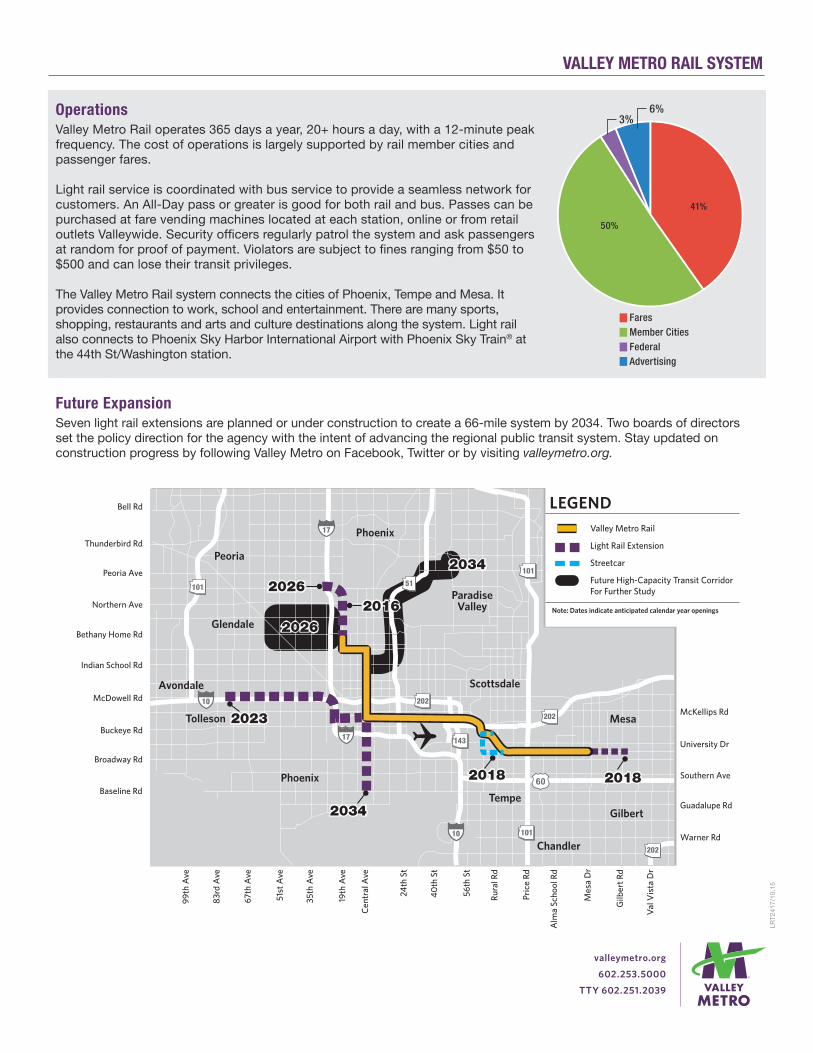
LEGENDValley Metro Rail
Light Rail Extension
Streetcar
Future High-Capacity Transit Corridor For Further Study
Note: Dates indicate anticipated calendar year openings
20342034
20262026
2026202620162016
2018201820182018
20232023
20342034
valleymetro.org
602.253.5000
TTY 602.251.2039
Future ExpansionSeven light rail extensions are planned or under construction to create a 66-mile system by 2034. Two boards of directors set the policy direction for the agency with the intent of advancing the regional public transit system. Stay updated on construction progress by following Valley Metro on Facebook, Twitter or by visiting valleymetro.org.
OperationsValley Metro Rail operates 365 days a year, 20+ hours a day, with a 12-minute peak frequency. The cost of operations is largely supported by rail member cities and passenger fares.
Light rail service is coordinated with bus service to provide a seamless network for customers. An All-Day pass or greater is good for both rail and bus. Passes can be purchased at fare vending machines located at each station, online or from retail outlets Valleywide. Security officers regularly patrol the system and ask passengers at random for proof of payment. Violators are subject to fines ranging from $50 to $500 and can lose their transit privileges.
The Valley Metro Rail system connects the cities of Phoenix, Tempe and Mesa. It provides connection to work, school and entertainment. There are many sports, shopping, restaurants and arts and culture destinations along the system. Light rail also connects to Phoenix Sky Harbor International Airport with Phoenix Sky Train® at the 44th St/Washington station.
FaresMember CitiesFederalAdvertising
41%
6%3%
50%
Valley Metro Rail, Inc. Table of Contents Comprehensive Annual Financial Report Fiscal Year Ended June 30, 2015
PageIntroductory Section
Letter of Transmittal iiiCertificate of Achievement for Excellence in Financial Reporting xPolicy Organizational Chart xiList of Appointed Officials xii
Financial Section Independent Auditor’s Report 1Management's Discussion and Analysis (Required Supplementary Information) 3Basic Financial Statements
Statement of Net Position 10 Statement of Revenues, Expenses, and Changes in Fund Net Position 11 Statement of Cash Flows 12 Notes to the Financial Statements 13
Other Supplementary Information Schedule of Operations - Budget and Actual 27
Statistical Section Financial Trends
Net Position by Component 31 Changes in Net Position 32
Demographic and Economic Information Growth in Regional Transit Usage 33 Population Growth 34 Top Employers in Maricopa County 35 Project Report – Central Mesa 36 Project Report – Northwest Extension Phase I 37 Project Report – Gilbert Road 38 Project Report – Tempe Streetcar 39 Project Report – Capitol / I-10 West 40 Project Report – West Phoenix / Central Glendale 41 Project Report – Northwest Extension Phase II 42 Project Report – South Central 43
Operating Information Full-Time Equivalent Positions 44 Schedule of Insurance Coverage 47 Design & Construction Milestones 49
INTRODUCTORY SECTION The Introductory Section includes Valley Metro Rail’s transmittal letter, policy organizational chart,
and list of appointed officials
iii
101 North 1st Avenue Suite 1300
Phoenix, AZ 85003 November 10, 2015
To Chairman and Members of the Valley Metro Rail, Inc. Board of Directors:
The comprehensive annual financial report of Valley Metro Rail, Inc. (VMR) for the fiscal year ended June 30, 2015, is hereby submitted in accordance with the requirements of the Bylaws and Board directives. Responsibility for both the accuracy of the data and the completeness and fairness of the presentation, including all disclosures, rests with management. To the best of our knowledge and belief, the enclosed data is accurate in all material respects and is reported in a manner that presents fairly the financial position, results of operations and cash flows of VMR. All disclosures necessary to enable the reader to gain an understanding of VMR’s activities have been included.
These financial statements have been prepared in accordance with accounting principles generally accepted in the United States of America (GAAP) for local governments as prescribed by the Governmental Accounting Standards Board (GASB) and the American Institute of Certified Public Accountants (AICPA).
The independent auditors, Heinfeld, Meech & Co., P.C., whose report is included herein, have examined the basic financial statements and related notes. As stated in the independent auditor’s report, the goal of the independent audit was to provide reasonable assurance that the basic financial statements of VMR as of and for the fiscal year ended June 30, 2015, are free from material misstatement. The independent audit involved examining, on a test basis; evidence supporting the amounts and disclosures in the financial statements; assessing accounting principles used and significant estimates made by management; and evaluating the overall financial statement presentation. The independent auditors concluded, based upon their audit, that there was a reasonable basis for rendering an unmodified opinion that the basic financial statements of VMR for the fiscal year ended June 30, 2015, are fairly presented, in all material respects, in conformity with GAAP. The independent auditor’s report is presented as the first component of the financial section of this report.
Additionally, VMR is required to have an independent audit of expenditures of federal awards received (Single Audit) by VMR directly from federal agencies, or passed through to VMR by other governmental entities during the fiscal year. The standards governing Single Audit engagements require the independent auditor to report not only on the fair presentation of the financial statements, but also on VMR’s internal controls and compliance with legal requirements having a direct and material impact on major programs, with special emphasis on internal controls and compliance requirements involving the administration of major federal awards. The results of VMR’s Single Audit for the fiscal year ended June 30, 2015, found no instances of material weakness in the internal control structure or significant violations of applicable laws and regulations with respect to major programs. The auditor’s reports on internal controls and compliance with applicable laws and regulations are included in a separately issued Single Audit Report.
The financial statements are prepared and presented in conformity with accounting principles generally accepted in the United States of America. More information about the presentation can be found in Management’s Discussion and Analysis (MD&A) beginning on page 3 and also discussed in the notes to the financial statements beginning on page 13. This transmittal letter is designed to complement MD&A and should be read in conjunction with it.
Valley Metro Rail, Inc. Letter of Transmittal (Continued)
iv
THE FINANCIAL REPORTING ENTITY VMR was established in October 2002 as a public nonprofit corporation formed by the cities of Glendale, Mesa, Phoenix, and Tempe to manage design, construction, and operation of the Light Rail Transit (LRT) System within the Metropolitan Area. The cities of Chandler and Peoria became contributing member cities in 2007. The City of Scottsdale joined in April of 2008 and withdrew membership effective July 1, 2009. Subsequent to the close of fiscal year 2010-2011, the City of Peoria withdrew membership effective July 1, 2011. During the fiscal year 2014-2015, a five member Board of Directors governed VMR, consisting of the mayors or their designated representatives from each member city. The Board of Directors establishes overall policies for management and administration of the LRT System, provides oversight over the design, construction and operation of light rail, and receives and disburses funds and grants from federal, state, local, and other funding sources. A Chief Executive Officer, appointed by the Board of Directors, is responsible for the day-to-day management of the organization. In February 2012, the Boards of Directors of VMR and the Regional Public Transportation Authority (RPTA) took action to appoint Mr. Stephen R. Banta as the Chief Executive Officer to manage the two financial entities under a single integrated agency. RPTA and VMR entered into an intergovernmental agreement providing for the single CEO to serve both organizations effective March 1, 2012 with the preservation of both RPTA and VMR Boards of Directors. LOCAL ECONOMIC CONDITION AND OUTLOOK VMR serves the cities of Chandler, Glendale, Mesa, Phoenix, and Tempe that are centrally located in Maricopa County, Arizona. These cities have constituted a well-established growth area since 1945, and collectively encompass approximately 1,000 square miles. Together they form a significant portion of the greater metropolitan Phoenix area, which is the economic, political, and population center of Arizona. The combined five cities have grown from 2.612 million residents in the year 2005 to 2.666 million residents in 2014, an increase of approximately 2.07% in the last ten years. The five cities’ population represents over 65% of the total Maricopa County population. According to the Greater Phoenix Economic Council, population in the region is projected to grow at more than twice the national rate for the next few decades, growing from 4.0 million in 2008 to 6.3 million in 2030. In 2007 and 2008, the region’s historically strong economic growth slowed and sales tax revenues fell with the nation-wide recession. In fiscal years 2009 and 2010 regional tax revenues fell 13.7% and 8.9% respectively. VMR responded to the times with staff reductions in 2009 and with service reductions in 2010. In fiscal years 2012, 2013, 2014 and 2015 regional tax revenues have rebounded, growing by 4.3%, 5.5%, 7.0% and 4.6% respectively. While the economic recovery in the region is not complete, the outlook is bright for maintaining and expanding the 20-mile light rail system. Despite the 2009 downturn, growth of public transportation continues to be strong. Over the last ten years, while population has grown by less than 3% in the region, public transportation ridership has grown by 19.4%. With the commencement of rail passenger operations in December 2008, the LRT System added new capacity to the regional transportation system. Since opening, VMR has experienced strong passenger growth with average weekday ridership reaching 43,418 passengers in fiscal year 2015 up from 33,440 riders per day in fiscal year 2009.
Valley Metro Rail, Inc. Letter of Transmittal (Continued)
v
With Proposition 400, and the creation of the Public Transportation Fund, light rail extensions in Mesa, Phoenix, and Tempe are in the planning or design stages which will continue to add capacity to the region’s transportation system in the years ahead. FINANCIAL CONTROLS Accounting and Administrative Controls As previously noted, VMR’s management is responsible for establishing and maintaining an internal control structure designed to ensure that the assets of VMR are protected from loss, theft or misuse and to ensure that adequate accounting data are compiled to allow for the preparation of financial statements in conformity with generally accepted accounting principles. VMR’s internal control structure is designed to provide reasonable, but not absolute, assurance that these objectives are met. The concept of reasonable assurance recognizes that: (1) the cost of a control should not exceed the benefits likely to be derived; and (2) the valuation of costs and benefits requires estimates and judgments by management. As a sub-recipient of federal financial assistance, VMR is also responsible for ensuring that an adequate internal control structure is in place to ensure and document compliance with applicable laws and regulations related to these programs. This internal control structure is subject to periodic evaluation by management and by VMR’s independent auditor. As part of VMR’s Single Audit, tests were made of the internal control structure and of its compliance with applicable laws and regulations, including those related to federal awards. Although this testing is limited in scope and is not sufficient to support an opinion on VMR’s internal control system or its compliance with laws and regulations, the audit for the year ended June 30, 2015, disclosed no material internal control weaknesses or material violations of laws and regulations. The audit of VMR’s compliance with requirements applicable to each major program and internal control over compliance resulted in an unmodified opinion of compliance and noted no material weaknesses in internal controls. Budgetary Systems and Controls The objective of the budgetary controls maintained by VMR is to ensure compliance with legal provisions embodied in the annual appropriated budget approved by the Board of Directors. The by-laws require a balanced budget to be adopted by the VMR Board each fiscal year. The level of budgetary control, i.e., the level at which expenditures cannot legally exceed appropriations, is the total operating budget. VMR maintains budgetary control by conducting quarterly evaluations of expenditures against appropriations and through close monitoring of revenues. Encumbrance accounting is not utilized and all appropriations lapse at year-end. As demonstrated by the statements included in the financial section of this report, VMR continues to meet its responsibility for sound financial management. In addition to the annual budget, VMR also prepares a Five-Year Capital Program and Operating Forecast and the Transit Life Cycle Plan (TLCP) update. The five-year forecast starts with the annual budget information and extends it an additional four years to provide information about the anticipated schedule, costs, and revenues. The TLCP gives a longer term perspective by outlining the sources and uses of funds for specific capital projects and the corresponding costs and funding to operate each project out through fiscal year 2025. For each major capital construction project, VMR regularly reports the project budget status to the Board showing by project element the budget amount versus actual expenditures, and forecasted cost at completion. VMR evaluates project contractual costs and estimates the cost at completion
Valley Metro Rail, Inc. Letter of Transmittal (Continued)
vi
as part of the regular project reporting process. Should anticipated contractual costs appear to exceed the Board approved project budget, VMR staff will seek Board action to adjust project scope or approve additional funding. During construction, significant issues are addressed in narrative reports included in the project progress report submitted to the Board on a quarterly basis. With the commencement of passenger operations in December 2008, VMR has continued to refine detailed cost estimates for manpower, contracted costs, utilities and insurance to construct the annual operations budget. Analysis and comparisons of VMR’s planned costs to peer city light rail systems have been conducted. Actual costs are tracked against budget and reported to Member Cites on a monthly basis with significant variances analyzed and communicated. Member Cities fund the cost of the operations based upon the ratio of route miles in operation within each jurisdiction. In the first five years of operations, VMR has successfully operated within budget while achieving on-time and reliability performance targets. With respect to fare revenues, VMR engages an armored car service contractor to pick up fare payments deposited by customers in the fare vending machines. The armored car service deposits daily collections into the City of Phoenix regional fare revenue depository. VMR works in collaboration with the City of Phoenix to compute and distribute fare revenues to the Member Cities. In FY15, VMR’s fare collections and cost of operations were level with the prior year. As a result, fare recovery ratio continued to exceed 40.0% comparing favorably with peer agencies located in the western United States. (See below table) Light Rail Systems
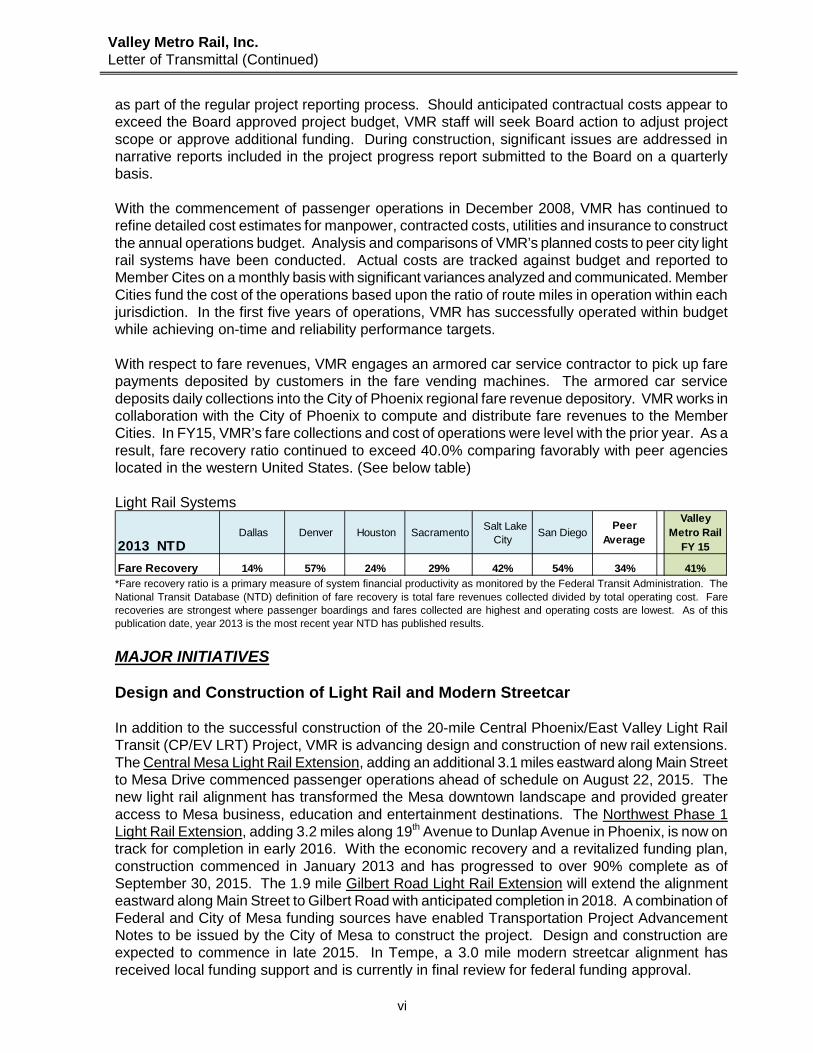
*Fare recovery ratio is a primary measure of system financial productivity as monitored by the Federal Transit Administration. The National Transit Database (NTD) definition of fare recovery is total fare revenues collected divided by total operating cost. Fare recoveries are strongest where passenger boardings and fares collected are highest and operating costs are lowest. As of this publication date, year 2013 is the most recent year NTD has published results.
MAJOR INITIATIVES Design and Construction of Light Rail and Modern Streetcar In addition to the successful construction of the 20-mile Central Phoenix/East Valley Light Rail Transit (CP/EV LRT) Project, VMR is advancing design and construction of new rail extensions. The Central Mesa Light Rail Extension, adding an additional 3.1 miles eastward along Main Street to Mesa Drive commenced passenger operations ahead of schedule on August 22, 2015. The new light rail alignment has transformed the Mesa downtown landscape and provided greater access to Mesa business, education and entertainment destinations. The Northwest Phase 1 Light Rail Extension, adding 3.2 miles along 19th Avenue to Dunlap Avenue in Phoenix, is now on track for completion in early 2016. With the economic recovery and a revitalized funding plan, construction commenced in January 2013 and has progressed to over 90% complete as of September 30, 2015. The 1.9 mile Gilbert Road Light Rail Extension will extend the alignment eastward along Main Street to Gilbert Road with anticipated completion in 2018. A combination of Federal and City of Mesa funding sources have enabled Transportation Project Advancement Notes to be issued by the City of Mesa to construct the project. Design and construction are expected to commence in late 2015. In Tempe, a 3.0 mile modern streetcar alignment has received local funding support and is currently in final review for federal funding approval.
2013 NTD Dallas Denver Houston Sacramento
Salt Lake City
San DiegoPeer
Average
Valley Metro Rail
FY 15
Fare Recovery 14% 57% 24% 29% 42% 54% 34% 41%
Valley Metro Rail, Inc. Letter of Transmittal (Continued)
vii
The Tempe Streetcar project is tentatively scheduled to commence design and construction for a line opening in 2018 / 2019, pending the outcome of the federal review process. In Phoenix, the 11 mile Capitol/I-10 West Light Rail Extension along the Interstate 10 corridor and the 5 mile South Central Corridor Light Rail Extension proceeding directly south of downtown along Central Avenue have received the support of the City of Phoenix Council. With the recent passage of Prop 104, the City of Phoenix has voter approval to fund light rail capital and operating costs which will move forward construction of these and other future projects in the city. (See pages 36-43 for project information)
Current Rail Passenger Operations
Commencing in January 2009, VMR has operated a 19.6 mile LRT System that connects north central Phoenix, Tempe, and Mesa complementing regional bus services. As the initial starter segment, the alignment extends from 19th Avenue and Bethany Home Road in Phoenix to Main and Sycamore Road in Mesa. The cities of Phoenix, Tempe, and Mesa share responsibility for funding the operating and maintenance (O&M) costs. Service commences daily at 5AM and operates to 11PM, with extended hours on Friday and Saturday to 2AM. Weekday riders have access to trains every 12 minutes from 7AM to 7PM. Weekend and off-peak weekday service frequencies range from 15 to 20 minutes.
Central Mesa Light Rail Extension Project
In March, 2010, the Mesa City Council approved a 3.1 mile extension of the LRT system and in August 2010, the Federal Transit Administration (FTA) approved the alignment for project development. In September 2012, the FTA completed review of the $75.0 million Section 5309 Small Start application and submitted the grant to Congress for final approval. The extension begins at the eastern limits of VMR’s existing light rail system (Sycamore) and extends east on Main Street to Mesa Drive. The entire extension is within the City of Mesa. There are four stations on Main Street including a station at Alma School Road, Country Club Drive, Center Street, and Mesa Drive.
The Central Mesa Extension commenced passenger operations in August 2015, three months ahead of schedule. Fully mature ridership projection is estimated at approximately 4,750 riders per day. The total capital cost of the project is $199.0 million, funded with a combination of federal and regional funds.
Northwest Extension LRT Project
The Northwest Extension is a 4.6 mile light rail project starting at the northwest termination point of the Central Phoenix/East Valley Light Rail project. The project follows 19th Avenue to Dunlap Avenue, then west on Dunlap Avenue to 25th Avenue and then runs on 25th Avenue to Mountain View Road. In March 2007 the Phoenix City Council approved an initial 3.2 mile phase to be locally funded, without federal funding support. In 2009, with the economic downturn, construction of the first phase, which includes the 19th Avenue to Dunlap portion of the project, was suspended based upon availability of funding. From 2009 through mid-2012, real estate was acquired, private utility lines were relocated and neighborhood mitigation improvements were made to prepare for light rail construction.
On June 20, 2012, the Phoenix City Council approved $60,000,000 from transit sales tax funds to accelerate the project construction, with repayment from the PTF to come in 2017. In July of 2012, the Regional Council of the Maricopa Association of Governments (MAG) approved the
Valley Metro Rail, Inc. Letter of Transmittal (Continued)
viii
2012 Transit Life Cycle Plan Update which allocates monies from the Public Transportation Fund (PTF) for the Northwest Extension Project. These funding actions have enabled the project to complete design work and reach 90% construction completion for the 3.2 mile Phase I. The Phase I Northwest Extension is on-track to open in the spring of 2016 with fully mature ridership estimated at approximately 4,000 riders per day. The total capital cost of the project is $326.6 million to be funded with a combination of City of Phoenix and Public Transportation Funds. Funding Milestones On November 2, 2004, the voters of Maricopa County approved Proposition 400, the continuation of the transportation tax, for a twenty year period, beginning in calendar year 2006. A major milestone in transportation funding and service in the region, the proposition had unanimous support from the mayors of all of the cities in the region and the Maricopa County Board of Supervisors, the Maricopa Association of Governments Regional Council, and the Arizona Department of Transportation. This initiative is forecasted to generate $1.3 billion (in year of expenditure dollars) in revenue over the 20 year period to fund construction of an additional 24 miles of light rail extension and 3.0 miles of modern streetcar. In March 2006, VMR began to receive funds from the Public Transportation Fund. Initial funds were used for the relocation of non-prior rights utilities impacted by LRT construction. InAugust 2006, the Regional Public Transportation Authority (RPTA) and VMR executed the LRT Program Agreement. Under the agreement, RPTA designates VMR as the Lead Agency to plan, design, and construct the LRT program as defined by the Maricopa Association of Governments Regional Transportation Plan. As of June 30, 2015, $471.0 million of Public Transportation Funds have been received to fund VMR rail programs. In December 2007, the Phoenix City Council approved $34.7 million to fund pre-construction activities for the Northwest Extension. In July 2009, in response to reductions in sales tax revenues, the Council took action to phase construction activities pending availability of funds. In June 2012, the Council took action to advance $60.0 million to restart and accelerate construction of the 3.2 mile Northwest Extension Phase I Project. In June 2009, the Regional Public Transportation Authority (RPTA) issued Transportation Excise Tax Revenue Bonds in the amount of $100,075,000. Approximately $55.0 million of the 2009 series bond proceeds reimbursed and paid LRT capital expenditures as designated in the Regional Transportation Plan. In January 2014, the RPTA issued a second series of bonds to fund LRT capital expenditures. The 2014 series bonds totaled $115,000,000 par value were sold at a premium to generate approximately $134.0 million in proceeds for the Central Mesa and Northwest Phase I LRT extensions. In December 2009, VMR submitted application with the FTA to enter Project Development for the Central Mesa LRT Extension. In August of 2010 FTA approved the project to move forward into design under the Sec 5309 Small Starts program. In August of 2011, the FTA approved the project environmental submittal enabling right of way acquisition and utility relocation eligible for federal funding. In October of 2012, the FTA awarded a $75.0 million Project Construction Grant Agreement for the Central Mesa Extension.
x x
xi
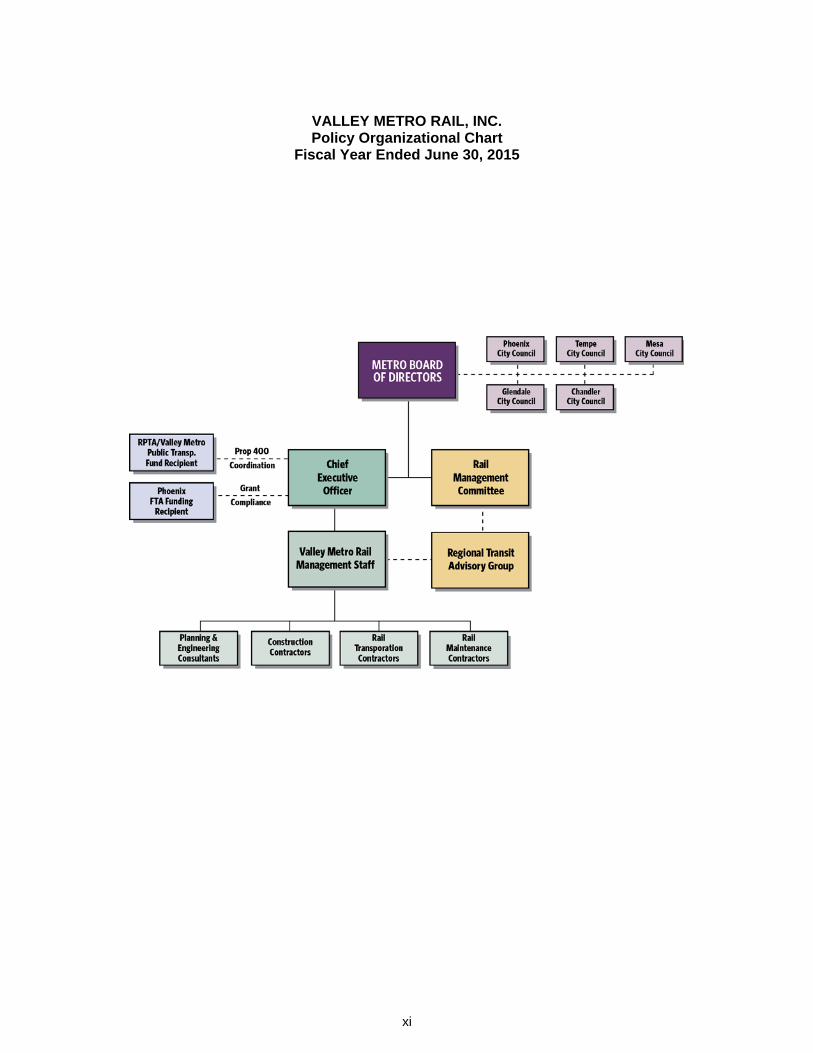
VALLEY METRO RAIL, INC. Policy Organizational Chart
Fiscal Year Ended June 30, 2015
Board Chairman Vice Mayor Dennis Kavanaugh, MesaVice Chairman Councilmember Thelda Williams, PhoenixBoard Member Councilmember Rick Heumann, ChandlerBoard Member Councilmember Gary Sherwood, GlendaleBoard Member Mayor Mark Mitchell, Tempe
Chief Executive Officer Stephen R. BantaChief of Staff Jyme Sue McLarenChief Operations Officer Raymond AbrahamChief Engineer Rick BrownDirector, Communication & Marketing Hillary FooseDirector, Planning & Development Wulf GroteDirector of Administration & Organizational Development Carol KetchersideGeneral Counsel Mike LadinoChief Financial Officer John McCormackDirector, Safety & Security Adrian Ruiz
Executive Management Team
VALLEY METRO RAIL, INC.List of Appointed Officials
Fiscal Year Ended June 30, 2015
Board of Directors
xii
FINANCIAL SECTION The Financial Section includes the Independent Auditor’s Report, Management’s Discussion and Analysis (MD&A), the basic financial statements, and notes to the financial statements.
1
INDEPENDENT AUDITOR’S REPORT Board of Directors Valley Metro Rail, Inc. Report on the Financial Statements We have audited the accompanying financial statements of Valley Metro Rail, Inc., as of and for the year ended June 30, 2015, and the related notes to the financial statements, as listed in the table of contents. Management’s Responsibility for the Financial Statements Management is responsible for the preparation and fair presentation of these financial statements in accordance with accounting principles generally accepted in the United States of America; this includes the design, implementation, and maintenance of internal control relevant to the preparation and fair presentation of financial statements that are free from material misstatement, whether due to fraud or error. Auditor’s Responsibility Our responsibility is to express an opinion on these financial statements based on our audit. We conducted our audit in accordance with auditing standards generally accepted in the United States of America and the standards applicable to financial audits contained in Government Auditing Standards, issued by the Comptroller General of the United States. Those standards require that we plan and perform the audit to obtain reasonable assurance about whether the financial statements are free from material misstatement. An audit involves performing procedures to obtain audit evidence about the amounts and disclosures in the financial statements. The procedures selected depend on the auditor’s judgment, including the assessment of the risks of material misstatement of the financial statements, whether due to fraud or error. In making those risk assessments, the auditor considers internal control relevant to the entity’s preparation and fair presentation of the financial statements in order to design audit procedures that are appropriate in the circumstances, but not for the purpose of expressing an opinion on the effectiveness of the entity’s internal control. Accordingly, we express no such opinion. An audit also includes evaluating the appropriateness of accounting policies used and the reasonableness of significant accounting estimates made by management, as well as evaluating the overall presentation of the financial statements. We believe that the audit evidence we have obtained is sufficient and appropriate to provide a basis for our audit opinion. Opinion In our opinion, the financial statements referred to above present fairly, in all material respects, the respective financial position of Valley Metro Rail, Inc., as of June 30, 2015, and the respective changes in financial position and, where applicable, cash flows thereof for the year then ended in accordance with accounting principles generally accepted in the United States of America.
TUCSON • PHOENIX • FLAGSTAFFwww.heinfeldmeech.com
10120 N. Oracle RoadTucson, Arizona 85704
Tel (520) 742-2611Fax (520) 742-2718
2
Other Matters Required Supplementary Information Accounting principles generally accepted in the United States of America require that the Management’s Discussion and Analysis, as listed in the table of contents, be presented to supplement the financial statements. Such information, although not a part of the financial statements, is required by the Governmental Accounting Standards Board, who considers it to be an essential part of financial reporting for placing the financial statements in an appropriate operational, economic, or historical context. We have applied certain limited procedures to the required supplementary information in accordance with auditing standards generally accepted in the United States of America, which consisted of inquiries of management about the methods of preparing the information and comparing the information for consistency with management’s responses to our inquiries, the financial statements, and other knowledge we obtained during our audit of the financial statements. We do not express an opinion or provide any assurance on the information because the limited procedures do not provide us with sufficient evidence to express an opinion or provide any assurance.
Other Information Our audit was conducted for the purpose of forming opinions on the financial statements that collectively comprise the Valley Metro Rail, Inc.’s financial statements. The Introductory Section, Schedule of Operations – Budget and Actual, listed as Other Supplementary Information in the table of contents, and Statistical Section are presented for purposes of additional analysis and are not a required part of the financial statements. The Schedule of Operations – Budget and Actual is the responsibility of management and was derived from and relates directly to the underlying accounting and other records used to prepare the financial statements. Such information has been subjected to the auditing procedures applied in the audit of the financial statements and certain additional procedures, including comparing and reconciling such information directly to the underlying accounting and other records used to prepare the financial statements or to the financial statements themselves, and other additional procedures in accordance with auditing standards generally accepted in the United States of America. In our opinion, the Schedule of Operations – Budget and Actual is fairly stated in all material respects in relation to the financial statements as a whole. The Introductory Section and Statistical Section have not been subjected to the auditing procedures applied in the audit of the financial statements and, accordingly, we do not express an opinion or provide any assurance on them. Other Reporting Required by Government Auditing Standards In accordance with Government Auditing Standards, we have also issued our report dated November 10, 2015, on our consideration of Valley Metro Rail, Inc.’s internal control over financial reporting and on our tests of its compliance with certain provisions of laws, regulations, contracts, and grant agreements and other matters. The purpose of that report is to describe the scope of our testing of internal control over financial reporting and compliance and the results of that testing, and not to provide an opinion on the internal control over financial reporting or on compliance. That report is an integral part of an audit performed in accordance with Government Auditing Standards in considering Valley Metro Rail, Inc.’s internal control over financial reporting and compliance. HEINFELD, MEECH & CO., P.C. CPAs and Business Consultants November 10, 2015
Valley Metro Rail, Inc. Management’s Discussion and Analysis
As management of Valley Metro Rail, Inc. (VMR), we offer this narrative overview and analysis of the financial activities of VMR for the fiscal year ended June 30, 2015. We encourage readers to consider the information presented here in conjunction with additional information that we have furnished in our letter of transmittal, which can be found on pages iii – ix of this report. This discussion and analysis is designed to (1) assist the reader in focusing on significant financial issues, (2) provide an overview of VMR’s financial activity, (3) identify changes in VMR’s financial position, (4) identify any material deviations from the financial plan (adopted annual budget), and (5) identify other issues or concerns.
Financial Highlights
• VMR’s total net position increased $21.4 million in FY 2015. The increase was caused by newcapital investments which exceeded scheduled depreciation charges. Total net position forVMR was $1.216 billion at June 30, 2015.
• VMR’s operating revenues for FY 2015 were $35.1 million compared to $33.4 million for theprior period, an increase of $1.7 million, or 5.1%. Advertising revenues, fare revenues andregional revenues for the regional capital rebuild program were up over last year. Operatingexpenses were $80.3 million compared to $79.0 million, an increase of $1.3 million, or 1.6%With the system now over five years old, the capital asset rebuild program has commencedexpending $0.9 million to maintain the light rail vehicle fleet in a state of good repair.
• Capital contributions totaled $73.8 million primarily consisting of Public Transportation Funds of$29.9 million and Federal Transit Administration Capital Grants totaling $43.8 million.Construction in progress additions for capital projects include $60.9 million for the Central MesaLRT extension and $65.1 million for the Northwest LRT extension. In addition, the capital fundsprovided for conveyance of $3.9 million in real estate to member cities.
OVERVIEW OF THE FINANCIAL STATEMENTS
VMR’s financial statements are presented in accordance with accounting principles generally accepted in the United States of America (“GAAP”). GAAP requires that the financial statements be accompanied by a narrative introduction and analytical overview of the government’s financial activities in the form of “Management’s Discussion and Analysis” (MD&A). The financial section of the Comprehensive Annual Financial Report (CAFR) for VMR consists of this discussion and analysis and the basic financial statements. This report also contains other supplementary schedules presented after the basic financial statements. VMR’s basic financial statements include a statement of net position; a statement of revenues, expenses and changes in net position; a statement of cash flows; and the notes to the financial statements. VMR’s financial statements are prepared on an accrual basis of accounting in accordance with accounting principles generally accepted in the United States of America promulgated by the Governmental Accounting Standards Board (GASB).
Fund Financial Statements – VMR is presented as an enterprise fund. Enterprise funds are used for activities that primarily serve customers outside the governmental unit. A fund is a grouping of related accounts that is used to maintain control over resources that have been segregated for specific activities or conditions. Funds are used to ensure and demonstrate compliance with finance-related legal requirements as well as for managerial control to demonstrate fiduciary responsibility over the assets of VMR.
3
Valley Metro Rail, Inc. Management’s Discussion and Analysis (Continued)
The statement of net position presents information on all of VMR’s assets and liabilities, with the difference between the two reported as net position. Over time, increases or decreases in net position may serve as a useful indicator of whether the financial position of VMR is improving or deteriorating.
The statement of revenues, expenses and changes in fund net position presents information showing how the agency’s net position changed during the most recent fiscal year. All changes in net position are reported as soon as the underlying event giving rise to the change occurs, regardless of the timing of related cash flows. Thus, revenues and expenses are reported in this statement for some items that will result in cash flows in future fiscal periods (e.g., uncollected grant revenues).
Notes to the Financial Statements – The notes to the financial statements provide additional information that is essential to a full understanding of the data provided in the financial statements and should be read with the financial statements. The notes can be found beginning on page 13.
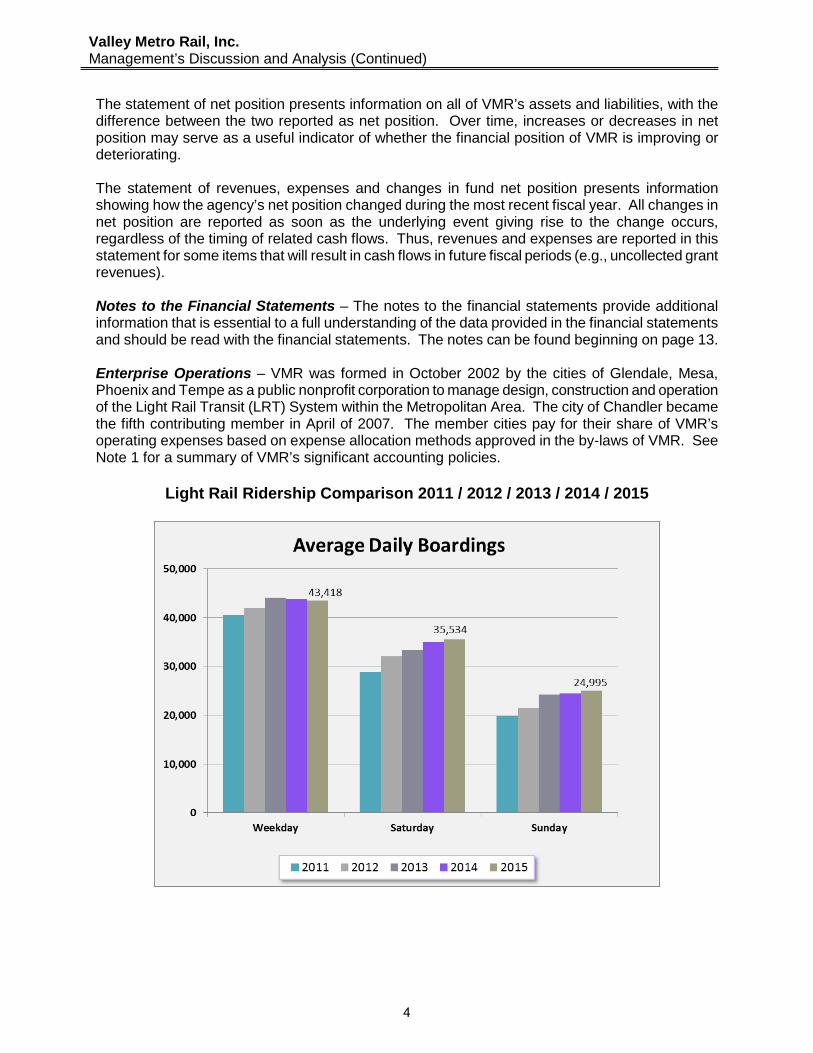
Enterprise Operations – VMR was formed in October 2002 by the cities of Glendale, Mesa, Phoenix and Tempe as a public nonprofit corporation to manage design, construction and operation of the Light Rail Transit (LRT) System within the Metropolitan Area. The city of Chandler became the fifth contributing member in April of 2007. The member cities pay for their share of VMR’s operating expenses based on expense allocation methods approved in the by-laws of VMR. See Note 1 for a summary of VMR’s significant accounting policies.
Light Rail Ridership Comparison 2011 / 2012 / 2013 / 2014 / 2015
4
Valley Metro Rail, Inc. Management’s Discussion and Analysis (Continued)
FINANCIAL ANALYSIS OF VMR
The following tables and analysis discuss the financial position and changes to the financial position for VMR as a whole as of and for the year ended June 30, 2015, with comparative information for the previous period.
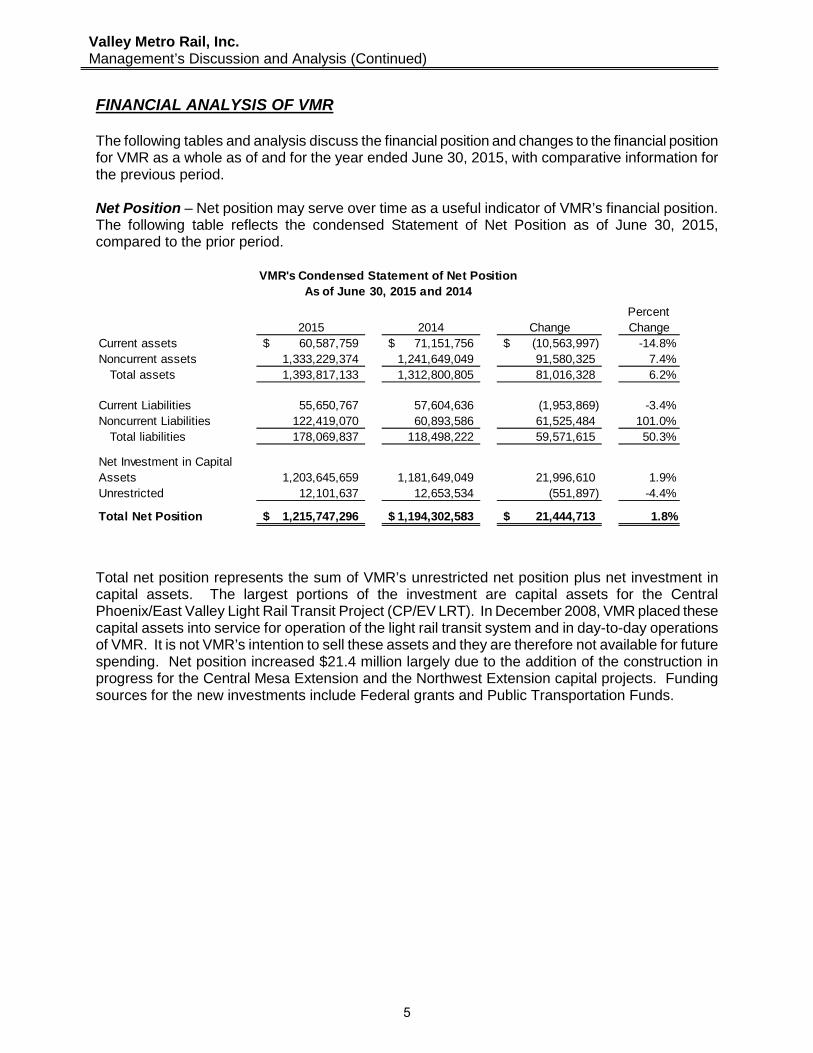
Net Position – Net position may serve over time as a useful indicator of VMR’s financial position. The following table reflects the condensed Statement of Net Position as of June 30, 2015, compared to the prior period.
2015 2014 ChangePercent Change
Current assets 60,587,759$ 71,151,756$ (10,563,997)$ -14.8%Noncurrent assets 1,333,229,374 1,241,649,049 91,580,325 7.4% Total assets 1,393,817,133 1,312,800,805 81,016,328 6.2%
Current Liabilities 55,650,767 57,604,636 (1,953,869) -3.4%Noncurrent Liabilities 122,419,070 60,893,586 61,525,484 101.0% Total liabilities 178,069,837 118,498,222 59,571,615 50.3%
Net Investment in Capital Assets 1,203,645,659 1,181,649,049 21,996,610 1.9%Unrestricted 12,101,637 12,653,534 (551,897) -4.4%
Total Net Position 1,215,747,296$ 1,194,302,583$ 21,444,713$ 1.8%
VMR's Condensed Statement of Net PositionAs of June 30, 2015 and 2014
Total net position represents the sum of VMR’s unrestricted net position plus net investment in capital assets. The largest portions of the investment are capital assets for the Central Phoenix/East Valley Light Rail Transit Project (CP/EV LRT). In December 2008, VMR placed these capital assets into service for operation of the light rail transit system and in day-to-day operations of VMR. It is not VMR’s intention to sell these assets and they are therefore not available for future spending. Net position increased $21.4 million largely due to the addition of the construction in progress for the Central Mesa Extension and the Northwest Extension capital projects. Funding sources for the new investments include Federal grants and Public Transportation Funds.
5
Valley Metro Rail, Inc. Management’s Discussion and Analysis (Continued)
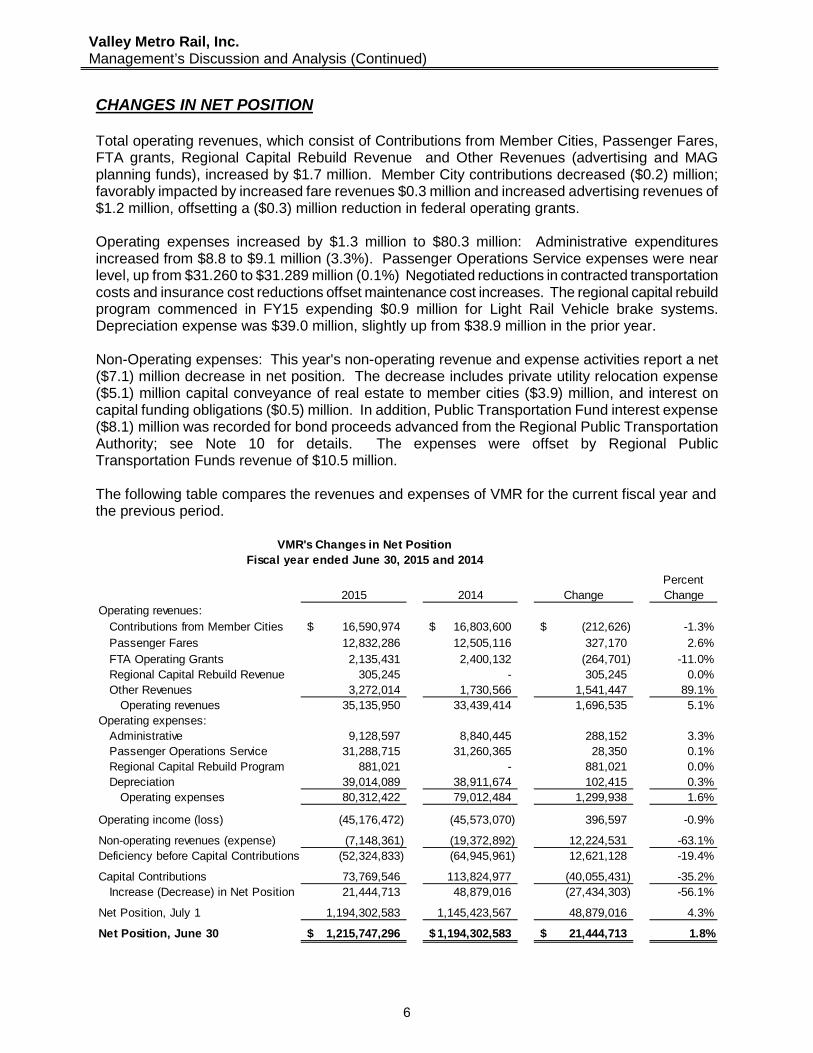
CHANGES IN NET POSITION
Total operating revenues, which consist of Contributions from Member Cities, Passenger Fares, FTA grants, Regional Capital Rebuild Revenue and Other Revenues (advertising and MAG planning funds), increased by $1.7 million. Member City contributions decreased ($0.2) million; favorably impacted by increased fare revenues $0.3 million and increased advertising revenues of $1.2 million, offsetting a ($0.3) million reduction in federal operating grants.
Operating expenses increased by $1.3 million to $80.3 million: Administrative expenditures increased from $8.8 to $9.1 million (3.3%). Passenger Operations Service expenses were near level, up from $31.260 to $31.289 million (0.1%) Negotiated reductions in contracted transportation costs and insurance cost reductions offset maintenance cost increases. The regional capital rebuild program commenced in FY15 expending $0.9 million for Light Rail Vehicle brake systems. Depreciation expense was $39.0 million, slightly up from $38.9 million in the prior year.
Non-Operating expenses: This year's non-operating revenue and expense activities report a net ($7.1) million decrease in net position. The decrease includes private utility relocation expense ($5.1) million capital conveyance of real estate to member cities ($3.9) million, and interest on capital funding obligations ($0.5) million. In addition, Public Transportation Fund interest expense ($8.1) million was recorded for bond proceeds advanced from the Regional Public Transportation Authority; see Note 10 for details. The expenses were offset by Regional Public Transportation Funds revenue of $10.5 million.
The following table compares the revenues and expenses of VMR for the current fiscal year and the previous period.
2015 2014 ChangePercent Change
Operating revenues: Contributions from Member Cities 16,590,974$ 16,803,600$ (212,626)$ -1.3% Passenger Fares 12,832,286 12,505,116 327,170 2.6% FTA Operating Grants 2,135,431 2,400,132 (264,701) -11.0%
Regional Capital Rebuild Revenue 305,245 - 305,245 0.0%Other Revenues 3,272,014 1,730,566 1,541,447 89.1%
Operating revenues 35,135,950 33,439,414 1,696,535 5.1%Operating expenses: Administrative 9,128,597 8,840,445 288,152 3.3% Passenger Operations Service 31,288,715 31,260,365 28,350 0.1%
Regional Capital Rebuild Program 881,021 - 881,021 0.0% Depreciation 39,014,089 38,911,674 102,415 0.3% Operating expenses 80,312,422 79,012,484 1,299,938 1.6%
Operating income (loss) (45,176,472) (45,573,070) 396,597 -0.9%
Non-operating revenues (expense) (7,148,361) (19,372,892) 12,224,531 -63.1%Deficiency before Capital Contributions (52,324,833) (64,945,961) 12,621,128 -19.4%
Capital Contributions 73,769,546 113,824,977 (40,055,431) -35.2% Increase (Decrease) in Net Position 21,444,713 48,879,016 (27,434,303) -56.1%
Net Position, July 1 1,194,302,583 1,145,423,567 48,879,016 4.3%
Net Position, June 30 1,215,747,296$ 1,194,302,583$ 21,444,713$ 1.8%
VMR's Changes in Net PositionFiscal year ended June 30, 2015 and 2014
6
Valley Metro Rail, Inc. Management’s Discussion and Analysis (Continued)
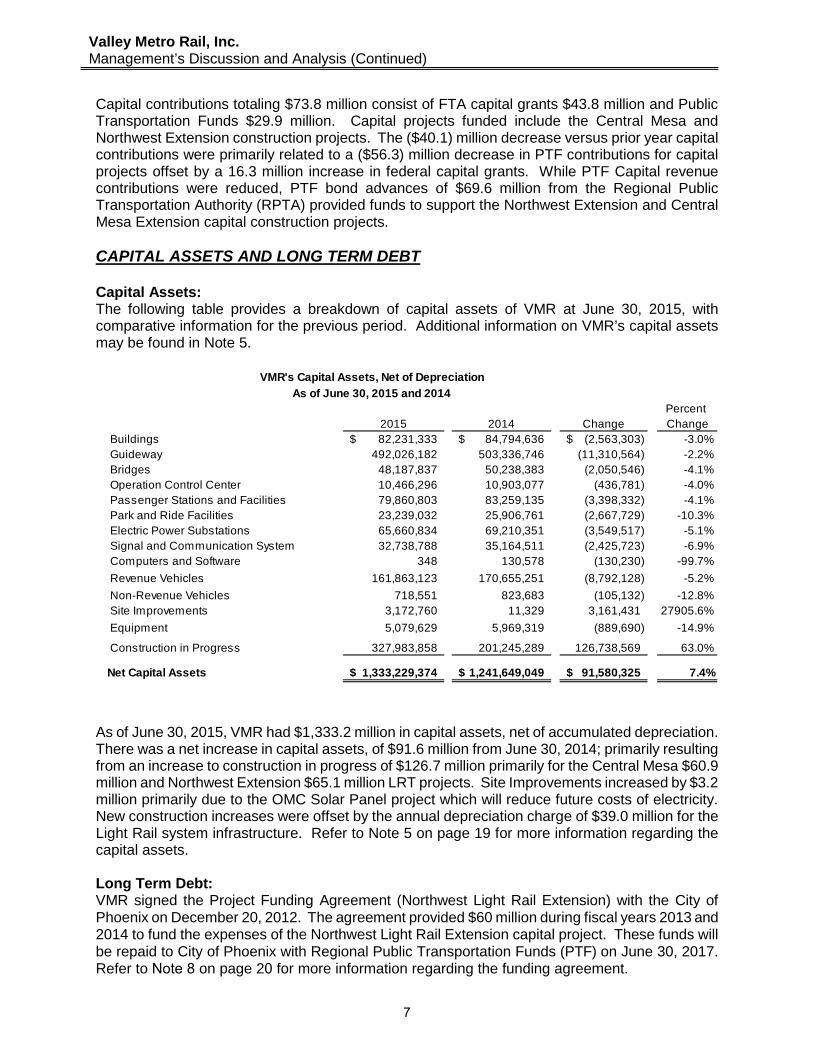
Capital contributions totaling $73.8 million consist of FTA capital grants $43.8 million and Public Transportation Funds $29.9 million. Capital projects funded include the Central Mesa and Northwest Extension construction projects. The ($40.1) million decrease versus prior year capital contributions were primarily related to a ($56.3) million decrease in PTF contributions for capital projects offset by a 16.3 million increase in federal capital grants. While PTF Capital revenue contributions were reduced, PTF bond advances of $69.6 million from the Regional Public Transportation Authority (RPTA) provided funds to support the Northwest Extension and Central Mesa Extension capital construction projects.
CAPITAL ASSETS AND LONG TERM DEBT
Capital Assets: The following table provides a breakdown of capital assets of VMR at June 30, 2015, with comparative information for the previous period. Additional information on VMR’s capital assets may be found in Note 5.
As of June 30, 2015, VMR had $1,333.2 million in capital assets, net of accumulated depreciation. There was a net increase in capital assets, of $91.6 million from June 30, 2014; primarily resulting from an increase to construction in progress of $126.7 million primarily for the Central Mesa $60.9 million and Northwest Extension $65.1 million LRT projects. Site Improvements increased by $3.2 million primarily due to the OMC Solar Panel project which will reduce future costs of electricity. New construction increases were offset by the annual depreciation charge of $39.0 million for the Light Rail system infrastructure. Refer to Note 5 on page 19 for more information regarding the capital assets.
Long Term Debt: VMR signed the Project Funding Agreement (Northwest Light Rail Extension) with the City of Phoenix on December 20, 2012. The agreement provided $60 million during fiscal years 2013 and 2014 to fund the expenses of the Northwest Light Rail Extension capital project. These funds will be repaid to City of Phoenix with Regional Public Transportation Funds (PTF) on June 30, 2017. Refer to Note 8 on page 20 for more information regarding the funding agreement.
2015 2014 ChangePercent Change
Buildings 82,231,333$ 84,794,636$ (2,563,303)$ -3.0%Guideway 492,026,182 503,336,746 (11,310,564) -2.2%Bridges 48,187,837 50,238,383 (2,050,546) -4.1%Operation Control Center 10,466,296 10,903,077 (436,781) -4.0%Passenger Stations and Facilities 79,860,803 83,259,135 (3,398,332) -4.1%Park and Ride Facilities 23,239,032 25,906,761 (2,667,729) -10.3%Electric Power Substations 65,660,834 69,210,351 (3,549,517) -5.1%Signal and Communication System 32,738,788 35,164,511 (2,425,723) -6.9%Computers and Software 348 130,578 (130,230) -99.7%
Revenue Vehicles 161,863,123 170,655,251 (8,792,128) -5.2%
Non-Revenue Vehicles 718,551 823,683 (105,132) -12.8%Site Improvements 3,172,760 11,329 3,161,431 27905.6%
Equipment 5,079,629 5,969,319 (889,690) -14.9%
Construction in Progress 327,983,858 201,245,289 126,738,569 63.0%
Net Capital Assets 1,333,229,374$ 1,241,649,049$ 91,580,325$ 7.4%
VMR's Capital Assets, Net of Depreciation
As of June 30, 2015 and 2014
7
Valley Metro Rail, Inc. Management’s Discussion and Analysis (Continued)
In April 2015, the VMR and RPTA Boards amended the interagency LRT Program Agreement whereby RPTA holds an interagency receivable for PTF bond proceeds advanced to VMR to fund LRT capital projects. In FY15, the PTF Advance Bond Proceeds due from VMR to RPTA totaled $69.6 million. See Note 10 for details.
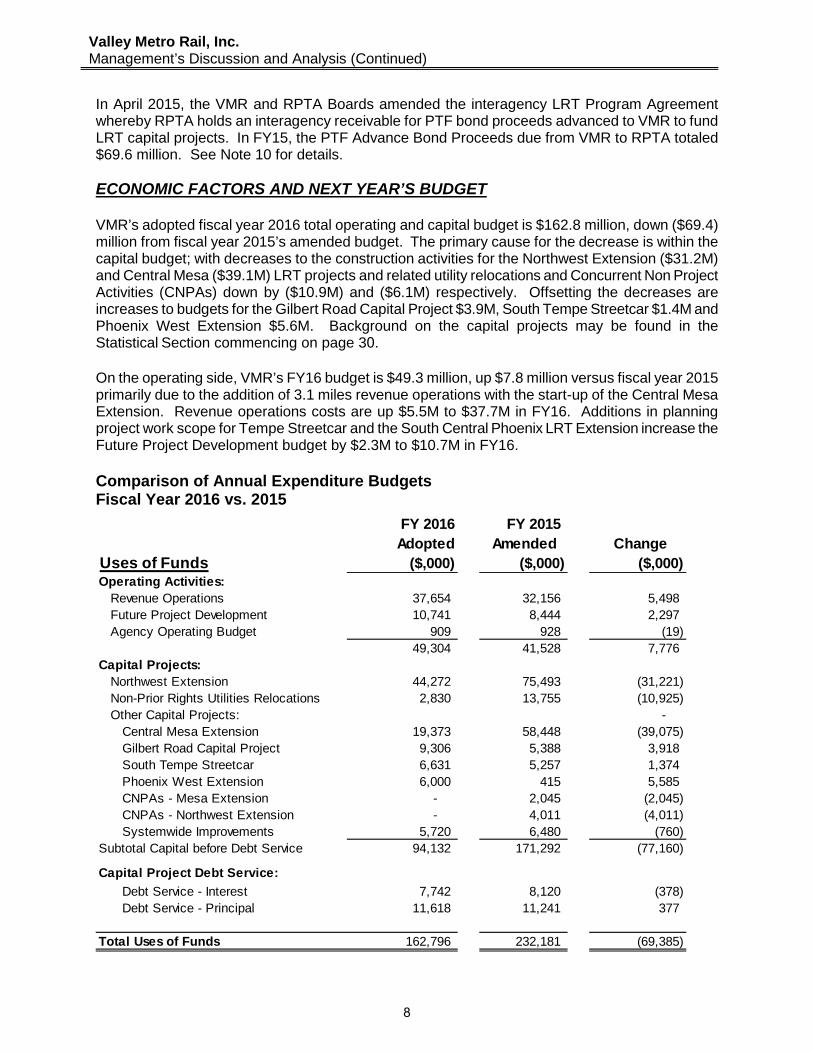
ECONOMIC FACTORS AND NEXT YEAR’S BUDGET
VMR’s adopted fiscal year 2016 total operating and capital budget is $162.8 million, down ($69.4) million from fiscal year 2015’s amended budget. The primary cause for the decrease is within the capital budget; with decreases to the construction activities for the Northwest Extension ($31.2M) and Central Mesa ($39.1M) LRT projects and related utility relocations and Concurrent Non Project Activities (CNPAs) down by ($10.9M) and ($6.1M) respectively. Offsetting the decreases are increases to budgets for the Gilbert Road Capital Project $3.9M, South Tempe Streetcar $1.4M and Phoenix West Extension $5.6M. Background on the capital projects may be found in the Statistical Section commencing on page 30.
On the operating side, VMR’s FY16 budget is $49.3 million, up $7.8 million versus fiscal year 2015 primarily due to the addition of 3.1 miles revenue operations with the start-up of the Central Mesa Extension. Revenue operations costs are up $5.5M to $37.7M in FY16. Additions in planning project work scope for Tempe Streetcar and the South Central Phoenix LRT Extension increase the Future Project Development budget by $2.3M to $10.7M in FY16.
Comparison of Annual Expenditure Budgets Fiscal Year 2016 vs. 2015
Uses of Funds
FY 2016Adopted
($,000)
FY 2015 Amended
($,000)Change
($,000)Operating Activities: Revenue Operations 37,654 32,156 5,498 Future Project Development 10,741 8,444 2,297 Agency Operating Budget 909 928 (19)
49,304 41,528 7,776 Capital Projects: Northwest Extension 44,272 75,493 (31,221) Non-Prior Rights Utilities Relocations 2,830 13,755 (10,925) Other Capital Projects: - Central Mesa Extension 19,373 58,448 (39,075) Gilbert Road Capital Project 9,306 5,388 3,918 South Tempe Streetcar 6,631 5,257 1,374 Phoenix West Extension 6,000 415 5,585 CNPAs - Mesa Extension - 2,045 (2,045) CNPAs - Northwest Extension - 4,011 (4,011) Systemwide Improvements 5,720 6,480 (760) Subtotal Capital before Debt Service 94,132 171,292 (77,160)
Capital Project Debt Service:
Debt Service - Interest 7,742 8,120 (378) Debt Service - Principal 11,618 11,241 377
Total Uses of Funds 162,796 232,181 (69,385)
8
Valley Metro Rail, Inc. Management’s Discussion and Analysis (Concluded)
FINANCIAL CONTACT
The financial report is designed to provide a general overview of VMR’s finances and to demonstrate accountability for the use of public funds. Questions about any of the information provided in this report, or requests for additional financial information should be addressed to VMR’s Chief Financial Officer, Valley Metro Rail, Inc., 101 North 1st Avenue, Suite 1300, Phoenix, Arizona 85003.
9
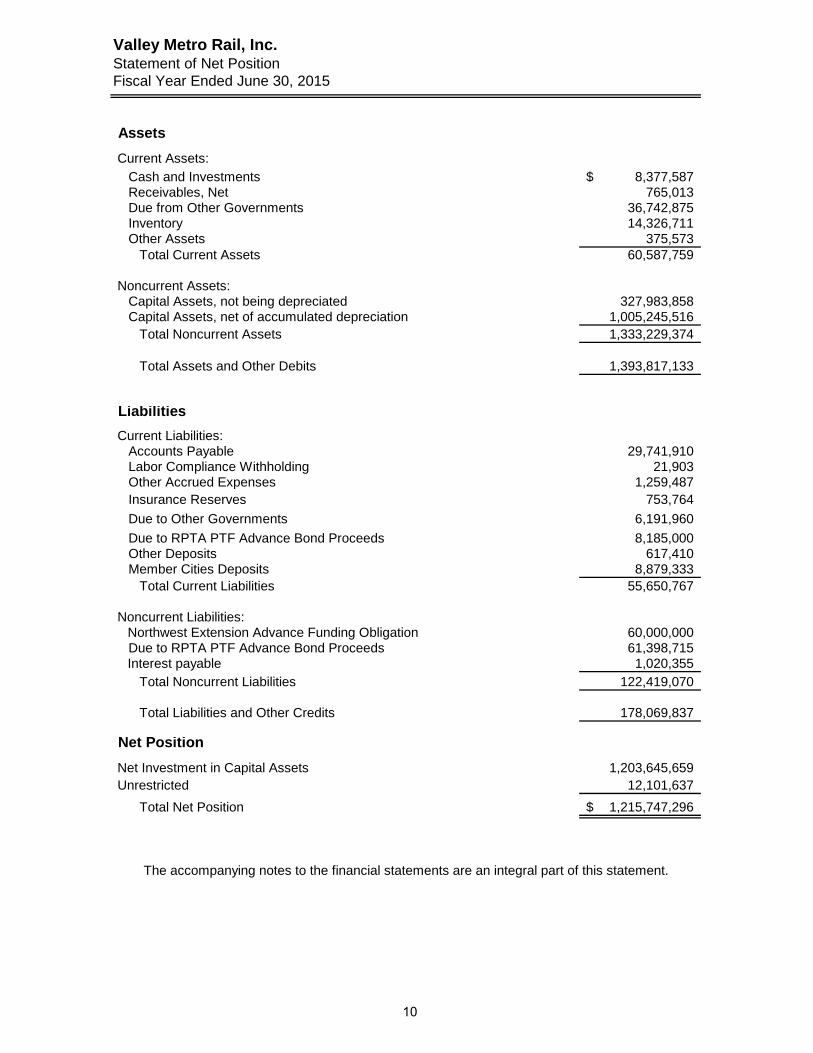
Valley Metro Rail, Inc.Statement of Net PositionFiscal Year Ended June 30, 2015
Assets
Current Assets:
Cash and Investments 8,377,587$ Receivables, Net 765,013 Due from Other Governments 36,742,875 Inventory 14,326,711 Other Assets 375,573 Total Current Assets 60,587,759
Noncurrent Assets: Capital Assets, not being depreciated 327,983,858 Capital Assets, net of accumulated depreciation 1,005,245,516 Total Noncurrent Assets 1,333,229,374
Total Assets and Other Debits 1,393,817,133
Liabilities
Current Liabilities: Accounts Payable 29,741,910 Labor Compliance Withholding 21,903 Other Accrued Expenses 1,259,487
Insurance Reserves 753,764
Due to Other Governments 6,191,960
Due to RPTA PTF Advance Bond Proceeds 8,185,000 Other Deposits 617,410 Member Cities Deposits 8,879,333 Total Current Liabilities 55,650,767
Noncurrent Liabilities: Northwest Extension Advance Funding Obligation 60,000,000 Due to RPTA PTF Advance Bond Proceeds 61,398,715
Interest payable 1,020,355 Total Noncurrent Liabilities 122,419,070
Total Liabilities and Other Credits 178,069,837
Net Position
Net Investment in Capital Assets 1,203,645,659 Unrestricted 12,101,637
Total Net Position 1,215,747,296$
The accompanying notes to the financial statements are an integral part of this statement.
10
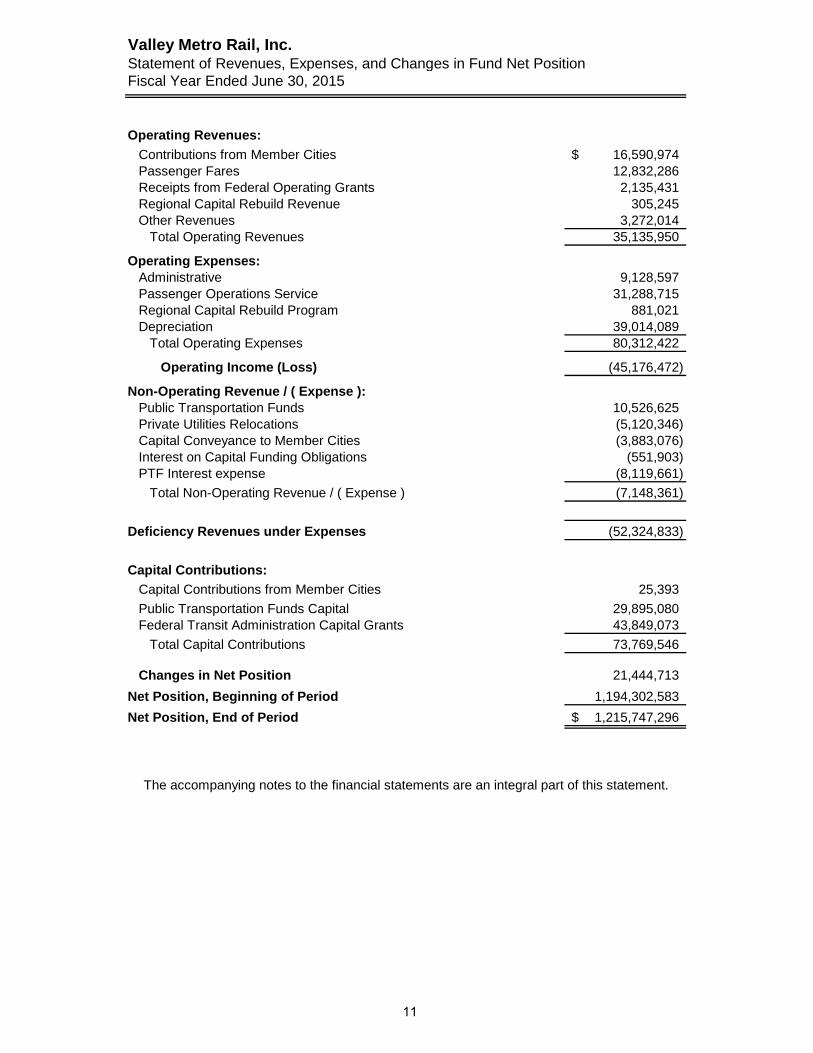
Valley Metro Rail, Inc.Statement of Revenues, Expenses, and Changes in Fund Net PositionFiscal Year Ended June 30, 2015
Operating Revenues:
Contributions from Member Cities 16,590,974$ Passenger Fares 12,832,286 Receipts from Federal Operating Grants 2,135,431
Regional Capital Rebuild Revenue 305,245 Other Revenues 3,272,014 Total Operating Revenues 35,135,950
Operating Expenses: Administrative 9,128,597 Passenger Operations Service 31,288,715
Regional Capital Rebuild Program 881,021 Depreciation 39,014,089 Total Operating Expenses 80,312,422
Operating Income (Loss) (45,176,472)
Non-Operating Revenue / ( Expense ): Public Transportation Funds 10,526,625 Private Utilities Relocations (5,120,346) Capital Conveyance to Member Cities (3,883,076) Interest on Capital Funding Obligations (551,903) PTF Interest expense (8,119,661)
Total Non-Operating Revenue / ( Expense ) (7,148,361)
Deficiency Revenues under Expenses (52,324,833)
Capital Contributions:
Capital Contributions from Member Cities 25,393
Public Transportation Funds Capital 29,895,080 Federal Transit Administration Capital Grants 43,849,073
Total Capital Contributions 73,769,546
Changes in Net Position 21,444,713
Net Position, Beginning of Period 1,194,302,583
Net Position, End of Period 1,215,747,296$
The accompanying notes to the financial statements are an integral part of this statement.
11
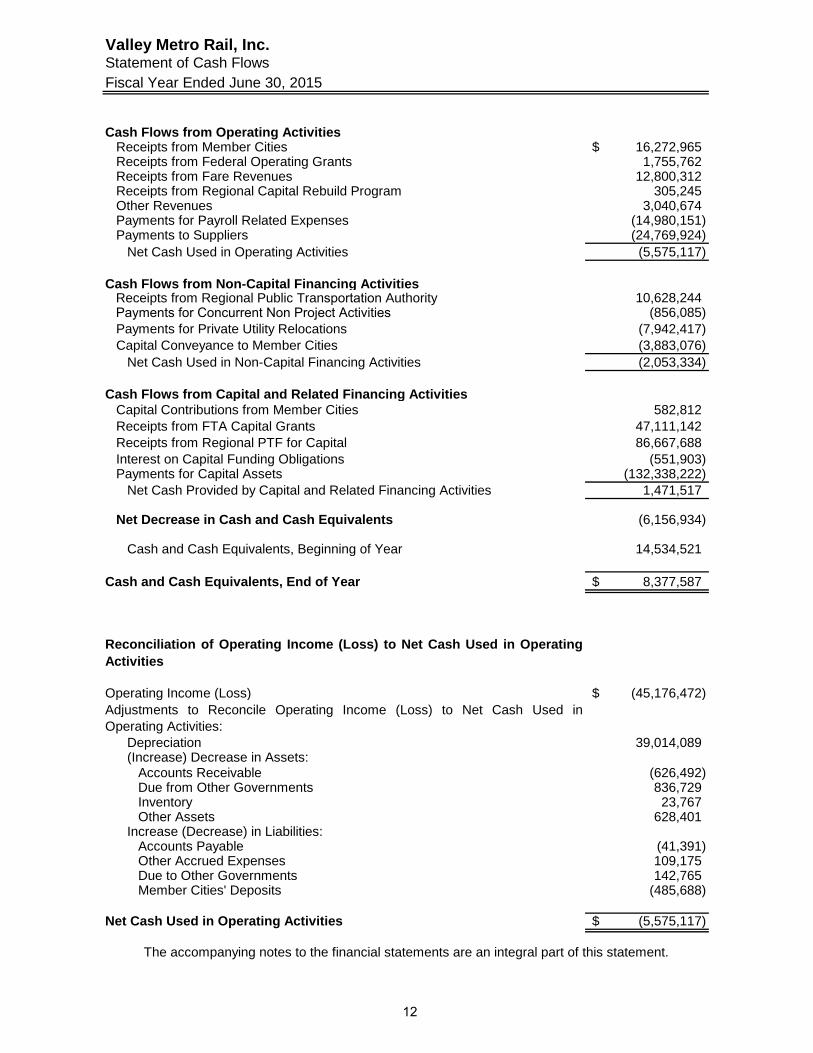
Valley Metro Rail, Inc.Statement of Cash FlowsFiscal Year Ended June 30, 2015
Cash Flows from Operating Activities Receipts from Member Cities 16,272,965$ Receipts from Federal Operating Grants 1,755,762 Receipts from Fare Revenues 12,800,312
Receipts from Regional Capital Rebuild Program 305,245 Other Revenues 3,040,674 Payments for Payroll Related Expenses (14,980,151) Payments to Suppliers (24,769,924) Net Cash Used in Operating Activities (5,575,117)
Cash Flows from Non-Capital Financing Activities10,628,244 Receipts from Regional Public Transportation Authority
Payments for Concurrent Non Project Activities (856,085) Payments for Private Utility Relocations (7,942,417) Capital Conveyance to Member Cities (3,883,076) Net Cash Used in Non-Capital Financing Activities (2,053,334)
Cash Flows from Capital and Related Financing Activities Capital Contributions from Member Cities 582,812 Receipts from FTA Capital Grants 47,111,142 Receipts from Regional PTF for Capital 86,667,688 Interest on Capital Funding Obligations (551,903) Payments for Capital Assets (132,338,222) Net Cash Provided by Capital and Related Financing Activities 1,471,517
Net Decrease in Cash and Cash Equivalents (6,156,934)
Cash and Cash Equivalents, Beginning of Year 14,534,521
Cash and Cash Equivalents, End of Year 8,377,587$
Reconciliation of Operating Income (Loss) to Net Cash Used in OperatingActivities
Operating Income (Loss) (45,176,472)$ Adjustments to Reconcile Operating Income (Loss) to Net Cash Used inOperating Activities: Depreciation 39,014,089 (Increase) Decrease in Assets: Accounts Receivable (626,492) Due from Other Governments 836,729 Inventory 23,767 Other Assets 628,401 Increase (Decrease) in Liabilities: Accounts Payable (41,391) Other Accrued Expenses 109,175 Due to Other Governments 142,765 Member Cities' Deposits (485,688)
Net Cash Used in Operating Activities (5,575,117)$
The accompanying notes to the financial statements are an integral part of this statement.
12
Valley Metro Rail, Inc. Notes to the Financial Statements Fiscal Year Ended June 30, 2015
Summary of Significant Accounting Policies
The accounting policies of Valley Metro Rail, Inc. (VMR) conform to accounting principles generally accepted in the United States of America (GAAP) as applicable to governmental units. The Governmental Accounting Standards Board (GASB) is the accepted standard-setting body for establishing governmental accounting and financial reporting principles.
a. Financial Reporting Entity
In October 2002, the city councils of Glendale, Mesa, Phoenix and Tempe approved theformation of a government entity with a nonprofit status by the name of Valley Metro Rail,Inc. The nonprofit corporation was organized under A.R.S. 11-952 and 40-1152. The initial members entered into a Joint Powers Agreement which provides that this corporation beorganized as the instrumentality to plan, design, construct, and operate the Light RailTransit Project (“LRT”). Prior to October 2002, the Regional Public Transportation Authority(RPTA) performed these roles.
VMR contracts with the RPTA for certain administrative functions, including personnel, HRadministration, and computer support services. All VMR staff is hired and employed byRPTA but works solely under the direction of Valley Metro Rail, Inc., and its Board ofDirectors, through a contractual arrangement with RPTA.
The Board of Directors of VMR is solely responsible for the governance of LRT and VMR isnot a component unit of RPTA; economic resources received by VMR are entirely for thedirect benefit of VMR, and RPTA is not entitled to and has no ability to otherwise access anyof the economic resources received or held by VMR.
b. Basic Financial Statements
These financial statements are presented in accordance with GASB Statement No. 34 –Basic Financial Statements and Management’s Discussion and Analysis for State and Local Governments (GASB No. 34). VMR is engaged only in business-type activities and isrequired to present the financial statements required for enterprise funds which are part ofproprietary funds. VMR does not report any component units.
During the year ended June 30, 2015, the provisions of GASB Statement No.68, Accountingand Financial Reporting for Pensions and GASB Statement No. 71, Pension Transition forContributions Made Subsequent to the Measurement Date became effective in the financial reporting for members of retirement systems. These statements replace the requirementsof prior GASB standards for pensions accounting and reporting.
VMR is not a member of the Arizona State Retirement System (ASRS). Therefore, VMR willnot implement the provisions of GASB 68 and 71 in its financial statements. All VMR staffare employees of RPTA. RPTA is an employer member of ASRS and will fully implementthe provisions of GASB Statements No. 68 and No. 71 in its FY15 CAFR. For furtherinformation, the RPTA CAFR is available on the Valleymetro.org website.
13
Valley Metro Rail, Inc. Notes to the Financial Statements (Continued) Fiscal Year Ended June 30, 2015
c. Basis of Presentation
Proprietary funds account for activities of VMR similar to those found in the private sector,where cost recovery and the determination of net income is useful or necessary forsound fiscal management. The focus of proprietary fund measurement is upon thedetermination of operating income, changes in net position, financial position and cashflows. Currently, enterprise funds are the only type of proprietary fund that VMR uses.
d. Measurement Focus and Basis of Accounting
The Statement of Net Position and Statement of Revenues, Expenses and Changes in FundNet Position are reported using the flow of economic resources measurement focus andaccrual basis of accounting. Revenues are recorded when earned and expenses arerecorded when a liability is incurred, regardless of the timing of related cash flows. Grantsand similar items are recognized as revenue as soon as all eligibility requirements imposedby the provider have been met. Such revenue is subject to review by the funding agency,which may result in disallowance in subsequent periods.
All of VMR's activities are accounted for in a single proprietary or business-type fund.Proprietary funds distinguish operating revenues and expenses from non-operating itemsand capital contributions. Operating revenues and expenses generally result from providingservices and producing and delivering goods in connecting with a proprietary fund'sprincipal ongoing operations. Revenues and expenses not meeting this definition arereported as either non-operating revenues and expenses or capital contributions.
e. Cash and Investments
State statutes authorize VMR to invest in obligations of the U.S. Treasury and any ofits agencies, corporations or instrumentalities, collateralized repurchase agreements,certificates of deposit, and the Local Government Investment Pool. VMR’s investments arestated at fair value. Fair value is based on quoted market prices as of the valuation date.
VMR considers short-term investments in mutual fund-money markets, U.S. Treasury billsand notes with maturities of three months or less at acquisition date to be cash equivalents.
f. Receivables
Management analyzes receivables periodically to determine the adequacy of the allowancefor doubtful accounts. There is no current provision required for possible bad debts.
g. Inventory
Inventories consist of expendable supplies held for consumption. Inventories are valued atcost using the average cost method. Inventories are expensed when the resources areused.
h. Prepaid Expenses
Certain payments to vendors reflect costs applicable to future accounting periods and arerecorded as prepaid items. The prepaid items are included in Other Assets under CurrentAssets on the Statement of Net Position.
14
Valley Metro Rail, Inc. Notes to the Financial Statements (Continued) Fiscal Year Ended June 30, 2015
i. Capital Assets
Capital assets are defined as assets with an initial, individual cost of more than $5,000 andan estimated useful life greater than one year.
Capital assets are recorded at cost or estimated historical cost if purchased or constructed.Donated capital assets are recorded at the estimated fair value at the date of donation.
VMR capitalizes all costs incurred in connection with the construction of the CentralPhoenix/East Valley (CP/EV) 20-mile alignment. The costs for the non-federal agencyoperating, Rail Operations, and the initial planning costs of additional extensions arerecorded as annual operating expenses.
VMR is not the legal owner of any land. The land required for the LRT system is acquiredand owned by the Member Cities and is the subject of a long-term use agreement betweeneach City and VMR. Land, subject to the above agreement, is recorded on the books ofmember cities.
The costs included as construction in progress consist primarily of project administration,engineering, construction management, utilities relocation, facility construction, equipmentprocurement, and other costs related to construction. No depreciation is provided onconstruction in progress until construction is completed and the assets are placed in service.
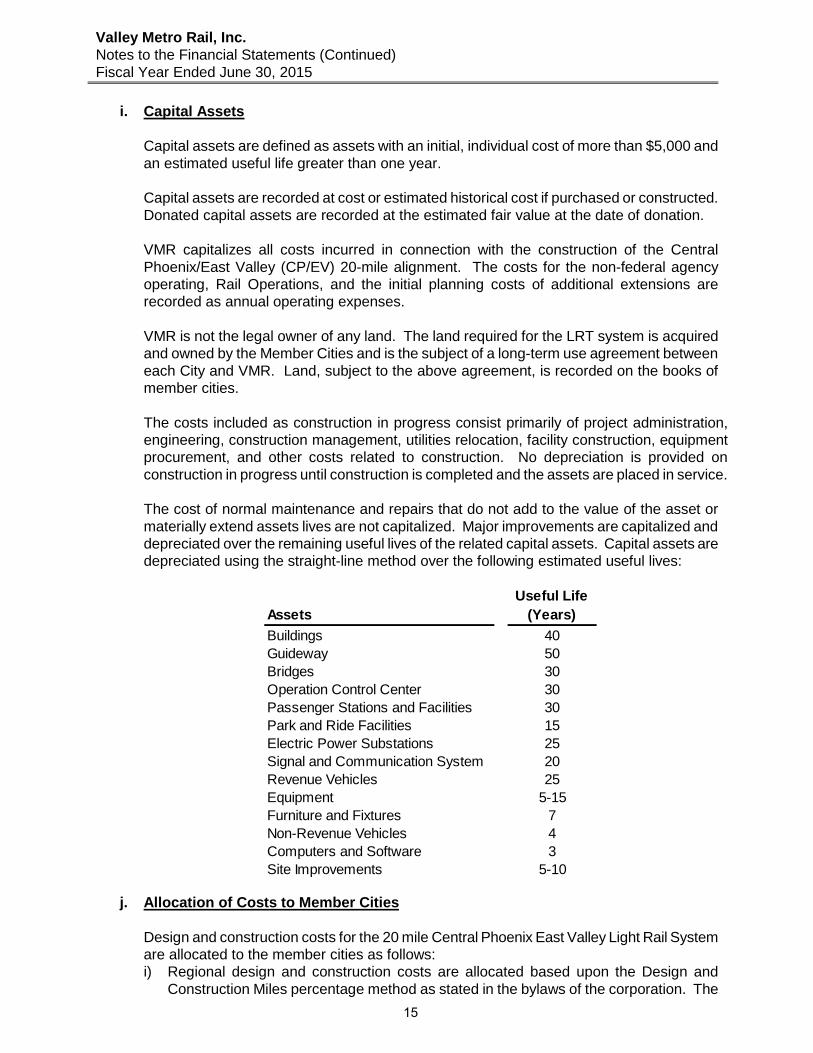
The cost of normal maintenance and repairs that do not add to the value of the asset ormaterially extend assets lives are not capitalized. Major improvements are capitalized anddepreciated over the remaining useful lives of the related capital assets. Capital assets aredepreciated using the straight-line method over the following estimated useful lives:
j. Allocation of Costs to Member Cities
Design and construction costs for the 20 mile Central Phoenix East Valley Light Rail Systemare allocated to the member cities as follows:i) Regional design and construction costs are allocated based upon the Design and
Construction Miles percentage method as stated in the bylaws of the corporation. The
AssetsUseful Life
(Years)
Buildings 40Guideway 50Bridges 30Operation Control Center 30Passenger Stations and Facilities 30Park and Ride Facilities 15Electric Power Substations 25Signal and Communication System 20Revenue Vehicles 25Equipment 5-15Furniture and Fixtures 7Non-Revenue Vehicles 4Computers and Software 3Site Improvements 5-10
15
Valley Metro Rail, Inc. Notes to the Financial Statements (Continued) Fiscal Year Ended June 30, 2015
components of the LRT that are currently classified as “regional” are light rail vehicles, the maintenance and storage facility, operations control center, bridge structures, and regional park-and-ride lots.
ii) Local design and construction costs are allocated to the member cities within whoseboundaries the LRT Component designed or constructed will be located. Design andconstruction costs that are not classified as regional are deemed to be local.
iii) Under the Design and Construction project agreements, the Member Cities provideproject funding to VMR as expenditures are incurred. As federal and regional fundingfor the capital project is received by VMR, the members receive cash distributions toreimburse the prior expenditures.
Design and construction costs for future LRT extensions are funded based upon Design and Construction Agreements which are executed in accordance with the adopted Transit Life Cycle Plan.
If a member city’s share of the LRT costs for a fiscal year is determined to be less than $50,000, such member city’s share of the LRT costs shall be $50,000. The purpose of the Minimum Cost is so that all member cities will contribute to payment of the overhead expense of the Corporation for matters such as the cost of meetings of the Board of Directors, administrative support to the Board of Directors, and support to member cities by the Rail Program Staff.
Passenger Operations Service Expenses are funded by the Member Cities according to the ratio of LRT route mileage currently in service. Member Cities also contribute amounts to fund local security costs related to fare inspection, on-board security and park-and-ride security within their respective jurisdictions.
k. Use of Estimates
The preparation of financial statements in conformity with accounting principles generallyaccepted in the United States of America necessarily requires management to makeestimates and assumptions that affect the reported amounts of assets and liabilities,disclosure of contingent assets and liabilities at the date of the financial statements and thereported amounts of revenue and expenses during the reporting financial period. Actualresults could differ from these estimates.
l. Net Position
VMR’s net position consists of unrestricted net position and net investment in capital assets.
2. Budgetary Basis of Accounting
An annual budget of revenues and expenses is prepared and adopted by the Board of Directorseach fiscal year. The legal level of budgetary control is the total annual appropriated budget.The annual budget is adopted on the accrual basis. Encumbrance accounting is not used andall appropriations lapse at year end. Depreciation expense is not included in the annual budget.Prior to final adoption, a proposed budget is presented to the Board of Directors for review andpublic comment is received. Final adoption of the budget must be on or before June 30 of eachyear.
16
Valley Metro Rail, Inc. Notes to the Financial Statements (Continued) Fiscal Year Ended June 30, 2015
During the fiscal year, the Board of Directors modified the original budget. A schedule of actual operating revenues and expenses versus original budget and final budget is presented as supplementary information. See Page 27.
3. Cash and Investments
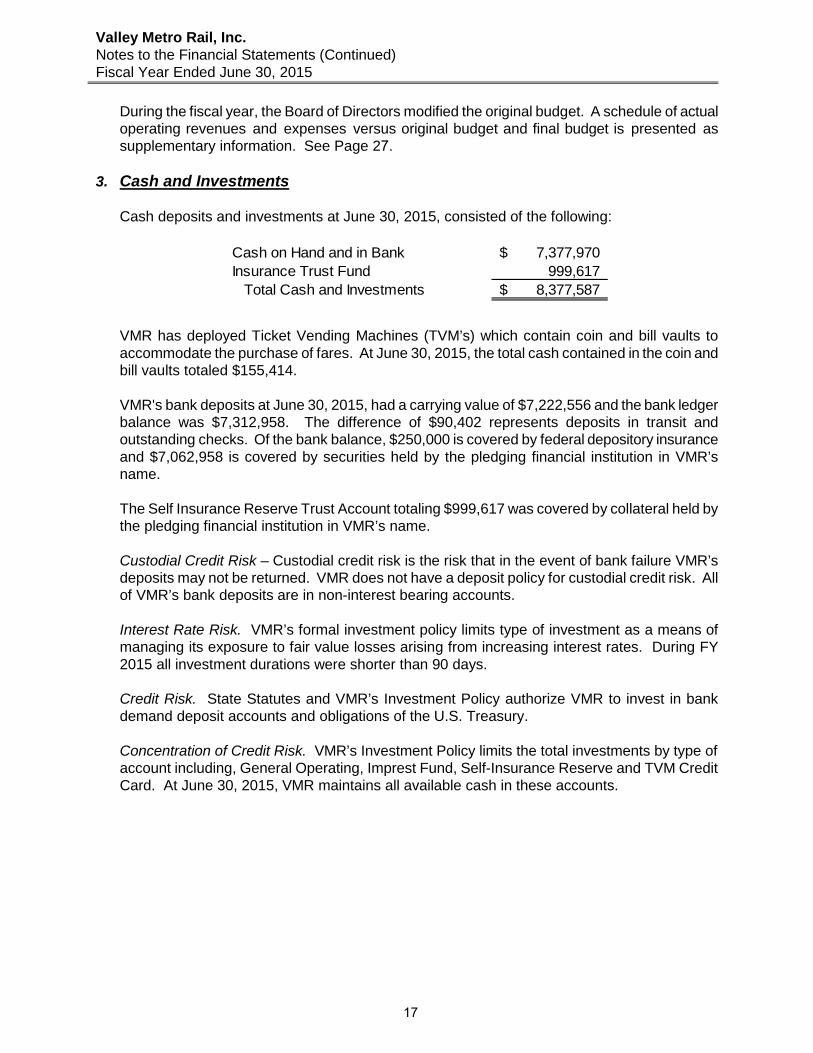
Cash deposits and investments at June 30, 2015, consisted of the following:
VMR has deployed Ticket Vending Machines (TVM’s) which contain coin and bill vaults to accommodate the purchase of fares. At June 30, 2015, the total cash contained in the coin and bill vaults totaled $155,414.
VMR's bank deposits at June 30, 2015, had a carrying value of $7,222,556 and the bank ledger balance was $7,312,958. The difference of $90,402 represents deposits in transit and outstanding checks. Of the bank balance, $250,000 is covered by federal depository insurance and $7,062,958 is covered by securities held by the pledging financial institution in VMR’s name.
The Self Insurance Reserve Trust Account totaling $999,617 was covered by collateral held by the pledging financial institution in VMR’s name.
Custodial Credit Risk – Custodial credit risk is the risk that in the event of bank failure VMR’s deposits may not be returned. VMR does not have a deposit policy for custodial credit risk. All of VMR’s bank deposits are in non-interest bearing accounts.
Interest Rate Risk. VMR’s formal investment policy limits type of investment as a means of managing its exposure to fair value losses arising from increasing interest rates. During FY 2015 all investment durations were shorter than 90 days.
Credit Risk. State Statutes and VMR’s Investment Policy authorize VMR to invest in bank demand deposit accounts and obligations of the U.S. Treasury.
Concentration of Credit Risk. VMR’s Investment Policy limits the total investments by type of account including, General Operating, Imprest Fund, Self-Insurance Reserve and TVM Credit Card. At June 30, 2015, VMR maintains all available cash in these accounts.
Cash on Hand and in Bank 7,377,970$ Insurance Trust Fund 999,617 Total Cash and Investments 8,377,587$
17
Valley Metro Rail, Inc. Notes to the Financial Statements (Continued) Fiscal Year Ended June 30, 2015
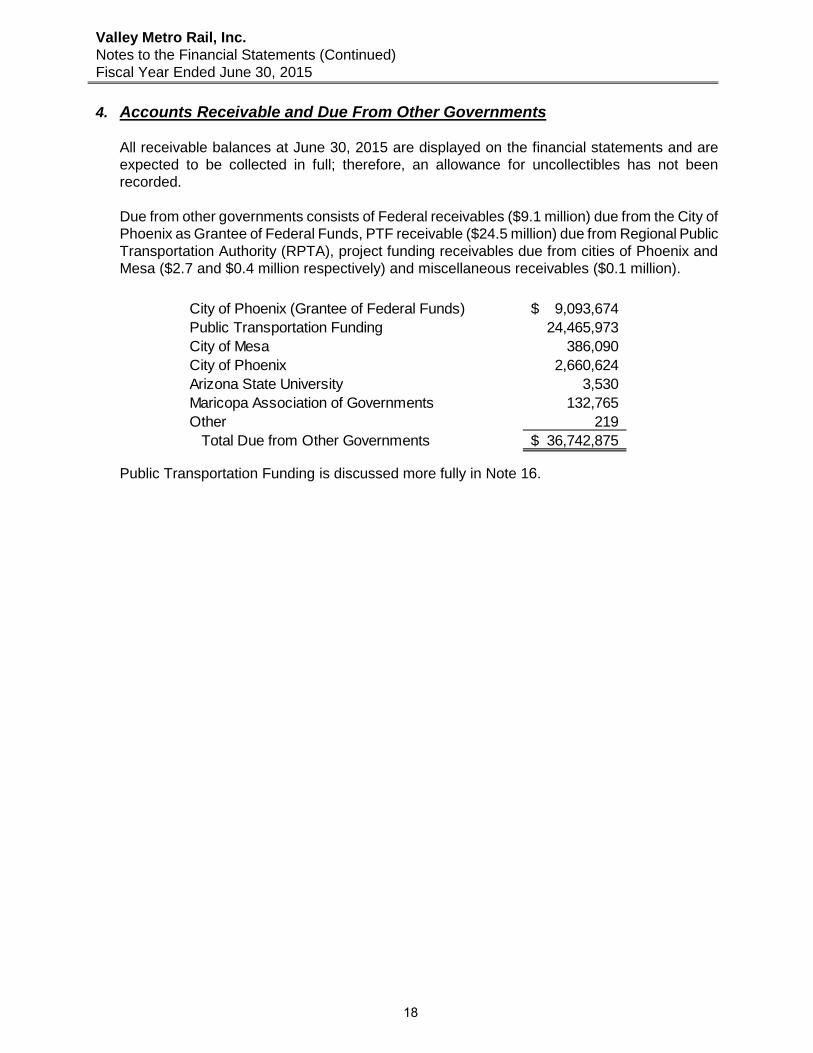
4. Accounts Receivable and Due From Other Governments
All receivable balances at June 30, 2015 are displayed on the financial statements and areexpected to be collected in full; therefore, an allowance for uncollectibles has not beenrecorded.
Due from other governments consists of Federal receivables ($9.1 million) due from the City ofPhoenix as Grantee of Federal Funds, PTF receivable ($24.5 million) due from Regional PublicTransportation Authority (RPTA), project funding receivables due from cities of Phoenix andMesa ($2.7 and $0.4 million respectively) and miscellaneous receivables ($0.1 million).
Public Transportation Funding is discussed more fully in Note 16.
City of Phoenix (Grantee of Federal Funds) 9,093,674$ Public Transportation Funding 24,465,973 City of Mesa 386,090 City of Phoenix 2,660,624 Arizona State University 3,530 Maricopa Association of Governments 132,765 Other 219
Total Due from Other Governments 36,742,875$
18
Valley Metro Rail, Inc. Notes to the Financial Statements (Continued) Fiscal Year Ended June 30, 2015
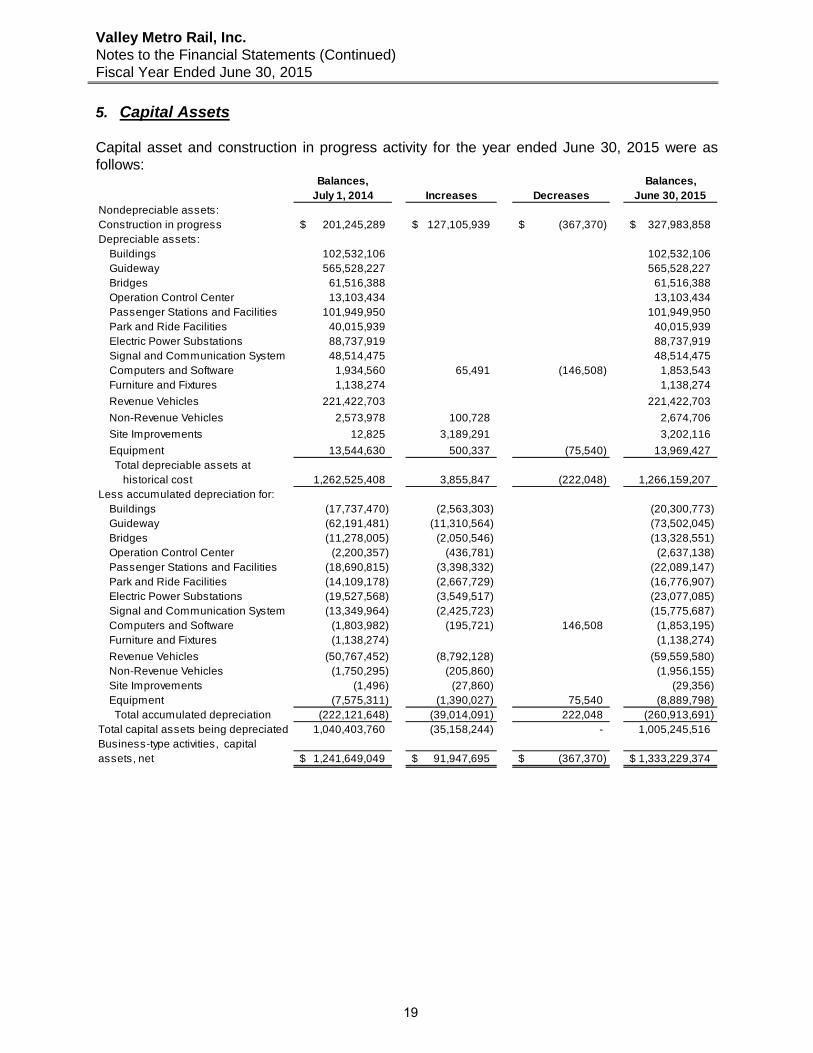
5. Capital Assets
Capital asset and construction in progress activity for the year ended June 30, 2015 were as follows:
Balances, Balances,July 1, 2014 Increases Decreases June 30, 2015
Nondepreciable assets:Construction in progress 201,245,289$ 127,105,939$ (367,370)$ 327,983,858$ Depreciable assets:
Buildings 102,532,106 102,532,106 Guideway 565,528,227 565,528,227 Bridges 61,516,388 61,516,388 Operation Control Center 13,103,434 13,103,434 Passenger Stations and Facilities 101,949,950 101,949,950 Park and Ride Facilities 40,015,939 40,015,939 Electric Power Substations 88,737,919 88,737,919 Signal and Communication System 48,514,475 48,514,475 Computers and Software 1,934,560 65,491 (146,508) 1,853,543 Furniture and Fixtures 1,138,274 1,138,274
Revenue Vehicles 221,422,703 221,422,703
Non-Revenue Vehicles 2,573,978 100,728 2,674,706
Site Improvements 12,825 3,189,291 3,202,116
Equipment 13,544,630 500,337 (75,540) 13,969,427 Total depreciable assets at historical cost 1,262,525,408 3,855,847 (222,048) 1,266,159,207 Less accumulated depreciation for:
Buildings (17,737,470) (2,563,303) (20,300,773) Guideway (62,191,481) (11,310,564) (73,502,045) Bridges (11,278,005) (2,050,546) (13,328,551) Operation Control Center (2,200,357) (436,781) (2,637,138) Passenger Stations and Facilities (18,690,815) (3,398,332) (22,089,147) Park and Ride Facilities (14,109,178) (2,667,729) (16,776,907) Electric Power Substations (19,527,568) (3,549,517) (23,077,085) Signal and Communication System (13,349,964) (2,425,723) (15,775,687) Computers and Software (1,803,982) (195,721) 146,508 (1,853,195) Furniture and Fixtures (1,138,274) (1,138,274)
Revenue Vehicles (50,767,452) (8,792,128) (59,559,580) Non-Revenue Vehicles (1,750,295) (205,860) (1,956,155) Site Improvements (1,496) (27,860) (29,356) Equipment (7,575,311) (1,390,027) 75,540 (8,889,798)
Total accumulated depreciation (222,121,648) (39,014,091) 222,048 (260,913,691) Total capital assets being depreciated 1,040,403,760 (35,158,244) - 1,005,245,516 Business-type activities, capitalassets, net 1,241,649,049$ 91,947,695$ (367,370)$ 1,333,229,374$
19

Valley Metro Rail, Inc. Notes to the Financial Statements (Continued) Fiscal Year Ended June 30, 2015
6. Member Cities’ Deposits
The member cities advance monies to cover the cost of operations plus the federal and localshare of project costs. In addition, unpaid expenses to be funded by member contributions areaccrued for each city. A summary of member cities’ deposits at June 30, 2015 follows:
7. Operating Leases
VMR leases office space and small office equipment under various operating lease agreements.Total expenditures for these leases were $1,444,605 for the fiscal year ended June 30, 2015.Future minimum lease payments under non-cancelable operating leases are as follows:
Beginning on July 1, 2014, VMR entered into a new contract to lease office space for a 12 year term which included 57,007 square feet of building space. Simultaneously, a sublease between VMR and RPTA took effect for 26,324 square feet. The 12 year term contract total is $16,266,090 for VMR. The sublease to RPTA is $7,502,340.
8. Northwest Extension Advance Funding Obligation
VMR signed the Project Funding Agreement (Northwest Light Rail Extension) between The City of Phoenix and Valley Metro Rail, Inc. on December 20, 2012. The agreement provides $60.0million during fiscal years 2013 and 2014 to fund the expenses of the Northwest Light RailExtension capital project. These funds will be repaid to City of Phoenix with PublicTransportation Funds on June 30, 2017. During the fiscal years 2013 and 2014, the City ofPhoenix advanced $37,914,519 and $22,085,481, respectively, totaling $60,000,000 by the endof fiscal year 2014 to cover the project expenses.
City of Chandler 703,515$ City of Glendale 113,443 City of Mesa 243,156 City of Peoria 37,600 City of Phoenix 5,912,454 City of Tempe 1,869,165
8,879,333$
2016 1,439,392$ 2017 1,393,5632018 1,374,6372019 1,355,5082020 1,355,5082021-2025 6,777,5382026 1,355,508
15,051,654$
Year Ending June 30, 2015
20
Valley Metro Rail, Inc. Notes to the Financial Statements (Continued) Fiscal Year Ended June 30, 2015
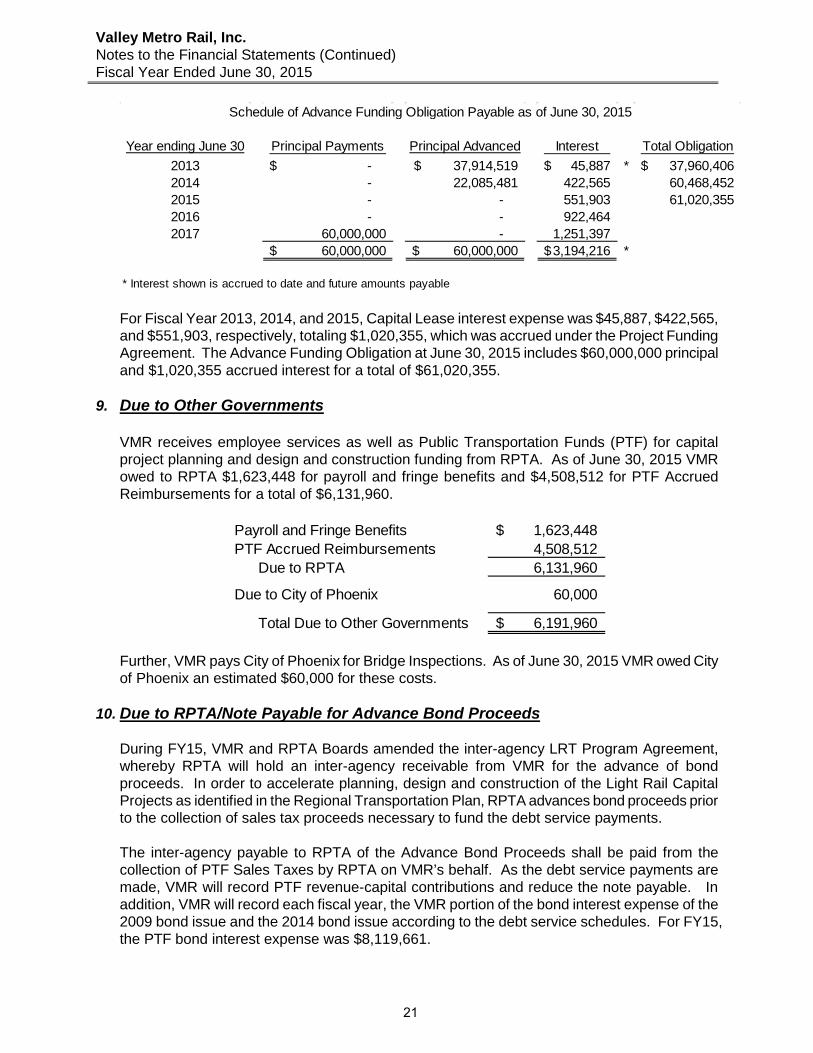
For Fiscal Year 2013, 2014, and 2015, Capital Lease interest expense was $45,887, $422,565, and $551,903, respectively, totaling $1,020,355, which was accrued under the Project Funding Agreement. The Advance Funding Obligation at June 30, 2015 includes $60,000,000 principal and $1,020,355 accrued interest for a total of $61,020,355.
9. Due to Other Governments
VMR receives employee services as well as Public Transportation Funds (PTF) for capitalproject planning and design and construction funding from RPTA. As of June 30, 2015 VMRowed to RPTA $1,623,448 for payroll and fringe benefits and $4,508,512 for PTF AccruedReimbursements for a total of $6,131,960.
Further, VMR pays City of Phoenix for Bridge Inspections. As of June 30, 2015 VMR owed City of Phoenix an estimated $60,000 for these costs.
10. Due to RPTA/Note Payable for Advance Bond Proceeds
During FY15, VMR and RPTA Boards amended the inter-agency LRT Program Agreement,whereby RPTA will hold an inter-agency receivable from VMR for the advance of bondproceeds. In order to accelerate planning, design and construction of the Light Rail CapitalProjects as identified in the Regional Transportation Plan, RPTA advances bond proceeds priorto the collection of sales tax proceeds necessary to fund the debt service payments.
The inter-agency payable to RPTA of the Advance Bond Proceeds shall be paid from the collection of PTF Sales Taxes by RPTA on VMR’s behalf. As the debt service payments are made, VMR will record PTF revenue-capital contributions and reduce the note payable. In addition, VMR will record each fiscal year, the VMR portion of the bond interest expense of the 2009 bond issue and the 2014 bond issue according to the debt service schedules. For FY15, the PTF bond interest expense was $8,119,661.
Year ending June 30 Principal Payments Principal Advanced Interest Total Obligation
2013 -$ 37,914,519$ 45,887$ * 37,960,406$ 2014 - 22,085,481 422,565 60,468,452 2015 - - 551,903 61,020,355 2016 - - 922,464 2017 60,000,000 - 1,251,397
60,000,000$ 60,000,000$ 3,194,216$ *
* Interest shown is accrued to date and future amounts payable
Schedule of Advance Funding Obligation Payable as of June 30, 2015
Payroll and Fringe Benefits 1,623,448$ PTF Accrued Reimbursements 4,508,512
Due to RPTA 6,131,960
Due to City of Phoenix 60,000
Total Due to Other Governments 6,191,960$
21
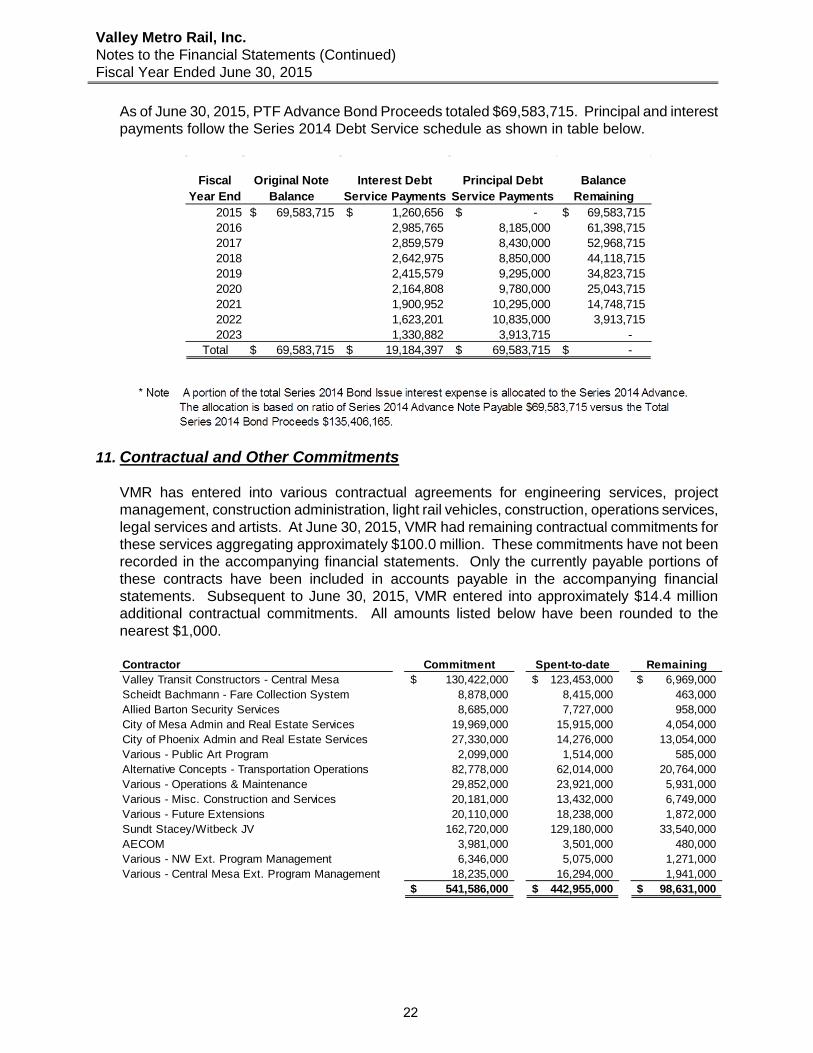
Valley Metro Rail, Inc. Notes to the Financial Statements (Continued) Fiscal Year Ended June 30, 2015
As of June 30, 2015, PTF Advance Bond Proceeds totaled $69,583,715. Principal and interest payments follow the Series 2014 Debt Service schedule as shown in table below.
11. Contractual and Other Commitments
VMR has entered into various contractual agreements for engineering services, projectmanagement, construction administration, light rail vehicles, construction, operations services,legal services and artists. At June 30, 2015, VMR had remaining contractual commitments forthese services aggregating approximately $100.0 million. These commitments have not beenrecorded in the accompanying financial statements. Only the currently payable portions ofthese contracts have been included in accounts payable in the accompanying financialstatements. Subsequent to June 30, 2015, VMR entered into approximately $14.4 millionadditional contractual commitments. All amounts listed below have been rounded to thenearest $1,000.
Fiscal Year End
Original Note Balance
Interest Debt Service Payments
Principal Debt Service Payments
Balance Remaining
2015 69,583,715$ 1,260,656$ -$ 69,583,715$ 2016 2,985,765 8,185,000 61,398,715 2017 2,859,579 8,430,000 52,968,715 2018 2,642,975 8,850,000 44,118,715 2019 2,415,579 9,295,000 34,823,715 2020 2,164,808 9,780,000 25,043,715 2021 1,900,952 10,295,000 14,748,715 2022 1,623,201 10,835,000 3,913,715 2023 1,330,882 3,913,715 -
Total 69,583,715$ 19,184,397$ 69,583,715$ -$
Contractor Commitment Spent-to-date RemainingValley Transit Constructors - Central Mesa 130,422,000$ 123,453,000$ 6,969,000$ Scheidt Bachmann - Fare Collection System 8,878,000 8,415,000 463,000 Allied Barton Security Services 8,685,000 7,727,000 958,000 City of Mesa Admin and Real Estate Services 19,969,000 15,915,000 4,054,000 City of Phoenix Admin and Real Estate Services 27,330,000 14,276,000 13,054,000 Various - Public Art Program 2,099,000 1,514,000 585,000Alternative Concepts - Transportation Operations 82,778,000 62,014,000 20,764,000 Various - Operations & Maintenance 29,852,000 23,921,000 5,931,000 Various - Misc. Construction and Services 20,181,000 13,432,000 6,749,000 Various - Future Extensions 20,110,000 18,238,000 1,872,000 Sundt Stacey/Witbeck JV 162,720,000 129,180,000 33,540,000 AECOM 3,981,000 3,501,000 480,000 Various - NW Ext. Program Management 6,346,000 5,075,000 1,271,000 Various - Central Mesa Ext. Program Management 18,235,000 16,294,000 1,941,000
541,586,000$ 442,955,000$ 98,631,000$
22
Valley Metro Rail, Inc. Notes to the Financial Statements (Continued) Fiscal Year Ended June 30, 2015
12. Risk Management
VMR is exposed to various risks of loss related to torts; theft of, damage to, and destruction ofassets; errors and omissions; injuries to contracted labor; and natural disasters. These risksare covered by commercial insurance purchased from independent third parties. VMRpurchases insurance coverage for property, general liability, excess liability, automobile liability,umbrella liability, public entity employment practices liability, public entity management liability,boiler and machinery, crime, inland marine, owner’s protective professional indemnity,environmental site protection, contractor’s environmental protection and excess liability. Inaddition, the RPTA purchases workers’ compensation, employee life insurance, health anddental insurance coverage for all LRT full-time employees. Settled claims for these risks havenever exceeded commercial insurance limits. See schedule of insurance on page 48 and Note15-Related Party Transactions.
VMR has received notice of general liability claims related to its operations. VMR’s commercialinsurance policies provide coverage against losses arising from the claims subject to policydeductible amounts. Such claims are evaluated and specific reserves are established to coverVMR’s contingent risk of loss pending settlement with the parties involved. At June 30, 2015the Reserve for General Liability Claims totaled $753,764.
13. Contingencies
As a subrecipient of federal grant monies, amounts passed through or receivable from otheragencies are subject to audit and adjustment by grantor agencies. Any disallowed claims,including amounts already collected, may constitute a liability. The amount, if any, ofexpenditures which may be disallowed by the grantor cannot be determined at this timealthough VMR expects such amounts, if any, to be immaterial.
14. Lawsuits
VMR is a party to a number of various types of lawsuits, many of which normally occur in governmental operations. The ultimate outcome of the actions is not determinable, however, VMR management believes that the outcome of these proceedings, either individually or in the aggregate, will not have a materially adverse effect on the accompanying financial statements.
15. Related Party Transactions
All of the five member cities of VMR’s Board of Directors are also member cities of the sixteen-member RPTA Board of Directors. The Board members of the cities of Glendale, Phoenix, andTempe represent their cities on both Boards. VMR has entered into contracts with the RPTA forcertain administrative functions, including personnel, administration, financial and accountingservices, purchasing, and computer support services. All VMR staff is hired and employed byRPTA but works solely under the direction of the VMR and its Board of Directors, through acontractual arrangement with RPTA. All payroll related liabilities are obligations of VMR due toRPTA. For the period July 1, 2014 through June 30, 2015, VMR incurred costs of $16,061,804for services provided by RPTA.
In September 2010, the VMR Board authorized the Chief Executive Officer (CEO) to enter into asublease with the Regional Public Transportation Authority (RPTA) for a portion of the officespace currently leased and occupied by VMR. The contract commenced in December 2010and would end in June 2016. Office space lease costs were paid by VMR monthly to thelandlord and then prorated and charged to RPTA based on square footage used by RPTA. In
23
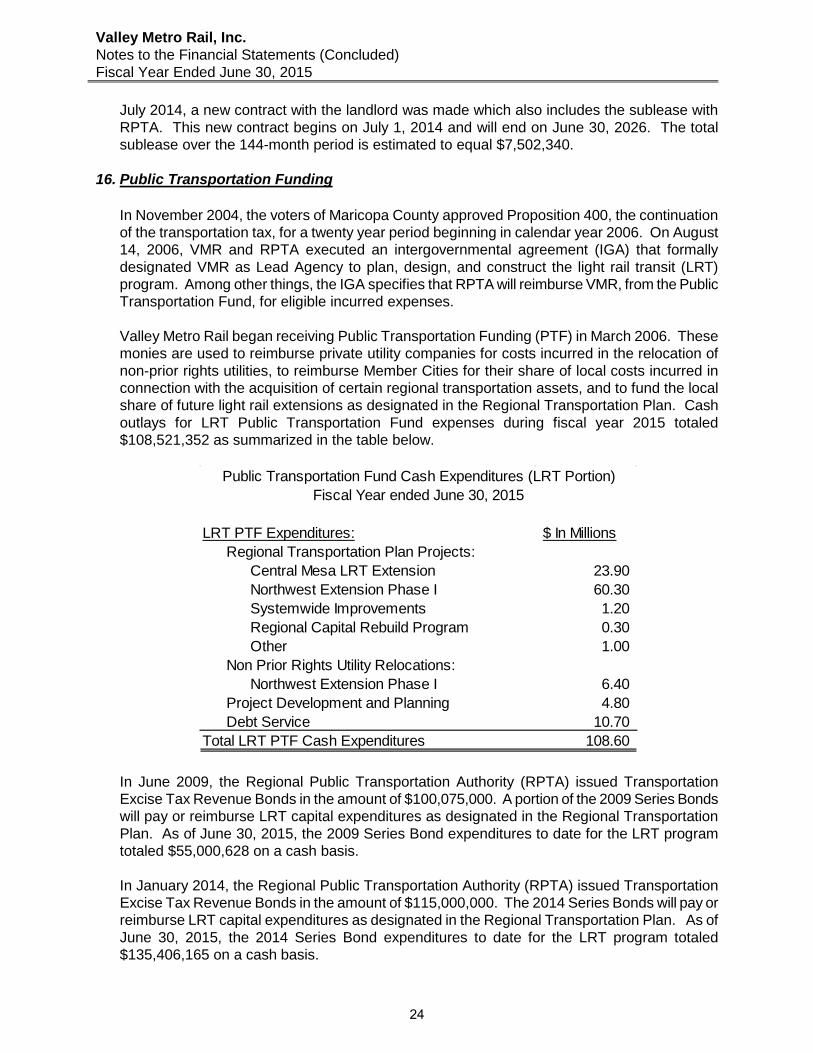
Valley Metro Rail, Inc. Notes to the Financial Statements (Concluded) Fiscal Year Ended June 30, 2015
July 2014, a new contract with the landlord was made which also includes the sublease with RPTA. This new contract begins on July 1, 2014 and will end on June 30, 2026. The total sublease over the 144-month period is estimated to equal $7,502,340.
16. Public Transportation Funding
In November 2004, the voters of Maricopa County approved Proposition 400, the continuationof the transportation tax, for a twenty year period beginning in calendar year 2006. On August14, 2006, VMR and RPTA executed an intergovernmental agreement (IGA) that formallydesignated VMR as Lead Agency to plan, design, and construct the light rail transit (LRT)program. Among other things, the IGA specifies that RPTA will reimburse VMR, from the PublicTransportation Fund, for eligible incurred expenses.
Valley Metro Rail began receiving Public Transportation Funding (PTF) in March 2006. Thesemonies are used to reimburse private utility companies for costs incurred in the relocation ofnon-prior rights utilities, to reimburse Member Cities for their share of local costs incurred inconnection with the acquisition of certain regional transportation assets, and to fund the localshare of future light rail extensions as designated in the Regional Transportation Plan. Cashoutlays for LRT Public Transportation Fund expenses during fiscal year 2015 totaled$108,521,352 as summarized in the table below.
In June 2009, the Regional Public Transportation Authority (RPTA) issued Transportation Excise Tax Revenue Bonds in the amount of $100,075,000. A portion of the 2009 Series Bonds will pay or reimburse LRT capital expenditures as designated in the Regional Transportation Plan. As of June 30, 2015, the 2009 Series Bond expenditures to date for the LRT program totaled $55,000,628 on a cash basis.
In January 2014, the Regional Public Transportation Authority (RPTA) issued Transportation Excise Tax Revenue Bonds in the amount of $115,000,000. The 2014 Series Bonds will pay or reimburse LRT capital expenditures as designated in the Regional Transportation Plan. As of June 30, 2015, the 2014 Series Bond expenditures to date for the LRT program totaled $135,406,165 on a cash basis.
LRT PTF Expenditures: $ In MillionsRegional Transportation Plan Projects:
Central Mesa LRT Extension 23.90 Northwest Extension Phase I 60.30 Systemwide Improvements 1.20 Regional Capital Rebuild Program 0.30 Other 1.00
Non Prior Rights Utility Relocations:Northwest Extension Phase I 6.40
Project Development and Planning 4.80 Debt Service 10.70
Total LRT PTF Cash Expenditures 108.60
Public Transportation Fund Cash Expenditures (LRT Portion)Fiscal Year ended June 30, 2015
24
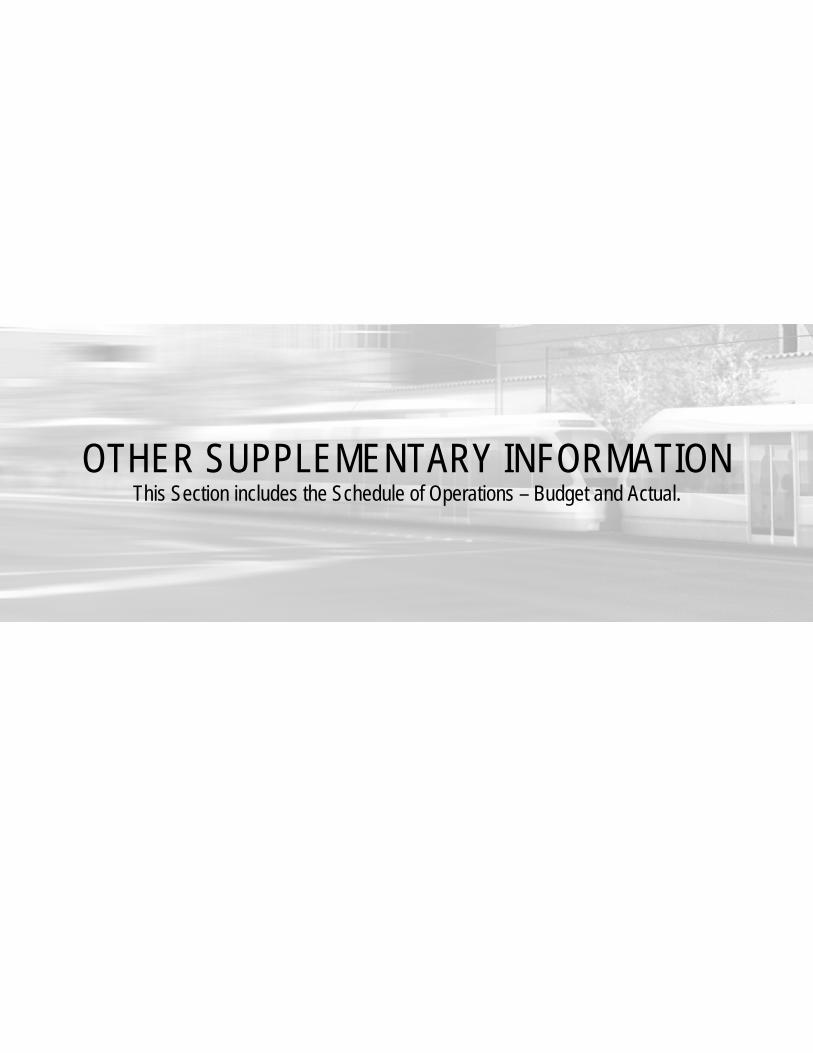
OTHER SUPPLEMENTARY INFORMATION This Section includes the Schedule of Operations – Budget and Actual.
Grand Opening celebration Central Mesa Extension August 22, 2015.
Construction continues on the Northwest Phase I Light Rail Extension.
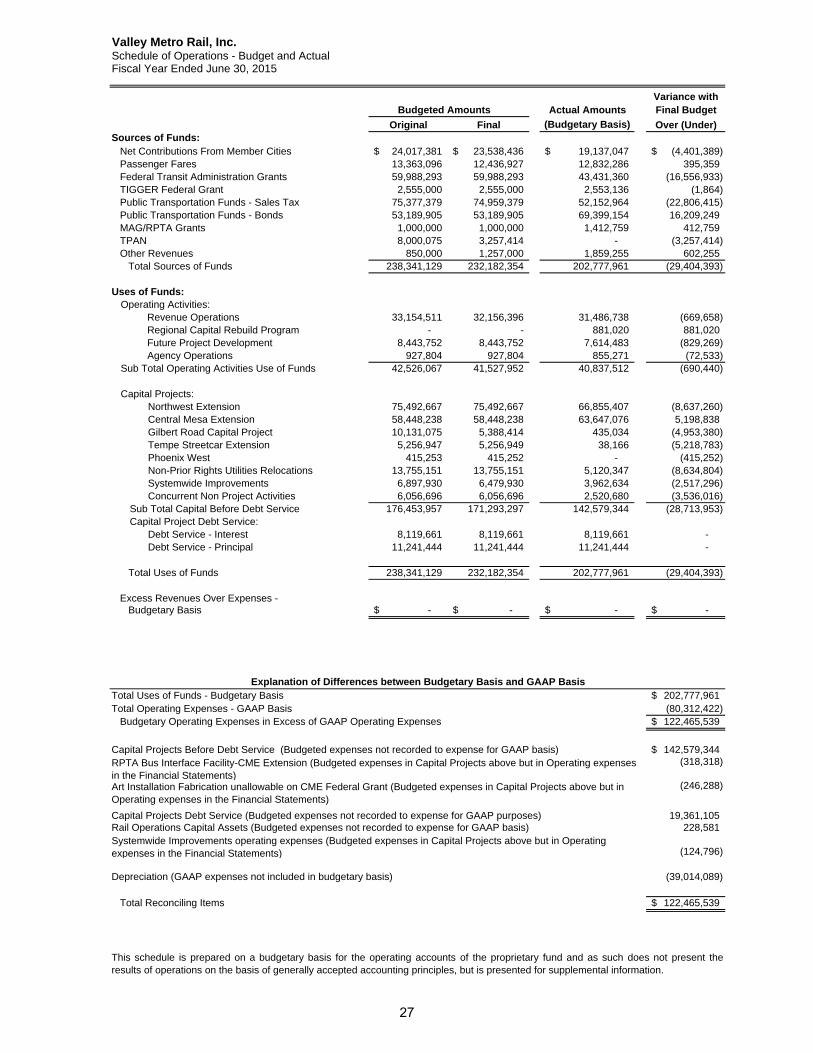
Valley Metro Rail, Inc.Schedule of Operations - Budget and ActualFiscal Year Ended June 30, 2015
Variance withBudgeted Amounts Actual Amounts Final Budget
Original Final (Budgetary Basis) Over (Under)Sources of Funds: Net Contributions From Member Cities 24,017,381$ 23,538,436$ 19,137,047$ (4,401,389)$ Passenger Fares 13,363,096 12,436,927 12,832,286 395,359 Federal Transit Administration Grants 59,988,293 59,988,293 43,431,360 (16,556,933) TIGGER Federal Grant 2,555,000 2,555,000 2,553,136 (1,864) Public Transportation Funds - Sales Tax 75,377,379 74,959,379 52,152,964 (22,806,415) Public Transportation Funds - Bonds 53,189,905 53,189,905 69,399,154 16,209,249 MAG/RPTA Grants 1,000,000 1,000,000 1,412,759 412,759 TPAN 8,000,075 3,257,414 - (3,257,414) Other Revenues 850,000 1,257,000 1,859,255 602,255 Total Sources of Funds 238,341,129 232,182,354 202,777,961 (29,404,393)
Uses of Funds:Operating Activities:
Revenue Operations 33,154,511 32,156,396 31,486,738 (669,658) Regional Capital Rebuild Program - - 881,020 881,020 Future Project Development 8,443,752 8,443,752 7,614,483 (829,269) Agency Operations 927,804 927,804 855,271 (72,533)
Sub Total Operating Activities Use of Funds 42,526,067 41,527,952 40,837,512 (690,440)
Capital Projects:Northwest Extension 75,492,667 75,492,667 66,855,407 (8,637,260)Central Mesa Extension 58,448,238 58,448,238 63,647,076 5,198,838Gilbert Road Capital Project 10,131,075 5,388,414 435,034 (4,953,380)Tempe Streetcar Extension 5,256,947 5,256,949 38,166 (5,218,783)Phoenix West 415,253 415,252 - (415,252)Non-Prior Rights Utilities Relocations 13,755,151 13,755,151 5,120,347 (8,634,804)Systemwide Improvements 6,897,930 6,479,930 3,962,634 (2,517,296)Concurrent Non Project Activities 6,056,696 6,056,696 2,520,680 (3,536,016)
Sub Total Capital Before Debt Service 176,453,957 171,293,297 142,579,344 (28,713,953)Capital Project Debt Service:
Debt Service - Interest 8,119,661 8,119,661 8,119,661 -Debt Service - Principal 11,241,444 11,241,444 11,241,444 -
Total Uses of Funds 238,341,129 232,182,354 202,777,961 (29,404,393)
Excess Revenues Over Expenses - Budgetary Basis -$ -$ -$ -$
Total Uses of Funds - Budgetary Basis 202,777,961$ (80,312,422)
Budgetary Operating Expenses in Excess of GAAP Operating Expenses 122,465,539$
Capital Projects Before Debt Service (Budgeted expenses not recorded to expense for GAAP basis) 142,579,344$ (318,318)
(246,288)
Capital Projects Debt Service (Budgeted expenses not recorded to expense for GAAP purposes) 19,361,105Rail Operations Capital Assets (Budgeted expenses not recorded to expense for GAAP basis) 228,581
(124,796)
Depreciation (GAAP expenses not included in budgetary basis) (39,014,089)
Total Reconciling Items 122,465,539$
This schedule is prepared on a budgetary basis for the operating accounts of the proprietary fund and as such does not present theresults of operations on the basis of generally accepted accounting principles, but is presented for supplemental information.
Explanation of Differences between Budgetary Basis and GAAP Basis
Total Operating Expenses - GAAP Basis
RPTA Bus Interface Facility-CME Extension (Budgeted expenses in Capital Projects above but in Operating expenses in the Financial Statements)Art Installation Fabrication unallowable on CME Federal Grant (Budgeted expenses in Capital Projects above but in Operating expenses in the Financial Statements)
Systemwide Improvements operating expenses (Budgeted expenses in Capital Projects above but in Operating expenses in the Financial Statements)
27
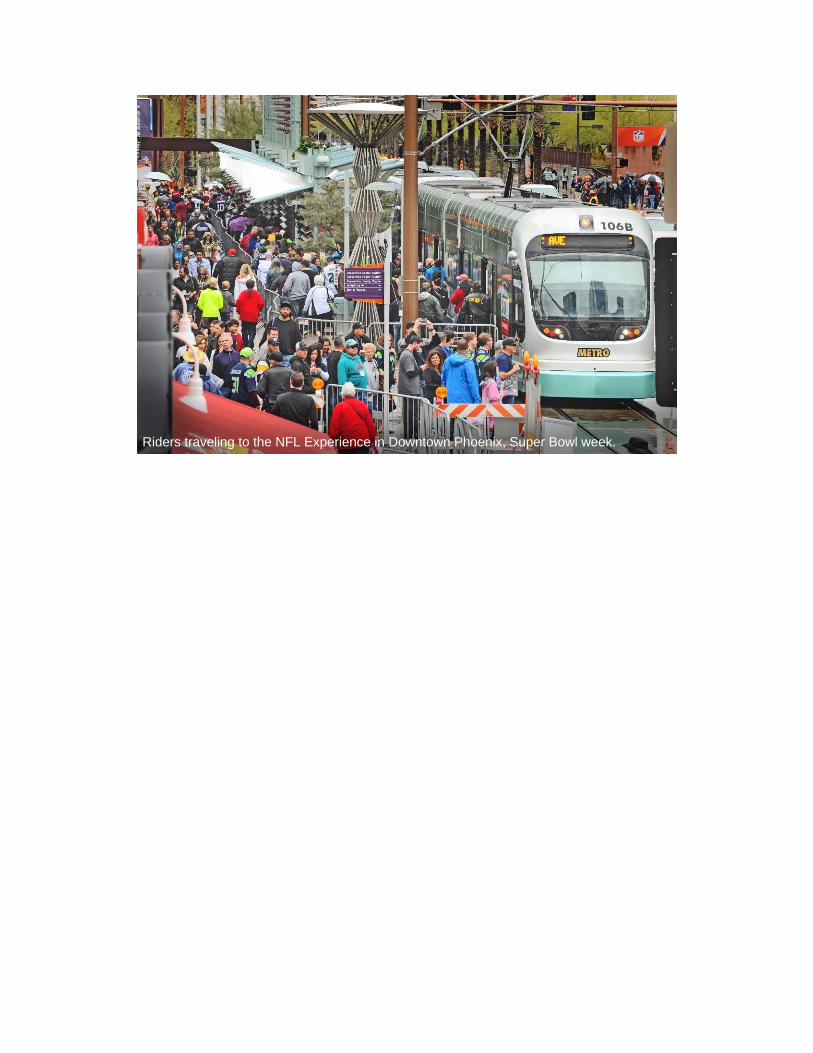
Riders traveling to the NFL Experience in Downtown Phoenix, Super Bowl week.
STATISTICAL SECTION The Statistical Section includes selected financial and demographic information regarding Valley Metro
Rail including financial trends, demographic and economic information, and operating information.
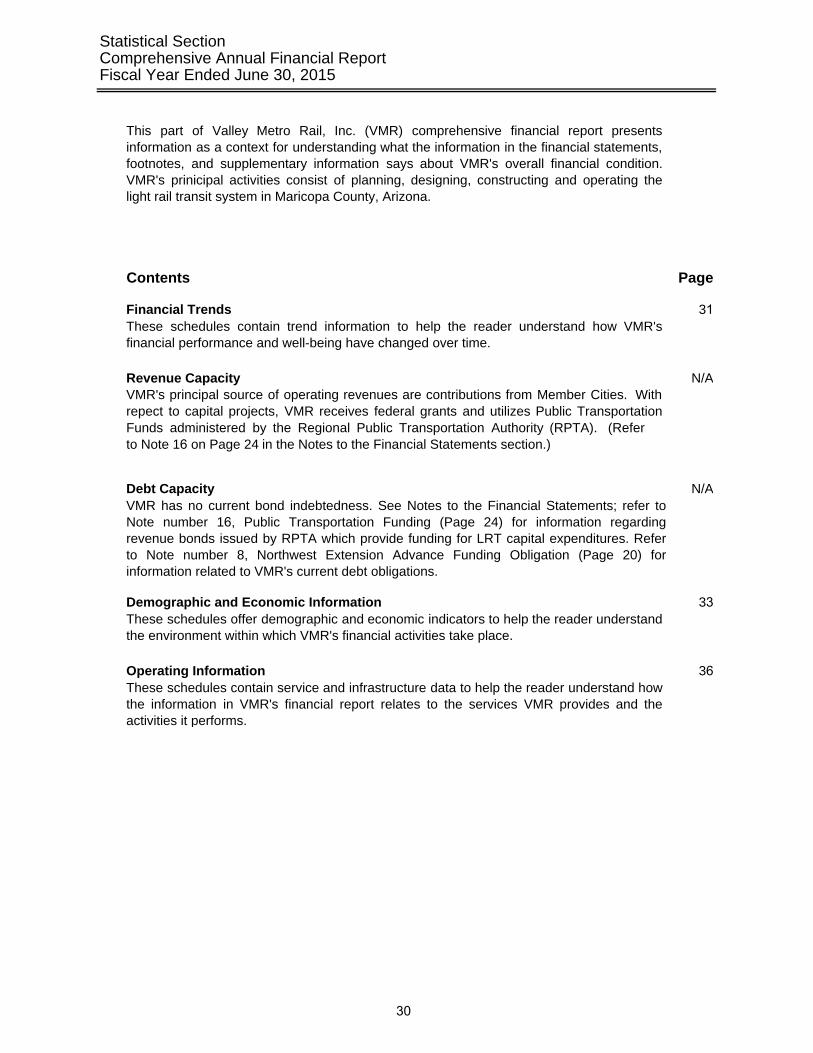
Statistical SectionComprehensive Annual Financial ReportFiscal Year Ended June 30, 2015
This part of Valley Metro Rail, Inc. (VMR) comprehensive financial report presentsinformation as a context for understanding what the information in the financial statements,footnotes, and supplementary information says about VMR's overall financial condition.VMR's prinicipal activities consist of planning, designing, constructing and operating thelight rail transit system in Maricopa County, Arizona.
Contents Page
Financial Trends 31These schedules contain trend information to help the reader understand how VMR'sfinancial performance and well-being have changed over time.
N/ARevenue CapacityVMR's principal source of operating revenues are contributions from Member Cities. With repect to capital projects, VMR receives federal grants and utilizes Public Transportation Funds administered by the Regional Public Transportation Authority (RPTA). (Refer to Note 16 on Page 24 in the Notes to the Financial Statements section.)
Debt Capacity N/AVMR has no current bond indebtedness. See Notes to the Financial Statements; refer to Note number 16, Public Transportation Funding (Page 24) for information regarding revenue bonds issued by RPTA which provide funding for LRT capital expenditures. Refer to Note number 8, Northwest Extension Advance Funding Obligation (Page 20) for information related to VMR's current debt obligations.
Demographic and Economic Information 33These schedules offer demographic and economic indicators to help the reader understandthe environment within which VMR's financial activities take place.
Operating Information 36These schedules contain service and infrastructure data to help the reader understand howthe information in VMR's financial report relates to the services VMR provides and theactivities it performs.
30
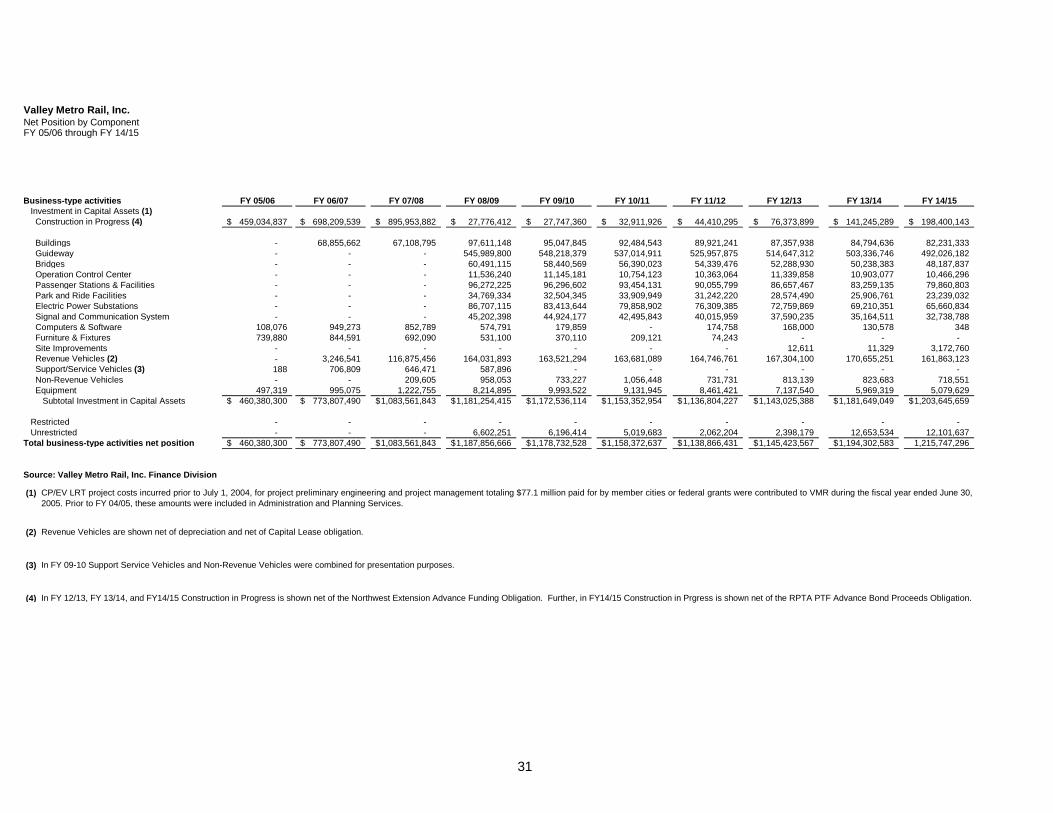
31
Business-type activities FY 05/06 FY 06/07 FY 07/08 FY 08/09 FY 09/10 FY 10/11 FY 11/12 FY 12/13 FY 13/14 FY 14/15 Investment in Capital Assets (1) Construction in Progress (4) 459,034,837$ 698,209,539$ 895,953,882$ 27,776,412$ 27,747,360$ 32,911,926$ 44,410,295$ 76,373,899$ 141,245,289$ 198,400,143$
Buildings - 68,855,662 67,108,795 97,611,148 95,047,845 92,484,543 89,921,241 87,357,938 84,794,636 82,231,333 Guideway - - - 545,989,800 548,218,379 537,014,911 525,957,875 514,647,312 503,336,746 492,026,182 Bridges - - - 60,491,115 58,440,569 56,390,023 54,339,476 52,288,930 50,238,383 48,187,837 Operation Control Center - - - 11,536,240 11,145,181 10,754,123 10,363,064 11,339,858 10,903,077 10,466,296 Passenger Stations & Facilities - - - 96,272,225 96,296,602 93,454,131 90,055,799 86,657,467 83,259,135 79,860,803 Park and Ride Facilities - - - 34,769,334 32,504,345 33,909,949 31,242,220 28,574,490 25,906,761 23,239,032 Electric Power Substations - - - 86,707,115 83,413,644 79,858,902 76,309,385 72,759,869 69,210,351 65,660,834 Signal and Communication System - - - 45,202,398 44,924,177 42,495,843 40,015,959 37,590,235 35,164,511 32,738,788 Computers & Software 108,076 949,273 852,789 574,791 179,859 - 174,758 168,000 130,578 348 Furniture & Fixtures 739,880 844,591 692,090 531,100 370,110 209,121 74,243 - - - Site Improvements - - - - - - - 12,611 11,329 3,172,760 Revenue Vehicles (2) - 3,246,541 116,875,456 164,031,893 163,521,294 163,681,089 164,746,761 167,304,100 170,655,251 161,863,123 Support/Service Vehicles (3) 188 706,809 646,471 587,896 - - - - - - Non-Revenue Vehicles - - 209,605 958,053 733,227 1,056,448 731,731 813,139 823,683 718,551 Equipment 497,319 995,075 1,222,755 8,214,895 9,993,522 9,131,945 8,461,421 7,137,540 5,969,319 5,079,629 Subtotal Investment in Capital Assets 460,380,300$ 773,807,490$ 1,083,561,843$ 1,181,254,415$ 1,172,536,114$ 1,153,352,954$ 1,136,804,227$ 1,143,025,388$ 1,181,649,049$ 1,203,645,659$
Restricted - - - - - - - - - - Unrestricted - - - 6,602,251 6,196,414 5,019,683 2,062,204 2,398,179 12,653,534 12,101,637 Total business-type activities net position 460,380,300$ 773,807,490$ 1,083,561,843$ 1,187,856,666$ 1,178,732,528$ 1,158,372,637$ 1,138,866,431$ 1,145,423,567$ 1,194,302,583$ 1,215,747,296
Source: Valley Metro Rail, Inc. Finance Division
(1)
(2)
(3)
(4)
In FY 09-10 Support Service Vehicles and Non-Revenue Vehicles were combined for presentation purposes.
In FY 12/13, FY 13/14, and FY14/15 Construction in Progress is shown net of the Northwest Extension Advance Funding Obligation. Further, in FY14/15 Construction in Prgress is shown net of the RPTA PTF Advance Bond Proceeds Obligation.
Valley Metro Rail, Inc.Net Position by ComponentFY 05/06 through FY 14/15
CP/EV LRT project costs incurred prior to July 1, 2004, for project preliminary engineering and project management totaling $77.1 million paid for by member cities or federal grants were contributed to VMR during the fiscal year ended June 30,2005. Prior to FY 04/05, these amounts were included in Administration and Planning Services.
Revenue Vehicles are shown net of depreciation and net of Capital Lease obligation.
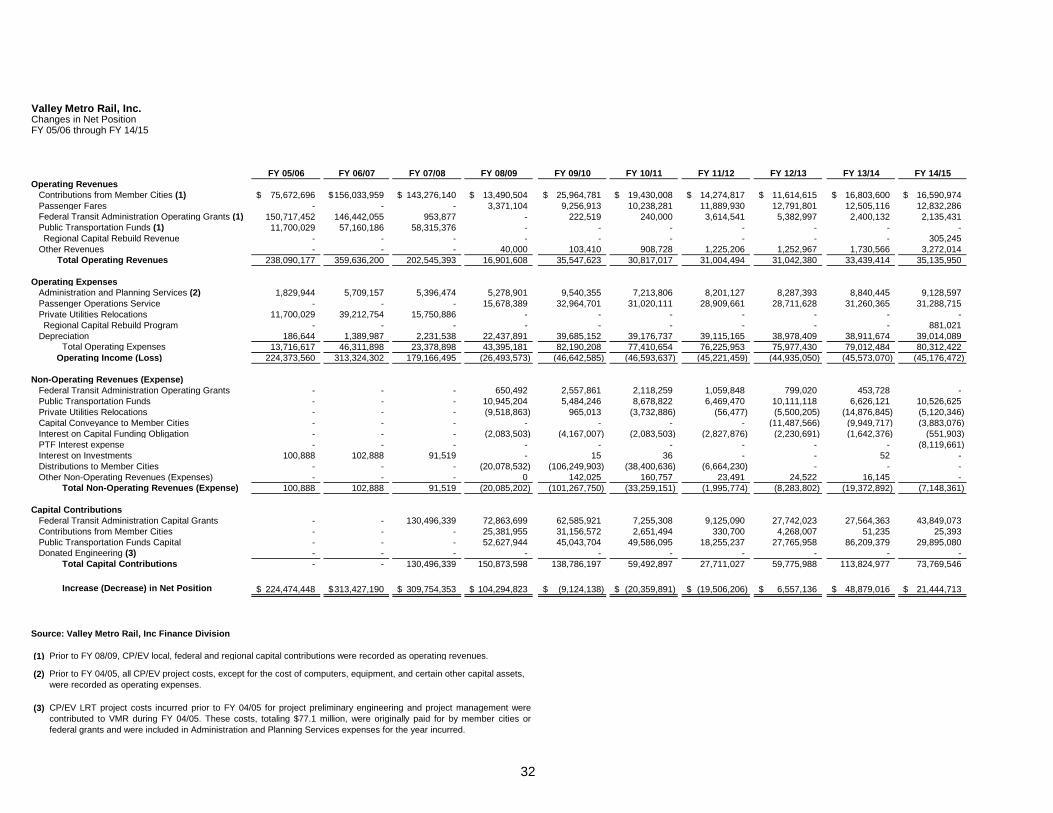
32
FY 05/06 FY 06/07 FY 07/08 FY 08/09 FY 09/10 FY 10/11 FY 11/12 FY 12/13 FY 13/14 FY 14/15Operating Revenues Contributions from Member Cities (1) 75,672,696$ 156,033,959$ 143,276,140$ 13,490,504$ 25,964,781$ 19,430,008$ 14,274,817$ 11,614,615$ 16,803,600$ 16,590,974$ Passenger Fares - - - 3,371,104 9,256,913 10,238,281 11,889,930 12,791,801 12,505,116 12,832,286 Federal Transit Administration Operating Grants (1) 150,717,452 146,442,055 953,877 - 222,519 240,000 3,614,541 5,382,997 2,400,132 2,135,431 Public Transportation Funds (1) 11,700,029 57,160,186 58,315,376 - - - - - - -
Regional Capital Rebuild Revenue - - - - - - - - - 305,245 Other Revenues - - - 40,000 103,410 908,728 1,225,206 1,252,967 1,730,566 3,272,014
Total Operating Revenues 238,090,177 359,636,200 202,545,393 16,901,608 35,547,623 30,817,017 31,004,494 31,042,380 33,439,414 35,135,950
Operating Expenses Administration and Planning Services (2) 1,829,944 5,709,157 5,396,474 5,278,901 9,540,355 7,213,806 8,201,127 8,287,393 8,840,445 9,128,597 Passenger Operations Service - - - 15,678,389 32,964,701 31,020,111 28,909,661 28,711,628 31,260,365 31,288,715 Private Utilities Relocations 11,700,029 39,212,754 15,750,886 - - - - - - -
Regional Capital Rebuild Program - - - - - - - - - 881,021 Depreciation 186,644 1,389,987 2,231,538 22,437,891 39,685,152 39,176,737 39,115,165 38,978,409 38,911,674 39,014,089
Total Operating Expenses 13,716,617 46,311,898 23,378,898 43,395,181 82,190,208 77,410,654 76,225,953 75,977,430 79,012,484 80,312,422 Operating Income (Loss) 224,373,560 313,324,302 179,166,495 (26,493,573) (46,642,585) (46,593,637) (45,221,459) (44,935,050) (45,573,070) (45,176,472)
Non-Operating Revenues (Expense) Federal Transit Administration Operating Grants - - - 650,492 2,557,861 2,118,259 1,059,848 799,020 453,728 - Public Transportation Funds - - - 10,945,204 5,484,246 8,678,822 6,469,470 10,111,118 6,626,121 10,526,625 Private Utilities Relocations - - - (9,518,863) 965,013 (3,732,886) (56,477) (5,500,205) (14,876,845) (5,120,346) Capital Conveyance to Member Cities - - - - - - - (11,487,566) (9,949,717) (3,883,076) Interest on Capital Funding Obligation - - - (2,083,503) (4,167,007) (2,083,503) (2,827,876) (2,230,691) (1,642,376) (551,903) PTF Interest expense - - - - - - - - - (8,119,661) Interest on Investments 100,888 102,888 91,519 - 15 36 - - 52 - Distributions to Member Cities - - - (20,078,532) (106,249,903) (38,400,636) (6,664,230) - - - Other Non-Operating Revenues (Expenses) - - - 0 142,025 160,757 23,491 24,522 16,145 -
Total Non-Operating Revenues (Expense) 100,888 102,888 91,519 (20,085,202) (101,267,750) (33,259,151) (1,995,774) (8,283,802) (19,372,892) (7,148,361)
Capital Contributions Federal Transit Administration Capital Grants - - 130,496,339 72,863,699 62,585,921 7,255,308 9,125,090 27,742,023 27,564,363 43,849,073 Contributions from Member Cities - - - 25,381,955 31,156,572 2,651,494 330,700 4,268,007 51,235 25,393 Public Transportation Funds Capital - - - 52,627,944 45,043,704 49,586,095 18,255,237 27,765,958 86,209,379 29,895,080 Donated Engineering (3) - - - - - - - - - -
Total Capital Contributions - - 130,496,339 150,873,598 138,786,197 59,492,897 27,711,027 59,775,988 113,824,977 73,769,546
Increase (Decrease) in Net Position 224,474,448$ 313,427,190$ 309,754,353$ 104,294,823$ (9,124,138)$ (20,359,891)$ (19,506,206)$ 6,557,136$ 48,879,016$ 21,444,713$
Source: Valley Metro Rail, Inc Finance Division
(1)
(2)
(3) CP/EV LRT project costs incurred prior to FY 04/05 for project preliminary engineering and project management werecontributed to VMR during FY 04/05. These costs, totaling $77.1 million, were originally paid for by member cities orfederal grants and were included in Administration and Planning Services expenses for the year incurred.
Valley Metro Rail, Inc.Changes in Net PositionFY 05/06 through FY 14/15
Prior to FY 04/05, all CP/EV project costs, except for the cost of computers, equipment, and certain other capital assets, were recorded as operating expenses.
Prior to FY 08/09, CP/EV local, federal and regional capital contributions were recorded as operating revenues.
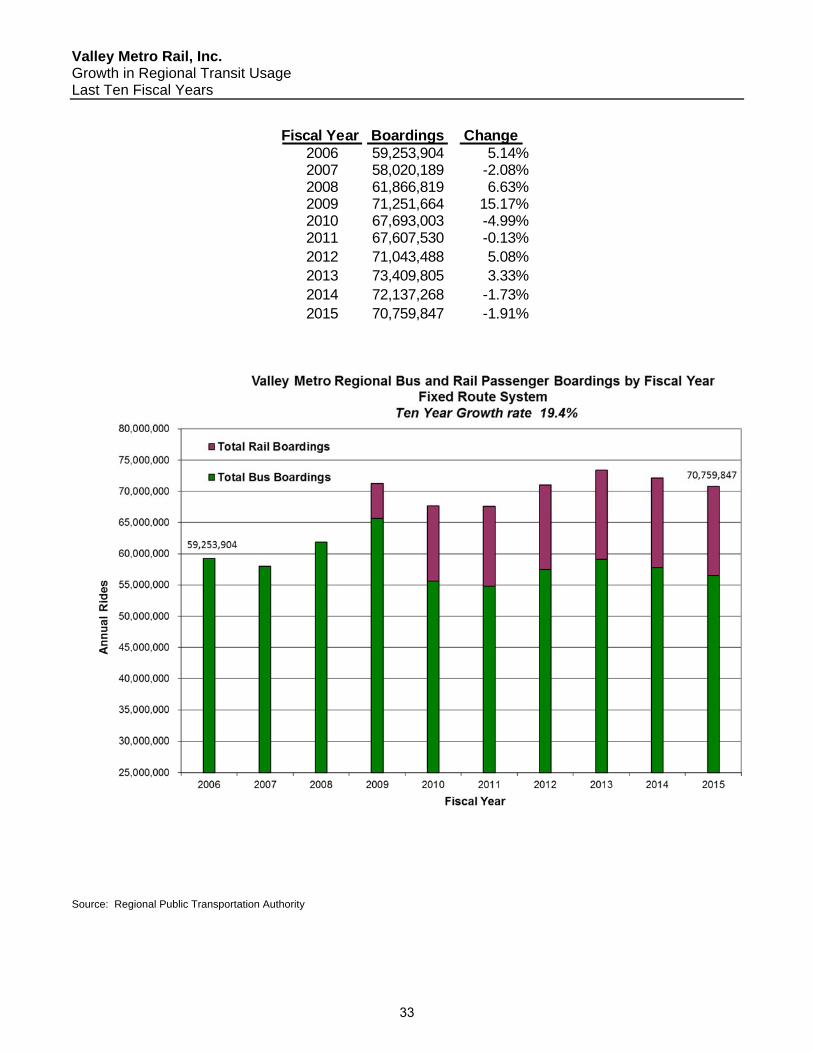
Valley Metro Rail, Inc. Growth in Regional Transit Usage Last Ten Fiscal Years
Source: Regional Public Transportation Authority
Fiscal Year Boardings Change 2006 59,253,904 5.14%2007 58,020,189 -2.08%2008 61,866,819 6.63%2009 71,251,664 15.17%2010 67,693,003 -4.99%2011 67,607,530 -0.13%2012 71,043,488 5.08%2013 73,409,805 3.33%2014 72,137,268 -1.73%2015 70,759,847 -1.91%
33
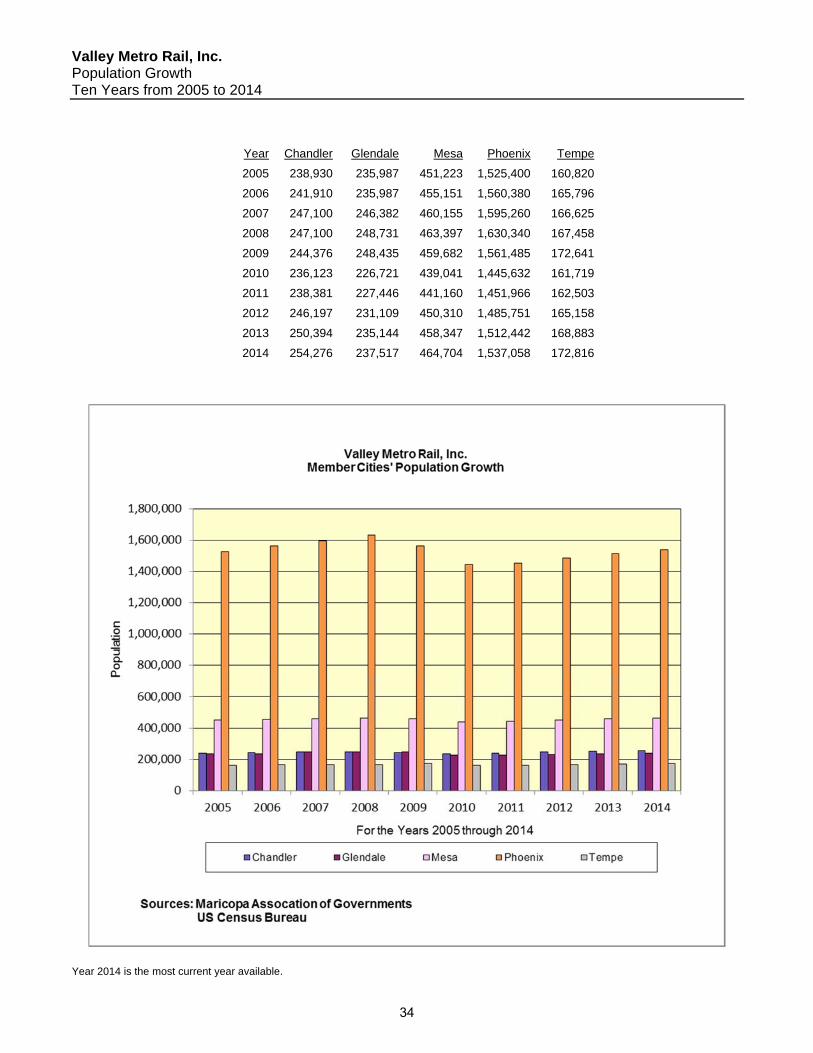
Valley Metro Rail, Inc. Population Growth Ten Years from 2005 to 2014
Year Chandler Glendale Mesa Phoenix Tempe
2005 238,930 235,987 451,223 1,525,400 160,820
2006 241,910 235,987 455,151 1,560,380 165,796
2007 247,100 246,382 460,155 1,595,260 166,625
2008 247,100 248,731 463,397 1,630,340 167,458
2009 244,376 248,435 459,682 1,561,485 172,641
2010 236,123 226,721 439,041 1,445,632 161,719
2011 238,381 227,446 441,160 1,451,966 162,503
2012 246,197 231,109 450,310 1,485,751 165,158
2013 250,394 235,144 458,347 1,512,442 168,883
2014 254,276 237,517 464,704 1,537,058 172,816
Year 2014 is the most current year available.
34
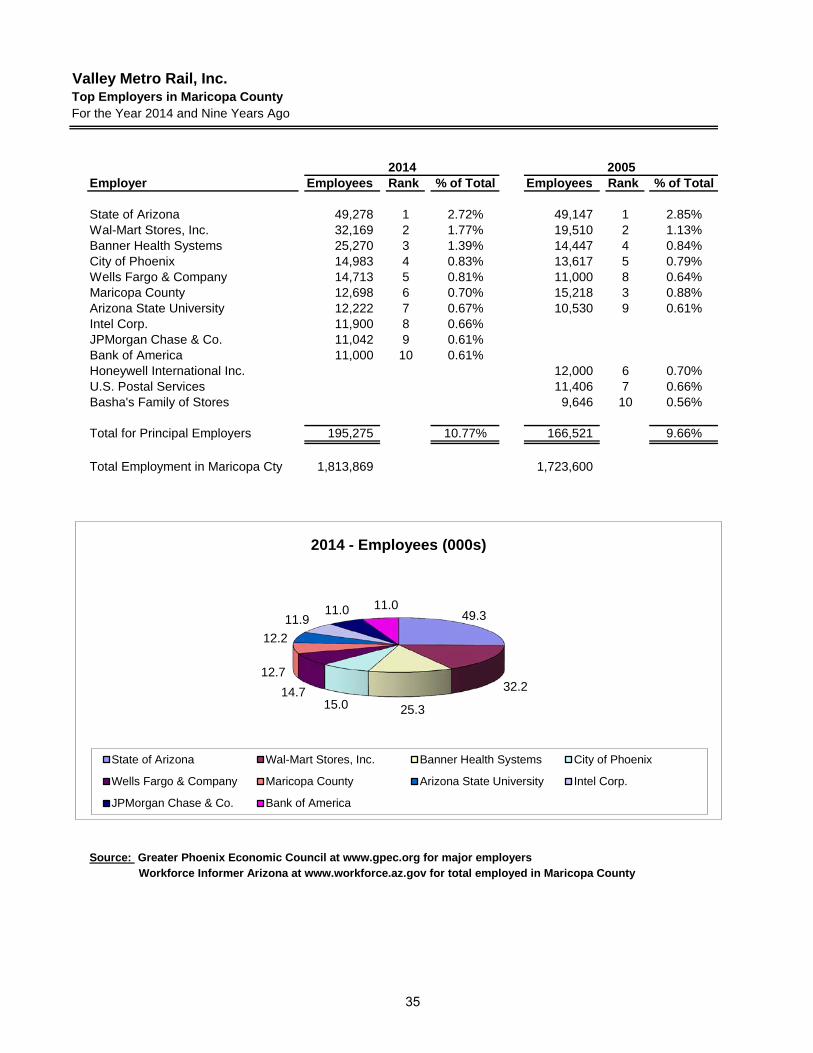
Valley Metro Rail, Inc.Top Employers in Maricopa CountyFor the Year 2014 and Nine Years Ago
Employer Employees Rank % of Total Employees Rank % of Total
State of Arizona 49,278 1 2.72% 49,147 1 2.85%Wal-Mart Stores, Inc. 32,169 2 1.77% 19,510 2 1.13%Banner Health Systems 25,270 3 1.39% 14,447 4 0.84%City of Phoenix 14,983 4 0.83% 13,617 5 0.79%Wells Fargo & Company 14,713 5 0.81% 11,000 8 0.64%Maricopa County 12,698 6 0.70% 15,218 3 0.88%Arizona State University 12,222 7 0.67% 10,530 9 0.61%Intel Corp. 11,900 8 0.66%JPMorgan Chase & Co. 11,042 9 0.61%Bank of America 11,000 10 0.61%Honeywell International Inc. 12,000 6 0.70%U.S. Postal Services 11,406 7 0.66%Basha's Family of Stores 9,646 10 0.56%
Total for Principal Employers 195,275 10.77% 166,521 9.66%
Total Employment in Maricopa Cty 1,813,869 1,723,600
Source: Greater Phoenix Economic Council at www.gpec.org for major employers
2014 2005
Workforce Informer Arizona at www.workforce.az.gov for total employed in Maricopa County
49.3
32.2
25.3 15.0 14.7
12.7
12.2
11.9 11.0 11.0
2014 - Employees (000s)
State of Arizona Wal-Mart Stores, Inc. Banner Health Systems City of Phoenix
Wells Fargo & Company Maricopa County Arizona State University Intel Corp.
JPMorgan Chase & Co. Bank of America
35
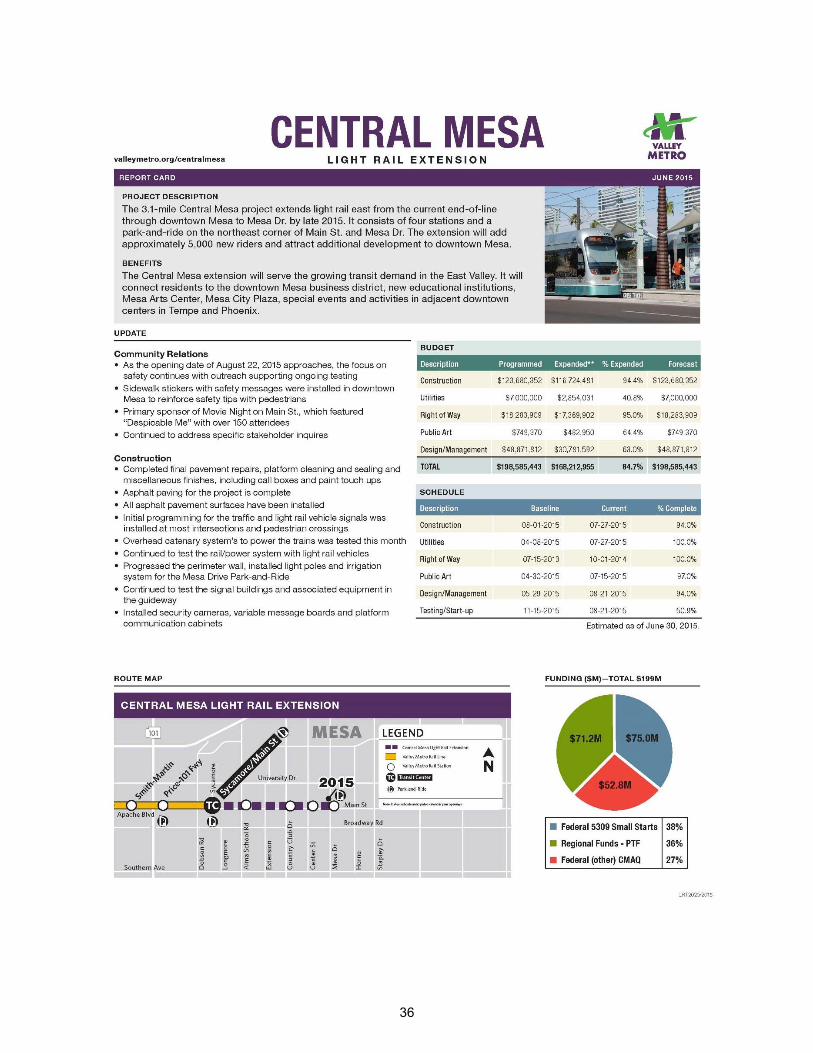
36
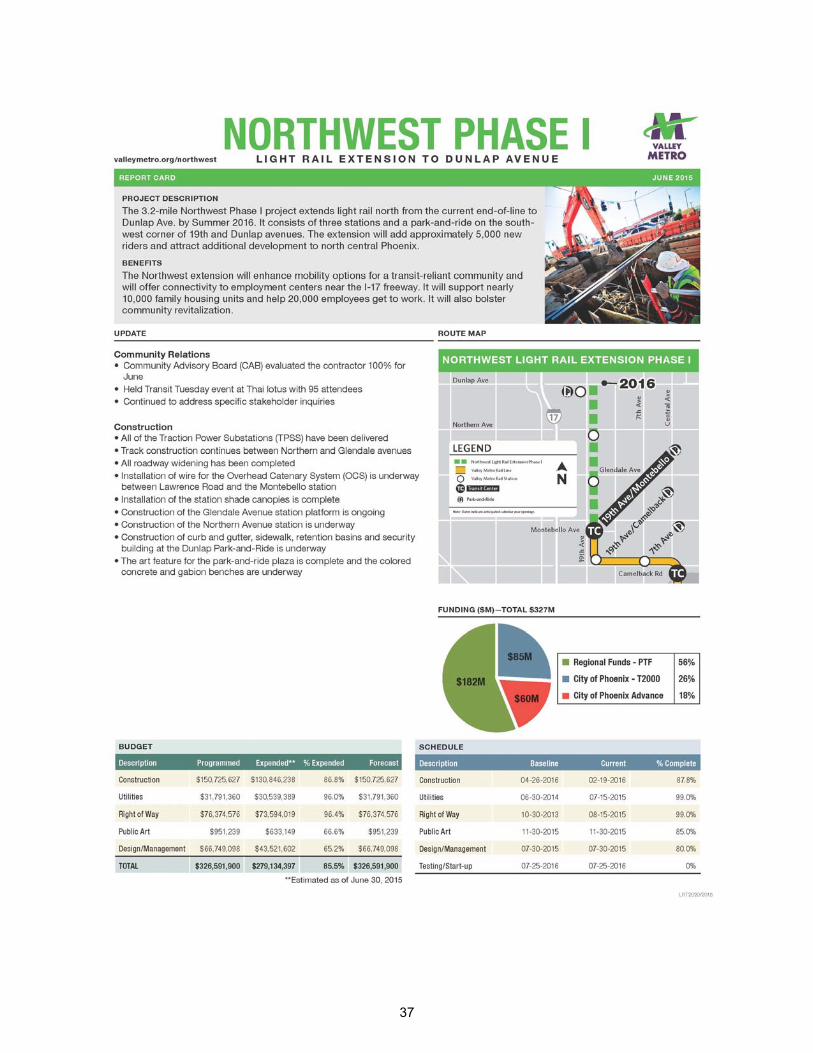
37
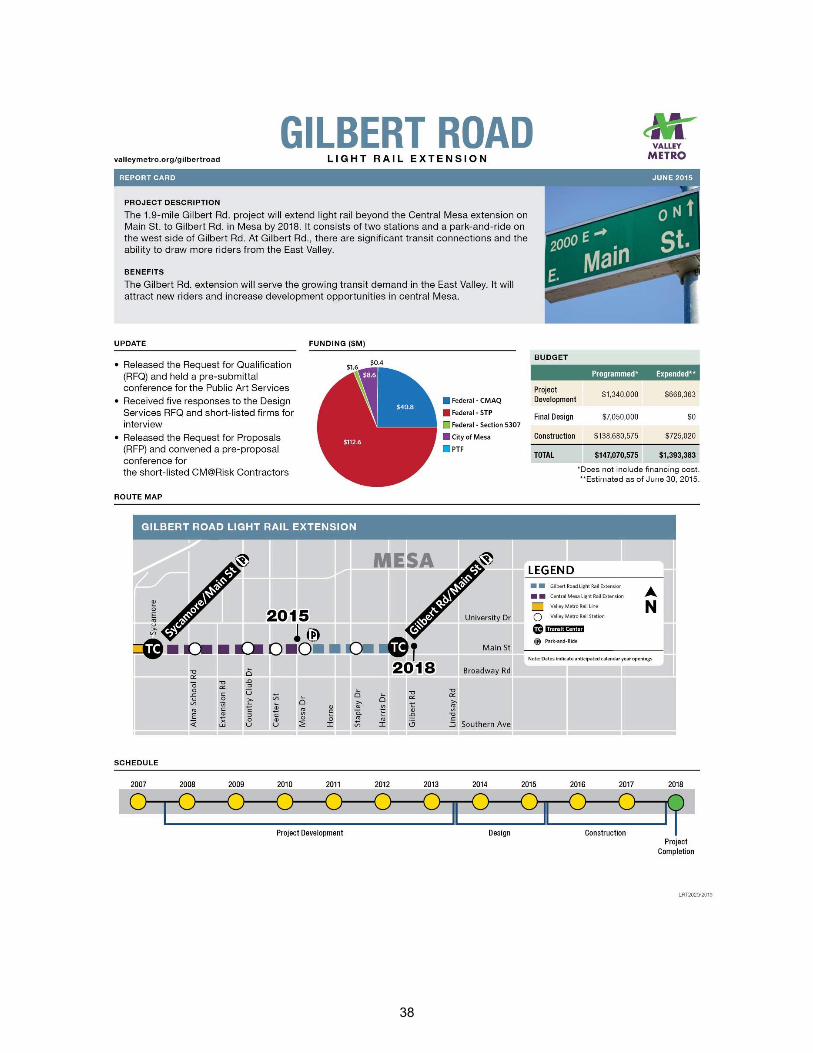
38
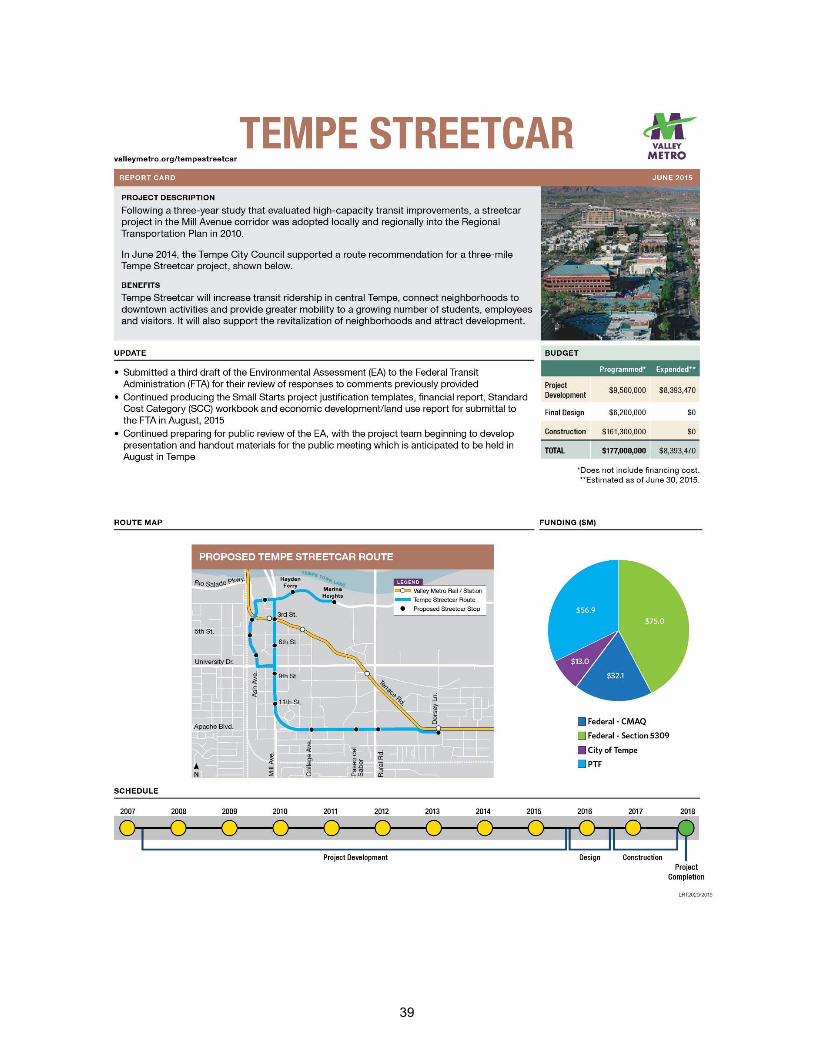
39
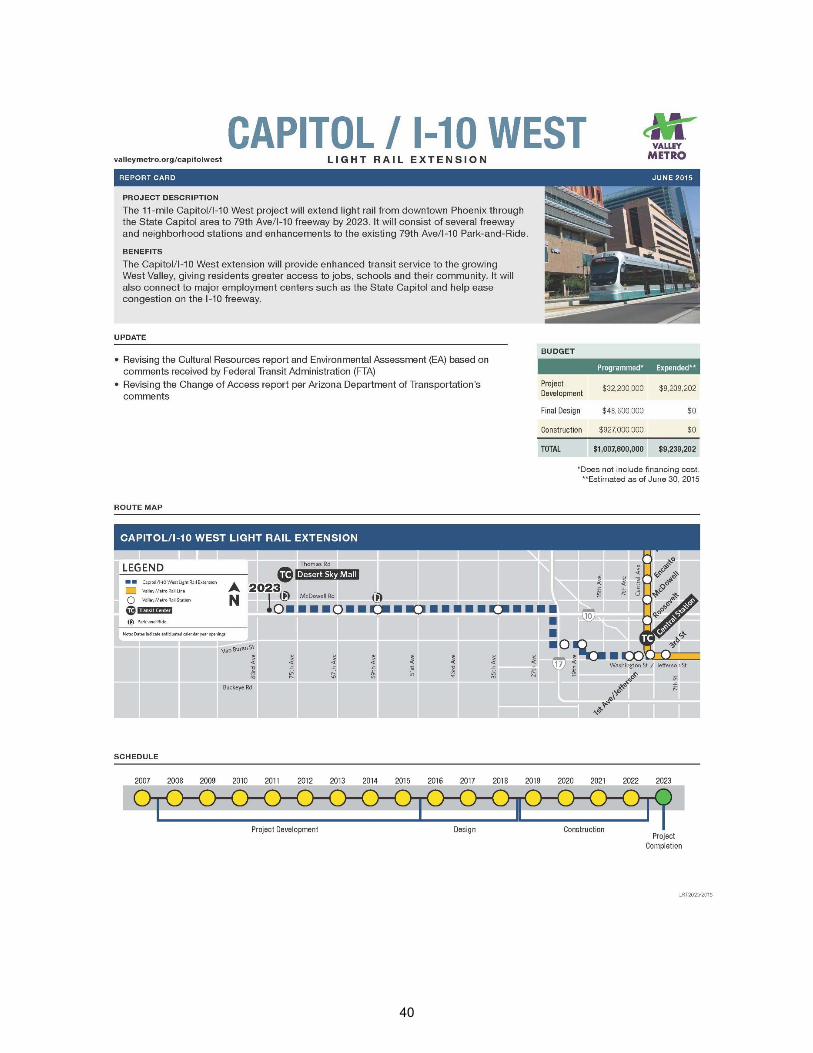
40
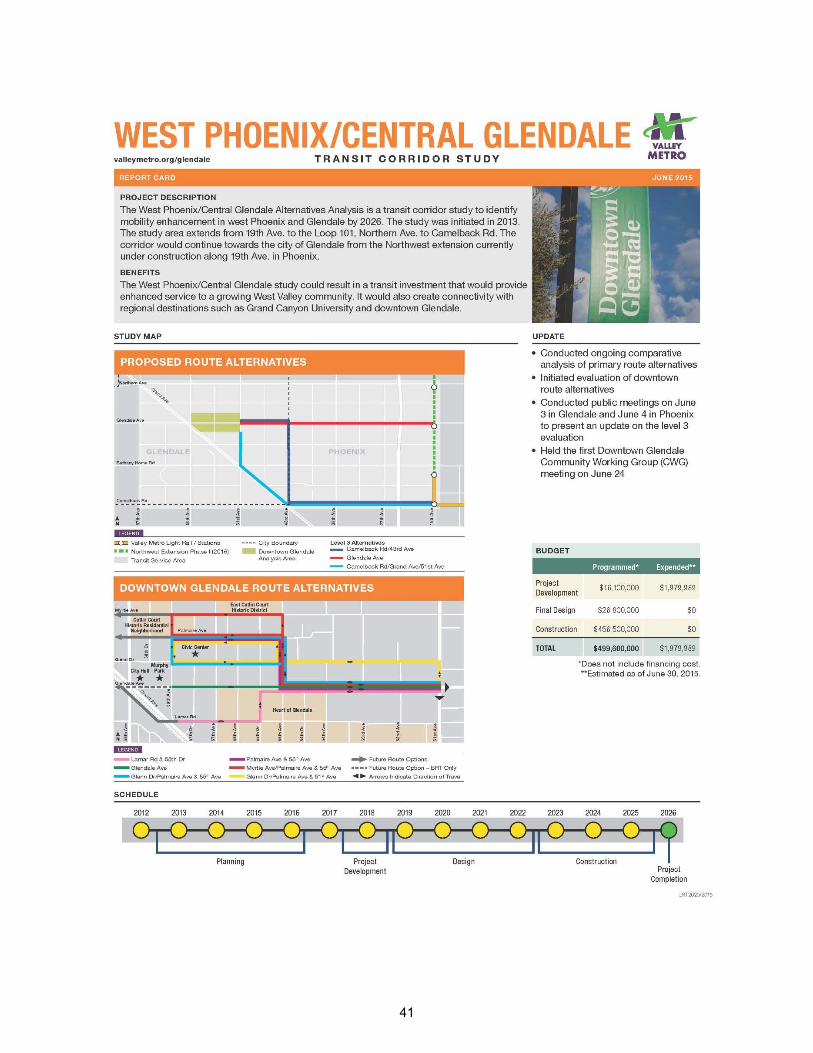
41
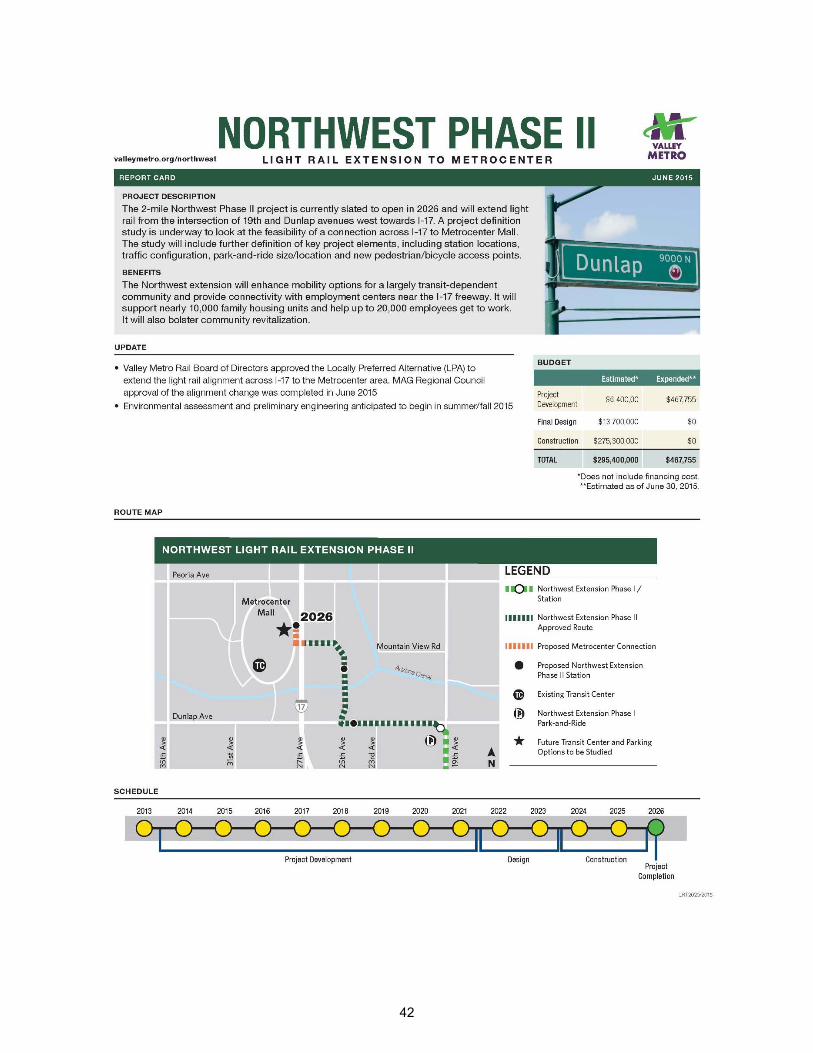
42
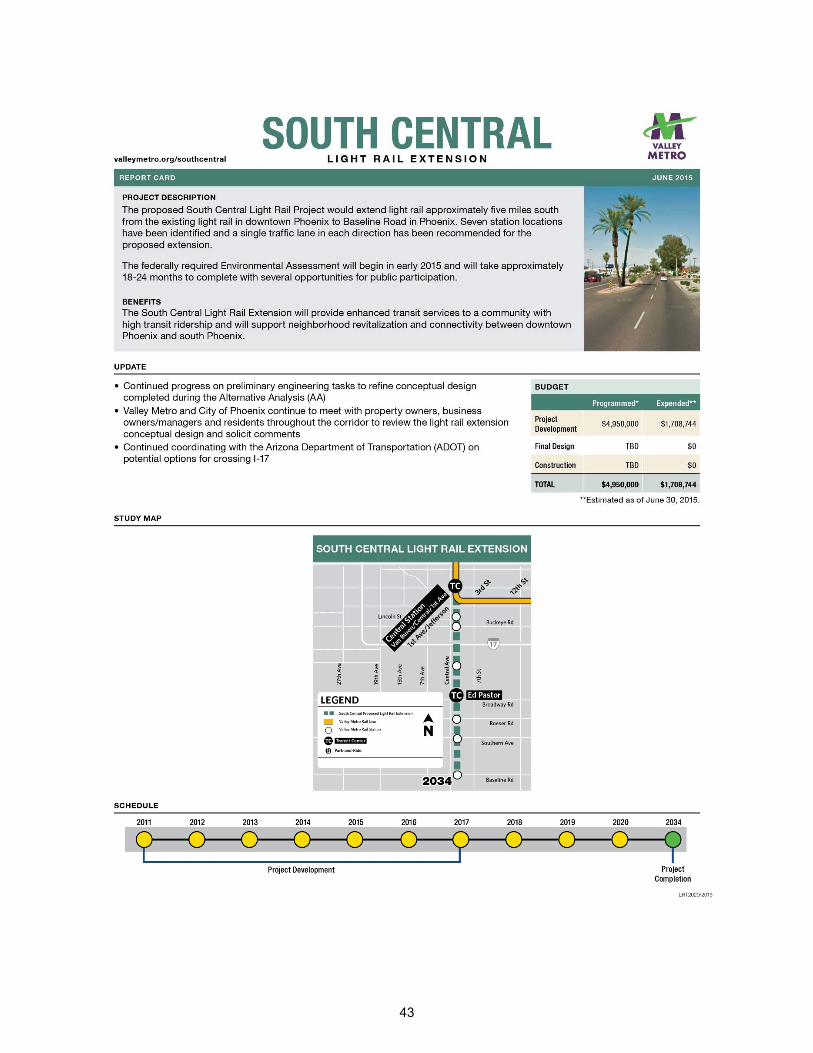
43
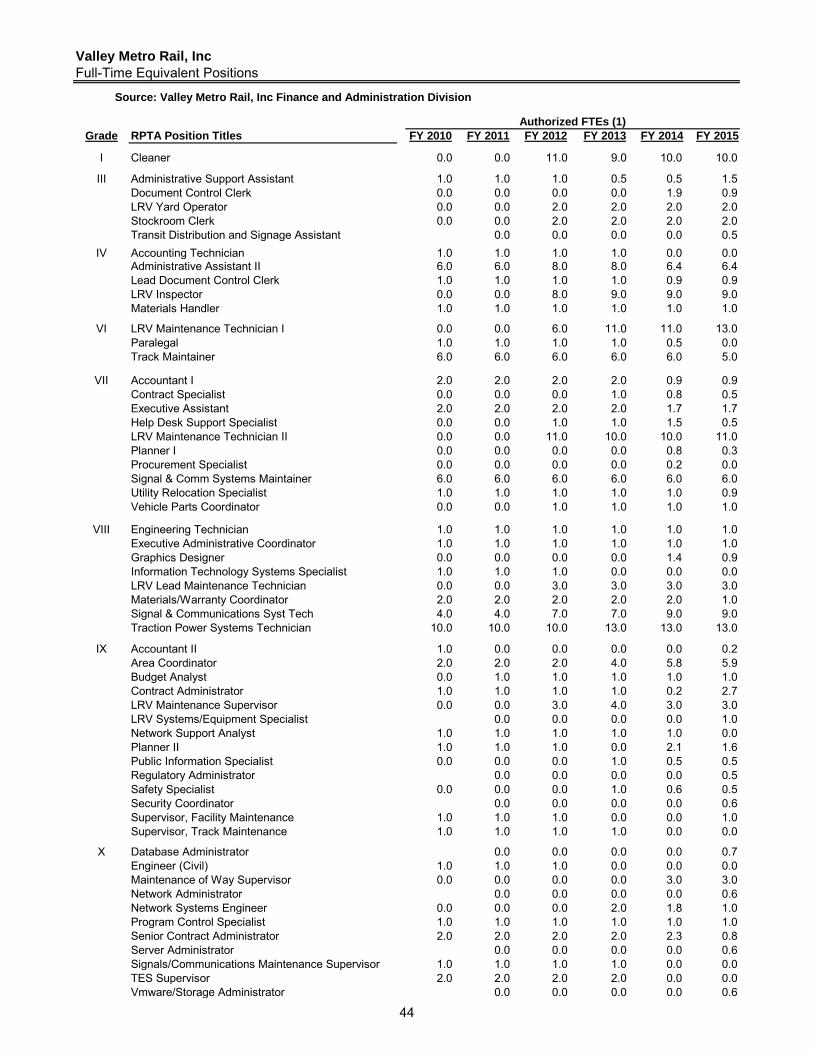
Grade RPTA Position Titles FY 2010 FY 2011 FY 2012 FY 2013 FY 2014 FY 2015
I Cleaner 0.0 0.0 11.0 9.0 10.0 10.0
III Administrative Support Assistant 1.0 1.0 1.0 0.5 0.5 1.5Document Control Clerk 0.0 0.0 0.0 0.0 1.9 0.9LRV Yard Operator 0.0 0.0 2.0 2.0 2.0 2.0Stockroom Clerk 0.0 0.0 2.0 2.0 2.0 2.0Transit Distribution and Signage Assistant 0.0 0.0 0.0 0.0 0.5
IV Accounting Technician 1.0 1.0 1.0 1.0 0.0 0.0Administrative Assistant II 6.0 6.0 8.0 8.0 6.4 6.4Lead Document Control Clerk 1.0 1.0 1.0 1.0 0.9 0.9LRV Inspector 0.0 0.0 8.0 9.0 9.0 9.0Materials Handler 1.0 1.0 1.0 1.0 1.0 1.0
VI LRV Maintenance Technician I 0.0 0.0 6.0 11.0 11.0 13.0Paralegal 1.0 1.0 1.0 1.0 0.5 0.0Track Maintainer 6.0 6.0 6.0 6.0 6.0 5.0
VII Accountant I 2.0 2.0 2.0 2.0 0.9 0.9Contract Specialist 0.0 0.0 0.0 1.0 0.8 0.5Executive Assistant 2.0 2.0 2.0 2.0 1.7 1.7Help Desk Support Specialist 0.0 0.0 1.0 1.0 1.5 0.5LRV Maintenance Technician II 0.0 0.0 11.0 10.0 10.0 11.0Planner I 0.0 0.0 0.0 0.0 0.8 0.3Procurement Specialist 0.0 0.0 0.0 0.0 0.2 0.0Signal & Comm Systems Maintainer 6.0 6.0 6.0 6.0 6.0 6.0Utility Relocation Specialist 1.0 1.0 1.0 1.0 1.0 0.9Vehicle Parts Coordinator 0.0 0.0 1.0 1.0 1.0 1.0
VIII Engineering Technician 1.0 1.0 1.0 1.0 1.0 1.0Executive Administrative Coordinator 1.0 1.0 1.0 1.0 1.0 1.0Graphics Designer 0.0 0.0 0.0 0.0 1.4 0.9Information Technology Systems Specialist 1.0 1.0 1.0 0.0 0.0 0.0LRV Lead Maintenance Technician 0.0 0.0 3.0 3.0 3.0 3.0Materials/Warranty Coordinator 2.0 2.0 2.0 2.0 2.0 1.0Signal & Communications Syst Tech 4.0 4.0 7.0 7.0 9.0 9.0Traction Power Systems Technician 10.0 10.0 10.0 13.0 13.0 13.0
IX Accountant II 1.0 0.0 0.0 0.0 0.0 0.2Area Coordinator 2.0 2.0 2.0 4.0 5.8 5.9Budget Analyst 0.0 1.0 1.0 1.0 1.0 1.0Contract Administrator 1.0 1.0 1.0 1.0 0.2 2.7LRV Maintenance Supervisor 0.0 0.0 3.0 4.0 3.0 3.0LRV Systems/Equipment Specialist 0.0 0.0 0.0 0.0 1.0Network Support Analyst 1.0 1.0 1.0 1.0 1.0 0.0Planner II 1.0 1.0 1.0 0.0 2.1 1.6Public Information Specialist 0.0 0.0 0.0 1.0 0.5 0.5Regulatory Administrator 0.0 0.0 0.0 0.0 0.5Safety Specialist 0.0 0.0 0.0 1.0 0.6 0.5Security Coordinator 0.0 0.0 0.0 0.0 0.6Supervisor, Facility Maintenance 1.0 1.0 1.0 0.0 0.0 1.0Supervisor, Track Maintenance 1.0 1.0 1.0 1.0 0.0 0.0
X Database Administrator 0.0 0.0 0.0 0.0 0.7Engineer (Civil) 1.0 1.0 1.0 0.0 0.0 0.0Maintenance of Way Supervisor 0.0 0.0 0.0 0.0 3.0 3.0Network Administrator 0.0 0.0 0.0 0.0 0.6Network Systems Engineer 0.0 0.0 0.0 2.0 1.8 1.0Program Control Specialist 1.0 1.0 1.0 1.0 1.0 1.0Senior Contract Administrator 2.0 2.0 2.0 2.0 2.3 0.8Server Administrator 0.0 0.0 0.0 0.0 0.6Signals/Communications Maintenance Supervisor 1.0 1.0 1.0 1.0 0.0 0.0TES Supervisor 2.0 2.0 2.0 2.0 0.0 0.0Vmware/Storage Administrator 0.0 0.0 0.0 0.0 0.6
Valley Metro Rail, Inc
Full-Time Equivalent Positions
Source: Valley Metro Rail, Inc Finance and Administration Division
Authorized FTEs (1)
44
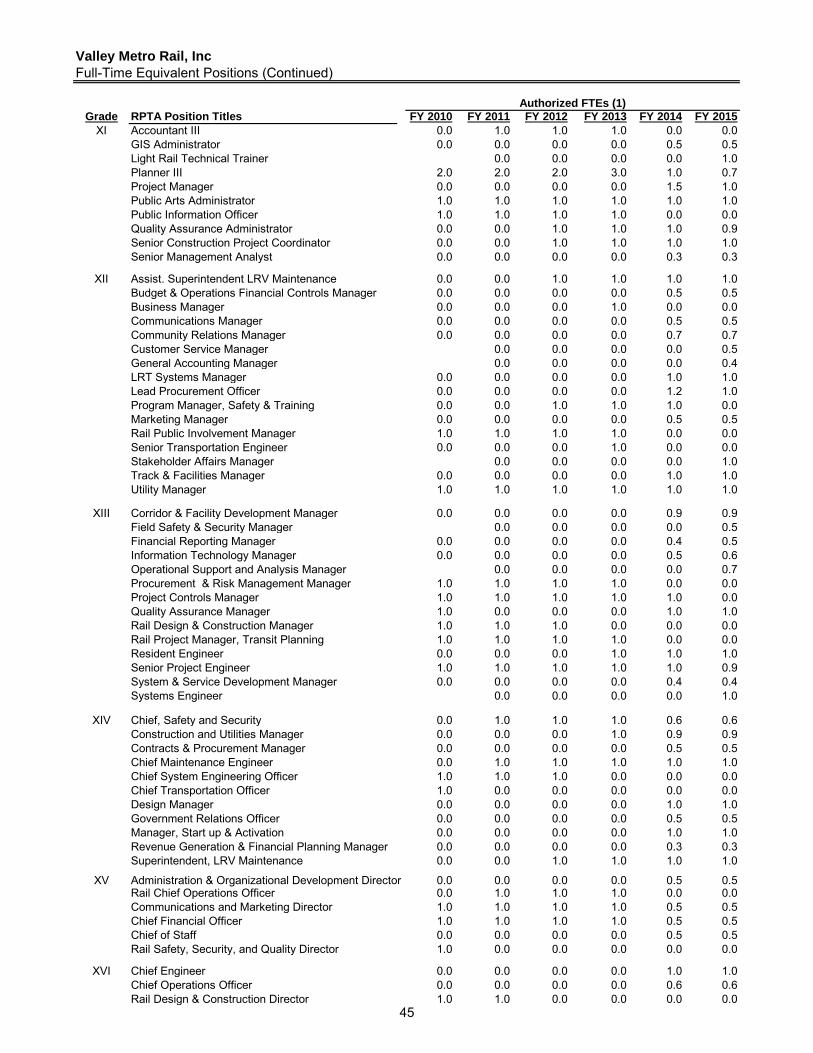
Grade RPTA Position Titles FY 2010 FY 2011 FY 2012 FY 2013 FY 2014 FY 2015
XI Accountant III 0.0 1.0 1.0 1.0 0.0 0.0GIS Administrator 0.0 0.0 0.0 0.0 0.5 0.5Light Rail Technical Trainer 0.0 0.0 0.0 0.0 1.0Planner III 2.0 2.0 2.0 3.0 1.0 0.7Project Manager 0.0 0.0 0.0 0.0 1.5 1.0Public Arts Administrator 1.0 1.0 1.0 1.0 1.0 1.0Public Information Officer 1.0 1.0 1.0 1.0 0.0 0.0Quality Assurance Administrator 0.0 0.0 1.0 1.0 1.0 0.9Senior Construction Project Coordinator 0.0 0.0 1.0 1.0 1.0 1.0Senior Management Analyst 0.0 0.0 0.0 0.0 0.3 0.3
XII Assist. Superintendent LRV Maintenance 0.0 0.0 1.0 1.0 1.0 1.0Budget & Operations Financial Controls Manager 0.0 0.0 0.0 0.0 0.5 0.5Business Manager 0.0 0.0 0.0 1.0 0.0 0.0Communications Manager 0.0 0.0 0.0 0.0 0.5 0.5Community Relations Manager 0.0 0.0 0.0 0.0 0.7 0.7Customer Service Manager 0.0 0.0 0.0 0.0 0.5General Accounting Manager 0.0 0.0 0.0 0.0 0.4LRT Systems Manager 0.0 0.0 0.0 0.0 1.0 1.0Lead Procurement Officer 0.0 0.0 0.0 0.0 1.2 1.0Program Manager, Safety & Training 0.0 0.0 1.0 1.0 1.0 0.0Marketing Manager 0.0 0.0 0.0 0.0 0.5 0.5Rail Public Involvement Manager 1.0 1.0 1.0 1.0 0.0 0.0Senior Transportation Engineer 0.0 0.0 0.0 1.0 0.0 0.0Stakeholder Affairs Manager 0.0 0.0 0.0 0.0 1.0Track & Facilities Manager 0.0 0.0 0.0 0.0 1.0 1.0Utility Manager 1.0 1.0 1.0 1.0 1.0 1.0
XIII Corridor & Facility Development Manager 0.0 0.0 0.0 0.0 0.9 0.9Field Safety & Security Manager 0.0 0.0 0.0 0.0 0.5Financial Reporting Manager 0.0 0.0 0.0 0.0 0.4 0.5Information Technology Manager 0.0 0.0 0.0 0.0 0.5 0.6Operational Support and Analysis Manager 0.0 0.0 0.0 0.0 0.7Procurement & Risk Management Manager 1.0 1.0 1.0 1.0 0.0 0.0Project Controls Manager 1.0 1.0 1.0 1.0 1.0 0.0Quality Assurance Manager 1.0 0.0 0.0 0.0 1.0 1.0Rail Design & Construction Manager 1.0 1.0 1.0 0.0 0.0 0.0Rail Project Manager, Transit Planning 1.0 1.0 1.0 1.0 0.0 0.0Resident Engineer 0.0 0.0 0.0 1.0 1.0 1.0Senior Project Engineer 1.0 1.0 1.0 1.0 1.0 0.9System & Service Development Manager 0.0 0.0 0.0 0.0 0.4 0.4Systems Engineer 0.0 0.0 0.0 0.0 1.0
XIV Chief, Safety and Security 0.0 1.0 1.0 1.0 0.6 0.6Construction and Utilities Manager 0.0 0.0 0.0 1.0 0.9 0.9Contracts & Procurement Manager 0.0 0.0 0.0 0.0 0.5 0.5Chief Maintenance Engineer 0.0 1.0 1.0 1.0 1.0 1.0Chief System Engineering Officer 1.0 1.0 1.0 0.0 0.0 0.0Chief Transportation Officer 1.0 0.0 0.0 0.0 0.0 0.0Design Manager 0.0 0.0 0.0 0.0 1.0 1.0Government Relations Officer 0.0 0.0 0.0 0.0 0.5 0.5Manager, Start up & Activation 0.0 0.0 0.0 0.0 1.0 1.0Revenue Generation & Financial Planning Manager 0.0 0.0 0.0 0.0 0.3 0.3Superintendent, LRV Maintenance 0.0 0.0 1.0 1.0 1.0 1.0
XV Administration & Organizational Development Director 0.0 0.0 0.0 0.0 0.5 0.5Rail Chief Operations Officer 0.0 1.0 1.0 1.0 0.0 0.0Communications and Marketing Director 1.0 1.0 1.0 1.0 0.5 0.5Chief Financial Officer 1.0 1.0 1.0 1.0 0.5 0.5Chief of Staff 0.0 0.0 0.0 0.0 0.5 0.5Rail Safety, Security, and Quality Director 1.0 0.0 0.0 0.0 0.0 0.0
XVI Chief Engineer 0.0 0.0 0.0 0.0 1.0 1.0Chief Operations Officer 0.0 0.0 0.0 0.0 0.6 0.6Rail Design & Construction Director 1.0 1.0 0.0 0.0 0.0 0.0
Valley Metro Rail, Inc
Full-Time Equivalent Positions (Continued)
Authorized FTEs (1)
45
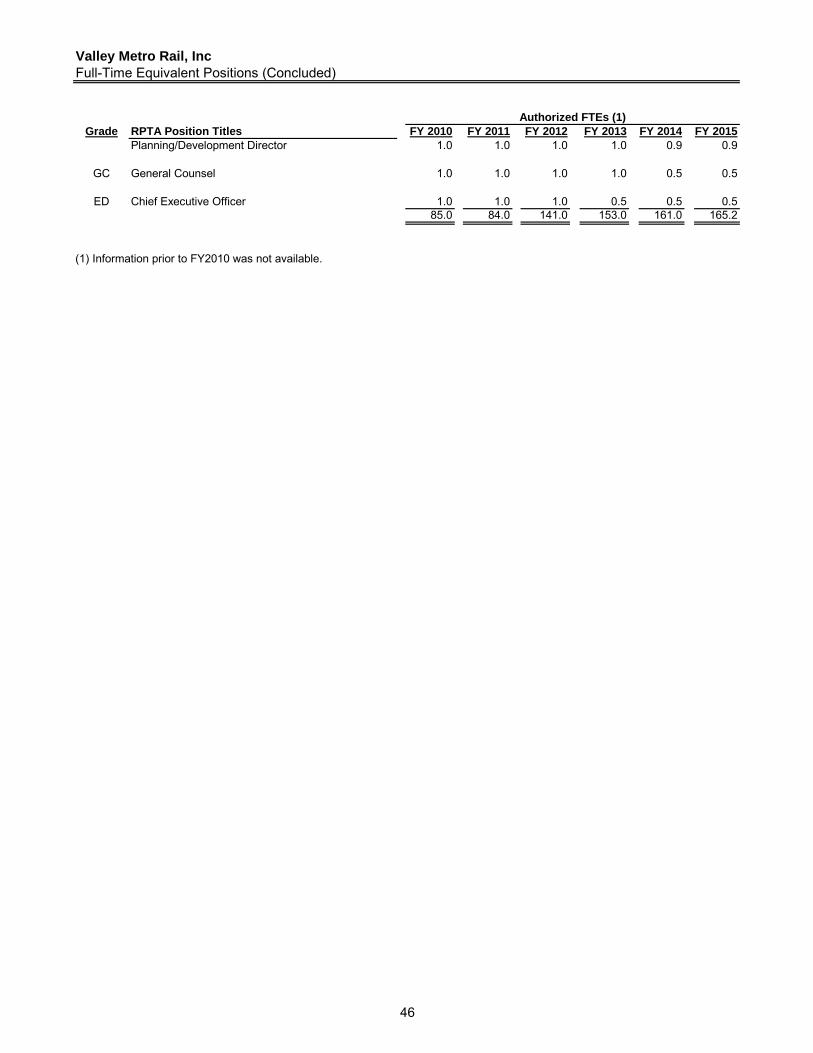
Grade RPTA Position Titles FY 2010 FY 2011 FY 2012 FY 2013 FY 2014 FY 2015
Planning/Development Director 1.0 1.0 1.0 1.0 0.9 0.9
GC General Counsel 1.0 1.0 1.0 1.0 0.5 0.5
ED Chief Executive Officer 1.0 1.0 1.0 0.5 0.5 0.585.0 84.0 141.0 153.0 161.0 165.2
(1) Information prior to FY2010 was not available.
Valley Metro Rail, Inc
Full-Time Equivalent Positions (Concluded)
Authorized FTEs (1)
46
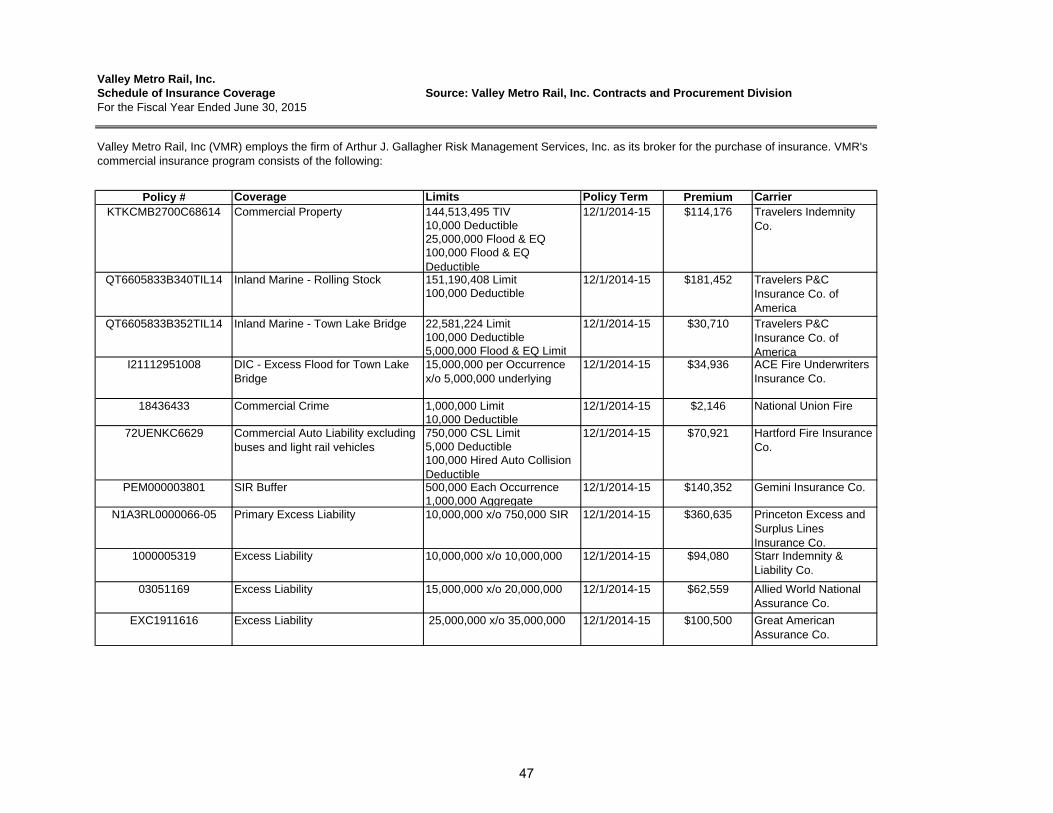
Valley Metro Rail, Inc.Schedule of Insurance Coverage Source: Valley Metro Rail, Inc. Contracts and Procurement DivisionFor the Fiscal Year Ended June 30, 2015
Policy # Coverage Limits Policy Term Premium Carrier144,513,495 TIV10,000 Deductible25,000,000 Flood & EQ 100,000 Flood & EQ Deductible151,190,408 Limit100,000 Deductible
22,581,224 Limit100,000 Deductible5,000,000 Flood & EQ Limit
I21112951008 DIC - Excess Flood for Town Lake Bridge
15,000,000 per Occurrence x/o 5,000,000 underlying
12/1/2014-15 $34,936 ACE Fire Underwriters Insurance Co.
1,000,000 Limit10,000 Deductible750,000 CSL Limit5,000 Deductible100,000 Hired Auto Collision Deductible 500,000 Each Occurrence1,000,000 Aggregate
N1A3RL0000066-05 Primary Excess Liability 10,000,000 x/o 750,000 SIR 12/1/2014-15 $360,635 Princeton Excess and Surplus Lines Insurance Co.
1000005319 Excess Liability 10,000,000 x/o 10,000,000 12/1/2014-15 $94,080 Starr Indemnity & Liability Co.
03051169 Excess Liability 15,000,000 x/o 20,000,000 12/1/2014-15 $62,559 Allied World National Assurance Co.
EXC1911616 Excess Liability 25,000,000 x/o 35,000,000 12/1/2014-15 $100,500 Great American Assurance Co.
Hartford Fire Insurance Co.
$70,92112/1/2014-15Commercial Auto Liability excluding buses and light rail vehicles
72UENKC6629
Gemini Insurance Co.$140,352PEM000003801
Valley Metro Rail, Inc (VMR) employs the firm of Arthur J. Gallagher Risk Management Services, Inc. as its broker for the purchase of insurance. VMR's commercial insurance program consists of the following:
KTKCMB2700C68614 Commercial Property Travelers Indemnity Co.
$114,17612/1/2014-15
18436433
Travelers P&C Insurance Co. of America
$30,71012/1/2014-15
$181,45212/1/2014-15
Commercial Crime
Travelers P&C Insurance Co. of America
QT6605833B340TIL14
QT6605833B352TIL14
Inland Marine - Rolling Stock
12/1/2014-15SIR Buffer
National Union Fire$2,14612/1/2014-15
Inland Marine - Town Lake Bridge
47
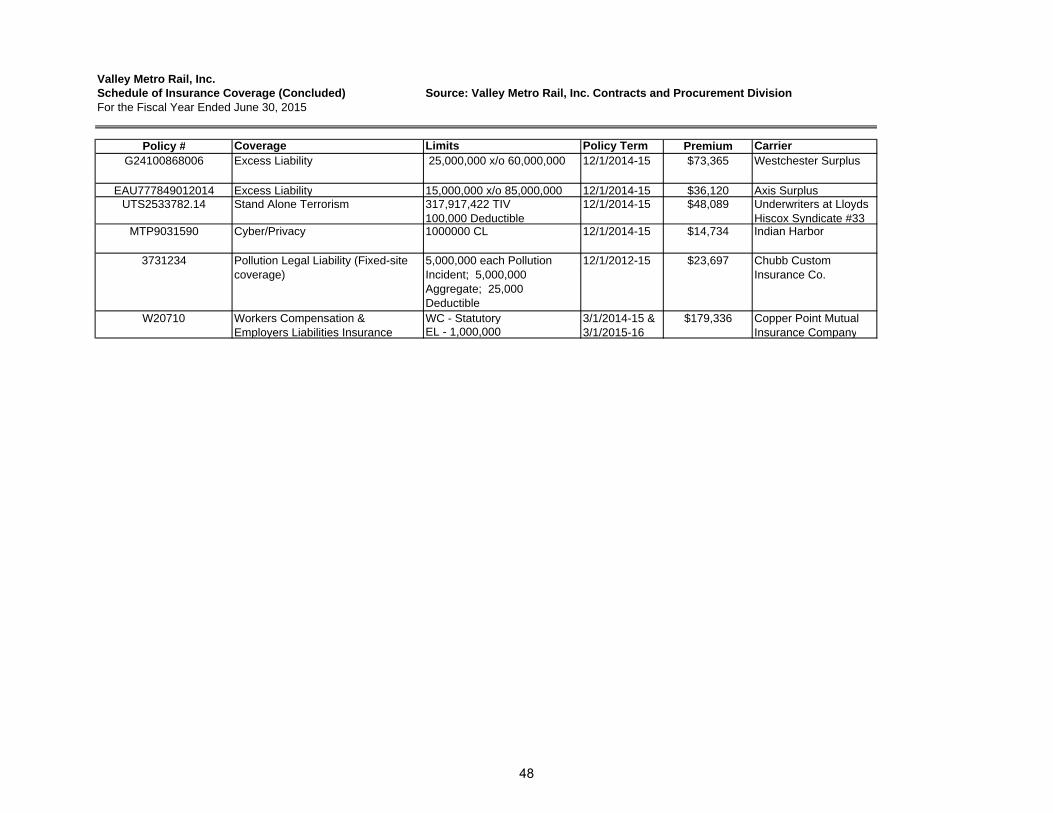
Valley Metro Rail, Inc.Schedule of Insurance Coverage (Concluded) Source: Valley Metro Rail, Inc. Contracts and Procurement DivisionFor the Fiscal Year Ended June 30, 2015
Policy # Coverage Limits Policy Term Premium CarrierG24100868006 Excess Liability 25,000,000 x/o 60,000,000 12/1/2014-15 $73,365 Westchester Surplus
EAU777849012014 Excess Liability 15,000,000 x/o 85,000,000 12/1/2014-15 $36,120 Axis SurplusUTS2533782.14 Stand Alone Terrorism 317,917,422 TIV
100,000 Deductible12/1/2014-15 $48,089 Underwriters at Lloyds
Hiscox Syndicate #33MTP9031590 Cyber/Privacy 1000000 CL 12/1/2014-15 $14,734 Indian Harbor
3731234 Pollution Legal Liability (Fixed-site coverage)
5,000,000 each Pollution Incident; 5,000,000 Aggregate; 25,000 Deductible
12/1/2012-15 $23,697 Chubb Custom Insurance Co.
WC - StatutoryEL - 1,000,000
W20710 Workers Compensation & Employers Liabilities Insurance
3/1/2014-15 & 3/1/2015-16
$179,336 Copper Point Mutual Insurance Company
48
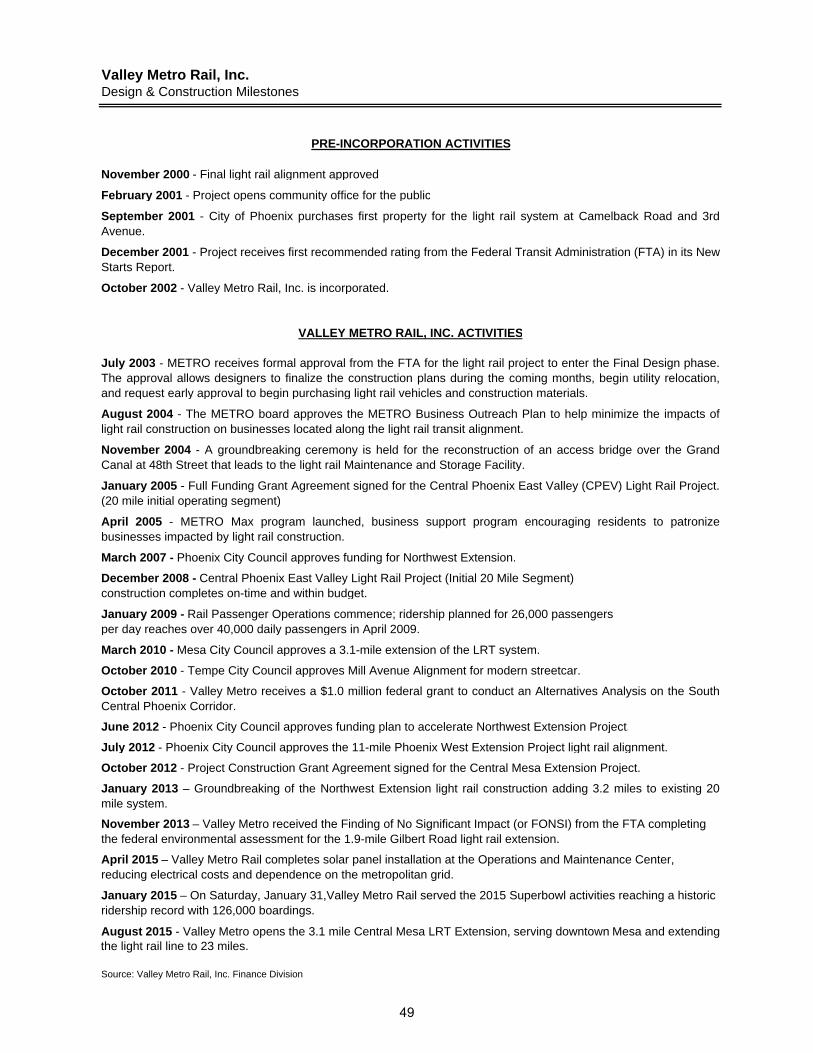
Valley Metro Rail, Inc.Design & Construction Milestones
PRE-INCORPORATION ACTIVITIES
November 2000 - Final light rail alignment approved
February 2001 - Project opens community office for the public
September 2001 - City of Phoenix purchases first property for the light rail system at Camelback Road and 3rdAvenue.
December 2001 - Project receives first recommended rating from the Federal Transit Administration (FTA) in its NewStarts Report.
October 2002 - Valley Metro Rail, Inc. is incorporated.
VALLEY METRO RAIL, INC. ACTIVITIES
July 2003 - METRO receives formal approval from the FTA for the light rail project to enter the Final Design phase.The approval allows designers to finalize the construction plans during the coming months, begin utility relocation,and request early approval to begin purchasing light rail vehicles and construction materials.
August 2004 - The METRO board approves the METRO Business Outreach Plan to help minimize the impacts oflight rail construction on businesses located along the light rail transit alignment.
November 2004 - A groundbreaking ceremony is held for the reconstruction of an access bridge over the GrandCanal at 48th Street that leads to the light rail Maintenance and Storage Facility.
January 2005 - Full Funding Grant Agreement signed for the Central Phoenix East Valley (CPEV) Light Rail Project.(20 mile initial operating segment)
April 2005 - METRO Max program launched, business support program encouraging residents to patronizebusinesses impacted by light rail construction.
March 2007 - Phoenix City Council approves funding for Northwest Extension.
December 2008 - Central Phoenix East Valley Light Rail Project (Initial 20 Mile Segment)construction completes on-time and within budget.
January 2009 - Rail Passenger Operations commence; ridership planned for 26,000 passengersper day reaches over 40,000 daily passengers in April 2009.
March 2010 - Mesa City Council approves a 3.1-mile extension of the LRT system.
October 2010 - Tempe City Council approves Mill Avenue Alignment for modern streetcar.
October 2011 - Valley Metro receives a $1.0 million federal grant to conduct an Alternatives Analysis on the SouthCentral Phoenix Corridor.
June 2012 - Phoenix City Council approves funding plan to accelerate Northwest Extension Project.
July 2012 - Phoenix City Council approves the 11-mile Phoenix West Extension Project light rail alignment.
October 2012 - Project Construction Grant Agreement signed for the Central Mesa Extension Project.
January 2013 – Groundbreaking of the Northwest Extension light rail construction adding 3.2 miles to existing 20mile system.
November 2013 – Valley Metro received the Finding of No Significant Impact (or FONSI) from the FTA completing the federal environmental assessment for the 1.9-mile Gilbert Road light rail extension.
April 2015 – Valley Metro Rail completes solar panel installation at the Operations and Maintenance Center, reducing electrical costs and dependence on the metropolitan grid.
January 2015 – On Saturday, January 31,Valley Metro Rail served the 2015 Superbowl activities reaching a historic ridership record with 126,000 boardings.
August 2015 - Valley Metro opens the 3.1 mile Central Mesa LRT Extension, serving downtown Mesa and extending the light rail line to 23 miles.
Source: Valley Metro Rail, Inc. Finance Division
49


101 North First Avenue | Suite 1300 | Phoenix, AZ 85003 | valleymetro.org