Embed Size (px)
Citation preview
Validation of upper mesospheric and lower thermospherictemperatures measured by the Solar Occultationfor Ice Experiment
Michael H. Stevens,1 Lance E. Deaver,2 Mark E. Hervig,2 James M. Russell III,3
David E. Siskind,1 Patrick E. Sheese,4 Edward J. Llewellyn,5 Richard L. Gattinger,5
Josef Höffner,6 and B. T. Marshall2
Received 25 February 2012; revised 5 July 2012; accepted 5 July 2012; published 23 August 2012.
[1] Temperature observations in the polar mesosphere and lower thermosphere are criticalfor studies of polar mesospheric cloud (PMC) formation and variability. The SolarOccultation for Ice Experiment (SOFIE) on NASA’s Aeronomy of Ice in the Mesosphere(AIM) satellite has been measuring temperatures in the polar atmosphere nearlycontinuously since 2007. We herein present an improved SOFIE temperature data setand validate it against a variety of satellite and ground-based observations. We find thatwhen taking all comparisons together, SOFIE temperatures are in agreement withindependent observations to within reported systematic uncertainties from 15 to 88 kmaltitude. Between 88 and 95 km SOFIE temperatures have a warm bias that peaks between10 and 15 K in the Arctic summer and 20–30 K in the Antarctic summer. Much of thewarm bias is likely related to uncertainties in prescribed atomic oxygen densities that arerequired for the SOFIE temperature retrieval.
Citation: Stevens, M. H., L. E. Deaver, M. E. Hervig, J. M. Russell III, D. E. Siskind, P. E. Sheese, E. J. Llewellyn,R. L. Gattinger, J. Höffner, and B. T. Marshall (2012), Validation of upper mesospheric and lower thermospheric temperaturesmeasured by the Solar Occultation for Ice Experiment, J. Geophys. Res., 117, D16304, doi:10.1029/2012JD017689.
1. Introduction
[2] Since the first temperature measurements of the highlatitude mesosphere in the early 1960s [Theon et al., 1967;Lübken, 2000], there has been a great deal of interest in thecold summer mesopause and its relevance to the formation ofpolar mesospheric clouds (PMCs) [von Zahn et al., 1996;Berger and von Zahn, 1999]. This is primarily because PMCsare extremely sensitive to the ambient temperature and couldtherefore be indicators of both natural and anthropogenicchanges in the upper atmosphere.[3] Accurate temperature profiles at high vertical resolu-
tion throughout the polar summer mesosphere are nonethe-less still scarce. Temperature observations with the highestvertical resolution (≤1 km) can be obtained by either ground-
based or in situ observations. Ground-based observationsinclude those from potassium lidar [Höffner and Lübken,2007; Lübken et al., 2009] or iron (Fe) lidar [Lautenbachand Höffner, 2004]. In situ measurements at high verticalresolution (�0.2 km) can be obtained from sounding rockets[e.g., Rapp et al., 2002] or at somewhat lower resolution(�3 km) from falling spheres [e.g., Lübken et al., 1996;Lübken and Müllemann, 2003]. Summertime falling sphereobservations have provided a clearer understanding of theseasonal evolution of the cold summer mesopause region [e.g.,Lübken, 1999]. All of these ground-based temperature mea-surements are necessarily limited in geographical coverage,underscoring the need for complementary satellite temperaturemeasurements to provide a more global-scale view.[4] The Solar Occultation for Ice Experiment (SOFIE) on
NASA’s Aeronomy of Ice in the Mesosphere (AIM) satellitehas measured temperature nearly continuously in the Arcticand Antarctic since May, 2007. SOFIE measures tempera-ture and pressure using observations of atmospheric trans-mission in the 4.3 mm band of carbon dioxide (CO2) and ofatmospheric refraction in the 701 nm region [Marshall et al.,2011] at a vertical resolution of 1–2 km. A discussion of theSOFIE experiment and some early results were presented byGordley et al. [2009].[5] Satellite temperature observations near the polar summer
mesopause at sufficient vertical resolution (<5 km) for valida-tion against SOFIE temperatures are relatively scarce. Threeinstruments that can provide these data are the AtmosphericChemistry Experiment (ACE), the Sounding of the Atmosphere
1Space Science Division, Naval Research Laboratory, Washington, D. C.,USA.
2GATS, Inc., Newport News, Virginia, USA.3Center for Atmospheric Sciences, Hampton University, Hampton,
Virginia, USA.4Department of Physics, University of Toronto, Toronto, Ontario, Canada.5Department of Physics and Engineering Physics, University of
Saskatchewan, Saskatoon, Saskatchewan, Canada.6Institute for Atmospheric Physics, Kühlungsborn, Germany.
Corresponding author: M. H. Stevens, Space Science Division, NavalResearch Laboratory, Code 7641, 4555 Overlook Ave., SW, Washington,DC 20375, USA. ([email protected])
©2012. American Geophysical Union. All Rights Reserved.0148-0227/12/2012JD017689
JOURNAL OF GEOPHYSICAL RESEARCH, VOL. 117, D16304, doi:10.1029/2012JD017689, 2012
D16304 1 of 13
using Broadband Emission Radiometry (SABER) and theOptical Spectrograph and Infrared Imaging System (OSI-RIS). ACE provides gas phase temperature profilesthroughout the PMC region using the technique of solaroccultation [Sica et al., 2008]. Its high inclination orbit (74�)allows for the simultaneous measurement of PMCs andtemperature in the Arctic for about a week each July. SABERon NASA’s Thermosphere, Ionosphere, Mesosphere, Ener-getics and Dynamics (TIMED) satellite retrieves kinetictemperature profiles in the Arctic mesosphere from the 15 mmband of CO2 [Remsberg et al., 2008]. SABER providestemperature profiles at latitudes up to 83� until about threeweeks after summer solstice, at which time the satellite yawsso that SABER does not observe in the polar summer.Recently, Sheese et al. [2011a] reported polar summer tem-peratures measured by OSIRIS on the Odin Satellite. Usingthe rotational structure of the O2 A-band, OSIRIS tempera-tures are reported at 88 km and above.[6] We herein compare SOFIE temperature profiles to
concurrent profiles from ACE, SABER and OSIRIS as wellas ground-based Fe lidar profiles from 69�N. Our compar-isons focus on the upper mesosphere and lower thermospherein the Arctic and Antarctic during the summer. Particularattention is given to finding observations for data sets that areco-located in both space and time. Many previous studies thatused earlier versions of the data have suggested a warm biasin SOFIE temperature retrievals in the upper mesosphere
[e.g., Hervig et al., 2009a; Hervig and Gordley, 2010;Siskind et al., 2011]. This study will focus on where andwhen the SOFIE data agree with other measurements andwhere and when they do not.[7] There are two objectives for the work presented here:
(1) present recent improvements to SOFIE temperatureretrievals resulting in the latest publicly released Version 1.2(v1.2) data set, and (2) compare SOFIE v1.2 temperatureprofiles against a variety of satellite and ground-based mea-surements to validate the new retrievals. This work isarranged as follows: in section 2 we discuss the SOFIE dataset and the measurement geometry. In section 3 we providedetails on the new SOFIE temperature retrievals and discussdifferences with the previous publicly released version(v1.03). In section 4 we compare SOFIE temperature obser-vations to other satellite and ground-based observations and
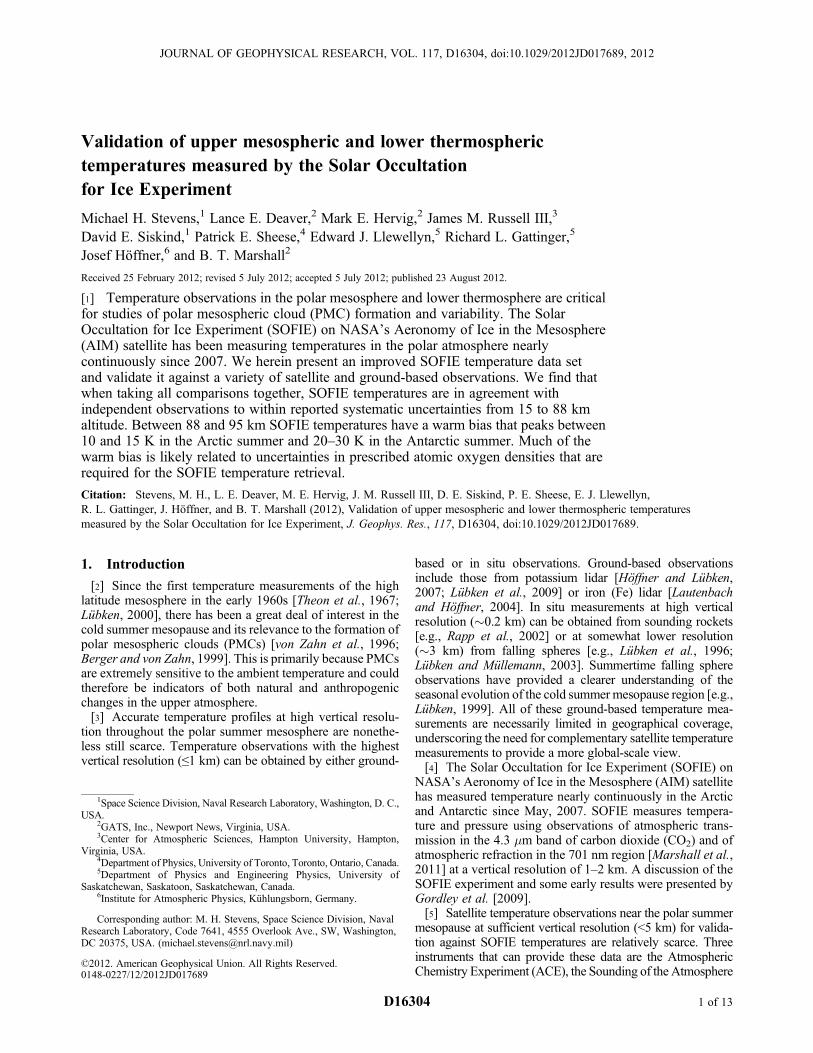
Figure 1. Comparison of SOFIE v1.03 and v1.2 temperatures in the Arctic summer. The profiles assembledfor the indicated time and place are coincident with Arctic SABER temperature observations (see Figure 4).
Table 1. SOFIE Temperature Uncertainties in the Polar Summer
Altitude(km)
Precision–OneScan (K)
O Profile(K)
CO2 Profile(K)
Totala
(K)
80 0.1 0.0 0.8 0.885 0.2 0.4 2.1 2.190 0.2 0.7 5.6 5.695 0.5 7.3 6.7 9.9
aQuadratic sum of O and CO2 uncertainty.
STEVENS ET AL.: VALIDATION OF SOFIE TEMPERATURES D16304D16304
2 of 13
in section 5 we summarize the results and offer possibleexplanations for any differences.
2. The SOFIE Observations
[8] The AIM satellite was launched on 25 April, 2007 into anearly circular sun-synchronous retrograde orbit with aninclination of 97.4� [Russell et al., 2009]. SOFIE observes 15solar occultations in the northern hemisphere and 15 in thesouthern hemisphere each day at latitudes between 66� (atsolstice) and 83� (at equinox) [Marshall et al., 2011]. Thelocal time (LT) at the tangent point for each of the occultationsis nearly constant at 23:00 in the northern hemisphere and01:30 in the southern hemisphere. SOFIE obtains temperatureprofiles between 15 km and 95 km in both hemispheres andcontinues to take data without significant interruption.[9] In this studywewill focus primarily on the altitude region
between 75 and 95 km, since this is the altitude region mostrelevant to PMC studies and the AIM science objectives.Temperatures measured by SOFIE were reported in manyprevious studies using earlier versions of the data [e.g.,Hervig et al., 2009a, 2009b;Gordley et al., 2009; Russell et al.,2009; Hervig and Gordley, 2010; Russell et al., 2010:Marshall et al., 2011; Sheese et al., 2011a; Siskind et al.,2011]. Most of these studies indicated that the SOFIE tem-peratures contained a warm bias of 7 K or more near themesopause. The new v1.2 SOFIE temperature retrievalsimprove on the v1.03 retrievals in many aspects discussedbelow. The v1.2 temperatures have not been validated againstany independent and concurrent measurements heretofore.
3. The SOFIE Version 1.2 Temperature Retrievals
[10] SOFIE temperature retrievals above 50 km use broad-band transmittance measurements in the 4.3 mm absorption
band of CO2. A detailed description of the SOFIE temperatureretrieval procedure including sensitivity studies and erroranalysis is found in Marshall et al. [2011] so we herein onlydiscuss recent improvements in the v1.2 algorithm. Theseimprovements can be categorized by field of view (FOV)corrections affecting the forward model and adjustments to theprescribed CO2 and atomic oxygen (O) profiles required forthe retrievals. They are discussed in order below.[11] The SOFIE Level 1 algorithm assigns latitude and
longitude to the occultation event, corrects the signals forinstrument effects, and registers the signals in altitude andpressure. The v1.2 data presented herein include a bettercharacterization of the FOV wings from analyzing data col-lected during scans of the solar disk. The new FOV analysisprovides a more accurate altitude registration and improvesthe forward model by accounting for both the vertical gra-dient in transmission and the variation in solar intensityacross the disk. In addition, new emissivity tables for thebroadband CO2 channels were computed on a finer verticalgrid, which improves the accuracy of the forward model.[12] As discussed in Marshall et al. [2011], SOFIE pro-
vides high quality results under the premise that the atmo-spheric CO2 and O profiles are well known. In thestratosphere the CO2 mixing ratio is near constant, howeverabove about 80 km molecular diffusion becomes importantand the mixing ratios decrease. It is in this region whereuncertainties in our knowledge of the CO2 vertical profile arelargest. Also, in this altitude region the radiative transfermodel must account for a CO2 vibrational state distributionthat is no longer determined strictly from local thermody-namic equilibrium (LTE) processes, and quenching by Omust therefore be considered. This is particularly importantin the vicinity of the polar summer mesopause and the lowerthermosphere.
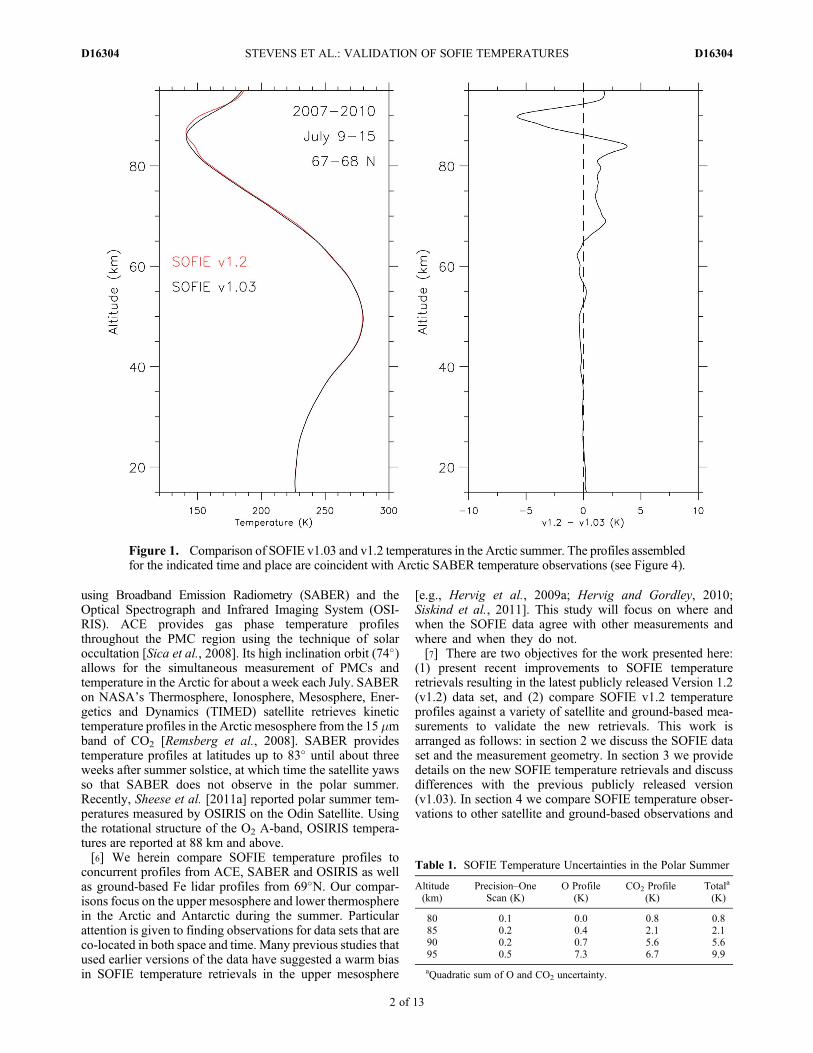
Figure 2. (left) Six SABER atomic oxygen (O) profiles in black obtained simultaneously with SOFIEobservations on 10 July 2010. MSIS O profiles used in the SOFIE temperature retrievals are shown inred. (middle) SOFIE retrieved temperatures using SABER O (black) and NRLMSISE-00 O (red). (right)Difference between SOFIE retrievals using NRLMSISE-00 O and SABER O. The average is shown in red.
STEVENS ET AL.: VALIDATION OF SOFIE TEMPERATURES D16304D16304
3 of 13
[13] The SOFIE v1.03 temperature retrieval algorithm hadan error that led to the forward model using incorrect CO2
and Omixing ratio profiles, which has been corrected in v1.2.For v1.2 we have also made adjustments to several rateconstants to make them consistent with values used in theSABER non-LTE algorithm. The non-LTE effects for SOFIEare explicitly modeled using the CO2 non-LTE modelsdeveloped for SABER [López-Puertas and Taylor, 2001;Mertens et al., 2001; Kutepov et al., 2006]. Note that thelower energy states of CO2 are relevant for the SOFIE 4.3 mmband in occultation whereas the upper energy states are rel-evant for the emission measurement of the SABER 15 mmband.[14] The improvements discussed above have resulted in
significant changes in the retrieved temperature profiles forv1.2. For both v1.03 and v1.2 the SOFIE temperatureretrievals extend up to 102 km, so that the approximationsused at the top of the retrievals have negligible impact to thetemperatures below 95 km shown herein. The differencebetween v1.2 and v1.03 temperatures in the Arctic summeris shown in Figure 1, where the temperatures at 90 km arenow reduced by 6 K in v1.2 compared to v1.03. We also
note from Figure 1 that temperatures near the PMC altitudeof 83 km are warmer compared to v1.03 by 4 K.[15] In order to better characterize the sensitivity of the
SOFIE retrieval to the prescribed CO2 and O profiles, weestimate the uncertainties in the retrieved temperatures dueto these important inputs and summarize the results inTable 1. The SOFIE v1.2 algorithm (as in all previous ver-sions) makes use of the O profile calculated from theNRLMSISE-00 empirical model [Picone et al., 2002]. Thescans assembled in Figure 1 are coincident with SABERscans both temporally and spatially (see section 4) so wehave compared six of these retrieved temperature profilesusing the NRLMSISE-00 O profiles and SABER O profilesand these results are shown in Figure 2. We find in all casesanalyzed, the SABER O profiles reduce the SOFIE temper-ature between 90 and 95 km. The effect is largest at 95 kmwhere the temperature is 7 K less and the SABER O is abouta factor of two to three larger than NRLMSISE-00. Weemphasize that comparisons of SABER O profiles to othermeasurements and empirical models in this altitude regionindicate that SABER O is larger by factors of 2–5 [Smithet al., 2010], which is greater than the O differences tested
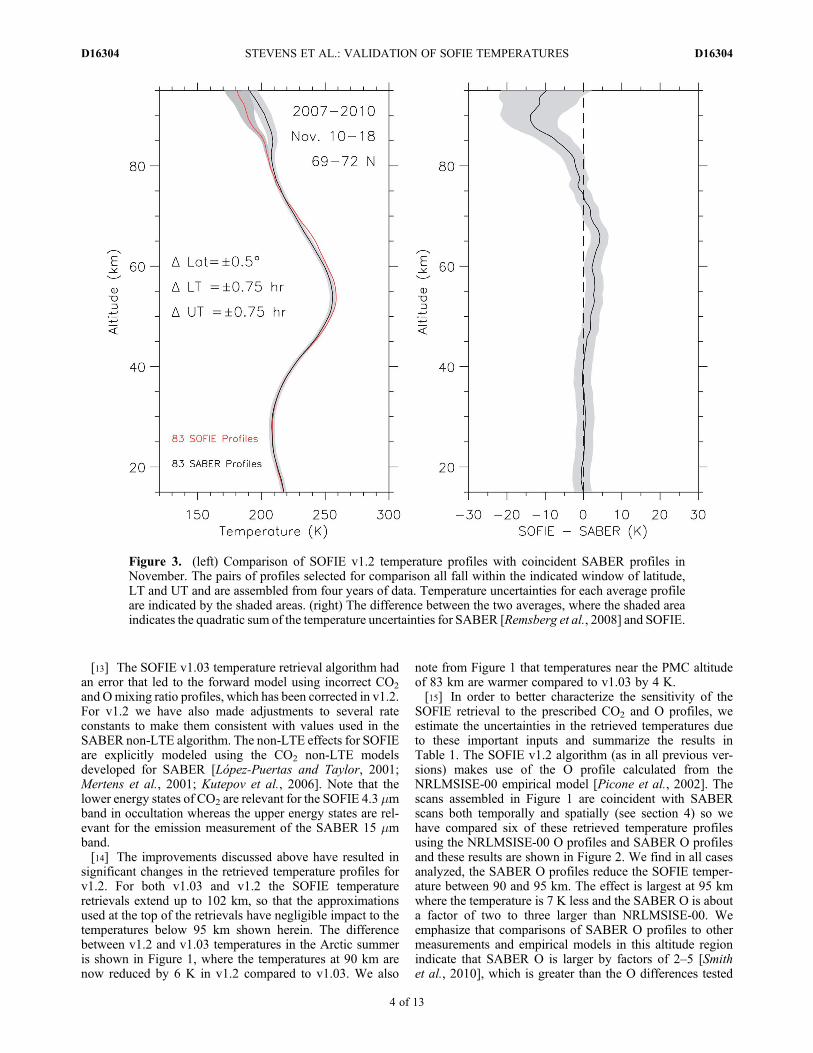
Figure 3. (left) Comparison of SOFIE v1.2 temperature profiles with coincident SABER profiles inNovember. The pairs of profiles selected for comparison all fall within the indicated window of latitude,LT and UT and are assembled from four years of data. Temperature uncertainties for each average profileare indicated by the shaded areas. (right) The difference between the two averages, where the shaded areaindicates the quadratic sum of the temperature uncertainties for SABER [Remsberg et al., 2008] and SOFIE.
STEVENS ET AL.: VALIDATION OF SOFIE TEMPERATURES D16304D16304
4 of 13
here. Moreover, Sheese et al. [2011b] found OSIRIS derivedO densities in the Arctic summer mesopause region are typ-ically larger than NRLMSISE-00 O densities by factors offive to ten and seasonal oscillations of O out of phase withNRLMSISE-00 O by six months. The determination of Odensities in this altitude region is beyond the scope of thispaper but it is clearly important to the retrieval of SOFIEtemperatures between 85 and 95 km.[16] SOFIE v1.2 temperature retrievals, like all previous
versions, use CO2 mixing ratio profiles from a climatologydeveloped from the Whole Atmosphere Community ClimateModel [Garcia et al., 2007]. Using the sensitivity study ofMarshall et al. [2011], we find that a 15% uncertainty in theCO2 mixing ratio at 95 km results in a 7 K uncertainty intemperature at that altitude.
4. Comparison With Concurrent Observations
[17] We now compare SOFIE mesospheric temperatureprofiles against results from three different satellite experi-ments observing during the Arctic summers of 2007–2010:ACE (version 3.0), SABER (version 2.00) and OSIRIS. Weselect the profiles from each data set that are as close as
possible in LT, latitude, and UT to the SOFIE observationsso as to minimize differences due to tides, latitudinal tem-perature gradients and temporal variations including theeffects of planetary waves. We also collect as many profilesas possible from each data set to minimize the statisticaluncertainty and to obtain a representative average from theobserved geophysical variability of the temperature profiles.[18] We divide the comparisons into three sections based
on the season and location of the observations. In section 4.1we compare SOFIE temperatures in the northern hemisphereto SABER observations outside of the PMC season inNovember. In section 4.2 we compare SOFIE temperatures inthe Arctic summer to SABER, ACE and OSIRIS observa-tions as well as ground-based Fe lidar observations. Finally,in section 4.3 we compare SOFIE temperatures in the Ant-arctic summer to SABER and ACE observations.
4.1. Arctic Autumn Temperatures
[19] The SABER observations precess in LT so that coin-cident observations with SOFIE are limited to specific daysof the year when the fixed LT of the SOFIE measurements isthe same as SABER. In mid-November there are a few daysduring which SABER and SOFIE are measuring nearly the
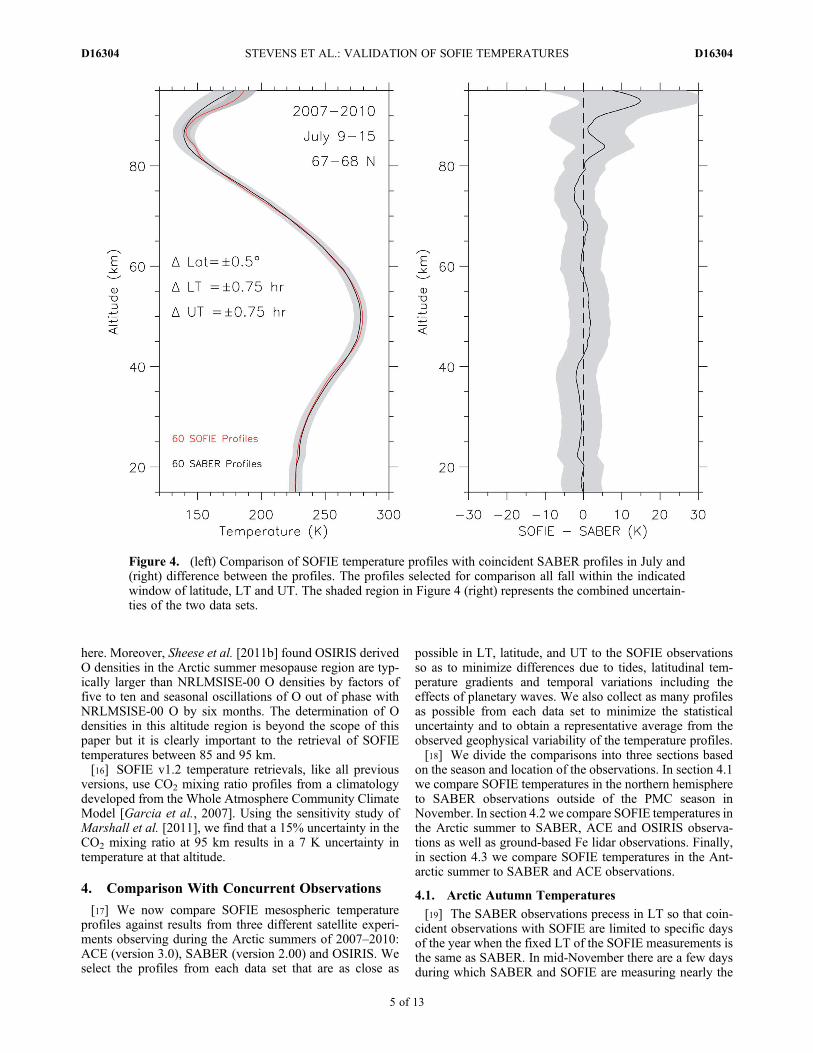
Figure 4. (left) Comparison of SOFIE temperature profiles with coincident SABER profiles in July and(right) difference between the profiles. The profiles selected for comparison all fall within the indicatedwindow of latitude, LT and UT. The shaded region in Figure 4 (right) represents the combined uncertain-ties of the two data sets.
STEVENS ET AL.: VALIDATION OF SOFIE TEMPERATURES D16304D16304
5 of 13
same parcels of air at the same time. Figure 3 shows a com-parison of SOFIE temperatures with concurrent SABERtemperature observations from 15 to 95 km. The miss dis-tance in latitude and the time differences are indicated andsmall enough so that each SOFIE scan used is paired with asingle SABER scan.[20] The SABER data used in these comparisons are from a
preliminary version of the next production release v2.0.These data differ from version 1.07 due to refinement of theoff-axis field of view (FOV) functions and changes to theforward model, of which the most important is the O volumemixing ratio (VMR) profile used in the vibrational tempera-ture model. These differences are typically less than 2 Kbelow 80 km but may exceed 5 K above, particularly for theupper mesosphere and lower thermosphere during polarsummer and polar winter. The SABER data used in thesecomparisons is expected to be within 1 K of publicly releasedv2.0 data below the middle mesosphere and within 5 K in theupper mesosphere and lower thermosphere. Details on theSABER temperatures will be provided in a forthcomingpublication.
[21] The vertical resolution of the SABER temperatureretrievals is �2 km [Remsberg et al., 2008], which is closeto the resolution of the SOFIE retrievals [Hervig et al.,2009a]. SABER systematic temperature uncertainties aretaken from Remsberg et al. [2008]. Random temperatureuncertainties of both SABER and SOFIE for the averagecomparisons in Figure 3 and all future satellite inter-comparisons herein are less than 1 K and not included (seeTable 1). The right hand panel shows the difference betweenthe two averaged profiles and the agreement is very goodbelow 75 km. Between 75 and 95 km SOFIE is colder thanSABER by 10–15 K, however this is nearly within thecombined uncertainty of the two instruments. The combineduncertainty shown as the shaded region in the right handpanel is the quadratic sum of the total SOFIE systematicuncertainty (Table 1) and the total SABER systematicuncertainty [Remsberg et al., 2008].
4.2. Arctic Summer Temperatures
[22] The polar summer mesosphere is the primary region ofscientific interest for the AIM mission so we focus on this
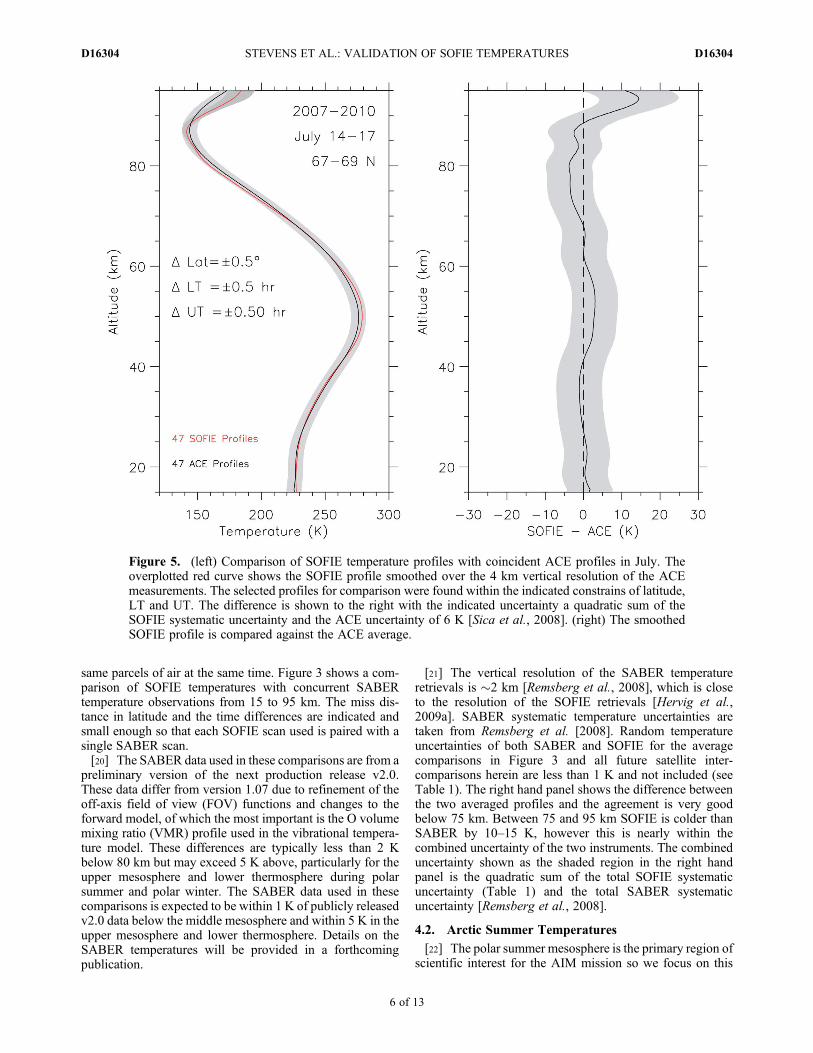
Figure 5. (left) Comparison of SOFIE temperature profiles with coincident ACE profiles in July. Theoverplotted red curve shows the SOFIE profile smoothed over the 4 km vertical resolution of the ACEmeasurements. The selected profiles for comparison were found within the indicated constrains of latitude,LT and UT. The difference is shown to the right with the indicated uncertainty a quadratic sum of theSOFIE systematic uncertainty and the ACE uncertainty of 6 K [Sica et al., 2008]. (right) The smoothedSOFIE profile is compared against the ACE average.
STEVENS ET AL.: VALIDATION OF SOFIE TEMPERATURES D16304D16304
6 of 13
region for the rest of our analysis. We compare SOFIE tem-peratures observed during the Arctic summer to three dif-ferent sets of satellite observations and one set of ground-based observations from 69�N. Figure 4 shows SOFIE tem-peratures compared to SABER temperatures from 15 to95 km altitude from July, 2007–2010. The agreement isexceptionally good and within reported combined systematicuncertainties at all altitudes. We note that the SABER sys-tematic temperature uncertainty is larger in the polar summerthan in November (Figure 3) [Remsberg et al., 2008]. Thegeophysical variability observed by SOFIE for one scan isabout 5 K at 80 km and 10 K at 90 km [Marshall et al., 2011].In Figure 4 (right) we show the difference between the twoprofiles and there is a suggestion that SOFIE temperatures aresystematically warmer than SABER temperatures by about10–15 K between 90 and 95 km altitude, but this is stillwithin the combined uncertainty of the two experiments. Thisapparent warm bias in the SOFIE temperatures is clarifiedfurther in comparisons with the ACE experiment.[23] Figure 5 shows a comparison of SOFIE and ACE
temperature profiles from July 14–17 assembled for the fouryears between 2007 and 2010. The ACE temperatureretrievals have a vertical resolution of about 4 km [Petelinaand Zasetsky, 2009] so we smooth the average SOFIE
profile by this amount prior to comparison with ACE. Theagreement is remarkably good for all altitudes from 15 kmup to 90 km and within the combined systematic uncertaintyof the two experiments. Between 90 and 95 km the differ-ence in the right hand panel shows that SOFIE temperaturesare systematically warmer than the ACE temperatures by10–15 K. These results are therefore very similar to thosefrom SABER in Figure 4.[24] Figure 6 shows a comparison of SOFIE and OSIRIS
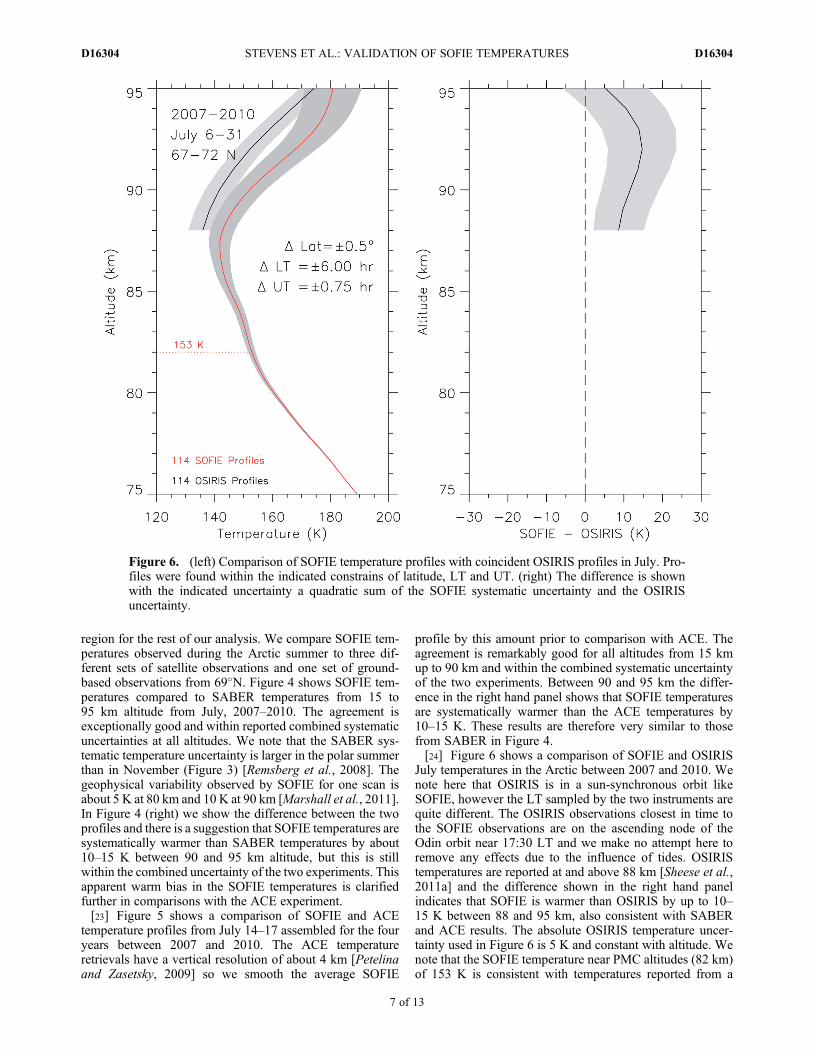
July temperatures in the Arctic between 2007 and 2010. Wenote here that OSIRIS is in a sun-synchronous orbit likeSOFIE, however the LT sampled by the two instruments arequite different. The OSIRIS observations closest in time tothe SOFIE observations are on the ascending node of theOdin orbit near 17:30 LT and we make no attempt here toremove any effects due to the influence of tides. OSIRIStemperatures are reported at and above 88 km [Sheese et al.,2011a] and the difference shown in the right hand panelindicates that SOFIE is warmer than OSIRIS by up to 10–15 K between 88 and 95 km, also consistent with SABERand ACE results. The absolute OSIRIS temperature uncer-tainty used in Figure 6 is 5 K and constant with altitude. Wenote that the SOFIE temperature near PMC altitudes (82 km)of 153 K is consistent with temperatures reported from a
Figure 6. (left) Comparison of SOFIE temperature profiles with coincident OSIRIS profiles in July. Pro-files were found within the indicated constrains of latitude, LT and UT. (right) The difference is shownwith the indicated uncertainty a quadratic sum of the SOFIE systematic uncertainty and the OSIRISuncertainty.
STEVENS ET AL.: VALIDATION OF SOFIE TEMPERATURES D16304D16304
7 of 13
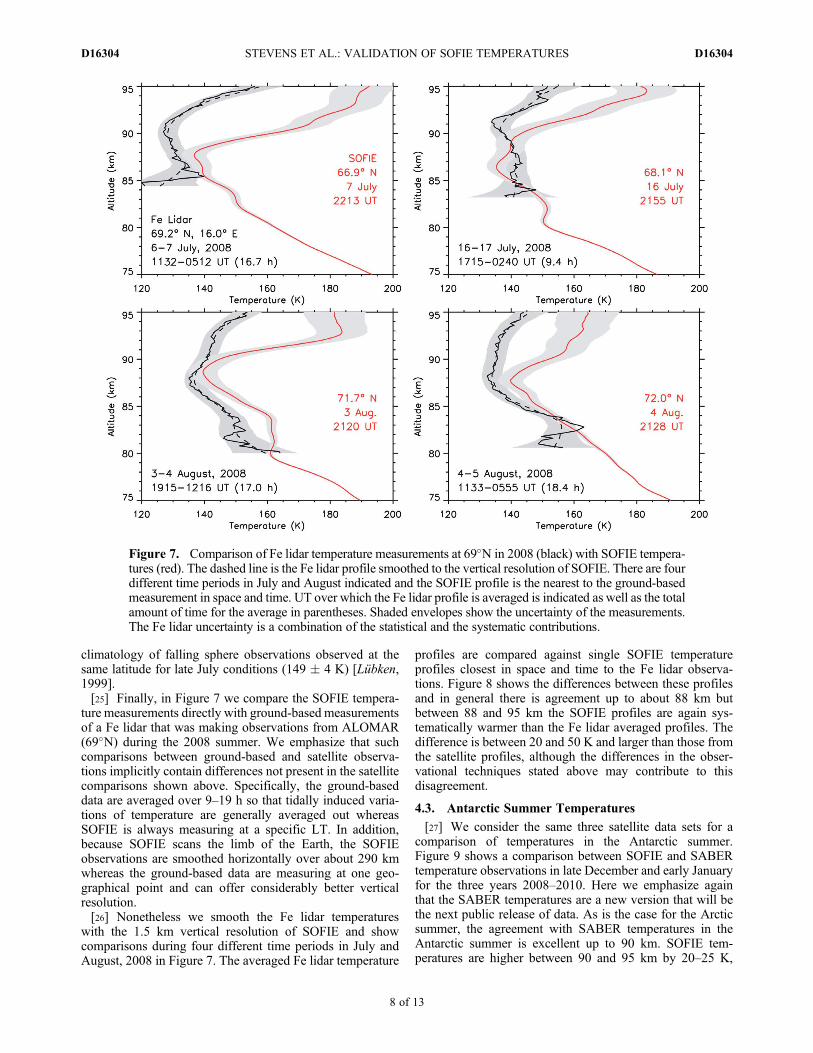
climatology of falling sphere observations observed at thesame latitude for late July conditions (149 � 4 K) [Lübken,1999].[25] Finally, in Figure 7 we compare the SOFIE tempera-
ture measurements directly with ground-based measurementsof a Fe lidar that was making observations from ALOMAR(69�N) during the 2008 summer. We emphasize that suchcomparisons between ground-based and satellite observa-tions implicitly contain differences not present in the satellitecomparisons shown above. Specifically, the ground-baseddata are averaged over 9–19 h so that tidally induced varia-tions of temperature are generally averaged out whereasSOFIE is always measuring at a specific LT. In addition,because SOFIE scans the limb of the Earth, the SOFIEobservations are smoothed horizontally over about 290 kmwhereas the ground-based data are measuring at one geo-graphical point and can offer considerably better verticalresolution.[26] Nonetheless we smooth the Fe lidar temperatures
with the 1.5 km vertical resolution of SOFIE and showcomparisons during four different time periods in July andAugust, 2008 in Figure 7. The averaged Fe lidar temperature
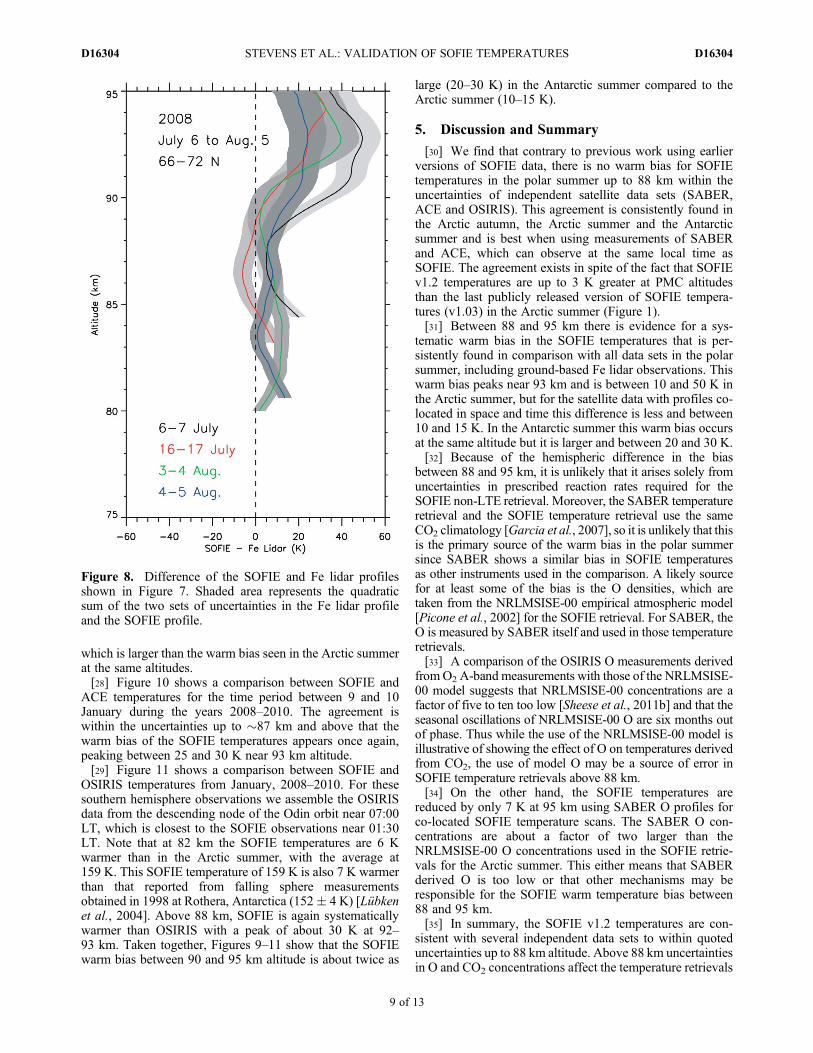
profiles are compared against single SOFIE temperatureprofiles closest in space and time to the Fe lidar observa-tions. Figure 8 shows the differences between these profilesand in general there is agreement up to about 88 km butbetween 88 and 95 km the SOFIE profiles are again sys-tematically warmer than the Fe lidar averaged profiles. Thedifference is between 20 and 50 K and larger than those fromthe satellite profiles, although the differences in the obser-vational techniques stated above may contribute to thisdisagreement.
4.3. Antarctic Summer Temperatures
[27] We consider the same three satellite data sets for acomparison of temperatures in the Antarctic summer.Figure 9 shows a comparison between SOFIE and SABERtemperature observations in late December and early Januaryfor the three years 2008–2010. Here we emphasize againthat the SABER temperatures are a new version that will bethe next public release of data. As is the case for the Arcticsummer, the agreement with SABER temperatures in theAntarctic summer is excellent up to 90 km. SOFIE tem-peratures are higher between 90 and 95 km by 20–25 K,
Figure 7. Comparison of Fe lidar temperature measurements at 69�N in 2008 (black) with SOFIE tempera-tures (red). The dashed line is the Fe lidar profile smoothed to the vertical resolution of SOFIE. There are fourdifferent time periods in July and August indicated and the SOFIE profile is the nearest to the ground-basedmeasurement in space and time. UT over which the Fe lidar profile is averaged is indicated as well as the totalamount of time for the average in parentheses. Shaded envelopes show the uncertainty of the measurements.The Fe lidar uncertainty is a combination of the statistical and the systematic contributions.
STEVENS ET AL.: VALIDATION OF SOFIE TEMPERATURES D16304D16304
8 of 13
which is larger than the warm bias seen in the Arctic summerat the same altitudes.[28] Figure 10 shows a comparison between SOFIE and
ACE temperatures for the time period between 9 and 10January during the years 2008–2010. The agreement iswithin the uncertainties up to �87 km and above that thewarm bias of the SOFIE temperatures appears once again,peaking between 25 and 30 K near 93 km altitude.[29] Figure 11 shows a comparison between SOFIE and
OSIRIS temperatures from January, 2008–2010. For thesesouthern hemisphere observations we assemble the OSIRISdata from the descending node of the Odin orbit near 07:00LT, which is closest to the SOFIE observations near 01:30LT. Note that at 82 km the SOFIE temperatures are 6 Kwarmer than in the Arctic summer, with the average at159 K. This SOFIE temperature of 159 K is also 7 K warmerthan that reported from falling sphere measurementsobtained in 1998 at Rothera, Antarctica (152� 4 K) [Lübkenet al., 2004]. Above 88 km, SOFIE is again systematicallywarmer than OSIRIS with a peak of about 30 K at 92–93 km. Taken together, Figures 9–11 show that the SOFIEwarm bias between 90 and 95 km altitude is about twice as
large (20–30 K) in the Antarctic summer compared to theArctic summer (10–15 K).
5. Discussion and Summary
[30] We find that contrary to previous work using earlierversions of SOFIE data, there is no warm bias for SOFIEtemperatures in the polar summer up to 88 km within theuncertainties of independent satellite data sets (SABER,ACE and OSIRIS). This agreement is consistently found inthe Arctic autumn, the Arctic summer and the Antarcticsummer and is best when using measurements of SABERand ACE, which can observe at the same local time asSOFIE. The agreement exists in spite of the fact that SOFIEv1.2 temperatures are up to 3 K greater at PMC altitudesthan the last publicly released version of SOFIE tempera-tures (v1.03) in the Arctic summer (Figure 1).[31] Between 88 and 95 km there is evidence for a sys-
tematic warm bias in the SOFIE temperatures that is per-sistently found in comparison with all data sets in the polarsummer, including ground-based Fe lidar observations. Thiswarm bias peaks near 93 km and is between 10 and 50 K inthe Arctic summer, but for the satellite data with profiles co-located in space and time this difference is less and between10 and 15 K. In the Antarctic summer this warm bias occursat the same altitude but it is larger and between 20 and 30 K.[32] Because of the hemispheric difference in the bias
between 88 and 95 km, it is unlikely that it arises solely fromuncertainties in prescribed reaction rates required for theSOFIE non-LTE retrieval. Moreover, the SABER temperatureretrieval and the SOFIE temperature retrieval use the sameCO2 climatology [Garcia et al., 2007], so it is unlikely that thisis the primary source of the warm bias in the polar summersince SABER shows a similar bias in SOFIE temperaturesas other instruments used in the comparison. A likely sourcefor at least some of the bias is the O densities, which aretaken from the NRLMSISE-00 empirical atmospheric model[Picone et al., 2002] for the SOFIE retrieval. For SABER, theO is measured by SABER itself and used in those temperatureretrievals.[33] A comparison of the OSIRIS O measurements derived
fromO2 A-band measurements with those of the NRLMSISE-00 model suggests that NRLMSISE-00 concentrations are afactor of five to ten too low [Sheese et al., 2011b] and that theseasonal oscillations of NRLMSISE-00 O are six months outof phase. Thus while the use of the NRLMSISE-00 model isillustrative of showing the effect of O on temperatures derivedfrom CO2, the use of model O may be a source of error inSOFIE temperature retrievals above 88 km.[34] On the other hand, the SOFIE temperatures are
reduced by only 7 K at 95 km using SABER O profiles forco-located SOFIE temperature scans. The SABER O con-centrations are about a factor of two larger than theNRLMSISE-00 O concentrations used in the SOFIE retrie-vals for the Arctic summer. This either means that SABERderived O is too low or that other mechanisms may beresponsible for the SOFIE warm temperature bias between88 and 95 km.[35] In summary, the SOFIE v1.2 temperatures are con-
sistent with several independent data sets to within quoteduncertainties up to 88 km altitude. Above 88 km uncertaintiesin O and CO2 concentrations affect the temperature retrievals
Figure 8. Difference of the SOFIE and Fe lidar profilesshown in Figure 7. Shaded area represents the quadraticsum of the two sets of uncertainties in the Fe lidar profileand the SOFIE profile.
STEVENS ET AL.: VALIDATION OF SOFIE TEMPERATURES D16304D16304
9 of 13
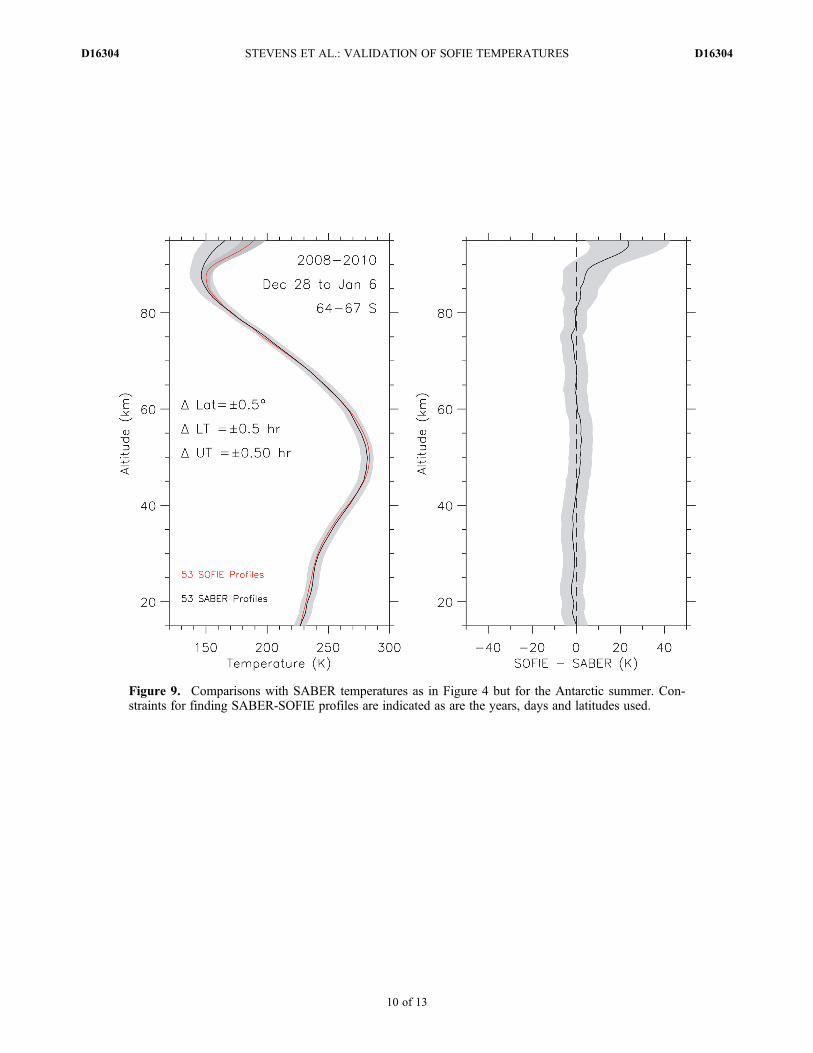
Figure 9. Comparisons with SABER temperatures as in Figure 4 but for the Antarctic summer. Con-straints for finding SABER-SOFIE profiles are indicated as are the years, days and latitudes used.
STEVENS ET AL.: VALIDATION OF SOFIE TEMPERATURES D16304D16304
10 of 13
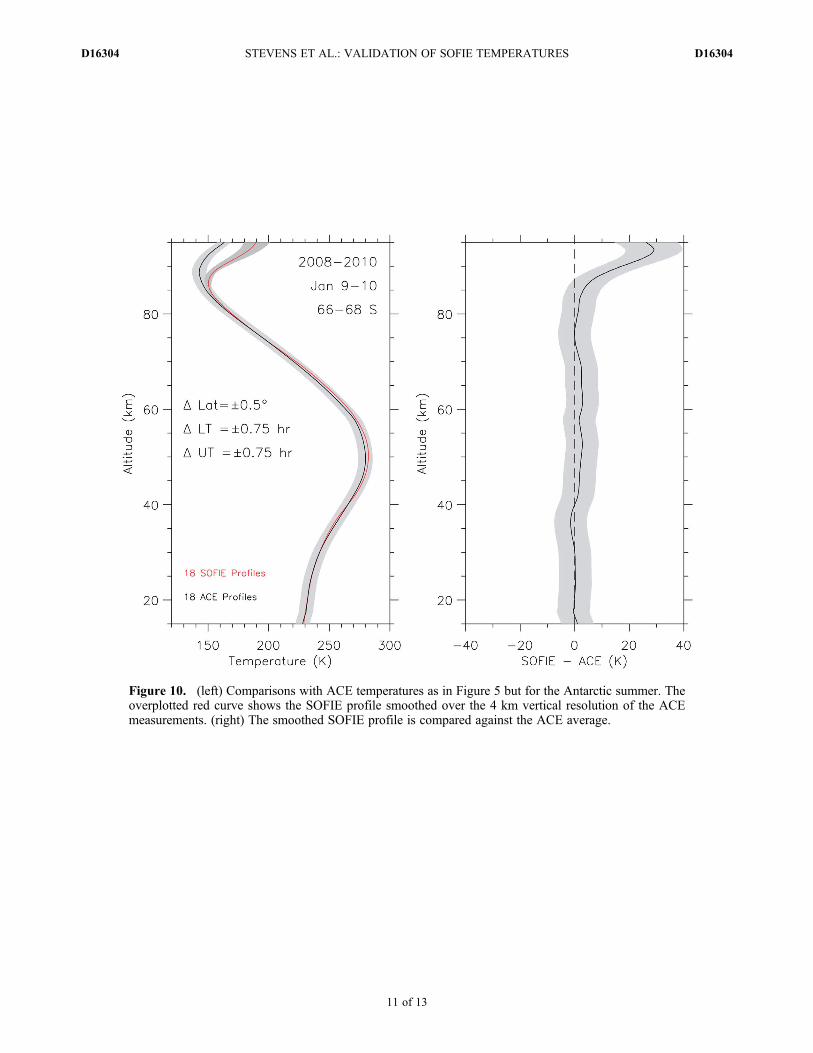
Figure 10. (left) Comparisons with ACE temperatures as in Figure 5 but for the Antarctic summer. Theoverplotted red curve shows the SOFIE profile smoothed over the 4 km vertical resolution of the ACEmeasurements. (right) The smoothed SOFIE profile is compared against the ACE average.
STEVENS ET AL.: VALIDATION OF SOFIE TEMPERATURES D16304D16304
11 of 13
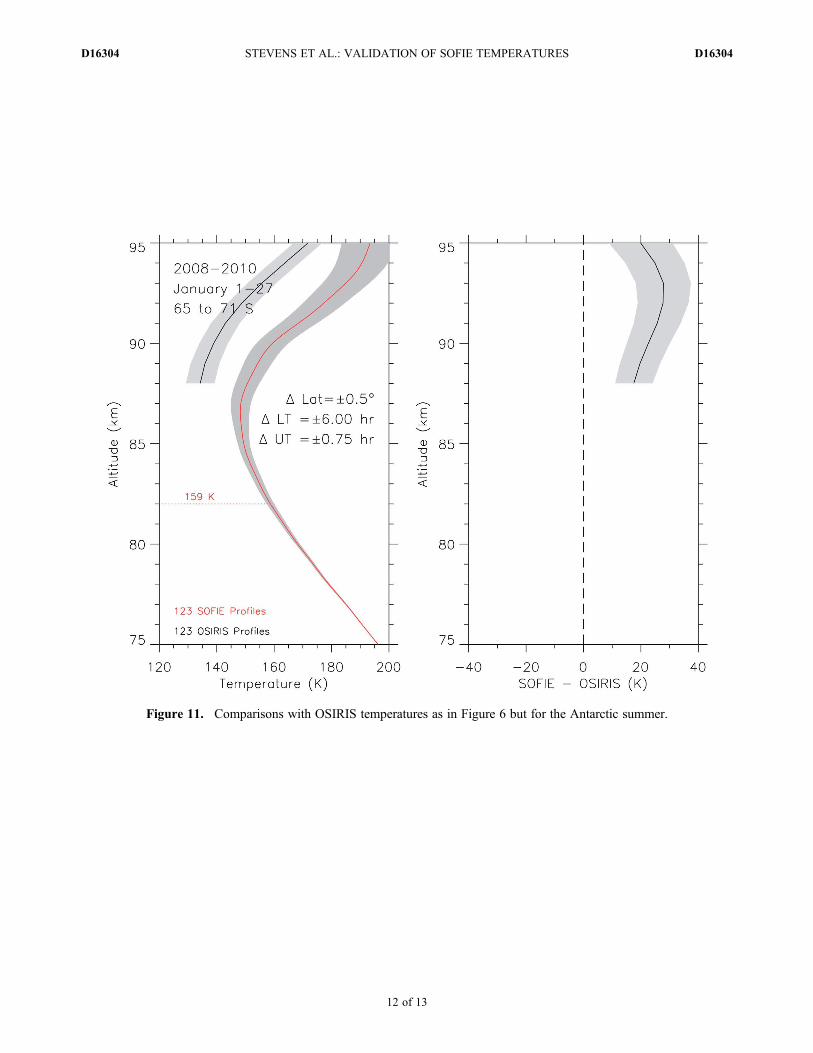
Figure 11. Comparisons with OSIRIS temperatures as in Figure 6 but for the Antarctic summer.
STEVENS ET AL.: VALIDATION OF SOFIE TEMPERATURES D16304D16304
12 of 13
significantly, most likely leading to a warm bias in the SOFIEtemperatures of 10–15 K in the Arctic summer and 20–30 Kin the Antarctic summer. Further progress on the SOFIEtemperature retrievals can be made when the local O and CO2
concentrations between 88 and 95 km are better constrained.
[36] Acknowledgments. Funding of this research was provided byNASA’s Small Explorers Program under contract NAS5–03132 that sup-ports the implementation of the AIM mission. The Atmospheric ChemistryExperiment (ACE), also known as SCISAT, is a Canadian-led missionmainly supported by the Canadian Space Agency. We thank AndrewKochenash for his assistance in the analysis of SABER temperatures.
ReferencesBerger, U., and U. von Zahn (1999), The two-level structure of the meso-pause: A model study, J. Geophys. Res., 104, 22,083–22,093,doi:10.1029/1999JD900389.
Garcia, R. R., D. R. Marsh, D. E. Kinnison, B. A. Boville, and F. Sassi(2007), Simulations of secular trends in the middle atmosphere, 1950–2003, J. Geophys. Res., 112, D09301, doi:10.1029/2006JD007485.
Gordley, L. L., et al. (2009), The solar occultation for ice experiment,J. Atmos. Sol. Terr. Phys., 71, 300–315, doi:10.1016/j.jastp.2008.07.012.
Hervig, M. E., and L. L. Gordley (2010), Temperature, shape, and phase ofmesospheric ice from Solar Occultation for Ice Experiment observations,J. Geophys. Res., 115, D15208, doi:10.1029/2010JD013918.
Hervig, M. E., et al. (2009a), Relationships between polar mesosphericclouds, temperature, and water vapor from Solar Occultation for IceExperiment (SOFIE) observations, J. Geophys. Res., 114, D20203,doi:10.1029/2009JD012302.
Hervig, M. E., L. L. Gordley, J. M. Russell III, and S. M. Bailey (2009b),SOFIE PMC observations during the northern summer of 2007, J. Atmos.Sol. Terr. Phys., 71, 331–339, doi:10.1016/j.jastp.2008.08.010.
Höffner, J., and F.-J. Lübken (2007), Potassium lidar temperatures and den-sities in the mesopause region at Spitsbergen (78�N), J. Geophys. Res.,112, D20114, doi:10.1029/2007JD008612.
Kutepov, A. A., et al. (2006), SABER temperature observations in the sum-mer polar mesosphere and lower thermosphere: Importance of accountingfor the CO2 n2 quanta V–V exchange, Geophys. Res. Lett., 33, L21809,doi:10.1029/2006GL026591.
Lautenbach, J., and J. Höffner (2004), Scanning iron temperature lidar formesopause temperature observation, Appl. Opt., 43, 4559–4563,doi:10.1364/AO.43.004559.
López-Puertas, M., and F. W. Taylor (2001), Non-LTE Radiative Transferin the Atmosphere, World Sci., Singapore, doi:10.1142/9789812811493.
Lübken, F.-J. (1999), Thermal structure of the Arctic summer mesosphere,J. Geophys. Res., 104, 9135–9149.
Lübken, F.-J. (2000), Nearly zero temperature trend in the polar summermesosphere, Geophys. Res. Lett., 27, 3603–3606, doi:10.1029/2000GL011893.
Lübken, F.-J., and A. Müllemann (2003), First in situ temperature mea-surements in the summer mesosphere at very high latitudes (78�N),J. Geophys. Res., 108(D8), 8448, doi:10.1029/2002JD002414.
Lübken, F.-J., K.-H. Fricke, and M. Langer (1996), Noctilucent cloudsand the thermal structure near the Arctic mesopause in the summer,J. Geophys. Res., 101, 9489–9508, doi:10.1029/96JD00444.
Lübken, F.-J., A. Müllemann, and M. J. Jarvis (2004), Temperatures andhorizontal winds in the Antarctic summer mesosphere, J. Geophys.Res., 109, D24112, doi:10.1029/2004JD005133.
Lübken, F.-J., J. Lautenbach, J. Höffner, M. Rapp, and M. Zecha (2009),First continuous temperature measurements within polar mesospheresummer echoes, J. Atmos. Sol. Terr. Phys., 71, 453–463, doi:10.1016/j.jastp.2008.06.001.
Marshall, B. T., et al. (2011), Retrieval of temperature and pressure usingbroadband solar occultation: SOFIE approach and results, Atmos. Meas.Tech., 4, 893–907, doi:10.5194/amt-4-893-2011.
Mertens, C. J., et al. (2001), Retrieval of mesospheric and lower thermo-spheric kinetic temperature from measurements of CO2 15 mm Earth limbemission under non-LTE conditions, Geophys. Res. Lett., 28, 1391–1394,doi:10.1029/2000GL012189.
Petelina, S. V., and A. Y. Zasetsky (2009), Temperature of mesospheric iceretrieved from the O-H stretch band, Geophys. Res. Lett., 36, L15804,doi:10.1029/2009GL038488.
Picone, J. M., A. E. Hedin, D. P. Drob, and A. C. Aikin (2002),NRLMSISE-00 empirical model of the atmosphere: Statistical comparisonsand scientific issues, J. Geophys. Res., 107(A12), 1468, doi:10.1029/2002JA009430.
Rapp, M., F.-J. Lübken, A. Mullemann, G. E. Thomas, and E. J. Jensen(2002), Small-scale temperature variations in the vicinity of NLC: Exper-imental and model results, J. Geophys. Res., 107(D19), 4392, doi:10.1029/2001JD001241.
Remsberg, E. E., et al. (2008), Assessment of the quality of the Version1.07 temperature-versus-pressure profiles of the middle atmospherefrom TIMED/SABER, J. Geophys. Res., 113, D17101, doi:10.1029/2008JD010013.
Russell, J. M., III, et al. (2009), The Aeronomy of Ice in the Mesosphere(AIM) mission: Overview and early science results, J. Atmos. Sol. Terr.Phys., 71, 289–299, doi:10.1016/j.jastp.2008.08.011.
Russell, J. M., III, P. Rong, S. M. Bailey, M. E. Hervig, and S. V. Petelina(2010), Relationship between the summer mesopause and polar meso-spheric cloud heights, J. Geophys. Res., 115, D16209, doi:10.1029/2010JD013852.
Sheese, P. E., E. J. Llewellyn, R. L. Gattinger, A. E. Bourassa, D. A.Degenstein, N. D. Lloyd, and I. C. McDade (2011a), Mesopause tempera-tures during the polar mesospheric cloud season, Geophys. Res. Lett., 38,L11803, doi:10.1029/2011GL047437.
Sheese, P. E., I. C. McDade, R. L. Gattinger, and E. J. Llewellyn (2011b),Atomic oxygen densities retrieved from Optical Spectrograph and Infra-red Imaging System observations of O2 A-band airglow emission in themesosphere and lower thermosphere, J. Geophys. Res., 116, D01303,doi:10.1029/2010JD014640.
Sica, R. J., et al. (2008), Validation of the Atmospheric Chemistry Experi-ment (ACE) version 2.2 temperature using ground-based and space-bornemeasurements, Atmos. Chem. Phys., 8, 35–62, doi:10.5194/acp-8-35-2008.
Siskind, D. E., et al. (2011), Consequences of recent Southern Hemispherewinter variability on polar mesospheric clouds, J. Atmos. Sol. Terr. Phys.,73, 2013–2021, doi:10.1016/j.jastp.2011.06.014.
Smith, A. K., D. R. Marsh, M. G. Mlynczak, and J. C. Mast (2010),Temporal variations of atomic oxygen in the upper mesosphere fromSABER, J. Geophys. Res., 115, D18309, doi:10.1029/2009JD013434.
Theon, J. S., W. Nordberg, L. B. Katchen, and J. J. Horvath (1967), Someobservations on the thermal behavior of the mesosphere, J. Atmos. Sci.,24, 428–438, doi:10.1175/1520-0469(1967)024<0428:SOOTTB>2.0.CO;2.
von Zahn, U., J. Höffner, V. Eska, and M. Alpers (1996), The mesopausealtitude: Only two distinctive levels worldwide?, Geophys. Res. Lett.,23, 3231–3234, doi:10.1029/96GL03041.
STEVENS ET AL.: VALIDATION OF SOFIE TEMPERATURES D16304D16304
13 of 13


![THERMOSPHERE MODEL EVALUATION AT LOW ALTITUDE WITH …€¦ · thermospheric-data). Whereas paper [6] compared GOCE densities (data version 1_0) to models mainly for validation purposes](https://img.pdfslide.us/doc/110x75/5fc8a03eb586e7770a2b5663/thermosphere-model-evaluation-at-low-altitude-with-thermospheric-data-whereas.jpg)