Embed Size (px)
Citation preview
A c t a T h e r i o l o g i c a 42 (4): 387-397 , 1997. PL ISSN 0001-7051
Validation of two new total body electrical conductivity (TOBEC) instruments for estimating body composition of
live northern red-backed voles Clethrionomys rutilus
Gerald L. ZUERCHER, Daniel D. ROBY* and Eric A. REXSTAD
Zuercher G. L., Roby D. D. and Rexstad E. A. 1997. Validation of two new total body electrical conductivity (TOBEC) instruments for estimating body composition of live northern red-backed voles Clethrionomys rutilus. Acta Theriologica 42: 387-397.
Total body electrical conductivity (TOBEC) is a method for non-destructively esti-mating body composition. We sought to monitor seasonal changes in total body fat in northern red-backed voles Clethrionomys rutilus (Pallas, 1779), a microtine (10-45 g). We validated two new TOBEC instruments: the SA-3000 by EM-SCAN Inc. and the ACAN-2 by Jagmar Inc. Both instruments explained 94% of the variation in lean body mass and total body water. However, accuracy of fat estimates generated from lean mass predictions was poor for both instruments (± > 100%). Two instrument-specific multiple regression models and a TOBEC-free multiple regression model were used to estimate total body fat. All three improved the ability to predict total body fat in C. rutilus. These two TOBEC instruments can not be used to measure changes in total body fat of individual C. rutilus due to the small amount of fat reserves and lack of seasonal variation.
Department of Biology and Wildlife, Institute of Arctic Biology, and Alaska Cooper-ative Fish and Wildlife Research Unit (Biological Resources Division, U.S. Geological Survey), University of Alaska Fairbanks, Fairbanks, AK 99775, U.S.A.
Key words', energetics, fat, microtines, non-invasive, rodents
Introduction
Seasonal patterns of fat deposition and catabolism can be used to infer energy balance of individual mammals and identify periods of the annual cycle when energy requirements exceed resource availability. Seasonal and annual variation in fat reserves and lean body mass of individuals can be used to relate differences in food availability and maintenance costs to survivorship and productivity of populations (Robbins 1983). This approach provides a link between the physio-logical ecology of individuals and the demography of populations comprising those individuals.
* Correspondence address: Oregon Cooperative Wildlife Research Unit, 104 Nash Hall, Oregon State University, Corvallis, OR 97331-3803, U.S.A.; e-mail: [email protected]
[387]
388 G. L. Zuercher at al.
The best means to monitor seasonal changes in body composition of a population is to non-destructively measure body composition in a sample of individuals repeatedly throughout the annual cycle. Until recently, this was not possible because the only reliable method for measuring body composition entailed killing subjects and analyzing proximate composition of carcasses (Roby 1991). Total body electrical conductivity (TOBEC) is a recently developed technique that non-de-structively and non-invasively estimates body composition using the difference in electrical properties of lean tissue and body fat (Keim et al. 1988). Lean tissue is a good electrical conductor because of the high content of water and electrolytes, whereas adipose tissue is nearly anhydrous and is a poor conductor of electrical current. Therefore, the amount of lean tissue in a body determines its conductive potential. TOBEC analysis is quick, painless, and poses little risk of stress to the subject. TOBEC provides an index to lean body mass and, together with total body mass, can be used to estimate total body fat. TOBEC has been an accurate method of measuring body composition when care is taken to insure tha t the subject is: (1) properly positioned, (2) not hyperthermic, and (3) normally hydrated (Roby 1991).
TOBEC analysis has demonstrated considerable potential as a means of estimating body composition in live subjects (Bracco et al. 1983, Walsberg 1988). A validation on laboratory rats produced a high correlation (r = 0.97) between fat-free mass, determined through proximate analysis, and the TOBEC index to lean body mass (Bracco et al. 1983). Walsberg (1988), combining data from several species of small rodents, obtained a high correlation (r = 0.996) between lean body mass and TOBEC numbers. A new TOBEC instrument (ACAN-2 by Jagmar Inc., Krakow, Poland) has recently been developed for use in studying variation in lean body mass and fat content in two species of mice, Apodemus agrarius and A. flavicollis (Froncisz et al. 1994). A similar instrument (SA-3000 by EM-SCAN, Inc., Springfield, Illinois, U.S.A.) also has been developed for measurement of small mammals.
The purpose of this study was to assess the absolute and relative accuracy of these two new TOBEC ins t ruments for measuring body composition of live northern red-backed voles Clethrionomys rutilus (Pallas, 1779). Although there are several published validations of TOBEC for estimating body composition of wild birds (Walsberg 1988, Castro et al. 1990, Roby 1991, Scott et al. 1991, Asch and Roby 1995), there are few for wild mammals. Walsberg (1988) validated the EM-SCAN SA-1 TOBEC instrument by combining several rodent species, but failed to validate the technique on a single species. The developers of the ACAN-2 instrument have validated this instrument separately for two species of Apodemus (Froncisz et al. 1994). Koteja (1996) also validated the ACAN-2 on Mus musculus and C. glareolus. A detailed description of the ACAN-2 is provided by Piasecki et al. (1995). With the exception of the validations by Froncisz et al. (1994) and Koteja (1996), instrument calibrations on mammals as small as northern red-backed voles (mass range 10-45 g) have not been published.
TOBEC estimates of vole body composition 389
We validated two new TOBEC instruments for their ability to predict lean body mass, total body water, and total body fat in northern red-backed voles. By comparing the results of TOBEC analyses from both instruments with those from proximate analysis, we determined the relative accuracy of each instrument for measuremen t of live animal composition. If one or both ins t ruments were sufficiently accurate, it would allow us to monitor seasonal changes in body composition of individual voles and potentially link fat reserves with attributes of fitness such as survival and reproduction.
Materials and methods
A n i m a l c o l l e c t i o n
Fifty C. rutilus were live-trapped in boreal forest on the University of Alaska Fairbanks campus dur ing J u n e and July, 1994. Voles were caught at four sites using either Sherman live-traps or Ugglan multiple capture live-traps. Traps were baited with a mixture of peanut but ter and oatmeal and examined twice daily (06.00 and 18.00). Each captured vole was weighed with a Pesola spring scale (± 0.5 g), sexed, reproductive s ta tus recorded (eg, descended testicles or lactating), and placed in a wooden container for temporary holding. After all t raps were examined, voles were immediately t ransported to the laboratory. Twenty-five live-trapped voles were subjected to one of two t rea tments to ensure a wide range of total body mass and total body fat in subjects used for TOBEC validations. The two t r ea tmen t s consisted of housing subjects outdoors in 76 liter glass ter rar ia with ad libitum food (Purina mouse chow, mixture of peanut but ter and oatmeal, blueberries) and water for ei ther 14 (n = 13 voles) or 7 (n - 12 voles) days. All other voles (n = 25) were transported to the laboratory for TOBEC analysis immediately after capture.
TOBEC m e a s u r e m e n t
Two TOBEC analyzers, the SA-3000 Multi-Detector Small Animal Body Composition Analysis System with an SA-3030 detection chamber (EM-SCAN, Inc., Springfield, Illinois, U.S.A.) and the ACAN-2 Small Animal Body Composition Analyzer with an MC-0038 chamber (Jagmar Inc., Krakow, Poland), were validated for use in measuring body composition of live C. rutilus. Prior to meas-urement of TOBEC, live-trapped voles were anesthetized (Walsberg 1988) in a glass ja r containing cotton soaked with Metofane. Each individual was then placed on a Mettler analytical balance (± 0.005 g) and rectal tempera ture was measured with a BAT-12 thermocouple thermometer. Each subject was then placed in the ACAN-2 i n s t r u m e n t and a min imum of six repl icate TOBEC measurements were taken. Although subjects were anesthetized, they were also restrained within the subject carrier provided with the instrument. Each individual was then placed in the EM-SCAN SA-3000 and a minimum of six replicate TOBEC measurements were taken. Due to constant drift in the SA-3000 ins t rument , up to ten replicate readings were taken for each individual, provided the subject remained still under the influence of the anesthesia. Immediately af ter measuring TOBEC with the two ins t ruments , each subject was euthanized in a glass j a r containing cotton balls soaked in Halothane. Voles were reweighed and three morphological measurements were taken. Total length and tail length (± 1.0 mm) were measured by laying the dorsal side of the subject on a 150 mm ruler. Right hind foot length (± 1.0 mm) was measured from the calcaneum to the toe tip by placing the raised foot agains t a 150 mm ruler. Vole carcasses were placed in plastic bags and frozen a t -20°C until proximate analysis was performed. All protocols involving live animals were approved by the Inst i tut ional Animal Care and Use Committee (IACUC) a t the University of Alaska Fairbanks.
390 G. L. Zuercher at al.
C a r c a s s a n a l y s i s
Vole carcasses were thawed, skinned, and their reproductive organs examined to determine reproductive s tatus. Reproductive activity in females was determined by the presence of any of the following: embryos, placental scars, lactation, or open vagina. Reproductive activity in males was determined by the presence of descended testicles > 5 mm in length. Carcasses were sectioned to increase drying rate, placed in a forced-air convection oven, and dried to constant mass at 60°C. Total body water (TBW) was determined by subtracting the dried carcass mass from the total body mass (TBM), measured immediately after death. Dried carcasses were ground and homogenized with a mortar and pestle and stored in a freezer (-20°C) until fat extraction was performed. Each ground carcass was divided into 2 - 4 subsamples, each of 2 .0-2 .5 g, and the entire carcass was extracted. Total fat was extracted from samples using a Soxtec HT-12 soxhlet appara tus (Tecator, Inc., Herndon, Virginia, U.S.A.) and petroleum ether as the solvent system (Dobush et al. 1985). Lean body mass (LBM) was determined from the difference between total body mass (measured immediately af ter death) and total body fat.
A n a l y t i c a l m e t h o d s
Means for total body mass, lean body mass, and total body fat were calculated for the two t rea tments and the control. Data did not depart significantly from normality. Analysis of var iance was performed on each to determine any significant differences in overall body composition related to t rea tment .
Average TOBEC number for each subject from each of the two ins t ruments was calculated from the replicate measurements . The relationship between average TOBEC number, lean body mass (LBM), and total body water (TBW) were determined through a series of l inear and curvil inear regressions, and residuals were examined for homoscedasticity (Table 1). Final linear regression models for both LBM and TBW used the natura l log (In) of the square root (V~) of the average TOBEC number as the dependent variable and either LBM or TBW as the independent variable. An est imate of total body fat was made from the difference between total body mass (measured immediately af ter death) and TOBEC-estimated lean mass.
The relat ionship between average TOBEC number and total body fat was determined using instrument-specific multiple regression models. Both models used total body fat as the dependent variable and TOBEC, total body mass, and total body length as independent variables (Morton et al. 1993, Skagen et al. 1993). Mean percent error in est imates of total body fat were determined from all regressions by the equation:
Z( | TBF - Estimated TBF | / TBF x 100) / n (1)
and used to evaluate the models. Residuals about the regression of TOBEC on lean body mass and total body water were examined by analysis of variance (ANOVA) using sex, reproductive s ta tus , and
Table 1. Comparison of regression models used to predict lean body mass (LBM) of C. rutilus from the ACAN-2 TOBEC instrument .
Regression type r 2 F-statistic p-value Homoscedastic
(Yes/Not)
Linear 0.9104 FI,48 = 487.47 < 0.001 N 2nd Order Polynomial 0.9362 ^2,47 = 344.89 < 0.001 N vacan # 0.9387 FI,48 = 734.50 < 0.001 N In (ACAN#) 0.9424 Fi,48 = 785.71 < 0.001 N ln(ACAN#) & ln(LBM) 0.9356 Fi,4 8 = 696.89 < 0.001 N In (VACAN#) 0.9424 Fi,48 = 785.96 < 0.001 Y
TOBEC est imates of vole body composition 391
t reatment , as well as a regression against body temperature, to determine if these variables significantly affected the accuracy of TOBEC measurements. Systat 5.2 and StatWorks 1.0 were used for the statistical analyses.
Results
Analysis of variance showed no effect of duration of captivity on either TBM or LBM (TBM: F2,47 = 2.7538, p = 0.074, n = 50; LBM: F2,47 = 0.5976, p = 0.554, n = 50). This treatment did, however, explain a significant portion of the variation in total body fat (TBF) {Fim = 85.3489, p < 0.001, n = 50). Mean total body fat in 14-day captive voles was 4.0844 ± 1.1134 g (15.49% of TBM); TBF in 7-day captive voles averaged 2.0891 ± 0.7780 g (8.19% of TBM), while wild-caught voles averaged 0.8267 ± 0.0838 g TBF (3.80% of TBM).
Gender did not enter into any predictive models due to the lack of sex differences within the sample. Total body mass in the sample of males averaged 22.6 g (SD = 5.78, range 14.31-34.93 g, n = 28), while females averaged 25.8 g (SD = 8.76, range 10.57-40.26 g, n = 22); these differences were not significantly different (t = 1.147, p = 0.264). Similarly there was no gender difference in LBM (males: mean = 20.46, SD = 4.61, range 13.93-30.16, n = 28; females: mean = 23.97, SD = 8.32, range 10.39-38.78, n = 22; t = 1.528, p = 0.141) or TBF (males: mean = 1.81, SD = 1.51, range 0.38-5.19, n = 28; females: mean = 2.11, SD = 1.58, range 0.19-5.84, n = 22; t = 1.694, p = 0.162).
L e a n b o d y m a s s
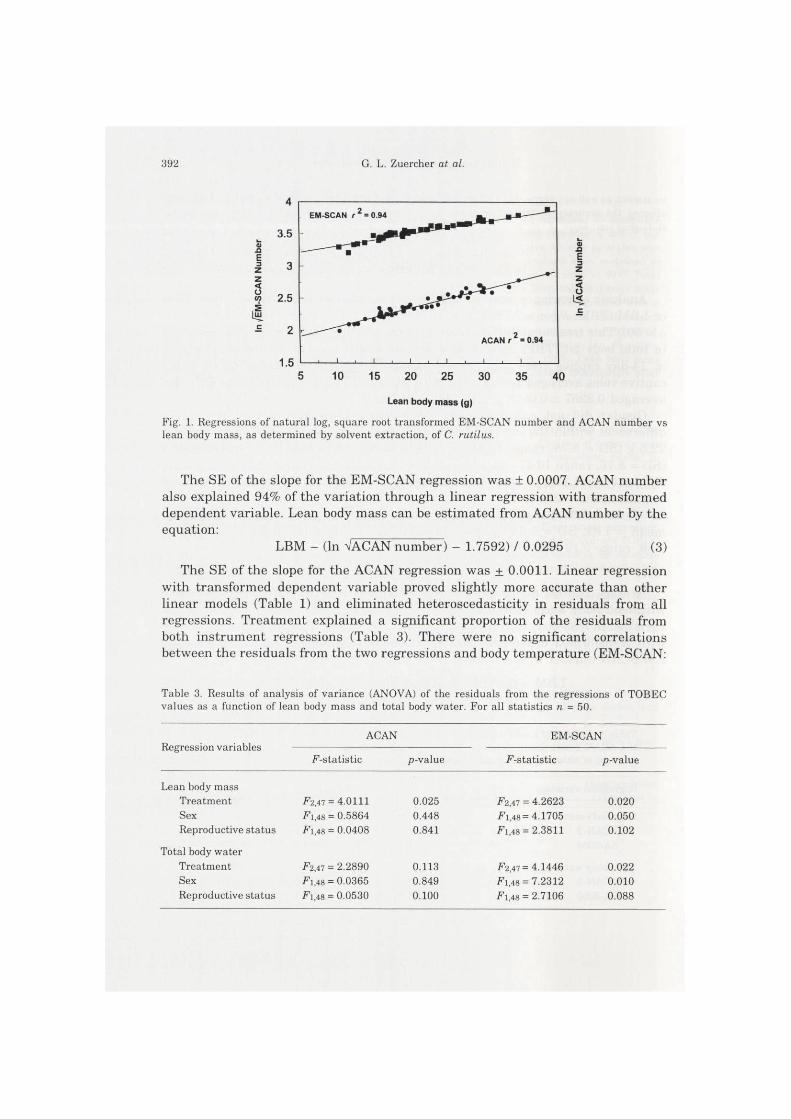
Average TOBEC numbers from both instruments were significantly correlated with lean body mass (Table 2, Fig. 1). EM-SCAN number explained 94% of the variation in lean body mass in the sample of live voles through a linear regression with transformed dependent variable. Lean body mass can be estimated from EM-SCAN number by the equation:
LBM = (In VEM-SCAN number) - 3.1095) / 0.0204 (2)
Table 2. Results of l inear regression for total body electrical conductivity (TOBEC) using the ACAN-2 ins t rument (Jagmar, Inc.) or the SA-3000 ins t rument (EM-SCAN, Inc.) as a function of either lean body mass or total body water.
Regression variables n r F-statistic p-value
Lean body mass ACAN-2 50 0.997 F2,47 = 366.80 <0 .001 SA-3000 50 0.971 F2,47 = 1126.9 <0.001
Total body water ACAN-2 50 0.976 ^1,48 = 920.06 < 0.001 SA-3000 50 0.985 FI,48 = 788.92 < 0.001
392 G. L. Zuercher at al.
z z < o OT A
4
3.5
3
2.5
2
1.5
EM-SCAN r 2 = 0.94
— " " •
-
I . I . ACAN r 2 = 0.94
I . i . I . I ,
z z < o
10 15 20 25
Lean body mass (g)
30 35 40
Fig. 1. Regressions of natura l log, square root transformed EM-SCAN number and ACAN number vs lean body mass, as determined by solvent extraction, of C. rutilus.
The SE of the slope for the EM-SCAN regression was ± 0.0007. ACAN number also explained 94% of the variation through a linear regression with transformed dependent variable. Lean body mass can be estimated from ACAN number by the equation:
LBM - (In VACAN number) - 1.7592) / 0.0295 (3)
The SE of the slope for the ACAN regression was ± 0.0011. Linear regression with transformed dependent variable proved slightly more accurate than other linear models (Table 1) and eliminated heteroscedasticity in residuals from all regressions. Treatment explained a significant proportion of the residuals from both instrument regressions (Table 3). There were no significant correlations between the residuals from the two regressions and body temperature (EM-SCAN:
Table 3. Results of analysis of variance (ANOVA) of the residuals from the regressions of TOBEC values as a function of lean body mass and total body water. For all statistics n = 50.
Regression variables ACAN EM-SCAN
Regression variables F-statistic p-value F-statistic p-value
Lean body mass Treatment F2,47 = 4.0111 0.025 F2,47 = 4.2623 0.020 Sex Fi,48 = 0.58 64 0.448 Fi,48= 4.1705 0.050 Reproductive s ta tus Fi,48 = 0.04 08 0.841 Fi,48 = 2.3811 0.102
Total body water Trea tment F2,47 = 2.28 90 0.113 F2,47= 4.1446 0.022 Sex Fi,48 = 0.03 65 0.849 Fi,48 = 7.2312 0.010 Reproductive s ta tus Fi,48 = 0.05 30 0.100 Fi,48 = 2.7106 0.088
TOBEC estimates of vole body composition 393
r = 0.1197, Fi,48 = 0.69 78, p = 0.408, n = 50; ACAN: r = 0.2278, F i , 4 8 = 2.6276, p = 0.092, n = 50). Average body temperature of subjects was 36.1°C (SD = 0.53, range 35.0-37.3, n = 50). Sex explained a significant proportion of the residuals from the EM-SCAN instrument, but not from the ACAN instrument (Table 3). Reproductive s ta tus did not explain a significant proportion of the residuals for either ins t rument (Table 3).
T o t a l b o d y w a t e r
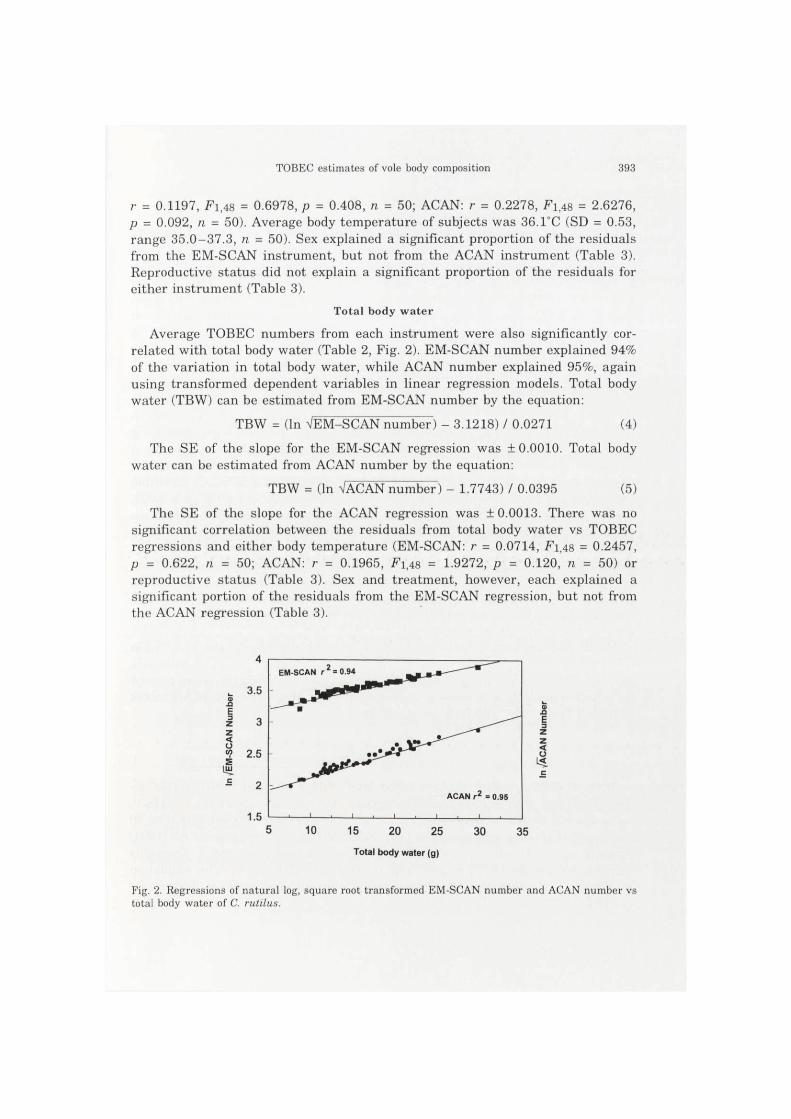
Average TOBEC numbers from each instrument were also significantly cor-related with total body water (Table 2, Fig. 2). EM-SCAN number explained 94% of the variation in total body water, while ACAN number explained 95%, again using transformed dependent variables in linear regression models. Total body water (TBW) can be estimated from EM-SCAN number by the equation:
TBW = (In VEM-SCAN number) - 3.1218) / 0.0271 (4)
The SE of the slope for the EM-SCAN regression was ± 0.0010. Total body water can be estimated from ACAN number by the equation:
TBW = (In VACAN number) - 1.7743) / 0.0395 (5)
The SE of the slope for the ACAN regression was ±0.0013. There was no significant correlation between the residuals from total body water vs TOBEC regressions and either body temperature (EM-SCAN: r = 0.0714, Fi,48 = 0.2457, p = 0.622, n = 50; ACAN: r = 0.1965, Fi,48 = 1.9272, p = 0.120, n = 50) or reproductive s ta tus (Table 3). Sex and t reatment , however, each explained a significant portion of the residuals from the EM-SCAN regression, but not from the ACAN regression (Table 3).
t —
EM-SCAN r ^ = 0.94 _ - ,
o 3.5
E 3 z 3 z < (J V) S
LLJ
2.5
2
1.5
ACAN r 2 = 0.95
^ _l . i . i . i . i 5 10 15 20 25 30 35
Total body water (g)
Fig. 2. Regressions of na tura l log, square root transformed EM-SCAN number and ACAN number vs total body water of C. rutilus.
394 G. L. Zuercher at al.
Total b o d y fat
The close correlation between average TOBEC numbers and either lean body mass or total body water for both instruments did not translate into accurate estimates of total body fat from models of simple linear regression. This is because the mean total body fat for all subjects was only 1.98 g (SD = 1.63; 7.8% of TBM ± 5.3, n = 50). Comparison of this average level of fat reserves with the mean error in TOBEC-estimated lean body mass for both instruments shows significant overlap. The mean error for EM-SCAN-estimated lean mass was ± 1.09 g (SD = 0.84) while the mean error for ACAN-estimated lean mass was ± 1.32 (SD = 0.96). This error in estimated lean body mass resulted in mean percent errors in fat estimates of 113% for the EM-SCAN and 120% for the ACAN.
Total body fat estimates through multiple regression proved to be more accurate than the above method. There was a significant correlation (r = 0.835) between total body fat and TOBEC-estimated body fat from the multiple regression using EM-SCAN number, total body mass, and total body length as independent variables. Likewise, there was a significant correlation (r = 0.903) when using the ACAN number in place of the EM-SCAN number. The EM-SCAN multiple regression explained 70% of the variation in total body fat (F3,46 = 35.30, p < 0.001, n = 50), whereas the ACAN multiple regression explained 81% of the variation (^3,46 = 67.90, p < 0.001, n = 50). A TOBEC-free multiple regression model using only total body mass and body length as independent variables was used as a comparison to evaluate the contribution of TOBEC data to estimating total body fat. There was a significant correlation (r = 0.679) between total body fat and fat estimated by the TOBEC-free multiple regression. However, this TOBEC-free multiple regression model explained only 46% of the variation in total body fat (^2,47 = 20.09, p < 0.001, n = 50).
The higher accuracy of fat estimates from multiple regressions also resulted in lower mean percent errors in the fat estimates. Mean percent error in fat estimates from the TOBEC-free multiple regression model was 78%, while the mean percent error for the multiple regression models that included ACAN and EM-SCAN values were still lower (40% and 59%, respectively).
Discussion
Both TOBEC instruments estimated lean body mass with considerable ac-curacy. Several studies have demonstrated similar accuracy. Bracco et al. (1983), using the EM-SCAN SA-1 instrument, reported r = 0.97 for their validation on 30 live Sprague-Dawley rats (range in body mass: 197-433 g), Froncisz et al. (1994) obtained r = 0.98 in their validation on 22 Apodemus agrarius and A. flavicollis (range in body mass: 16-37 g), and Koteja (1996) reported r = 0.92 in his validation on 20 Mus musculus and 14 Clethrionomys glareolus (no range in body mass available).
TOBEC est imates of vole body composition 395
That sex showed a slight effect on the results from the EM-SCAN SA-3000 instrument is likely accounted for by the higher percent water in lean body mass of pregnant females (Zuercher 1995). The treatment effect on the EM-SCAN residuals from both LBM and TBW regressions is explained by the presence of an outlier. The treatment effect on the ACAN residuals is due to the underestimation of lean body mass associated with captivity. The increased proportion of total body fat observed in the captive voles appears to have a negative effect on the ability of the ACAN-2 to estimate lean body mass.
Validations for estimating total body water revealed that both instruments were equally accurate at estimating total body water as with lean mass. ACAN-2 performed slightly better than the EM-SCAN SA-3000. The sex and treatment effects on the residuals from the EM-SCAN regression are artifacts of one outlier in each set of residuals. While few studies have regressed TOBEC on TBW, Keim et al. (1988), in a study using swine, reported r = 0.979 for body water and Koteja (1996), using mice and voles, reported r = 0.95.
Es t imates of total body fat from TOBEC were much less accurate than estimates of lean body mass. Estimates of body fat derived from subtracting estimated lean body mass from total body mass were subject to considerable error. While the absolute error for estimated lean body mass is identical to the absolute error for estimated total body fat, the relative error will be much higher for fat due to the small ratio of fat : lean in many organisms (Morton et al. 1993, Skagen et al. 1993). Therefore, the accuracy of total body fat estimates from TOBEC--predicted lean mass is low for C. rutilus, a species with relatively small fat reserves. The predictive models for lean mass would presumably perform even more poorly if used to estimate total body fat of individual voles not used to construct the model. Morton et al. (1993) and Skagen et al. (1993), however, suggested incorporating TOBEC values into multiple regression models to more accurately estimate total body fat. Our results from the multiple regression models (independent variables: TOBEC number, total body mass, and total body length) support the conclusion that this method of fat estimation is preferable to the direct subtraction method. Despite the improved accuracy of estimation for the multiple regression models, we did not achieve the same success reported by Koteja (1996).
The ease in obtaining measurements with the ACAN-2 was much greater than for the SA-3000. The SA-3000 was subject to constant background drift, which made determination of EM-SCAN values difficult to replicate. Another drawback of the SA-3000 was its response to changes in room temperature. All windows and doors needed to be closed for at least two hours prior to measurement to minimize drift. Investigator movement in front of the SA-3000 detection chamber also caused erratic readings. Apparently the SA-3000 detection chamber is sensitive to slight temperature changes within the chamber; a potentially serious problem if used under field conditions. These problems are apparently due to the instrument's higher sensitivity compared with the ACAN-2. Although less sensitive, the ACAN-2 provided estimates of total body fat that were more accurate. ACAN-
396 G. L. Zuercher at al.
-values were less variable (mean CV = 0.502) than those from the SA-3000 (mean CV = 1.095) and the ACAN-instrument did not suffer from the drift problems associated with the SA-3000.
While the two instruments estimated lean body mass with similar accuracy, the ACAN-2 proved slightly better than the SA-3000 in estimating total body water. The ACAN-2 also outperformed the SA-3000 in estimating total body fat using the multiple regression method. The TOBEC-free multiple regression proved less accurate in estimating total body fat than either of the TOBEC instrument multiple regressions, indicating tha t TOBEC data do improve the accuracy of body fat estimates. The higher correlation between TOBEC-estimated body fat and total body fa t by the multiple regression models supports the idea tha t simple subtraction from estimated lean mass procedures are inadequate (Morton et al. 1993, Skagen et al. 1993).
There is potential for the two instruments to estimate total body fat of captive C. rutilus with elevated total body fat levels. ACAN number, incorporated in a multiple regression model, may be a useful tool in studies on the effects of experimental feeding regimes or dietary contaminants, such as organophosphates, on body composition of captive C. rutilus. Nonetheless, the low total body fat observed in the wild-caught C. rutilus used for this validation, as well as throughout the annual cycle (Zuercher 1995), prevents either instrument from providing useful information for monitoring of seasonal fluctuations in body composition of individual free-ranging C. rutilus.
Acknowledgements: We would like to thank D. Feist and B. Barnes for supplying the Sherman t raps used during this study and for making useful comments during the course of this research. We also thank J . Cook and the University of Alaska Museum Mammal Depar tment for supplying the Ugglan t raps used during this study. This research was supported in par t by a Grant from the President 's Special Project Fund at the University of Alaska, a Multi-user Biological Equipment Gran t from the National Science Foundation, U.S.A., and the Alaska Depar tment of Fish and Game. An anonymous reviewer significantly improved an earlier version of this paper.
References
Asch A. and Roby D. D. 1995. Some factors affecting precision of the total body electrical conductivity technique for measur ing body composition in live birds. Wilson Bulletin 107: 306-316.
Bracco E. F., Yang M., Segal K., Hashim S. A. and Van Italie T. B. 1983. A new method for estimation of body composition in the live rat. Proceedings of the Society for Experimental Biology and Medicine 174: 143-146.
Castro G., Wunder B. A. and Fritz F. L. 1990. Total body electrical conductivity (TOBEC) to est imate total body fat of free-living birds. Condor 92: 496-499.
Dobush G. R., Ankney C. D. and Krementz D. G. 1985. The effect of apparatus , extraction time, and solvent type on lipid extractions of Snow Geese. Canadian Journal of Zoology 63: 1917-1920.
Froncisz W., Piasecki W., Koteja P., Staliriski J . and Weiner J . 1994. A new ins t rument for non--invasive measurement of total body water and fat content in small mammals . Polish Ecological Studies 20: 323-328.
TOBEC estimates of vole body composition 397
Keim N. L., Mayclin P. L., Taylor S. J. and Brown D. L. 1988. Total-body electrical conductivity method for es t imating body composition: validation by direct carcass analysis of pigs. American Journal of Clinical Nutri t ion 47: 180-185.
Koteja P. 1996. The usefulness of a new TOBEC ins t rument (ACAN) for investigating body com-position in small mammals . Acta Theriologica 41: 107-112.
Morton J . M., Kirkpatrick R. L. and Smith E. P. 1993. Comments on est imating total body lipids from measures of lean mass. Condor 93: 463-465.
Piasecki W., Koteja P., Weiner J . and Froncisz W. 1995. New way of body composition analysis using total body electrical conductivity method. Review of Scientific Ins t ruments 66(4): 3037-3041.
Robbins C. T. 1983. Wildlife feeding and nutrit ion. Academic Press, New York: 1-352. Roby D. D. 1991. A comparison of two noninvasive techniques to measure total body lipid in live birds.
Auk 108: 509-518. Scott I., Grant M. and Evans P. R. 1991. Estimation of fat-free mass of live birds: use of total body
electrical conductivity (TOBEC) measurements in studies of single species in the field. Functional Ecology 5: 314-320.
Skagen S. K., Knopf F. L. and Cade B. S. 1993. Estimation of lipids and lean mass of migrat ing sandpipers. Condor 95: 944-956.
Walsberg G. E. 1988. Evaluation of a nondestructive method for determining fat stores in small birds and mammals. Physiological Zoology 61: 153-159.
Zuercher G. L. 1995. Seasonal changes in body mass and composition of northern red-backed voles (Clethrionomys rutilus) in Interior Alaska. M Sc thesis, University of Alaska, Fairbanks: 1-127.
Received 20 January 1997, accepted 7 July 1997.


![DRIVEN BY VISIBILITY...Daewoo Cielo [T-Car] 1995.07 2001.03 3 397 011 646 3 397 011 646 3 397 005 293 3 397 016 578 3 397 016 578 Matiz 1998.11 2002.02 3 397 011 650 3 397 011 643](https://img.pdfslide.us/doc/110x75/6112d7f249975425bc587ce5/driven-by-visibility-daewoo-cielo-t-car-199507-200103-3-397-011-646-3-397.jpg)


![[ENG] 397 Manolona](https://img.pdfslide.us/doc/110x75/568c4dbb1a28ab4916a51e37/eng-397-manolona.jpg)