Embed Size (px)
Citation preview

1
July-2010
Validation of tie-point concepts by the DEM adjustment approach of TanDEM-X
M. Huber, A. Gruber, B. Wessel, M.Breunig, A. Wendleder
Slide 2
Overview
Mosaicking and Calibration Processor
Calibration Point Extraction (ICESat, tie-points)
Tie-Point Concept
Single point approach
Area based approach
DEM Calibration
Test-site based on SRTM
Results
Conclusion
2
Slide 3
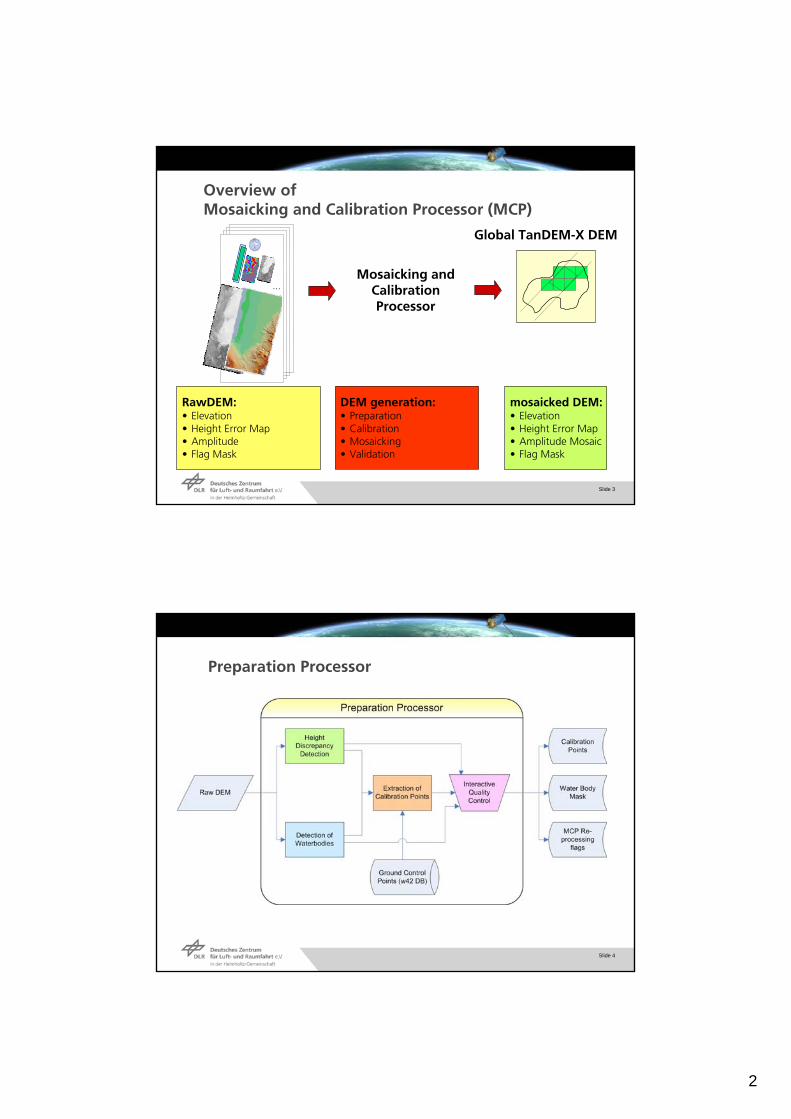
mosaicked DEM:• Elevation• Height Error Map• Amplitude Mosaic• Flag Mask
Mosaicking and Calibration Processor
…
RawDEM:• Elevation• Height Error Map• Amplitude• Flag Mask
Global TanDEM-X DEM
DEM generation:• Preparation• Calibration• Mosaicking• Validation
Overview ofMosaicking and Calibration Processor (MCP)
Slide 4
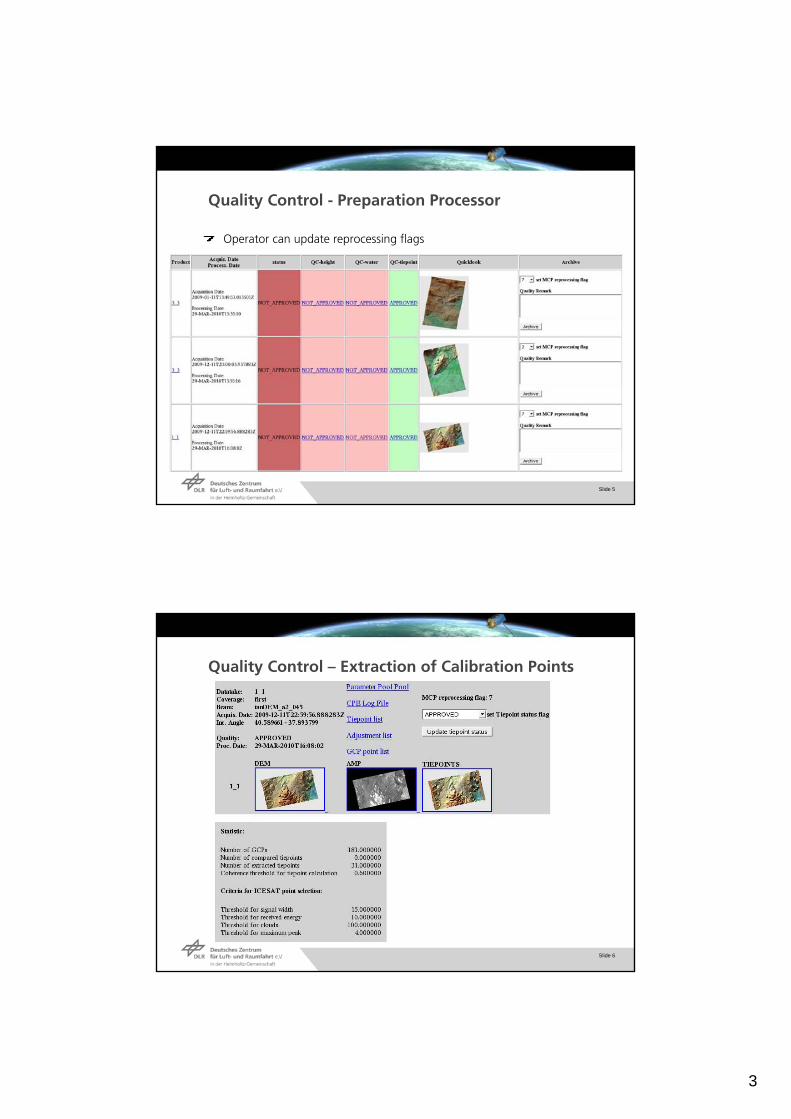
Preparation Processor
3
Slide 5
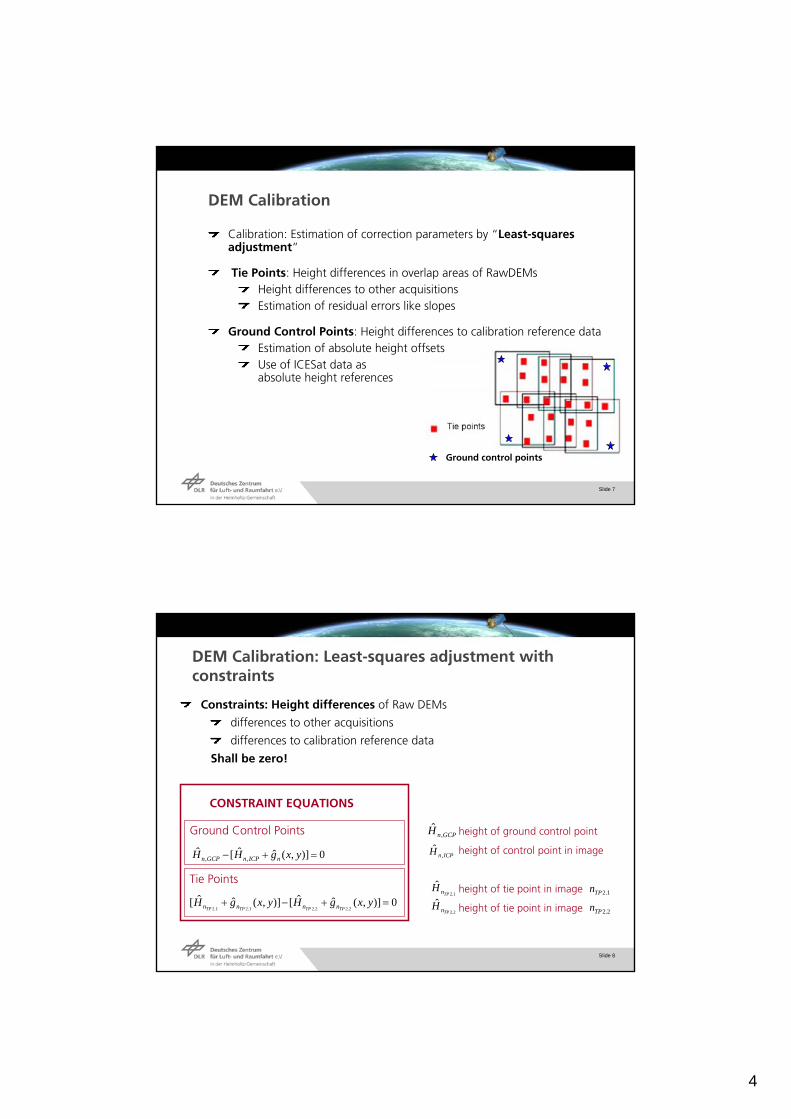
Quality Control - Preparation Processor
Operator can update reprocessing flags
Slide 6
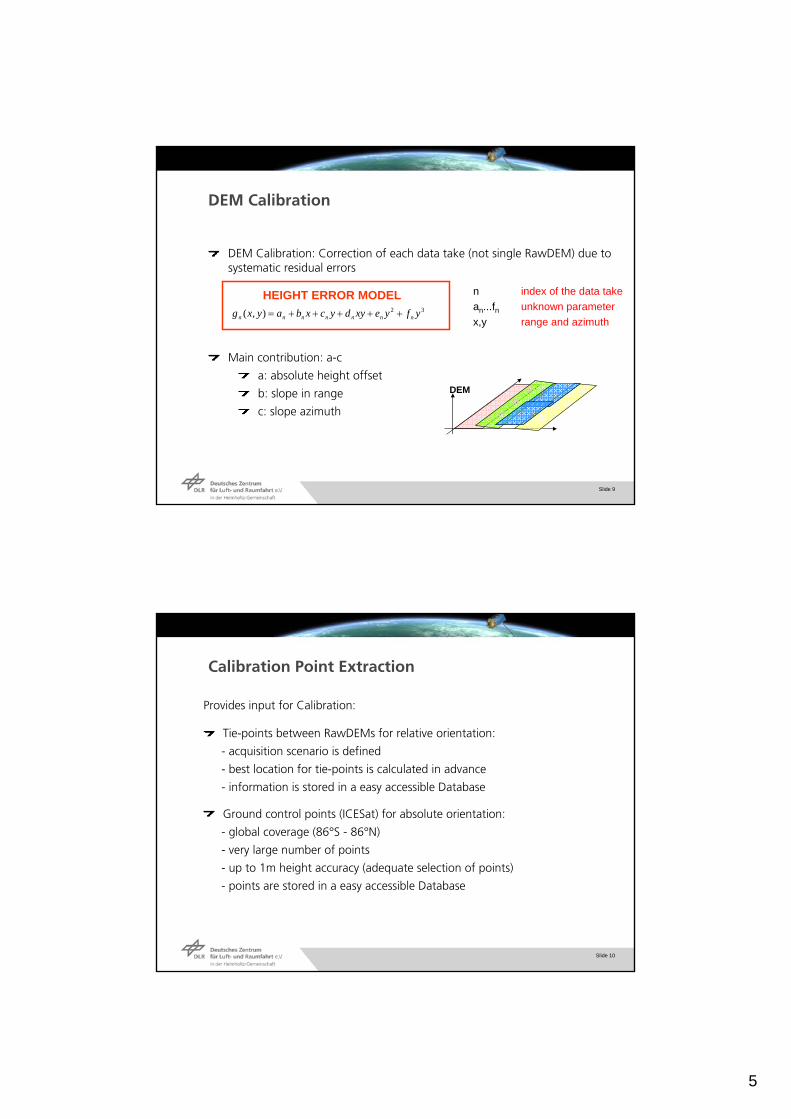
Quality Control – Extraction of Calibration Points
4
Slide 7
DEM Calibration
Calibration: Estimation of correction parameters by “Least-squares adjustment”
Tie Points: Height differences in overlap areas of RawDEMs Height differences to other acquisitionsEstimation of residual errors like slopes
Ground Control Points: Height differences to calibration reference dataEstimation of absolute height offsetsUse of ICESat data as absolute height references
Ground control points
Slide 8
Constraints: Height differences of Raw DEMs
differences to other acquisitions
differences to calibration reference data
Shall be zero!
0)],(ˆˆ[ˆ,, yxgHH nICPnGCPn
Ground Control Points
0)],(ˆˆ[)],(ˆˆ[2.22.21.21.2
yxgHyxgHTPTPTPTP nnnn
Tie Points
CONSTRAINT EQUATIONS
GCPnH ,ˆ
ICPnH ,ˆ
1.2
ˆTPnH
2.2
ˆTPnH
height of ground control point
height of control point in image
height of tie point in image
height of tie point in image
1.2TPn
2.2TPn
DEM Calibration: Least-squares adjustment withconstraints
5
Slide 9
DEM Calibration
DEM Calibration: Correction of each data take (not single RawDEM) due to systematic residual errors
Main contribution: a-c
a: absolute height offset
b: slope in range
c: slope azimuth
32),( yfyexydycxbayxg nnnnnnn
HEIGHT ERROR MODEL n index of the data take
an...fn unknown parameter
x,y range and azimuth
DEM
Slide 10
Calibration Point Extraction
Provides input for Calibration:
Tie-points between RawDEMs for relative orientation:
- acquisition scenario is defined
- best location for tie-points is calculated in advance
- information is stored in a easy accessible Database
Ground control points (ICESat) for absolute orientation:
- global coverage (86°S - 86°N)
- very large number of points
- up to 1m height accuracy (adequate selection of points)
- points are stored in a easy accessible Database

6
Slide 11
Tie-Point Concept
Tie-point Database:acquisition scenario is defined tie-point chip are extracted around given locations along overlap centers
30 km
50 km
3 km
3 km
Raw-
DEM_3
Raw-
DEM_2
Raw-
DEM_1
overlap area 2nd year
ground-track
center overlap
3 km
3 km Raw-DEM_1
Raw-DEM_2
1 km
ground-track
points1 km
Slide 12
Single Point Approach
Tie-point is located at the most appropriated location in the chip
Pixel flagged as shadow, layover, water or having low coherence are not taken into account
Meanfilter (9x9) identifies most flat area inside the chip
Height value is averaged over a filtering window (3x3)
Standard deviation is stored as additional information (quality information)
Master chip is the extracted chip of the first available DEM
Master chip identifies tie-point position for all subsequently acquired DEMs
7
Slide 13
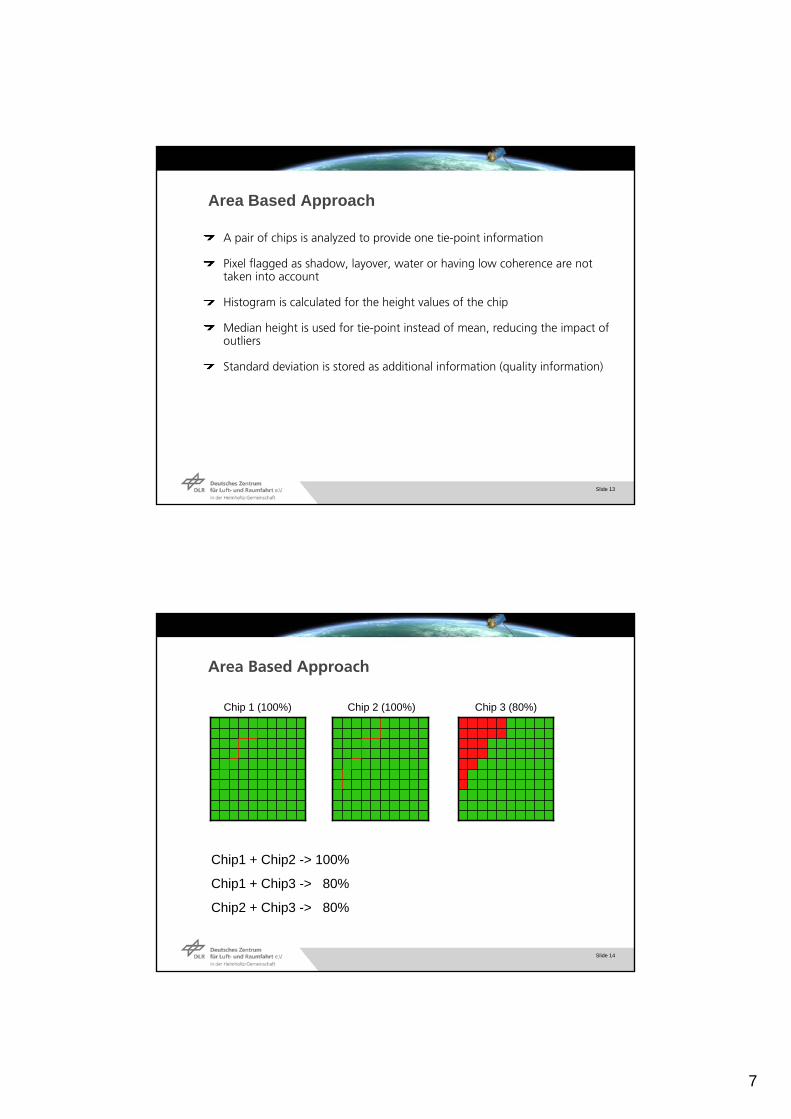
Area Based Approach
A pair of chips is analyzed to provide one tie-point information
Pixel flagged as shadow, layover, water or having low coherence are not taken into account
Histogram is calculated for the height values of the chip
Median height is used for tie-point instead of mean, reducing the impact of outliers
Standard deviation is stored as additional information (quality information)
Slide 14
Area Based Approach
Chip 1 (100%) Chip 2 (100%) Chip 3 (80%)
Chip1 + Chip2 -> 100%
Chip1 + Chip3 -> 80%
Chip2 + Chip3 -> 80%
8
Slide 15
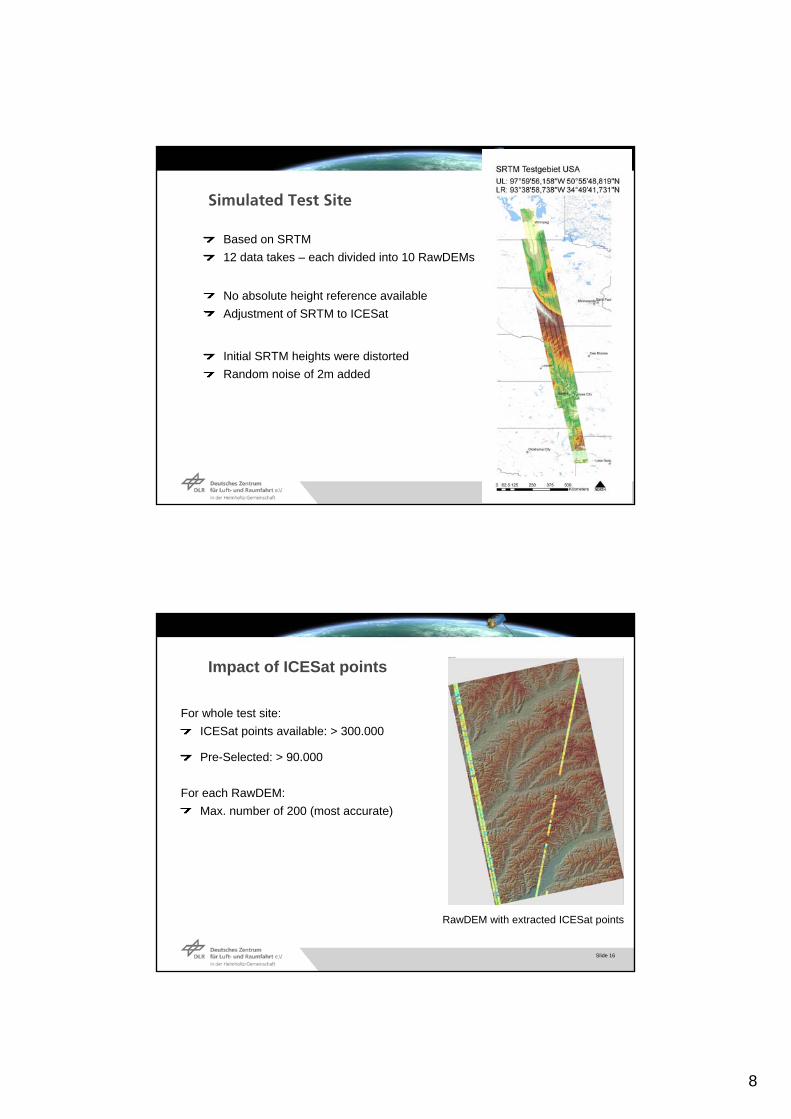
Simulated Test Site
Based on SRTM
12 data takes – each divided into 10 RawDEMs
No absolute height reference available
Adjustment of SRTM to ICESat
Initial SRTM heights were distorted
Random noise of 2m added
Slide 16
Impact of ICESat points
For whole test site:
ICESat points available: > 300.000
Pre-Selected: > 90.000
For each RawDEM:
Max. number of 200 (most accurate)
RawDEM with extracted ICESat points

9
Slide 17
Comparison of single-point and area-based approach
Detailed comparison of specific chip
Determination of best point position
Compare only valid pixel
Slide 18
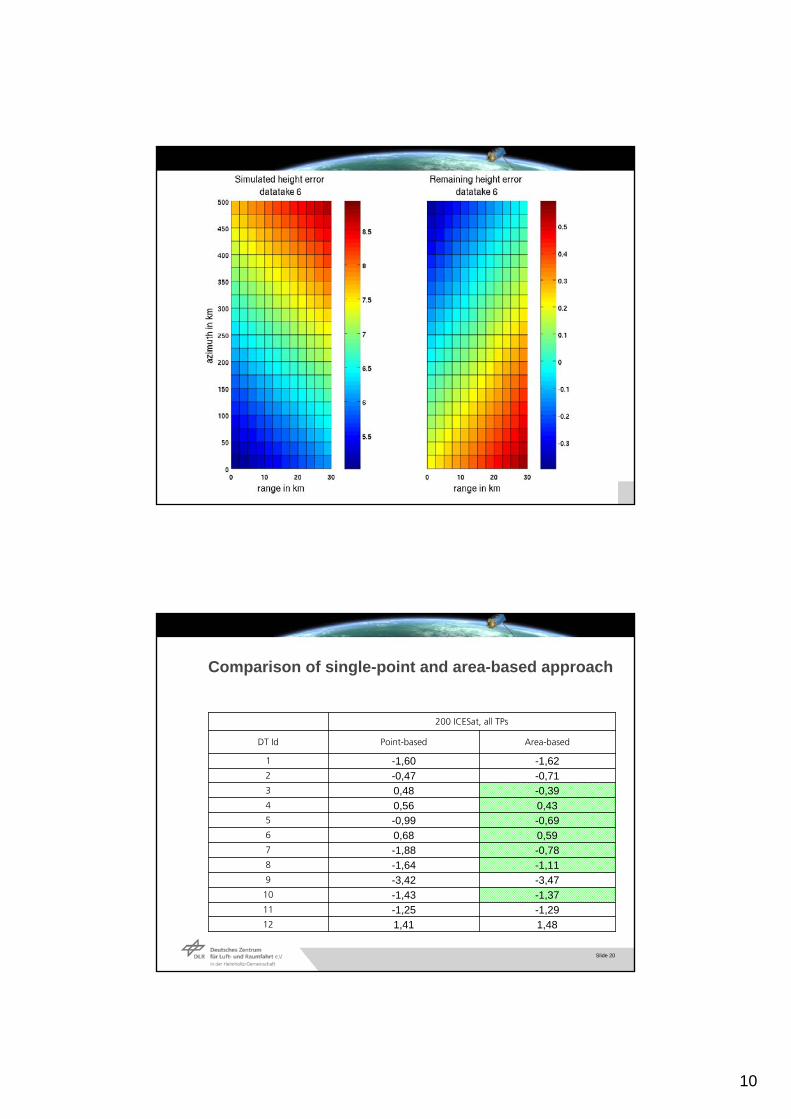
Comparison of single-point and area-based approach
The estimated height offset and tilt have to be taken into account together
Maximum height difference between ref. DEM and cal. DEM is evaluated
10
Slide 19
Slide 20
Comparison of single-point and area-based approach
1,481,4112
-1,29-1,2511
-1,37-1,4310
-3,47-3,429
-1,11-1,648
-0,78-1,887
0,590,686
-0,69-0,995
0,430,564
-0,390,483
-0,71-0,472
-1,62-1,601
Area-basedPoint-basedDT Id
200 ICESat, all TPs
11
Slide 21
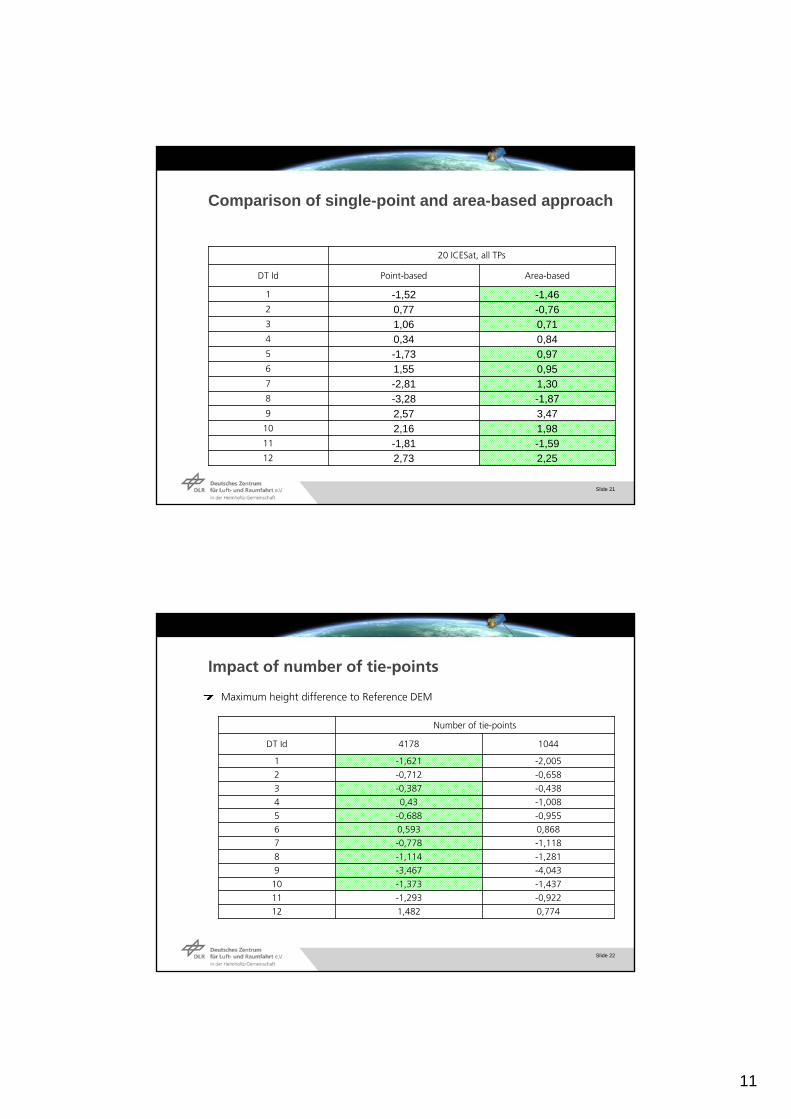
Comparison of single-point and area-based approach
2,252,7312
-1,59-1,8111
1,982,1610
3,472,579
-1,87-3,288
1,30-2,817
0,951,556
0,97-1,735
0,840,344
0,711,063
-0,760,772
-1,46-1,521
Area-basedPoint-basedDT Id
20 ICESat, all TPs
Slide 22
Impact of number of tie-points
Maximum height difference to Reference DEM
0,7741,48212
-0,922-1,29311
-1,437-1,37310
-4,043-3,4679
-1,281-1,1148
-1,118-0,7787
0,8680,5936
-0,955-0,6885
-1,0080,434
-0,438-0,3873
-0,658-0,7122
-2,005-1,6211
10444178DT Id
Number of tie-points

12
Slide 23
Conclusion
Advantage of the area based approach is the median filter
Reducing the noise by averaging a larger area
Results with area-based tie-point approach are better than with the single point approach
Similar tests will be carried out with real TanDEM-X data