Embed Size (px)
Citation preview
Loughborough UniversityInstitutional Repository
Validation of the GENEAaccelerometer
This item was submitted to Loughborough Universitys Institutional Repositoryby thean author
Citation ESLIGER DW et al 2011 Validation of the GENEA ac-celerometer Medicine and Science in Sports and Exercise 43(6) pp1085-1093
Additional Information
bull This is a non-final version of an article published in final form in Medicineand Science in Sports and Exercise 43(6) pp1085-1093
Metadata Record httpsdspacelboroacuk213415394
Version Accepted for publication
Publisher Lippincott Williams ampWilkins ( ccopy The American College of SportsMedicine)
Please cite the published version
This item was submitted to Loughboroughrsquos Institutional Repository
(httpsdspacelboroacuk) by the author and is made available under the following Creative Commons Licence conditions
For the full text of this licence please go to httpcreativecommonsorglicensesby-nc-nd25
1
Validation of the GENEA accelerometer
Running title GENEA accelerometer
Dale W Esliger14
Ann V Rowlands1 Tina L Hurst
2 Michael Catt
32 Peter Murray
2 Roger G
Eston1
1School of Sport and Health Sciences St Luke‟s Campus University of Exeter Exeter United
Kingdom
2Unilever Discover Colworth United Kingdom
3Institute for Ageing and Health Newcastle University Newcastle Upon Tyne United Kingdom
4College of Kinesiology University of Saskatchewan Saskatoon Saskatchewan Canada
Funding This research was supported by Unilever Discover
Address correspondence to
Dale W Esliger
College of Kinesiology
87 Campus Drive
Saskatoon SK Canada
S7N 5B2
daleesligerusaskca
306-966-1085
306-966-6464
Manuscript (include title page abstract text references)
2
Abstract Purpose The study aims were 1) to assess the technical reliability and validity of the GENEA
using a mechanical shaker 2) to perform a GENEA value calibration to develop thresholds for
sedentary light moderate and vigorous intensity physical activity and 3) to compare the
intensity classification of the GENEA with two widely used accelerometers Methods 47
GENEAs were attached to a shaker and vertically accelerated generating 15 conditions of
varying acceleration andor frequency Reliability was calculated using standard deviation and
intra- and inter-instrument coefficient of variation while validity was assessed via Pearson
correlation with the shaker acceleration as the criterion Next 60 adults wore a GENEA on each
wrist and on the waist (alongside an Actigraph and RT3 accelerometer) while completing 10-12
activity tasks A portable metabolic gas analyzer provided the criterion measure of physical
activity Analyses involved the use of Pearson correlations to establish criterion and concurrent
validity and ROC curves to establish intensity cut points Results The GENEA demonstrated
excellent technical reliability (CVintra=14 CVinter=21) and validity (r=098 plt0001) using
the mechanical shaker The GENEA demonstrated excellent criterion validity using VO2 as the
criterion (left wrist r=086 right wrist r=083 waist r=087) on par with the waist-worn
Actigraph and RT3 The GENEA demonstrated excellent concurrent validity compared to the
Actigraph (r=092) and the RT3 (r=097) The waist-worn GENEA had the greatest
classification accuracy (Area Under the ROC curve AUC=095) followed by the left (093) then
right wrist (090) The accuracy of the waist-worn GENEA was virtually identical to the
Actigraph (AUC=094) and RT3 (095) Conclusions The GENEA is a reliable and valid
measurement tool capable of classifying the intensity of physical activity in adults
Key Words ACTIVITY MONITOR MEASUREMENT ACCELERATION FREQUENCY
GRAVITY RELIABILITY
3
3
INTRODUCTION
Paragraph Number 1 The unequivocal link between physical activity and health has prompted
exercise science and public health researchers their learned societies and their funders to search
for better and more logistically feasible and objective tools to measure physical activity
This focus has facilitated the development of many objective measurement technologies such as
accelerometers (described in detail elsewhere (17 29)) which provide robust and detailed
physical activity information (4)
Paragraph Number 2 Although much progress has been made in the assessment of
physical activity with accelerometers there are a number of limitations that still need to be
addressed An important first step would be to convince manufacturers to abolish the practice of
disguising raw acceleration outcomes via proprietary bdquocount‟ units as it hinders between model
comparisons Second increased battery life and memory storage would benefit users that require
higher resolution signals This is especially important for multi-axis accelerometers and seismic-
based technologies (26) However a balance must be struck to ensure that the quest for richer
data does not interfere with other more practical issues related to accelerometer size weight and
functionality For example the IDEEA monitor (32) utilizes an array of wired accelerometers
and as such is somewhat obtrusive That said there are some accelerometers such as the Sensor
Wear Armband (7) the ActivPal (9) and the DynaPort (26) that seem to have balanced the
desire for advanced measurement capabilities such as activity classification with feasibility
issues (eg the desire for high resolution acceleration data and the need to remain unobtrusive)
More recently another accelerometer the GENEA has been developed
Paragraph Number 3 This manuscript functions to introduce the GENEA a novel
acceleration sensor developed by Unilever Discover (Colworth United Kingdom) and
4
4
manufactured and distributed by Oralinsights Limited (Kimbolton Cambridgeshire United
Kingdom) Therefore the purpose of this study was threefold 1) to perform a preliminary
technical reliability and validity assessment of the GENEA using a mechanical shaker table 2) to
perform a value calibration of the GENEA to develop thresholds for sedentary light moderate
and vigorous intensity physical activity in adults and 3) to compare the intensity classification of
the GENEA with two widely used accelerometers
METHODS
Technical Reliability and Validity
Paragraph Number 4 Accelerometers The GENEA is a triaxial plusmn 6 g seismic acceleration
sensor (LIS3LV02DL STMicroelectronics Geneva Switzerland) The small (36x30x12
LxWxH mm) and lightweight (16 grams) splashproof design of the GENEA allow it to be easily
worn at multiple locations on the body (eg wrist waist ankle) The GENEA has 500
megabytes of memory to assist with the storage of the raw 80 Hz sampling frequency and can
store ~8 days of data in raw mode with 12 bit resolution Users have the ability to select user-
defined sample frequencies ranging from 10-80 Hz Using the GENEA software (version 1487
update 531) via USB to PC connection 47 GENEA accelerometers were initialized to collect
unfiltered triaxial acceleration data at a sample rate of 80 Hz
Paragraph Number 5 Multi-axis shaking table All technical reliability and validity testing
was completed using a Multi-Axis Shaking Table (MAST) manufactured by Instron Structural
Testing Systems (Buckinghamshire United Kingdom) with an industrial Labtronic 8800 Digital
Controller (Darmstadt Germany) The MAST has been described in detail by Gizatullin and
Edge (8) The MAST is designed to recreate spatial motion of the platform in three dimensions
however only vertical motion was used in this preliminary technical reliability and validity
5
5
study Using a combination of command file and individually entered position command
signals the MAST was programmed to accurately and reliably oscillate the platform at the
various testing conditions using a sinusoidal oscillation procedure The testing conditions were
restricted by the MAST stroke limits of approximately plusmn75 mm The range of possible
conditions of acceleration and frequency of oscillation are described by the equation
acceleration (ms-2
) = (amplitude (m) frequency2
(rads-1
) Fifteen different conditions were
selected to produce a range of physiologically relevant accelerations from light to moderate to
vigorous within the limitations of the MAST
Paragraph Number 6 The GENEA accelerometers were securedenclosed in a custom test
jig (Figure 1 inset right) lined with high density foam to avoid potential vibration transference
and bolted to the surface of the shaker table (Figure 1 inset left) Care was taken to ensure that
the monitors were secured firmly so the vertical movement was along the y-axis of the GENEA
Next the first test condition was programmed and the condition was executed accelerating all
accelerometers simultaneously in the vertical plane for the 60 second test duration All 15
conditions were completed in this fashion and when complete the accelerometers were removed
from the shaker plate and test jig
Paragraph Number 7 Data Reduction All 47 GENEA accelerometers were downloaded to the
initialization PC resulting in the creation of 47 raw 80 Hz data files containing unfiltered time
and date stamped x y and z axis acceleration data (in gravitational units (g) complete with
negative sign indicating directionality) These data were downloaded in comma separated values
file format (csv extension) however the user may also (or instead) choose a binary format (bin
extension) Although both files contain the same data the binary format is much more efficient
at nearly 8 times smaller file size Using the GENEA Post Processing software (version 121)
6
6
the raw 80 Hz triaxial GENEA data were summarized into a signal magnitude vector (gravity-
subtracted) (SVMgs) using 1 second epochs [see equation 1] (11) The resulting SI units for this
outcome variable are g ∙ seconds
Equation 1
SVMgs = 2 2 2x y z g
where the correction for gravity was undertaken to focus the outcome variable on
dynamic rather than static accelerations
Although not the focus of the present study the post processing software does allow the user to
summarize the raw triaxial signal using units of acceleration This is achieved by using the mean
signal magnitude vector over the user-defined epoch [see equation 2] rather than the integral
measure of the SVM as outlined above (26)
Equation 2
SVM = 2 2 2x y z
as this is a mean rather than an cumulative sum it retains its gravity-based acceleration
units (g) where 1 g=981 mmiddots-2
Next data were imported into a customized spreadsheet application using the common epoch-
by-epoch time stamp to alignsynchronize the data across units and models (verified by cross-
correlation analyses) The recorded condition start and end times were identified and the middle
50 seconds of each condition were extracted for further analysis
Paragraph Number 8 Statistical Analyses For all test conditions the mean count output (50
replicate seconds) of each accelerometer for each condition was calculated Intra- and inter-
instrument reliability was calculated using standard deviation and coefficient of variation (CVintra
and CVinter) Pearson product-moment correlation was used to determine the criterion validity of
7
7
the GENEA versus the MAST acceleration All analyses were performed using SPSS version
150 for Windows (SPSS Chicago USA)
Value Calibration
Paragraph Number 9 Participants Participant recruitment was initiated in February 2008 in an
effort to obtain a convenience sample of 60 male and female volunteers aged 40-65 years Two
recruitment methods were used an email to employees of the University of Exeter Exeter
Devon UK and an advertisement in a local newspaper A health and fitness report and a pound20 gift
card were offered as incentive and honorarium respectively for participating in the study Data
collection was undertaken in March and April 2008 after which time 60 adults (62 female)
aged 40ndash63 years completed the study protocol All participants were free from diagnosed
disease and musculoskeletal injury and had no affirmative answers to the Physical Activity
Readiness Questionnaire (PAR-Q) Written informed consent was obtained from each
participant The study was approved by the Ethics committee of the School of Sport and Health
Sciences University of Exeter
Paragraph Number 10 Data Collection Procedures Participants arrived at the laboratory
having refrained from consuming nicotine caffeine or a large meal for at least two hours prior
and exercise at least 6 hours prior to the appointment As part of a larger battery of
anthropometry and health-related fitness tests (peripheral to the present study) participants had
their height (to the nearest 01 cm) and body mass (to the nearest 01 kg) measured using a
Holtain stadiometer (Holtain Crymych Dyfedd UK) and a Tanita TBF-305 scale (Tanita UK
Ltd Middlesex UK) respectively Whole body bioelectrical impedance analysis (BodyStat
1500 BodyStat Onchan Isle of Man United Kingdom) was also performed to determine
percent body fat Next each participant was asked to complete an ordered series of 10-12 semi-
8
8
structured activities in the laboratory and free-living environment The lying activity was
performed for 10 minutes while all other activities were performed for 45 minutes In between
each activity the participants were given at least 2 minutes rest to allow them to prepare for the
next activity and for their metabolic rate (oxygen uptake) to recover to pre-activity levels
Throughout testing VO2 VCO2 and heart rate were measured by the Cosmed K4b2 (Rome
Italy) portable metabolic gas analysis system with heart rate receiver Prior to each testing
session the K4b2 was calibrated with gases of known concentration and the flow sensor
calibration and environmental conditions updated Lastly the K4b2 and the computer running
the software were time-synchronized with the Greenwich Mean Time server The K4b2 has
been shown to provide valid measurements of oxygen uptake across a range of exercise
intensities (13) After each testing session the relative VO2 data were downloaded and stored on
a PC for further analysis
Paragraph Number 11 Accelerometer Throughout testing three GENEA accelerometers were
worn one on each of the left and right wrists (using simple watch straps accelerometers
positioned over the dorsal aspect of the wrists midway between the radial and ulnar styloid
processes) and one on the waist (using a elasticized belt accelerometer positioned over the right
hip mid-clavicular line landmarked by the supraspinale) The same three GENEAs were used
by all 60 participants and were always positioned at the same sites for each On the same belt
adjacent to the waist-worn GENEA participants wore two peer accelerometers a uniaxial
Actigraph GT1M accelerometer with firmware version 300 (Actigraph Pensacola Florida
USA) and a triaxial RT3 accelerometer (Stayhealthycom Monrovia California USA) At the
start of each testing session the accelerometers were time synchronized with the GMT time
server and initialized to record acceleration data The epoch length was set at 80 Hz 1 second
9
9
and 1 minute 3-axis for the GENEAs Actigraph and RT3‟s respectively however only the
vector magnitude data from the RT3 were analyzed After each testing session the accelerometer
data were downloaded and stored on a PC for further analysis
Paragraph Number 12 Data Analyses Using the K4b2 software the breath-by-breath VO2
data were filtered using 1 minute averaging Using the GENEA Post Processing software
(version 121) the raw 80 Hz triaxial GENEA data were summarized into SVMgs using 1 minute
epoch intervals The Actigraph data were also integrated to 1-minute epochs for further analysis
Custom spreadsheet applications were developed to temporally synchronize the minute-by-
minute data from the K4b2 with the data from the three accelerometer models The combined
data set was then plotted to facilitate the selection of the minute of accelerometer data that
coincided with steady-state VO2 for each of the activities performed Ideally and in most cases
this was the 4th
minute of each activity however in a minority of cases the 3rd
minute was
selected as it better represented steady-state due to occasional time synchronization issues (the
10th
or 9th
minute for the lying activity) The relative VO2 and accelerometer data corresponding
to the selected minute were exported to SPSS version 150 for Windows (SPSS Chicago USA)
for further analysis Pearson correlations were calculated between each accelerometer output
and VO2
Paragraph Number 13 The VO2 data were converted to METS using the standard
conversion of 1 MET = 35 mlmiddotkg-1
middotmin-1
and then coded into one of four absolute intensity
categories sedentary (lt15 METS) light (15-399 METS) moderate (400-699 METS) or
vigorous (7+ METS) activity The impetus for using 4 and 7 rather than 3 and 6 MET
thresholds to mark moderate and vigorous intensity physical activity follows the rationale
described in a review by Shephard (23) Citing work by Porcari et al (19) Shephard noted that
10
10
those deriving health benefits from lifestyle activities tended to be sedentary obese and elderly
people those for whom a given absolute intensity of effort such as brisk walking develops a
substantial relative intensity of effort Simply put because the present sample were
sedentaryunfit their physical activity energy expenditure for a given absolute intensity effort
such as a brisk walk is likely to be higher than for fitter individuals Therefore developing cut
points on an unfit sample using 3 and 6 MET thresholds would result in an increased chance of
erroneously categorizing fitter individuals as active rather than inactive As this was the case in
the present study the higher absolute intensity cut points of 4 and 7 METS were chosen
Paragraph Number 14 Next the accelerometer data were recoded to create binary
indicator variables (0 or 1) to facilitate the Receiver Operator Characteristic (ROC) curve
analyses For sedentary this corresponded to sedentary activities versus more than sedentary
activities For moderate intensity this corresponded to less than moderate activities versus
moderate to vigorous activities For vigorous intensity this corresponded to vigorous activities
versus less than vigorous activities Next the binary coded accelerometer data were exported to
GraphPad Prism 400 for Windows (GraphPad Software San Diego USA) to undergo the ROC
curve analyses
Paragraph Number 15 A ROC curve is a graphical technique for describing and
comparing the accuracy of diagnostic tests In the present application ROC analysis is used to
examine the potential of using thresholds within the GENEA Actigraph and RT3 data to
discriminate between four activity intensity categories As Jago et al (10) described ROC
analysis is a means to evaluate and visualize the sensitivity [true positives(true positives + false
negatives)] and specificity [true negatives(true negatives + false positives)] of tests The ROC
curve is simply a plot of the sensitivity of a test on the y-axis versus its 1-specificity (ie false
11
11
positive fraction on the x-axis) Each possible threshold value corresponds to a point on the ROC
curve The upper-left corner [the point (0 1)] represents perfect classification and the diagonal
line represents the strategy of randomly guessing Sensitivity is maximized by correctly
identifying at or above the threshold for intensity whereas specificity is maximized by correctly
excluding activities below the threshold for intensity Similar to the methods of Evenson et al
(6) the cut points at which sensitivity and specificity were both maximized were identified
RESULTS
Technical Reliability and Validity
Paragraph Number 16 All 47 GENEA accelerometers successfully initialized collected and
downloaded data The mean SMVgs (g ∙ seconds) for the GENEA accelerometers displayed a
linear trajectory across all 15 testing conditions when organized from low to high acceleration
values (Figure 1 main) The average intra- and inter-instrument reliability of the 47 GENEA
accelerometers across the 15 conditions was CVintra=18 and CVinter=24 respectively The
criterion validity for the GENEA versus the MAST acceleration for all 15 test conditions was
excellent (r=097 plt0001)
Value Calibration
Paragraph Number 17 Descriptive characteristics of the participants are shown in Table 2 The
BMI data are a testament to the fact that this is a convenience sample as the participants are
leaner than the general population In fact the prevalence of obesity among the group was 4
for men and 5 for women much lower than the 23 and 25 found in the general population
(21) However the number of left handed participants in this study (12) matched well the 11
prevalence of left handedness in the UK population (14)
12
12
Paragraph Number 18 Table 3 compares the average METS and the position-specific
GENEA results As expected the activities in the posture grouping were the lowest intensity
while the optional running activities were the highest which was reflected in the VO2 and the
accelerometer output The fact that the slow treadmill walking an activity intended to be light
intensity resulted in an average 388 METS response helps to justify the decision to utilize the
higher absolute intensity cut points of 4 and 7 METS to distinguish moderate and vigorous
intensity activity in this sample Comparing the different wear positions of the GENEA showed
that data for the left and right wrists were similar while the mean GENEA data collected at the
waist were lower as were the standard deviations Comparative data from the waist-worn
Actigraph and RT3 are also displayed in Table 3
Paragraph Number 19 Using relative VO2 as the criterion the GENEA demonstrated
excellent criterion validity across all activities (left r = 086 right r = 083 waist r = 087)
performing as well at the waist as the Actigraph GT1M (r = 086) and RT3 (r = 088) The
GENEA also demonstrated excellent concurrent validity compared to the Actigraph GT1M (r =
092) and the RT3 (097) accelerometers Device-specific scatter plots in Figure 2 provide a
graphical comparison of criterion validity (ie METS versus each accelerometer‟s output) across
the varying activity conditions
Paragraph Number 20 Table 4 outlines the results of the ROC curve analysis for the
GENEA Across all three wear positions discrimination of sedentary behavior was almost
perfect with the area under the ROC curve ranging from 097-098 On account of reduced
specificity the discrimination of moderate activity was slightly less precise ranging from 084-
093 Meanwhile it was the reduced sensitivity of vigorous intensity cut points that
compromised the discrimination of vigorous activity which ranged from 089-092 Overall the
13
13
waist-worn GENEA had the greatest classification accuracy (095) followed by the left (093)
then right wrist (090) Interestingly the GENEA on the right wrist was unable to discriminate
between light and moderate intensity categories The overall ability to discriminate between
sedentary light moderate and vigorous intensity physical activity of the waist-worn GENEA
was virtually identical to that of the Actigraph GT1M (094) and the RT3 (095) (data not
shown)
DISCUSSION
Technical Reliability and Validity
Paragraph Number 21 Researchers have used various mechanical apparatuses to oscillate
accelerometers in various axes in an effort to assess reliability These apparatuses allow the
researcher to control the magnitude of the acceleration being imparted as well as the frequency
of the oscillation two key variables that contribute to the accelerometer‟s output Mechanical
setups by virtue of the precise control of the experimental conditions are able to determine the
variability attributed solely to the accelerometer Examples include turntables (15) rotating
wheel setups (2 16) vibration tables (20) and various types of mechanical shakers (5 12 22
24 26) This type of testing is important because if the measurement error intrinsic to the
accelerometer is found to be small then focus can shift to other sources of variation (eg
position worn on the body variation over time (eg day-to-day week-to-week season-to-
season) (15)
Paragraph Number 22 This is the first study to evaluate the technical reliability and
validity of the newly introduced GENEA accelerometer Utilizing 15 testing conditions across a
range of accelerations and frequencies the GENEA was found to be highly reliable with mean
intra- and inter-instrument coefficients of variation of 18 and 24 respectively Likewise the
14
14
GENEA was found to have excellent criterion validity when compared to the MAST acceleration
(r=097) Two thirds of the above-mentioned technical reliability studies focus on Actigraph
model accelerometers and as such it is a logical comparator for the GENEA Out of six studies
the current GENEA results demonstrate the highest technical reliability with the next best
performer coming in a recent study on the Actigraph GT1M (CVintra=29 and CVinter=35)
(24) In terms of criterion validity with the MAST the only relevant comparison comes from a
study on the Actigraph 7164 (2) where the validity coefficient was identical to the present study
Value Calibration
Paragraph Number 23 This is the first study to develop accelerometer cut points for both wrist
and waist-worn GENEA accelerometers that reflect sedentary light moderate and vigorous
intensity physical activity in adults The delineation of intensity of physical activity from
accelerometer data aids in the understanding of the relationship between health-related physical
activity and potential predictor variables such as adiposity age health status and ethnicity (10)
The process used to convert raw accelerometer data into more meaningful and interpretable units
is generally referred to as ldquovalue calibrationrdquo (30) Although raw accelerometer data provides an
indicator of overall movement a fundamental research challenge has been to determine how to
equate it to more meaningful indicators such as energy expenditure or time spent at given
activity intensity Being able to identify the amount of time spent in a range of intensity
categories is useful given the fact that numerous international physical activity guidelines
recommend various amounts of time be spent in specific intensity categories (27)
Paragraph Number 24 In the present study the GENEA demonstrated high levels of
criterion validity (with an average correlation with METS across wear positions of r = 085)
across 10-12 static and dynamic physical activities In fact the criterion validity of the GENEA
15
15
was virtually identical to that of the Actigraph and RT3 Similarly high levels of criterion
validity were shown by Bouten et al (1) during the development of their novel triaxial
accelerometer The GENEA also demonstrated high levels of concurrent validity compared to
the Actigraph GT1M and the RT3 with the highest correlations between the triaxial devices
These data illustrate that the GENEA is comparable to peer accelerometers a result that is
confirmed in the graphical representation of the data in Figure 2 However a closer look
suggests that the GENEA data are less variable than the RT3 and Actigraph across the intensity
spectrum Although speculative the tighter clustering of data within activities may provide
greater success for the GENEA when pursuing alternative analytical approaches For example
the tighter clustering of data within activities in the GENEA should allow for more optimal
activity classification (ie the determination of the mode of physical activity)
Paragraph Number 25 The GENEA SVMgs (g ∙ minutes) cut points established in this
study demonstrated excellent accuracy for classifying physical activity intensity across the
intensity spectrum Because this is the first article to report cut points for the GENEA it is not
possible to compare these values with other studies Although the accuracy of the GENEA was
greatest at the waist it also performed well at the wrist with the left wrist being more accurate
than the right The diminished accuracy experienced on the right wrist was likely due to
differences in participant handedness that is extraneous movements recorded during the activity
conditions were more likely to occur on the right wrist (eg scratching adjusting
clothingglasses hand gestures) However given small number of left handed participants (n=5)
testing of the hypothesis was untenable However it may be that activity signatures obtained
from the right wrist (dominant for over 80 of the population) may prove more useful than the
left (non-dominant) wrist Future research should specifically address this issue so that users
16
16
especially left handed users may know if wearing the GENEA on the right hand is possible The
small size of the GENEA and the fact that it can be positioned at the wrist a location intuitively
less obtrusive than the waist may help rectify issues related to participant compliance in future
studies and may allow for studies with extended physical activity monitoring periods (28)
Paragraph Number 26 Strengths and Limitations Several strengths are noteworthy in the
present study The first strength was the use of a mechanical shaker to perform a preliminary
technical reliability and validity assessment on the GENEA The use of this well controlled
experimental setup allowed for a robust assessment of this new technology Next the GENEA
output was collected analyzed and presented in a non-proprietary SI unit and as such can be
compared with other devices that retainemploy classical physics based measurements Next
ROC curve analysis was chosen to determine the physical activity intensity cut points which is
known to be superior to previous accelerometer calibration methods that employed linear
regression approaches (see Jago et al (10) for a more thorough discussion on this topic) To
date only four studies have employed ROC curve analysis to generate cut points and these were
done on children (3 6 10 31) A further strength of the ROC curve analyses was that the cut
points were chosen to optimize the balance between sensitivity and specificity (ie point nearest
01 on the ROC curve) which in all analyses also coincided with the Youden index ensuring the
optimality of the cut points The intuitive interpretation of the Youden index is that it is the point
on the curve farthest from chance (18) Finally the comparison to two widely used peer
technologies also strengthens the study as does the fact that energy expenditure (mlmiddotkg-1
middotmin-1
)
rather than direct observation was used to provide a continuous objective and physiologically
meaningful dependent variable with which to compare the GENEA data (25)
17
17
Paragraph Number 27 Several limitations of this study should be acknowledged First
the preliminary technical reliability and validity assessment was only performed on one axis the
vertical leaving the performance of the other two axes uncharacterized Next the comparison of
the GENEA would have been more appropriate with the triaxial Actigraph GT3X rather than the
GT1M accelerometer however at the time of this study the newer Actigraphs were not part of
our accelerometer inventory Next although our sample includes men and women of differing
ages and body size our population may not be representative Larger and more variable samples
(eg more left handed more overweight and obese participants) are needed to determine if these
factors might modify our findings In addition the activity conditions selected in this study may
not represent the full complement of activities undertaken by a population therefore caution
must be used when generalizing these results to other groups Finally cross-validation of the
GENEA physical activity intensity cut points by other research groups in different adult
populations is warranted
CONCLUSION
Paragraph Number 28 The GENEA demonstrated excellent technical reliability and validity and
excellent criterion validity compared to VO2 The GENEA cut points established in this study
can be used to estimate the time spent in sedentary light moderate and vigorous intensity
physical activity in adults As a result the GENEA has established itself as an objective and
feasible measurement tool comparable to other peer accelerometers such as the Actigraph
GT1M and RT3 with the potential of offering advanced measurement features in the future
Additional work is warranted to further refine the adult cut points and to develop cut points for
other age groups in an effort to calibrate the GENEA across the lifespan Given that the high
resolution sampling of the GENEA allows for advanced data mining (eg extraction of
18
18
frequency domain features) future research should strive to classifyrecognize activities of daily
living
Acknowledgments
This research was supported by a grant from Unilever Discover Colworth Bedford UK The
authors would like to thank the participants the graduate research assistants and the
administrative staff of the School of Sport and Health Sciences for their dedication to this
research project
Conflict of Interest
The results of the present study do not constitute endorsement by the authors or ACSM of
the products described in this paper This research was funded by an unrestricted research grant
awarded by Unilever Discover to the School of Sport and Health Sciences University of Exeter
The grant funded the salary of DE and small portions of the salaries of AR and RE At the time
of this research TH and MC were both employed by Unilever Discover However at the time of
manuscript submission MC and DE have no further relationship with Unilever Discover or any
of its operating companies None of the authors have a conflict of interest with Oralinsights the
manufacturer of the technology on which this manuscript is based
19
19
References
1 Bouten CV Koekkoek KT Verduin M Kodde R Janssen JD A triaxial accelerometer and
portable data processing unit for the assessment of daily physical activity IEEE Trans
Biomed Eng 199744(3)136-47
2 Brage S Brage N Wedderkopp N Froberg K Reliability and validity of the Computer
Science and Applications accelerometer in a mechanical setting Measurement in Physical
Education and Exercise Science 20037(2)101-19
3 Chu EY McManus AM Yu CC Calibration of the RT3 accelerometer for ambulation and
nonambulation in children Med Sci Sports Exerc 200739(11)2085-91
4 Esliger DW and Tremblay MS Physical activity and inactivity profiling the next generation
Can J Public Health 200798 Suppl 2S195-S207
5 Esliger DW and Tremblay MS Technical reliability assessment of three accelerometer
models in a mechanical setup Med Sci Sports Exerc 200638(12)2173-81
6 Evenson KR Catellier DJ Gill K Ondrak KS McMurray RG Calibration of two objective
measures of physical activity for children J Sports Sci 20081-9
7 Fruin ML and Rankin JW Validity of a multi-sensor armband in estimating rest and exercise
energy expenditure Med Sci Sports Exerc 200436(6)1063-9
8 Gizatullin AO and Edge KA Adaptive control for a multi-axis hydraulic test rig
Proceedings of the Institution of Mechanical Engineers Part I Journal of Systems and
Control Engineering 2007221(2)183-98
9 Grant PM Ryan CG Tigbe WW Granat MH The validation of a novel activity monitor in
the measurement of posture and motion during everyday activities Br J Sports Med
200640(12)992-7
10 Jago R Zakeri I Baranowski T Watson K Decision boundaries and receiver operating
characteristic curves new methods for determining accelerometer cutpoints J Sports Sci
200725(8)937-44
20
20
11 Karantonis DM Narayanan MR Mathie M Lovell NH Celler BG Implementation of a
real-time human movement classifier using a triaxial accelerometer for ambulatory
monitoring IEEE Trans Inf Technol Biomed 200610(1)156-67
12 Krasnoff JB Kohn MA Choy FK Doyle J Johansen K Painter PL Interunit and
intraunit reliability of the RT3 triaxial accelerometer J Phys Act Health 20085(4)527-38
13 McLaughlin JE King GA Howley ET Bassett DR Jr Ainsworth BE Validation of the
COSMED K4 b2 portable metabolic system Int J Sports Med 200122(4)280-4
14 McManus IC and Hartigan A Declining left-handedness in Victorian England seen in the
films of Mitchell and Kenyon Curr Biol 200717(18)R793-R794
15 Metcalf BS Curnow JS Evans C Voss LD Wilkin TJ Technical reliability of the CSA
activity monitor The EarlyBird Study Med Sci Sports Exerc 200234(9)1533-7
16 Moeller NC Korsholm L Kristensen PL Andersen LB Wedderkopp N Froberg K
Unit-specific calibration of Actigraph accelerometers in a mechanical setup - is it worth the
effort The effect on random output variation caused by technical inter-instrument variability
in the laboratory and in the field BMC Med Res Methodol 2008819
17 Montoye HJ Kemper HCG Saris WHM Washburn RA Measuring Physical Activity
and Energy Expenditure Champaign IL Human Kinetics 1996
18 Perkins NJ and Schisterman EF The inconsistency of optimal cutpoints obtained using
two criteria based on the receiver operating characteristic curve Am J Epidemiol
2006163(7)670-5
19 Porcari J McCarron R Kline G Freedson PS Ward A Ross JA Rippe JM Is fast
walking an adequate aerobic training stimulus for 30- to 69-year-old men and women
Physician Sportsmed 198715(2)119-29
20 Powell SM Jones DI Rowlands AV Technical variability of the RT3 accelerometer
Med Sci Sports Exerc 200335(10)1773-8
21 Rennie KL and Jebb SA Prevalence of obesity in Great Britain Obes Rev 20056(1)11-
2
21
21
22 Rothney MP Apker GA Song Y Chen KY Comparing the performance of three
generations of ActiGraph accelerometers J Appl Physiol 2008105(4)1091-7
23 Shephard RJ Absolute versus relative intensity of physical activity in a dose-response
context Med Sci Sports Exerc 200133(6 Suppl)S400-S418
24 Silva P Esliger DW Welk GJ Mota J Technical reliability assessment of the Actigraph
GT1M accelerometer Measurement in Physical Education and Exercise Science
20101479-91
25 Sirard JR Trost SG Pfeiffer KA Dowda M Pate RR Calibration and evaluation of an
objective measure of physical activity in preschool children Journal of Physical Activity and
Health 20053345-57
26 Van Hees V Slootmaker SM De GG Van MW Van Lummel RC Reproducibility of a
triaxial seismic accelerometer (DynaPort) Med Sci Sports Exerc 200941(4)810-7
27 Warburton DE Katzmarzyk PT Rhodes RE Shephard RJ Evidence-informed physical
activity guidelines for Canadian adults Can J Public Health 200798 Suppl 2S16-S68
28 Ware LJ Hurling R Bataveljic O Fairley BW Hurst TL Murray P Rennie KL
Tomkins CE Finn A Cobain MR Pearson DA Foreyt JP Rates and determinants of uptake
and use of an internet physical activity and weight management program in office and
manufacturing work sites in England cohort study J Med Internet Res 200810(4)e56
29 Welk G Physical Activity Assessments for Health-Related Research Champaign IL Human Kinetics 2002
30 Welk GJ Principles of design and analyses for the calibration of accelerometry-based
activity monitors Med Sci Sports Exerc 200537(11 Suppl)S501-S511
31 Welk GJ Eisenmann JC Schaben J Trost SG Dale D Calibration of the biotrainer pro
activity monitor in children Pediatr Exerc Sci 200719(2)145-58
32 Zhang K Werner P Sun M Pi-Sunyer FX Boozer CN Measurement of human daily
physical activity Obes Res 200311(1)33-40
22
22
Figure Captions
Figure 1 Inset right Overhead view of GENEA accelerometers positioned in the test jig Inset
left Multi-Axis Shaker Table (MAST) complete with the test jig secured in place Main Figure
Comparison of a typical output trace from one GENEA accelerometer across the 15 test
conditions
Notes i) the trace represents the middle 50 seconds of each of the 15 conditions
Figure 2 Relationship between physical activity intensity (METS) versus the outputs from the
waist worn GENEA SVMgs (g middot minutes) RT3 (countsminute) and Actigraph (countsmin)
accelerometers across the 16 activity conditions
Table 1 Reliability results for the GENEA for all 15 test conditions
Acceleration Frequency Amplitude GENEA SVMgs
(g ∙ seconds)
CV intra
CV inter
g (mmiddots-2
) (Hz) (m) Mean SD GENEA GENEA
005 049 10 00124 3 01 39 53
022 216 10 00547 11 02 17 20
046 451 30 00127 23 02 08 14
046 451 25 00183 24 02 09 14
048 471 20 00298 25 03 10 14
049 481 15 00541 25 03 11 16
079 775 50 00079 41 04 10 15
091 893 30 00251 46 04 08 13
125 1226 45 00153 57 08 15 21
129 1265 40 00200 58 08 13 20
131 1285 35 00266 59 12 21 26
138 1354 30 00381 60 06 10 18
168 1648 45 00206 64 22 34 37
184 1805 30 00508 66 09 13 22
252 2472 45 00309 84 43 51 53
Average variability across all 15 test conditions 18 24
Table 1
Table 2 Descriptive characteristics of the study participants
Gender Sample
Size Age
Left
Handed
Right
Handed
Height
(cm)
Weight
(kg)
BMI
(kg∙m-2
)
Body Fat
()
Male 23 489 (68) 1 22 1762 (62) 806 (116) 259 (27) 207 (34)
Female 37 496 (64) 4 33 1628 (54) 629 (84) 238 (35) 328 (66)
Overall 60 494 (65) 5 55 1679 (87) 697 (130) 246 (34) 282 (81)
for the measurement of body fat there were 2 less participants (1 male and 1 female)
Table 2
Table 3 Average intensity (METS) and average left right and waist positioned GENEA output by activity
GENEA
(SVMgs (g middot minutes)
Actigraph (CountsMinute)
RT3 (VM CountsMinute)
Activity Grouping
N METS Left Wrist Right Wrist Waist Waist Waist
Mean SD Mean SD Mean SD Mean SD Mean SD Mean SD
Lateral Recumbent (lying on side) Posture
(all)
53 094 023 63 55 143 53 34 17 0 0 4 11
Seated Computer Work 55 122 029 185 86 242 67 48 33 1 3 9 21
Standing 55 113 025 100 66 103 177 48 15 0 0 3 9
Window Washing Lifestyle
(2 of 4)dagger
31 337 106 469 693 1808 708 185 61 138 177 463 344
Washing Dishes 24 235 045 634 177 768 239 132 164 51 80 160 74
Shelf Stacking 30 419 098 884 224 940 202 214 72 2620 1933 421 297
Sweeping 23 339 067 878 264 976 289 187 48 465 355 356 96
Slow Treadmill Walk (4 km∙hr-1
) Ambulatory
(all)
54 388 069 864 195 847 232 856 221 2323 643 1267 318
Medium Treadmill Walk (5 km∙hr-1
) 55 459 079 1177 299 1204 357 1264 214 3745 656 1659 331
Brisk Treadmill Walk (6 km∙hr-1
) 55 588 098 1506 400 1513 350 1815 272 4917 940 2228 450
Stair AscentDescent (80 steps∙min-1
) Stairs (all) 55 619 110 836 620 794 597 697 127 2427 780 811 208
Slow Treadmill Run (8 km∙hr-1
) Ambulatory
(1 of 3)Dagger
18 1113 138 3858 588 4087 798 3553 593 8936 1794 4578 799
Medium Treadmill Run (10 km∙hr-1
) 14 1200 124 5345 1073 4915 787 4043 325 8904 1826 5419 423
Fast Treadmill Run (12 km∙hr-1
) 5 1361 060 5096 2339 5358 2460 4066 299 6982 3233 6093 674
Brisk Free-living Walk (6 km∙hr-1
) Ambulatory
(all) 40 576 094 1433 171 1474 216 1769 227 4912 748 2434 559
Medium Free-living Run (10 km∙hr-1
) Ambulatory
(optional) 5 1262 117 5151 1113 4844 1232 3756 631 8825 1592 5525 787
listwise sample size dagger indicates that participants were randomly allocated 2 out of the 4 activities in this grouping
Dagger indicates that participants had the option to run (select 1 out of the 3 activities in this grouping) if they so chose
Note 1 MET = 35 ml∙kg∙min-1
Table 3
Table 4 Sensitivity specificity area under the ROC curve and GENEA SVMgs (g middot minutes)
cut points that maximized sensitivity and specificity at three wear positions
Intensity Sensitivity Specificity Area under ROC
curve (95 CI)
GENEA Cut points
SVMgs (g middot minutes)
Left Wrist
Sedentary 97 95 098 (098-099) lt 217
Light NA NA NA 217-644
Moderate 95 72 091 (088-093) 645-1810
Vigorous 78 98 091 (086-095) gt 1810
Right Wrist
Sedentary 99 96 098 (097-099) lt 386
Light NA NA NA 386-439
Moderate 100 56 084 (0-81-087) 440-2098
Vigorous 78 97 089 (084-094) gt 2098
Waist
Sedentary 99 96 097 (096-098) lt 77
Light NA NA NA 77-219
Moderate 96 80 093 (091-095) 220-2056
Vigorous 73 99 092 (088-096) gt 2056
Sedentary (lt15 METS) light (15-399 METS) moderate (400-699 METS) vigorous (7+
METS)
NA = not applicable as the sedentary and moderate cut points provide the boundaries for the light
intensity category
Table 4
0
10
20
30
40
50
60
70
80
90
100
GE
NE
A
SV
Mg
s (g
s
eco
nd
s)
Condition1 2 3 4 5 6 7 8 9 10 11 12 13 14 15
Figure 1
GENEA SVMgs (g minutes)
Figure 2
2
Abstract Purpose The study aims were 1) to assess the technical reliability and validity of the GENEA
using a mechanical shaker 2) to perform a GENEA value calibration to develop thresholds for
sedentary light moderate and vigorous intensity physical activity and 3) to compare the
intensity classification of the GENEA with two widely used accelerometers Methods 47
GENEAs were attached to a shaker and vertically accelerated generating 15 conditions of
varying acceleration andor frequency Reliability was calculated using standard deviation and
intra- and inter-instrument coefficient of variation while validity was assessed via Pearson
correlation with the shaker acceleration as the criterion Next 60 adults wore a GENEA on each
wrist and on the waist (alongside an Actigraph and RT3 accelerometer) while completing 10-12
activity tasks A portable metabolic gas analyzer provided the criterion measure of physical
activity Analyses involved the use of Pearson correlations to establish criterion and concurrent
validity and ROC curves to establish intensity cut points Results The GENEA demonstrated
excellent technical reliability (CVintra=14 CVinter=21) and validity (r=098 plt0001) using
the mechanical shaker The GENEA demonstrated excellent criterion validity using VO2 as the
criterion (left wrist r=086 right wrist r=083 waist r=087) on par with the waist-worn
Actigraph and RT3 The GENEA demonstrated excellent concurrent validity compared to the
Actigraph (r=092) and the RT3 (r=097) The waist-worn GENEA had the greatest
classification accuracy (Area Under the ROC curve AUC=095) followed by the left (093) then
right wrist (090) The accuracy of the waist-worn GENEA was virtually identical to the
Actigraph (AUC=094) and RT3 (095) Conclusions The GENEA is a reliable and valid
measurement tool capable of classifying the intensity of physical activity in adults
Key Words ACTIVITY MONITOR MEASUREMENT ACCELERATION FREQUENCY
GRAVITY RELIABILITY
3
3
INTRODUCTION
Paragraph Number 1 The unequivocal link between physical activity and health has prompted
exercise science and public health researchers their learned societies and their funders to search
for better and more logistically feasible and objective tools to measure physical activity
This focus has facilitated the development of many objective measurement technologies such as
accelerometers (described in detail elsewhere (17 29)) which provide robust and detailed
physical activity information (4)
Paragraph Number 2 Although much progress has been made in the assessment of
physical activity with accelerometers there are a number of limitations that still need to be
addressed An important first step would be to convince manufacturers to abolish the practice of
disguising raw acceleration outcomes via proprietary bdquocount‟ units as it hinders between model
comparisons Second increased battery life and memory storage would benefit users that require
higher resolution signals This is especially important for multi-axis accelerometers and seismic-
based technologies (26) However a balance must be struck to ensure that the quest for richer
data does not interfere with other more practical issues related to accelerometer size weight and
functionality For example the IDEEA monitor (32) utilizes an array of wired accelerometers
and as such is somewhat obtrusive That said there are some accelerometers such as the Sensor
Wear Armband (7) the ActivPal (9) and the DynaPort (26) that seem to have balanced the
desire for advanced measurement capabilities such as activity classification with feasibility
issues (eg the desire for high resolution acceleration data and the need to remain unobtrusive)
More recently another accelerometer the GENEA has been developed
Paragraph Number 3 This manuscript functions to introduce the GENEA a novel
acceleration sensor developed by Unilever Discover (Colworth United Kingdom) and
4
4
manufactured and distributed by Oralinsights Limited (Kimbolton Cambridgeshire United
Kingdom) Therefore the purpose of this study was threefold 1) to perform a preliminary
technical reliability and validity assessment of the GENEA using a mechanical shaker table 2) to
perform a value calibration of the GENEA to develop thresholds for sedentary light moderate
and vigorous intensity physical activity in adults and 3) to compare the intensity classification of
the GENEA with two widely used accelerometers
METHODS
Technical Reliability and Validity
Paragraph Number 4 Accelerometers The GENEA is a triaxial plusmn 6 g seismic acceleration
sensor (LIS3LV02DL STMicroelectronics Geneva Switzerland) The small (36x30x12
LxWxH mm) and lightweight (16 grams) splashproof design of the GENEA allow it to be easily
worn at multiple locations on the body (eg wrist waist ankle) The GENEA has 500
megabytes of memory to assist with the storage of the raw 80 Hz sampling frequency and can
store ~8 days of data in raw mode with 12 bit resolution Users have the ability to select user-
defined sample frequencies ranging from 10-80 Hz Using the GENEA software (version 1487
update 531) via USB to PC connection 47 GENEA accelerometers were initialized to collect
unfiltered triaxial acceleration data at a sample rate of 80 Hz
Paragraph Number 5 Multi-axis shaking table All technical reliability and validity testing
was completed using a Multi-Axis Shaking Table (MAST) manufactured by Instron Structural
Testing Systems (Buckinghamshire United Kingdom) with an industrial Labtronic 8800 Digital
Controller (Darmstadt Germany) The MAST has been described in detail by Gizatullin and
Edge (8) The MAST is designed to recreate spatial motion of the platform in three dimensions
however only vertical motion was used in this preliminary technical reliability and validity
5
5
study Using a combination of command file and individually entered position command
signals the MAST was programmed to accurately and reliably oscillate the platform at the
various testing conditions using a sinusoidal oscillation procedure The testing conditions were
restricted by the MAST stroke limits of approximately plusmn75 mm The range of possible
conditions of acceleration and frequency of oscillation are described by the equation
acceleration (ms-2
) = (amplitude (m) frequency2
(rads-1
) Fifteen different conditions were
selected to produce a range of physiologically relevant accelerations from light to moderate to
vigorous within the limitations of the MAST
Paragraph Number 6 The GENEA accelerometers were securedenclosed in a custom test
jig (Figure 1 inset right) lined with high density foam to avoid potential vibration transference
and bolted to the surface of the shaker table (Figure 1 inset left) Care was taken to ensure that
the monitors were secured firmly so the vertical movement was along the y-axis of the GENEA
Next the first test condition was programmed and the condition was executed accelerating all
accelerometers simultaneously in the vertical plane for the 60 second test duration All 15
conditions were completed in this fashion and when complete the accelerometers were removed
from the shaker plate and test jig
Paragraph Number 7 Data Reduction All 47 GENEA accelerometers were downloaded to the
initialization PC resulting in the creation of 47 raw 80 Hz data files containing unfiltered time
and date stamped x y and z axis acceleration data (in gravitational units (g) complete with
negative sign indicating directionality) These data were downloaded in comma separated values
file format (csv extension) however the user may also (or instead) choose a binary format (bin
extension) Although both files contain the same data the binary format is much more efficient
at nearly 8 times smaller file size Using the GENEA Post Processing software (version 121)
6
6
the raw 80 Hz triaxial GENEA data were summarized into a signal magnitude vector (gravity-
subtracted) (SVMgs) using 1 second epochs [see equation 1] (11) The resulting SI units for this
outcome variable are g ∙ seconds
Equation 1
SVMgs = 2 2 2x y z g
where the correction for gravity was undertaken to focus the outcome variable on
dynamic rather than static accelerations
Although not the focus of the present study the post processing software does allow the user to
summarize the raw triaxial signal using units of acceleration This is achieved by using the mean
signal magnitude vector over the user-defined epoch [see equation 2] rather than the integral
measure of the SVM as outlined above (26)
Equation 2
SVM = 2 2 2x y z
as this is a mean rather than an cumulative sum it retains its gravity-based acceleration
units (g) where 1 g=981 mmiddots-2
Next data were imported into a customized spreadsheet application using the common epoch-
by-epoch time stamp to alignsynchronize the data across units and models (verified by cross-
correlation analyses) The recorded condition start and end times were identified and the middle
50 seconds of each condition were extracted for further analysis
Paragraph Number 8 Statistical Analyses For all test conditions the mean count output (50
replicate seconds) of each accelerometer for each condition was calculated Intra- and inter-
instrument reliability was calculated using standard deviation and coefficient of variation (CVintra
and CVinter) Pearson product-moment correlation was used to determine the criterion validity of
7
7
the GENEA versus the MAST acceleration All analyses were performed using SPSS version
150 for Windows (SPSS Chicago USA)
Value Calibration
Paragraph Number 9 Participants Participant recruitment was initiated in February 2008 in an
effort to obtain a convenience sample of 60 male and female volunteers aged 40-65 years Two
recruitment methods were used an email to employees of the University of Exeter Exeter
Devon UK and an advertisement in a local newspaper A health and fitness report and a pound20 gift
card were offered as incentive and honorarium respectively for participating in the study Data
collection was undertaken in March and April 2008 after which time 60 adults (62 female)
aged 40ndash63 years completed the study protocol All participants were free from diagnosed
disease and musculoskeletal injury and had no affirmative answers to the Physical Activity
Readiness Questionnaire (PAR-Q) Written informed consent was obtained from each
participant The study was approved by the Ethics committee of the School of Sport and Health
Sciences University of Exeter
Paragraph Number 10 Data Collection Procedures Participants arrived at the laboratory
having refrained from consuming nicotine caffeine or a large meal for at least two hours prior
and exercise at least 6 hours prior to the appointment As part of a larger battery of
anthropometry and health-related fitness tests (peripheral to the present study) participants had
their height (to the nearest 01 cm) and body mass (to the nearest 01 kg) measured using a
Holtain stadiometer (Holtain Crymych Dyfedd UK) and a Tanita TBF-305 scale (Tanita UK
Ltd Middlesex UK) respectively Whole body bioelectrical impedance analysis (BodyStat
1500 BodyStat Onchan Isle of Man United Kingdom) was also performed to determine
percent body fat Next each participant was asked to complete an ordered series of 10-12 semi-
8
8
structured activities in the laboratory and free-living environment The lying activity was
performed for 10 minutes while all other activities were performed for 45 minutes In between
each activity the participants were given at least 2 minutes rest to allow them to prepare for the
next activity and for their metabolic rate (oxygen uptake) to recover to pre-activity levels
Throughout testing VO2 VCO2 and heart rate were measured by the Cosmed K4b2 (Rome
Italy) portable metabolic gas analysis system with heart rate receiver Prior to each testing
session the K4b2 was calibrated with gases of known concentration and the flow sensor
calibration and environmental conditions updated Lastly the K4b2 and the computer running
the software were time-synchronized with the Greenwich Mean Time server The K4b2 has
been shown to provide valid measurements of oxygen uptake across a range of exercise
intensities (13) After each testing session the relative VO2 data were downloaded and stored on
a PC for further analysis
Paragraph Number 11 Accelerometer Throughout testing three GENEA accelerometers were
worn one on each of the left and right wrists (using simple watch straps accelerometers
positioned over the dorsal aspect of the wrists midway between the radial and ulnar styloid
processes) and one on the waist (using a elasticized belt accelerometer positioned over the right
hip mid-clavicular line landmarked by the supraspinale) The same three GENEAs were used
by all 60 participants and were always positioned at the same sites for each On the same belt
adjacent to the waist-worn GENEA participants wore two peer accelerometers a uniaxial
Actigraph GT1M accelerometer with firmware version 300 (Actigraph Pensacola Florida
USA) and a triaxial RT3 accelerometer (Stayhealthycom Monrovia California USA) At the
start of each testing session the accelerometers were time synchronized with the GMT time
server and initialized to record acceleration data The epoch length was set at 80 Hz 1 second
9
9
and 1 minute 3-axis for the GENEAs Actigraph and RT3‟s respectively however only the
vector magnitude data from the RT3 were analyzed After each testing session the accelerometer
data were downloaded and stored on a PC for further analysis
Paragraph Number 12 Data Analyses Using the K4b2 software the breath-by-breath VO2
data were filtered using 1 minute averaging Using the GENEA Post Processing software
(version 121) the raw 80 Hz triaxial GENEA data were summarized into SVMgs using 1 minute
epoch intervals The Actigraph data were also integrated to 1-minute epochs for further analysis
Custom spreadsheet applications were developed to temporally synchronize the minute-by-
minute data from the K4b2 with the data from the three accelerometer models The combined
data set was then plotted to facilitate the selection of the minute of accelerometer data that
coincided with steady-state VO2 for each of the activities performed Ideally and in most cases
this was the 4th
minute of each activity however in a minority of cases the 3rd
minute was
selected as it better represented steady-state due to occasional time synchronization issues (the
10th
or 9th
minute for the lying activity) The relative VO2 and accelerometer data corresponding
to the selected minute were exported to SPSS version 150 for Windows (SPSS Chicago USA)
for further analysis Pearson correlations were calculated between each accelerometer output
and VO2
Paragraph Number 13 The VO2 data were converted to METS using the standard
conversion of 1 MET = 35 mlmiddotkg-1
middotmin-1
and then coded into one of four absolute intensity
categories sedentary (lt15 METS) light (15-399 METS) moderate (400-699 METS) or
vigorous (7+ METS) activity The impetus for using 4 and 7 rather than 3 and 6 MET
thresholds to mark moderate and vigorous intensity physical activity follows the rationale
described in a review by Shephard (23) Citing work by Porcari et al (19) Shephard noted that
10
10
those deriving health benefits from lifestyle activities tended to be sedentary obese and elderly
people those for whom a given absolute intensity of effort such as brisk walking develops a
substantial relative intensity of effort Simply put because the present sample were
sedentaryunfit their physical activity energy expenditure for a given absolute intensity effort
such as a brisk walk is likely to be higher than for fitter individuals Therefore developing cut
points on an unfit sample using 3 and 6 MET thresholds would result in an increased chance of
erroneously categorizing fitter individuals as active rather than inactive As this was the case in
the present study the higher absolute intensity cut points of 4 and 7 METS were chosen
Paragraph Number 14 Next the accelerometer data were recoded to create binary
indicator variables (0 or 1) to facilitate the Receiver Operator Characteristic (ROC) curve
analyses For sedentary this corresponded to sedentary activities versus more than sedentary
activities For moderate intensity this corresponded to less than moderate activities versus
moderate to vigorous activities For vigorous intensity this corresponded to vigorous activities
versus less than vigorous activities Next the binary coded accelerometer data were exported to
GraphPad Prism 400 for Windows (GraphPad Software San Diego USA) to undergo the ROC
curve analyses
Paragraph Number 15 A ROC curve is a graphical technique for describing and
comparing the accuracy of diagnostic tests In the present application ROC analysis is used to
examine the potential of using thresholds within the GENEA Actigraph and RT3 data to
discriminate between four activity intensity categories As Jago et al (10) described ROC
analysis is a means to evaluate and visualize the sensitivity [true positives(true positives + false
negatives)] and specificity [true negatives(true negatives + false positives)] of tests The ROC
curve is simply a plot of the sensitivity of a test on the y-axis versus its 1-specificity (ie false
11
11
positive fraction on the x-axis) Each possible threshold value corresponds to a point on the ROC
curve The upper-left corner [the point (0 1)] represents perfect classification and the diagonal
line represents the strategy of randomly guessing Sensitivity is maximized by correctly
identifying at or above the threshold for intensity whereas specificity is maximized by correctly
excluding activities below the threshold for intensity Similar to the methods of Evenson et al
(6) the cut points at which sensitivity and specificity were both maximized were identified
RESULTS
Technical Reliability and Validity
Paragraph Number 16 All 47 GENEA accelerometers successfully initialized collected and
downloaded data The mean SMVgs (g ∙ seconds) for the GENEA accelerometers displayed a
linear trajectory across all 15 testing conditions when organized from low to high acceleration
values (Figure 1 main) The average intra- and inter-instrument reliability of the 47 GENEA
accelerometers across the 15 conditions was CVintra=18 and CVinter=24 respectively The
criterion validity for the GENEA versus the MAST acceleration for all 15 test conditions was
excellent (r=097 plt0001)
Value Calibration
Paragraph Number 17 Descriptive characteristics of the participants are shown in Table 2 The
BMI data are a testament to the fact that this is a convenience sample as the participants are
leaner than the general population In fact the prevalence of obesity among the group was 4
for men and 5 for women much lower than the 23 and 25 found in the general population
(21) However the number of left handed participants in this study (12) matched well the 11
prevalence of left handedness in the UK population (14)
12
12
Paragraph Number 18 Table 3 compares the average METS and the position-specific
GENEA results As expected the activities in the posture grouping were the lowest intensity
while the optional running activities were the highest which was reflected in the VO2 and the
accelerometer output The fact that the slow treadmill walking an activity intended to be light
intensity resulted in an average 388 METS response helps to justify the decision to utilize the
higher absolute intensity cut points of 4 and 7 METS to distinguish moderate and vigorous
intensity activity in this sample Comparing the different wear positions of the GENEA showed
that data for the left and right wrists were similar while the mean GENEA data collected at the
waist were lower as were the standard deviations Comparative data from the waist-worn
Actigraph and RT3 are also displayed in Table 3
Paragraph Number 19 Using relative VO2 as the criterion the GENEA demonstrated
excellent criterion validity across all activities (left r = 086 right r = 083 waist r = 087)
performing as well at the waist as the Actigraph GT1M (r = 086) and RT3 (r = 088) The
GENEA also demonstrated excellent concurrent validity compared to the Actigraph GT1M (r =
092) and the RT3 (097) accelerometers Device-specific scatter plots in Figure 2 provide a
graphical comparison of criterion validity (ie METS versus each accelerometer‟s output) across
the varying activity conditions
Paragraph Number 20 Table 4 outlines the results of the ROC curve analysis for the
GENEA Across all three wear positions discrimination of sedentary behavior was almost
perfect with the area under the ROC curve ranging from 097-098 On account of reduced
specificity the discrimination of moderate activity was slightly less precise ranging from 084-
093 Meanwhile it was the reduced sensitivity of vigorous intensity cut points that
compromised the discrimination of vigorous activity which ranged from 089-092 Overall the
13
13
waist-worn GENEA had the greatest classification accuracy (095) followed by the left (093)
then right wrist (090) Interestingly the GENEA on the right wrist was unable to discriminate
between light and moderate intensity categories The overall ability to discriminate between
sedentary light moderate and vigorous intensity physical activity of the waist-worn GENEA
was virtually identical to that of the Actigraph GT1M (094) and the RT3 (095) (data not
shown)
DISCUSSION
Technical Reliability and Validity
Paragraph Number 21 Researchers have used various mechanical apparatuses to oscillate
accelerometers in various axes in an effort to assess reliability These apparatuses allow the
researcher to control the magnitude of the acceleration being imparted as well as the frequency
of the oscillation two key variables that contribute to the accelerometer‟s output Mechanical
setups by virtue of the precise control of the experimental conditions are able to determine the
variability attributed solely to the accelerometer Examples include turntables (15) rotating
wheel setups (2 16) vibration tables (20) and various types of mechanical shakers (5 12 22
24 26) This type of testing is important because if the measurement error intrinsic to the
accelerometer is found to be small then focus can shift to other sources of variation (eg
position worn on the body variation over time (eg day-to-day week-to-week season-to-
season) (15)
Paragraph Number 22 This is the first study to evaluate the technical reliability and
validity of the newly introduced GENEA accelerometer Utilizing 15 testing conditions across a
range of accelerations and frequencies the GENEA was found to be highly reliable with mean
intra- and inter-instrument coefficients of variation of 18 and 24 respectively Likewise the
14
14
GENEA was found to have excellent criterion validity when compared to the MAST acceleration
(r=097) Two thirds of the above-mentioned technical reliability studies focus on Actigraph
model accelerometers and as such it is a logical comparator for the GENEA Out of six studies
the current GENEA results demonstrate the highest technical reliability with the next best
performer coming in a recent study on the Actigraph GT1M (CVintra=29 and CVinter=35)
(24) In terms of criterion validity with the MAST the only relevant comparison comes from a
study on the Actigraph 7164 (2) where the validity coefficient was identical to the present study
Value Calibration
Paragraph Number 23 This is the first study to develop accelerometer cut points for both wrist
and waist-worn GENEA accelerometers that reflect sedentary light moderate and vigorous
intensity physical activity in adults The delineation of intensity of physical activity from
accelerometer data aids in the understanding of the relationship between health-related physical
activity and potential predictor variables such as adiposity age health status and ethnicity (10)
The process used to convert raw accelerometer data into more meaningful and interpretable units
is generally referred to as ldquovalue calibrationrdquo (30) Although raw accelerometer data provides an
indicator of overall movement a fundamental research challenge has been to determine how to
equate it to more meaningful indicators such as energy expenditure or time spent at given
activity intensity Being able to identify the amount of time spent in a range of intensity
categories is useful given the fact that numerous international physical activity guidelines
recommend various amounts of time be spent in specific intensity categories (27)
Paragraph Number 24 In the present study the GENEA demonstrated high levels of
criterion validity (with an average correlation with METS across wear positions of r = 085)
across 10-12 static and dynamic physical activities In fact the criterion validity of the GENEA
15
15
was virtually identical to that of the Actigraph and RT3 Similarly high levels of criterion
validity were shown by Bouten et al (1) during the development of their novel triaxial
accelerometer The GENEA also demonstrated high levels of concurrent validity compared to
the Actigraph GT1M and the RT3 with the highest correlations between the triaxial devices
These data illustrate that the GENEA is comparable to peer accelerometers a result that is
confirmed in the graphical representation of the data in Figure 2 However a closer look
suggests that the GENEA data are less variable than the RT3 and Actigraph across the intensity
spectrum Although speculative the tighter clustering of data within activities may provide
greater success for the GENEA when pursuing alternative analytical approaches For example
the tighter clustering of data within activities in the GENEA should allow for more optimal
activity classification (ie the determination of the mode of physical activity)
Paragraph Number 25 The GENEA SVMgs (g ∙ minutes) cut points established in this
study demonstrated excellent accuracy for classifying physical activity intensity across the
intensity spectrum Because this is the first article to report cut points for the GENEA it is not
possible to compare these values with other studies Although the accuracy of the GENEA was
greatest at the waist it also performed well at the wrist with the left wrist being more accurate
than the right The diminished accuracy experienced on the right wrist was likely due to
differences in participant handedness that is extraneous movements recorded during the activity
conditions were more likely to occur on the right wrist (eg scratching adjusting
clothingglasses hand gestures) However given small number of left handed participants (n=5)
testing of the hypothesis was untenable However it may be that activity signatures obtained
from the right wrist (dominant for over 80 of the population) may prove more useful than the
left (non-dominant) wrist Future research should specifically address this issue so that users
16
16
especially left handed users may know if wearing the GENEA on the right hand is possible The
small size of the GENEA and the fact that it can be positioned at the wrist a location intuitively
less obtrusive than the waist may help rectify issues related to participant compliance in future
studies and may allow for studies with extended physical activity monitoring periods (28)
Paragraph Number 26 Strengths and Limitations Several strengths are noteworthy in the
present study The first strength was the use of a mechanical shaker to perform a preliminary
technical reliability and validity assessment on the GENEA The use of this well controlled
experimental setup allowed for a robust assessment of this new technology Next the GENEA
output was collected analyzed and presented in a non-proprietary SI unit and as such can be
compared with other devices that retainemploy classical physics based measurements Next
ROC curve analysis was chosen to determine the physical activity intensity cut points which is
known to be superior to previous accelerometer calibration methods that employed linear
regression approaches (see Jago et al (10) for a more thorough discussion on this topic) To
date only four studies have employed ROC curve analysis to generate cut points and these were
done on children (3 6 10 31) A further strength of the ROC curve analyses was that the cut
points were chosen to optimize the balance between sensitivity and specificity (ie point nearest
01 on the ROC curve) which in all analyses also coincided with the Youden index ensuring the
optimality of the cut points The intuitive interpretation of the Youden index is that it is the point
on the curve farthest from chance (18) Finally the comparison to two widely used peer
technologies also strengthens the study as does the fact that energy expenditure (mlmiddotkg-1
middotmin-1
)
rather than direct observation was used to provide a continuous objective and physiologically
meaningful dependent variable with which to compare the GENEA data (25)
17
17
Paragraph Number 27 Several limitations of this study should be acknowledged First
the preliminary technical reliability and validity assessment was only performed on one axis the
vertical leaving the performance of the other two axes uncharacterized Next the comparison of
the GENEA would have been more appropriate with the triaxial Actigraph GT3X rather than the
GT1M accelerometer however at the time of this study the newer Actigraphs were not part of
our accelerometer inventory Next although our sample includes men and women of differing
ages and body size our population may not be representative Larger and more variable samples
(eg more left handed more overweight and obese participants) are needed to determine if these
factors might modify our findings In addition the activity conditions selected in this study may
not represent the full complement of activities undertaken by a population therefore caution
must be used when generalizing these results to other groups Finally cross-validation of the
GENEA physical activity intensity cut points by other research groups in different adult
populations is warranted
CONCLUSION
Paragraph Number 28 The GENEA demonstrated excellent technical reliability and validity and
excellent criterion validity compared to VO2 The GENEA cut points established in this study
can be used to estimate the time spent in sedentary light moderate and vigorous intensity
physical activity in adults As a result the GENEA has established itself as an objective and
feasible measurement tool comparable to other peer accelerometers such as the Actigraph
GT1M and RT3 with the potential of offering advanced measurement features in the future
Additional work is warranted to further refine the adult cut points and to develop cut points for
other age groups in an effort to calibrate the GENEA across the lifespan Given that the high
resolution sampling of the GENEA allows for advanced data mining (eg extraction of
18
18
frequency domain features) future research should strive to classifyrecognize activities of daily
living
Acknowledgments
This research was supported by a grant from Unilever Discover Colworth Bedford UK The
authors would like to thank the participants the graduate research assistants and the
administrative staff of the School of Sport and Health Sciences for their dedication to this
research project
Conflict of Interest
The results of the present study do not constitute endorsement by the authors or ACSM of
the products described in this paper This research was funded by an unrestricted research grant
awarded by Unilever Discover to the School of Sport and Health Sciences University of Exeter
The grant funded the salary of DE and small portions of the salaries of AR and RE At the time
of this research TH and MC were both employed by Unilever Discover However at the time of
manuscript submission MC and DE have no further relationship with Unilever Discover or any
of its operating companies None of the authors have a conflict of interest with Oralinsights the
manufacturer of the technology on which this manuscript is based
19
19
References
1 Bouten CV Koekkoek KT Verduin M Kodde R Janssen JD A triaxial accelerometer and
portable data processing unit for the assessment of daily physical activity IEEE Trans
Biomed Eng 199744(3)136-47
2 Brage S Brage N Wedderkopp N Froberg K Reliability and validity of the Computer
Science and Applications accelerometer in a mechanical setting Measurement in Physical
Education and Exercise Science 20037(2)101-19
3 Chu EY McManus AM Yu CC Calibration of the RT3 accelerometer for ambulation and
nonambulation in children Med Sci Sports Exerc 200739(11)2085-91
4 Esliger DW and Tremblay MS Physical activity and inactivity profiling the next generation
Can J Public Health 200798 Suppl 2S195-S207
5 Esliger DW and Tremblay MS Technical reliability assessment of three accelerometer
models in a mechanical setup Med Sci Sports Exerc 200638(12)2173-81
6 Evenson KR Catellier DJ Gill K Ondrak KS McMurray RG Calibration of two objective
measures of physical activity for children J Sports Sci 20081-9
7 Fruin ML and Rankin JW Validity of a multi-sensor armband in estimating rest and exercise
energy expenditure Med Sci Sports Exerc 200436(6)1063-9
8 Gizatullin AO and Edge KA Adaptive control for a multi-axis hydraulic test rig
Proceedings of the Institution of Mechanical Engineers Part I Journal of Systems and
Control Engineering 2007221(2)183-98
9 Grant PM Ryan CG Tigbe WW Granat MH The validation of a novel activity monitor in
the measurement of posture and motion during everyday activities Br J Sports Med
200640(12)992-7
10 Jago R Zakeri I Baranowski T Watson K Decision boundaries and receiver operating
characteristic curves new methods for determining accelerometer cutpoints J Sports Sci
200725(8)937-44
20
20
11 Karantonis DM Narayanan MR Mathie M Lovell NH Celler BG Implementation of a
real-time human movement classifier using a triaxial accelerometer for ambulatory
monitoring IEEE Trans Inf Technol Biomed 200610(1)156-67
12 Krasnoff JB Kohn MA Choy FK Doyle J Johansen K Painter PL Interunit and
intraunit reliability of the RT3 triaxial accelerometer J Phys Act Health 20085(4)527-38
13 McLaughlin JE King GA Howley ET Bassett DR Jr Ainsworth BE Validation of the
COSMED K4 b2 portable metabolic system Int J Sports Med 200122(4)280-4
14 McManus IC and Hartigan A Declining left-handedness in Victorian England seen in the
films of Mitchell and Kenyon Curr Biol 200717(18)R793-R794
15 Metcalf BS Curnow JS Evans C Voss LD Wilkin TJ Technical reliability of the CSA
activity monitor The EarlyBird Study Med Sci Sports Exerc 200234(9)1533-7
16 Moeller NC Korsholm L Kristensen PL Andersen LB Wedderkopp N Froberg K
Unit-specific calibration of Actigraph accelerometers in a mechanical setup - is it worth the
effort The effect on random output variation caused by technical inter-instrument variability
in the laboratory and in the field BMC Med Res Methodol 2008819
17 Montoye HJ Kemper HCG Saris WHM Washburn RA Measuring Physical Activity
and Energy Expenditure Champaign IL Human Kinetics 1996
18 Perkins NJ and Schisterman EF The inconsistency of optimal cutpoints obtained using
two criteria based on the receiver operating characteristic curve Am J Epidemiol
2006163(7)670-5
19 Porcari J McCarron R Kline G Freedson PS Ward A Ross JA Rippe JM Is fast
walking an adequate aerobic training stimulus for 30- to 69-year-old men and women
Physician Sportsmed 198715(2)119-29
20 Powell SM Jones DI Rowlands AV Technical variability of the RT3 accelerometer
Med Sci Sports Exerc 200335(10)1773-8
21 Rennie KL and Jebb SA Prevalence of obesity in Great Britain Obes Rev 20056(1)11-
2
21
21
22 Rothney MP Apker GA Song Y Chen KY Comparing the performance of three
generations of ActiGraph accelerometers J Appl Physiol 2008105(4)1091-7
23 Shephard RJ Absolute versus relative intensity of physical activity in a dose-response
context Med Sci Sports Exerc 200133(6 Suppl)S400-S418
24 Silva P Esliger DW Welk GJ Mota J Technical reliability assessment of the Actigraph
GT1M accelerometer Measurement in Physical Education and Exercise Science
20101479-91
25 Sirard JR Trost SG Pfeiffer KA Dowda M Pate RR Calibration and evaluation of an
objective measure of physical activity in preschool children Journal of Physical Activity and
Health 20053345-57
26 Van Hees V Slootmaker SM De GG Van MW Van Lummel RC Reproducibility of a
triaxial seismic accelerometer (DynaPort) Med Sci Sports Exerc 200941(4)810-7
27 Warburton DE Katzmarzyk PT Rhodes RE Shephard RJ Evidence-informed physical
activity guidelines for Canadian adults Can J Public Health 200798 Suppl 2S16-S68
28 Ware LJ Hurling R Bataveljic O Fairley BW Hurst TL Murray P Rennie KL
Tomkins CE Finn A Cobain MR Pearson DA Foreyt JP Rates and determinants of uptake
and use of an internet physical activity and weight management program in office and
manufacturing work sites in England cohort study J Med Internet Res 200810(4)e56
29 Welk G Physical Activity Assessments for Health-Related Research Champaign IL Human Kinetics 2002
30 Welk GJ Principles of design and analyses for the calibration of accelerometry-based
activity monitors Med Sci Sports Exerc 200537(11 Suppl)S501-S511
31 Welk GJ Eisenmann JC Schaben J Trost SG Dale D Calibration of the biotrainer pro
activity monitor in children Pediatr Exerc Sci 200719(2)145-58
32 Zhang K Werner P Sun M Pi-Sunyer FX Boozer CN Measurement of human daily
physical activity Obes Res 200311(1)33-40
22
22
Figure Captions
Figure 1 Inset right Overhead view of GENEA accelerometers positioned in the test jig Inset
left Multi-Axis Shaker Table (MAST) complete with the test jig secured in place Main Figure
Comparison of a typical output trace from one GENEA accelerometer across the 15 test
conditions
Notes i) the trace represents the middle 50 seconds of each of the 15 conditions
Figure 2 Relationship between physical activity intensity (METS) versus the outputs from the
waist worn GENEA SVMgs (g middot minutes) RT3 (countsminute) and Actigraph (countsmin)
accelerometers across the 16 activity conditions
Table 1 Reliability results for the GENEA for all 15 test conditions
Acceleration Frequency Amplitude GENEA SVMgs
(g ∙ seconds)
CV intra
CV inter
g (mmiddots-2
) (Hz) (m) Mean SD GENEA GENEA
005 049 10 00124 3 01 39 53
022 216 10 00547 11 02 17 20
046 451 30 00127 23 02 08 14
046 451 25 00183 24 02 09 14
048 471 20 00298 25 03 10 14
049 481 15 00541 25 03 11 16
079 775 50 00079 41 04 10 15
091 893 30 00251 46 04 08 13
125 1226 45 00153 57 08 15 21
129 1265 40 00200 58 08 13 20
131 1285 35 00266 59 12 21 26
138 1354 30 00381 60 06 10 18
168 1648 45 00206 64 22 34 37
184 1805 30 00508 66 09 13 22
252 2472 45 00309 84 43 51 53
Average variability across all 15 test conditions 18 24
Table 1
Table 2 Descriptive characteristics of the study participants
Gender Sample
Size Age
Left
Handed
Right
Handed
Height
(cm)
Weight
(kg)
BMI
(kg∙m-2
)
Body Fat
()
Male 23 489 (68) 1 22 1762 (62) 806 (116) 259 (27) 207 (34)
Female 37 496 (64) 4 33 1628 (54) 629 (84) 238 (35) 328 (66)
Overall 60 494 (65) 5 55 1679 (87) 697 (130) 246 (34) 282 (81)
for the measurement of body fat there were 2 less participants (1 male and 1 female)
Table 2
Table 3 Average intensity (METS) and average left right and waist positioned GENEA output by activity
GENEA
(SVMgs (g middot minutes)
Actigraph (CountsMinute)
RT3 (VM CountsMinute)
Activity Grouping
N METS Left Wrist Right Wrist Waist Waist Waist
Mean SD Mean SD Mean SD Mean SD Mean SD Mean SD
Lateral Recumbent (lying on side) Posture
(all)
53 094 023 63 55 143 53 34 17 0 0 4 11
Seated Computer Work 55 122 029 185 86 242 67 48 33 1 3 9 21
Standing 55 113 025 100 66 103 177 48 15 0 0 3 9
Window Washing Lifestyle
(2 of 4)dagger
31 337 106 469 693 1808 708 185 61 138 177 463 344
Washing Dishes 24 235 045 634 177 768 239 132 164 51 80 160 74
Shelf Stacking 30 419 098 884 224 940 202 214 72 2620 1933 421 297
Sweeping 23 339 067 878 264 976 289 187 48 465 355 356 96
Slow Treadmill Walk (4 km∙hr-1
) Ambulatory
(all)
54 388 069 864 195 847 232 856 221 2323 643 1267 318
Medium Treadmill Walk (5 km∙hr-1
) 55 459 079 1177 299 1204 357 1264 214 3745 656 1659 331
Brisk Treadmill Walk (6 km∙hr-1
) 55 588 098 1506 400 1513 350 1815 272 4917 940 2228 450
Stair AscentDescent (80 steps∙min-1
) Stairs (all) 55 619 110 836 620 794 597 697 127 2427 780 811 208
Slow Treadmill Run (8 km∙hr-1
) Ambulatory
(1 of 3)Dagger
18 1113 138 3858 588 4087 798 3553 593 8936 1794 4578 799
Medium Treadmill Run (10 km∙hr-1
) 14 1200 124 5345 1073 4915 787 4043 325 8904 1826 5419 423
Fast Treadmill Run (12 km∙hr-1
) 5 1361 060 5096 2339 5358 2460 4066 299 6982 3233 6093 674
Brisk Free-living Walk (6 km∙hr-1
) Ambulatory
(all) 40 576 094 1433 171 1474 216 1769 227 4912 748 2434 559
Medium Free-living Run (10 km∙hr-1
) Ambulatory
(optional) 5 1262 117 5151 1113 4844 1232 3756 631 8825 1592 5525 787
listwise sample size dagger indicates that participants were randomly allocated 2 out of the 4 activities in this grouping
Dagger indicates that participants had the option to run (select 1 out of the 3 activities in this grouping) if they so chose
Note 1 MET = 35 ml∙kg∙min-1
Table 3
Table 4 Sensitivity specificity area under the ROC curve and GENEA SVMgs (g middot minutes)
cut points that maximized sensitivity and specificity at three wear positions
Intensity Sensitivity Specificity Area under ROC
curve (95 CI)
GENEA Cut points
SVMgs (g middot minutes)
Left Wrist
Sedentary 97 95 098 (098-099) lt 217
Light NA NA NA 217-644
Moderate 95 72 091 (088-093) 645-1810
Vigorous 78 98 091 (086-095) gt 1810
Right Wrist
Sedentary 99 96 098 (097-099) lt 386
Light NA NA NA 386-439
Moderate 100 56 084 (0-81-087) 440-2098
Vigorous 78 97 089 (084-094) gt 2098
Waist
Sedentary 99 96 097 (096-098) lt 77
Light NA NA NA 77-219
Moderate 96 80 093 (091-095) 220-2056
Vigorous 73 99 092 (088-096) gt 2056
Sedentary (lt15 METS) light (15-399 METS) moderate (400-699 METS) vigorous (7+
METS)
NA = not applicable as the sedentary and moderate cut points provide the boundaries for the light
intensity category
Table 4
0
10
20
30
40
50
60
70
80
90
100
GE
NE
A
SV
Mg
s (g
s
eco
nd
s)
Condition1 2 3 4 5 6 7 8 9 10 11 12 13 14 15
Figure 1
GENEA SVMgs (g minutes)
Figure 2
3
3
INTRODUCTION
Paragraph Number 1 The unequivocal link between physical activity and health has prompted
exercise science and public health researchers their learned societies and their funders to search
for better and more logistically feasible and objective tools to measure physical activity
This focus has facilitated the development of many objective measurement technologies such as
accelerometers (described in detail elsewhere (17 29)) which provide robust and detailed
physical activity information (4)
Paragraph Number 2 Although much progress has been made in the assessment of
physical activity with accelerometers there are a number of limitations that still need to be
addressed An important first step would be to convince manufacturers to abolish the practice of
disguising raw acceleration outcomes via proprietary bdquocount‟ units as it hinders between model
comparisons Second increased battery life and memory storage would benefit users that require
higher resolution signals This is especially important for multi-axis accelerometers and seismic-
based technologies (26) However a balance must be struck to ensure that the quest for richer
data does not interfere with other more practical issues related to accelerometer size weight and
functionality For example the IDEEA monitor (32) utilizes an array of wired accelerometers
and as such is somewhat obtrusive That said there are some accelerometers such as the Sensor
Wear Armband (7) the ActivPal (9) and the DynaPort (26) that seem to have balanced the
desire for advanced measurement capabilities such as activity classification with feasibility
issues (eg the desire for high resolution acceleration data and the need to remain unobtrusive)
More recently another accelerometer the GENEA has been developed
Paragraph Number 3 This manuscript functions to introduce the GENEA a novel
acceleration sensor developed by Unilever Discover (Colworth United Kingdom) and
4
4
manufactured and distributed by Oralinsights Limited (Kimbolton Cambridgeshire United
Kingdom) Therefore the purpose of this study was threefold 1) to perform a preliminary
technical reliability and validity assessment of the GENEA using a mechanical shaker table 2) to
perform a value calibration of the GENEA to develop thresholds for sedentary light moderate
and vigorous intensity physical activity in adults and 3) to compare the intensity classification of
the GENEA with two widely used accelerometers
METHODS
Technical Reliability and Validity
Paragraph Number 4 Accelerometers The GENEA is a triaxial plusmn 6 g seismic acceleration
sensor (LIS3LV02DL STMicroelectronics Geneva Switzerland) The small (36x30x12
LxWxH mm) and lightweight (16 grams) splashproof design of the GENEA allow it to be easily
worn at multiple locations on the body (eg wrist waist ankle) The GENEA has 500
megabytes of memory to assist with the storage of the raw 80 Hz sampling frequency and can
store ~8 days of data in raw mode with 12 bit resolution Users have the ability to select user-
defined sample frequencies ranging from 10-80 Hz Using the GENEA software (version 1487
update 531) via USB to PC connection 47 GENEA accelerometers were initialized to collect
unfiltered triaxial acceleration data at a sample rate of 80 Hz
Paragraph Number 5 Multi-axis shaking table All technical reliability and validity testing
was completed using a Multi-Axis Shaking Table (MAST) manufactured by Instron Structural
Testing Systems (Buckinghamshire United Kingdom) with an industrial Labtronic 8800 Digital
Controller (Darmstadt Germany) The MAST has been described in detail by Gizatullin and
Edge (8) The MAST is designed to recreate spatial motion of the platform in three dimensions
however only vertical motion was used in this preliminary technical reliability and validity
5
5
study Using a combination of command file and individually entered position command
signals the MAST was programmed to accurately and reliably oscillate the platform at the
various testing conditions using a sinusoidal oscillation procedure The testing conditions were
restricted by the MAST stroke limits of approximately plusmn75 mm The range of possible
conditions of acceleration and frequency of oscillation are described by the equation
acceleration (ms-2
) = (amplitude (m) frequency2
(rads-1
) Fifteen different conditions were
selected to produce a range of physiologically relevant accelerations from light to moderate to
vigorous within the limitations of the MAST
Paragraph Number 6 The GENEA accelerometers were securedenclosed in a custom test
jig (Figure 1 inset right) lined with high density foam to avoid potential vibration transference
and bolted to the surface of the shaker table (Figure 1 inset left) Care was taken to ensure that
the monitors were secured firmly so the vertical movement was along the y-axis of the GENEA
Next the first test condition was programmed and the condition was executed accelerating all
accelerometers simultaneously in the vertical plane for the 60 second test duration All 15
conditions were completed in this fashion and when complete the accelerometers were removed
from the shaker plate and test jig
Paragraph Number 7 Data Reduction All 47 GENEA accelerometers were downloaded to the
initialization PC resulting in the creation of 47 raw 80 Hz data files containing unfiltered time
and date stamped x y and z axis acceleration data (in gravitational units (g) complete with
negative sign indicating directionality) These data were downloaded in comma separated values
file format (csv extension) however the user may also (or instead) choose a binary format (bin
extension) Although both files contain the same data the binary format is much more efficient
at nearly 8 times smaller file size Using the GENEA Post Processing software (version 121)
6
6
the raw 80 Hz triaxial GENEA data were summarized into a signal magnitude vector (gravity-
subtracted) (SVMgs) using 1 second epochs [see equation 1] (11) The resulting SI units for this
outcome variable are g ∙ seconds
Equation 1
SVMgs = 2 2 2x y z g
where the correction for gravity was undertaken to focus the outcome variable on
dynamic rather than static accelerations
Although not the focus of the present study the post processing software does allow the user to
summarize the raw triaxial signal using units of acceleration This is achieved by using the mean
signal magnitude vector over the user-defined epoch [see equation 2] rather than the integral
measure of the SVM as outlined above (26)
Equation 2
SVM = 2 2 2x y z
as this is a mean rather than an cumulative sum it retains its gravity-based acceleration
units (g) where 1 g=981 mmiddots-2
Next data were imported into a customized spreadsheet application using the common epoch-
by-epoch time stamp to alignsynchronize the data across units and models (verified by cross-
correlation analyses) The recorded condition start and end times were identified and the middle
50 seconds of each condition were extracted for further analysis
Paragraph Number 8 Statistical Analyses For all test conditions the mean count output (50
replicate seconds) of each accelerometer for each condition was calculated Intra- and inter-
instrument reliability was calculated using standard deviation and coefficient of variation (CVintra
and CVinter) Pearson product-moment correlation was used to determine the criterion validity of
7
7
the GENEA versus the MAST acceleration All analyses were performed using SPSS version
150 for Windows (SPSS Chicago USA)
Value Calibration
Paragraph Number 9 Participants Participant recruitment was initiated in February 2008 in an
effort to obtain a convenience sample of 60 male and female volunteers aged 40-65 years Two
recruitment methods were used an email to employees of the University of Exeter Exeter
Devon UK and an advertisement in a local newspaper A health and fitness report and a pound20 gift
card were offered as incentive and honorarium respectively for participating in the study Data
collection was undertaken in March and April 2008 after which time 60 adults (62 female)
aged 40ndash63 years completed the study protocol All participants were free from diagnosed
disease and musculoskeletal injury and had no affirmative answers to the Physical Activity
Readiness Questionnaire (PAR-Q) Written informed consent was obtained from each
participant The study was approved by the Ethics committee of the School of Sport and Health
Sciences University of Exeter
Paragraph Number 10 Data Collection Procedures Participants arrived at the laboratory
having refrained from consuming nicotine caffeine or a large meal for at least two hours prior
and exercise at least 6 hours prior to the appointment As part of a larger battery of
anthropometry and health-related fitness tests (peripheral to the present study) participants had
their height (to the nearest 01 cm) and body mass (to the nearest 01 kg) measured using a
Holtain stadiometer (Holtain Crymych Dyfedd UK) and a Tanita TBF-305 scale (Tanita UK
Ltd Middlesex UK) respectively Whole body bioelectrical impedance analysis (BodyStat
1500 BodyStat Onchan Isle of Man United Kingdom) was also performed to determine
percent body fat Next each participant was asked to complete an ordered series of 10-12 semi-
8
8
structured activities in the laboratory and free-living environment The lying activity was
performed for 10 minutes while all other activities were performed for 45 minutes In between
each activity the participants were given at least 2 minutes rest to allow them to prepare for the
next activity and for their metabolic rate (oxygen uptake) to recover to pre-activity levels
Throughout testing VO2 VCO2 and heart rate were measured by the Cosmed K4b2 (Rome
Italy) portable metabolic gas analysis system with heart rate receiver Prior to each testing
session the K4b2 was calibrated with gases of known concentration and the flow sensor
calibration and environmental conditions updated Lastly the K4b2 and the computer running
the software were time-synchronized with the Greenwich Mean Time server The K4b2 has
been shown to provide valid measurements of oxygen uptake across a range of exercise
intensities (13) After each testing session the relative VO2 data were downloaded and stored on
a PC for further analysis
Paragraph Number 11 Accelerometer Throughout testing three GENEA accelerometers were
worn one on each of the left and right wrists (using simple watch straps accelerometers
positioned over the dorsal aspect of the wrists midway between the radial and ulnar styloid
processes) and one on the waist (using a elasticized belt accelerometer positioned over the right
hip mid-clavicular line landmarked by the supraspinale) The same three GENEAs were used
by all 60 participants and were always positioned at the same sites for each On the same belt
adjacent to the waist-worn GENEA participants wore two peer accelerometers a uniaxial
Actigraph GT1M accelerometer with firmware version 300 (Actigraph Pensacola Florida
USA) and a triaxial RT3 accelerometer (Stayhealthycom Monrovia California USA) At the
start of each testing session the accelerometers were time synchronized with the GMT time
server and initialized to record acceleration data The epoch length was set at 80 Hz 1 second
9
9
and 1 minute 3-axis for the GENEAs Actigraph and RT3‟s respectively however only the
vector magnitude data from the RT3 were analyzed After each testing session the accelerometer
data were downloaded and stored on a PC for further analysis
Paragraph Number 12 Data Analyses Using the K4b2 software the breath-by-breath VO2
data were filtered using 1 minute averaging Using the GENEA Post Processing software
(version 121) the raw 80 Hz triaxial GENEA data were summarized into SVMgs using 1 minute
epoch intervals The Actigraph data were also integrated to 1-minute epochs for further analysis
Custom spreadsheet applications were developed to temporally synchronize the minute-by-
minute data from the K4b2 with the data from the three accelerometer models The combined
data set was then plotted to facilitate the selection of the minute of accelerometer data that
coincided with steady-state VO2 for each of the activities performed Ideally and in most cases
this was the 4th
minute of each activity however in a minority of cases the 3rd
minute was
selected as it better represented steady-state due to occasional time synchronization issues (the
10th
or 9th
minute for the lying activity) The relative VO2 and accelerometer data corresponding
to the selected minute were exported to SPSS version 150 for Windows (SPSS Chicago USA)
for further analysis Pearson correlations were calculated between each accelerometer output
and VO2
Paragraph Number 13 The VO2 data were converted to METS using the standard
conversion of 1 MET = 35 mlmiddotkg-1
middotmin-1
and then coded into one of four absolute intensity
categories sedentary (lt15 METS) light (15-399 METS) moderate (400-699 METS) or
vigorous (7+ METS) activity The impetus for using 4 and 7 rather than 3 and 6 MET
thresholds to mark moderate and vigorous intensity physical activity follows the rationale
described in a review by Shephard (23) Citing work by Porcari et al (19) Shephard noted that
10
10
those deriving health benefits from lifestyle activities tended to be sedentary obese and elderly
people those for whom a given absolute intensity of effort such as brisk walking develops a
substantial relative intensity of effort Simply put because the present sample were
sedentaryunfit their physical activity energy expenditure for a given absolute intensity effort
such as a brisk walk is likely to be higher than for fitter individuals Therefore developing cut
points on an unfit sample using 3 and 6 MET thresholds would result in an increased chance of
erroneously categorizing fitter individuals as active rather than inactive As this was the case in
the present study the higher absolute intensity cut points of 4 and 7 METS were chosen
Paragraph Number 14 Next the accelerometer data were recoded to create binary
indicator variables (0 or 1) to facilitate the Receiver Operator Characteristic (ROC) curve
analyses For sedentary this corresponded to sedentary activities versus more than sedentary
activities For moderate intensity this corresponded to less than moderate activities versus
moderate to vigorous activities For vigorous intensity this corresponded to vigorous activities
versus less than vigorous activities Next the binary coded accelerometer data were exported to
GraphPad Prism 400 for Windows (GraphPad Software San Diego USA) to undergo the ROC
curve analyses
Paragraph Number 15 A ROC curve is a graphical technique for describing and
comparing the accuracy of diagnostic tests In the present application ROC analysis is used to
examine the potential of using thresholds within the GENEA Actigraph and RT3 data to
discriminate between four activity intensity categories As Jago et al (10) described ROC
analysis is a means to evaluate and visualize the sensitivity [true positives(true positives + false
negatives)] and specificity [true negatives(true negatives + false positives)] of tests The ROC
curve is simply a plot of the sensitivity of a test on the y-axis versus its 1-specificity (ie false
11
11
positive fraction on the x-axis) Each possible threshold value corresponds to a point on the ROC
curve The upper-left corner [the point (0 1)] represents perfect classification and the diagonal
line represents the strategy of randomly guessing Sensitivity is maximized by correctly
identifying at or above the threshold for intensity whereas specificity is maximized by correctly
excluding activities below the threshold for intensity Similar to the methods of Evenson et al
(6) the cut points at which sensitivity and specificity were both maximized were identified
RESULTS
Technical Reliability and Validity
Paragraph Number 16 All 47 GENEA accelerometers successfully initialized collected and
downloaded data The mean SMVgs (g ∙ seconds) for the GENEA accelerometers displayed a
linear trajectory across all 15 testing conditions when organized from low to high acceleration
values (Figure 1 main) The average intra- and inter-instrument reliability of the 47 GENEA
accelerometers across the 15 conditions was CVintra=18 and CVinter=24 respectively The
criterion validity for the GENEA versus the MAST acceleration for all 15 test conditions was
excellent (r=097 plt0001)
Value Calibration
Paragraph Number 17 Descriptive characteristics of the participants are shown in Table 2 The
BMI data are a testament to the fact that this is a convenience sample as the participants are
leaner than the general population In fact the prevalence of obesity among the group was 4
for men and 5 for women much lower than the 23 and 25 found in the general population
(21) However the number of left handed participants in this study (12) matched well the 11
prevalence of left handedness in the UK population (14)
12
12
Paragraph Number 18 Table 3 compares the average METS and the position-specific
GENEA results As expected the activities in the posture grouping were the lowest intensity
while the optional running activities were the highest which was reflected in the VO2 and the
accelerometer output The fact that the slow treadmill walking an activity intended to be light
intensity resulted in an average 388 METS response helps to justify the decision to utilize the
higher absolute intensity cut points of 4 and 7 METS to distinguish moderate and vigorous
intensity activity in this sample Comparing the different wear positions of the GENEA showed
that data for the left and right wrists were similar while the mean GENEA data collected at the
waist were lower as were the standard deviations Comparative data from the waist-worn
Actigraph and RT3 are also displayed in Table 3
Paragraph Number 19 Using relative VO2 as the criterion the GENEA demonstrated
excellent criterion validity across all activities (left r = 086 right r = 083 waist r = 087)
performing as well at the waist as the Actigraph GT1M (r = 086) and RT3 (r = 088) The
GENEA also demonstrated excellent concurrent validity compared to the Actigraph GT1M (r =
092) and the RT3 (097) accelerometers Device-specific scatter plots in Figure 2 provide a
graphical comparison of criterion validity (ie METS versus each accelerometer‟s output) across
the varying activity conditions
Paragraph Number 20 Table 4 outlines the results of the ROC curve analysis for the
GENEA Across all three wear positions discrimination of sedentary behavior was almost
perfect with the area under the ROC curve ranging from 097-098 On account of reduced
specificity the discrimination of moderate activity was slightly less precise ranging from 084-
093 Meanwhile it was the reduced sensitivity of vigorous intensity cut points that
compromised the discrimination of vigorous activity which ranged from 089-092 Overall the
13
13
waist-worn GENEA had the greatest classification accuracy (095) followed by the left (093)
then right wrist (090) Interestingly the GENEA on the right wrist was unable to discriminate
between light and moderate intensity categories The overall ability to discriminate between
sedentary light moderate and vigorous intensity physical activity of the waist-worn GENEA
was virtually identical to that of the Actigraph GT1M (094) and the RT3 (095) (data not
shown)
DISCUSSION
Technical Reliability and Validity
Paragraph Number 21 Researchers have used various mechanical apparatuses to oscillate
accelerometers in various axes in an effort to assess reliability These apparatuses allow the
researcher to control the magnitude of the acceleration being imparted as well as the frequency
of the oscillation two key variables that contribute to the accelerometer‟s output Mechanical
setups by virtue of the precise control of the experimental conditions are able to determine the
variability attributed solely to the accelerometer Examples include turntables (15) rotating
wheel setups (2 16) vibration tables (20) and various types of mechanical shakers (5 12 22
24 26) This type of testing is important because if the measurement error intrinsic to the
accelerometer is found to be small then focus can shift to other sources of variation (eg
position worn on the body variation over time (eg day-to-day week-to-week season-to-
season) (15)
Paragraph Number 22 This is the first study to evaluate the technical reliability and
validity of the newly introduced GENEA accelerometer Utilizing 15 testing conditions across a
range of accelerations and frequencies the GENEA was found to be highly reliable with mean
intra- and inter-instrument coefficients of variation of 18 and 24 respectively Likewise the
14
14
GENEA was found to have excellent criterion validity when compared to the MAST acceleration
(r=097) Two thirds of the above-mentioned technical reliability studies focus on Actigraph
model accelerometers and as such it is a logical comparator for the GENEA Out of six studies
the current GENEA results demonstrate the highest technical reliability with the next best
performer coming in a recent study on the Actigraph GT1M (CVintra=29 and CVinter=35)
(24) In terms of criterion validity with the MAST the only relevant comparison comes from a
study on the Actigraph 7164 (2) where the validity coefficient was identical to the present study
Value Calibration
Paragraph Number 23 This is the first study to develop accelerometer cut points for both wrist
and waist-worn GENEA accelerometers that reflect sedentary light moderate and vigorous
intensity physical activity in adults The delineation of intensity of physical activity from
accelerometer data aids in the understanding of the relationship between health-related physical
activity and potential predictor variables such as adiposity age health status and ethnicity (10)
The process used to convert raw accelerometer data into more meaningful and interpretable units
is generally referred to as ldquovalue calibrationrdquo (30) Although raw accelerometer data provides an
indicator of overall movement a fundamental research challenge has been to determine how to
equate it to more meaningful indicators such as energy expenditure or time spent at given
activity intensity Being able to identify the amount of time spent in a range of intensity
categories is useful given the fact that numerous international physical activity guidelines
recommend various amounts of time be spent in specific intensity categories (27)
Paragraph Number 24 In the present study the GENEA demonstrated high levels of
criterion validity (with an average correlation with METS across wear positions of r = 085)
across 10-12 static and dynamic physical activities In fact the criterion validity of the GENEA
15
15
was virtually identical to that of the Actigraph and RT3 Similarly high levels of criterion
validity were shown by Bouten et al (1) during the development of their novel triaxial
accelerometer The GENEA also demonstrated high levels of concurrent validity compared to
the Actigraph GT1M and the RT3 with the highest correlations between the triaxial devices
These data illustrate that the GENEA is comparable to peer accelerometers a result that is
confirmed in the graphical representation of the data in Figure 2 However a closer look
suggests that the GENEA data are less variable than the RT3 and Actigraph across the intensity
spectrum Although speculative the tighter clustering of data within activities may provide
greater success for the GENEA when pursuing alternative analytical approaches For example
the tighter clustering of data within activities in the GENEA should allow for more optimal
activity classification (ie the determination of the mode of physical activity)
Paragraph Number 25 The GENEA SVMgs (g ∙ minutes) cut points established in this
study demonstrated excellent accuracy for classifying physical activity intensity across the
intensity spectrum Because this is the first article to report cut points for the GENEA it is not
possible to compare these values with other studies Although the accuracy of the GENEA was
greatest at the waist it also performed well at the wrist with the left wrist being more accurate
than the right The diminished accuracy experienced on the right wrist was likely due to
differences in participant handedness that is extraneous movements recorded during the activity
conditions were more likely to occur on the right wrist (eg scratching adjusting
clothingglasses hand gestures) However given small number of left handed participants (n=5)
testing of the hypothesis was untenable However it may be that activity signatures obtained
from the right wrist (dominant for over 80 of the population) may prove more useful than the
left (non-dominant) wrist Future research should specifically address this issue so that users
16
16
especially left handed users may know if wearing the GENEA on the right hand is possible The
small size of the GENEA and the fact that it can be positioned at the wrist a location intuitively
less obtrusive than the waist may help rectify issues related to participant compliance in future
studies and may allow for studies with extended physical activity monitoring periods (28)
Paragraph Number 26 Strengths and Limitations Several strengths are noteworthy in the
present study The first strength was the use of a mechanical shaker to perform a preliminary
technical reliability and validity assessment on the GENEA The use of this well controlled
experimental setup allowed for a robust assessment of this new technology Next the GENEA
output was collected analyzed and presented in a non-proprietary SI unit and as such can be
compared with other devices that retainemploy classical physics based measurements Next
ROC curve analysis was chosen to determine the physical activity intensity cut points which is
known to be superior to previous accelerometer calibration methods that employed linear
regression approaches (see Jago et al (10) for a more thorough discussion on this topic) To
date only four studies have employed ROC curve analysis to generate cut points and these were
done on children (3 6 10 31) A further strength of the ROC curve analyses was that the cut
points were chosen to optimize the balance between sensitivity and specificity (ie point nearest
01 on the ROC curve) which in all analyses also coincided with the Youden index ensuring the
optimality of the cut points The intuitive interpretation of the Youden index is that it is the point
on the curve farthest from chance (18) Finally the comparison to two widely used peer
technologies also strengthens the study as does the fact that energy expenditure (mlmiddotkg-1
middotmin-1
)
rather than direct observation was used to provide a continuous objective and physiologically
meaningful dependent variable with which to compare the GENEA data (25)
17
17
Paragraph Number 27 Several limitations of this study should be acknowledged First
the preliminary technical reliability and validity assessment was only performed on one axis the
vertical leaving the performance of the other two axes uncharacterized Next the comparison of
the GENEA would have been more appropriate with the triaxial Actigraph GT3X rather than the
GT1M accelerometer however at the time of this study the newer Actigraphs were not part of
our accelerometer inventory Next although our sample includes men and women of differing
ages and body size our population may not be representative Larger and more variable samples
(eg more left handed more overweight and obese participants) are needed to determine if these
factors might modify our findings In addition the activity conditions selected in this study may
not represent the full complement of activities undertaken by a population therefore caution
must be used when generalizing these results to other groups Finally cross-validation of the
GENEA physical activity intensity cut points by other research groups in different adult
populations is warranted
CONCLUSION
Paragraph Number 28 The GENEA demonstrated excellent technical reliability and validity and
excellent criterion validity compared to VO2 The GENEA cut points established in this study
can be used to estimate the time spent in sedentary light moderate and vigorous intensity
physical activity in adults As a result the GENEA has established itself as an objective and
feasible measurement tool comparable to other peer accelerometers such as the Actigraph
GT1M and RT3 with the potential of offering advanced measurement features in the future
Additional work is warranted to further refine the adult cut points and to develop cut points for
other age groups in an effort to calibrate the GENEA across the lifespan Given that the high
resolution sampling of the GENEA allows for advanced data mining (eg extraction of
18
18
frequency domain features) future research should strive to classifyrecognize activities of daily
living
Acknowledgments
This research was supported by a grant from Unilever Discover Colworth Bedford UK The
authors would like to thank the participants the graduate research assistants and the
administrative staff of the School of Sport and Health Sciences for their dedication to this
research project
Conflict of Interest
The results of the present study do not constitute endorsement by the authors or ACSM of
the products described in this paper This research was funded by an unrestricted research grant
awarded by Unilever Discover to the School of Sport and Health Sciences University of Exeter
The grant funded the salary of DE and small portions of the salaries of AR and RE At the time
of this research TH and MC were both employed by Unilever Discover However at the time of
manuscript submission MC and DE have no further relationship with Unilever Discover or any
of its operating companies None of the authors have a conflict of interest with Oralinsights the
manufacturer of the technology on which this manuscript is based
19
19
References
1 Bouten CV Koekkoek KT Verduin M Kodde R Janssen JD A triaxial accelerometer and
portable data processing unit for the assessment of daily physical activity IEEE Trans
Biomed Eng 199744(3)136-47
2 Brage S Brage N Wedderkopp N Froberg K Reliability and validity of the Computer
Science and Applications accelerometer in a mechanical setting Measurement in Physical
Education and Exercise Science 20037(2)101-19
3 Chu EY McManus AM Yu CC Calibration of the RT3 accelerometer for ambulation and
nonambulation in children Med Sci Sports Exerc 200739(11)2085-91
4 Esliger DW and Tremblay MS Physical activity and inactivity profiling the next generation
Can J Public Health 200798 Suppl 2S195-S207
5 Esliger DW and Tremblay MS Technical reliability assessment of three accelerometer
models in a mechanical setup Med Sci Sports Exerc 200638(12)2173-81
6 Evenson KR Catellier DJ Gill K Ondrak KS McMurray RG Calibration of two objective
measures of physical activity for children J Sports Sci 20081-9
7 Fruin ML and Rankin JW Validity of a multi-sensor armband in estimating rest and exercise
energy expenditure Med Sci Sports Exerc 200436(6)1063-9
8 Gizatullin AO and Edge KA Adaptive control for a multi-axis hydraulic test rig
Proceedings of the Institution of Mechanical Engineers Part I Journal of Systems and
Control Engineering 2007221(2)183-98
9 Grant PM Ryan CG Tigbe WW Granat MH The validation of a novel activity monitor in
the measurement of posture and motion during everyday activities Br J Sports Med
200640(12)992-7
10 Jago R Zakeri I Baranowski T Watson K Decision boundaries and receiver operating
characteristic curves new methods for determining accelerometer cutpoints J Sports Sci
200725(8)937-44
20
20
11 Karantonis DM Narayanan MR Mathie M Lovell NH Celler BG Implementation of a
real-time human movement classifier using a triaxial accelerometer for ambulatory
monitoring IEEE Trans Inf Technol Biomed 200610(1)156-67
12 Krasnoff JB Kohn MA Choy FK Doyle J Johansen K Painter PL Interunit and
intraunit reliability of the RT3 triaxial accelerometer J Phys Act Health 20085(4)527-38
13 McLaughlin JE King GA Howley ET Bassett DR Jr Ainsworth BE Validation of the
COSMED K4 b2 portable metabolic system Int J Sports Med 200122(4)280-4
14 McManus IC and Hartigan A Declining left-handedness in Victorian England seen in the
films of Mitchell and Kenyon Curr Biol 200717(18)R793-R794
15 Metcalf BS Curnow JS Evans C Voss LD Wilkin TJ Technical reliability of the CSA
activity monitor The EarlyBird Study Med Sci Sports Exerc 200234(9)1533-7
16 Moeller NC Korsholm L Kristensen PL Andersen LB Wedderkopp N Froberg K
Unit-specific calibration of Actigraph accelerometers in a mechanical setup - is it worth the
effort The effect on random output variation caused by technical inter-instrument variability
in the laboratory and in the field BMC Med Res Methodol 2008819
17 Montoye HJ Kemper HCG Saris WHM Washburn RA Measuring Physical Activity
and Energy Expenditure Champaign IL Human Kinetics 1996
18 Perkins NJ and Schisterman EF The inconsistency of optimal cutpoints obtained using
two criteria based on the receiver operating characteristic curve Am J Epidemiol
2006163(7)670-5
19 Porcari J McCarron R Kline G Freedson PS Ward A Ross JA Rippe JM Is fast
walking an adequate aerobic training stimulus for 30- to 69-year-old men and women
Physician Sportsmed 198715(2)119-29
20 Powell SM Jones DI Rowlands AV Technical variability of the RT3 accelerometer
Med Sci Sports Exerc 200335(10)1773-8
21 Rennie KL and Jebb SA Prevalence of obesity in Great Britain Obes Rev 20056(1)11-
2
21
21
22 Rothney MP Apker GA Song Y Chen KY Comparing the performance of three
generations of ActiGraph accelerometers J Appl Physiol 2008105(4)1091-7
23 Shephard RJ Absolute versus relative intensity of physical activity in a dose-response
context Med Sci Sports Exerc 200133(6 Suppl)S400-S418
24 Silva P Esliger DW Welk GJ Mota J Technical reliability assessment of the Actigraph
GT1M accelerometer Measurement in Physical Education and Exercise Science
20101479-91
25 Sirard JR Trost SG Pfeiffer KA Dowda M Pate RR Calibration and evaluation of an
objective measure of physical activity in preschool children Journal of Physical Activity and
Health 20053345-57
26 Van Hees V Slootmaker SM De GG Van MW Van Lummel RC Reproducibility of a
triaxial seismic accelerometer (DynaPort) Med Sci Sports Exerc 200941(4)810-7
27 Warburton DE Katzmarzyk PT Rhodes RE Shephard RJ Evidence-informed physical
activity guidelines for Canadian adults Can J Public Health 200798 Suppl 2S16-S68
28 Ware LJ Hurling R Bataveljic O Fairley BW Hurst TL Murray P Rennie KL
Tomkins CE Finn A Cobain MR Pearson DA Foreyt JP Rates and determinants of uptake
and use of an internet physical activity and weight management program in office and
manufacturing work sites in England cohort study J Med Internet Res 200810(4)e56
29 Welk G Physical Activity Assessments for Health-Related Research Champaign IL Human Kinetics 2002
30 Welk GJ Principles of design and analyses for the calibration of accelerometry-based
activity monitors Med Sci Sports Exerc 200537(11 Suppl)S501-S511
31 Welk GJ Eisenmann JC Schaben J Trost SG Dale D Calibration of the biotrainer pro
activity monitor in children Pediatr Exerc Sci 200719(2)145-58
32 Zhang K Werner P Sun M Pi-Sunyer FX Boozer CN Measurement of human daily
physical activity Obes Res 200311(1)33-40
22
22
Figure Captions
Figure 1 Inset right Overhead view of GENEA accelerometers positioned in the test jig Inset
left Multi-Axis Shaker Table (MAST) complete with the test jig secured in place Main Figure
Comparison of a typical output trace from one GENEA accelerometer across the 15 test
conditions
Notes i) the trace represents the middle 50 seconds of each of the 15 conditions
Figure 2 Relationship between physical activity intensity (METS) versus the outputs from the
waist worn GENEA SVMgs (g middot minutes) RT3 (countsminute) and Actigraph (countsmin)
accelerometers across the 16 activity conditions
Table 1 Reliability results for the GENEA for all 15 test conditions
Acceleration Frequency Amplitude GENEA SVMgs
(g ∙ seconds)
CV intra
CV inter
g (mmiddots-2
) (Hz) (m) Mean SD GENEA GENEA
005 049 10 00124 3 01 39 53
022 216 10 00547 11 02 17 20
046 451 30 00127 23 02 08 14
046 451 25 00183 24 02 09 14
048 471 20 00298 25 03 10 14
049 481 15 00541 25 03 11 16
079 775 50 00079 41 04 10 15
091 893 30 00251 46 04 08 13
125 1226 45 00153 57 08 15 21
129 1265 40 00200 58 08 13 20
131 1285 35 00266 59 12 21 26
138 1354 30 00381 60 06 10 18
168 1648 45 00206 64 22 34 37
184 1805 30 00508 66 09 13 22
252 2472 45 00309 84 43 51 53
Average variability across all 15 test conditions 18 24
Table 1
Table 2 Descriptive characteristics of the study participants
Gender Sample
Size Age
Left
Handed
Right
Handed
Height
(cm)
Weight
(kg)
BMI
(kg∙m-2
)
Body Fat
()
Male 23 489 (68) 1 22 1762 (62) 806 (116) 259 (27) 207 (34)
Female 37 496 (64) 4 33 1628 (54) 629 (84) 238 (35) 328 (66)
Overall 60 494 (65) 5 55 1679 (87) 697 (130) 246 (34) 282 (81)
for the measurement of body fat there were 2 less participants (1 male and 1 female)
Table 2
Table 3 Average intensity (METS) and average left right and waist positioned GENEA output by activity
GENEA
(SVMgs (g middot minutes)
Actigraph (CountsMinute)
RT3 (VM CountsMinute)
Activity Grouping
N METS Left Wrist Right Wrist Waist Waist Waist
Mean SD Mean SD Mean SD Mean SD Mean SD Mean SD
Lateral Recumbent (lying on side) Posture
(all)
53 094 023 63 55 143 53 34 17 0 0 4 11
Seated Computer Work 55 122 029 185 86 242 67 48 33 1 3 9 21
Standing 55 113 025 100 66 103 177 48 15 0 0 3 9
Window Washing Lifestyle
(2 of 4)dagger
31 337 106 469 693 1808 708 185 61 138 177 463 344
Washing Dishes 24 235 045 634 177 768 239 132 164 51 80 160 74
Shelf Stacking 30 419 098 884 224 940 202 214 72 2620 1933 421 297
Sweeping 23 339 067 878 264 976 289 187 48 465 355 356 96
Slow Treadmill Walk (4 km∙hr-1
) Ambulatory
(all)
54 388 069 864 195 847 232 856 221 2323 643 1267 318
Medium Treadmill Walk (5 km∙hr-1
) 55 459 079 1177 299 1204 357 1264 214 3745 656 1659 331
Brisk Treadmill Walk (6 km∙hr-1
) 55 588 098 1506 400 1513 350 1815 272 4917 940 2228 450
Stair AscentDescent (80 steps∙min-1
) Stairs (all) 55 619 110 836 620 794 597 697 127 2427 780 811 208
Slow Treadmill Run (8 km∙hr-1
) Ambulatory
(1 of 3)Dagger
18 1113 138 3858 588 4087 798 3553 593 8936 1794 4578 799
Medium Treadmill Run (10 km∙hr-1
) 14 1200 124 5345 1073 4915 787 4043 325 8904 1826 5419 423
Fast Treadmill Run (12 km∙hr-1
) 5 1361 060 5096 2339 5358 2460 4066 299 6982 3233 6093 674
Brisk Free-living Walk (6 km∙hr-1
) Ambulatory
(all) 40 576 094 1433 171 1474 216 1769 227 4912 748 2434 559
Medium Free-living Run (10 km∙hr-1
) Ambulatory
(optional) 5 1262 117 5151 1113 4844 1232 3756 631 8825 1592 5525 787
listwise sample size dagger indicates that participants were randomly allocated 2 out of the 4 activities in this grouping
Dagger indicates that participants had the option to run (select 1 out of the 3 activities in this grouping) if they so chose
Note 1 MET = 35 ml∙kg∙min-1
Table 3
Table 4 Sensitivity specificity area under the ROC curve and GENEA SVMgs (g middot minutes)
cut points that maximized sensitivity and specificity at three wear positions
Intensity Sensitivity Specificity Area under ROC
curve (95 CI)
GENEA Cut points
SVMgs (g middot minutes)
Left Wrist
Sedentary 97 95 098 (098-099) lt 217
Light NA NA NA 217-644
Moderate 95 72 091 (088-093) 645-1810
Vigorous 78 98 091 (086-095) gt 1810
Right Wrist
Sedentary 99 96 098 (097-099) lt 386
Light NA NA NA 386-439
Moderate 100 56 084 (0-81-087) 440-2098
Vigorous 78 97 089 (084-094) gt 2098
Waist
Sedentary 99 96 097 (096-098) lt 77
Light NA NA NA 77-219
Moderate 96 80 093 (091-095) 220-2056
Vigorous 73 99 092 (088-096) gt 2056
Sedentary (lt15 METS) light (15-399 METS) moderate (400-699 METS) vigorous (7+
METS)
NA = not applicable as the sedentary and moderate cut points provide the boundaries for the light
intensity category
Table 4
0
10
20
30
40
50
60
70
80
90
100
GE
NE
A
SV
Mg
s (g
s
eco
nd
s)
Condition1 2 3 4 5 6 7 8 9 10 11 12 13 14 15
Figure 1
GENEA SVMgs (g minutes)
Figure 2
4
4
manufactured and distributed by Oralinsights Limited (Kimbolton Cambridgeshire United
Kingdom) Therefore the purpose of this study was threefold 1) to perform a preliminary
technical reliability and validity assessment of the GENEA using a mechanical shaker table 2) to
perform a value calibration of the GENEA to develop thresholds for sedentary light moderate
and vigorous intensity physical activity in adults and 3) to compare the intensity classification of
the GENEA with two widely used accelerometers
METHODS
Technical Reliability and Validity
Paragraph Number 4 Accelerometers The GENEA is a triaxial plusmn 6 g seismic acceleration
sensor (LIS3LV02DL STMicroelectronics Geneva Switzerland) The small (36x30x12
LxWxH mm) and lightweight (16 grams) splashproof design of the GENEA allow it to be easily
worn at multiple locations on the body (eg wrist waist ankle) The GENEA has 500
megabytes of memory to assist with the storage of the raw 80 Hz sampling frequency and can
store ~8 days of data in raw mode with 12 bit resolution Users have the ability to select user-
defined sample frequencies ranging from 10-80 Hz Using the GENEA software (version 1487
update 531) via USB to PC connection 47 GENEA accelerometers were initialized to collect
unfiltered triaxial acceleration data at a sample rate of 80 Hz
Paragraph Number 5 Multi-axis shaking table All technical reliability and validity testing
was completed using a Multi-Axis Shaking Table (MAST) manufactured by Instron Structural
Testing Systems (Buckinghamshire United Kingdom) with an industrial Labtronic 8800 Digital
Controller (Darmstadt Germany) The MAST has been described in detail by Gizatullin and
Edge (8) The MAST is designed to recreate spatial motion of the platform in three dimensions
however only vertical motion was used in this preliminary technical reliability and validity
5
5
study Using a combination of command file and individually entered position command
signals the MAST was programmed to accurately and reliably oscillate the platform at the
various testing conditions using a sinusoidal oscillation procedure The testing conditions were
restricted by the MAST stroke limits of approximately plusmn75 mm The range of possible
conditions of acceleration and frequency of oscillation are described by the equation
acceleration (ms-2
) = (amplitude (m) frequency2
(rads-1
) Fifteen different conditions were
selected to produce a range of physiologically relevant accelerations from light to moderate to
vigorous within the limitations of the MAST
Paragraph Number 6 The GENEA accelerometers were securedenclosed in a custom test
jig (Figure 1 inset right) lined with high density foam to avoid potential vibration transference
and bolted to the surface of the shaker table (Figure 1 inset left) Care was taken to ensure that
the monitors were secured firmly so the vertical movement was along the y-axis of the GENEA
Next the first test condition was programmed and the condition was executed accelerating all
accelerometers simultaneously in the vertical plane for the 60 second test duration All 15
conditions were completed in this fashion and when complete the accelerometers were removed
from the shaker plate and test jig
Paragraph Number 7 Data Reduction All 47 GENEA accelerometers were downloaded to the
initialization PC resulting in the creation of 47 raw 80 Hz data files containing unfiltered time
and date stamped x y and z axis acceleration data (in gravitational units (g) complete with
negative sign indicating directionality) These data were downloaded in comma separated values
file format (csv extension) however the user may also (or instead) choose a binary format (bin
extension) Although both files contain the same data the binary format is much more efficient
at nearly 8 times smaller file size Using the GENEA Post Processing software (version 121)
6
6
the raw 80 Hz triaxial GENEA data were summarized into a signal magnitude vector (gravity-
subtracted) (SVMgs) using 1 second epochs [see equation 1] (11) The resulting SI units for this
outcome variable are g ∙ seconds
Equation 1
SVMgs = 2 2 2x y z g
where the correction for gravity was undertaken to focus the outcome variable on
dynamic rather than static accelerations
Although not the focus of the present study the post processing software does allow the user to
summarize the raw triaxial signal using units of acceleration This is achieved by using the mean
signal magnitude vector over the user-defined epoch [see equation 2] rather than the integral
measure of the SVM as outlined above (26)
Equation 2
SVM = 2 2 2x y z
as this is a mean rather than an cumulative sum it retains its gravity-based acceleration
units (g) where 1 g=981 mmiddots-2
Next data were imported into a customized spreadsheet application using the common epoch-
by-epoch time stamp to alignsynchronize the data across units and models (verified by cross-
correlation analyses) The recorded condition start and end times were identified and the middle
50 seconds of each condition were extracted for further analysis
Paragraph Number 8 Statistical Analyses For all test conditions the mean count output (50
replicate seconds) of each accelerometer for each condition was calculated Intra- and inter-
instrument reliability was calculated using standard deviation and coefficient of variation (CVintra
and CVinter) Pearson product-moment correlation was used to determine the criterion validity of
7
7
the GENEA versus the MAST acceleration All analyses were performed using SPSS version
150 for Windows (SPSS Chicago USA)
Value Calibration
Paragraph Number 9 Participants Participant recruitment was initiated in February 2008 in an
effort to obtain a convenience sample of 60 male and female volunteers aged 40-65 years Two
recruitment methods were used an email to employees of the University of Exeter Exeter
Devon UK and an advertisement in a local newspaper A health and fitness report and a pound20 gift
card were offered as incentive and honorarium respectively for participating in the study Data
collection was undertaken in March and April 2008 after which time 60 adults (62 female)
aged 40ndash63 years completed the study protocol All participants were free from diagnosed
disease and musculoskeletal injury and had no affirmative answers to the Physical Activity
Readiness Questionnaire (PAR-Q) Written informed consent was obtained from each
participant The study was approved by the Ethics committee of the School of Sport and Health
Sciences University of Exeter
Paragraph Number 10 Data Collection Procedures Participants arrived at the laboratory
having refrained from consuming nicotine caffeine or a large meal for at least two hours prior
and exercise at least 6 hours prior to the appointment As part of a larger battery of
anthropometry and health-related fitness tests (peripheral to the present study) participants had
their height (to the nearest 01 cm) and body mass (to the nearest 01 kg) measured using a
Holtain stadiometer (Holtain Crymych Dyfedd UK) and a Tanita TBF-305 scale (Tanita UK
Ltd Middlesex UK) respectively Whole body bioelectrical impedance analysis (BodyStat
1500 BodyStat Onchan Isle of Man United Kingdom) was also performed to determine
percent body fat Next each participant was asked to complete an ordered series of 10-12 semi-
8
8
structured activities in the laboratory and free-living environment The lying activity was
performed for 10 minutes while all other activities were performed for 45 minutes In between
each activity the participants were given at least 2 minutes rest to allow them to prepare for the
next activity and for their metabolic rate (oxygen uptake) to recover to pre-activity levels
Throughout testing VO2 VCO2 and heart rate were measured by the Cosmed K4b2 (Rome
Italy) portable metabolic gas analysis system with heart rate receiver Prior to each testing
session the K4b2 was calibrated with gases of known concentration and the flow sensor
calibration and environmental conditions updated Lastly the K4b2 and the computer running
the software were time-synchronized with the Greenwich Mean Time server The K4b2 has
been shown to provide valid measurements of oxygen uptake across a range of exercise
intensities (13) After each testing session the relative VO2 data were downloaded and stored on
a PC for further analysis
Paragraph Number 11 Accelerometer Throughout testing three GENEA accelerometers were
worn one on each of the left and right wrists (using simple watch straps accelerometers
positioned over the dorsal aspect of the wrists midway between the radial and ulnar styloid
processes) and one on the waist (using a elasticized belt accelerometer positioned over the right
hip mid-clavicular line landmarked by the supraspinale) The same three GENEAs were used
by all 60 participants and were always positioned at the same sites for each On the same belt
adjacent to the waist-worn GENEA participants wore two peer accelerometers a uniaxial
Actigraph GT1M accelerometer with firmware version 300 (Actigraph Pensacola Florida
USA) and a triaxial RT3 accelerometer (Stayhealthycom Monrovia California USA) At the
start of each testing session the accelerometers were time synchronized with the GMT time
server and initialized to record acceleration data The epoch length was set at 80 Hz 1 second
9
9
and 1 minute 3-axis for the GENEAs Actigraph and RT3‟s respectively however only the
vector magnitude data from the RT3 were analyzed After each testing session the accelerometer
data were downloaded and stored on a PC for further analysis
Paragraph Number 12 Data Analyses Using the K4b2 software the breath-by-breath VO2
data were filtered using 1 minute averaging Using the GENEA Post Processing software
(version 121) the raw 80 Hz triaxial GENEA data were summarized into SVMgs using 1 minute
epoch intervals The Actigraph data were also integrated to 1-minute epochs for further analysis
Custom spreadsheet applications were developed to temporally synchronize the minute-by-
minute data from the K4b2 with the data from the three accelerometer models The combined
data set was then plotted to facilitate the selection of the minute of accelerometer data that
coincided with steady-state VO2 for each of the activities performed Ideally and in most cases
this was the 4th
minute of each activity however in a minority of cases the 3rd
minute was
selected as it better represented steady-state due to occasional time synchronization issues (the
10th
or 9th
minute for the lying activity) The relative VO2 and accelerometer data corresponding
to the selected minute were exported to SPSS version 150 for Windows (SPSS Chicago USA)
for further analysis Pearson correlations were calculated between each accelerometer output
and VO2
Paragraph Number 13 The VO2 data were converted to METS using the standard
conversion of 1 MET = 35 mlmiddotkg-1
middotmin-1
and then coded into one of four absolute intensity
categories sedentary (lt15 METS) light (15-399 METS) moderate (400-699 METS) or
vigorous (7+ METS) activity The impetus for using 4 and 7 rather than 3 and 6 MET
thresholds to mark moderate and vigorous intensity physical activity follows the rationale
described in a review by Shephard (23) Citing work by Porcari et al (19) Shephard noted that
10
10
those deriving health benefits from lifestyle activities tended to be sedentary obese and elderly
people those for whom a given absolute intensity of effort such as brisk walking develops a
substantial relative intensity of effort Simply put because the present sample were
sedentaryunfit their physical activity energy expenditure for a given absolute intensity effort
such as a brisk walk is likely to be higher than for fitter individuals Therefore developing cut
points on an unfit sample using 3 and 6 MET thresholds would result in an increased chance of
erroneously categorizing fitter individuals as active rather than inactive As this was the case in
the present study the higher absolute intensity cut points of 4 and 7 METS were chosen
Paragraph Number 14 Next the accelerometer data were recoded to create binary
indicator variables (0 or 1) to facilitate the Receiver Operator Characteristic (ROC) curve
analyses For sedentary this corresponded to sedentary activities versus more than sedentary
activities For moderate intensity this corresponded to less than moderate activities versus
moderate to vigorous activities For vigorous intensity this corresponded to vigorous activities
versus less than vigorous activities Next the binary coded accelerometer data were exported to
GraphPad Prism 400 for Windows (GraphPad Software San Diego USA) to undergo the ROC
curve analyses
Paragraph Number 15 A ROC curve is a graphical technique for describing and
comparing the accuracy of diagnostic tests In the present application ROC analysis is used to
examine the potential of using thresholds within the GENEA Actigraph and RT3 data to
discriminate between four activity intensity categories As Jago et al (10) described ROC
analysis is a means to evaluate and visualize the sensitivity [true positives(true positives + false
negatives)] and specificity [true negatives(true negatives + false positives)] of tests The ROC
curve is simply a plot of the sensitivity of a test on the y-axis versus its 1-specificity (ie false
11
11
positive fraction on the x-axis) Each possible threshold value corresponds to a point on the ROC
curve The upper-left corner [the point (0 1)] represents perfect classification and the diagonal
line represents the strategy of randomly guessing Sensitivity is maximized by correctly
identifying at or above the threshold for intensity whereas specificity is maximized by correctly
excluding activities below the threshold for intensity Similar to the methods of Evenson et al
(6) the cut points at which sensitivity and specificity were both maximized were identified
RESULTS
Technical Reliability and Validity
Paragraph Number 16 All 47 GENEA accelerometers successfully initialized collected and
downloaded data The mean SMVgs (g ∙ seconds) for the GENEA accelerometers displayed a
linear trajectory across all 15 testing conditions when organized from low to high acceleration
values (Figure 1 main) The average intra- and inter-instrument reliability of the 47 GENEA
accelerometers across the 15 conditions was CVintra=18 and CVinter=24 respectively The
criterion validity for the GENEA versus the MAST acceleration for all 15 test conditions was
excellent (r=097 plt0001)
Value Calibration
Paragraph Number 17 Descriptive characteristics of the participants are shown in Table 2 The
BMI data are a testament to the fact that this is a convenience sample as the participants are
leaner than the general population In fact the prevalence of obesity among the group was 4
for men and 5 for women much lower than the 23 and 25 found in the general population
(21) However the number of left handed participants in this study (12) matched well the 11
prevalence of left handedness in the UK population (14)
12
12
Paragraph Number 18 Table 3 compares the average METS and the position-specific
GENEA results As expected the activities in the posture grouping were the lowest intensity
while the optional running activities were the highest which was reflected in the VO2 and the
accelerometer output The fact that the slow treadmill walking an activity intended to be light
intensity resulted in an average 388 METS response helps to justify the decision to utilize the
higher absolute intensity cut points of 4 and 7 METS to distinguish moderate and vigorous
intensity activity in this sample Comparing the different wear positions of the GENEA showed
that data for the left and right wrists were similar while the mean GENEA data collected at the
waist were lower as were the standard deviations Comparative data from the waist-worn
Actigraph and RT3 are also displayed in Table 3
Paragraph Number 19 Using relative VO2 as the criterion the GENEA demonstrated
excellent criterion validity across all activities (left r = 086 right r = 083 waist r = 087)
performing as well at the waist as the Actigraph GT1M (r = 086) and RT3 (r = 088) The
GENEA also demonstrated excellent concurrent validity compared to the Actigraph GT1M (r =
092) and the RT3 (097) accelerometers Device-specific scatter plots in Figure 2 provide a
graphical comparison of criterion validity (ie METS versus each accelerometer‟s output) across
the varying activity conditions
Paragraph Number 20 Table 4 outlines the results of the ROC curve analysis for the
GENEA Across all three wear positions discrimination of sedentary behavior was almost
perfect with the area under the ROC curve ranging from 097-098 On account of reduced
specificity the discrimination of moderate activity was slightly less precise ranging from 084-
093 Meanwhile it was the reduced sensitivity of vigorous intensity cut points that
compromised the discrimination of vigorous activity which ranged from 089-092 Overall the
13
13
waist-worn GENEA had the greatest classification accuracy (095) followed by the left (093)
then right wrist (090) Interestingly the GENEA on the right wrist was unable to discriminate
between light and moderate intensity categories The overall ability to discriminate between
sedentary light moderate and vigorous intensity physical activity of the waist-worn GENEA
was virtually identical to that of the Actigraph GT1M (094) and the RT3 (095) (data not
shown)
DISCUSSION
Technical Reliability and Validity
Paragraph Number 21 Researchers have used various mechanical apparatuses to oscillate
accelerometers in various axes in an effort to assess reliability These apparatuses allow the
researcher to control the magnitude of the acceleration being imparted as well as the frequency
of the oscillation two key variables that contribute to the accelerometer‟s output Mechanical
setups by virtue of the precise control of the experimental conditions are able to determine the
variability attributed solely to the accelerometer Examples include turntables (15) rotating
wheel setups (2 16) vibration tables (20) and various types of mechanical shakers (5 12 22
24 26) This type of testing is important because if the measurement error intrinsic to the
accelerometer is found to be small then focus can shift to other sources of variation (eg
position worn on the body variation over time (eg day-to-day week-to-week season-to-
season) (15)
Paragraph Number 22 This is the first study to evaluate the technical reliability and
validity of the newly introduced GENEA accelerometer Utilizing 15 testing conditions across a
range of accelerations and frequencies the GENEA was found to be highly reliable with mean
intra- and inter-instrument coefficients of variation of 18 and 24 respectively Likewise the
14
14
GENEA was found to have excellent criterion validity when compared to the MAST acceleration
(r=097) Two thirds of the above-mentioned technical reliability studies focus on Actigraph
model accelerometers and as such it is a logical comparator for the GENEA Out of six studies
the current GENEA results demonstrate the highest technical reliability with the next best
performer coming in a recent study on the Actigraph GT1M (CVintra=29 and CVinter=35)
(24) In terms of criterion validity with the MAST the only relevant comparison comes from a
study on the Actigraph 7164 (2) where the validity coefficient was identical to the present study
Value Calibration
Paragraph Number 23 This is the first study to develop accelerometer cut points for both wrist
and waist-worn GENEA accelerometers that reflect sedentary light moderate and vigorous
intensity physical activity in adults The delineation of intensity of physical activity from
accelerometer data aids in the understanding of the relationship between health-related physical
activity and potential predictor variables such as adiposity age health status and ethnicity (10)
The process used to convert raw accelerometer data into more meaningful and interpretable units
is generally referred to as ldquovalue calibrationrdquo (30) Although raw accelerometer data provides an
indicator of overall movement a fundamental research challenge has been to determine how to
equate it to more meaningful indicators such as energy expenditure or time spent at given
activity intensity Being able to identify the amount of time spent in a range of intensity
categories is useful given the fact that numerous international physical activity guidelines
recommend various amounts of time be spent in specific intensity categories (27)
Paragraph Number 24 In the present study the GENEA demonstrated high levels of
criterion validity (with an average correlation with METS across wear positions of r = 085)
across 10-12 static and dynamic physical activities In fact the criterion validity of the GENEA
15
15
was virtually identical to that of the Actigraph and RT3 Similarly high levels of criterion
validity were shown by Bouten et al (1) during the development of their novel triaxial
accelerometer The GENEA also demonstrated high levels of concurrent validity compared to
the Actigraph GT1M and the RT3 with the highest correlations between the triaxial devices
These data illustrate that the GENEA is comparable to peer accelerometers a result that is
confirmed in the graphical representation of the data in Figure 2 However a closer look
suggests that the GENEA data are less variable than the RT3 and Actigraph across the intensity
spectrum Although speculative the tighter clustering of data within activities may provide
greater success for the GENEA when pursuing alternative analytical approaches For example
the tighter clustering of data within activities in the GENEA should allow for more optimal
activity classification (ie the determination of the mode of physical activity)
Paragraph Number 25 The GENEA SVMgs (g ∙ minutes) cut points established in this
study demonstrated excellent accuracy for classifying physical activity intensity across the
intensity spectrum Because this is the first article to report cut points for the GENEA it is not
possible to compare these values with other studies Although the accuracy of the GENEA was
greatest at the waist it also performed well at the wrist with the left wrist being more accurate
than the right The diminished accuracy experienced on the right wrist was likely due to
differences in participant handedness that is extraneous movements recorded during the activity
conditions were more likely to occur on the right wrist (eg scratching adjusting
clothingglasses hand gestures) However given small number of left handed participants (n=5)
testing of the hypothesis was untenable However it may be that activity signatures obtained
from the right wrist (dominant for over 80 of the population) may prove more useful than the
left (non-dominant) wrist Future research should specifically address this issue so that users
16
16
especially left handed users may know if wearing the GENEA on the right hand is possible The
small size of the GENEA and the fact that it can be positioned at the wrist a location intuitively
less obtrusive than the waist may help rectify issues related to participant compliance in future
studies and may allow for studies with extended physical activity monitoring periods (28)
Paragraph Number 26 Strengths and Limitations Several strengths are noteworthy in the
present study The first strength was the use of a mechanical shaker to perform a preliminary
technical reliability and validity assessment on the GENEA The use of this well controlled
experimental setup allowed for a robust assessment of this new technology Next the GENEA
output was collected analyzed and presented in a non-proprietary SI unit and as such can be
compared with other devices that retainemploy classical physics based measurements Next
ROC curve analysis was chosen to determine the physical activity intensity cut points which is
known to be superior to previous accelerometer calibration methods that employed linear
regression approaches (see Jago et al (10) for a more thorough discussion on this topic) To
date only four studies have employed ROC curve analysis to generate cut points and these were
done on children (3 6 10 31) A further strength of the ROC curve analyses was that the cut
points were chosen to optimize the balance between sensitivity and specificity (ie point nearest
01 on the ROC curve) which in all analyses also coincided with the Youden index ensuring the
optimality of the cut points The intuitive interpretation of the Youden index is that it is the point
on the curve farthest from chance (18) Finally the comparison to two widely used peer
technologies also strengthens the study as does the fact that energy expenditure (mlmiddotkg-1
middotmin-1
)
rather than direct observation was used to provide a continuous objective and physiologically
meaningful dependent variable with which to compare the GENEA data (25)
17
17
Paragraph Number 27 Several limitations of this study should be acknowledged First
the preliminary technical reliability and validity assessment was only performed on one axis the
vertical leaving the performance of the other two axes uncharacterized Next the comparison of
the GENEA would have been more appropriate with the triaxial Actigraph GT3X rather than the
GT1M accelerometer however at the time of this study the newer Actigraphs were not part of
our accelerometer inventory Next although our sample includes men and women of differing
ages and body size our population may not be representative Larger and more variable samples
(eg more left handed more overweight and obese participants) are needed to determine if these
factors might modify our findings In addition the activity conditions selected in this study may
not represent the full complement of activities undertaken by a population therefore caution
must be used when generalizing these results to other groups Finally cross-validation of the
GENEA physical activity intensity cut points by other research groups in different adult
populations is warranted
CONCLUSION
Paragraph Number 28 The GENEA demonstrated excellent technical reliability and validity and
excellent criterion validity compared to VO2 The GENEA cut points established in this study
can be used to estimate the time spent in sedentary light moderate and vigorous intensity
physical activity in adults As a result the GENEA has established itself as an objective and
feasible measurement tool comparable to other peer accelerometers such as the Actigraph
GT1M and RT3 with the potential of offering advanced measurement features in the future
Additional work is warranted to further refine the adult cut points and to develop cut points for
other age groups in an effort to calibrate the GENEA across the lifespan Given that the high
resolution sampling of the GENEA allows for advanced data mining (eg extraction of
18
18
frequency domain features) future research should strive to classifyrecognize activities of daily
living
Acknowledgments
This research was supported by a grant from Unilever Discover Colworth Bedford UK The
authors would like to thank the participants the graduate research assistants and the
administrative staff of the School of Sport and Health Sciences for their dedication to this
research project
Conflict of Interest
The results of the present study do not constitute endorsement by the authors or ACSM of
the products described in this paper This research was funded by an unrestricted research grant
awarded by Unilever Discover to the School of Sport and Health Sciences University of Exeter
The grant funded the salary of DE and small portions of the salaries of AR and RE At the time
of this research TH and MC were both employed by Unilever Discover However at the time of
manuscript submission MC and DE have no further relationship with Unilever Discover or any
of its operating companies None of the authors have a conflict of interest with Oralinsights the
manufacturer of the technology on which this manuscript is based
19
19
References
1 Bouten CV Koekkoek KT Verduin M Kodde R Janssen JD A triaxial accelerometer and
portable data processing unit for the assessment of daily physical activity IEEE Trans
Biomed Eng 199744(3)136-47
2 Brage S Brage N Wedderkopp N Froberg K Reliability and validity of the Computer
Science and Applications accelerometer in a mechanical setting Measurement in Physical
Education and Exercise Science 20037(2)101-19
3 Chu EY McManus AM Yu CC Calibration of the RT3 accelerometer for ambulation and
nonambulation in children Med Sci Sports Exerc 200739(11)2085-91
4 Esliger DW and Tremblay MS Physical activity and inactivity profiling the next generation
Can J Public Health 200798 Suppl 2S195-S207
5 Esliger DW and Tremblay MS Technical reliability assessment of three accelerometer
models in a mechanical setup Med Sci Sports Exerc 200638(12)2173-81
6 Evenson KR Catellier DJ Gill K Ondrak KS McMurray RG Calibration of two objective
measures of physical activity for children J Sports Sci 20081-9
7 Fruin ML and Rankin JW Validity of a multi-sensor armband in estimating rest and exercise
energy expenditure Med Sci Sports Exerc 200436(6)1063-9
8 Gizatullin AO and Edge KA Adaptive control for a multi-axis hydraulic test rig
Proceedings of the Institution of Mechanical Engineers Part I Journal of Systems and
Control Engineering 2007221(2)183-98
9 Grant PM Ryan CG Tigbe WW Granat MH The validation of a novel activity monitor in
the measurement of posture and motion during everyday activities Br J Sports Med
200640(12)992-7
10 Jago R Zakeri I Baranowski T Watson K Decision boundaries and receiver operating
characteristic curves new methods for determining accelerometer cutpoints J Sports Sci
200725(8)937-44
20
20
11 Karantonis DM Narayanan MR Mathie M Lovell NH Celler BG Implementation of a
real-time human movement classifier using a triaxial accelerometer for ambulatory
monitoring IEEE Trans Inf Technol Biomed 200610(1)156-67
12 Krasnoff JB Kohn MA Choy FK Doyle J Johansen K Painter PL Interunit and
intraunit reliability of the RT3 triaxial accelerometer J Phys Act Health 20085(4)527-38
13 McLaughlin JE King GA Howley ET Bassett DR Jr Ainsworth BE Validation of the
COSMED K4 b2 portable metabolic system Int J Sports Med 200122(4)280-4
14 McManus IC and Hartigan A Declining left-handedness in Victorian England seen in the
films of Mitchell and Kenyon Curr Biol 200717(18)R793-R794
15 Metcalf BS Curnow JS Evans C Voss LD Wilkin TJ Technical reliability of the CSA
activity monitor The EarlyBird Study Med Sci Sports Exerc 200234(9)1533-7
16 Moeller NC Korsholm L Kristensen PL Andersen LB Wedderkopp N Froberg K
Unit-specific calibration of Actigraph accelerometers in a mechanical setup - is it worth the
effort The effect on random output variation caused by technical inter-instrument variability
in the laboratory and in the field BMC Med Res Methodol 2008819
17 Montoye HJ Kemper HCG Saris WHM Washburn RA Measuring Physical Activity
and Energy Expenditure Champaign IL Human Kinetics 1996
18 Perkins NJ and Schisterman EF The inconsistency of optimal cutpoints obtained using
two criteria based on the receiver operating characteristic curve Am J Epidemiol
2006163(7)670-5
19 Porcari J McCarron R Kline G Freedson PS Ward A Ross JA Rippe JM Is fast
walking an adequate aerobic training stimulus for 30- to 69-year-old men and women
Physician Sportsmed 198715(2)119-29
20 Powell SM Jones DI Rowlands AV Technical variability of the RT3 accelerometer
Med Sci Sports Exerc 200335(10)1773-8
21 Rennie KL and Jebb SA Prevalence of obesity in Great Britain Obes Rev 20056(1)11-
2
21
21
22 Rothney MP Apker GA Song Y Chen KY Comparing the performance of three
generations of ActiGraph accelerometers J Appl Physiol 2008105(4)1091-7
23 Shephard RJ Absolute versus relative intensity of physical activity in a dose-response
context Med Sci Sports Exerc 200133(6 Suppl)S400-S418
24 Silva P Esliger DW Welk GJ Mota J Technical reliability assessment of the Actigraph
GT1M accelerometer Measurement in Physical Education and Exercise Science
20101479-91
25 Sirard JR Trost SG Pfeiffer KA Dowda M Pate RR Calibration and evaluation of an
objective measure of physical activity in preschool children Journal of Physical Activity and
Health 20053345-57
26 Van Hees V Slootmaker SM De GG Van MW Van Lummel RC Reproducibility of a
triaxial seismic accelerometer (DynaPort) Med Sci Sports Exerc 200941(4)810-7
27 Warburton DE Katzmarzyk PT Rhodes RE Shephard RJ Evidence-informed physical
activity guidelines for Canadian adults Can J Public Health 200798 Suppl 2S16-S68
28 Ware LJ Hurling R Bataveljic O Fairley BW Hurst TL Murray P Rennie KL
Tomkins CE Finn A Cobain MR Pearson DA Foreyt JP Rates and determinants of uptake
and use of an internet physical activity and weight management program in office and
manufacturing work sites in England cohort study J Med Internet Res 200810(4)e56
29 Welk G Physical Activity Assessments for Health-Related Research Champaign IL Human Kinetics 2002
30 Welk GJ Principles of design and analyses for the calibration of accelerometry-based
activity monitors Med Sci Sports Exerc 200537(11 Suppl)S501-S511
31 Welk GJ Eisenmann JC Schaben J Trost SG Dale D Calibration of the biotrainer pro
activity monitor in children Pediatr Exerc Sci 200719(2)145-58
32 Zhang K Werner P Sun M Pi-Sunyer FX Boozer CN Measurement of human daily
physical activity Obes Res 200311(1)33-40
22
22
Figure Captions
Figure 1 Inset right Overhead view of GENEA accelerometers positioned in the test jig Inset
left Multi-Axis Shaker Table (MAST) complete with the test jig secured in place Main Figure
Comparison of a typical output trace from one GENEA accelerometer across the 15 test
conditions
Notes i) the trace represents the middle 50 seconds of each of the 15 conditions
Figure 2 Relationship between physical activity intensity (METS) versus the outputs from the
waist worn GENEA SVMgs (g middot minutes) RT3 (countsminute) and Actigraph (countsmin)
accelerometers across the 16 activity conditions
Table 1 Reliability results for the GENEA for all 15 test conditions
Acceleration Frequency Amplitude GENEA SVMgs
(g ∙ seconds)
CV intra
CV inter
g (mmiddots-2
) (Hz) (m) Mean SD GENEA GENEA
005 049 10 00124 3 01 39 53
022 216 10 00547 11 02 17 20
046 451 30 00127 23 02 08 14
046 451 25 00183 24 02 09 14
048 471 20 00298 25 03 10 14
049 481 15 00541 25 03 11 16
079 775 50 00079 41 04 10 15
091 893 30 00251 46 04 08 13
125 1226 45 00153 57 08 15 21
129 1265 40 00200 58 08 13 20
131 1285 35 00266 59 12 21 26
138 1354 30 00381 60 06 10 18
168 1648 45 00206 64 22 34 37
184 1805 30 00508 66 09 13 22
252 2472 45 00309 84 43 51 53
Average variability across all 15 test conditions 18 24
Table 1
Table 2 Descriptive characteristics of the study participants
Gender Sample
Size Age
Left
Handed
Right
Handed
Height
(cm)
Weight
(kg)
BMI
(kg∙m-2
)
Body Fat
()
Male 23 489 (68) 1 22 1762 (62) 806 (116) 259 (27) 207 (34)
Female 37 496 (64) 4 33 1628 (54) 629 (84) 238 (35) 328 (66)
Overall 60 494 (65) 5 55 1679 (87) 697 (130) 246 (34) 282 (81)
for the measurement of body fat there were 2 less participants (1 male and 1 female)
Table 2
Table 3 Average intensity (METS) and average left right and waist positioned GENEA output by activity
GENEA
(SVMgs (g middot minutes)
Actigraph (CountsMinute)
RT3 (VM CountsMinute)
Activity Grouping
N METS Left Wrist Right Wrist Waist Waist Waist
Mean SD Mean SD Mean SD Mean SD Mean SD Mean SD
Lateral Recumbent (lying on side) Posture
(all)
53 094 023 63 55 143 53 34 17 0 0 4 11
Seated Computer Work 55 122 029 185 86 242 67 48 33 1 3 9 21
Standing 55 113 025 100 66 103 177 48 15 0 0 3 9
Window Washing Lifestyle
(2 of 4)dagger
31 337 106 469 693 1808 708 185 61 138 177 463 344
Washing Dishes 24 235 045 634 177 768 239 132 164 51 80 160 74
Shelf Stacking 30 419 098 884 224 940 202 214 72 2620 1933 421 297
Sweeping 23 339 067 878 264 976 289 187 48 465 355 356 96
Slow Treadmill Walk (4 km∙hr-1
) Ambulatory
(all)
54 388 069 864 195 847 232 856 221 2323 643 1267 318
Medium Treadmill Walk (5 km∙hr-1
) 55 459 079 1177 299 1204 357 1264 214 3745 656 1659 331
Brisk Treadmill Walk (6 km∙hr-1
) 55 588 098 1506 400 1513 350 1815 272 4917 940 2228 450
Stair AscentDescent (80 steps∙min-1
) Stairs (all) 55 619 110 836 620 794 597 697 127 2427 780 811 208
Slow Treadmill Run (8 km∙hr-1
) Ambulatory
(1 of 3)Dagger
18 1113 138 3858 588 4087 798 3553 593 8936 1794 4578 799
Medium Treadmill Run (10 km∙hr-1
) 14 1200 124 5345 1073 4915 787 4043 325 8904 1826 5419 423
Fast Treadmill Run (12 km∙hr-1
) 5 1361 060 5096 2339 5358 2460 4066 299 6982 3233 6093 674
Brisk Free-living Walk (6 km∙hr-1
) Ambulatory
(all) 40 576 094 1433 171 1474 216 1769 227 4912 748 2434 559
Medium Free-living Run (10 km∙hr-1
) Ambulatory
(optional) 5 1262 117 5151 1113 4844 1232 3756 631 8825 1592 5525 787
listwise sample size dagger indicates that participants were randomly allocated 2 out of the 4 activities in this grouping
Dagger indicates that participants had the option to run (select 1 out of the 3 activities in this grouping) if they so chose
Note 1 MET = 35 ml∙kg∙min-1
Table 3
Table 4 Sensitivity specificity area under the ROC curve and GENEA SVMgs (g middot minutes)
cut points that maximized sensitivity and specificity at three wear positions
Intensity Sensitivity Specificity Area under ROC
curve (95 CI)
GENEA Cut points
SVMgs (g middot minutes)
Left Wrist
Sedentary 97 95 098 (098-099) lt 217
Light NA NA NA 217-644
Moderate 95 72 091 (088-093) 645-1810
Vigorous 78 98 091 (086-095) gt 1810
Right Wrist
Sedentary 99 96 098 (097-099) lt 386
Light NA NA NA 386-439
Moderate 100 56 084 (0-81-087) 440-2098
Vigorous 78 97 089 (084-094) gt 2098
Waist
Sedentary 99 96 097 (096-098) lt 77
Light NA NA NA 77-219
Moderate 96 80 093 (091-095) 220-2056
Vigorous 73 99 092 (088-096) gt 2056
Sedentary (lt15 METS) light (15-399 METS) moderate (400-699 METS) vigorous (7+
METS)
NA = not applicable as the sedentary and moderate cut points provide the boundaries for the light
intensity category
Table 4
0
10
20
30
40
50
60
70
80
90
100
GE
NE
A
SV
Mg
s (g
s
eco
nd
s)
Condition1 2 3 4 5 6 7 8 9 10 11 12 13 14 15
Figure 1
GENEA SVMgs (g minutes)
Figure 2
5
5
study Using a combination of command file and individually entered position command
signals the MAST was programmed to accurately and reliably oscillate the platform at the
various testing conditions using a sinusoidal oscillation procedure The testing conditions were
restricted by the MAST stroke limits of approximately plusmn75 mm The range of possible
conditions of acceleration and frequency of oscillation are described by the equation
acceleration (ms-2
) = (amplitude (m) frequency2
(rads-1
) Fifteen different conditions were
selected to produce a range of physiologically relevant accelerations from light to moderate to
vigorous within the limitations of the MAST
Paragraph Number 6 The GENEA accelerometers were securedenclosed in a custom test
jig (Figure 1 inset right) lined with high density foam to avoid potential vibration transference
and bolted to the surface of the shaker table (Figure 1 inset left) Care was taken to ensure that
the monitors were secured firmly so the vertical movement was along the y-axis of the GENEA
Next the first test condition was programmed and the condition was executed accelerating all
accelerometers simultaneously in the vertical plane for the 60 second test duration All 15
conditions were completed in this fashion and when complete the accelerometers were removed
from the shaker plate and test jig
Paragraph Number 7 Data Reduction All 47 GENEA accelerometers were downloaded to the
initialization PC resulting in the creation of 47 raw 80 Hz data files containing unfiltered time
and date stamped x y and z axis acceleration data (in gravitational units (g) complete with
negative sign indicating directionality) These data were downloaded in comma separated values
file format (csv extension) however the user may also (or instead) choose a binary format (bin
extension) Although both files contain the same data the binary format is much more efficient
at nearly 8 times smaller file size Using the GENEA Post Processing software (version 121)
6
6
the raw 80 Hz triaxial GENEA data were summarized into a signal magnitude vector (gravity-
subtracted) (SVMgs) using 1 second epochs [see equation 1] (11) The resulting SI units for this
outcome variable are g ∙ seconds
Equation 1
SVMgs = 2 2 2x y z g
where the correction for gravity was undertaken to focus the outcome variable on
dynamic rather than static accelerations
Although not the focus of the present study the post processing software does allow the user to
summarize the raw triaxial signal using units of acceleration This is achieved by using the mean
signal magnitude vector over the user-defined epoch [see equation 2] rather than the integral
measure of the SVM as outlined above (26)
Equation 2
SVM = 2 2 2x y z
as this is a mean rather than an cumulative sum it retains its gravity-based acceleration
units (g) where 1 g=981 mmiddots-2
Next data were imported into a customized spreadsheet application using the common epoch-
by-epoch time stamp to alignsynchronize the data across units and models (verified by cross-
correlation analyses) The recorded condition start and end times were identified and the middle
50 seconds of each condition were extracted for further analysis
Paragraph Number 8 Statistical Analyses For all test conditions the mean count output (50
replicate seconds) of each accelerometer for each condition was calculated Intra- and inter-
instrument reliability was calculated using standard deviation and coefficient of variation (CVintra
and CVinter) Pearson product-moment correlation was used to determine the criterion validity of
7
7
the GENEA versus the MAST acceleration All analyses were performed using SPSS version
150 for Windows (SPSS Chicago USA)
Value Calibration
Paragraph Number 9 Participants Participant recruitment was initiated in February 2008 in an
effort to obtain a convenience sample of 60 male and female volunteers aged 40-65 years Two
recruitment methods were used an email to employees of the University of Exeter Exeter
Devon UK and an advertisement in a local newspaper A health and fitness report and a pound20 gift
card were offered as incentive and honorarium respectively for participating in the study Data
collection was undertaken in March and April 2008 after which time 60 adults (62 female)
aged 40ndash63 years completed the study protocol All participants were free from diagnosed
disease and musculoskeletal injury and had no affirmative answers to the Physical Activity
Readiness Questionnaire (PAR-Q) Written informed consent was obtained from each
participant The study was approved by the Ethics committee of the School of Sport and Health
Sciences University of Exeter
Paragraph Number 10 Data Collection Procedures Participants arrived at the laboratory
having refrained from consuming nicotine caffeine or a large meal for at least two hours prior
and exercise at least 6 hours prior to the appointment As part of a larger battery of
anthropometry and health-related fitness tests (peripheral to the present study) participants had
their height (to the nearest 01 cm) and body mass (to the nearest 01 kg) measured using a
Holtain stadiometer (Holtain Crymych Dyfedd UK) and a Tanita TBF-305 scale (Tanita UK
Ltd Middlesex UK) respectively Whole body bioelectrical impedance analysis (BodyStat
1500 BodyStat Onchan Isle of Man United Kingdom) was also performed to determine
percent body fat Next each participant was asked to complete an ordered series of 10-12 semi-
8
8
structured activities in the laboratory and free-living environment The lying activity was
performed for 10 minutes while all other activities were performed for 45 minutes In between
each activity the participants were given at least 2 minutes rest to allow them to prepare for the
next activity and for their metabolic rate (oxygen uptake) to recover to pre-activity levels
Throughout testing VO2 VCO2 and heart rate were measured by the Cosmed K4b2 (Rome
Italy) portable metabolic gas analysis system with heart rate receiver Prior to each testing
session the K4b2 was calibrated with gases of known concentration and the flow sensor
calibration and environmental conditions updated Lastly the K4b2 and the computer running
the software were time-synchronized with the Greenwich Mean Time server The K4b2 has
been shown to provide valid measurements of oxygen uptake across a range of exercise
intensities (13) After each testing session the relative VO2 data were downloaded and stored on
a PC for further analysis
Paragraph Number 11 Accelerometer Throughout testing three GENEA accelerometers were
worn one on each of the left and right wrists (using simple watch straps accelerometers
positioned over the dorsal aspect of the wrists midway between the radial and ulnar styloid
processes) and one on the waist (using a elasticized belt accelerometer positioned over the right
hip mid-clavicular line landmarked by the supraspinale) The same three GENEAs were used
by all 60 participants and were always positioned at the same sites for each On the same belt
adjacent to the waist-worn GENEA participants wore two peer accelerometers a uniaxial
Actigraph GT1M accelerometer with firmware version 300 (Actigraph Pensacola Florida
USA) and a triaxial RT3 accelerometer (Stayhealthycom Monrovia California USA) At the
start of each testing session the accelerometers were time synchronized with the GMT time
server and initialized to record acceleration data The epoch length was set at 80 Hz 1 second
9
9
and 1 minute 3-axis for the GENEAs Actigraph and RT3‟s respectively however only the
vector magnitude data from the RT3 were analyzed After each testing session the accelerometer
data were downloaded and stored on a PC for further analysis
Paragraph Number 12 Data Analyses Using the K4b2 software the breath-by-breath VO2
data were filtered using 1 minute averaging Using the GENEA Post Processing software
(version 121) the raw 80 Hz triaxial GENEA data were summarized into SVMgs using 1 minute
epoch intervals The Actigraph data were also integrated to 1-minute epochs for further analysis
Custom spreadsheet applications were developed to temporally synchronize the minute-by-
minute data from the K4b2 with the data from the three accelerometer models The combined
data set was then plotted to facilitate the selection of the minute of accelerometer data that
coincided with steady-state VO2 for each of the activities performed Ideally and in most cases
this was the 4th
minute of each activity however in a minority of cases the 3rd
minute was
selected as it better represented steady-state due to occasional time synchronization issues (the
10th
or 9th
minute for the lying activity) The relative VO2 and accelerometer data corresponding
to the selected minute were exported to SPSS version 150 for Windows (SPSS Chicago USA)
for further analysis Pearson correlations were calculated between each accelerometer output
and VO2
Paragraph Number 13 The VO2 data were converted to METS using the standard
conversion of 1 MET = 35 mlmiddotkg-1
middotmin-1
and then coded into one of four absolute intensity
categories sedentary (lt15 METS) light (15-399 METS) moderate (400-699 METS) or
vigorous (7+ METS) activity The impetus for using 4 and 7 rather than 3 and 6 MET
thresholds to mark moderate and vigorous intensity physical activity follows the rationale
described in a review by Shephard (23) Citing work by Porcari et al (19) Shephard noted that
10
10
those deriving health benefits from lifestyle activities tended to be sedentary obese and elderly
people those for whom a given absolute intensity of effort such as brisk walking develops a
substantial relative intensity of effort Simply put because the present sample were
sedentaryunfit their physical activity energy expenditure for a given absolute intensity effort
such as a brisk walk is likely to be higher than for fitter individuals Therefore developing cut
points on an unfit sample using 3 and 6 MET thresholds would result in an increased chance of
erroneously categorizing fitter individuals as active rather than inactive As this was the case in
the present study the higher absolute intensity cut points of 4 and 7 METS were chosen
Paragraph Number 14 Next the accelerometer data were recoded to create binary
indicator variables (0 or 1) to facilitate the Receiver Operator Characteristic (ROC) curve
analyses For sedentary this corresponded to sedentary activities versus more than sedentary
activities For moderate intensity this corresponded to less than moderate activities versus
moderate to vigorous activities For vigorous intensity this corresponded to vigorous activities
versus less than vigorous activities Next the binary coded accelerometer data were exported to
GraphPad Prism 400 for Windows (GraphPad Software San Diego USA) to undergo the ROC
curve analyses
Paragraph Number 15 A ROC curve is a graphical technique for describing and
comparing the accuracy of diagnostic tests In the present application ROC analysis is used to
examine the potential of using thresholds within the GENEA Actigraph and RT3 data to
discriminate between four activity intensity categories As Jago et al (10) described ROC
analysis is a means to evaluate and visualize the sensitivity [true positives(true positives + false
negatives)] and specificity [true negatives(true negatives + false positives)] of tests The ROC
curve is simply a plot of the sensitivity of a test on the y-axis versus its 1-specificity (ie false
11
11
positive fraction on the x-axis) Each possible threshold value corresponds to a point on the ROC
curve The upper-left corner [the point (0 1)] represents perfect classification and the diagonal
line represents the strategy of randomly guessing Sensitivity is maximized by correctly
identifying at or above the threshold for intensity whereas specificity is maximized by correctly
excluding activities below the threshold for intensity Similar to the methods of Evenson et al
(6) the cut points at which sensitivity and specificity were both maximized were identified
RESULTS
Technical Reliability and Validity
Paragraph Number 16 All 47 GENEA accelerometers successfully initialized collected and
downloaded data The mean SMVgs (g ∙ seconds) for the GENEA accelerometers displayed a
linear trajectory across all 15 testing conditions when organized from low to high acceleration
values (Figure 1 main) The average intra- and inter-instrument reliability of the 47 GENEA
accelerometers across the 15 conditions was CVintra=18 and CVinter=24 respectively The
criterion validity for the GENEA versus the MAST acceleration for all 15 test conditions was
excellent (r=097 plt0001)
Value Calibration
Paragraph Number 17 Descriptive characteristics of the participants are shown in Table 2 The
BMI data are a testament to the fact that this is a convenience sample as the participants are
leaner than the general population In fact the prevalence of obesity among the group was 4
for men and 5 for women much lower than the 23 and 25 found in the general population
(21) However the number of left handed participants in this study (12) matched well the 11
prevalence of left handedness in the UK population (14)
12
12
Paragraph Number 18 Table 3 compares the average METS and the position-specific
GENEA results As expected the activities in the posture grouping were the lowest intensity
while the optional running activities were the highest which was reflected in the VO2 and the
accelerometer output The fact that the slow treadmill walking an activity intended to be light
intensity resulted in an average 388 METS response helps to justify the decision to utilize the
higher absolute intensity cut points of 4 and 7 METS to distinguish moderate and vigorous
intensity activity in this sample Comparing the different wear positions of the GENEA showed
that data for the left and right wrists were similar while the mean GENEA data collected at the
waist were lower as were the standard deviations Comparative data from the waist-worn
Actigraph and RT3 are also displayed in Table 3
Paragraph Number 19 Using relative VO2 as the criterion the GENEA demonstrated
excellent criterion validity across all activities (left r = 086 right r = 083 waist r = 087)
performing as well at the waist as the Actigraph GT1M (r = 086) and RT3 (r = 088) The
GENEA also demonstrated excellent concurrent validity compared to the Actigraph GT1M (r =
092) and the RT3 (097) accelerometers Device-specific scatter plots in Figure 2 provide a
graphical comparison of criterion validity (ie METS versus each accelerometer‟s output) across
the varying activity conditions
Paragraph Number 20 Table 4 outlines the results of the ROC curve analysis for the
GENEA Across all three wear positions discrimination of sedentary behavior was almost
perfect with the area under the ROC curve ranging from 097-098 On account of reduced
specificity the discrimination of moderate activity was slightly less precise ranging from 084-
093 Meanwhile it was the reduced sensitivity of vigorous intensity cut points that
compromised the discrimination of vigorous activity which ranged from 089-092 Overall the
13
13
waist-worn GENEA had the greatest classification accuracy (095) followed by the left (093)
then right wrist (090) Interestingly the GENEA on the right wrist was unable to discriminate
between light and moderate intensity categories The overall ability to discriminate between
sedentary light moderate and vigorous intensity physical activity of the waist-worn GENEA
was virtually identical to that of the Actigraph GT1M (094) and the RT3 (095) (data not
shown)
DISCUSSION
Technical Reliability and Validity
Paragraph Number 21 Researchers have used various mechanical apparatuses to oscillate
accelerometers in various axes in an effort to assess reliability These apparatuses allow the
researcher to control the magnitude of the acceleration being imparted as well as the frequency
of the oscillation two key variables that contribute to the accelerometer‟s output Mechanical
setups by virtue of the precise control of the experimental conditions are able to determine the
variability attributed solely to the accelerometer Examples include turntables (15) rotating
wheel setups (2 16) vibration tables (20) and various types of mechanical shakers (5 12 22
24 26) This type of testing is important because if the measurement error intrinsic to the
accelerometer is found to be small then focus can shift to other sources of variation (eg
position worn on the body variation over time (eg day-to-day week-to-week season-to-
season) (15)
Paragraph Number 22 This is the first study to evaluate the technical reliability and
validity of the newly introduced GENEA accelerometer Utilizing 15 testing conditions across a
range of accelerations and frequencies the GENEA was found to be highly reliable with mean
intra- and inter-instrument coefficients of variation of 18 and 24 respectively Likewise the
14
14
GENEA was found to have excellent criterion validity when compared to the MAST acceleration
(r=097) Two thirds of the above-mentioned technical reliability studies focus on Actigraph
model accelerometers and as such it is a logical comparator for the GENEA Out of six studies
the current GENEA results demonstrate the highest technical reliability with the next best
performer coming in a recent study on the Actigraph GT1M (CVintra=29 and CVinter=35)
(24) In terms of criterion validity with the MAST the only relevant comparison comes from a
study on the Actigraph 7164 (2) where the validity coefficient was identical to the present study
Value Calibration
Paragraph Number 23 This is the first study to develop accelerometer cut points for both wrist
and waist-worn GENEA accelerometers that reflect sedentary light moderate and vigorous
intensity physical activity in adults The delineation of intensity of physical activity from
accelerometer data aids in the understanding of the relationship between health-related physical
activity and potential predictor variables such as adiposity age health status and ethnicity (10)
The process used to convert raw accelerometer data into more meaningful and interpretable units
is generally referred to as ldquovalue calibrationrdquo (30) Although raw accelerometer data provides an
indicator of overall movement a fundamental research challenge has been to determine how to
equate it to more meaningful indicators such as energy expenditure or time spent at given
activity intensity Being able to identify the amount of time spent in a range of intensity
categories is useful given the fact that numerous international physical activity guidelines
recommend various amounts of time be spent in specific intensity categories (27)
Paragraph Number 24 In the present study the GENEA demonstrated high levels of
criterion validity (with an average correlation with METS across wear positions of r = 085)
across 10-12 static and dynamic physical activities In fact the criterion validity of the GENEA
15
15
was virtually identical to that of the Actigraph and RT3 Similarly high levels of criterion
validity were shown by Bouten et al (1) during the development of their novel triaxial
accelerometer The GENEA also demonstrated high levels of concurrent validity compared to
the Actigraph GT1M and the RT3 with the highest correlations between the triaxial devices
These data illustrate that the GENEA is comparable to peer accelerometers a result that is
confirmed in the graphical representation of the data in Figure 2 However a closer look
suggests that the GENEA data are less variable than the RT3 and Actigraph across the intensity
spectrum Although speculative the tighter clustering of data within activities may provide
greater success for the GENEA when pursuing alternative analytical approaches For example
the tighter clustering of data within activities in the GENEA should allow for more optimal
activity classification (ie the determination of the mode of physical activity)
Paragraph Number 25 The GENEA SVMgs (g ∙ minutes) cut points established in this
study demonstrated excellent accuracy for classifying physical activity intensity across the
intensity spectrum Because this is the first article to report cut points for the GENEA it is not
possible to compare these values with other studies Although the accuracy of the GENEA was
greatest at the waist it also performed well at the wrist with the left wrist being more accurate
than the right The diminished accuracy experienced on the right wrist was likely due to
differences in participant handedness that is extraneous movements recorded during the activity
conditions were more likely to occur on the right wrist (eg scratching adjusting
clothingglasses hand gestures) However given small number of left handed participants (n=5)
testing of the hypothesis was untenable However it may be that activity signatures obtained
from the right wrist (dominant for over 80 of the population) may prove more useful than the
left (non-dominant) wrist Future research should specifically address this issue so that users
16
16
especially left handed users may know if wearing the GENEA on the right hand is possible The
small size of the GENEA and the fact that it can be positioned at the wrist a location intuitively
less obtrusive than the waist may help rectify issues related to participant compliance in future
studies and may allow for studies with extended physical activity monitoring periods (28)
Paragraph Number 26 Strengths and Limitations Several strengths are noteworthy in the
present study The first strength was the use of a mechanical shaker to perform a preliminary
technical reliability and validity assessment on the GENEA The use of this well controlled
experimental setup allowed for a robust assessment of this new technology Next the GENEA
output was collected analyzed and presented in a non-proprietary SI unit and as such can be
compared with other devices that retainemploy classical physics based measurements Next
ROC curve analysis was chosen to determine the physical activity intensity cut points which is
known to be superior to previous accelerometer calibration methods that employed linear
regression approaches (see Jago et al (10) for a more thorough discussion on this topic) To
date only four studies have employed ROC curve analysis to generate cut points and these were
done on children (3 6 10 31) A further strength of the ROC curve analyses was that the cut
points were chosen to optimize the balance between sensitivity and specificity (ie point nearest
01 on the ROC curve) which in all analyses also coincided with the Youden index ensuring the
optimality of the cut points The intuitive interpretation of the Youden index is that it is the point
on the curve farthest from chance (18) Finally the comparison to two widely used peer
technologies also strengthens the study as does the fact that energy expenditure (mlmiddotkg-1
middotmin-1
)
rather than direct observation was used to provide a continuous objective and physiologically
meaningful dependent variable with which to compare the GENEA data (25)
17
17
Paragraph Number 27 Several limitations of this study should be acknowledged First
the preliminary technical reliability and validity assessment was only performed on one axis the
vertical leaving the performance of the other two axes uncharacterized Next the comparison of
the GENEA would have been more appropriate with the triaxial Actigraph GT3X rather than the
GT1M accelerometer however at the time of this study the newer Actigraphs were not part of
our accelerometer inventory Next although our sample includes men and women of differing
ages and body size our population may not be representative Larger and more variable samples
(eg more left handed more overweight and obese participants) are needed to determine if these
factors might modify our findings In addition the activity conditions selected in this study may
not represent the full complement of activities undertaken by a population therefore caution
must be used when generalizing these results to other groups Finally cross-validation of the
GENEA physical activity intensity cut points by other research groups in different adult
populations is warranted
CONCLUSION
Paragraph Number 28 The GENEA demonstrated excellent technical reliability and validity and
excellent criterion validity compared to VO2 The GENEA cut points established in this study
can be used to estimate the time spent in sedentary light moderate and vigorous intensity
physical activity in adults As a result the GENEA has established itself as an objective and
feasible measurement tool comparable to other peer accelerometers such as the Actigraph
GT1M and RT3 with the potential of offering advanced measurement features in the future
Additional work is warranted to further refine the adult cut points and to develop cut points for
other age groups in an effort to calibrate the GENEA across the lifespan Given that the high
resolution sampling of the GENEA allows for advanced data mining (eg extraction of
18
18
frequency domain features) future research should strive to classifyrecognize activities of daily
living
Acknowledgments
This research was supported by a grant from Unilever Discover Colworth Bedford UK The
authors would like to thank the participants the graduate research assistants and the
administrative staff of the School of Sport and Health Sciences for their dedication to this
research project
Conflict of Interest
The results of the present study do not constitute endorsement by the authors or ACSM of
the products described in this paper This research was funded by an unrestricted research grant
awarded by Unilever Discover to the School of Sport and Health Sciences University of Exeter
The grant funded the salary of DE and small portions of the salaries of AR and RE At the time
of this research TH and MC were both employed by Unilever Discover However at the time of
manuscript submission MC and DE have no further relationship with Unilever Discover or any
of its operating companies None of the authors have a conflict of interest with Oralinsights the
manufacturer of the technology on which this manuscript is based
19
19
References
1 Bouten CV Koekkoek KT Verduin M Kodde R Janssen JD A triaxial accelerometer and
portable data processing unit for the assessment of daily physical activity IEEE Trans
Biomed Eng 199744(3)136-47
2 Brage S Brage N Wedderkopp N Froberg K Reliability and validity of the Computer
Science and Applications accelerometer in a mechanical setting Measurement in Physical
Education and Exercise Science 20037(2)101-19
3 Chu EY McManus AM Yu CC Calibration of the RT3 accelerometer for ambulation and
nonambulation in children Med Sci Sports Exerc 200739(11)2085-91
4 Esliger DW and Tremblay MS Physical activity and inactivity profiling the next generation
Can J Public Health 200798 Suppl 2S195-S207
5 Esliger DW and Tremblay MS Technical reliability assessment of three accelerometer
models in a mechanical setup Med Sci Sports Exerc 200638(12)2173-81
6 Evenson KR Catellier DJ Gill K Ondrak KS McMurray RG Calibration of two objective
measures of physical activity for children J Sports Sci 20081-9
7 Fruin ML and Rankin JW Validity of a multi-sensor armband in estimating rest and exercise
energy expenditure Med Sci Sports Exerc 200436(6)1063-9
8 Gizatullin AO and Edge KA Adaptive control for a multi-axis hydraulic test rig
Proceedings of the Institution of Mechanical Engineers Part I Journal of Systems and
Control Engineering 2007221(2)183-98
9 Grant PM Ryan CG Tigbe WW Granat MH The validation of a novel activity monitor in
the measurement of posture and motion during everyday activities Br J Sports Med
200640(12)992-7
10 Jago R Zakeri I Baranowski T Watson K Decision boundaries and receiver operating
characteristic curves new methods for determining accelerometer cutpoints J Sports Sci
200725(8)937-44
20
20
11 Karantonis DM Narayanan MR Mathie M Lovell NH Celler BG Implementation of a
real-time human movement classifier using a triaxial accelerometer for ambulatory
monitoring IEEE Trans Inf Technol Biomed 200610(1)156-67
12 Krasnoff JB Kohn MA Choy FK Doyle J Johansen K Painter PL Interunit and
intraunit reliability of the RT3 triaxial accelerometer J Phys Act Health 20085(4)527-38
13 McLaughlin JE King GA Howley ET Bassett DR Jr Ainsworth BE Validation of the
COSMED K4 b2 portable metabolic system Int J Sports Med 200122(4)280-4
14 McManus IC and Hartigan A Declining left-handedness in Victorian England seen in the
films of Mitchell and Kenyon Curr Biol 200717(18)R793-R794
15 Metcalf BS Curnow JS Evans C Voss LD Wilkin TJ Technical reliability of the CSA
activity monitor The EarlyBird Study Med Sci Sports Exerc 200234(9)1533-7
16 Moeller NC Korsholm L Kristensen PL Andersen LB Wedderkopp N Froberg K
Unit-specific calibration of Actigraph accelerometers in a mechanical setup - is it worth the
effort The effect on random output variation caused by technical inter-instrument variability
in the laboratory and in the field BMC Med Res Methodol 2008819
17 Montoye HJ Kemper HCG Saris WHM Washburn RA Measuring Physical Activity
and Energy Expenditure Champaign IL Human Kinetics 1996
18 Perkins NJ and Schisterman EF The inconsistency of optimal cutpoints obtained using
two criteria based on the receiver operating characteristic curve Am J Epidemiol
2006163(7)670-5
19 Porcari J McCarron R Kline G Freedson PS Ward A Ross JA Rippe JM Is fast
walking an adequate aerobic training stimulus for 30- to 69-year-old men and women
Physician Sportsmed 198715(2)119-29
20 Powell SM Jones DI Rowlands AV Technical variability of the RT3 accelerometer
Med Sci Sports Exerc 200335(10)1773-8
21 Rennie KL and Jebb SA Prevalence of obesity in Great Britain Obes Rev 20056(1)11-
2
21
21
22 Rothney MP Apker GA Song Y Chen KY Comparing the performance of three
generations of ActiGraph accelerometers J Appl Physiol 2008105(4)1091-7
23 Shephard RJ Absolute versus relative intensity of physical activity in a dose-response
context Med Sci Sports Exerc 200133(6 Suppl)S400-S418
24 Silva P Esliger DW Welk GJ Mota J Technical reliability assessment of the Actigraph
GT1M accelerometer Measurement in Physical Education and Exercise Science
20101479-91
25 Sirard JR Trost SG Pfeiffer KA Dowda M Pate RR Calibration and evaluation of an
objective measure of physical activity in preschool children Journal of Physical Activity and
Health 20053345-57
26 Van Hees V Slootmaker SM De GG Van MW Van Lummel RC Reproducibility of a
triaxial seismic accelerometer (DynaPort) Med Sci Sports Exerc 200941(4)810-7
27 Warburton DE Katzmarzyk PT Rhodes RE Shephard RJ Evidence-informed physical
activity guidelines for Canadian adults Can J Public Health 200798 Suppl 2S16-S68
28 Ware LJ Hurling R Bataveljic O Fairley BW Hurst TL Murray P Rennie KL
Tomkins CE Finn A Cobain MR Pearson DA Foreyt JP Rates and determinants of uptake
and use of an internet physical activity and weight management program in office and
manufacturing work sites in England cohort study J Med Internet Res 200810(4)e56
29 Welk G Physical Activity Assessments for Health-Related Research Champaign IL Human Kinetics 2002
30 Welk GJ Principles of design and analyses for the calibration of accelerometry-based
activity monitors Med Sci Sports Exerc 200537(11 Suppl)S501-S511
31 Welk GJ Eisenmann JC Schaben J Trost SG Dale D Calibration of the biotrainer pro
activity monitor in children Pediatr Exerc Sci 200719(2)145-58
32 Zhang K Werner P Sun M Pi-Sunyer FX Boozer CN Measurement of human daily
physical activity Obes Res 200311(1)33-40
22
22
Figure Captions
Figure 1 Inset right Overhead view of GENEA accelerometers positioned in the test jig Inset
left Multi-Axis Shaker Table (MAST) complete with the test jig secured in place Main Figure
Comparison of a typical output trace from one GENEA accelerometer across the 15 test
conditions
Notes i) the trace represents the middle 50 seconds of each of the 15 conditions
Figure 2 Relationship between physical activity intensity (METS) versus the outputs from the
waist worn GENEA SVMgs (g middot minutes) RT3 (countsminute) and Actigraph (countsmin)
accelerometers across the 16 activity conditions
Table 1 Reliability results for the GENEA for all 15 test conditions
Acceleration Frequency Amplitude GENEA SVMgs
(g ∙ seconds)
CV intra
CV inter
g (mmiddots-2
) (Hz) (m) Mean SD GENEA GENEA
005 049 10 00124 3 01 39 53
022 216 10 00547 11 02 17 20
046 451 30 00127 23 02 08 14
046 451 25 00183 24 02 09 14
048 471 20 00298 25 03 10 14
049 481 15 00541 25 03 11 16
079 775 50 00079 41 04 10 15
091 893 30 00251 46 04 08 13
125 1226 45 00153 57 08 15 21
129 1265 40 00200 58 08 13 20
131 1285 35 00266 59 12 21 26
138 1354 30 00381 60 06 10 18
168 1648 45 00206 64 22 34 37
184 1805 30 00508 66 09 13 22
252 2472 45 00309 84 43 51 53
Average variability across all 15 test conditions 18 24
Table 1
Table 2 Descriptive characteristics of the study participants
Gender Sample
Size Age
Left
Handed
Right
Handed
Height
(cm)
Weight
(kg)
BMI
(kg∙m-2
)
Body Fat
()
Male 23 489 (68) 1 22 1762 (62) 806 (116) 259 (27) 207 (34)
Female 37 496 (64) 4 33 1628 (54) 629 (84) 238 (35) 328 (66)
Overall 60 494 (65) 5 55 1679 (87) 697 (130) 246 (34) 282 (81)
for the measurement of body fat there were 2 less participants (1 male and 1 female)
Table 2
Table 3 Average intensity (METS) and average left right and waist positioned GENEA output by activity
GENEA
(SVMgs (g middot minutes)
Actigraph (CountsMinute)
RT3 (VM CountsMinute)
Activity Grouping
N METS Left Wrist Right Wrist Waist Waist Waist
Mean SD Mean SD Mean SD Mean SD Mean SD Mean SD
Lateral Recumbent (lying on side) Posture
(all)
53 094 023 63 55 143 53 34 17 0 0 4 11
Seated Computer Work 55 122 029 185 86 242 67 48 33 1 3 9 21
Standing 55 113 025 100 66 103 177 48 15 0 0 3 9
Window Washing Lifestyle
(2 of 4)dagger
31 337 106 469 693 1808 708 185 61 138 177 463 344
Washing Dishes 24 235 045 634 177 768 239 132 164 51 80 160 74
Shelf Stacking 30 419 098 884 224 940 202 214 72 2620 1933 421 297
Sweeping 23 339 067 878 264 976 289 187 48 465 355 356 96
Slow Treadmill Walk (4 km∙hr-1
) Ambulatory
(all)
54 388 069 864 195 847 232 856 221 2323 643 1267 318
Medium Treadmill Walk (5 km∙hr-1
) 55 459 079 1177 299 1204 357 1264 214 3745 656 1659 331
Brisk Treadmill Walk (6 km∙hr-1
) 55 588 098 1506 400 1513 350 1815 272 4917 940 2228 450
Stair AscentDescent (80 steps∙min-1
) Stairs (all) 55 619 110 836 620 794 597 697 127 2427 780 811 208
Slow Treadmill Run (8 km∙hr-1
) Ambulatory
(1 of 3)Dagger
18 1113 138 3858 588 4087 798 3553 593 8936 1794 4578 799
Medium Treadmill Run (10 km∙hr-1
) 14 1200 124 5345 1073 4915 787 4043 325 8904 1826 5419 423
Fast Treadmill Run (12 km∙hr-1
) 5 1361 060 5096 2339 5358 2460 4066 299 6982 3233 6093 674
Brisk Free-living Walk (6 km∙hr-1
) Ambulatory
(all) 40 576 094 1433 171 1474 216 1769 227 4912 748 2434 559
Medium Free-living Run (10 km∙hr-1
) Ambulatory
(optional) 5 1262 117 5151 1113 4844 1232 3756 631 8825 1592 5525 787
listwise sample size dagger indicates that participants were randomly allocated 2 out of the 4 activities in this grouping
Dagger indicates that participants had the option to run (select 1 out of the 3 activities in this grouping) if they so chose
Note 1 MET = 35 ml∙kg∙min-1
Table 3
Table 4 Sensitivity specificity area under the ROC curve and GENEA SVMgs (g middot minutes)
cut points that maximized sensitivity and specificity at three wear positions
Intensity Sensitivity Specificity Area under ROC
curve (95 CI)
GENEA Cut points
SVMgs (g middot minutes)
Left Wrist
Sedentary 97 95 098 (098-099) lt 217
Light NA NA NA 217-644
Moderate 95 72 091 (088-093) 645-1810
Vigorous 78 98 091 (086-095) gt 1810
Right Wrist
Sedentary 99 96 098 (097-099) lt 386
Light NA NA NA 386-439
Moderate 100 56 084 (0-81-087) 440-2098
Vigorous 78 97 089 (084-094) gt 2098
Waist
Sedentary 99 96 097 (096-098) lt 77
Light NA NA NA 77-219
Moderate 96 80 093 (091-095) 220-2056
Vigorous 73 99 092 (088-096) gt 2056
Sedentary (lt15 METS) light (15-399 METS) moderate (400-699 METS) vigorous (7+
METS)
NA = not applicable as the sedentary and moderate cut points provide the boundaries for the light
intensity category
Table 4
0
10
20
30
40
50
60
70
80
90
100
GE
NE
A
SV
Mg
s (g
s
eco
nd
s)
Condition1 2 3 4 5 6 7 8 9 10 11 12 13 14 15
Figure 1
GENEA SVMgs (g minutes)
Figure 2
6
6
the raw 80 Hz triaxial GENEA data were summarized into a signal magnitude vector (gravity-
subtracted) (SVMgs) using 1 second epochs [see equation 1] (11) The resulting SI units for this
outcome variable are g ∙ seconds
Equation 1
SVMgs = 2 2 2x y z g
where the correction for gravity was undertaken to focus the outcome variable on
dynamic rather than static accelerations
Although not the focus of the present study the post processing software does allow the user to
summarize the raw triaxial signal using units of acceleration This is achieved by using the mean
signal magnitude vector over the user-defined epoch [see equation 2] rather than the integral
measure of the SVM as outlined above (26)
Equation 2
SVM = 2 2 2x y z
as this is a mean rather than an cumulative sum it retains its gravity-based acceleration
units (g) where 1 g=981 mmiddots-2
Next data were imported into a customized spreadsheet application using the common epoch-
by-epoch time stamp to alignsynchronize the data across units and models (verified by cross-
correlation analyses) The recorded condition start and end times were identified and the middle
50 seconds of each condition were extracted for further analysis
Paragraph Number 8 Statistical Analyses For all test conditions the mean count output (50
replicate seconds) of each accelerometer for each condition was calculated Intra- and inter-
instrument reliability was calculated using standard deviation and coefficient of variation (CVintra
and CVinter) Pearson product-moment correlation was used to determine the criterion validity of
7
7
the GENEA versus the MAST acceleration All analyses were performed using SPSS version
150 for Windows (SPSS Chicago USA)
Value Calibration
Paragraph Number 9 Participants Participant recruitment was initiated in February 2008 in an
effort to obtain a convenience sample of 60 male and female volunteers aged 40-65 years Two
recruitment methods were used an email to employees of the University of Exeter Exeter
Devon UK and an advertisement in a local newspaper A health and fitness report and a pound20 gift
card were offered as incentive and honorarium respectively for participating in the study Data
collection was undertaken in March and April 2008 after which time 60 adults (62 female)
aged 40ndash63 years completed the study protocol All participants were free from diagnosed
disease and musculoskeletal injury and had no affirmative answers to the Physical Activity
Readiness Questionnaire (PAR-Q) Written informed consent was obtained from each
participant The study was approved by the Ethics committee of the School of Sport and Health
Sciences University of Exeter
Paragraph Number 10 Data Collection Procedures Participants arrived at the laboratory
having refrained from consuming nicotine caffeine or a large meal for at least two hours prior
and exercise at least 6 hours prior to the appointment As part of a larger battery of
anthropometry and health-related fitness tests (peripheral to the present study) participants had
their height (to the nearest 01 cm) and body mass (to the nearest 01 kg) measured using a
Holtain stadiometer (Holtain Crymych Dyfedd UK) and a Tanita TBF-305 scale (Tanita UK
Ltd Middlesex UK) respectively Whole body bioelectrical impedance analysis (BodyStat
1500 BodyStat Onchan Isle of Man United Kingdom) was also performed to determine
percent body fat Next each participant was asked to complete an ordered series of 10-12 semi-
8
8
structured activities in the laboratory and free-living environment The lying activity was
performed for 10 minutes while all other activities were performed for 45 minutes In between
each activity the participants were given at least 2 minutes rest to allow them to prepare for the
next activity and for their metabolic rate (oxygen uptake) to recover to pre-activity levels
Throughout testing VO2 VCO2 and heart rate were measured by the Cosmed K4b2 (Rome
Italy) portable metabolic gas analysis system with heart rate receiver Prior to each testing
session the K4b2 was calibrated with gases of known concentration and the flow sensor
calibration and environmental conditions updated Lastly the K4b2 and the computer running
the software were time-synchronized with the Greenwich Mean Time server The K4b2 has
been shown to provide valid measurements of oxygen uptake across a range of exercise
intensities (13) After each testing session the relative VO2 data were downloaded and stored on
a PC for further analysis
Paragraph Number 11 Accelerometer Throughout testing three GENEA accelerometers were
worn one on each of the left and right wrists (using simple watch straps accelerometers
positioned over the dorsal aspect of the wrists midway between the radial and ulnar styloid
processes) and one on the waist (using a elasticized belt accelerometer positioned over the right
hip mid-clavicular line landmarked by the supraspinale) The same three GENEAs were used
by all 60 participants and were always positioned at the same sites for each On the same belt
adjacent to the waist-worn GENEA participants wore two peer accelerometers a uniaxial
Actigraph GT1M accelerometer with firmware version 300 (Actigraph Pensacola Florida
USA) and a triaxial RT3 accelerometer (Stayhealthycom Monrovia California USA) At the
start of each testing session the accelerometers were time synchronized with the GMT time
server and initialized to record acceleration data The epoch length was set at 80 Hz 1 second
9
9
and 1 minute 3-axis for the GENEAs Actigraph and RT3‟s respectively however only the
vector magnitude data from the RT3 were analyzed After each testing session the accelerometer
data were downloaded and stored on a PC for further analysis
Paragraph Number 12 Data Analyses Using the K4b2 software the breath-by-breath VO2
data were filtered using 1 minute averaging Using the GENEA Post Processing software
(version 121) the raw 80 Hz triaxial GENEA data were summarized into SVMgs using 1 minute
epoch intervals The Actigraph data were also integrated to 1-minute epochs for further analysis
Custom spreadsheet applications were developed to temporally synchronize the minute-by-
minute data from the K4b2 with the data from the three accelerometer models The combined
data set was then plotted to facilitate the selection of the minute of accelerometer data that
coincided with steady-state VO2 for each of the activities performed Ideally and in most cases
this was the 4th
minute of each activity however in a minority of cases the 3rd
minute was
selected as it better represented steady-state due to occasional time synchronization issues (the
10th
or 9th
minute for the lying activity) The relative VO2 and accelerometer data corresponding
to the selected minute were exported to SPSS version 150 for Windows (SPSS Chicago USA)
for further analysis Pearson correlations were calculated between each accelerometer output
and VO2
Paragraph Number 13 The VO2 data were converted to METS using the standard
conversion of 1 MET = 35 mlmiddotkg-1
middotmin-1
and then coded into one of four absolute intensity
categories sedentary (lt15 METS) light (15-399 METS) moderate (400-699 METS) or
vigorous (7+ METS) activity The impetus for using 4 and 7 rather than 3 and 6 MET
thresholds to mark moderate and vigorous intensity physical activity follows the rationale
described in a review by Shephard (23) Citing work by Porcari et al (19) Shephard noted that
10
10
those deriving health benefits from lifestyle activities tended to be sedentary obese and elderly
people those for whom a given absolute intensity of effort such as brisk walking develops a
substantial relative intensity of effort Simply put because the present sample were
sedentaryunfit their physical activity energy expenditure for a given absolute intensity effort
such as a brisk walk is likely to be higher than for fitter individuals Therefore developing cut
points on an unfit sample using 3 and 6 MET thresholds would result in an increased chance of
erroneously categorizing fitter individuals as active rather than inactive As this was the case in
the present study the higher absolute intensity cut points of 4 and 7 METS were chosen
Paragraph Number 14 Next the accelerometer data were recoded to create binary
indicator variables (0 or 1) to facilitate the Receiver Operator Characteristic (ROC) curve
analyses For sedentary this corresponded to sedentary activities versus more than sedentary
activities For moderate intensity this corresponded to less than moderate activities versus
moderate to vigorous activities For vigorous intensity this corresponded to vigorous activities
versus less than vigorous activities Next the binary coded accelerometer data were exported to
GraphPad Prism 400 for Windows (GraphPad Software San Diego USA) to undergo the ROC
curve analyses
Paragraph Number 15 A ROC curve is a graphical technique for describing and
comparing the accuracy of diagnostic tests In the present application ROC analysis is used to
examine the potential of using thresholds within the GENEA Actigraph and RT3 data to
discriminate between four activity intensity categories As Jago et al (10) described ROC
analysis is a means to evaluate and visualize the sensitivity [true positives(true positives + false
negatives)] and specificity [true negatives(true negatives + false positives)] of tests The ROC
curve is simply a plot of the sensitivity of a test on the y-axis versus its 1-specificity (ie false
11
11
positive fraction on the x-axis) Each possible threshold value corresponds to a point on the ROC
curve The upper-left corner [the point (0 1)] represents perfect classification and the diagonal
line represents the strategy of randomly guessing Sensitivity is maximized by correctly
identifying at or above the threshold for intensity whereas specificity is maximized by correctly
excluding activities below the threshold for intensity Similar to the methods of Evenson et al
(6) the cut points at which sensitivity and specificity were both maximized were identified
RESULTS
Technical Reliability and Validity
Paragraph Number 16 All 47 GENEA accelerometers successfully initialized collected and
downloaded data The mean SMVgs (g ∙ seconds) for the GENEA accelerometers displayed a
linear trajectory across all 15 testing conditions when organized from low to high acceleration
values (Figure 1 main) The average intra- and inter-instrument reliability of the 47 GENEA
accelerometers across the 15 conditions was CVintra=18 and CVinter=24 respectively The
criterion validity for the GENEA versus the MAST acceleration for all 15 test conditions was
excellent (r=097 plt0001)
Value Calibration
Paragraph Number 17 Descriptive characteristics of the participants are shown in Table 2 The
BMI data are a testament to the fact that this is a convenience sample as the participants are
leaner than the general population In fact the prevalence of obesity among the group was 4
for men and 5 for women much lower than the 23 and 25 found in the general population
(21) However the number of left handed participants in this study (12) matched well the 11
prevalence of left handedness in the UK population (14)
12
12
Paragraph Number 18 Table 3 compares the average METS and the position-specific
GENEA results As expected the activities in the posture grouping were the lowest intensity
while the optional running activities were the highest which was reflected in the VO2 and the
accelerometer output The fact that the slow treadmill walking an activity intended to be light
intensity resulted in an average 388 METS response helps to justify the decision to utilize the
higher absolute intensity cut points of 4 and 7 METS to distinguish moderate and vigorous
intensity activity in this sample Comparing the different wear positions of the GENEA showed
that data for the left and right wrists were similar while the mean GENEA data collected at the
waist were lower as were the standard deviations Comparative data from the waist-worn
Actigraph and RT3 are also displayed in Table 3
Paragraph Number 19 Using relative VO2 as the criterion the GENEA demonstrated
excellent criterion validity across all activities (left r = 086 right r = 083 waist r = 087)
performing as well at the waist as the Actigraph GT1M (r = 086) and RT3 (r = 088) The
GENEA also demonstrated excellent concurrent validity compared to the Actigraph GT1M (r =
092) and the RT3 (097) accelerometers Device-specific scatter plots in Figure 2 provide a
graphical comparison of criterion validity (ie METS versus each accelerometer‟s output) across
the varying activity conditions
Paragraph Number 20 Table 4 outlines the results of the ROC curve analysis for the
GENEA Across all three wear positions discrimination of sedentary behavior was almost
perfect with the area under the ROC curve ranging from 097-098 On account of reduced
specificity the discrimination of moderate activity was slightly less precise ranging from 084-
093 Meanwhile it was the reduced sensitivity of vigorous intensity cut points that
compromised the discrimination of vigorous activity which ranged from 089-092 Overall the
13
13
waist-worn GENEA had the greatest classification accuracy (095) followed by the left (093)
then right wrist (090) Interestingly the GENEA on the right wrist was unable to discriminate
between light and moderate intensity categories The overall ability to discriminate between
sedentary light moderate and vigorous intensity physical activity of the waist-worn GENEA
was virtually identical to that of the Actigraph GT1M (094) and the RT3 (095) (data not
shown)
DISCUSSION
Technical Reliability and Validity
Paragraph Number 21 Researchers have used various mechanical apparatuses to oscillate
accelerometers in various axes in an effort to assess reliability These apparatuses allow the
researcher to control the magnitude of the acceleration being imparted as well as the frequency
of the oscillation two key variables that contribute to the accelerometer‟s output Mechanical
setups by virtue of the precise control of the experimental conditions are able to determine the
variability attributed solely to the accelerometer Examples include turntables (15) rotating
wheel setups (2 16) vibration tables (20) and various types of mechanical shakers (5 12 22
24 26) This type of testing is important because if the measurement error intrinsic to the
accelerometer is found to be small then focus can shift to other sources of variation (eg
position worn on the body variation over time (eg day-to-day week-to-week season-to-
season) (15)
Paragraph Number 22 This is the first study to evaluate the technical reliability and
validity of the newly introduced GENEA accelerometer Utilizing 15 testing conditions across a
range of accelerations and frequencies the GENEA was found to be highly reliable with mean
intra- and inter-instrument coefficients of variation of 18 and 24 respectively Likewise the
14
14
GENEA was found to have excellent criterion validity when compared to the MAST acceleration
(r=097) Two thirds of the above-mentioned technical reliability studies focus on Actigraph
model accelerometers and as such it is a logical comparator for the GENEA Out of six studies
the current GENEA results demonstrate the highest technical reliability with the next best
performer coming in a recent study on the Actigraph GT1M (CVintra=29 and CVinter=35)
(24) In terms of criterion validity with the MAST the only relevant comparison comes from a
study on the Actigraph 7164 (2) where the validity coefficient was identical to the present study
Value Calibration
Paragraph Number 23 This is the first study to develop accelerometer cut points for both wrist
and waist-worn GENEA accelerometers that reflect sedentary light moderate and vigorous
intensity physical activity in adults The delineation of intensity of physical activity from
accelerometer data aids in the understanding of the relationship between health-related physical
activity and potential predictor variables such as adiposity age health status and ethnicity (10)
The process used to convert raw accelerometer data into more meaningful and interpretable units
is generally referred to as ldquovalue calibrationrdquo (30) Although raw accelerometer data provides an
indicator of overall movement a fundamental research challenge has been to determine how to
equate it to more meaningful indicators such as energy expenditure or time spent at given
activity intensity Being able to identify the amount of time spent in a range of intensity
categories is useful given the fact that numerous international physical activity guidelines
recommend various amounts of time be spent in specific intensity categories (27)
Paragraph Number 24 In the present study the GENEA demonstrated high levels of
criterion validity (with an average correlation with METS across wear positions of r = 085)
across 10-12 static and dynamic physical activities In fact the criterion validity of the GENEA
15
15
was virtually identical to that of the Actigraph and RT3 Similarly high levels of criterion
validity were shown by Bouten et al (1) during the development of their novel triaxial
accelerometer The GENEA also demonstrated high levels of concurrent validity compared to
the Actigraph GT1M and the RT3 with the highest correlations between the triaxial devices
These data illustrate that the GENEA is comparable to peer accelerometers a result that is
confirmed in the graphical representation of the data in Figure 2 However a closer look
suggests that the GENEA data are less variable than the RT3 and Actigraph across the intensity
spectrum Although speculative the tighter clustering of data within activities may provide
greater success for the GENEA when pursuing alternative analytical approaches For example
the tighter clustering of data within activities in the GENEA should allow for more optimal
activity classification (ie the determination of the mode of physical activity)
Paragraph Number 25 The GENEA SVMgs (g ∙ minutes) cut points established in this
study demonstrated excellent accuracy for classifying physical activity intensity across the
intensity spectrum Because this is the first article to report cut points for the GENEA it is not
possible to compare these values with other studies Although the accuracy of the GENEA was
greatest at the waist it also performed well at the wrist with the left wrist being more accurate
than the right The diminished accuracy experienced on the right wrist was likely due to
differences in participant handedness that is extraneous movements recorded during the activity
conditions were more likely to occur on the right wrist (eg scratching adjusting
clothingglasses hand gestures) However given small number of left handed participants (n=5)
testing of the hypothesis was untenable However it may be that activity signatures obtained
from the right wrist (dominant for over 80 of the population) may prove more useful than the
left (non-dominant) wrist Future research should specifically address this issue so that users
16
16
especially left handed users may know if wearing the GENEA on the right hand is possible The
small size of the GENEA and the fact that it can be positioned at the wrist a location intuitively
less obtrusive than the waist may help rectify issues related to participant compliance in future
studies and may allow for studies with extended physical activity monitoring periods (28)
Paragraph Number 26 Strengths and Limitations Several strengths are noteworthy in the
present study The first strength was the use of a mechanical shaker to perform a preliminary
technical reliability and validity assessment on the GENEA The use of this well controlled
experimental setup allowed for a robust assessment of this new technology Next the GENEA
output was collected analyzed and presented in a non-proprietary SI unit and as such can be
compared with other devices that retainemploy classical physics based measurements Next
ROC curve analysis was chosen to determine the physical activity intensity cut points which is
known to be superior to previous accelerometer calibration methods that employed linear
regression approaches (see Jago et al (10) for a more thorough discussion on this topic) To
date only four studies have employed ROC curve analysis to generate cut points and these were
done on children (3 6 10 31) A further strength of the ROC curve analyses was that the cut
points were chosen to optimize the balance between sensitivity and specificity (ie point nearest
01 on the ROC curve) which in all analyses also coincided with the Youden index ensuring the
optimality of the cut points The intuitive interpretation of the Youden index is that it is the point
on the curve farthest from chance (18) Finally the comparison to two widely used peer
technologies also strengthens the study as does the fact that energy expenditure (mlmiddotkg-1
middotmin-1
)
rather than direct observation was used to provide a continuous objective and physiologically
meaningful dependent variable with which to compare the GENEA data (25)
17
17
Paragraph Number 27 Several limitations of this study should be acknowledged First
the preliminary technical reliability and validity assessment was only performed on one axis the
vertical leaving the performance of the other two axes uncharacterized Next the comparison of
the GENEA would have been more appropriate with the triaxial Actigraph GT3X rather than the
GT1M accelerometer however at the time of this study the newer Actigraphs were not part of
our accelerometer inventory Next although our sample includes men and women of differing
ages and body size our population may not be representative Larger and more variable samples
(eg more left handed more overweight and obese participants) are needed to determine if these
factors might modify our findings In addition the activity conditions selected in this study may
not represent the full complement of activities undertaken by a population therefore caution
must be used when generalizing these results to other groups Finally cross-validation of the
GENEA physical activity intensity cut points by other research groups in different adult
populations is warranted
CONCLUSION
Paragraph Number 28 The GENEA demonstrated excellent technical reliability and validity and
excellent criterion validity compared to VO2 The GENEA cut points established in this study
can be used to estimate the time spent in sedentary light moderate and vigorous intensity
physical activity in adults As a result the GENEA has established itself as an objective and
feasible measurement tool comparable to other peer accelerometers such as the Actigraph
GT1M and RT3 with the potential of offering advanced measurement features in the future
Additional work is warranted to further refine the adult cut points and to develop cut points for
other age groups in an effort to calibrate the GENEA across the lifespan Given that the high
resolution sampling of the GENEA allows for advanced data mining (eg extraction of
18
18
frequency domain features) future research should strive to classifyrecognize activities of daily
living
Acknowledgments
This research was supported by a grant from Unilever Discover Colworth Bedford UK The
authors would like to thank the participants the graduate research assistants and the
administrative staff of the School of Sport and Health Sciences for their dedication to this
research project
Conflict of Interest
The results of the present study do not constitute endorsement by the authors or ACSM of
the products described in this paper This research was funded by an unrestricted research grant
awarded by Unilever Discover to the School of Sport and Health Sciences University of Exeter
The grant funded the salary of DE and small portions of the salaries of AR and RE At the time
of this research TH and MC were both employed by Unilever Discover However at the time of
manuscript submission MC and DE have no further relationship with Unilever Discover or any
of its operating companies None of the authors have a conflict of interest with Oralinsights the
manufacturer of the technology on which this manuscript is based
19
19
References
1 Bouten CV Koekkoek KT Verduin M Kodde R Janssen JD A triaxial accelerometer and
portable data processing unit for the assessment of daily physical activity IEEE Trans
Biomed Eng 199744(3)136-47
2 Brage S Brage N Wedderkopp N Froberg K Reliability and validity of the Computer
Science and Applications accelerometer in a mechanical setting Measurement in Physical
Education and Exercise Science 20037(2)101-19
3 Chu EY McManus AM Yu CC Calibration of the RT3 accelerometer for ambulation and
nonambulation in children Med Sci Sports Exerc 200739(11)2085-91
4 Esliger DW and Tremblay MS Physical activity and inactivity profiling the next generation
Can J Public Health 200798 Suppl 2S195-S207
5 Esliger DW and Tremblay MS Technical reliability assessment of three accelerometer
models in a mechanical setup Med Sci Sports Exerc 200638(12)2173-81
6 Evenson KR Catellier DJ Gill K Ondrak KS McMurray RG Calibration of two objective
measures of physical activity for children J Sports Sci 20081-9
7 Fruin ML and Rankin JW Validity of a multi-sensor armband in estimating rest and exercise
energy expenditure Med Sci Sports Exerc 200436(6)1063-9
8 Gizatullin AO and Edge KA Adaptive control for a multi-axis hydraulic test rig
Proceedings of the Institution of Mechanical Engineers Part I Journal of Systems and
Control Engineering 2007221(2)183-98
9 Grant PM Ryan CG Tigbe WW Granat MH The validation of a novel activity monitor in
the measurement of posture and motion during everyday activities Br J Sports Med
200640(12)992-7
10 Jago R Zakeri I Baranowski T Watson K Decision boundaries and receiver operating
characteristic curves new methods for determining accelerometer cutpoints J Sports Sci
200725(8)937-44
20
20
11 Karantonis DM Narayanan MR Mathie M Lovell NH Celler BG Implementation of a
real-time human movement classifier using a triaxial accelerometer for ambulatory
monitoring IEEE Trans Inf Technol Biomed 200610(1)156-67
12 Krasnoff JB Kohn MA Choy FK Doyle J Johansen K Painter PL Interunit and
intraunit reliability of the RT3 triaxial accelerometer J Phys Act Health 20085(4)527-38
13 McLaughlin JE King GA Howley ET Bassett DR Jr Ainsworth BE Validation of the
COSMED K4 b2 portable metabolic system Int J Sports Med 200122(4)280-4
14 McManus IC and Hartigan A Declining left-handedness in Victorian England seen in the
films of Mitchell and Kenyon Curr Biol 200717(18)R793-R794
15 Metcalf BS Curnow JS Evans C Voss LD Wilkin TJ Technical reliability of the CSA
activity monitor The EarlyBird Study Med Sci Sports Exerc 200234(9)1533-7
16 Moeller NC Korsholm L Kristensen PL Andersen LB Wedderkopp N Froberg K
Unit-specific calibration of Actigraph accelerometers in a mechanical setup - is it worth the
effort The effect on random output variation caused by technical inter-instrument variability
in the laboratory and in the field BMC Med Res Methodol 2008819
17 Montoye HJ Kemper HCG Saris WHM Washburn RA Measuring Physical Activity
and Energy Expenditure Champaign IL Human Kinetics 1996
18 Perkins NJ and Schisterman EF The inconsistency of optimal cutpoints obtained using
two criteria based on the receiver operating characteristic curve Am J Epidemiol
2006163(7)670-5
19 Porcari J McCarron R Kline G Freedson PS Ward A Ross JA Rippe JM Is fast
walking an adequate aerobic training stimulus for 30- to 69-year-old men and women
Physician Sportsmed 198715(2)119-29
20 Powell SM Jones DI Rowlands AV Technical variability of the RT3 accelerometer
Med Sci Sports Exerc 200335(10)1773-8
21 Rennie KL and Jebb SA Prevalence of obesity in Great Britain Obes Rev 20056(1)11-
2
21
21
22 Rothney MP Apker GA Song Y Chen KY Comparing the performance of three
generations of ActiGraph accelerometers J Appl Physiol 2008105(4)1091-7
23 Shephard RJ Absolute versus relative intensity of physical activity in a dose-response
context Med Sci Sports Exerc 200133(6 Suppl)S400-S418
24 Silva P Esliger DW Welk GJ Mota J Technical reliability assessment of the Actigraph
GT1M accelerometer Measurement in Physical Education and Exercise Science
20101479-91
25 Sirard JR Trost SG Pfeiffer KA Dowda M Pate RR Calibration and evaluation of an
objective measure of physical activity in preschool children Journal of Physical Activity and
Health 20053345-57
26 Van Hees V Slootmaker SM De GG Van MW Van Lummel RC Reproducibility of a
triaxial seismic accelerometer (DynaPort) Med Sci Sports Exerc 200941(4)810-7
27 Warburton DE Katzmarzyk PT Rhodes RE Shephard RJ Evidence-informed physical
activity guidelines for Canadian adults Can J Public Health 200798 Suppl 2S16-S68
28 Ware LJ Hurling R Bataveljic O Fairley BW Hurst TL Murray P Rennie KL
Tomkins CE Finn A Cobain MR Pearson DA Foreyt JP Rates and determinants of uptake
and use of an internet physical activity and weight management program in office and
manufacturing work sites in England cohort study J Med Internet Res 200810(4)e56
29 Welk G Physical Activity Assessments for Health-Related Research Champaign IL Human Kinetics 2002
30 Welk GJ Principles of design and analyses for the calibration of accelerometry-based
activity monitors Med Sci Sports Exerc 200537(11 Suppl)S501-S511
31 Welk GJ Eisenmann JC Schaben J Trost SG Dale D Calibration of the biotrainer pro
activity monitor in children Pediatr Exerc Sci 200719(2)145-58
32 Zhang K Werner P Sun M Pi-Sunyer FX Boozer CN Measurement of human daily
physical activity Obes Res 200311(1)33-40
22
22
Figure Captions
Figure 1 Inset right Overhead view of GENEA accelerometers positioned in the test jig Inset
left Multi-Axis Shaker Table (MAST) complete with the test jig secured in place Main Figure
Comparison of a typical output trace from one GENEA accelerometer across the 15 test
conditions
Notes i) the trace represents the middle 50 seconds of each of the 15 conditions
Figure 2 Relationship between physical activity intensity (METS) versus the outputs from the
waist worn GENEA SVMgs (g middot minutes) RT3 (countsminute) and Actigraph (countsmin)
accelerometers across the 16 activity conditions
Table 1 Reliability results for the GENEA for all 15 test conditions
Acceleration Frequency Amplitude GENEA SVMgs
(g ∙ seconds)
CV intra
CV inter
g (mmiddots-2
) (Hz) (m) Mean SD GENEA GENEA
005 049 10 00124 3 01 39 53
022 216 10 00547 11 02 17 20
046 451 30 00127 23 02 08 14
046 451 25 00183 24 02 09 14
048 471 20 00298 25 03 10 14
049 481 15 00541 25 03 11 16
079 775 50 00079 41 04 10 15
091 893 30 00251 46 04 08 13
125 1226 45 00153 57 08 15 21
129 1265 40 00200 58 08 13 20
131 1285 35 00266 59 12 21 26
138 1354 30 00381 60 06 10 18
168 1648 45 00206 64 22 34 37
184 1805 30 00508 66 09 13 22
252 2472 45 00309 84 43 51 53
Average variability across all 15 test conditions 18 24
Table 1
Table 2 Descriptive characteristics of the study participants
Gender Sample
Size Age
Left
Handed
Right
Handed
Height
(cm)
Weight
(kg)
BMI
(kg∙m-2
)
Body Fat
()
Male 23 489 (68) 1 22 1762 (62) 806 (116) 259 (27) 207 (34)
Female 37 496 (64) 4 33 1628 (54) 629 (84) 238 (35) 328 (66)
Overall 60 494 (65) 5 55 1679 (87) 697 (130) 246 (34) 282 (81)
for the measurement of body fat there were 2 less participants (1 male and 1 female)
Table 2
Table 3 Average intensity (METS) and average left right and waist positioned GENEA output by activity
GENEA
(SVMgs (g middot minutes)
Actigraph (CountsMinute)
RT3 (VM CountsMinute)
Activity Grouping
N METS Left Wrist Right Wrist Waist Waist Waist
Mean SD Mean SD Mean SD Mean SD Mean SD Mean SD
Lateral Recumbent (lying on side) Posture
(all)
53 094 023 63 55 143 53 34 17 0 0 4 11
Seated Computer Work 55 122 029 185 86 242 67 48 33 1 3 9 21
Standing 55 113 025 100 66 103 177 48 15 0 0 3 9
Window Washing Lifestyle
(2 of 4)dagger
31 337 106 469 693 1808 708 185 61 138 177 463 344
Washing Dishes 24 235 045 634 177 768 239 132 164 51 80 160 74
Shelf Stacking 30 419 098 884 224 940 202 214 72 2620 1933 421 297
Sweeping 23 339 067 878 264 976 289 187 48 465 355 356 96
Slow Treadmill Walk (4 km∙hr-1
) Ambulatory
(all)
54 388 069 864 195 847 232 856 221 2323 643 1267 318
Medium Treadmill Walk (5 km∙hr-1
) 55 459 079 1177 299 1204 357 1264 214 3745 656 1659 331
Brisk Treadmill Walk (6 km∙hr-1
) 55 588 098 1506 400 1513 350 1815 272 4917 940 2228 450
Stair AscentDescent (80 steps∙min-1
) Stairs (all) 55 619 110 836 620 794 597 697 127 2427 780 811 208
Slow Treadmill Run (8 km∙hr-1
) Ambulatory
(1 of 3)Dagger
18 1113 138 3858 588 4087 798 3553 593 8936 1794 4578 799
Medium Treadmill Run (10 km∙hr-1
) 14 1200 124 5345 1073 4915 787 4043 325 8904 1826 5419 423
Fast Treadmill Run (12 km∙hr-1
) 5 1361 060 5096 2339 5358 2460 4066 299 6982 3233 6093 674
Brisk Free-living Walk (6 km∙hr-1
) Ambulatory
(all) 40 576 094 1433 171 1474 216 1769 227 4912 748 2434 559
Medium Free-living Run (10 km∙hr-1
) Ambulatory
(optional) 5 1262 117 5151 1113 4844 1232 3756 631 8825 1592 5525 787
listwise sample size dagger indicates that participants were randomly allocated 2 out of the 4 activities in this grouping
Dagger indicates that participants had the option to run (select 1 out of the 3 activities in this grouping) if they so chose
Note 1 MET = 35 ml∙kg∙min-1
Table 3
Table 4 Sensitivity specificity area under the ROC curve and GENEA SVMgs (g middot minutes)
cut points that maximized sensitivity and specificity at three wear positions
Intensity Sensitivity Specificity Area under ROC
curve (95 CI)
GENEA Cut points
SVMgs (g middot minutes)
Left Wrist
Sedentary 97 95 098 (098-099) lt 217
Light NA NA NA 217-644
Moderate 95 72 091 (088-093) 645-1810
Vigorous 78 98 091 (086-095) gt 1810
Right Wrist
Sedentary 99 96 098 (097-099) lt 386
Light NA NA NA 386-439
Moderate 100 56 084 (0-81-087) 440-2098
Vigorous 78 97 089 (084-094) gt 2098
Waist
Sedentary 99 96 097 (096-098) lt 77
Light NA NA NA 77-219
Moderate 96 80 093 (091-095) 220-2056
Vigorous 73 99 092 (088-096) gt 2056
Sedentary (lt15 METS) light (15-399 METS) moderate (400-699 METS) vigorous (7+
METS)
NA = not applicable as the sedentary and moderate cut points provide the boundaries for the light
intensity category
Table 4
0
10
20
30
40
50
60
70
80
90
100
GE
NE
A
SV
Mg
s (g
s
eco
nd
s)
Condition1 2 3 4 5 6 7 8 9 10 11 12 13 14 15
Figure 1
GENEA SVMgs (g minutes)
Figure 2
7
7
the GENEA versus the MAST acceleration All analyses were performed using SPSS version
150 for Windows (SPSS Chicago USA)
Value Calibration
Paragraph Number 9 Participants Participant recruitment was initiated in February 2008 in an
effort to obtain a convenience sample of 60 male and female volunteers aged 40-65 years Two
recruitment methods were used an email to employees of the University of Exeter Exeter
Devon UK and an advertisement in a local newspaper A health and fitness report and a pound20 gift
card were offered as incentive and honorarium respectively for participating in the study Data
collection was undertaken in March and April 2008 after which time 60 adults (62 female)
aged 40ndash63 years completed the study protocol All participants were free from diagnosed
disease and musculoskeletal injury and had no affirmative answers to the Physical Activity
Readiness Questionnaire (PAR-Q) Written informed consent was obtained from each
participant The study was approved by the Ethics committee of the School of Sport and Health
Sciences University of Exeter
Paragraph Number 10 Data Collection Procedures Participants arrived at the laboratory
having refrained from consuming nicotine caffeine or a large meal for at least two hours prior
and exercise at least 6 hours prior to the appointment As part of a larger battery of
anthropometry and health-related fitness tests (peripheral to the present study) participants had
their height (to the nearest 01 cm) and body mass (to the nearest 01 kg) measured using a
Holtain stadiometer (Holtain Crymych Dyfedd UK) and a Tanita TBF-305 scale (Tanita UK
Ltd Middlesex UK) respectively Whole body bioelectrical impedance analysis (BodyStat
1500 BodyStat Onchan Isle of Man United Kingdom) was also performed to determine
percent body fat Next each participant was asked to complete an ordered series of 10-12 semi-
8
8
structured activities in the laboratory and free-living environment The lying activity was
performed for 10 minutes while all other activities were performed for 45 minutes In between
each activity the participants were given at least 2 minutes rest to allow them to prepare for the
next activity and for their metabolic rate (oxygen uptake) to recover to pre-activity levels
Throughout testing VO2 VCO2 and heart rate were measured by the Cosmed K4b2 (Rome
Italy) portable metabolic gas analysis system with heart rate receiver Prior to each testing
session the K4b2 was calibrated with gases of known concentration and the flow sensor
calibration and environmental conditions updated Lastly the K4b2 and the computer running
the software were time-synchronized with the Greenwich Mean Time server The K4b2 has
been shown to provide valid measurements of oxygen uptake across a range of exercise
intensities (13) After each testing session the relative VO2 data were downloaded and stored on
a PC for further analysis
Paragraph Number 11 Accelerometer Throughout testing three GENEA accelerometers were
worn one on each of the left and right wrists (using simple watch straps accelerometers
positioned over the dorsal aspect of the wrists midway between the radial and ulnar styloid
processes) and one on the waist (using a elasticized belt accelerometer positioned over the right
hip mid-clavicular line landmarked by the supraspinale) The same three GENEAs were used
by all 60 participants and were always positioned at the same sites for each On the same belt
adjacent to the waist-worn GENEA participants wore two peer accelerometers a uniaxial
Actigraph GT1M accelerometer with firmware version 300 (Actigraph Pensacola Florida
USA) and a triaxial RT3 accelerometer (Stayhealthycom Monrovia California USA) At the
start of each testing session the accelerometers were time synchronized with the GMT time
server and initialized to record acceleration data The epoch length was set at 80 Hz 1 second
9
9
and 1 minute 3-axis for the GENEAs Actigraph and RT3‟s respectively however only the
vector magnitude data from the RT3 were analyzed After each testing session the accelerometer
data were downloaded and stored on a PC for further analysis
Paragraph Number 12 Data Analyses Using the K4b2 software the breath-by-breath VO2
data were filtered using 1 minute averaging Using the GENEA Post Processing software
(version 121) the raw 80 Hz triaxial GENEA data were summarized into SVMgs using 1 minute
epoch intervals The Actigraph data were also integrated to 1-minute epochs for further analysis
Custom spreadsheet applications were developed to temporally synchronize the minute-by-
minute data from the K4b2 with the data from the three accelerometer models The combined
data set was then plotted to facilitate the selection of the minute of accelerometer data that
coincided with steady-state VO2 for each of the activities performed Ideally and in most cases
this was the 4th
minute of each activity however in a minority of cases the 3rd
minute was
selected as it better represented steady-state due to occasional time synchronization issues (the
10th
or 9th
minute for the lying activity) The relative VO2 and accelerometer data corresponding
to the selected minute were exported to SPSS version 150 for Windows (SPSS Chicago USA)
for further analysis Pearson correlations were calculated between each accelerometer output
and VO2
Paragraph Number 13 The VO2 data were converted to METS using the standard
conversion of 1 MET = 35 mlmiddotkg-1
middotmin-1
and then coded into one of four absolute intensity
categories sedentary (lt15 METS) light (15-399 METS) moderate (400-699 METS) or
vigorous (7+ METS) activity The impetus for using 4 and 7 rather than 3 and 6 MET
thresholds to mark moderate and vigorous intensity physical activity follows the rationale
described in a review by Shephard (23) Citing work by Porcari et al (19) Shephard noted that
10
10
those deriving health benefits from lifestyle activities tended to be sedentary obese and elderly
people those for whom a given absolute intensity of effort such as brisk walking develops a
substantial relative intensity of effort Simply put because the present sample were
sedentaryunfit their physical activity energy expenditure for a given absolute intensity effort
such as a brisk walk is likely to be higher than for fitter individuals Therefore developing cut
points on an unfit sample using 3 and 6 MET thresholds would result in an increased chance of
erroneously categorizing fitter individuals as active rather than inactive As this was the case in
the present study the higher absolute intensity cut points of 4 and 7 METS were chosen
Paragraph Number 14 Next the accelerometer data were recoded to create binary
indicator variables (0 or 1) to facilitate the Receiver Operator Characteristic (ROC) curve
analyses For sedentary this corresponded to sedentary activities versus more than sedentary
activities For moderate intensity this corresponded to less than moderate activities versus
moderate to vigorous activities For vigorous intensity this corresponded to vigorous activities
versus less than vigorous activities Next the binary coded accelerometer data were exported to
GraphPad Prism 400 for Windows (GraphPad Software San Diego USA) to undergo the ROC
curve analyses
Paragraph Number 15 A ROC curve is a graphical technique for describing and
comparing the accuracy of diagnostic tests In the present application ROC analysis is used to
examine the potential of using thresholds within the GENEA Actigraph and RT3 data to
discriminate between four activity intensity categories As Jago et al (10) described ROC
analysis is a means to evaluate and visualize the sensitivity [true positives(true positives + false
negatives)] and specificity [true negatives(true negatives + false positives)] of tests The ROC
curve is simply a plot of the sensitivity of a test on the y-axis versus its 1-specificity (ie false
11
11
positive fraction on the x-axis) Each possible threshold value corresponds to a point on the ROC
curve The upper-left corner [the point (0 1)] represents perfect classification and the diagonal
line represents the strategy of randomly guessing Sensitivity is maximized by correctly
identifying at or above the threshold for intensity whereas specificity is maximized by correctly
excluding activities below the threshold for intensity Similar to the methods of Evenson et al
(6) the cut points at which sensitivity and specificity were both maximized were identified
RESULTS
Technical Reliability and Validity
Paragraph Number 16 All 47 GENEA accelerometers successfully initialized collected and
downloaded data The mean SMVgs (g ∙ seconds) for the GENEA accelerometers displayed a
linear trajectory across all 15 testing conditions when organized from low to high acceleration
values (Figure 1 main) The average intra- and inter-instrument reliability of the 47 GENEA
accelerometers across the 15 conditions was CVintra=18 and CVinter=24 respectively The
criterion validity for the GENEA versus the MAST acceleration for all 15 test conditions was
excellent (r=097 plt0001)
Value Calibration
Paragraph Number 17 Descriptive characteristics of the participants are shown in Table 2 The
BMI data are a testament to the fact that this is a convenience sample as the participants are
leaner than the general population In fact the prevalence of obesity among the group was 4
for men and 5 for women much lower than the 23 and 25 found in the general population
(21) However the number of left handed participants in this study (12) matched well the 11
prevalence of left handedness in the UK population (14)
12
12
Paragraph Number 18 Table 3 compares the average METS and the position-specific
GENEA results As expected the activities in the posture grouping were the lowest intensity
while the optional running activities were the highest which was reflected in the VO2 and the
accelerometer output The fact that the slow treadmill walking an activity intended to be light
intensity resulted in an average 388 METS response helps to justify the decision to utilize the
higher absolute intensity cut points of 4 and 7 METS to distinguish moderate and vigorous
intensity activity in this sample Comparing the different wear positions of the GENEA showed
that data for the left and right wrists were similar while the mean GENEA data collected at the
waist were lower as were the standard deviations Comparative data from the waist-worn
Actigraph and RT3 are also displayed in Table 3
Paragraph Number 19 Using relative VO2 as the criterion the GENEA demonstrated
excellent criterion validity across all activities (left r = 086 right r = 083 waist r = 087)
performing as well at the waist as the Actigraph GT1M (r = 086) and RT3 (r = 088) The
GENEA also demonstrated excellent concurrent validity compared to the Actigraph GT1M (r =
092) and the RT3 (097) accelerometers Device-specific scatter plots in Figure 2 provide a
graphical comparison of criterion validity (ie METS versus each accelerometer‟s output) across
the varying activity conditions
Paragraph Number 20 Table 4 outlines the results of the ROC curve analysis for the
GENEA Across all three wear positions discrimination of sedentary behavior was almost
perfect with the area under the ROC curve ranging from 097-098 On account of reduced
specificity the discrimination of moderate activity was slightly less precise ranging from 084-
093 Meanwhile it was the reduced sensitivity of vigorous intensity cut points that
compromised the discrimination of vigorous activity which ranged from 089-092 Overall the
13
13
waist-worn GENEA had the greatest classification accuracy (095) followed by the left (093)
then right wrist (090) Interestingly the GENEA on the right wrist was unable to discriminate
between light and moderate intensity categories The overall ability to discriminate between
sedentary light moderate and vigorous intensity physical activity of the waist-worn GENEA
was virtually identical to that of the Actigraph GT1M (094) and the RT3 (095) (data not
shown)
DISCUSSION
Technical Reliability and Validity
Paragraph Number 21 Researchers have used various mechanical apparatuses to oscillate
accelerometers in various axes in an effort to assess reliability These apparatuses allow the
researcher to control the magnitude of the acceleration being imparted as well as the frequency
of the oscillation two key variables that contribute to the accelerometer‟s output Mechanical
setups by virtue of the precise control of the experimental conditions are able to determine the
variability attributed solely to the accelerometer Examples include turntables (15) rotating
wheel setups (2 16) vibration tables (20) and various types of mechanical shakers (5 12 22
24 26) This type of testing is important because if the measurement error intrinsic to the
accelerometer is found to be small then focus can shift to other sources of variation (eg
position worn on the body variation over time (eg day-to-day week-to-week season-to-
season) (15)
Paragraph Number 22 This is the first study to evaluate the technical reliability and
validity of the newly introduced GENEA accelerometer Utilizing 15 testing conditions across a
range of accelerations and frequencies the GENEA was found to be highly reliable with mean
intra- and inter-instrument coefficients of variation of 18 and 24 respectively Likewise the
14
14
GENEA was found to have excellent criterion validity when compared to the MAST acceleration
(r=097) Two thirds of the above-mentioned technical reliability studies focus on Actigraph
model accelerometers and as such it is a logical comparator for the GENEA Out of six studies
the current GENEA results demonstrate the highest technical reliability with the next best
performer coming in a recent study on the Actigraph GT1M (CVintra=29 and CVinter=35)
(24) In terms of criterion validity with the MAST the only relevant comparison comes from a
study on the Actigraph 7164 (2) where the validity coefficient was identical to the present study
Value Calibration
Paragraph Number 23 This is the first study to develop accelerometer cut points for both wrist
and waist-worn GENEA accelerometers that reflect sedentary light moderate and vigorous
intensity physical activity in adults The delineation of intensity of physical activity from
accelerometer data aids in the understanding of the relationship between health-related physical
activity and potential predictor variables such as adiposity age health status and ethnicity (10)
The process used to convert raw accelerometer data into more meaningful and interpretable units
is generally referred to as ldquovalue calibrationrdquo (30) Although raw accelerometer data provides an
indicator of overall movement a fundamental research challenge has been to determine how to
equate it to more meaningful indicators such as energy expenditure or time spent at given
activity intensity Being able to identify the amount of time spent in a range of intensity
categories is useful given the fact that numerous international physical activity guidelines
recommend various amounts of time be spent in specific intensity categories (27)
Paragraph Number 24 In the present study the GENEA demonstrated high levels of
criterion validity (with an average correlation with METS across wear positions of r = 085)
across 10-12 static and dynamic physical activities In fact the criterion validity of the GENEA
15
15
was virtually identical to that of the Actigraph and RT3 Similarly high levels of criterion
validity were shown by Bouten et al (1) during the development of their novel triaxial
accelerometer The GENEA also demonstrated high levels of concurrent validity compared to
the Actigraph GT1M and the RT3 with the highest correlations between the triaxial devices
These data illustrate that the GENEA is comparable to peer accelerometers a result that is
confirmed in the graphical representation of the data in Figure 2 However a closer look
suggests that the GENEA data are less variable than the RT3 and Actigraph across the intensity
spectrum Although speculative the tighter clustering of data within activities may provide
greater success for the GENEA when pursuing alternative analytical approaches For example
the tighter clustering of data within activities in the GENEA should allow for more optimal
activity classification (ie the determination of the mode of physical activity)
Paragraph Number 25 The GENEA SVMgs (g ∙ minutes) cut points established in this
study demonstrated excellent accuracy for classifying physical activity intensity across the
intensity spectrum Because this is the first article to report cut points for the GENEA it is not
possible to compare these values with other studies Although the accuracy of the GENEA was
greatest at the waist it also performed well at the wrist with the left wrist being more accurate
than the right The diminished accuracy experienced on the right wrist was likely due to
differences in participant handedness that is extraneous movements recorded during the activity
conditions were more likely to occur on the right wrist (eg scratching adjusting
clothingglasses hand gestures) However given small number of left handed participants (n=5)
testing of the hypothesis was untenable However it may be that activity signatures obtained
from the right wrist (dominant for over 80 of the population) may prove more useful than the
left (non-dominant) wrist Future research should specifically address this issue so that users
16
16
especially left handed users may know if wearing the GENEA on the right hand is possible The
small size of the GENEA and the fact that it can be positioned at the wrist a location intuitively
less obtrusive than the waist may help rectify issues related to participant compliance in future
studies and may allow for studies with extended physical activity monitoring periods (28)
Paragraph Number 26 Strengths and Limitations Several strengths are noteworthy in the
present study The first strength was the use of a mechanical shaker to perform a preliminary
technical reliability and validity assessment on the GENEA The use of this well controlled
experimental setup allowed for a robust assessment of this new technology Next the GENEA
output was collected analyzed and presented in a non-proprietary SI unit and as such can be
compared with other devices that retainemploy classical physics based measurements Next
ROC curve analysis was chosen to determine the physical activity intensity cut points which is
known to be superior to previous accelerometer calibration methods that employed linear
regression approaches (see Jago et al (10) for a more thorough discussion on this topic) To
date only four studies have employed ROC curve analysis to generate cut points and these were
done on children (3 6 10 31) A further strength of the ROC curve analyses was that the cut
points were chosen to optimize the balance between sensitivity and specificity (ie point nearest
01 on the ROC curve) which in all analyses also coincided with the Youden index ensuring the
optimality of the cut points The intuitive interpretation of the Youden index is that it is the point
on the curve farthest from chance (18) Finally the comparison to two widely used peer
technologies also strengthens the study as does the fact that energy expenditure (mlmiddotkg-1
middotmin-1
)
rather than direct observation was used to provide a continuous objective and physiologically
meaningful dependent variable with which to compare the GENEA data (25)
17
17
Paragraph Number 27 Several limitations of this study should be acknowledged First
the preliminary technical reliability and validity assessment was only performed on one axis the
vertical leaving the performance of the other two axes uncharacterized Next the comparison of
the GENEA would have been more appropriate with the triaxial Actigraph GT3X rather than the
GT1M accelerometer however at the time of this study the newer Actigraphs were not part of
our accelerometer inventory Next although our sample includes men and women of differing
ages and body size our population may not be representative Larger and more variable samples
(eg more left handed more overweight and obese participants) are needed to determine if these
factors might modify our findings In addition the activity conditions selected in this study may
not represent the full complement of activities undertaken by a population therefore caution
must be used when generalizing these results to other groups Finally cross-validation of the
GENEA physical activity intensity cut points by other research groups in different adult
populations is warranted
CONCLUSION
Paragraph Number 28 The GENEA demonstrated excellent technical reliability and validity and
excellent criterion validity compared to VO2 The GENEA cut points established in this study
can be used to estimate the time spent in sedentary light moderate and vigorous intensity
physical activity in adults As a result the GENEA has established itself as an objective and
feasible measurement tool comparable to other peer accelerometers such as the Actigraph
GT1M and RT3 with the potential of offering advanced measurement features in the future
Additional work is warranted to further refine the adult cut points and to develop cut points for
other age groups in an effort to calibrate the GENEA across the lifespan Given that the high
resolution sampling of the GENEA allows for advanced data mining (eg extraction of
18
18
frequency domain features) future research should strive to classifyrecognize activities of daily
living
Acknowledgments
This research was supported by a grant from Unilever Discover Colworth Bedford UK The
authors would like to thank the participants the graduate research assistants and the
administrative staff of the School of Sport and Health Sciences for their dedication to this
research project
Conflict of Interest
The results of the present study do not constitute endorsement by the authors or ACSM of
the products described in this paper This research was funded by an unrestricted research grant
awarded by Unilever Discover to the School of Sport and Health Sciences University of Exeter
The grant funded the salary of DE and small portions of the salaries of AR and RE At the time
of this research TH and MC were both employed by Unilever Discover However at the time of
manuscript submission MC and DE have no further relationship with Unilever Discover or any
of its operating companies None of the authors have a conflict of interest with Oralinsights the
manufacturer of the technology on which this manuscript is based
19
19
References
1 Bouten CV Koekkoek KT Verduin M Kodde R Janssen JD A triaxial accelerometer and
portable data processing unit for the assessment of daily physical activity IEEE Trans
Biomed Eng 199744(3)136-47
2 Brage S Brage N Wedderkopp N Froberg K Reliability and validity of the Computer
Science and Applications accelerometer in a mechanical setting Measurement in Physical
Education and Exercise Science 20037(2)101-19
3 Chu EY McManus AM Yu CC Calibration of the RT3 accelerometer for ambulation and
nonambulation in children Med Sci Sports Exerc 200739(11)2085-91
4 Esliger DW and Tremblay MS Physical activity and inactivity profiling the next generation
Can J Public Health 200798 Suppl 2S195-S207
5 Esliger DW and Tremblay MS Technical reliability assessment of three accelerometer
models in a mechanical setup Med Sci Sports Exerc 200638(12)2173-81
6 Evenson KR Catellier DJ Gill K Ondrak KS McMurray RG Calibration of two objective
measures of physical activity for children J Sports Sci 20081-9
7 Fruin ML and Rankin JW Validity of a multi-sensor armband in estimating rest and exercise
energy expenditure Med Sci Sports Exerc 200436(6)1063-9
8 Gizatullin AO and Edge KA Adaptive control for a multi-axis hydraulic test rig
Proceedings of the Institution of Mechanical Engineers Part I Journal of Systems and
Control Engineering 2007221(2)183-98
9 Grant PM Ryan CG Tigbe WW Granat MH The validation of a novel activity monitor in
the measurement of posture and motion during everyday activities Br J Sports Med
200640(12)992-7
10 Jago R Zakeri I Baranowski T Watson K Decision boundaries and receiver operating
characteristic curves new methods for determining accelerometer cutpoints J Sports Sci
200725(8)937-44
20
20
11 Karantonis DM Narayanan MR Mathie M Lovell NH Celler BG Implementation of a
real-time human movement classifier using a triaxial accelerometer for ambulatory
monitoring IEEE Trans Inf Technol Biomed 200610(1)156-67
12 Krasnoff JB Kohn MA Choy FK Doyle J Johansen K Painter PL Interunit and
intraunit reliability of the RT3 triaxial accelerometer J Phys Act Health 20085(4)527-38
13 McLaughlin JE King GA Howley ET Bassett DR Jr Ainsworth BE Validation of the
COSMED K4 b2 portable metabolic system Int J Sports Med 200122(4)280-4
14 McManus IC and Hartigan A Declining left-handedness in Victorian England seen in the
films of Mitchell and Kenyon Curr Biol 200717(18)R793-R794
15 Metcalf BS Curnow JS Evans C Voss LD Wilkin TJ Technical reliability of the CSA
activity monitor The EarlyBird Study Med Sci Sports Exerc 200234(9)1533-7
16 Moeller NC Korsholm L Kristensen PL Andersen LB Wedderkopp N Froberg K
Unit-specific calibration of Actigraph accelerometers in a mechanical setup - is it worth the
effort The effect on random output variation caused by technical inter-instrument variability
in the laboratory and in the field BMC Med Res Methodol 2008819
17 Montoye HJ Kemper HCG Saris WHM Washburn RA Measuring Physical Activity
and Energy Expenditure Champaign IL Human Kinetics 1996
18 Perkins NJ and Schisterman EF The inconsistency of optimal cutpoints obtained using
two criteria based on the receiver operating characteristic curve Am J Epidemiol
2006163(7)670-5
19 Porcari J McCarron R Kline G Freedson PS Ward A Ross JA Rippe JM Is fast
walking an adequate aerobic training stimulus for 30- to 69-year-old men and women
Physician Sportsmed 198715(2)119-29
20 Powell SM Jones DI Rowlands AV Technical variability of the RT3 accelerometer
Med Sci Sports Exerc 200335(10)1773-8
21 Rennie KL and Jebb SA Prevalence of obesity in Great Britain Obes Rev 20056(1)11-
2
21
21
22 Rothney MP Apker GA Song Y Chen KY Comparing the performance of three
generations of ActiGraph accelerometers J Appl Physiol 2008105(4)1091-7
23 Shephard RJ Absolute versus relative intensity of physical activity in a dose-response
context Med Sci Sports Exerc 200133(6 Suppl)S400-S418
24 Silva P Esliger DW Welk GJ Mota J Technical reliability assessment of the Actigraph
GT1M accelerometer Measurement in Physical Education and Exercise Science
20101479-91
25 Sirard JR Trost SG Pfeiffer KA Dowda M Pate RR Calibration and evaluation of an
objective measure of physical activity in preschool children Journal of Physical Activity and
Health 20053345-57
26 Van Hees V Slootmaker SM De GG Van MW Van Lummel RC Reproducibility of a
triaxial seismic accelerometer (DynaPort) Med Sci Sports Exerc 200941(4)810-7
27 Warburton DE Katzmarzyk PT Rhodes RE Shephard RJ Evidence-informed physical
activity guidelines for Canadian adults Can J Public Health 200798 Suppl 2S16-S68
28 Ware LJ Hurling R Bataveljic O Fairley BW Hurst TL Murray P Rennie KL
Tomkins CE Finn A Cobain MR Pearson DA Foreyt JP Rates and determinants of uptake
and use of an internet physical activity and weight management program in office and
manufacturing work sites in England cohort study J Med Internet Res 200810(4)e56
29 Welk G Physical Activity Assessments for Health-Related Research Champaign IL Human Kinetics 2002
30 Welk GJ Principles of design and analyses for the calibration of accelerometry-based
activity monitors Med Sci Sports Exerc 200537(11 Suppl)S501-S511
31 Welk GJ Eisenmann JC Schaben J Trost SG Dale D Calibration of the biotrainer pro
activity monitor in children Pediatr Exerc Sci 200719(2)145-58
32 Zhang K Werner P Sun M Pi-Sunyer FX Boozer CN Measurement of human daily
physical activity Obes Res 200311(1)33-40
22
22
Figure Captions
Figure 1 Inset right Overhead view of GENEA accelerometers positioned in the test jig Inset
left Multi-Axis Shaker Table (MAST) complete with the test jig secured in place Main Figure
Comparison of a typical output trace from one GENEA accelerometer across the 15 test
conditions
Notes i) the trace represents the middle 50 seconds of each of the 15 conditions
Figure 2 Relationship between physical activity intensity (METS) versus the outputs from the
waist worn GENEA SVMgs (g middot minutes) RT3 (countsminute) and Actigraph (countsmin)
accelerometers across the 16 activity conditions
Table 1 Reliability results for the GENEA for all 15 test conditions
Acceleration Frequency Amplitude GENEA SVMgs
(g ∙ seconds)
CV intra
CV inter
g (mmiddots-2
) (Hz) (m) Mean SD GENEA GENEA
005 049 10 00124 3 01 39 53
022 216 10 00547 11 02 17 20
046 451 30 00127 23 02 08 14
046 451 25 00183 24 02 09 14
048 471 20 00298 25 03 10 14
049 481 15 00541 25 03 11 16
079 775 50 00079 41 04 10 15
091 893 30 00251 46 04 08 13
125 1226 45 00153 57 08 15 21
129 1265 40 00200 58 08 13 20
131 1285 35 00266 59 12 21 26
138 1354 30 00381 60 06 10 18
168 1648 45 00206 64 22 34 37
184 1805 30 00508 66 09 13 22
252 2472 45 00309 84 43 51 53
Average variability across all 15 test conditions 18 24
Table 1
Table 2 Descriptive characteristics of the study participants
Gender Sample
Size Age
Left
Handed
Right
Handed
Height
(cm)
Weight
(kg)
BMI
(kg∙m-2
)
Body Fat
()
Male 23 489 (68) 1 22 1762 (62) 806 (116) 259 (27) 207 (34)
Female 37 496 (64) 4 33 1628 (54) 629 (84) 238 (35) 328 (66)
Overall 60 494 (65) 5 55 1679 (87) 697 (130) 246 (34) 282 (81)
for the measurement of body fat there were 2 less participants (1 male and 1 female)
Table 2
Table 3 Average intensity (METS) and average left right and waist positioned GENEA output by activity
GENEA
(SVMgs (g middot minutes)
Actigraph (CountsMinute)
RT3 (VM CountsMinute)
Activity Grouping
N METS Left Wrist Right Wrist Waist Waist Waist
Mean SD Mean SD Mean SD Mean SD Mean SD Mean SD
Lateral Recumbent (lying on side) Posture
(all)
53 094 023 63 55 143 53 34 17 0 0 4 11
Seated Computer Work 55 122 029 185 86 242 67 48 33 1 3 9 21
Standing 55 113 025 100 66 103 177 48 15 0 0 3 9
Window Washing Lifestyle
(2 of 4)dagger
31 337 106 469 693 1808 708 185 61 138 177 463 344
Washing Dishes 24 235 045 634 177 768 239 132 164 51 80 160 74
Shelf Stacking 30 419 098 884 224 940 202 214 72 2620 1933 421 297
Sweeping 23 339 067 878 264 976 289 187 48 465 355 356 96
Slow Treadmill Walk (4 km∙hr-1
) Ambulatory
(all)
54 388 069 864 195 847 232 856 221 2323 643 1267 318
Medium Treadmill Walk (5 km∙hr-1
) 55 459 079 1177 299 1204 357 1264 214 3745 656 1659 331
Brisk Treadmill Walk (6 km∙hr-1
) 55 588 098 1506 400 1513 350 1815 272 4917 940 2228 450
Stair AscentDescent (80 steps∙min-1
) Stairs (all) 55 619 110 836 620 794 597 697 127 2427 780 811 208
Slow Treadmill Run (8 km∙hr-1
) Ambulatory
(1 of 3)Dagger
18 1113 138 3858 588 4087 798 3553 593 8936 1794 4578 799
Medium Treadmill Run (10 km∙hr-1
) 14 1200 124 5345 1073 4915 787 4043 325 8904 1826 5419 423
Fast Treadmill Run (12 km∙hr-1
) 5 1361 060 5096 2339 5358 2460 4066 299 6982 3233 6093 674
Brisk Free-living Walk (6 km∙hr-1
) Ambulatory
(all) 40 576 094 1433 171 1474 216 1769 227 4912 748 2434 559
Medium Free-living Run (10 km∙hr-1
) Ambulatory
(optional) 5 1262 117 5151 1113 4844 1232 3756 631 8825 1592 5525 787
listwise sample size dagger indicates that participants were randomly allocated 2 out of the 4 activities in this grouping
Dagger indicates that participants had the option to run (select 1 out of the 3 activities in this grouping) if they so chose
Note 1 MET = 35 ml∙kg∙min-1
Table 3
Table 4 Sensitivity specificity area under the ROC curve and GENEA SVMgs (g middot minutes)
cut points that maximized sensitivity and specificity at three wear positions
Intensity Sensitivity Specificity Area under ROC
curve (95 CI)
GENEA Cut points
SVMgs (g middot minutes)
Left Wrist
Sedentary 97 95 098 (098-099) lt 217
Light NA NA NA 217-644
Moderate 95 72 091 (088-093) 645-1810
Vigorous 78 98 091 (086-095) gt 1810
Right Wrist
Sedentary 99 96 098 (097-099) lt 386
Light NA NA NA 386-439
Moderate 100 56 084 (0-81-087) 440-2098
Vigorous 78 97 089 (084-094) gt 2098
Waist
Sedentary 99 96 097 (096-098) lt 77
Light NA NA NA 77-219
Moderate 96 80 093 (091-095) 220-2056
Vigorous 73 99 092 (088-096) gt 2056
Sedentary (lt15 METS) light (15-399 METS) moderate (400-699 METS) vigorous (7+
METS)
NA = not applicable as the sedentary and moderate cut points provide the boundaries for the light
intensity category
Table 4
0
10
20
30
40
50
60
70
80
90
100
GE
NE
A
SV
Mg
s (g
s
eco
nd
s)
Condition1 2 3 4 5 6 7 8 9 10 11 12 13 14 15
Figure 1
GENEA SVMgs (g minutes)
Figure 2
8
8
structured activities in the laboratory and free-living environment The lying activity was
performed for 10 minutes while all other activities were performed for 45 minutes In between
each activity the participants were given at least 2 minutes rest to allow them to prepare for the
next activity and for their metabolic rate (oxygen uptake) to recover to pre-activity levels
Throughout testing VO2 VCO2 and heart rate were measured by the Cosmed K4b2 (Rome
Italy) portable metabolic gas analysis system with heart rate receiver Prior to each testing
session the K4b2 was calibrated with gases of known concentration and the flow sensor
calibration and environmental conditions updated Lastly the K4b2 and the computer running
the software were time-synchronized with the Greenwich Mean Time server The K4b2 has
been shown to provide valid measurements of oxygen uptake across a range of exercise
intensities (13) After each testing session the relative VO2 data were downloaded and stored on
a PC for further analysis
Paragraph Number 11 Accelerometer Throughout testing three GENEA accelerometers were
worn one on each of the left and right wrists (using simple watch straps accelerometers
positioned over the dorsal aspect of the wrists midway between the radial and ulnar styloid
processes) and one on the waist (using a elasticized belt accelerometer positioned over the right
hip mid-clavicular line landmarked by the supraspinale) The same three GENEAs were used
by all 60 participants and were always positioned at the same sites for each On the same belt
adjacent to the waist-worn GENEA participants wore two peer accelerometers a uniaxial
Actigraph GT1M accelerometer with firmware version 300 (Actigraph Pensacola Florida
USA) and a triaxial RT3 accelerometer (Stayhealthycom Monrovia California USA) At the
start of each testing session the accelerometers were time synchronized with the GMT time
server and initialized to record acceleration data The epoch length was set at 80 Hz 1 second
9
9
and 1 minute 3-axis for the GENEAs Actigraph and RT3‟s respectively however only the
vector magnitude data from the RT3 were analyzed After each testing session the accelerometer
data were downloaded and stored on a PC for further analysis
Paragraph Number 12 Data Analyses Using the K4b2 software the breath-by-breath VO2
data were filtered using 1 minute averaging Using the GENEA Post Processing software
(version 121) the raw 80 Hz triaxial GENEA data were summarized into SVMgs using 1 minute
epoch intervals The Actigraph data were also integrated to 1-minute epochs for further analysis
Custom spreadsheet applications were developed to temporally synchronize the minute-by-
minute data from the K4b2 with the data from the three accelerometer models The combined
data set was then plotted to facilitate the selection of the minute of accelerometer data that
coincided with steady-state VO2 for each of the activities performed Ideally and in most cases
this was the 4th
minute of each activity however in a minority of cases the 3rd
minute was
selected as it better represented steady-state due to occasional time synchronization issues (the
10th
or 9th
minute for the lying activity) The relative VO2 and accelerometer data corresponding
to the selected minute were exported to SPSS version 150 for Windows (SPSS Chicago USA)
for further analysis Pearson correlations were calculated between each accelerometer output
and VO2
Paragraph Number 13 The VO2 data were converted to METS using the standard
conversion of 1 MET = 35 mlmiddotkg-1
middotmin-1
and then coded into one of four absolute intensity
categories sedentary (lt15 METS) light (15-399 METS) moderate (400-699 METS) or
vigorous (7+ METS) activity The impetus for using 4 and 7 rather than 3 and 6 MET
thresholds to mark moderate and vigorous intensity physical activity follows the rationale
described in a review by Shephard (23) Citing work by Porcari et al (19) Shephard noted that
10
10
those deriving health benefits from lifestyle activities tended to be sedentary obese and elderly
people those for whom a given absolute intensity of effort such as brisk walking develops a
substantial relative intensity of effort Simply put because the present sample were
sedentaryunfit their physical activity energy expenditure for a given absolute intensity effort
such as a brisk walk is likely to be higher than for fitter individuals Therefore developing cut
points on an unfit sample using 3 and 6 MET thresholds would result in an increased chance of
erroneously categorizing fitter individuals as active rather than inactive As this was the case in
the present study the higher absolute intensity cut points of 4 and 7 METS were chosen
Paragraph Number 14 Next the accelerometer data were recoded to create binary
indicator variables (0 or 1) to facilitate the Receiver Operator Characteristic (ROC) curve
analyses For sedentary this corresponded to sedentary activities versus more than sedentary
activities For moderate intensity this corresponded to less than moderate activities versus
moderate to vigorous activities For vigorous intensity this corresponded to vigorous activities
versus less than vigorous activities Next the binary coded accelerometer data were exported to
GraphPad Prism 400 for Windows (GraphPad Software San Diego USA) to undergo the ROC
curve analyses
Paragraph Number 15 A ROC curve is a graphical technique for describing and
comparing the accuracy of diagnostic tests In the present application ROC analysis is used to
examine the potential of using thresholds within the GENEA Actigraph and RT3 data to
discriminate between four activity intensity categories As Jago et al (10) described ROC
analysis is a means to evaluate and visualize the sensitivity [true positives(true positives + false
negatives)] and specificity [true negatives(true negatives + false positives)] of tests The ROC
curve is simply a plot of the sensitivity of a test on the y-axis versus its 1-specificity (ie false
11
11
positive fraction on the x-axis) Each possible threshold value corresponds to a point on the ROC
curve The upper-left corner [the point (0 1)] represents perfect classification and the diagonal
line represents the strategy of randomly guessing Sensitivity is maximized by correctly
identifying at or above the threshold for intensity whereas specificity is maximized by correctly
excluding activities below the threshold for intensity Similar to the methods of Evenson et al
(6) the cut points at which sensitivity and specificity were both maximized were identified
RESULTS
Technical Reliability and Validity
Paragraph Number 16 All 47 GENEA accelerometers successfully initialized collected and
downloaded data The mean SMVgs (g ∙ seconds) for the GENEA accelerometers displayed a
linear trajectory across all 15 testing conditions when organized from low to high acceleration
values (Figure 1 main) The average intra- and inter-instrument reliability of the 47 GENEA
accelerometers across the 15 conditions was CVintra=18 and CVinter=24 respectively The
criterion validity for the GENEA versus the MAST acceleration for all 15 test conditions was
excellent (r=097 plt0001)
Value Calibration
Paragraph Number 17 Descriptive characteristics of the participants are shown in Table 2 The
BMI data are a testament to the fact that this is a convenience sample as the participants are
leaner than the general population In fact the prevalence of obesity among the group was 4
for men and 5 for women much lower than the 23 and 25 found in the general population
(21) However the number of left handed participants in this study (12) matched well the 11
prevalence of left handedness in the UK population (14)
12
12
Paragraph Number 18 Table 3 compares the average METS and the position-specific
GENEA results As expected the activities in the posture grouping were the lowest intensity
while the optional running activities were the highest which was reflected in the VO2 and the
accelerometer output The fact that the slow treadmill walking an activity intended to be light
intensity resulted in an average 388 METS response helps to justify the decision to utilize the
higher absolute intensity cut points of 4 and 7 METS to distinguish moderate and vigorous
intensity activity in this sample Comparing the different wear positions of the GENEA showed
that data for the left and right wrists were similar while the mean GENEA data collected at the
waist were lower as were the standard deviations Comparative data from the waist-worn
Actigraph and RT3 are also displayed in Table 3
Paragraph Number 19 Using relative VO2 as the criterion the GENEA demonstrated
excellent criterion validity across all activities (left r = 086 right r = 083 waist r = 087)
performing as well at the waist as the Actigraph GT1M (r = 086) and RT3 (r = 088) The
GENEA also demonstrated excellent concurrent validity compared to the Actigraph GT1M (r =
092) and the RT3 (097) accelerometers Device-specific scatter plots in Figure 2 provide a
graphical comparison of criterion validity (ie METS versus each accelerometer‟s output) across
the varying activity conditions
Paragraph Number 20 Table 4 outlines the results of the ROC curve analysis for the
GENEA Across all three wear positions discrimination of sedentary behavior was almost
perfect with the area under the ROC curve ranging from 097-098 On account of reduced
specificity the discrimination of moderate activity was slightly less precise ranging from 084-
093 Meanwhile it was the reduced sensitivity of vigorous intensity cut points that
compromised the discrimination of vigorous activity which ranged from 089-092 Overall the
13
13
waist-worn GENEA had the greatest classification accuracy (095) followed by the left (093)
then right wrist (090) Interestingly the GENEA on the right wrist was unable to discriminate
between light and moderate intensity categories The overall ability to discriminate between
sedentary light moderate and vigorous intensity physical activity of the waist-worn GENEA
was virtually identical to that of the Actigraph GT1M (094) and the RT3 (095) (data not
shown)
DISCUSSION
Technical Reliability and Validity
Paragraph Number 21 Researchers have used various mechanical apparatuses to oscillate
accelerometers in various axes in an effort to assess reliability These apparatuses allow the
researcher to control the magnitude of the acceleration being imparted as well as the frequency
of the oscillation two key variables that contribute to the accelerometer‟s output Mechanical
setups by virtue of the precise control of the experimental conditions are able to determine the
variability attributed solely to the accelerometer Examples include turntables (15) rotating
wheel setups (2 16) vibration tables (20) and various types of mechanical shakers (5 12 22
24 26) This type of testing is important because if the measurement error intrinsic to the
accelerometer is found to be small then focus can shift to other sources of variation (eg
position worn on the body variation over time (eg day-to-day week-to-week season-to-
season) (15)
Paragraph Number 22 This is the first study to evaluate the technical reliability and
validity of the newly introduced GENEA accelerometer Utilizing 15 testing conditions across a
range of accelerations and frequencies the GENEA was found to be highly reliable with mean
intra- and inter-instrument coefficients of variation of 18 and 24 respectively Likewise the
14
14
GENEA was found to have excellent criterion validity when compared to the MAST acceleration
(r=097) Two thirds of the above-mentioned technical reliability studies focus on Actigraph
model accelerometers and as such it is a logical comparator for the GENEA Out of six studies
the current GENEA results demonstrate the highest technical reliability with the next best
performer coming in a recent study on the Actigraph GT1M (CVintra=29 and CVinter=35)
(24) In terms of criterion validity with the MAST the only relevant comparison comes from a
study on the Actigraph 7164 (2) where the validity coefficient was identical to the present study
Value Calibration
Paragraph Number 23 This is the first study to develop accelerometer cut points for both wrist
and waist-worn GENEA accelerometers that reflect sedentary light moderate and vigorous
intensity physical activity in adults The delineation of intensity of physical activity from
accelerometer data aids in the understanding of the relationship between health-related physical
activity and potential predictor variables such as adiposity age health status and ethnicity (10)
The process used to convert raw accelerometer data into more meaningful and interpretable units
is generally referred to as ldquovalue calibrationrdquo (30) Although raw accelerometer data provides an
indicator of overall movement a fundamental research challenge has been to determine how to
equate it to more meaningful indicators such as energy expenditure or time spent at given
activity intensity Being able to identify the amount of time spent in a range of intensity
categories is useful given the fact that numerous international physical activity guidelines
recommend various amounts of time be spent in specific intensity categories (27)
Paragraph Number 24 In the present study the GENEA demonstrated high levels of
criterion validity (with an average correlation with METS across wear positions of r = 085)
across 10-12 static and dynamic physical activities In fact the criterion validity of the GENEA
15
15
was virtually identical to that of the Actigraph and RT3 Similarly high levels of criterion
validity were shown by Bouten et al (1) during the development of their novel triaxial
accelerometer The GENEA also demonstrated high levels of concurrent validity compared to
the Actigraph GT1M and the RT3 with the highest correlations between the triaxial devices
These data illustrate that the GENEA is comparable to peer accelerometers a result that is
confirmed in the graphical representation of the data in Figure 2 However a closer look
suggests that the GENEA data are less variable than the RT3 and Actigraph across the intensity
spectrum Although speculative the tighter clustering of data within activities may provide
greater success for the GENEA when pursuing alternative analytical approaches For example
the tighter clustering of data within activities in the GENEA should allow for more optimal
activity classification (ie the determination of the mode of physical activity)
Paragraph Number 25 The GENEA SVMgs (g ∙ minutes) cut points established in this
study demonstrated excellent accuracy for classifying physical activity intensity across the
intensity spectrum Because this is the first article to report cut points for the GENEA it is not
possible to compare these values with other studies Although the accuracy of the GENEA was
greatest at the waist it also performed well at the wrist with the left wrist being more accurate
than the right The diminished accuracy experienced on the right wrist was likely due to
differences in participant handedness that is extraneous movements recorded during the activity
conditions were more likely to occur on the right wrist (eg scratching adjusting
clothingglasses hand gestures) However given small number of left handed participants (n=5)
testing of the hypothesis was untenable However it may be that activity signatures obtained
from the right wrist (dominant for over 80 of the population) may prove more useful than the
left (non-dominant) wrist Future research should specifically address this issue so that users
16
16
especially left handed users may know if wearing the GENEA on the right hand is possible The
small size of the GENEA and the fact that it can be positioned at the wrist a location intuitively
less obtrusive than the waist may help rectify issues related to participant compliance in future
studies and may allow for studies with extended physical activity monitoring periods (28)
Paragraph Number 26 Strengths and Limitations Several strengths are noteworthy in the
present study The first strength was the use of a mechanical shaker to perform a preliminary
technical reliability and validity assessment on the GENEA The use of this well controlled
experimental setup allowed for a robust assessment of this new technology Next the GENEA
output was collected analyzed and presented in a non-proprietary SI unit and as such can be
compared with other devices that retainemploy classical physics based measurements Next
ROC curve analysis was chosen to determine the physical activity intensity cut points which is
known to be superior to previous accelerometer calibration methods that employed linear
regression approaches (see Jago et al (10) for a more thorough discussion on this topic) To
date only four studies have employed ROC curve analysis to generate cut points and these were
done on children (3 6 10 31) A further strength of the ROC curve analyses was that the cut
points were chosen to optimize the balance between sensitivity and specificity (ie point nearest
01 on the ROC curve) which in all analyses also coincided with the Youden index ensuring the
optimality of the cut points The intuitive interpretation of the Youden index is that it is the point
on the curve farthest from chance (18) Finally the comparison to two widely used peer
technologies also strengthens the study as does the fact that energy expenditure (mlmiddotkg-1
middotmin-1
)
rather than direct observation was used to provide a continuous objective and physiologically
meaningful dependent variable with which to compare the GENEA data (25)
17
17
Paragraph Number 27 Several limitations of this study should be acknowledged First
the preliminary technical reliability and validity assessment was only performed on one axis the
vertical leaving the performance of the other two axes uncharacterized Next the comparison of
the GENEA would have been more appropriate with the triaxial Actigraph GT3X rather than the
GT1M accelerometer however at the time of this study the newer Actigraphs were not part of
our accelerometer inventory Next although our sample includes men and women of differing
ages and body size our population may not be representative Larger and more variable samples
(eg more left handed more overweight and obese participants) are needed to determine if these
factors might modify our findings In addition the activity conditions selected in this study may
not represent the full complement of activities undertaken by a population therefore caution
must be used when generalizing these results to other groups Finally cross-validation of the
GENEA physical activity intensity cut points by other research groups in different adult
populations is warranted
CONCLUSION
Paragraph Number 28 The GENEA demonstrated excellent technical reliability and validity and
excellent criterion validity compared to VO2 The GENEA cut points established in this study
can be used to estimate the time spent in sedentary light moderate and vigorous intensity
physical activity in adults As a result the GENEA has established itself as an objective and
feasible measurement tool comparable to other peer accelerometers such as the Actigraph
GT1M and RT3 with the potential of offering advanced measurement features in the future
Additional work is warranted to further refine the adult cut points and to develop cut points for
other age groups in an effort to calibrate the GENEA across the lifespan Given that the high
resolution sampling of the GENEA allows for advanced data mining (eg extraction of
18
18
frequency domain features) future research should strive to classifyrecognize activities of daily
living
Acknowledgments
This research was supported by a grant from Unilever Discover Colworth Bedford UK The
authors would like to thank the participants the graduate research assistants and the
administrative staff of the School of Sport and Health Sciences for their dedication to this
research project
Conflict of Interest
The results of the present study do not constitute endorsement by the authors or ACSM of
the products described in this paper This research was funded by an unrestricted research grant
awarded by Unilever Discover to the School of Sport and Health Sciences University of Exeter
The grant funded the salary of DE and small portions of the salaries of AR and RE At the time
of this research TH and MC were both employed by Unilever Discover However at the time of
manuscript submission MC and DE have no further relationship with Unilever Discover or any
of its operating companies None of the authors have a conflict of interest with Oralinsights the
manufacturer of the technology on which this manuscript is based
19
19
References
1 Bouten CV Koekkoek KT Verduin M Kodde R Janssen JD A triaxial accelerometer and
portable data processing unit for the assessment of daily physical activity IEEE Trans
Biomed Eng 199744(3)136-47
2 Brage S Brage N Wedderkopp N Froberg K Reliability and validity of the Computer
Science and Applications accelerometer in a mechanical setting Measurement in Physical
Education and Exercise Science 20037(2)101-19
3 Chu EY McManus AM Yu CC Calibration of the RT3 accelerometer for ambulation and
nonambulation in children Med Sci Sports Exerc 200739(11)2085-91
4 Esliger DW and Tremblay MS Physical activity and inactivity profiling the next generation
Can J Public Health 200798 Suppl 2S195-S207
5 Esliger DW and Tremblay MS Technical reliability assessment of three accelerometer
models in a mechanical setup Med Sci Sports Exerc 200638(12)2173-81
6 Evenson KR Catellier DJ Gill K Ondrak KS McMurray RG Calibration of two objective
measures of physical activity for children J Sports Sci 20081-9
7 Fruin ML and Rankin JW Validity of a multi-sensor armband in estimating rest and exercise
energy expenditure Med Sci Sports Exerc 200436(6)1063-9
8 Gizatullin AO and Edge KA Adaptive control for a multi-axis hydraulic test rig
Proceedings of the Institution of Mechanical Engineers Part I Journal of Systems and
Control Engineering 2007221(2)183-98
9 Grant PM Ryan CG Tigbe WW Granat MH The validation of a novel activity monitor in
the measurement of posture and motion during everyday activities Br J Sports Med
200640(12)992-7
10 Jago R Zakeri I Baranowski T Watson K Decision boundaries and receiver operating
characteristic curves new methods for determining accelerometer cutpoints J Sports Sci
200725(8)937-44
20
20
11 Karantonis DM Narayanan MR Mathie M Lovell NH Celler BG Implementation of a
real-time human movement classifier using a triaxial accelerometer for ambulatory
monitoring IEEE Trans Inf Technol Biomed 200610(1)156-67
12 Krasnoff JB Kohn MA Choy FK Doyle J Johansen K Painter PL Interunit and
intraunit reliability of the RT3 triaxial accelerometer J Phys Act Health 20085(4)527-38
13 McLaughlin JE King GA Howley ET Bassett DR Jr Ainsworth BE Validation of the
COSMED K4 b2 portable metabolic system Int J Sports Med 200122(4)280-4
14 McManus IC and Hartigan A Declining left-handedness in Victorian England seen in the
films of Mitchell and Kenyon Curr Biol 200717(18)R793-R794
15 Metcalf BS Curnow JS Evans C Voss LD Wilkin TJ Technical reliability of the CSA
activity monitor The EarlyBird Study Med Sci Sports Exerc 200234(9)1533-7
16 Moeller NC Korsholm L Kristensen PL Andersen LB Wedderkopp N Froberg K
Unit-specific calibration of Actigraph accelerometers in a mechanical setup - is it worth the
effort The effect on random output variation caused by technical inter-instrument variability
in the laboratory and in the field BMC Med Res Methodol 2008819
17 Montoye HJ Kemper HCG Saris WHM Washburn RA Measuring Physical Activity
and Energy Expenditure Champaign IL Human Kinetics 1996
18 Perkins NJ and Schisterman EF The inconsistency of optimal cutpoints obtained using
two criteria based on the receiver operating characteristic curve Am J Epidemiol
2006163(7)670-5
19 Porcari J McCarron R Kline G Freedson PS Ward A Ross JA Rippe JM Is fast
walking an adequate aerobic training stimulus for 30- to 69-year-old men and women
Physician Sportsmed 198715(2)119-29
20 Powell SM Jones DI Rowlands AV Technical variability of the RT3 accelerometer
Med Sci Sports Exerc 200335(10)1773-8
21 Rennie KL and Jebb SA Prevalence of obesity in Great Britain Obes Rev 20056(1)11-
2
21
21
22 Rothney MP Apker GA Song Y Chen KY Comparing the performance of three
generations of ActiGraph accelerometers J Appl Physiol 2008105(4)1091-7
23 Shephard RJ Absolute versus relative intensity of physical activity in a dose-response
context Med Sci Sports Exerc 200133(6 Suppl)S400-S418
24 Silva P Esliger DW Welk GJ Mota J Technical reliability assessment of the Actigraph
GT1M accelerometer Measurement in Physical Education and Exercise Science
20101479-91
25 Sirard JR Trost SG Pfeiffer KA Dowda M Pate RR Calibration and evaluation of an
objective measure of physical activity in preschool children Journal of Physical Activity and
Health 20053345-57
26 Van Hees V Slootmaker SM De GG Van MW Van Lummel RC Reproducibility of a
triaxial seismic accelerometer (DynaPort) Med Sci Sports Exerc 200941(4)810-7
27 Warburton DE Katzmarzyk PT Rhodes RE Shephard RJ Evidence-informed physical
activity guidelines for Canadian adults Can J Public Health 200798 Suppl 2S16-S68
28 Ware LJ Hurling R Bataveljic O Fairley BW Hurst TL Murray P Rennie KL
Tomkins CE Finn A Cobain MR Pearson DA Foreyt JP Rates and determinants of uptake
and use of an internet physical activity and weight management program in office and
manufacturing work sites in England cohort study J Med Internet Res 200810(4)e56
29 Welk G Physical Activity Assessments for Health-Related Research Champaign IL Human Kinetics 2002
30 Welk GJ Principles of design and analyses for the calibration of accelerometry-based
activity monitors Med Sci Sports Exerc 200537(11 Suppl)S501-S511
31 Welk GJ Eisenmann JC Schaben J Trost SG Dale D Calibration of the biotrainer pro
activity monitor in children Pediatr Exerc Sci 200719(2)145-58
32 Zhang K Werner P Sun M Pi-Sunyer FX Boozer CN Measurement of human daily
physical activity Obes Res 200311(1)33-40
22
22
Figure Captions
Figure 1 Inset right Overhead view of GENEA accelerometers positioned in the test jig Inset
left Multi-Axis Shaker Table (MAST) complete with the test jig secured in place Main Figure
Comparison of a typical output trace from one GENEA accelerometer across the 15 test
conditions
Notes i) the trace represents the middle 50 seconds of each of the 15 conditions
Figure 2 Relationship between physical activity intensity (METS) versus the outputs from the
waist worn GENEA SVMgs (g middot minutes) RT3 (countsminute) and Actigraph (countsmin)
accelerometers across the 16 activity conditions
Table 1 Reliability results for the GENEA for all 15 test conditions
Acceleration Frequency Amplitude GENEA SVMgs
(g ∙ seconds)
CV intra
CV inter
g (mmiddots-2
) (Hz) (m) Mean SD GENEA GENEA
005 049 10 00124 3 01 39 53
022 216 10 00547 11 02 17 20
046 451 30 00127 23 02 08 14
046 451 25 00183 24 02 09 14
048 471 20 00298 25 03 10 14
049 481 15 00541 25 03 11 16
079 775 50 00079 41 04 10 15
091 893 30 00251 46 04 08 13
125 1226 45 00153 57 08 15 21
129 1265 40 00200 58 08 13 20
131 1285 35 00266 59 12 21 26
138 1354 30 00381 60 06 10 18
168 1648 45 00206 64 22 34 37
184 1805 30 00508 66 09 13 22
252 2472 45 00309 84 43 51 53
Average variability across all 15 test conditions 18 24
Table 1
Table 2 Descriptive characteristics of the study participants
Gender Sample
Size Age
Left
Handed
Right
Handed
Height
(cm)
Weight
(kg)
BMI
(kg∙m-2
)
Body Fat
()
Male 23 489 (68) 1 22 1762 (62) 806 (116) 259 (27) 207 (34)
Female 37 496 (64) 4 33 1628 (54) 629 (84) 238 (35) 328 (66)
Overall 60 494 (65) 5 55 1679 (87) 697 (130) 246 (34) 282 (81)
for the measurement of body fat there were 2 less participants (1 male and 1 female)
Table 2
Table 3 Average intensity (METS) and average left right and waist positioned GENEA output by activity
GENEA
(SVMgs (g middot minutes)
Actigraph (CountsMinute)
RT3 (VM CountsMinute)
Activity Grouping
N METS Left Wrist Right Wrist Waist Waist Waist
Mean SD Mean SD Mean SD Mean SD Mean SD Mean SD
Lateral Recumbent (lying on side) Posture
(all)
53 094 023 63 55 143 53 34 17 0 0 4 11
Seated Computer Work 55 122 029 185 86 242 67 48 33 1 3 9 21
Standing 55 113 025 100 66 103 177 48 15 0 0 3 9
Window Washing Lifestyle
(2 of 4)dagger
31 337 106 469 693 1808 708 185 61 138 177 463 344
Washing Dishes 24 235 045 634 177 768 239 132 164 51 80 160 74
Shelf Stacking 30 419 098 884 224 940 202 214 72 2620 1933 421 297
Sweeping 23 339 067 878 264 976 289 187 48 465 355 356 96
Slow Treadmill Walk (4 km∙hr-1
) Ambulatory
(all)
54 388 069 864 195 847 232 856 221 2323 643 1267 318
Medium Treadmill Walk (5 km∙hr-1
) 55 459 079 1177 299 1204 357 1264 214 3745 656 1659 331
Brisk Treadmill Walk (6 km∙hr-1
) 55 588 098 1506 400 1513 350 1815 272 4917 940 2228 450
Stair AscentDescent (80 steps∙min-1
) Stairs (all) 55 619 110 836 620 794 597 697 127 2427 780 811 208
Slow Treadmill Run (8 km∙hr-1
) Ambulatory
(1 of 3)Dagger
18 1113 138 3858 588 4087 798 3553 593 8936 1794 4578 799
Medium Treadmill Run (10 km∙hr-1
) 14 1200 124 5345 1073 4915 787 4043 325 8904 1826 5419 423
Fast Treadmill Run (12 km∙hr-1
) 5 1361 060 5096 2339 5358 2460 4066 299 6982 3233 6093 674
Brisk Free-living Walk (6 km∙hr-1
) Ambulatory
(all) 40 576 094 1433 171 1474 216 1769 227 4912 748 2434 559
Medium Free-living Run (10 km∙hr-1
) Ambulatory
(optional) 5 1262 117 5151 1113 4844 1232 3756 631 8825 1592 5525 787
listwise sample size dagger indicates that participants were randomly allocated 2 out of the 4 activities in this grouping
Dagger indicates that participants had the option to run (select 1 out of the 3 activities in this grouping) if they so chose
Note 1 MET = 35 ml∙kg∙min-1
Table 3
Table 4 Sensitivity specificity area under the ROC curve and GENEA SVMgs (g middot minutes)
cut points that maximized sensitivity and specificity at three wear positions
Intensity Sensitivity Specificity Area under ROC
curve (95 CI)
GENEA Cut points
SVMgs (g middot minutes)
Left Wrist
Sedentary 97 95 098 (098-099) lt 217
Light NA NA NA 217-644
Moderate 95 72 091 (088-093) 645-1810
Vigorous 78 98 091 (086-095) gt 1810
Right Wrist
Sedentary 99 96 098 (097-099) lt 386
Light NA NA NA 386-439
Moderate 100 56 084 (0-81-087) 440-2098
Vigorous 78 97 089 (084-094) gt 2098
Waist
Sedentary 99 96 097 (096-098) lt 77
Light NA NA NA 77-219
Moderate 96 80 093 (091-095) 220-2056
Vigorous 73 99 092 (088-096) gt 2056
Sedentary (lt15 METS) light (15-399 METS) moderate (400-699 METS) vigorous (7+
METS)
NA = not applicable as the sedentary and moderate cut points provide the boundaries for the light
intensity category
Table 4
0
10
20
30
40
50
60
70
80
90
100
GE
NE
A
SV
Mg
s (g
s
eco
nd
s)
Condition1 2 3 4 5 6 7 8 9 10 11 12 13 14 15
Figure 1
GENEA SVMgs (g minutes)
Figure 2
9
9
and 1 minute 3-axis for the GENEAs Actigraph and RT3‟s respectively however only the
vector magnitude data from the RT3 were analyzed After each testing session the accelerometer
data were downloaded and stored on a PC for further analysis
Paragraph Number 12 Data Analyses Using the K4b2 software the breath-by-breath VO2
data were filtered using 1 minute averaging Using the GENEA Post Processing software
(version 121) the raw 80 Hz triaxial GENEA data were summarized into SVMgs using 1 minute
epoch intervals The Actigraph data were also integrated to 1-minute epochs for further analysis
Custom spreadsheet applications were developed to temporally synchronize the minute-by-
minute data from the K4b2 with the data from the three accelerometer models The combined
data set was then plotted to facilitate the selection of the minute of accelerometer data that
coincided with steady-state VO2 for each of the activities performed Ideally and in most cases
this was the 4th
minute of each activity however in a minority of cases the 3rd
minute was
selected as it better represented steady-state due to occasional time synchronization issues (the
10th
or 9th
minute for the lying activity) The relative VO2 and accelerometer data corresponding
to the selected minute were exported to SPSS version 150 for Windows (SPSS Chicago USA)
for further analysis Pearson correlations were calculated between each accelerometer output
and VO2
Paragraph Number 13 The VO2 data were converted to METS using the standard
conversion of 1 MET = 35 mlmiddotkg-1
middotmin-1
and then coded into one of four absolute intensity
categories sedentary (lt15 METS) light (15-399 METS) moderate (400-699 METS) or
vigorous (7+ METS) activity The impetus for using 4 and 7 rather than 3 and 6 MET
thresholds to mark moderate and vigorous intensity physical activity follows the rationale
described in a review by Shephard (23) Citing work by Porcari et al (19) Shephard noted that
10
10
those deriving health benefits from lifestyle activities tended to be sedentary obese and elderly
people those for whom a given absolute intensity of effort such as brisk walking develops a
substantial relative intensity of effort Simply put because the present sample were
sedentaryunfit their physical activity energy expenditure for a given absolute intensity effort
such as a brisk walk is likely to be higher than for fitter individuals Therefore developing cut
points on an unfit sample using 3 and 6 MET thresholds would result in an increased chance of
erroneously categorizing fitter individuals as active rather than inactive As this was the case in
the present study the higher absolute intensity cut points of 4 and 7 METS were chosen
Paragraph Number 14 Next the accelerometer data were recoded to create binary
indicator variables (0 or 1) to facilitate the Receiver Operator Characteristic (ROC) curve
analyses For sedentary this corresponded to sedentary activities versus more than sedentary
activities For moderate intensity this corresponded to less than moderate activities versus
moderate to vigorous activities For vigorous intensity this corresponded to vigorous activities
versus less than vigorous activities Next the binary coded accelerometer data were exported to
GraphPad Prism 400 for Windows (GraphPad Software San Diego USA) to undergo the ROC
curve analyses
Paragraph Number 15 A ROC curve is a graphical technique for describing and
comparing the accuracy of diagnostic tests In the present application ROC analysis is used to
examine the potential of using thresholds within the GENEA Actigraph and RT3 data to
discriminate between four activity intensity categories As Jago et al (10) described ROC
analysis is a means to evaluate and visualize the sensitivity [true positives(true positives + false
negatives)] and specificity [true negatives(true negatives + false positives)] of tests The ROC
curve is simply a plot of the sensitivity of a test on the y-axis versus its 1-specificity (ie false
11
11
positive fraction on the x-axis) Each possible threshold value corresponds to a point on the ROC
curve The upper-left corner [the point (0 1)] represents perfect classification and the diagonal
line represents the strategy of randomly guessing Sensitivity is maximized by correctly
identifying at or above the threshold for intensity whereas specificity is maximized by correctly
excluding activities below the threshold for intensity Similar to the methods of Evenson et al
(6) the cut points at which sensitivity and specificity were both maximized were identified
RESULTS
Technical Reliability and Validity
Paragraph Number 16 All 47 GENEA accelerometers successfully initialized collected and
downloaded data The mean SMVgs (g ∙ seconds) for the GENEA accelerometers displayed a
linear trajectory across all 15 testing conditions when organized from low to high acceleration
values (Figure 1 main) The average intra- and inter-instrument reliability of the 47 GENEA
accelerometers across the 15 conditions was CVintra=18 and CVinter=24 respectively The
criterion validity for the GENEA versus the MAST acceleration for all 15 test conditions was
excellent (r=097 plt0001)
Value Calibration
Paragraph Number 17 Descriptive characteristics of the participants are shown in Table 2 The
BMI data are a testament to the fact that this is a convenience sample as the participants are
leaner than the general population In fact the prevalence of obesity among the group was 4
for men and 5 for women much lower than the 23 and 25 found in the general population
(21) However the number of left handed participants in this study (12) matched well the 11
prevalence of left handedness in the UK population (14)
12
12
Paragraph Number 18 Table 3 compares the average METS and the position-specific
GENEA results As expected the activities in the posture grouping were the lowest intensity
while the optional running activities were the highest which was reflected in the VO2 and the
accelerometer output The fact that the slow treadmill walking an activity intended to be light
intensity resulted in an average 388 METS response helps to justify the decision to utilize the
higher absolute intensity cut points of 4 and 7 METS to distinguish moderate and vigorous
intensity activity in this sample Comparing the different wear positions of the GENEA showed
that data for the left and right wrists were similar while the mean GENEA data collected at the
waist were lower as were the standard deviations Comparative data from the waist-worn
Actigraph and RT3 are also displayed in Table 3
Paragraph Number 19 Using relative VO2 as the criterion the GENEA demonstrated
excellent criterion validity across all activities (left r = 086 right r = 083 waist r = 087)
performing as well at the waist as the Actigraph GT1M (r = 086) and RT3 (r = 088) The
GENEA also demonstrated excellent concurrent validity compared to the Actigraph GT1M (r =
092) and the RT3 (097) accelerometers Device-specific scatter plots in Figure 2 provide a
graphical comparison of criterion validity (ie METS versus each accelerometer‟s output) across
the varying activity conditions
Paragraph Number 20 Table 4 outlines the results of the ROC curve analysis for the
GENEA Across all three wear positions discrimination of sedentary behavior was almost
perfect with the area under the ROC curve ranging from 097-098 On account of reduced
specificity the discrimination of moderate activity was slightly less precise ranging from 084-
093 Meanwhile it was the reduced sensitivity of vigorous intensity cut points that
compromised the discrimination of vigorous activity which ranged from 089-092 Overall the
13
13
waist-worn GENEA had the greatest classification accuracy (095) followed by the left (093)
then right wrist (090) Interestingly the GENEA on the right wrist was unable to discriminate
between light and moderate intensity categories The overall ability to discriminate between
sedentary light moderate and vigorous intensity physical activity of the waist-worn GENEA
was virtually identical to that of the Actigraph GT1M (094) and the RT3 (095) (data not
shown)
DISCUSSION
Technical Reliability and Validity
Paragraph Number 21 Researchers have used various mechanical apparatuses to oscillate
accelerometers in various axes in an effort to assess reliability These apparatuses allow the
researcher to control the magnitude of the acceleration being imparted as well as the frequency
of the oscillation two key variables that contribute to the accelerometer‟s output Mechanical
setups by virtue of the precise control of the experimental conditions are able to determine the
variability attributed solely to the accelerometer Examples include turntables (15) rotating
wheel setups (2 16) vibration tables (20) and various types of mechanical shakers (5 12 22
24 26) This type of testing is important because if the measurement error intrinsic to the
accelerometer is found to be small then focus can shift to other sources of variation (eg
position worn on the body variation over time (eg day-to-day week-to-week season-to-
season) (15)
Paragraph Number 22 This is the first study to evaluate the technical reliability and
validity of the newly introduced GENEA accelerometer Utilizing 15 testing conditions across a
range of accelerations and frequencies the GENEA was found to be highly reliable with mean
intra- and inter-instrument coefficients of variation of 18 and 24 respectively Likewise the
14
14
GENEA was found to have excellent criterion validity when compared to the MAST acceleration
(r=097) Two thirds of the above-mentioned technical reliability studies focus on Actigraph
model accelerometers and as such it is a logical comparator for the GENEA Out of six studies
the current GENEA results demonstrate the highest technical reliability with the next best
performer coming in a recent study on the Actigraph GT1M (CVintra=29 and CVinter=35)
(24) In terms of criterion validity with the MAST the only relevant comparison comes from a
study on the Actigraph 7164 (2) where the validity coefficient was identical to the present study
Value Calibration
Paragraph Number 23 This is the first study to develop accelerometer cut points for both wrist
and waist-worn GENEA accelerometers that reflect sedentary light moderate and vigorous
intensity physical activity in adults The delineation of intensity of physical activity from
accelerometer data aids in the understanding of the relationship between health-related physical
activity and potential predictor variables such as adiposity age health status and ethnicity (10)
The process used to convert raw accelerometer data into more meaningful and interpretable units
is generally referred to as ldquovalue calibrationrdquo (30) Although raw accelerometer data provides an
indicator of overall movement a fundamental research challenge has been to determine how to
equate it to more meaningful indicators such as energy expenditure or time spent at given
activity intensity Being able to identify the amount of time spent in a range of intensity
categories is useful given the fact that numerous international physical activity guidelines
recommend various amounts of time be spent in specific intensity categories (27)
Paragraph Number 24 In the present study the GENEA demonstrated high levels of
criterion validity (with an average correlation with METS across wear positions of r = 085)
across 10-12 static and dynamic physical activities In fact the criterion validity of the GENEA
15
15
was virtually identical to that of the Actigraph and RT3 Similarly high levels of criterion
validity were shown by Bouten et al (1) during the development of their novel triaxial
accelerometer The GENEA also demonstrated high levels of concurrent validity compared to
the Actigraph GT1M and the RT3 with the highest correlations between the triaxial devices
These data illustrate that the GENEA is comparable to peer accelerometers a result that is
confirmed in the graphical representation of the data in Figure 2 However a closer look
suggests that the GENEA data are less variable than the RT3 and Actigraph across the intensity
spectrum Although speculative the tighter clustering of data within activities may provide
greater success for the GENEA when pursuing alternative analytical approaches For example
the tighter clustering of data within activities in the GENEA should allow for more optimal
activity classification (ie the determination of the mode of physical activity)
Paragraph Number 25 The GENEA SVMgs (g ∙ minutes) cut points established in this
study demonstrated excellent accuracy for classifying physical activity intensity across the
intensity spectrum Because this is the first article to report cut points for the GENEA it is not
possible to compare these values with other studies Although the accuracy of the GENEA was
greatest at the waist it also performed well at the wrist with the left wrist being more accurate
than the right The diminished accuracy experienced on the right wrist was likely due to
differences in participant handedness that is extraneous movements recorded during the activity
conditions were more likely to occur on the right wrist (eg scratching adjusting
clothingglasses hand gestures) However given small number of left handed participants (n=5)
testing of the hypothesis was untenable However it may be that activity signatures obtained
from the right wrist (dominant for over 80 of the population) may prove more useful than the
left (non-dominant) wrist Future research should specifically address this issue so that users
16
16
especially left handed users may know if wearing the GENEA on the right hand is possible The
small size of the GENEA and the fact that it can be positioned at the wrist a location intuitively
less obtrusive than the waist may help rectify issues related to participant compliance in future
studies and may allow for studies with extended physical activity monitoring periods (28)
Paragraph Number 26 Strengths and Limitations Several strengths are noteworthy in the
present study The first strength was the use of a mechanical shaker to perform a preliminary
technical reliability and validity assessment on the GENEA The use of this well controlled
experimental setup allowed for a robust assessment of this new technology Next the GENEA
output was collected analyzed and presented in a non-proprietary SI unit and as such can be
compared with other devices that retainemploy classical physics based measurements Next
ROC curve analysis was chosen to determine the physical activity intensity cut points which is
known to be superior to previous accelerometer calibration methods that employed linear
regression approaches (see Jago et al (10) for a more thorough discussion on this topic) To
date only four studies have employed ROC curve analysis to generate cut points and these were
done on children (3 6 10 31) A further strength of the ROC curve analyses was that the cut
points were chosen to optimize the balance between sensitivity and specificity (ie point nearest
01 on the ROC curve) which in all analyses also coincided with the Youden index ensuring the
optimality of the cut points The intuitive interpretation of the Youden index is that it is the point
on the curve farthest from chance (18) Finally the comparison to two widely used peer
technologies also strengthens the study as does the fact that energy expenditure (mlmiddotkg-1
middotmin-1
)
rather than direct observation was used to provide a continuous objective and physiologically
meaningful dependent variable with which to compare the GENEA data (25)
17
17
Paragraph Number 27 Several limitations of this study should be acknowledged First
the preliminary technical reliability and validity assessment was only performed on one axis the
vertical leaving the performance of the other two axes uncharacterized Next the comparison of
the GENEA would have been more appropriate with the triaxial Actigraph GT3X rather than the
GT1M accelerometer however at the time of this study the newer Actigraphs were not part of
our accelerometer inventory Next although our sample includes men and women of differing
ages and body size our population may not be representative Larger and more variable samples
(eg more left handed more overweight and obese participants) are needed to determine if these
factors might modify our findings In addition the activity conditions selected in this study may
not represent the full complement of activities undertaken by a population therefore caution
must be used when generalizing these results to other groups Finally cross-validation of the
GENEA physical activity intensity cut points by other research groups in different adult
populations is warranted
CONCLUSION
Paragraph Number 28 The GENEA demonstrated excellent technical reliability and validity and
excellent criterion validity compared to VO2 The GENEA cut points established in this study
can be used to estimate the time spent in sedentary light moderate and vigorous intensity
physical activity in adults As a result the GENEA has established itself as an objective and
feasible measurement tool comparable to other peer accelerometers such as the Actigraph
GT1M and RT3 with the potential of offering advanced measurement features in the future
Additional work is warranted to further refine the adult cut points and to develop cut points for
other age groups in an effort to calibrate the GENEA across the lifespan Given that the high
resolution sampling of the GENEA allows for advanced data mining (eg extraction of
18
18
frequency domain features) future research should strive to classifyrecognize activities of daily
living
Acknowledgments
This research was supported by a grant from Unilever Discover Colworth Bedford UK The
authors would like to thank the participants the graduate research assistants and the
administrative staff of the School of Sport and Health Sciences for their dedication to this
research project
Conflict of Interest
The results of the present study do not constitute endorsement by the authors or ACSM of
the products described in this paper This research was funded by an unrestricted research grant
awarded by Unilever Discover to the School of Sport and Health Sciences University of Exeter
The grant funded the salary of DE and small portions of the salaries of AR and RE At the time
of this research TH and MC were both employed by Unilever Discover However at the time of
manuscript submission MC and DE have no further relationship with Unilever Discover or any
of its operating companies None of the authors have a conflict of interest with Oralinsights the
manufacturer of the technology on which this manuscript is based
19
19
References
1 Bouten CV Koekkoek KT Verduin M Kodde R Janssen JD A triaxial accelerometer and
portable data processing unit for the assessment of daily physical activity IEEE Trans
Biomed Eng 199744(3)136-47
2 Brage S Brage N Wedderkopp N Froberg K Reliability and validity of the Computer
Science and Applications accelerometer in a mechanical setting Measurement in Physical
Education and Exercise Science 20037(2)101-19
3 Chu EY McManus AM Yu CC Calibration of the RT3 accelerometer for ambulation and
nonambulation in children Med Sci Sports Exerc 200739(11)2085-91
4 Esliger DW and Tremblay MS Physical activity and inactivity profiling the next generation
Can J Public Health 200798 Suppl 2S195-S207
5 Esliger DW and Tremblay MS Technical reliability assessment of three accelerometer
models in a mechanical setup Med Sci Sports Exerc 200638(12)2173-81
6 Evenson KR Catellier DJ Gill K Ondrak KS McMurray RG Calibration of two objective
measures of physical activity for children J Sports Sci 20081-9
7 Fruin ML and Rankin JW Validity of a multi-sensor armband in estimating rest and exercise
energy expenditure Med Sci Sports Exerc 200436(6)1063-9
8 Gizatullin AO and Edge KA Adaptive control for a multi-axis hydraulic test rig
Proceedings of the Institution of Mechanical Engineers Part I Journal of Systems and
Control Engineering 2007221(2)183-98
9 Grant PM Ryan CG Tigbe WW Granat MH The validation of a novel activity monitor in
the measurement of posture and motion during everyday activities Br J Sports Med
200640(12)992-7
10 Jago R Zakeri I Baranowski T Watson K Decision boundaries and receiver operating
characteristic curves new methods for determining accelerometer cutpoints J Sports Sci
200725(8)937-44
20
20
11 Karantonis DM Narayanan MR Mathie M Lovell NH Celler BG Implementation of a
real-time human movement classifier using a triaxial accelerometer for ambulatory
monitoring IEEE Trans Inf Technol Biomed 200610(1)156-67
12 Krasnoff JB Kohn MA Choy FK Doyle J Johansen K Painter PL Interunit and
intraunit reliability of the RT3 triaxial accelerometer J Phys Act Health 20085(4)527-38
13 McLaughlin JE King GA Howley ET Bassett DR Jr Ainsworth BE Validation of the
COSMED K4 b2 portable metabolic system Int J Sports Med 200122(4)280-4
14 McManus IC and Hartigan A Declining left-handedness in Victorian England seen in the
films of Mitchell and Kenyon Curr Biol 200717(18)R793-R794
15 Metcalf BS Curnow JS Evans C Voss LD Wilkin TJ Technical reliability of the CSA
activity monitor The EarlyBird Study Med Sci Sports Exerc 200234(9)1533-7
16 Moeller NC Korsholm L Kristensen PL Andersen LB Wedderkopp N Froberg K
Unit-specific calibration of Actigraph accelerometers in a mechanical setup - is it worth the
effort The effect on random output variation caused by technical inter-instrument variability
in the laboratory and in the field BMC Med Res Methodol 2008819
17 Montoye HJ Kemper HCG Saris WHM Washburn RA Measuring Physical Activity
and Energy Expenditure Champaign IL Human Kinetics 1996
18 Perkins NJ and Schisterman EF The inconsistency of optimal cutpoints obtained using
two criteria based on the receiver operating characteristic curve Am J Epidemiol
2006163(7)670-5
19 Porcari J McCarron R Kline G Freedson PS Ward A Ross JA Rippe JM Is fast
walking an adequate aerobic training stimulus for 30- to 69-year-old men and women
Physician Sportsmed 198715(2)119-29
20 Powell SM Jones DI Rowlands AV Technical variability of the RT3 accelerometer
Med Sci Sports Exerc 200335(10)1773-8
21 Rennie KL and Jebb SA Prevalence of obesity in Great Britain Obes Rev 20056(1)11-
2
21
21
22 Rothney MP Apker GA Song Y Chen KY Comparing the performance of three
generations of ActiGraph accelerometers J Appl Physiol 2008105(4)1091-7
23 Shephard RJ Absolute versus relative intensity of physical activity in a dose-response
context Med Sci Sports Exerc 200133(6 Suppl)S400-S418
24 Silva P Esliger DW Welk GJ Mota J Technical reliability assessment of the Actigraph
GT1M accelerometer Measurement in Physical Education and Exercise Science
20101479-91
25 Sirard JR Trost SG Pfeiffer KA Dowda M Pate RR Calibration and evaluation of an
objective measure of physical activity in preschool children Journal of Physical Activity and
Health 20053345-57
26 Van Hees V Slootmaker SM De GG Van MW Van Lummel RC Reproducibility of a
triaxial seismic accelerometer (DynaPort) Med Sci Sports Exerc 200941(4)810-7
27 Warburton DE Katzmarzyk PT Rhodes RE Shephard RJ Evidence-informed physical
activity guidelines for Canadian adults Can J Public Health 200798 Suppl 2S16-S68
28 Ware LJ Hurling R Bataveljic O Fairley BW Hurst TL Murray P Rennie KL
Tomkins CE Finn A Cobain MR Pearson DA Foreyt JP Rates and determinants of uptake
and use of an internet physical activity and weight management program in office and
manufacturing work sites in England cohort study J Med Internet Res 200810(4)e56
29 Welk G Physical Activity Assessments for Health-Related Research Champaign IL Human Kinetics 2002
30 Welk GJ Principles of design and analyses for the calibration of accelerometry-based
activity monitors Med Sci Sports Exerc 200537(11 Suppl)S501-S511
31 Welk GJ Eisenmann JC Schaben J Trost SG Dale D Calibration of the biotrainer pro
activity monitor in children Pediatr Exerc Sci 200719(2)145-58
32 Zhang K Werner P Sun M Pi-Sunyer FX Boozer CN Measurement of human daily
physical activity Obes Res 200311(1)33-40
22
22
Figure Captions
Figure 1 Inset right Overhead view of GENEA accelerometers positioned in the test jig Inset
left Multi-Axis Shaker Table (MAST) complete with the test jig secured in place Main Figure
Comparison of a typical output trace from one GENEA accelerometer across the 15 test
conditions
Notes i) the trace represents the middle 50 seconds of each of the 15 conditions
Figure 2 Relationship between physical activity intensity (METS) versus the outputs from the
waist worn GENEA SVMgs (g middot minutes) RT3 (countsminute) and Actigraph (countsmin)
accelerometers across the 16 activity conditions
Table 1 Reliability results for the GENEA for all 15 test conditions
Acceleration Frequency Amplitude GENEA SVMgs
(g ∙ seconds)
CV intra
CV inter
g (mmiddots-2
) (Hz) (m) Mean SD GENEA GENEA
005 049 10 00124 3 01 39 53
022 216 10 00547 11 02 17 20
046 451 30 00127 23 02 08 14
046 451 25 00183 24 02 09 14
048 471 20 00298 25 03 10 14
049 481 15 00541 25 03 11 16
079 775 50 00079 41 04 10 15
091 893 30 00251 46 04 08 13
125 1226 45 00153 57 08 15 21
129 1265 40 00200 58 08 13 20
131 1285 35 00266 59 12 21 26
138 1354 30 00381 60 06 10 18
168 1648 45 00206 64 22 34 37
184 1805 30 00508 66 09 13 22
252 2472 45 00309 84 43 51 53
Average variability across all 15 test conditions 18 24
Table 1
Table 2 Descriptive characteristics of the study participants
Gender Sample
Size Age
Left
Handed
Right
Handed
Height
(cm)
Weight
(kg)
BMI
(kg∙m-2
)
Body Fat
()
Male 23 489 (68) 1 22 1762 (62) 806 (116) 259 (27) 207 (34)
Female 37 496 (64) 4 33 1628 (54) 629 (84) 238 (35) 328 (66)
Overall 60 494 (65) 5 55 1679 (87) 697 (130) 246 (34) 282 (81)
for the measurement of body fat there were 2 less participants (1 male and 1 female)
Table 2
Table 3 Average intensity (METS) and average left right and waist positioned GENEA output by activity
GENEA
(SVMgs (g middot minutes)
Actigraph (CountsMinute)
RT3 (VM CountsMinute)
Activity Grouping
N METS Left Wrist Right Wrist Waist Waist Waist
Mean SD Mean SD Mean SD Mean SD Mean SD Mean SD
Lateral Recumbent (lying on side) Posture
(all)
53 094 023 63 55 143 53 34 17 0 0 4 11
Seated Computer Work 55 122 029 185 86 242 67 48 33 1 3 9 21
Standing 55 113 025 100 66 103 177 48 15 0 0 3 9
Window Washing Lifestyle
(2 of 4)dagger
31 337 106 469 693 1808 708 185 61 138 177 463 344
Washing Dishes 24 235 045 634 177 768 239 132 164 51 80 160 74
Shelf Stacking 30 419 098 884 224 940 202 214 72 2620 1933 421 297
Sweeping 23 339 067 878 264 976 289 187 48 465 355 356 96
Slow Treadmill Walk (4 km∙hr-1
) Ambulatory
(all)
54 388 069 864 195 847 232 856 221 2323 643 1267 318
Medium Treadmill Walk (5 km∙hr-1
) 55 459 079 1177 299 1204 357 1264 214 3745 656 1659 331
Brisk Treadmill Walk (6 km∙hr-1
) 55 588 098 1506 400 1513 350 1815 272 4917 940 2228 450
Stair AscentDescent (80 steps∙min-1
) Stairs (all) 55 619 110 836 620 794 597 697 127 2427 780 811 208
Slow Treadmill Run (8 km∙hr-1
) Ambulatory
(1 of 3)Dagger
18 1113 138 3858 588 4087 798 3553 593 8936 1794 4578 799
Medium Treadmill Run (10 km∙hr-1
) 14 1200 124 5345 1073 4915 787 4043 325 8904 1826 5419 423
Fast Treadmill Run (12 km∙hr-1
) 5 1361 060 5096 2339 5358 2460 4066 299 6982 3233 6093 674
Brisk Free-living Walk (6 km∙hr-1
) Ambulatory
(all) 40 576 094 1433 171 1474 216 1769 227 4912 748 2434 559
Medium Free-living Run (10 km∙hr-1
) Ambulatory
(optional) 5 1262 117 5151 1113 4844 1232 3756 631 8825 1592 5525 787
listwise sample size dagger indicates that participants were randomly allocated 2 out of the 4 activities in this grouping
Dagger indicates that participants had the option to run (select 1 out of the 3 activities in this grouping) if they so chose
Note 1 MET = 35 ml∙kg∙min-1
Table 3
Table 4 Sensitivity specificity area under the ROC curve and GENEA SVMgs (g middot minutes)
cut points that maximized sensitivity and specificity at three wear positions
Intensity Sensitivity Specificity Area under ROC
curve (95 CI)
GENEA Cut points
SVMgs (g middot minutes)
Left Wrist
Sedentary 97 95 098 (098-099) lt 217
Light NA NA NA 217-644
Moderate 95 72 091 (088-093) 645-1810
Vigorous 78 98 091 (086-095) gt 1810
Right Wrist
Sedentary 99 96 098 (097-099) lt 386
Light NA NA NA 386-439
Moderate 100 56 084 (0-81-087) 440-2098
Vigorous 78 97 089 (084-094) gt 2098
Waist
Sedentary 99 96 097 (096-098) lt 77
Light NA NA NA 77-219
Moderate 96 80 093 (091-095) 220-2056
Vigorous 73 99 092 (088-096) gt 2056
Sedentary (lt15 METS) light (15-399 METS) moderate (400-699 METS) vigorous (7+
METS)
NA = not applicable as the sedentary and moderate cut points provide the boundaries for the light
intensity category
Table 4
0
10
20
30
40
50
60
70
80
90
100
GE
NE
A
SV
Mg
s (g
s
eco
nd
s)
Condition1 2 3 4 5 6 7 8 9 10 11 12 13 14 15
Figure 1
GENEA SVMgs (g minutes)
Figure 2
10
10
those deriving health benefits from lifestyle activities tended to be sedentary obese and elderly
people those for whom a given absolute intensity of effort such as brisk walking develops a
substantial relative intensity of effort Simply put because the present sample were
sedentaryunfit their physical activity energy expenditure for a given absolute intensity effort
such as a brisk walk is likely to be higher than for fitter individuals Therefore developing cut
points on an unfit sample using 3 and 6 MET thresholds would result in an increased chance of
erroneously categorizing fitter individuals as active rather than inactive As this was the case in
the present study the higher absolute intensity cut points of 4 and 7 METS were chosen
Paragraph Number 14 Next the accelerometer data were recoded to create binary
indicator variables (0 or 1) to facilitate the Receiver Operator Characteristic (ROC) curve
analyses For sedentary this corresponded to sedentary activities versus more than sedentary
activities For moderate intensity this corresponded to less than moderate activities versus
moderate to vigorous activities For vigorous intensity this corresponded to vigorous activities
versus less than vigorous activities Next the binary coded accelerometer data were exported to
GraphPad Prism 400 for Windows (GraphPad Software San Diego USA) to undergo the ROC
curve analyses
Paragraph Number 15 A ROC curve is a graphical technique for describing and
comparing the accuracy of diagnostic tests In the present application ROC analysis is used to
examine the potential of using thresholds within the GENEA Actigraph and RT3 data to
discriminate between four activity intensity categories As Jago et al (10) described ROC
analysis is a means to evaluate and visualize the sensitivity [true positives(true positives + false
negatives)] and specificity [true negatives(true negatives + false positives)] of tests The ROC
curve is simply a plot of the sensitivity of a test on the y-axis versus its 1-specificity (ie false
11
11
positive fraction on the x-axis) Each possible threshold value corresponds to a point on the ROC
curve The upper-left corner [the point (0 1)] represents perfect classification and the diagonal
line represents the strategy of randomly guessing Sensitivity is maximized by correctly
identifying at or above the threshold for intensity whereas specificity is maximized by correctly
excluding activities below the threshold for intensity Similar to the methods of Evenson et al
(6) the cut points at which sensitivity and specificity were both maximized were identified
RESULTS
Technical Reliability and Validity
Paragraph Number 16 All 47 GENEA accelerometers successfully initialized collected and
downloaded data The mean SMVgs (g ∙ seconds) for the GENEA accelerometers displayed a
linear trajectory across all 15 testing conditions when organized from low to high acceleration
values (Figure 1 main) The average intra- and inter-instrument reliability of the 47 GENEA
accelerometers across the 15 conditions was CVintra=18 and CVinter=24 respectively The
criterion validity for the GENEA versus the MAST acceleration for all 15 test conditions was
excellent (r=097 plt0001)
Value Calibration
Paragraph Number 17 Descriptive characteristics of the participants are shown in Table 2 The
BMI data are a testament to the fact that this is a convenience sample as the participants are
leaner than the general population In fact the prevalence of obesity among the group was 4
for men and 5 for women much lower than the 23 and 25 found in the general population
(21) However the number of left handed participants in this study (12) matched well the 11
prevalence of left handedness in the UK population (14)
12
12
Paragraph Number 18 Table 3 compares the average METS and the position-specific
GENEA results As expected the activities in the posture grouping were the lowest intensity
while the optional running activities were the highest which was reflected in the VO2 and the
accelerometer output The fact that the slow treadmill walking an activity intended to be light
intensity resulted in an average 388 METS response helps to justify the decision to utilize the
higher absolute intensity cut points of 4 and 7 METS to distinguish moderate and vigorous
intensity activity in this sample Comparing the different wear positions of the GENEA showed
that data for the left and right wrists were similar while the mean GENEA data collected at the
waist were lower as were the standard deviations Comparative data from the waist-worn
Actigraph and RT3 are also displayed in Table 3
Paragraph Number 19 Using relative VO2 as the criterion the GENEA demonstrated
excellent criterion validity across all activities (left r = 086 right r = 083 waist r = 087)
performing as well at the waist as the Actigraph GT1M (r = 086) and RT3 (r = 088) The
GENEA also demonstrated excellent concurrent validity compared to the Actigraph GT1M (r =
092) and the RT3 (097) accelerometers Device-specific scatter plots in Figure 2 provide a
graphical comparison of criterion validity (ie METS versus each accelerometer‟s output) across
the varying activity conditions
Paragraph Number 20 Table 4 outlines the results of the ROC curve analysis for the
GENEA Across all three wear positions discrimination of sedentary behavior was almost
perfect with the area under the ROC curve ranging from 097-098 On account of reduced
specificity the discrimination of moderate activity was slightly less precise ranging from 084-
093 Meanwhile it was the reduced sensitivity of vigorous intensity cut points that
compromised the discrimination of vigorous activity which ranged from 089-092 Overall the
13
13
waist-worn GENEA had the greatest classification accuracy (095) followed by the left (093)
then right wrist (090) Interestingly the GENEA on the right wrist was unable to discriminate
between light and moderate intensity categories The overall ability to discriminate between
sedentary light moderate and vigorous intensity physical activity of the waist-worn GENEA
was virtually identical to that of the Actigraph GT1M (094) and the RT3 (095) (data not
shown)
DISCUSSION
Technical Reliability and Validity
Paragraph Number 21 Researchers have used various mechanical apparatuses to oscillate
accelerometers in various axes in an effort to assess reliability These apparatuses allow the
researcher to control the magnitude of the acceleration being imparted as well as the frequency
of the oscillation two key variables that contribute to the accelerometer‟s output Mechanical
setups by virtue of the precise control of the experimental conditions are able to determine the
variability attributed solely to the accelerometer Examples include turntables (15) rotating
wheel setups (2 16) vibration tables (20) and various types of mechanical shakers (5 12 22
24 26) This type of testing is important because if the measurement error intrinsic to the
accelerometer is found to be small then focus can shift to other sources of variation (eg
position worn on the body variation over time (eg day-to-day week-to-week season-to-
season) (15)
Paragraph Number 22 This is the first study to evaluate the technical reliability and
validity of the newly introduced GENEA accelerometer Utilizing 15 testing conditions across a
range of accelerations and frequencies the GENEA was found to be highly reliable with mean
intra- and inter-instrument coefficients of variation of 18 and 24 respectively Likewise the
14
14
GENEA was found to have excellent criterion validity when compared to the MAST acceleration
(r=097) Two thirds of the above-mentioned technical reliability studies focus on Actigraph
model accelerometers and as such it is a logical comparator for the GENEA Out of six studies
the current GENEA results demonstrate the highest technical reliability with the next best
performer coming in a recent study on the Actigraph GT1M (CVintra=29 and CVinter=35)
(24) In terms of criterion validity with the MAST the only relevant comparison comes from a
study on the Actigraph 7164 (2) where the validity coefficient was identical to the present study
Value Calibration
Paragraph Number 23 This is the first study to develop accelerometer cut points for both wrist
and waist-worn GENEA accelerometers that reflect sedentary light moderate and vigorous
intensity physical activity in adults The delineation of intensity of physical activity from
accelerometer data aids in the understanding of the relationship between health-related physical
activity and potential predictor variables such as adiposity age health status and ethnicity (10)
The process used to convert raw accelerometer data into more meaningful and interpretable units
is generally referred to as ldquovalue calibrationrdquo (30) Although raw accelerometer data provides an
indicator of overall movement a fundamental research challenge has been to determine how to
equate it to more meaningful indicators such as energy expenditure or time spent at given
activity intensity Being able to identify the amount of time spent in a range of intensity
categories is useful given the fact that numerous international physical activity guidelines
recommend various amounts of time be spent in specific intensity categories (27)
Paragraph Number 24 In the present study the GENEA demonstrated high levels of
criterion validity (with an average correlation with METS across wear positions of r = 085)
across 10-12 static and dynamic physical activities In fact the criterion validity of the GENEA
15
15
was virtually identical to that of the Actigraph and RT3 Similarly high levels of criterion
validity were shown by Bouten et al (1) during the development of their novel triaxial
accelerometer The GENEA also demonstrated high levels of concurrent validity compared to
the Actigraph GT1M and the RT3 with the highest correlations between the triaxial devices
These data illustrate that the GENEA is comparable to peer accelerometers a result that is
confirmed in the graphical representation of the data in Figure 2 However a closer look
suggests that the GENEA data are less variable than the RT3 and Actigraph across the intensity
spectrum Although speculative the tighter clustering of data within activities may provide
greater success for the GENEA when pursuing alternative analytical approaches For example
the tighter clustering of data within activities in the GENEA should allow for more optimal
activity classification (ie the determination of the mode of physical activity)
Paragraph Number 25 The GENEA SVMgs (g ∙ minutes) cut points established in this
study demonstrated excellent accuracy for classifying physical activity intensity across the
intensity spectrum Because this is the first article to report cut points for the GENEA it is not
possible to compare these values with other studies Although the accuracy of the GENEA was
greatest at the waist it also performed well at the wrist with the left wrist being more accurate
than the right The diminished accuracy experienced on the right wrist was likely due to
differences in participant handedness that is extraneous movements recorded during the activity
conditions were more likely to occur on the right wrist (eg scratching adjusting
clothingglasses hand gestures) However given small number of left handed participants (n=5)
testing of the hypothesis was untenable However it may be that activity signatures obtained
from the right wrist (dominant for over 80 of the population) may prove more useful than the
left (non-dominant) wrist Future research should specifically address this issue so that users
16
16
especially left handed users may know if wearing the GENEA on the right hand is possible The
small size of the GENEA and the fact that it can be positioned at the wrist a location intuitively
less obtrusive than the waist may help rectify issues related to participant compliance in future
studies and may allow for studies with extended physical activity monitoring periods (28)
Paragraph Number 26 Strengths and Limitations Several strengths are noteworthy in the
present study The first strength was the use of a mechanical shaker to perform a preliminary
technical reliability and validity assessment on the GENEA The use of this well controlled
experimental setup allowed for a robust assessment of this new technology Next the GENEA
output was collected analyzed and presented in a non-proprietary SI unit and as such can be
compared with other devices that retainemploy classical physics based measurements Next
ROC curve analysis was chosen to determine the physical activity intensity cut points which is
known to be superior to previous accelerometer calibration methods that employed linear
regression approaches (see Jago et al (10) for a more thorough discussion on this topic) To
date only four studies have employed ROC curve analysis to generate cut points and these were
done on children (3 6 10 31) A further strength of the ROC curve analyses was that the cut
points were chosen to optimize the balance between sensitivity and specificity (ie point nearest
01 on the ROC curve) which in all analyses also coincided with the Youden index ensuring the
optimality of the cut points The intuitive interpretation of the Youden index is that it is the point
on the curve farthest from chance (18) Finally the comparison to two widely used peer
technologies also strengthens the study as does the fact that energy expenditure (mlmiddotkg-1
middotmin-1
)
rather than direct observation was used to provide a continuous objective and physiologically
meaningful dependent variable with which to compare the GENEA data (25)
17
17
Paragraph Number 27 Several limitations of this study should be acknowledged First
the preliminary technical reliability and validity assessment was only performed on one axis the
vertical leaving the performance of the other two axes uncharacterized Next the comparison of
the GENEA would have been more appropriate with the triaxial Actigraph GT3X rather than the
GT1M accelerometer however at the time of this study the newer Actigraphs were not part of
our accelerometer inventory Next although our sample includes men and women of differing
ages and body size our population may not be representative Larger and more variable samples
(eg more left handed more overweight and obese participants) are needed to determine if these
factors might modify our findings In addition the activity conditions selected in this study may
not represent the full complement of activities undertaken by a population therefore caution
must be used when generalizing these results to other groups Finally cross-validation of the
GENEA physical activity intensity cut points by other research groups in different adult
populations is warranted
CONCLUSION
Paragraph Number 28 The GENEA demonstrated excellent technical reliability and validity and
excellent criterion validity compared to VO2 The GENEA cut points established in this study
can be used to estimate the time spent in sedentary light moderate and vigorous intensity
physical activity in adults As a result the GENEA has established itself as an objective and
feasible measurement tool comparable to other peer accelerometers such as the Actigraph
GT1M and RT3 with the potential of offering advanced measurement features in the future
Additional work is warranted to further refine the adult cut points and to develop cut points for
other age groups in an effort to calibrate the GENEA across the lifespan Given that the high
resolution sampling of the GENEA allows for advanced data mining (eg extraction of
18
18
frequency domain features) future research should strive to classifyrecognize activities of daily
living
Acknowledgments
This research was supported by a grant from Unilever Discover Colworth Bedford UK The
authors would like to thank the participants the graduate research assistants and the
administrative staff of the School of Sport and Health Sciences for their dedication to this
research project
Conflict of Interest
The results of the present study do not constitute endorsement by the authors or ACSM of
the products described in this paper This research was funded by an unrestricted research grant
awarded by Unilever Discover to the School of Sport and Health Sciences University of Exeter
The grant funded the salary of DE and small portions of the salaries of AR and RE At the time
of this research TH and MC were both employed by Unilever Discover However at the time of
manuscript submission MC and DE have no further relationship with Unilever Discover or any
of its operating companies None of the authors have a conflict of interest with Oralinsights the
manufacturer of the technology on which this manuscript is based
19
19
References
1 Bouten CV Koekkoek KT Verduin M Kodde R Janssen JD A triaxial accelerometer and
portable data processing unit for the assessment of daily physical activity IEEE Trans
Biomed Eng 199744(3)136-47
2 Brage S Brage N Wedderkopp N Froberg K Reliability and validity of the Computer
Science and Applications accelerometer in a mechanical setting Measurement in Physical
Education and Exercise Science 20037(2)101-19
3 Chu EY McManus AM Yu CC Calibration of the RT3 accelerometer for ambulation and
nonambulation in children Med Sci Sports Exerc 200739(11)2085-91
4 Esliger DW and Tremblay MS Physical activity and inactivity profiling the next generation
Can J Public Health 200798 Suppl 2S195-S207
5 Esliger DW and Tremblay MS Technical reliability assessment of three accelerometer
models in a mechanical setup Med Sci Sports Exerc 200638(12)2173-81
6 Evenson KR Catellier DJ Gill K Ondrak KS McMurray RG Calibration of two objective
measures of physical activity for children J Sports Sci 20081-9
7 Fruin ML and Rankin JW Validity of a multi-sensor armband in estimating rest and exercise
energy expenditure Med Sci Sports Exerc 200436(6)1063-9
8 Gizatullin AO and Edge KA Adaptive control for a multi-axis hydraulic test rig
Proceedings of the Institution of Mechanical Engineers Part I Journal of Systems and
Control Engineering 2007221(2)183-98
9 Grant PM Ryan CG Tigbe WW Granat MH The validation of a novel activity monitor in
the measurement of posture and motion during everyday activities Br J Sports Med
200640(12)992-7
10 Jago R Zakeri I Baranowski T Watson K Decision boundaries and receiver operating
characteristic curves new methods for determining accelerometer cutpoints J Sports Sci
200725(8)937-44
20
20
11 Karantonis DM Narayanan MR Mathie M Lovell NH Celler BG Implementation of a
real-time human movement classifier using a triaxial accelerometer for ambulatory
monitoring IEEE Trans Inf Technol Biomed 200610(1)156-67
12 Krasnoff JB Kohn MA Choy FK Doyle J Johansen K Painter PL Interunit and
intraunit reliability of the RT3 triaxial accelerometer J Phys Act Health 20085(4)527-38
13 McLaughlin JE King GA Howley ET Bassett DR Jr Ainsworth BE Validation of the
COSMED K4 b2 portable metabolic system Int J Sports Med 200122(4)280-4
14 McManus IC and Hartigan A Declining left-handedness in Victorian England seen in the
films of Mitchell and Kenyon Curr Biol 200717(18)R793-R794
15 Metcalf BS Curnow JS Evans C Voss LD Wilkin TJ Technical reliability of the CSA
activity monitor The EarlyBird Study Med Sci Sports Exerc 200234(9)1533-7
16 Moeller NC Korsholm L Kristensen PL Andersen LB Wedderkopp N Froberg K
Unit-specific calibration of Actigraph accelerometers in a mechanical setup - is it worth the
effort The effect on random output variation caused by technical inter-instrument variability
in the laboratory and in the field BMC Med Res Methodol 2008819
17 Montoye HJ Kemper HCG Saris WHM Washburn RA Measuring Physical Activity
and Energy Expenditure Champaign IL Human Kinetics 1996
18 Perkins NJ and Schisterman EF The inconsistency of optimal cutpoints obtained using
two criteria based on the receiver operating characteristic curve Am J Epidemiol
2006163(7)670-5
19 Porcari J McCarron R Kline G Freedson PS Ward A Ross JA Rippe JM Is fast
walking an adequate aerobic training stimulus for 30- to 69-year-old men and women
Physician Sportsmed 198715(2)119-29
20 Powell SM Jones DI Rowlands AV Technical variability of the RT3 accelerometer
Med Sci Sports Exerc 200335(10)1773-8
21 Rennie KL and Jebb SA Prevalence of obesity in Great Britain Obes Rev 20056(1)11-
2
21
21
22 Rothney MP Apker GA Song Y Chen KY Comparing the performance of three
generations of ActiGraph accelerometers J Appl Physiol 2008105(4)1091-7
23 Shephard RJ Absolute versus relative intensity of physical activity in a dose-response
context Med Sci Sports Exerc 200133(6 Suppl)S400-S418
24 Silva P Esliger DW Welk GJ Mota J Technical reliability assessment of the Actigraph
GT1M accelerometer Measurement in Physical Education and Exercise Science
20101479-91
25 Sirard JR Trost SG Pfeiffer KA Dowda M Pate RR Calibration and evaluation of an
objective measure of physical activity in preschool children Journal of Physical Activity and
Health 20053345-57
26 Van Hees V Slootmaker SM De GG Van MW Van Lummel RC Reproducibility of a
triaxial seismic accelerometer (DynaPort) Med Sci Sports Exerc 200941(4)810-7
27 Warburton DE Katzmarzyk PT Rhodes RE Shephard RJ Evidence-informed physical
activity guidelines for Canadian adults Can J Public Health 200798 Suppl 2S16-S68
28 Ware LJ Hurling R Bataveljic O Fairley BW Hurst TL Murray P Rennie KL
Tomkins CE Finn A Cobain MR Pearson DA Foreyt JP Rates and determinants of uptake
and use of an internet physical activity and weight management program in office and
manufacturing work sites in England cohort study J Med Internet Res 200810(4)e56
29 Welk G Physical Activity Assessments for Health-Related Research Champaign IL Human Kinetics 2002
30 Welk GJ Principles of design and analyses for the calibration of accelerometry-based
activity monitors Med Sci Sports Exerc 200537(11 Suppl)S501-S511
31 Welk GJ Eisenmann JC Schaben J Trost SG Dale D Calibration of the biotrainer pro
activity monitor in children Pediatr Exerc Sci 200719(2)145-58
32 Zhang K Werner P Sun M Pi-Sunyer FX Boozer CN Measurement of human daily
physical activity Obes Res 200311(1)33-40
22
22
Figure Captions
Figure 1 Inset right Overhead view of GENEA accelerometers positioned in the test jig Inset
left Multi-Axis Shaker Table (MAST) complete with the test jig secured in place Main Figure
Comparison of a typical output trace from one GENEA accelerometer across the 15 test
conditions
Notes i) the trace represents the middle 50 seconds of each of the 15 conditions
Figure 2 Relationship between physical activity intensity (METS) versus the outputs from the
waist worn GENEA SVMgs (g middot minutes) RT3 (countsminute) and Actigraph (countsmin)
accelerometers across the 16 activity conditions
Table 1 Reliability results for the GENEA for all 15 test conditions
Acceleration Frequency Amplitude GENEA SVMgs
(g ∙ seconds)
CV intra
CV inter
g (mmiddots-2
) (Hz) (m) Mean SD GENEA GENEA
005 049 10 00124 3 01 39 53
022 216 10 00547 11 02 17 20
046 451 30 00127 23 02 08 14
046 451 25 00183 24 02 09 14
048 471 20 00298 25 03 10 14
049 481 15 00541 25 03 11 16
079 775 50 00079 41 04 10 15
091 893 30 00251 46 04 08 13
125 1226 45 00153 57 08 15 21
129 1265 40 00200 58 08 13 20
131 1285 35 00266 59 12 21 26
138 1354 30 00381 60 06 10 18
168 1648 45 00206 64 22 34 37
184 1805 30 00508 66 09 13 22
252 2472 45 00309 84 43 51 53
Average variability across all 15 test conditions 18 24
Table 1
Table 2 Descriptive characteristics of the study participants
Gender Sample
Size Age
Left
Handed
Right
Handed
Height
(cm)
Weight
(kg)
BMI
(kg∙m-2
)
Body Fat
()
Male 23 489 (68) 1 22 1762 (62) 806 (116) 259 (27) 207 (34)
Female 37 496 (64) 4 33 1628 (54) 629 (84) 238 (35) 328 (66)
Overall 60 494 (65) 5 55 1679 (87) 697 (130) 246 (34) 282 (81)
for the measurement of body fat there were 2 less participants (1 male and 1 female)
Table 2
Table 3 Average intensity (METS) and average left right and waist positioned GENEA output by activity
GENEA
(SVMgs (g middot minutes)
Actigraph (CountsMinute)
RT3 (VM CountsMinute)
Activity Grouping
N METS Left Wrist Right Wrist Waist Waist Waist
Mean SD Mean SD Mean SD Mean SD Mean SD Mean SD
Lateral Recumbent (lying on side) Posture
(all)
53 094 023 63 55 143 53 34 17 0 0 4 11
Seated Computer Work 55 122 029 185 86 242 67 48 33 1 3 9 21
Standing 55 113 025 100 66 103 177 48 15 0 0 3 9
Window Washing Lifestyle
(2 of 4)dagger
31 337 106 469 693 1808 708 185 61 138 177 463 344
Washing Dishes 24 235 045 634 177 768 239 132 164 51 80 160 74
Shelf Stacking 30 419 098 884 224 940 202 214 72 2620 1933 421 297
Sweeping 23 339 067 878 264 976 289 187 48 465 355 356 96
Slow Treadmill Walk (4 km∙hr-1
) Ambulatory
(all)
54 388 069 864 195 847 232 856 221 2323 643 1267 318
Medium Treadmill Walk (5 km∙hr-1
) 55 459 079 1177 299 1204 357 1264 214 3745 656 1659 331
Brisk Treadmill Walk (6 km∙hr-1
) 55 588 098 1506 400 1513 350 1815 272 4917 940 2228 450
Stair AscentDescent (80 steps∙min-1
) Stairs (all) 55 619 110 836 620 794 597 697 127 2427 780 811 208
Slow Treadmill Run (8 km∙hr-1
) Ambulatory
(1 of 3)Dagger
18 1113 138 3858 588 4087 798 3553 593 8936 1794 4578 799
Medium Treadmill Run (10 km∙hr-1
) 14 1200 124 5345 1073 4915 787 4043 325 8904 1826 5419 423
Fast Treadmill Run (12 km∙hr-1
) 5 1361 060 5096 2339 5358 2460 4066 299 6982 3233 6093 674
Brisk Free-living Walk (6 km∙hr-1
) Ambulatory
(all) 40 576 094 1433 171 1474 216 1769 227 4912 748 2434 559
Medium Free-living Run (10 km∙hr-1
) Ambulatory
(optional) 5 1262 117 5151 1113 4844 1232 3756 631 8825 1592 5525 787
listwise sample size dagger indicates that participants were randomly allocated 2 out of the 4 activities in this grouping
Dagger indicates that participants had the option to run (select 1 out of the 3 activities in this grouping) if they so chose
Note 1 MET = 35 ml∙kg∙min-1
Table 3
Table 4 Sensitivity specificity area under the ROC curve and GENEA SVMgs (g middot minutes)
cut points that maximized sensitivity and specificity at three wear positions
Intensity Sensitivity Specificity Area under ROC
curve (95 CI)
GENEA Cut points
SVMgs (g middot minutes)
Left Wrist
Sedentary 97 95 098 (098-099) lt 217
Light NA NA NA 217-644
Moderate 95 72 091 (088-093) 645-1810
Vigorous 78 98 091 (086-095) gt 1810
Right Wrist
Sedentary 99 96 098 (097-099) lt 386
Light NA NA NA 386-439
Moderate 100 56 084 (0-81-087) 440-2098
Vigorous 78 97 089 (084-094) gt 2098
Waist
Sedentary 99 96 097 (096-098) lt 77
Light NA NA NA 77-219
Moderate 96 80 093 (091-095) 220-2056
Vigorous 73 99 092 (088-096) gt 2056
Sedentary (lt15 METS) light (15-399 METS) moderate (400-699 METS) vigorous (7+
METS)
NA = not applicable as the sedentary and moderate cut points provide the boundaries for the light
intensity category
Table 4
0
10
20
30
40
50
60
70
80
90
100
GE
NE
A
SV
Mg
s (g
s
eco
nd
s)
Condition1 2 3 4 5 6 7 8 9 10 11 12 13 14 15
Figure 1
GENEA SVMgs (g minutes)
Figure 2
11
11
positive fraction on the x-axis) Each possible threshold value corresponds to a point on the ROC
curve The upper-left corner [the point (0 1)] represents perfect classification and the diagonal
line represents the strategy of randomly guessing Sensitivity is maximized by correctly
identifying at or above the threshold for intensity whereas specificity is maximized by correctly
excluding activities below the threshold for intensity Similar to the methods of Evenson et al
(6) the cut points at which sensitivity and specificity were both maximized were identified
RESULTS
Technical Reliability and Validity
Paragraph Number 16 All 47 GENEA accelerometers successfully initialized collected and
downloaded data The mean SMVgs (g ∙ seconds) for the GENEA accelerometers displayed a
linear trajectory across all 15 testing conditions when organized from low to high acceleration
values (Figure 1 main) The average intra- and inter-instrument reliability of the 47 GENEA
accelerometers across the 15 conditions was CVintra=18 and CVinter=24 respectively The
criterion validity for the GENEA versus the MAST acceleration for all 15 test conditions was
excellent (r=097 plt0001)
Value Calibration
Paragraph Number 17 Descriptive characteristics of the participants are shown in Table 2 The
BMI data are a testament to the fact that this is a convenience sample as the participants are
leaner than the general population In fact the prevalence of obesity among the group was 4
for men and 5 for women much lower than the 23 and 25 found in the general population
(21) However the number of left handed participants in this study (12) matched well the 11
prevalence of left handedness in the UK population (14)
12
12
Paragraph Number 18 Table 3 compares the average METS and the position-specific
GENEA results As expected the activities in the posture grouping were the lowest intensity
while the optional running activities were the highest which was reflected in the VO2 and the
accelerometer output The fact that the slow treadmill walking an activity intended to be light
intensity resulted in an average 388 METS response helps to justify the decision to utilize the
higher absolute intensity cut points of 4 and 7 METS to distinguish moderate and vigorous
intensity activity in this sample Comparing the different wear positions of the GENEA showed
that data for the left and right wrists were similar while the mean GENEA data collected at the
waist were lower as were the standard deviations Comparative data from the waist-worn
Actigraph and RT3 are also displayed in Table 3
Paragraph Number 19 Using relative VO2 as the criterion the GENEA demonstrated
excellent criterion validity across all activities (left r = 086 right r = 083 waist r = 087)
performing as well at the waist as the Actigraph GT1M (r = 086) and RT3 (r = 088) The
GENEA also demonstrated excellent concurrent validity compared to the Actigraph GT1M (r =
092) and the RT3 (097) accelerometers Device-specific scatter plots in Figure 2 provide a
graphical comparison of criterion validity (ie METS versus each accelerometer‟s output) across
the varying activity conditions
Paragraph Number 20 Table 4 outlines the results of the ROC curve analysis for the
GENEA Across all three wear positions discrimination of sedentary behavior was almost
perfect with the area under the ROC curve ranging from 097-098 On account of reduced
specificity the discrimination of moderate activity was slightly less precise ranging from 084-
093 Meanwhile it was the reduced sensitivity of vigorous intensity cut points that
compromised the discrimination of vigorous activity which ranged from 089-092 Overall the
13
13
waist-worn GENEA had the greatest classification accuracy (095) followed by the left (093)
then right wrist (090) Interestingly the GENEA on the right wrist was unable to discriminate
between light and moderate intensity categories The overall ability to discriminate between
sedentary light moderate and vigorous intensity physical activity of the waist-worn GENEA
was virtually identical to that of the Actigraph GT1M (094) and the RT3 (095) (data not
shown)
DISCUSSION
Technical Reliability and Validity
Paragraph Number 21 Researchers have used various mechanical apparatuses to oscillate
accelerometers in various axes in an effort to assess reliability These apparatuses allow the
researcher to control the magnitude of the acceleration being imparted as well as the frequency
of the oscillation two key variables that contribute to the accelerometer‟s output Mechanical
setups by virtue of the precise control of the experimental conditions are able to determine the
variability attributed solely to the accelerometer Examples include turntables (15) rotating
wheel setups (2 16) vibration tables (20) and various types of mechanical shakers (5 12 22
24 26) This type of testing is important because if the measurement error intrinsic to the
accelerometer is found to be small then focus can shift to other sources of variation (eg
position worn on the body variation over time (eg day-to-day week-to-week season-to-
season) (15)
Paragraph Number 22 This is the first study to evaluate the technical reliability and
validity of the newly introduced GENEA accelerometer Utilizing 15 testing conditions across a
range of accelerations and frequencies the GENEA was found to be highly reliable with mean
intra- and inter-instrument coefficients of variation of 18 and 24 respectively Likewise the
14
14
GENEA was found to have excellent criterion validity when compared to the MAST acceleration
(r=097) Two thirds of the above-mentioned technical reliability studies focus on Actigraph
model accelerometers and as such it is a logical comparator for the GENEA Out of six studies
the current GENEA results demonstrate the highest technical reliability with the next best
performer coming in a recent study on the Actigraph GT1M (CVintra=29 and CVinter=35)
(24) In terms of criterion validity with the MAST the only relevant comparison comes from a
study on the Actigraph 7164 (2) where the validity coefficient was identical to the present study
Value Calibration
Paragraph Number 23 This is the first study to develop accelerometer cut points for both wrist
and waist-worn GENEA accelerometers that reflect sedentary light moderate and vigorous
intensity physical activity in adults The delineation of intensity of physical activity from
accelerometer data aids in the understanding of the relationship between health-related physical
activity and potential predictor variables such as adiposity age health status and ethnicity (10)
The process used to convert raw accelerometer data into more meaningful and interpretable units
is generally referred to as ldquovalue calibrationrdquo (30) Although raw accelerometer data provides an
indicator of overall movement a fundamental research challenge has been to determine how to
equate it to more meaningful indicators such as energy expenditure or time spent at given
activity intensity Being able to identify the amount of time spent in a range of intensity
categories is useful given the fact that numerous international physical activity guidelines
recommend various amounts of time be spent in specific intensity categories (27)
Paragraph Number 24 In the present study the GENEA demonstrated high levels of
criterion validity (with an average correlation with METS across wear positions of r = 085)
across 10-12 static and dynamic physical activities In fact the criterion validity of the GENEA
15
15
was virtually identical to that of the Actigraph and RT3 Similarly high levels of criterion
validity were shown by Bouten et al (1) during the development of their novel triaxial
accelerometer The GENEA also demonstrated high levels of concurrent validity compared to
the Actigraph GT1M and the RT3 with the highest correlations between the triaxial devices
These data illustrate that the GENEA is comparable to peer accelerometers a result that is
confirmed in the graphical representation of the data in Figure 2 However a closer look
suggests that the GENEA data are less variable than the RT3 and Actigraph across the intensity
spectrum Although speculative the tighter clustering of data within activities may provide
greater success for the GENEA when pursuing alternative analytical approaches For example
the tighter clustering of data within activities in the GENEA should allow for more optimal
activity classification (ie the determination of the mode of physical activity)
Paragraph Number 25 The GENEA SVMgs (g ∙ minutes) cut points established in this
study demonstrated excellent accuracy for classifying physical activity intensity across the
intensity spectrum Because this is the first article to report cut points for the GENEA it is not
possible to compare these values with other studies Although the accuracy of the GENEA was
greatest at the waist it also performed well at the wrist with the left wrist being more accurate
than the right The diminished accuracy experienced on the right wrist was likely due to
differences in participant handedness that is extraneous movements recorded during the activity
conditions were more likely to occur on the right wrist (eg scratching adjusting
clothingglasses hand gestures) However given small number of left handed participants (n=5)
testing of the hypothesis was untenable However it may be that activity signatures obtained
from the right wrist (dominant for over 80 of the population) may prove more useful than the
left (non-dominant) wrist Future research should specifically address this issue so that users
16
16
especially left handed users may know if wearing the GENEA on the right hand is possible The
small size of the GENEA and the fact that it can be positioned at the wrist a location intuitively
less obtrusive than the waist may help rectify issues related to participant compliance in future
studies and may allow for studies with extended physical activity monitoring periods (28)
Paragraph Number 26 Strengths and Limitations Several strengths are noteworthy in the
present study The first strength was the use of a mechanical shaker to perform a preliminary
technical reliability and validity assessment on the GENEA The use of this well controlled
experimental setup allowed for a robust assessment of this new technology Next the GENEA
output was collected analyzed and presented in a non-proprietary SI unit and as such can be
compared with other devices that retainemploy classical physics based measurements Next
ROC curve analysis was chosen to determine the physical activity intensity cut points which is
known to be superior to previous accelerometer calibration methods that employed linear
regression approaches (see Jago et al (10) for a more thorough discussion on this topic) To
date only four studies have employed ROC curve analysis to generate cut points and these were
done on children (3 6 10 31) A further strength of the ROC curve analyses was that the cut
points were chosen to optimize the balance between sensitivity and specificity (ie point nearest
01 on the ROC curve) which in all analyses also coincided with the Youden index ensuring the
optimality of the cut points The intuitive interpretation of the Youden index is that it is the point
on the curve farthest from chance (18) Finally the comparison to two widely used peer
technologies also strengthens the study as does the fact that energy expenditure (mlmiddotkg-1
middotmin-1
)
rather than direct observation was used to provide a continuous objective and physiologically
meaningful dependent variable with which to compare the GENEA data (25)
17
17
Paragraph Number 27 Several limitations of this study should be acknowledged First
the preliminary technical reliability and validity assessment was only performed on one axis the
vertical leaving the performance of the other two axes uncharacterized Next the comparison of
the GENEA would have been more appropriate with the triaxial Actigraph GT3X rather than the
GT1M accelerometer however at the time of this study the newer Actigraphs were not part of
our accelerometer inventory Next although our sample includes men and women of differing
ages and body size our population may not be representative Larger and more variable samples
(eg more left handed more overweight and obese participants) are needed to determine if these
factors might modify our findings In addition the activity conditions selected in this study may
not represent the full complement of activities undertaken by a population therefore caution
must be used when generalizing these results to other groups Finally cross-validation of the
GENEA physical activity intensity cut points by other research groups in different adult
populations is warranted
CONCLUSION
Paragraph Number 28 The GENEA demonstrated excellent technical reliability and validity and
excellent criterion validity compared to VO2 The GENEA cut points established in this study
can be used to estimate the time spent in sedentary light moderate and vigorous intensity
physical activity in adults As a result the GENEA has established itself as an objective and
feasible measurement tool comparable to other peer accelerometers such as the Actigraph
GT1M and RT3 with the potential of offering advanced measurement features in the future
Additional work is warranted to further refine the adult cut points and to develop cut points for
other age groups in an effort to calibrate the GENEA across the lifespan Given that the high
resolution sampling of the GENEA allows for advanced data mining (eg extraction of
18
18
frequency domain features) future research should strive to classifyrecognize activities of daily
living
Acknowledgments
This research was supported by a grant from Unilever Discover Colworth Bedford UK The
authors would like to thank the participants the graduate research assistants and the
administrative staff of the School of Sport and Health Sciences for their dedication to this
research project
Conflict of Interest
The results of the present study do not constitute endorsement by the authors or ACSM of
the products described in this paper This research was funded by an unrestricted research grant
awarded by Unilever Discover to the School of Sport and Health Sciences University of Exeter
The grant funded the salary of DE and small portions of the salaries of AR and RE At the time
of this research TH and MC were both employed by Unilever Discover However at the time of
manuscript submission MC and DE have no further relationship with Unilever Discover or any
of its operating companies None of the authors have a conflict of interest with Oralinsights the
manufacturer of the technology on which this manuscript is based
19
19
References
1 Bouten CV Koekkoek KT Verduin M Kodde R Janssen JD A triaxial accelerometer and
portable data processing unit for the assessment of daily physical activity IEEE Trans
Biomed Eng 199744(3)136-47
2 Brage S Brage N Wedderkopp N Froberg K Reliability and validity of the Computer
Science and Applications accelerometer in a mechanical setting Measurement in Physical
Education and Exercise Science 20037(2)101-19
3 Chu EY McManus AM Yu CC Calibration of the RT3 accelerometer for ambulation and
nonambulation in children Med Sci Sports Exerc 200739(11)2085-91
4 Esliger DW and Tremblay MS Physical activity and inactivity profiling the next generation
Can J Public Health 200798 Suppl 2S195-S207
5 Esliger DW and Tremblay MS Technical reliability assessment of three accelerometer
models in a mechanical setup Med Sci Sports Exerc 200638(12)2173-81
6 Evenson KR Catellier DJ Gill K Ondrak KS McMurray RG Calibration of two objective
measures of physical activity for children J Sports Sci 20081-9
7 Fruin ML and Rankin JW Validity of a multi-sensor armband in estimating rest and exercise
energy expenditure Med Sci Sports Exerc 200436(6)1063-9
8 Gizatullin AO and Edge KA Adaptive control for a multi-axis hydraulic test rig
Proceedings of the Institution of Mechanical Engineers Part I Journal of Systems and
Control Engineering 2007221(2)183-98
9 Grant PM Ryan CG Tigbe WW Granat MH The validation of a novel activity monitor in
the measurement of posture and motion during everyday activities Br J Sports Med
200640(12)992-7
10 Jago R Zakeri I Baranowski T Watson K Decision boundaries and receiver operating
characteristic curves new methods for determining accelerometer cutpoints J Sports Sci
200725(8)937-44
20
20
11 Karantonis DM Narayanan MR Mathie M Lovell NH Celler BG Implementation of a
real-time human movement classifier using a triaxial accelerometer for ambulatory
monitoring IEEE Trans Inf Technol Biomed 200610(1)156-67
12 Krasnoff JB Kohn MA Choy FK Doyle J Johansen K Painter PL Interunit and
intraunit reliability of the RT3 triaxial accelerometer J Phys Act Health 20085(4)527-38
13 McLaughlin JE King GA Howley ET Bassett DR Jr Ainsworth BE Validation of the
COSMED K4 b2 portable metabolic system Int J Sports Med 200122(4)280-4
14 McManus IC and Hartigan A Declining left-handedness in Victorian England seen in the
films of Mitchell and Kenyon Curr Biol 200717(18)R793-R794
15 Metcalf BS Curnow JS Evans C Voss LD Wilkin TJ Technical reliability of the CSA
activity monitor The EarlyBird Study Med Sci Sports Exerc 200234(9)1533-7
16 Moeller NC Korsholm L Kristensen PL Andersen LB Wedderkopp N Froberg K
Unit-specific calibration of Actigraph accelerometers in a mechanical setup - is it worth the
effort The effect on random output variation caused by technical inter-instrument variability
in the laboratory and in the field BMC Med Res Methodol 2008819
17 Montoye HJ Kemper HCG Saris WHM Washburn RA Measuring Physical Activity
and Energy Expenditure Champaign IL Human Kinetics 1996
18 Perkins NJ and Schisterman EF The inconsistency of optimal cutpoints obtained using
two criteria based on the receiver operating characteristic curve Am J Epidemiol
2006163(7)670-5
19 Porcari J McCarron R Kline G Freedson PS Ward A Ross JA Rippe JM Is fast
walking an adequate aerobic training stimulus for 30- to 69-year-old men and women
Physician Sportsmed 198715(2)119-29
20 Powell SM Jones DI Rowlands AV Technical variability of the RT3 accelerometer
Med Sci Sports Exerc 200335(10)1773-8
21 Rennie KL and Jebb SA Prevalence of obesity in Great Britain Obes Rev 20056(1)11-
2
21
21
22 Rothney MP Apker GA Song Y Chen KY Comparing the performance of three
generations of ActiGraph accelerometers J Appl Physiol 2008105(4)1091-7
23 Shephard RJ Absolute versus relative intensity of physical activity in a dose-response
context Med Sci Sports Exerc 200133(6 Suppl)S400-S418
24 Silva P Esliger DW Welk GJ Mota J Technical reliability assessment of the Actigraph
GT1M accelerometer Measurement in Physical Education and Exercise Science
20101479-91
25 Sirard JR Trost SG Pfeiffer KA Dowda M Pate RR Calibration and evaluation of an
objective measure of physical activity in preschool children Journal of Physical Activity and
Health 20053345-57
26 Van Hees V Slootmaker SM De GG Van MW Van Lummel RC Reproducibility of a
triaxial seismic accelerometer (DynaPort) Med Sci Sports Exerc 200941(4)810-7
27 Warburton DE Katzmarzyk PT Rhodes RE Shephard RJ Evidence-informed physical
activity guidelines for Canadian adults Can J Public Health 200798 Suppl 2S16-S68
28 Ware LJ Hurling R Bataveljic O Fairley BW Hurst TL Murray P Rennie KL
Tomkins CE Finn A Cobain MR Pearson DA Foreyt JP Rates and determinants of uptake
and use of an internet physical activity and weight management program in office and
manufacturing work sites in England cohort study J Med Internet Res 200810(4)e56
29 Welk G Physical Activity Assessments for Health-Related Research Champaign IL Human Kinetics 2002
30 Welk GJ Principles of design and analyses for the calibration of accelerometry-based
activity monitors Med Sci Sports Exerc 200537(11 Suppl)S501-S511
31 Welk GJ Eisenmann JC Schaben J Trost SG Dale D Calibration of the biotrainer pro
activity monitor in children Pediatr Exerc Sci 200719(2)145-58
32 Zhang K Werner P Sun M Pi-Sunyer FX Boozer CN Measurement of human daily
physical activity Obes Res 200311(1)33-40
22
22
Figure Captions
Figure 1 Inset right Overhead view of GENEA accelerometers positioned in the test jig Inset
left Multi-Axis Shaker Table (MAST) complete with the test jig secured in place Main Figure
Comparison of a typical output trace from one GENEA accelerometer across the 15 test
conditions
Notes i) the trace represents the middle 50 seconds of each of the 15 conditions
Figure 2 Relationship between physical activity intensity (METS) versus the outputs from the
waist worn GENEA SVMgs (g middot minutes) RT3 (countsminute) and Actigraph (countsmin)
accelerometers across the 16 activity conditions
Table 1 Reliability results for the GENEA for all 15 test conditions
Acceleration Frequency Amplitude GENEA SVMgs
(g ∙ seconds)
CV intra
CV inter
g (mmiddots-2
) (Hz) (m) Mean SD GENEA GENEA
005 049 10 00124 3 01 39 53
022 216 10 00547 11 02 17 20
046 451 30 00127 23 02 08 14
046 451 25 00183 24 02 09 14
048 471 20 00298 25 03 10 14
049 481 15 00541 25 03 11 16
079 775 50 00079 41 04 10 15
091 893 30 00251 46 04 08 13
125 1226 45 00153 57 08 15 21
129 1265 40 00200 58 08 13 20
131 1285 35 00266 59 12 21 26
138 1354 30 00381 60 06 10 18
168 1648 45 00206 64 22 34 37
184 1805 30 00508 66 09 13 22
252 2472 45 00309 84 43 51 53
Average variability across all 15 test conditions 18 24
Table 1
Table 2 Descriptive characteristics of the study participants
Gender Sample
Size Age
Left
Handed
Right
Handed
Height
(cm)
Weight
(kg)
BMI
(kg∙m-2
)
Body Fat
()
Male 23 489 (68) 1 22 1762 (62) 806 (116) 259 (27) 207 (34)
Female 37 496 (64) 4 33 1628 (54) 629 (84) 238 (35) 328 (66)
Overall 60 494 (65) 5 55 1679 (87) 697 (130) 246 (34) 282 (81)
for the measurement of body fat there were 2 less participants (1 male and 1 female)
Table 2
Table 3 Average intensity (METS) and average left right and waist positioned GENEA output by activity
GENEA
(SVMgs (g middot minutes)
Actigraph (CountsMinute)
RT3 (VM CountsMinute)
Activity Grouping
N METS Left Wrist Right Wrist Waist Waist Waist
Mean SD Mean SD Mean SD Mean SD Mean SD Mean SD
Lateral Recumbent (lying on side) Posture
(all)
53 094 023 63 55 143 53 34 17 0 0 4 11
Seated Computer Work 55 122 029 185 86 242 67 48 33 1 3 9 21
Standing 55 113 025 100 66 103 177 48 15 0 0 3 9
Window Washing Lifestyle
(2 of 4)dagger
31 337 106 469 693 1808 708 185 61 138 177 463 344
Washing Dishes 24 235 045 634 177 768 239 132 164 51 80 160 74
Shelf Stacking 30 419 098 884 224 940 202 214 72 2620 1933 421 297
Sweeping 23 339 067 878 264 976 289 187 48 465 355 356 96
Slow Treadmill Walk (4 km∙hr-1
) Ambulatory
(all)
54 388 069 864 195 847 232 856 221 2323 643 1267 318
Medium Treadmill Walk (5 km∙hr-1
) 55 459 079 1177 299 1204 357 1264 214 3745 656 1659 331
Brisk Treadmill Walk (6 km∙hr-1
) 55 588 098 1506 400 1513 350 1815 272 4917 940 2228 450
Stair AscentDescent (80 steps∙min-1
) Stairs (all) 55 619 110 836 620 794 597 697 127 2427 780 811 208
Slow Treadmill Run (8 km∙hr-1
) Ambulatory
(1 of 3)Dagger
18 1113 138 3858 588 4087 798 3553 593 8936 1794 4578 799
Medium Treadmill Run (10 km∙hr-1
) 14 1200 124 5345 1073 4915 787 4043 325 8904 1826 5419 423
Fast Treadmill Run (12 km∙hr-1
) 5 1361 060 5096 2339 5358 2460 4066 299 6982 3233 6093 674
Brisk Free-living Walk (6 km∙hr-1
) Ambulatory
(all) 40 576 094 1433 171 1474 216 1769 227 4912 748 2434 559
Medium Free-living Run (10 km∙hr-1
) Ambulatory
(optional) 5 1262 117 5151 1113 4844 1232 3756 631 8825 1592 5525 787
listwise sample size dagger indicates that participants were randomly allocated 2 out of the 4 activities in this grouping
Dagger indicates that participants had the option to run (select 1 out of the 3 activities in this grouping) if they so chose
Note 1 MET = 35 ml∙kg∙min-1
Table 3
Table 4 Sensitivity specificity area under the ROC curve and GENEA SVMgs (g middot minutes)
cut points that maximized sensitivity and specificity at three wear positions
Intensity Sensitivity Specificity Area under ROC
curve (95 CI)
GENEA Cut points
SVMgs (g middot minutes)
Left Wrist
Sedentary 97 95 098 (098-099) lt 217
Light NA NA NA 217-644
Moderate 95 72 091 (088-093) 645-1810
Vigorous 78 98 091 (086-095) gt 1810
Right Wrist
Sedentary 99 96 098 (097-099) lt 386
Light NA NA NA 386-439
Moderate 100 56 084 (0-81-087) 440-2098
Vigorous 78 97 089 (084-094) gt 2098
Waist
Sedentary 99 96 097 (096-098) lt 77
Light NA NA NA 77-219
Moderate 96 80 093 (091-095) 220-2056
Vigorous 73 99 092 (088-096) gt 2056
Sedentary (lt15 METS) light (15-399 METS) moderate (400-699 METS) vigorous (7+
METS)
NA = not applicable as the sedentary and moderate cut points provide the boundaries for the light
intensity category
Table 4
0
10
20
30
40
50
60
70
80
90
100
GE
NE
A
SV
Mg
s (g
s
eco
nd
s)
Condition1 2 3 4 5 6 7 8 9 10 11 12 13 14 15
Figure 1
GENEA SVMgs (g minutes)
Figure 2
12
12
Paragraph Number 18 Table 3 compares the average METS and the position-specific
GENEA results As expected the activities in the posture grouping were the lowest intensity
while the optional running activities were the highest which was reflected in the VO2 and the
accelerometer output The fact that the slow treadmill walking an activity intended to be light
intensity resulted in an average 388 METS response helps to justify the decision to utilize the
higher absolute intensity cut points of 4 and 7 METS to distinguish moderate and vigorous
intensity activity in this sample Comparing the different wear positions of the GENEA showed
that data for the left and right wrists were similar while the mean GENEA data collected at the
waist were lower as were the standard deviations Comparative data from the waist-worn
Actigraph and RT3 are also displayed in Table 3
Paragraph Number 19 Using relative VO2 as the criterion the GENEA demonstrated
excellent criterion validity across all activities (left r = 086 right r = 083 waist r = 087)
performing as well at the waist as the Actigraph GT1M (r = 086) and RT3 (r = 088) The
GENEA also demonstrated excellent concurrent validity compared to the Actigraph GT1M (r =
092) and the RT3 (097) accelerometers Device-specific scatter plots in Figure 2 provide a
graphical comparison of criterion validity (ie METS versus each accelerometer‟s output) across
the varying activity conditions
Paragraph Number 20 Table 4 outlines the results of the ROC curve analysis for the
GENEA Across all three wear positions discrimination of sedentary behavior was almost
perfect with the area under the ROC curve ranging from 097-098 On account of reduced
specificity the discrimination of moderate activity was slightly less precise ranging from 084-
093 Meanwhile it was the reduced sensitivity of vigorous intensity cut points that
compromised the discrimination of vigorous activity which ranged from 089-092 Overall the
13
13
waist-worn GENEA had the greatest classification accuracy (095) followed by the left (093)
then right wrist (090) Interestingly the GENEA on the right wrist was unable to discriminate
between light and moderate intensity categories The overall ability to discriminate between
sedentary light moderate and vigorous intensity physical activity of the waist-worn GENEA
was virtually identical to that of the Actigraph GT1M (094) and the RT3 (095) (data not
shown)
DISCUSSION
Technical Reliability and Validity
Paragraph Number 21 Researchers have used various mechanical apparatuses to oscillate
accelerometers in various axes in an effort to assess reliability These apparatuses allow the
researcher to control the magnitude of the acceleration being imparted as well as the frequency
of the oscillation two key variables that contribute to the accelerometer‟s output Mechanical
setups by virtue of the precise control of the experimental conditions are able to determine the
variability attributed solely to the accelerometer Examples include turntables (15) rotating
wheel setups (2 16) vibration tables (20) and various types of mechanical shakers (5 12 22
24 26) This type of testing is important because if the measurement error intrinsic to the
accelerometer is found to be small then focus can shift to other sources of variation (eg
position worn on the body variation over time (eg day-to-day week-to-week season-to-
season) (15)
Paragraph Number 22 This is the first study to evaluate the technical reliability and
validity of the newly introduced GENEA accelerometer Utilizing 15 testing conditions across a
range of accelerations and frequencies the GENEA was found to be highly reliable with mean
intra- and inter-instrument coefficients of variation of 18 and 24 respectively Likewise the
14
14
GENEA was found to have excellent criterion validity when compared to the MAST acceleration
(r=097) Two thirds of the above-mentioned technical reliability studies focus on Actigraph
model accelerometers and as such it is a logical comparator for the GENEA Out of six studies
the current GENEA results demonstrate the highest technical reliability with the next best
performer coming in a recent study on the Actigraph GT1M (CVintra=29 and CVinter=35)
(24) In terms of criterion validity with the MAST the only relevant comparison comes from a
study on the Actigraph 7164 (2) where the validity coefficient was identical to the present study
Value Calibration
Paragraph Number 23 This is the first study to develop accelerometer cut points for both wrist
and waist-worn GENEA accelerometers that reflect sedentary light moderate and vigorous
intensity physical activity in adults The delineation of intensity of physical activity from
accelerometer data aids in the understanding of the relationship between health-related physical
activity and potential predictor variables such as adiposity age health status and ethnicity (10)
The process used to convert raw accelerometer data into more meaningful and interpretable units
is generally referred to as ldquovalue calibrationrdquo (30) Although raw accelerometer data provides an
indicator of overall movement a fundamental research challenge has been to determine how to
equate it to more meaningful indicators such as energy expenditure or time spent at given
activity intensity Being able to identify the amount of time spent in a range of intensity
categories is useful given the fact that numerous international physical activity guidelines
recommend various amounts of time be spent in specific intensity categories (27)
Paragraph Number 24 In the present study the GENEA demonstrated high levels of
criterion validity (with an average correlation with METS across wear positions of r = 085)
across 10-12 static and dynamic physical activities In fact the criterion validity of the GENEA
15
15
was virtually identical to that of the Actigraph and RT3 Similarly high levels of criterion
validity were shown by Bouten et al (1) during the development of their novel triaxial
accelerometer The GENEA also demonstrated high levels of concurrent validity compared to
the Actigraph GT1M and the RT3 with the highest correlations between the triaxial devices
These data illustrate that the GENEA is comparable to peer accelerometers a result that is
confirmed in the graphical representation of the data in Figure 2 However a closer look
suggests that the GENEA data are less variable than the RT3 and Actigraph across the intensity
spectrum Although speculative the tighter clustering of data within activities may provide
greater success for the GENEA when pursuing alternative analytical approaches For example
the tighter clustering of data within activities in the GENEA should allow for more optimal
activity classification (ie the determination of the mode of physical activity)
Paragraph Number 25 The GENEA SVMgs (g ∙ minutes) cut points established in this
study demonstrated excellent accuracy for classifying physical activity intensity across the
intensity spectrum Because this is the first article to report cut points for the GENEA it is not
possible to compare these values with other studies Although the accuracy of the GENEA was
greatest at the waist it also performed well at the wrist with the left wrist being more accurate
than the right The diminished accuracy experienced on the right wrist was likely due to
differences in participant handedness that is extraneous movements recorded during the activity
conditions were more likely to occur on the right wrist (eg scratching adjusting
clothingglasses hand gestures) However given small number of left handed participants (n=5)
testing of the hypothesis was untenable However it may be that activity signatures obtained
from the right wrist (dominant for over 80 of the population) may prove more useful than the
left (non-dominant) wrist Future research should specifically address this issue so that users
16
16
especially left handed users may know if wearing the GENEA on the right hand is possible The
small size of the GENEA and the fact that it can be positioned at the wrist a location intuitively
less obtrusive than the waist may help rectify issues related to participant compliance in future
studies and may allow for studies with extended physical activity monitoring periods (28)
Paragraph Number 26 Strengths and Limitations Several strengths are noteworthy in the
present study The first strength was the use of a mechanical shaker to perform a preliminary
technical reliability and validity assessment on the GENEA The use of this well controlled
experimental setup allowed for a robust assessment of this new technology Next the GENEA
output was collected analyzed and presented in a non-proprietary SI unit and as such can be
compared with other devices that retainemploy classical physics based measurements Next
ROC curve analysis was chosen to determine the physical activity intensity cut points which is
known to be superior to previous accelerometer calibration methods that employed linear
regression approaches (see Jago et al (10) for a more thorough discussion on this topic) To
date only four studies have employed ROC curve analysis to generate cut points and these were
done on children (3 6 10 31) A further strength of the ROC curve analyses was that the cut
points were chosen to optimize the balance between sensitivity and specificity (ie point nearest
01 on the ROC curve) which in all analyses also coincided with the Youden index ensuring the
optimality of the cut points The intuitive interpretation of the Youden index is that it is the point
on the curve farthest from chance (18) Finally the comparison to two widely used peer
technologies also strengthens the study as does the fact that energy expenditure (mlmiddotkg-1
middotmin-1
)
rather than direct observation was used to provide a continuous objective and physiologically
meaningful dependent variable with which to compare the GENEA data (25)
17
17
Paragraph Number 27 Several limitations of this study should be acknowledged First
the preliminary technical reliability and validity assessment was only performed on one axis the
vertical leaving the performance of the other two axes uncharacterized Next the comparison of
the GENEA would have been more appropriate with the triaxial Actigraph GT3X rather than the
GT1M accelerometer however at the time of this study the newer Actigraphs were not part of
our accelerometer inventory Next although our sample includes men and women of differing
ages and body size our population may not be representative Larger and more variable samples
(eg more left handed more overweight and obese participants) are needed to determine if these
factors might modify our findings In addition the activity conditions selected in this study may
not represent the full complement of activities undertaken by a population therefore caution
must be used when generalizing these results to other groups Finally cross-validation of the
GENEA physical activity intensity cut points by other research groups in different adult
populations is warranted
CONCLUSION
Paragraph Number 28 The GENEA demonstrated excellent technical reliability and validity and
excellent criterion validity compared to VO2 The GENEA cut points established in this study
can be used to estimate the time spent in sedentary light moderate and vigorous intensity
physical activity in adults As a result the GENEA has established itself as an objective and
feasible measurement tool comparable to other peer accelerometers such as the Actigraph
GT1M and RT3 with the potential of offering advanced measurement features in the future
Additional work is warranted to further refine the adult cut points and to develop cut points for
other age groups in an effort to calibrate the GENEA across the lifespan Given that the high
resolution sampling of the GENEA allows for advanced data mining (eg extraction of
18
18
frequency domain features) future research should strive to classifyrecognize activities of daily
living
Acknowledgments
This research was supported by a grant from Unilever Discover Colworth Bedford UK The
authors would like to thank the participants the graduate research assistants and the
administrative staff of the School of Sport and Health Sciences for their dedication to this
research project
Conflict of Interest
The results of the present study do not constitute endorsement by the authors or ACSM of
the products described in this paper This research was funded by an unrestricted research grant
awarded by Unilever Discover to the School of Sport and Health Sciences University of Exeter
The grant funded the salary of DE and small portions of the salaries of AR and RE At the time
of this research TH and MC were both employed by Unilever Discover However at the time of
manuscript submission MC and DE have no further relationship with Unilever Discover or any
of its operating companies None of the authors have a conflict of interest with Oralinsights the
manufacturer of the technology on which this manuscript is based
19
19
References
1 Bouten CV Koekkoek KT Verduin M Kodde R Janssen JD A triaxial accelerometer and
portable data processing unit for the assessment of daily physical activity IEEE Trans
Biomed Eng 199744(3)136-47
2 Brage S Brage N Wedderkopp N Froberg K Reliability and validity of the Computer
Science and Applications accelerometer in a mechanical setting Measurement in Physical
Education and Exercise Science 20037(2)101-19
3 Chu EY McManus AM Yu CC Calibration of the RT3 accelerometer for ambulation and
nonambulation in children Med Sci Sports Exerc 200739(11)2085-91
4 Esliger DW and Tremblay MS Physical activity and inactivity profiling the next generation
Can J Public Health 200798 Suppl 2S195-S207
5 Esliger DW and Tremblay MS Technical reliability assessment of three accelerometer
models in a mechanical setup Med Sci Sports Exerc 200638(12)2173-81
6 Evenson KR Catellier DJ Gill K Ondrak KS McMurray RG Calibration of two objective
measures of physical activity for children J Sports Sci 20081-9
7 Fruin ML and Rankin JW Validity of a multi-sensor armband in estimating rest and exercise
energy expenditure Med Sci Sports Exerc 200436(6)1063-9
8 Gizatullin AO and Edge KA Adaptive control for a multi-axis hydraulic test rig
Proceedings of the Institution of Mechanical Engineers Part I Journal of Systems and
Control Engineering 2007221(2)183-98
9 Grant PM Ryan CG Tigbe WW Granat MH The validation of a novel activity monitor in
the measurement of posture and motion during everyday activities Br J Sports Med
200640(12)992-7
10 Jago R Zakeri I Baranowski T Watson K Decision boundaries and receiver operating
characteristic curves new methods for determining accelerometer cutpoints J Sports Sci
200725(8)937-44
20
20
11 Karantonis DM Narayanan MR Mathie M Lovell NH Celler BG Implementation of a
real-time human movement classifier using a triaxial accelerometer for ambulatory
monitoring IEEE Trans Inf Technol Biomed 200610(1)156-67
12 Krasnoff JB Kohn MA Choy FK Doyle J Johansen K Painter PL Interunit and
intraunit reliability of the RT3 triaxial accelerometer J Phys Act Health 20085(4)527-38
13 McLaughlin JE King GA Howley ET Bassett DR Jr Ainsworth BE Validation of the
COSMED K4 b2 portable metabolic system Int J Sports Med 200122(4)280-4
14 McManus IC and Hartigan A Declining left-handedness in Victorian England seen in the
films of Mitchell and Kenyon Curr Biol 200717(18)R793-R794
15 Metcalf BS Curnow JS Evans C Voss LD Wilkin TJ Technical reliability of the CSA
activity monitor The EarlyBird Study Med Sci Sports Exerc 200234(9)1533-7
16 Moeller NC Korsholm L Kristensen PL Andersen LB Wedderkopp N Froberg K
Unit-specific calibration of Actigraph accelerometers in a mechanical setup - is it worth the
effort The effect on random output variation caused by technical inter-instrument variability
in the laboratory and in the field BMC Med Res Methodol 2008819
17 Montoye HJ Kemper HCG Saris WHM Washburn RA Measuring Physical Activity
and Energy Expenditure Champaign IL Human Kinetics 1996
18 Perkins NJ and Schisterman EF The inconsistency of optimal cutpoints obtained using
two criteria based on the receiver operating characteristic curve Am J Epidemiol
2006163(7)670-5
19 Porcari J McCarron R Kline G Freedson PS Ward A Ross JA Rippe JM Is fast
walking an adequate aerobic training stimulus for 30- to 69-year-old men and women
Physician Sportsmed 198715(2)119-29
20 Powell SM Jones DI Rowlands AV Technical variability of the RT3 accelerometer
Med Sci Sports Exerc 200335(10)1773-8
21 Rennie KL and Jebb SA Prevalence of obesity in Great Britain Obes Rev 20056(1)11-
2
21
21
22 Rothney MP Apker GA Song Y Chen KY Comparing the performance of three
generations of ActiGraph accelerometers J Appl Physiol 2008105(4)1091-7
23 Shephard RJ Absolute versus relative intensity of physical activity in a dose-response
context Med Sci Sports Exerc 200133(6 Suppl)S400-S418
24 Silva P Esliger DW Welk GJ Mota J Technical reliability assessment of the Actigraph
GT1M accelerometer Measurement in Physical Education and Exercise Science
20101479-91
25 Sirard JR Trost SG Pfeiffer KA Dowda M Pate RR Calibration and evaluation of an
objective measure of physical activity in preschool children Journal of Physical Activity and
Health 20053345-57
26 Van Hees V Slootmaker SM De GG Van MW Van Lummel RC Reproducibility of a
triaxial seismic accelerometer (DynaPort) Med Sci Sports Exerc 200941(4)810-7
27 Warburton DE Katzmarzyk PT Rhodes RE Shephard RJ Evidence-informed physical
activity guidelines for Canadian adults Can J Public Health 200798 Suppl 2S16-S68
28 Ware LJ Hurling R Bataveljic O Fairley BW Hurst TL Murray P Rennie KL
Tomkins CE Finn A Cobain MR Pearson DA Foreyt JP Rates and determinants of uptake
and use of an internet physical activity and weight management program in office and
manufacturing work sites in England cohort study J Med Internet Res 200810(4)e56
29 Welk G Physical Activity Assessments for Health-Related Research Champaign IL Human Kinetics 2002
30 Welk GJ Principles of design and analyses for the calibration of accelerometry-based
activity monitors Med Sci Sports Exerc 200537(11 Suppl)S501-S511
31 Welk GJ Eisenmann JC Schaben J Trost SG Dale D Calibration of the biotrainer pro
activity monitor in children Pediatr Exerc Sci 200719(2)145-58
32 Zhang K Werner P Sun M Pi-Sunyer FX Boozer CN Measurement of human daily
physical activity Obes Res 200311(1)33-40
22
22
Figure Captions
Figure 1 Inset right Overhead view of GENEA accelerometers positioned in the test jig Inset
left Multi-Axis Shaker Table (MAST) complete with the test jig secured in place Main Figure
Comparison of a typical output trace from one GENEA accelerometer across the 15 test
conditions
Notes i) the trace represents the middle 50 seconds of each of the 15 conditions
Figure 2 Relationship between physical activity intensity (METS) versus the outputs from the
waist worn GENEA SVMgs (g middot minutes) RT3 (countsminute) and Actigraph (countsmin)
accelerometers across the 16 activity conditions
Table 1 Reliability results for the GENEA for all 15 test conditions
Acceleration Frequency Amplitude GENEA SVMgs
(g ∙ seconds)
CV intra
CV inter
g (mmiddots-2
) (Hz) (m) Mean SD GENEA GENEA
005 049 10 00124 3 01 39 53
022 216 10 00547 11 02 17 20
046 451 30 00127 23 02 08 14
046 451 25 00183 24 02 09 14
048 471 20 00298 25 03 10 14
049 481 15 00541 25 03 11 16
079 775 50 00079 41 04 10 15
091 893 30 00251 46 04 08 13
125 1226 45 00153 57 08 15 21
129 1265 40 00200 58 08 13 20
131 1285 35 00266 59 12 21 26
138 1354 30 00381 60 06 10 18
168 1648 45 00206 64 22 34 37
184 1805 30 00508 66 09 13 22
252 2472 45 00309 84 43 51 53
Average variability across all 15 test conditions 18 24
Table 1
Table 2 Descriptive characteristics of the study participants
Gender Sample
Size Age
Left
Handed
Right
Handed
Height
(cm)
Weight
(kg)
BMI
(kg∙m-2
)
Body Fat
()
Male 23 489 (68) 1 22 1762 (62) 806 (116) 259 (27) 207 (34)
Female 37 496 (64) 4 33 1628 (54) 629 (84) 238 (35) 328 (66)
Overall 60 494 (65) 5 55 1679 (87) 697 (130) 246 (34) 282 (81)
for the measurement of body fat there were 2 less participants (1 male and 1 female)
Table 2
Table 3 Average intensity (METS) and average left right and waist positioned GENEA output by activity
GENEA
(SVMgs (g middot minutes)
Actigraph (CountsMinute)
RT3 (VM CountsMinute)
Activity Grouping
N METS Left Wrist Right Wrist Waist Waist Waist
Mean SD Mean SD Mean SD Mean SD Mean SD Mean SD
Lateral Recumbent (lying on side) Posture
(all)
53 094 023 63 55 143 53 34 17 0 0 4 11
Seated Computer Work 55 122 029 185 86 242 67 48 33 1 3 9 21
Standing 55 113 025 100 66 103 177 48 15 0 0 3 9
Window Washing Lifestyle
(2 of 4)dagger
31 337 106 469 693 1808 708 185 61 138 177 463 344
Washing Dishes 24 235 045 634 177 768 239 132 164 51 80 160 74
Shelf Stacking 30 419 098 884 224 940 202 214 72 2620 1933 421 297
Sweeping 23 339 067 878 264 976 289 187 48 465 355 356 96
Slow Treadmill Walk (4 km∙hr-1
) Ambulatory
(all)
54 388 069 864 195 847 232 856 221 2323 643 1267 318
Medium Treadmill Walk (5 km∙hr-1
) 55 459 079 1177 299 1204 357 1264 214 3745 656 1659 331
Brisk Treadmill Walk (6 km∙hr-1
) 55 588 098 1506 400 1513 350 1815 272 4917 940 2228 450
Stair AscentDescent (80 steps∙min-1
) Stairs (all) 55 619 110 836 620 794 597 697 127 2427 780 811 208
Slow Treadmill Run (8 km∙hr-1
) Ambulatory
(1 of 3)Dagger
18 1113 138 3858 588 4087 798 3553 593 8936 1794 4578 799
Medium Treadmill Run (10 km∙hr-1
) 14 1200 124 5345 1073 4915 787 4043 325 8904 1826 5419 423
Fast Treadmill Run (12 km∙hr-1
) 5 1361 060 5096 2339 5358 2460 4066 299 6982 3233 6093 674
Brisk Free-living Walk (6 km∙hr-1
) Ambulatory
(all) 40 576 094 1433 171 1474 216 1769 227 4912 748 2434 559
Medium Free-living Run (10 km∙hr-1
) Ambulatory
(optional) 5 1262 117 5151 1113 4844 1232 3756 631 8825 1592 5525 787
listwise sample size dagger indicates that participants were randomly allocated 2 out of the 4 activities in this grouping
Dagger indicates that participants had the option to run (select 1 out of the 3 activities in this grouping) if they so chose
Note 1 MET = 35 ml∙kg∙min-1
Table 3
Table 4 Sensitivity specificity area under the ROC curve and GENEA SVMgs (g middot minutes)
cut points that maximized sensitivity and specificity at three wear positions
Intensity Sensitivity Specificity Area under ROC
curve (95 CI)
GENEA Cut points
SVMgs (g middot minutes)
Left Wrist
Sedentary 97 95 098 (098-099) lt 217
Light NA NA NA 217-644
Moderate 95 72 091 (088-093) 645-1810
Vigorous 78 98 091 (086-095) gt 1810
Right Wrist
Sedentary 99 96 098 (097-099) lt 386
Light NA NA NA 386-439
Moderate 100 56 084 (0-81-087) 440-2098
Vigorous 78 97 089 (084-094) gt 2098
Waist
Sedentary 99 96 097 (096-098) lt 77
Light NA NA NA 77-219
Moderate 96 80 093 (091-095) 220-2056
Vigorous 73 99 092 (088-096) gt 2056
Sedentary (lt15 METS) light (15-399 METS) moderate (400-699 METS) vigorous (7+
METS)
NA = not applicable as the sedentary and moderate cut points provide the boundaries for the light
intensity category
Table 4
0
10
20
30
40
50
60
70
80
90
100
GE
NE
A
SV
Mg
s (g
s
eco
nd
s)
Condition1 2 3 4 5 6 7 8 9 10 11 12 13 14 15
Figure 1
GENEA SVMgs (g minutes)
Figure 2
13
13
waist-worn GENEA had the greatest classification accuracy (095) followed by the left (093)
then right wrist (090) Interestingly the GENEA on the right wrist was unable to discriminate
between light and moderate intensity categories The overall ability to discriminate between
sedentary light moderate and vigorous intensity physical activity of the waist-worn GENEA
was virtually identical to that of the Actigraph GT1M (094) and the RT3 (095) (data not
shown)
DISCUSSION
Technical Reliability and Validity
Paragraph Number 21 Researchers have used various mechanical apparatuses to oscillate
accelerometers in various axes in an effort to assess reliability These apparatuses allow the
researcher to control the magnitude of the acceleration being imparted as well as the frequency
of the oscillation two key variables that contribute to the accelerometer‟s output Mechanical
setups by virtue of the precise control of the experimental conditions are able to determine the
variability attributed solely to the accelerometer Examples include turntables (15) rotating
wheel setups (2 16) vibration tables (20) and various types of mechanical shakers (5 12 22
24 26) This type of testing is important because if the measurement error intrinsic to the
accelerometer is found to be small then focus can shift to other sources of variation (eg
position worn on the body variation over time (eg day-to-day week-to-week season-to-
season) (15)
Paragraph Number 22 This is the first study to evaluate the technical reliability and
validity of the newly introduced GENEA accelerometer Utilizing 15 testing conditions across a
range of accelerations and frequencies the GENEA was found to be highly reliable with mean
intra- and inter-instrument coefficients of variation of 18 and 24 respectively Likewise the
14
14
GENEA was found to have excellent criterion validity when compared to the MAST acceleration
(r=097) Two thirds of the above-mentioned technical reliability studies focus on Actigraph
model accelerometers and as such it is a logical comparator for the GENEA Out of six studies
the current GENEA results demonstrate the highest technical reliability with the next best
performer coming in a recent study on the Actigraph GT1M (CVintra=29 and CVinter=35)
(24) In terms of criterion validity with the MAST the only relevant comparison comes from a
study on the Actigraph 7164 (2) where the validity coefficient was identical to the present study
Value Calibration
Paragraph Number 23 This is the first study to develop accelerometer cut points for both wrist
and waist-worn GENEA accelerometers that reflect sedentary light moderate and vigorous
intensity physical activity in adults The delineation of intensity of physical activity from
accelerometer data aids in the understanding of the relationship between health-related physical
activity and potential predictor variables such as adiposity age health status and ethnicity (10)
The process used to convert raw accelerometer data into more meaningful and interpretable units
is generally referred to as ldquovalue calibrationrdquo (30) Although raw accelerometer data provides an
indicator of overall movement a fundamental research challenge has been to determine how to
equate it to more meaningful indicators such as energy expenditure or time spent at given
activity intensity Being able to identify the amount of time spent in a range of intensity
categories is useful given the fact that numerous international physical activity guidelines
recommend various amounts of time be spent in specific intensity categories (27)
Paragraph Number 24 In the present study the GENEA demonstrated high levels of
criterion validity (with an average correlation with METS across wear positions of r = 085)
across 10-12 static and dynamic physical activities In fact the criterion validity of the GENEA
15
15
was virtually identical to that of the Actigraph and RT3 Similarly high levels of criterion
validity were shown by Bouten et al (1) during the development of their novel triaxial
accelerometer The GENEA also demonstrated high levels of concurrent validity compared to
the Actigraph GT1M and the RT3 with the highest correlations between the triaxial devices
These data illustrate that the GENEA is comparable to peer accelerometers a result that is
confirmed in the graphical representation of the data in Figure 2 However a closer look
suggests that the GENEA data are less variable than the RT3 and Actigraph across the intensity
spectrum Although speculative the tighter clustering of data within activities may provide
greater success for the GENEA when pursuing alternative analytical approaches For example
the tighter clustering of data within activities in the GENEA should allow for more optimal
activity classification (ie the determination of the mode of physical activity)
Paragraph Number 25 The GENEA SVMgs (g ∙ minutes) cut points established in this
study demonstrated excellent accuracy for classifying physical activity intensity across the
intensity spectrum Because this is the first article to report cut points for the GENEA it is not
possible to compare these values with other studies Although the accuracy of the GENEA was
greatest at the waist it also performed well at the wrist with the left wrist being more accurate
than the right The diminished accuracy experienced on the right wrist was likely due to
differences in participant handedness that is extraneous movements recorded during the activity
conditions were more likely to occur on the right wrist (eg scratching adjusting
clothingglasses hand gestures) However given small number of left handed participants (n=5)
testing of the hypothesis was untenable However it may be that activity signatures obtained
from the right wrist (dominant for over 80 of the population) may prove more useful than the
left (non-dominant) wrist Future research should specifically address this issue so that users
16
16
especially left handed users may know if wearing the GENEA on the right hand is possible The
small size of the GENEA and the fact that it can be positioned at the wrist a location intuitively
less obtrusive than the waist may help rectify issues related to participant compliance in future
studies and may allow for studies with extended physical activity monitoring periods (28)
Paragraph Number 26 Strengths and Limitations Several strengths are noteworthy in the
present study The first strength was the use of a mechanical shaker to perform a preliminary
technical reliability and validity assessment on the GENEA The use of this well controlled
experimental setup allowed for a robust assessment of this new technology Next the GENEA
output was collected analyzed and presented in a non-proprietary SI unit and as such can be
compared with other devices that retainemploy classical physics based measurements Next
ROC curve analysis was chosen to determine the physical activity intensity cut points which is
known to be superior to previous accelerometer calibration methods that employed linear
regression approaches (see Jago et al (10) for a more thorough discussion on this topic) To
date only four studies have employed ROC curve analysis to generate cut points and these were
done on children (3 6 10 31) A further strength of the ROC curve analyses was that the cut
points were chosen to optimize the balance between sensitivity and specificity (ie point nearest
01 on the ROC curve) which in all analyses also coincided with the Youden index ensuring the
optimality of the cut points The intuitive interpretation of the Youden index is that it is the point
on the curve farthest from chance (18) Finally the comparison to two widely used peer
technologies also strengthens the study as does the fact that energy expenditure (mlmiddotkg-1
middotmin-1
)
rather than direct observation was used to provide a continuous objective and physiologically
meaningful dependent variable with which to compare the GENEA data (25)
17
17
Paragraph Number 27 Several limitations of this study should be acknowledged First
the preliminary technical reliability and validity assessment was only performed on one axis the
vertical leaving the performance of the other two axes uncharacterized Next the comparison of
the GENEA would have been more appropriate with the triaxial Actigraph GT3X rather than the
GT1M accelerometer however at the time of this study the newer Actigraphs were not part of
our accelerometer inventory Next although our sample includes men and women of differing
ages and body size our population may not be representative Larger and more variable samples
(eg more left handed more overweight and obese participants) are needed to determine if these
factors might modify our findings In addition the activity conditions selected in this study may
not represent the full complement of activities undertaken by a population therefore caution
must be used when generalizing these results to other groups Finally cross-validation of the
GENEA physical activity intensity cut points by other research groups in different adult
populations is warranted
CONCLUSION
Paragraph Number 28 The GENEA demonstrated excellent technical reliability and validity and
excellent criterion validity compared to VO2 The GENEA cut points established in this study
can be used to estimate the time spent in sedentary light moderate and vigorous intensity
physical activity in adults As a result the GENEA has established itself as an objective and
feasible measurement tool comparable to other peer accelerometers such as the Actigraph
GT1M and RT3 with the potential of offering advanced measurement features in the future
Additional work is warranted to further refine the adult cut points and to develop cut points for
other age groups in an effort to calibrate the GENEA across the lifespan Given that the high
resolution sampling of the GENEA allows for advanced data mining (eg extraction of
18
18
frequency domain features) future research should strive to classifyrecognize activities of daily
living
Acknowledgments
This research was supported by a grant from Unilever Discover Colworth Bedford UK The
authors would like to thank the participants the graduate research assistants and the
administrative staff of the School of Sport and Health Sciences for their dedication to this
research project
Conflict of Interest
The results of the present study do not constitute endorsement by the authors or ACSM of
the products described in this paper This research was funded by an unrestricted research grant
awarded by Unilever Discover to the School of Sport and Health Sciences University of Exeter
The grant funded the salary of DE and small portions of the salaries of AR and RE At the time
of this research TH and MC were both employed by Unilever Discover However at the time of
manuscript submission MC and DE have no further relationship with Unilever Discover or any
of its operating companies None of the authors have a conflict of interest with Oralinsights the
manufacturer of the technology on which this manuscript is based
19
19
References
1 Bouten CV Koekkoek KT Verduin M Kodde R Janssen JD A triaxial accelerometer and
portable data processing unit for the assessment of daily physical activity IEEE Trans
Biomed Eng 199744(3)136-47
2 Brage S Brage N Wedderkopp N Froberg K Reliability and validity of the Computer
Science and Applications accelerometer in a mechanical setting Measurement in Physical
Education and Exercise Science 20037(2)101-19
3 Chu EY McManus AM Yu CC Calibration of the RT3 accelerometer for ambulation and
nonambulation in children Med Sci Sports Exerc 200739(11)2085-91
4 Esliger DW and Tremblay MS Physical activity and inactivity profiling the next generation
Can J Public Health 200798 Suppl 2S195-S207
5 Esliger DW and Tremblay MS Technical reliability assessment of three accelerometer
models in a mechanical setup Med Sci Sports Exerc 200638(12)2173-81
6 Evenson KR Catellier DJ Gill K Ondrak KS McMurray RG Calibration of two objective
measures of physical activity for children J Sports Sci 20081-9
7 Fruin ML and Rankin JW Validity of a multi-sensor armband in estimating rest and exercise
energy expenditure Med Sci Sports Exerc 200436(6)1063-9
8 Gizatullin AO and Edge KA Adaptive control for a multi-axis hydraulic test rig
Proceedings of the Institution of Mechanical Engineers Part I Journal of Systems and
Control Engineering 2007221(2)183-98
9 Grant PM Ryan CG Tigbe WW Granat MH The validation of a novel activity monitor in
the measurement of posture and motion during everyday activities Br J Sports Med
200640(12)992-7
10 Jago R Zakeri I Baranowski T Watson K Decision boundaries and receiver operating
characteristic curves new methods for determining accelerometer cutpoints J Sports Sci
200725(8)937-44
20
20
11 Karantonis DM Narayanan MR Mathie M Lovell NH Celler BG Implementation of a
real-time human movement classifier using a triaxial accelerometer for ambulatory
monitoring IEEE Trans Inf Technol Biomed 200610(1)156-67
12 Krasnoff JB Kohn MA Choy FK Doyle J Johansen K Painter PL Interunit and
intraunit reliability of the RT3 triaxial accelerometer J Phys Act Health 20085(4)527-38
13 McLaughlin JE King GA Howley ET Bassett DR Jr Ainsworth BE Validation of the
COSMED K4 b2 portable metabolic system Int J Sports Med 200122(4)280-4
14 McManus IC and Hartigan A Declining left-handedness in Victorian England seen in the
films of Mitchell and Kenyon Curr Biol 200717(18)R793-R794
15 Metcalf BS Curnow JS Evans C Voss LD Wilkin TJ Technical reliability of the CSA
activity monitor The EarlyBird Study Med Sci Sports Exerc 200234(9)1533-7
16 Moeller NC Korsholm L Kristensen PL Andersen LB Wedderkopp N Froberg K
Unit-specific calibration of Actigraph accelerometers in a mechanical setup - is it worth the
effort The effect on random output variation caused by technical inter-instrument variability
in the laboratory and in the field BMC Med Res Methodol 2008819
17 Montoye HJ Kemper HCG Saris WHM Washburn RA Measuring Physical Activity
and Energy Expenditure Champaign IL Human Kinetics 1996
18 Perkins NJ and Schisterman EF The inconsistency of optimal cutpoints obtained using
two criteria based on the receiver operating characteristic curve Am J Epidemiol
2006163(7)670-5
19 Porcari J McCarron R Kline G Freedson PS Ward A Ross JA Rippe JM Is fast
walking an adequate aerobic training stimulus for 30- to 69-year-old men and women
Physician Sportsmed 198715(2)119-29
20 Powell SM Jones DI Rowlands AV Technical variability of the RT3 accelerometer
Med Sci Sports Exerc 200335(10)1773-8
21 Rennie KL and Jebb SA Prevalence of obesity in Great Britain Obes Rev 20056(1)11-
2
21
21
22 Rothney MP Apker GA Song Y Chen KY Comparing the performance of three
generations of ActiGraph accelerometers J Appl Physiol 2008105(4)1091-7
23 Shephard RJ Absolute versus relative intensity of physical activity in a dose-response
context Med Sci Sports Exerc 200133(6 Suppl)S400-S418
24 Silva P Esliger DW Welk GJ Mota J Technical reliability assessment of the Actigraph
GT1M accelerometer Measurement in Physical Education and Exercise Science
20101479-91
25 Sirard JR Trost SG Pfeiffer KA Dowda M Pate RR Calibration and evaluation of an
objective measure of physical activity in preschool children Journal of Physical Activity and
Health 20053345-57
26 Van Hees V Slootmaker SM De GG Van MW Van Lummel RC Reproducibility of a
triaxial seismic accelerometer (DynaPort) Med Sci Sports Exerc 200941(4)810-7
27 Warburton DE Katzmarzyk PT Rhodes RE Shephard RJ Evidence-informed physical
activity guidelines for Canadian adults Can J Public Health 200798 Suppl 2S16-S68
28 Ware LJ Hurling R Bataveljic O Fairley BW Hurst TL Murray P Rennie KL
Tomkins CE Finn A Cobain MR Pearson DA Foreyt JP Rates and determinants of uptake
and use of an internet physical activity and weight management program in office and
manufacturing work sites in England cohort study J Med Internet Res 200810(4)e56
29 Welk G Physical Activity Assessments for Health-Related Research Champaign IL Human Kinetics 2002
30 Welk GJ Principles of design and analyses for the calibration of accelerometry-based
activity monitors Med Sci Sports Exerc 200537(11 Suppl)S501-S511
31 Welk GJ Eisenmann JC Schaben J Trost SG Dale D Calibration of the biotrainer pro
activity monitor in children Pediatr Exerc Sci 200719(2)145-58
32 Zhang K Werner P Sun M Pi-Sunyer FX Boozer CN Measurement of human daily
physical activity Obes Res 200311(1)33-40
22
22
Figure Captions
Figure 1 Inset right Overhead view of GENEA accelerometers positioned in the test jig Inset
left Multi-Axis Shaker Table (MAST) complete with the test jig secured in place Main Figure
Comparison of a typical output trace from one GENEA accelerometer across the 15 test
conditions
Notes i) the trace represents the middle 50 seconds of each of the 15 conditions
Figure 2 Relationship between physical activity intensity (METS) versus the outputs from the
waist worn GENEA SVMgs (g middot minutes) RT3 (countsminute) and Actigraph (countsmin)
accelerometers across the 16 activity conditions
Table 1 Reliability results for the GENEA for all 15 test conditions
Acceleration Frequency Amplitude GENEA SVMgs
(g ∙ seconds)
CV intra
CV inter
g (mmiddots-2
) (Hz) (m) Mean SD GENEA GENEA
005 049 10 00124 3 01 39 53
022 216 10 00547 11 02 17 20
046 451 30 00127 23 02 08 14
046 451 25 00183 24 02 09 14
048 471 20 00298 25 03 10 14
049 481 15 00541 25 03 11 16
079 775 50 00079 41 04 10 15
091 893 30 00251 46 04 08 13
125 1226 45 00153 57 08 15 21
129 1265 40 00200 58 08 13 20
131 1285 35 00266 59 12 21 26
138 1354 30 00381 60 06 10 18
168 1648 45 00206 64 22 34 37
184 1805 30 00508 66 09 13 22
252 2472 45 00309 84 43 51 53
Average variability across all 15 test conditions 18 24
Table 1
Table 2 Descriptive characteristics of the study participants
Gender Sample
Size Age
Left
Handed
Right
Handed
Height
(cm)
Weight
(kg)
BMI
(kg∙m-2
)
Body Fat
()
Male 23 489 (68) 1 22 1762 (62) 806 (116) 259 (27) 207 (34)
Female 37 496 (64) 4 33 1628 (54) 629 (84) 238 (35) 328 (66)
Overall 60 494 (65) 5 55 1679 (87) 697 (130) 246 (34) 282 (81)
for the measurement of body fat there were 2 less participants (1 male and 1 female)
Table 2
Table 3 Average intensity (METS) and average left right and waist positioned GENEA output by activity
GENEA
(SVMgs (g middot minutes)
Actigraph (CountsMinute)
RT3 (VM CountsMinute)
Activity Grouping
N METS Left Wrist Right Wrist Waist Waist Waist
Mean SD Mean SD Mean SD Mean SD Mean SD Mean SD
Lateral Recumbent (lying on side) Posture
(all)
53 094 023 63 55 143 53 34 17 0 0 4 11
Seated Computer Work 55 122 029 185 86 242 67 48 33 1 3 9 21
Standing 55 113 025 100 66 103 177 48 15 0 0 3 9
Window Washing Lifestyle
(2 of 4)dagger
31 337 106 469 693 1808 708 185 61 138 177 463 344
Washing Dishes 24 235 045 634 177 768 239 132 164 51 80 160 74
Shelf Stacking 30 419 098 884 224 940 202 214 72 2620 1933 421 297
Sweeping 23 339 067 878 264 976 289 187 48 465 355 356 96
Slow Treadmill Walk (4 km∙hr-1
) Ambulatory
(all)
54 388 069 864 195 847 232 856 221 2323 643 1267 318
Medium Treadmill Walk (5 km∙hr-1
) 55 459 079 1177 299 1204 357 1264 214 3745 656 1659 331
Brisk Treadmill Walk (6 km∙hr-1
) 55 588 098 1506 400 1513 350 1815 272 4917 940 2228 450
Stair AscentDescent (80 steps∙min-1
) Stairs (all) 55 619 110 836 620 794 597 697 127 2427 780 811 208
Slow Treadmill Run (8 km∙hr-1
) Ambulatory
(1 of 3)Dagger
18 1113 138 3858 588 4087 798 3553 593 8936 1794 4578 799
Medium Treadmill Run (10 km∙hr-1
) 14 1200 124 5345 1073 4915 787 4043 325 8904 1826 5419 423
Fast Treadmill Run (12 km∙hr-1
) 5 1361 060 5096 2339 5358 2460 4066 299 6982 3233 6093 674
Brisk Free-living Walk (6 km∙hr-1
) Ambulatory
(all) 40 576 094 1433 171 1474 216 1769 227 4912 748 2434 559
Medium Free-living Run (10 km∙hr-1
) Ambulatory
(optional) 5 1262 117 5151 1113 4844 1232 3756 631 8825 1592 5525 787
listwise sample size dagger indicates that participants were randomly allocated 2 out of the 4 activities in this grouping
Dagger indicates that participants had the option to run (select 1 out of the 3 activities in this grouping) if they so chose
Note 1 MET = 35 ml∙kg∙min-1
Table 3
Table 4 Sensitivity specificity area under the ROC curve and GENEA SVMgs (g middot minutes)
cut points that maximized sensitivity and specificity at three wear positions
Intensity Sensitivity Specificity Area under ROC
curve (95 CI)
GENEA Cut points
SVMgs (g middot minutes)
Left Wrist
Sedentary 97 95 098 (098-099) lt 217
Light NA NA NA 217-644
Moderate 95 72 091 (088-093) 645-1810
Vigorous 78 98 091 (086-095) gt 1810
Right Wrist
Sedentary 99 96 098 (097-099) lt 386
Light NA NA NA 386-439
Moderate 100 56 084 (0-81-087) 440-2098
Vigorous 78 97 089 (084-094) gt 2098
Waist
Sedentary 99 96 097 (096-098) lt 77
Light NA NA NA 77-219
Moderate 96 80 093 (091-095) 220-2056
Vigorous 73 99 092 (088-096) gt 2056
Sedentary (lt15 METS) light (15-399 METS) moderate (400-699 METS) vigorous (7+
METS)
NA = not applicable as the sedentary and moderate cut points provide the boundaries for the light
intensity category
Table 4
0
10
20
30
40
50
60
70
80
90
100
GE
NE
A
SV
Mg
s (g
s
eco
nd
s)
Condition1 2 3 4 5 6 7 8 9 10 11 12 13 14 15
Figure 1
GENEA SVMgs (g minutes)
Figure 2
14
14
GENEA was found to have excellent criterion validity when compared to the MAST acceleration
(r=097) Two thirds of the above-mentioned technical reliability studies focus on Actigraph
model accelerometers and as such it is a logical comparator for the GENEA Out of six studies
the current GENEA results demonstrate the highest technical reliability with the next best
performer coming in a recent study on the Actigraph GT1M (CVintra=29 and CVinter=35)
(24) In terms of criterion validity with the MAST the only relevant comparison comes from a
study on the Actigraph 7164 (2) where the validity coefficient was identical to the present study
Value Calibration
Paragraph Number 23 This is the first study to develop accelerometer cut points for both wrist
and waist-worn GENEA accelerometers that reflect sedentary light moderate and vigorous
intensity physical activity in adults The delineation of intensity of physical activity from
accelerometer data aids in the understanding of the relationship between health-related physical
activity and potential predictor variables such as adiposity age health status and ethnicity (10)
The process used to convert raw accelerometer data into more meaningful and interpretable units
is generally referred to as ldquovalue calibrationrdquo (30) Although raw accelerometer data provides an
indicator of overall movement a fundamental research challenge has been to determine how to
equate it to more meaningful indicators such as energy expenditure or time spent at given
activity intensity Being able to identify the amount of time spent in a range of intensity
categories is useful given the fact that numerous international physical activity guidelines
recommend various amounts of time be spent in specific intensity categories (27)
Paragraph Number 24 In the present study the GENEA demonstrated high levels of
criterion validity (with an average correlation with METS across wear positions of r = 085)
across 10-12 static and dynamic physical activities In fact the criterion validity of the GENEA
15
15
was virtually identical to that of the Actigraph and RT3 Similarly high levels of criterion
validity were shown by Bouten et al (1) during the development of their novel triaxial
accelerometer The GENEA also demonstrated high levels of concurrent validity compared to
the Actigraph GT1M and the RT3 with the highest correlations between the triaxial devices
These data illustrate that the GENEA is comparable to peer accelerometers a result that is
confirmed in the graphical representation of the data in Figure 2 However a closer look
suggests that the GENEA data are less variable than the RT3 and Actigraph across the intensity
spectrum Although speculative the tighter clustering of data within activities may provide
greater success for the GENEA when pursuing alternative analytical approaches For example
the tighter clustering of data within activities in the GENEA should allow for more optimal
activity classification (ie the determination of the mode of physical activity)
Paragraph Number 25 The GENEA SVMgs (g ∙ minutes) cut points established in this
study demonstrated excellent accuracy for classifying physical activity intensity across the
intensity spectrum Because this is the first article to report cut points for the GENEA it is not
possible to compare these values with other studies Although the accuracy of the GENEA was
greatest at the waist it also performed well at the wrist with the left wrist being more accurate
than the right The diminished accuracy experienced on the right wrist was likely due to
differences in participant handedness that is extraneous movements recorded during the activity
conditions were more likely to occur on the right wrist (eg scratching adjusting
clothingglasses hand gestures) However given small number of left handed participants (n=5)
testing of the hypothesis was untenable However it may be that activity signatures obtained
from the right wrist (dominant for over 80 of the population) may prove more useful than the
left (non-dominant) wrist Future research should specifically address this issue so that users
16
16
especially left handed users may know if wearing the GENEA on the right hand is possible The
small size of the GENEA and the fact that it can be positioned at the wrist a location intuitively
less obtrusive than the waist may help rectify issues related to participant compliance in future
studies and may allow for studies with extended physical activity monitoring periods (28)
Paragraph Number 26 Strengths and Limitations Several strengths are noteworthy in the
present study The first strength was the use of a mechanical shaker to perform a preliminary
technical reliability and validity assessment on the GENEA The use of this well controlled
experimental setup allowed for a robust assessment of this new technology Next the GENEA
output was collected analyzed and presented in a non-proprietary SI unit and as such can be
compared with other devices that retainemploy classical physics based measurements Next
ROC curve analysis was chosen to determine the physical activity intensity cut points which is
known to be superior to previous accelerometer calibration methods that employed linear
regression approaches (see Jago et al (10) for a more thorough discussion on this topic) To
date only four studies have employed ROC curve analysis to generate cut points and these were
done on children (3 6 10 31) A further strength of the ROC curve analyses was that the cut
points were chosen to optimize the balance between sensitivity and specificity (ie point nearest
01 on the ROC curve) which in all analyses also coincided with the Youden index ensuring the
optimality of the cut points The intuitive interpretation of the Youden index is that it is the point
on the curve farthest from chance (18) Finally the comparison to two widely used peer
technologies also strengthens the study as does the fact that energy expenditure (mlmiddotkg-1
middotmin-1
)
rather than direct observation was used to provide a continuous objective and physiologically
meaningful dependent variable with which to compare the GENEA data (25)
17
17
Paragraph Number 27 Several limitations of this study should be acknowledged First
the preliminary technical reliability and validity assessment was only performed on one axis the
vertical leaving the performance of the other two axes uncharacterized Next the comparison of
the GENEA would have been more appropriate with the triaxial Actigraph GT3X rather than the
GT1M accelerometer however at the time of this study the newer Actigraphs were not part of
our accelerometer inventory Next although our sample includes men and women of differing
ages and body size our population may not be representative Larger and more variable samples
(eg more left handed more overweight and obese participants) are needed to determine if these
factors might modify our findings In addition the activity conditions selected in this study may
not represent the full complement of activities undertaken by a population therefore caution
must be used when generalizing these results to other groups Finally cross-validation of the
GENEA physical activity intensity cut points by other research groups in different adult
populations is warranted
CONCLUSION
Paragraph Number 28 The GENEA demonstrated excellent technical reliability and validity and
excellent criterion validity compared to VO2 The GENEA cut points established in this study
can be used to estimate the time spent in sedentary light moderate and vigorous intensity
physical activity in adults As a result the GENEA has established itself as an objective and
feasible measurement tool comparable to other peer accelerometers such as the Actigraph
GT1M and RT3 with the potential of offering advanced measurement features in the future
Additional work is warranted to further refine the adult cut points and to develop cut points for
other age groups in an effort to calibrate the GENEA across the lifespan Given that the high
resolution sampling of the GENEA allows for advanced data mining (eg extraction of
18
18
frequency domain features) future research should strive to classifyrecognize activities of daily
living
Acknowledgments
This research was supported by a grant from Unilever Discover Colworth Bedford UK The
authors would like to thank the participants the graduate research assistants and the
administrative staff of the School of Sport and Health Sciences for their dedication to this
research project
Conflict of Interest
The results of the present study do not constitute endorsement by the authors or ACSM of
the products described in this paper This research was funded by an unrestricted research grant
awarded by Unilever Discover to the School of Sport and Health Sciences University of Exeter
The grant funded the salary of DE and small portions of the salaries of AR and RE At the time
of this research TH and MC were both employed by Unilever Discover However at the time of
manuscript submission MC and DE have no further relationship with Unilever Discover or any
of its operating companies None of the authors have a conflict of interest with Oralinsights the
manufacturer of the technology on which this manuscript is based
19
19
References
1 Bouten CV Koekkoek KT Verduin M Kodde R Janssen JD A triaxial accelerometer and
portable data processing unit for the assessment of daily physical activity IEEE Trans
Biomed Eng 199744(3)136-47
2 Brage S Brage N Wedderkopp N Froberg K Reliability and validity of the Computer
Science and Applications accelerometer in a mechanical setting Measurement in Physical
Education and Exercise Science 20037(2)101-19
3 Chu EY McManus AM Yu CC Calibration of the RT3 accelerometer for ambulation and
nonambulation in children Med Sci Sports Exerc 200739(11)2085-91
4 Esliger DW and Tremblay MS Physical activity and inactivity profiling the next generation
Can J Public Health 200798 Suppl 2S195-S207
5 Esliger DW and Tremblay MS Technical reliability assessment of three accelerometer
models in a mechanical setup Med Sci Sports Exerc 200638(12)2173-81
6 Evenson KR Catellier DJ Gill K Ondrak KS McMurray RG Calibration of two objective
measures of physical activity for children J Sports Sci 20081-9
7 Fruin ML and Rankin JW Validity of a multi-sensor armband in estimating rest and exercise
energy expenditure Med Sci Sports Exerc 200436(6)1063-9
8 Gizatullin AO and Edge KA Adaptive control for a multi-axis hydraulic test rig
Proceedings of the Institution of Mechanical Engineers Part I Journal of Systems and
Control Engineering 2007221(2)183-98
9 Grant PM Ryan CG Tigbe WW Granat MH The validation of a novel activity monitor in
the measurement of posture and motion during everyday activities Br J Sports Med
200640(12)992-7
10 Jago R Zakeri I Baranowski T Watson K Decision boundaries and receiver operating
characteristic curves new methods for determining accelerometer cutpoints J Sports Sci
200725(8)937-44
20
20
11 Karantonis DM Narayanan MR Mathie M Lovell NH Celler BG Implementation of a
real-time human movement classifier using a triaxial accelerometer for ambulatory
monitoring IEEE Trans Inf Technol Biomed 200610(1)156-67
12 Krasnoff JB Kohn MA Choy FK Doyle J Johansen K Painter PL Interunit and
intraunit reliability of the RT3 triaxial accelerometer J Phys Act Health 20085(4)527-38
13 McLaughlin JE King GA Howley ET Bassett DR Jr Ainsworth BE Validation of the
COSMED K4 b2 portable metabolic system Int J Sports Med 200122(4)280-4
14 McManus IC and Hartigan A Declining left-handedness in Victorian England seen in the
films of Mitchell and Kenyon Curr Biol 200717(18)R793-R794
15 Metcalf BS Curnow JS Evans C Voss LD Wilkin TJ Technical reliability of the CSA
activity monitor The EarlyBird Study Med Sci Sports Exerc 200234(9)1533-7
16 Moeller NC Korsholm L Kristensen PL Andersen LB Wedderkopp N Froberg K
Unit-specific calibration of Actigraph accelerometers in a mechanical setup - is it worth the
effort The effect on random output variation caused by technical inter-instrument variability
in the laboratory and in the field BMC Med Res Methodol 2008819
17 Montoye HJ Kemper HCG Saris WHM Washburn RA Measuring Physical Activity
and Energy Expenditure Champaign IL Human Kinetics 1996
18 Perkins NJ and Schisterman EF The inconsistency of optimal cutpoints obtained using
two criteria based on the receiver operating characteristic curve Am J Epidemiol
2006163(7)670-5
19 Porcari J McCarron R Kline G Freedson PS Ward A Ross JA Rippe JM Is fast
walking an adequate aerobic training stimulus for 30- to 69-year-old men and women
Physician Sportsmed 198715(2)119-29
20 Powell SM Jones DI Rowlands AV Technical variability of the RT3 accelerometer
Med Sci Sports Exerc 200335(10)1773-8
21 Rennie KL and Jebb SA Prevalence of obesity in Great Britain Obes Rev 20056(1)11-
2
21
21
22 Rothney MP Apker GA Song Y Chen KY Comparing the performance of three
generations of ActiGraph accelerometers J Appl Physiol 2008105(4)1091-7
23 Shephard RJ Absolute versus relative intensity of physical activity in a dose-response
context Med Sci Sports Exerc 200133(6 Suppl)S400-S418
24 Silva P Esliger DW Welk GJ Mota J Technical reliability assessment of the Actigraph
GT1M accelerometer Measurement in Physical Education and Exercise Science
20101479-91
25 Sirard JR Trost SG Pfeiffer KA Dowda M Pate RR Calibration and evaluation of an
objective measure of physical activity in preschool children Journal of Physical Activity and
Health 20053345-57
26 Van Hees V Slootmaker SM De GG Van MW Van Lummel RC Reproducibility of a
triaxial seismic accelerometer (DynaPort) Med Sci Sports Exerc 200941(4)810-7
27 Warburton DE Katzmarzyk PT Rhodes RE Shephard RJ Evidence-informed physical
activity guidelines for Canadian adults Can J Public Health 200798 Suppl 2S16-S68
28 Ware LJ Hurling R Bataveljic O Fairley BW Hurst TL Murray P Rennie KL
Tomkins CE Finn A Cobain MR Pearson DA Foreyt JP Rates and determinants of uptake
and use of an internet physical activity and weight management program in office and
manufacturing work sites in England cohort study J Med Internet Res 200810(4)e56
29 Welk G Physical Activity Assessments for Health-Related Research Champaign IL Human Kinetics 2002
30 Welk GJ Principles of design and analyses for the calibration of accelerometry-based
activity monitors Med Sci Sports Exerc 200537(11 Suppl)S501-S511
31 Welk GJ Eisenmann JC Schaben J Trost SG Dale D Calibration of the biotrainer pro
activity monitor in children Pediatr Exerc Sci 200719(2)145-58
32 Zhang K Werner P Sun M Pi-Sunyer FX Boozer CN Measurement of human daily
physical activity Obes Res 200311(1)33-40
22
22
Figure Captions
Figure 1 Inset right Overhead view of GENEA accelerometers positioned in the test jig Inset
left Multi-Axis Shaker Table (MAST) complete with the test jig secured in place Main Figure
Comparison of a typical output trace from one GENEA accelerometer across the 15 test
conditions
Notes i) the trace represents the middle 50 seconds of each of the 15 conditions
Figure 2 Relationship between physical activity intensity (METS) versus the outputs from the
waist worn GENEA SVMgs (g middot minutes) RT3 (countsminute) and Actigraph (countsmin)
accelerometers across the 16 activity conditions
Table 1 Reliability results for the GENEA for all 15 test conditions
Acceleration Frequency Amplitude GENEA SVMgs
(g ∙ seconds)
CV intra
CV inter
g (mmiddots-2
) (Hz) (m) Mean SD GENEA GENEA
005 049 10 00124 3 01 39 53
022 216 10 00547 11 02 17 20
046 451 30 00127 23 02 08 14
046 451 25 00183 24 02 09 14
048 471 20 00298 25 03 10 14
049 481 15 00541 25 03 11 16
079 775 50 00079 41 04 10 15
091 893 30 00251 46 04 08 13
125 1226 45 00153 57 08 15 21
129 1265 40 00200 58 08 13 20
131 1285 35 00266 59 12 21 26
138 1354 30 00381 60 06 10 18
168 1648 45 00206 64 22 34 37
184 1805 30 00508 66 09 13 22
252 2472 45 00309 84 43 51 53
Average variability across all 15 test conditions 18 24
Table 1
Table 2 Descriptive characteristics of the study participants
Gender Sample
Size Age
Left
Handed
Right
Handed
Height
(cm)
Weight
(kg)
BMI
(kg∙m-2
)
Body Fat
()
Male 23 489 (68) 1 22 1762 (62) 806 (116) 259 (27) 207 (34)
Female 37 496 (64) 4 33 1628 (54) 629 (84) 238 (35) 328 (66)
Overall 60 494 (65) 5 55 1679 (87) 697 (130) 246 (34) 282 (81)
for the measurement of body fat there were 2 less participants (1 male and 1 female)
Table 2
Table 3 Average intensity (METS) and average left right and waist positioned GENEA output by activity
GENEA
(SVMgs (g middot minutes)
Actigraph (CountsMinute)
RT3 (VM CountsMinute)
Activity Grouping
N METS Left Wrist Right Wrist Waist Waist Waist
Mean SD Mean SD Mean SD Mean SD Mean SD Mean SD
Lateral Recumbent (lying on side) Posture
(all)
53 094 023 63 55 143 53 34 17 0 0 4 11
Seated Computer Work 55 122 029 185 86 242 67 48 33 1 3 9 21
Standing 55 113 025 100 66 103 177 48 15 0 0 3 9
Window Washing Lifestyle
(2 of 4)dagger
31 337 106 469 693 1808 708 185 61 138 177 463 344
Washing Dishes 24 235 045 634 177 768 239 132 164 51 80 160 74
Shelf Stacking 30 419 098 884 224 940 202 214 72 2620 1933 421 297
Sweeping 23 339 067 878 264 976 289 187 48 465 355 356 96
Slow Treadmill Walk (4 km∙hr-1
) Ambulatory
(all)
54 388 069 864 195 847 232 856 221 2323 643 1267 318
Medium Treadmill Walk (5 km∙hr-1
) 55 459 079 1177 299 1204 357 1264 214 3745 656 1659 331
Brisk Treadmill Walk (6 km∙hr-1
) 55 588 098 1506 400 1513 350 1815 272 4917 940 2228 450
Stair AscentDescent (80 steps∙min-1
) Stairs (all) 55 619 110 836 620 794 597 697 127 2427 780 811 208
Slow Treadmill Run (8 km∙hr-1
) Ambulatory
(1 of 3)Dagger
18 1113 138 3858 588 4087 798 3553 593 8936 1794 4578 799
Medium Treadmill Run (10 km∙hr-1
) 14 1200 124 5345 1073 4915 787 4043 325 8904 1826 5419 423
Fast Treadmill Run (12 km∙hr-1
) 5 1361 060 5096 2339 5358 2460 4066 299 6982 3233 6093 674
Brisk Free-living Walk (6 km∙hr-1
) Ambulatory
(all) 40 576 094 1433 171 1474 216 1769 227 4912 748 2434 559
Medium Free-living Run (10 km∙hr-1
) Ambulatory
(optional) 5 1262 117 5151 1113 4844 1232 3756 631 8825 1592 5525 787
listwise sample size dagger indicates that participants were randomly allocated 2 out of the 4 activities in this grouping
Dagger indicates that participants had the option to run (select 1 out of the 3 activities in this grouping) if they so chose
Note 1 MET = 35 ml∙kg∙min-1
Table 3
Table 4 Sensitivity specificity area under the ROC curve and GENEA SVMgs (g middot minutes)
cut points that maximized sensitivity and specificity at three wear positions
Intensity Sensitivity Specificity Area under ROC
curve (95 CI)
GENEA Cut points
SVMgs (g middot minutes)
Left Wrist
Sedentary 97 95 098 (098-099) lt 217
Light NA NA NA 217-644
Moderate 95 72 091 (088-093) 645-1810
Vigorous 78 98 091 (086-095) gt 1810
Right Wrist
Sedentary 99 96 098 (097-099) lt 386
Light NA NA NA 386-439
Moderate 100 56 084 (0-81-087) 440-2098
Vigorous 78 97 089 (084-094) gt 2098
Waist
Sedentary 99 96 097 (096-098) lt 77
Light NA NA NA 77-219
Moderate 96 80 093 (091-095) 220-2056
Vigorous 73 99 092 (088-096) gt 2056
Sedentary (lt15 METS) light (15-399 METS) moderate (400-699 METS) vigorous (7+
METS)
NA = not applicable as the sedentary and moderate cut points provide the boundaries for the light
intensity category
Table 4
0
10
20
30
40
50
60
70
80
90
100
GE
NE
A
SV
Mg
s (g
s
eco
nd
s)
Condition1 2 3 4 5 6 7 8 9 10 11 12 13 14 15
Figure 1
GENEA SVMgs (g minutes)
Figure 2
15
15
was virtually identical to that of the Actigraph and RT3 Similarly high levels of criterion
validity were shown by Bouten et al (1) during the development of their novel triaxial
accelerometer The GENEA also demonstrated high levels of concurrent validity compared to
the Actigraph GT1M and the RT3 with the highest correlations between the triaxial devices
These data illustrate that the GENEA is comparable to peer accelerometers a result that is
confirmed in the graphical representation of the data in Figure 2 However a closer look
suggests that the GENEA data are less variable than the RT3 and Actigraph across the intensity
spectrum Although speculative the tighter clustering of data within activities may provide
greater success for the GENEA when pursuing alternative analytical approaches For example
the tighter clustering of data within activities in the GENEA should allow for more optimal
activity classification (ie the determination of the mode of physical activity)
Paragraph Number 25 The GENEA SVMgs (g ∙ minutes) cut points established in this
study demonstrated excellent accuracy for classifying physical activity intensity across the
intensity spectrum Because this is the first article to report cut points for the GENEA it is not
possible to compare these values with other studies Although the accuracy of the GENEA was
greatest at the waist it also performed well at the wrist with the left wrist being more accurate
than the right The diminished accuracy experienced on the right wrist was likely due to
differences in participant handedness that is extraneous movements recorded during the activity
conditions were more likely to occur on the right wrist (eg scratching adjusting
clothingglasses hand gestures) However given small number of left handed participants (n=5)
testing of the hypothesis was untenable However it may be that activity signatures obtained
from the right wrist (dominant for over 80 of the population) may prove more useful than the
left (non-dominant) wrist Future research should specifically address this issue so that users
16
16
especially left handed users may know if wearing the GENEA on the right hand is possible The
small size of the GENEA and the fact that it can be positioned at the wrist a location intuitively
less obtrusive than the waist may help rectify issues related to participant compliance in future
studies and may allow for studies with extended physical activity monitoring periods (28)
Paragraph Number 26 Strengths and Limitations Several strengths are noteworthy in the
present study The first strength was the use of a mechanical shaker to perform a preliminary
technical reliability and validity assessment on the GENEA The use of this well controlled
experimental setup allowed for a robust assessment of this new technology Next the GENEA
output was collected analyzed and presented in a non-proprietary SI unit and as such can be
compared with other devices that retainemploy classical physics based measurements Next
ROC curve analysis was chosen to determine the physical activity intensity cut points which is
known to be superior to previous accelerometer calibration methods that employed linear
regression approaches (see Jago et al (10) for a more thorough discussion on this topic) To
date only four studies have employed ROC curve analysis to generate cut points and these were
done on children (3 6 10 31) A further strength of the ROC curve analyses was that the cut
points were chosen to optimize the balance between sensitivity and specificity (ie point nearest
01 on the ROC curve) which in all analyses also coincided with the Youden index ensuring the
optimality of the cut points The intuitive interpretation of the Youden index is that it is the point
on the curve farthest from chance (18) Finally the comparison to two widely used peer
technologies also strengthens the study as does the fact that energy expenditure (mlmiddotkg-1
middotmin-1
)
rather than direct observation was used to provide a continuous objective and physiologically
meaningful dependent variable with which to compare the GENEA data (25)
17
17
Paragraph Number 27 Several limitations of this study should be acknowledged First
the preliminary technical reliability and validity assessment was only performed on one axis the
vertical leaving the performance of the other two axes uncharacterized Next the comparison of
the GENEA would have been more appropriate with the triaxial Actigraph GT3X rather than the
GT1M accelerometer however at the time of this study the newer Actigraphs were not part of
our accelerometer inventory Next although our sample includes men and women of differing
ages and body size our population may not be representative Larger and more variable samples
(eg more left handed more overweight and obese participants) are needed to determine if these
factors might modify our findings In addition the activity conditions selected in this study may
not represent the full complement of activities undertaken by a population therefore caution
must be used when generalizing these results to other groups Finally cross-validation of the
GENEA physical activity intensity cut points by other research groups in different adult
populations is warranted
CONCLUSION
Paragraph Number 28 The GENEA demonstrated excellent technical reliability and validity and
excellent criterion validity compared to VO2 The GENEA cut points established in this study
can be used to estimate the time spent in sedentary light moderate and vigorous intensity
physical activity in adults As a result the GENEA has established itself as an objective and
feasible measurement tool comparable to other peer accelerometers such as the Actigraph
GT1M and RT3 with the potential of offering advanced measurement features in the future
Additional work is warranted to further refine the adult cut points and to develop cut points for
other age groups in an effort to calibrate the GENEA across the lifespan Given that the high
resolution sampling of the GENEA allows for advanced data mining (eg extraction of
18
18
frequency domain features) future research should strive to classifyrecognize activities of daily
living
Acknowledgments
This research was supported by a grant from Unilever Discover Colworth Bedford UK The
authors would like to thank the participants the graduate research assistants and the
administrative staff of the School of Sport and Health Sciences for their dedication to this
research project
Conflict of Interest
The results of the present study do not constitute endorsement by the authors or ACSM of
the products described in this paper This research was funded by an unrestricted research grant
awarded by Unilever Discover to the School of Sport and Health Sciences University of Exeter
The grant funded the salary of DE and small portions of the salaries of AR and RE At the time
of this research TH and MC were both employed by Unilever Discover However at the time of
manuscript submission MC and DE have no further relationship with Unilever Discover or any
of its operating companies None of the authors have a conflict of interest with Oralinsights the
manufacturer of the technology on which this manuscript is based
19
19
References
1 Bouten CV Koekkoek KT Verduin M Kodde R Janssen JD A triaxial accelerometer and
portable data processing unit for the assessment of daily physical activity IEEE Trans
Biomed Eng 199744(3)136-47
2 Brage S Brage N Wedderkopp N Froberg K Reliability and validity of the Computer
Science and Applications accelerometer in a mechanical setting Measurement in Physical
Education and Exercise Science 20037(2)101-19
3 Chu EY McManus AM Yu CC Calibration of the RT3 accelerometer for ambulation and
nonambulation in children Med Sci Sports Exerc 200739(11)2085-91
4 Esliger DW and Tremblay MS Physical activity and inactivity profiling the next generation
Can J Public Health 200798 Suppl 2S195-S207
5 Esliger DW and Tremblay MS Technical reliability assessment of three accelerometer
models in a mechanical setup Med Sci Sports Exerc 200638(12)2173-81
6 Evenson KR Catellier DJ Gill K Ondrak KS McMurray RG Calibration of two objective
measures of physical activity for children J Sports Sci 20081-9
7 Fruin ML and Rankin JW Validity of a multi-sensor armband in estimating rest and exercise
energy expenditure Med Sci Sports Exerc 200436(6)1063-9
8 Gizatullin AO and Edge KA Adaptive control for a multi-axis hydraulic test rig
Proceedings of the Institution of Mechanical Engineers Part I Journal of Systems and
Control Engineering 2007221(2)183-98
9 Grant PM Ryan CG Tigbe WW Granat MH The validation of a novel activity monitor in
the measurement of posture and motion during everyday activities Br J Sports Med
200640(12)992-7
10 Jago R Zakeri I Baranowski T Watson K Decision boundaries and receiver operating
characteristic curves new methods for determining accelerometer cutpoints J Sports Sci
200725(8)937-44
20
20
11 Karantonis DM Narayanan MR Mathie M Lovell NH Celler BG Implementation of a
real-time human movement classifier using a triaxial accelerometer for ambulatory
monitoring IEEE Trans Inf Technol Biomed 200610(1)156-67
12 Krasnoff JB Kohn MA Choy FK Doyle J Johansen K Painter PL Interunit and
intraunit reliability of the RT3 triaxial accelerometer J Phys Act Health 20085(4)527-38
13 McLaughlin JE King GA Howley ET Bassett DR Jr Ainsworth BE Validation of the
COSMED K4 b2 portable metabolic system Int J Sports Med 200122(4)280-4
14 McManus IC and Hartigan A Declining left-handedness in Victorian England seen in the
films of Mitchell and Kenyon Curr Biol 200717(18)R793-R794
15 Metcalf BS Curnow JS Evans C Voss LD Wilkin TJ Technical reliability of the CSA
activity monitor The EarlyBird Study Med Sci Sports Exerc 200234(9)1533-7
16 Moeller NC Korsholm L Kristensen PL Andersen LB Wedderkopp N Froberg K
Unit-specific calibration of Actigraph accelerometers in a mechanical setup - is it worth the
effort The effect on random output variation caused by technical inter-instrument variability
in the laboratory and in the field BMC Med Res Methodol 2008819
17 Montoye HJ Kemper HCG Saris WHM Washburn RA Measuring Physical Activity
and Energy Expenditure Champaign IL Human Kinetics 1996
18 Perkins NJ and Schisterman EF The inconsistency of optimal cutpoints obtained using
two criteria based on the receiver operating characteristic curve Am J Epidemiol
2006163(7)670-5
19 Porcari J McCarron R Kline G Freedson PS Ward A Ross JA Rippe JM Is fast
walking an adequate aerobic training stimulus for 30- to 69-year-old men and women
Physician Sportsmed 198715(2)119-29
20 Powell SM Jones DI Rowlands AV Technical variability of the RT3 accelerometer
Med Sci Sports Exerc 200335(10)1773-8
21 Rennie KL and Jebb SA Prevalence of obesity in Great Britain Obes Rev 20056(1)11-
2
21
21
22 Rothney MP Apker GA Song Y Chen KY Comparing the performance of three
generations of ActiGraph accelerometers J Appl Physiol 2008105(4)1091-7
23 Shephard RJ Absolute versus relative intensity of physical activity in a dose-response
context Med Sci Sports Exerc 200133(6 Suppl)S400-S418
24 Silva P Esliger DW Welk GJ Mota J Technical reliability assessment of the Actigraph
GT1M accelerometer Measurement in Physical Education and Exercise Science
20101479-91
25 Sirard JR Trost SG Pfeiffer KA Dowda M Pate RR Calibration and evaluation of an
objective measure of physical activity in preschool children Journal of Physical Activity and
Health 20053345-57
26 Van Hees V Slootmaker SM De GG Van MW Van Lummel RC Reproducibility of a
triaxial seismic accelerometer (DynaPort) Med Sci Sports Exerc 200941(4)810-7
27 Warburton DE Katzmarzyk PT Rhodes RE Shephard RJ Evidence-informed physical
activity guidelines for Canadian adults Can J Public Health 200798 Suppl 2S16-S68
28 Ware LJ Hurling R Bataveljic O Fairley BW Hurst TL Murray P Rennie KL
Tomkins CE Finn A Cobain MR Pearson DA Foreyt JP Rates and determinants of uptake
and use of an internet physical activity and weight management program in office and
manufacturing work sites in England cohort study J Med Internet Res 200810(4)e56
29 Welk G Physical Activity Assessments for Health-Related Research Champaign IL Human Kinetics 2002
30 Welk GJ Principles of design and analyses for the calibration of accelerometry-based
activity monitors Med Sci Sports Exerc 200537(11 Suppl)S501-S511
31 Welk GJ Eisenmann JC Schaben J Trost SG Dale D Calibration of the biotrainer pro
activity monitor in children Pediatr Exerc Sci 200719(2)145-58
32 Zhang K Werner P Sun M Pi-Sunyer FX Boozer CN Measurement of human daily
physical activity Obes Res 200311(1)33-40
22
22
Figure Captions
Figure 1 Inset right Overhead view of GENEA accelerometers positioned in the test jig Inset
left Multi-Axis Shaker Table (MAST) complete with the test jig secured in place Main Figure
Comparison of a typical output trace from one GENEA accelerometer across the 15 test
conditions
Notes i) the trace represents the middle 50 seconds of each of the 15 conditions
Figure 2 Relationship between physical activity intensity (METS) versus the outputs from the
waist worn GENEA SVMgs (g middot minutes) RT3 (countsminute) and Actigraph (countsmin)
accelerometers across the 16 activity conditions
Table 1 Reliability results for the GENEA for all 15 test conditions
Acceleration Frequency Amplitude GENEA SVMgs
(g ∙ seconds)
CV intra
CV inter
g (mmiddots-2
) (Hz) (m) Mean SD GENEA GENEA
005 049 10 00124 3 01 39 53
022 216 10 00547 11 02 17 20
046 451 30 00127 23 02 08 14
046 451 25 00183 24 02 09 14
048 471 20 00298 25 03 10 14
049 481 15 00541 25 03 11 16
079 775 50 00079 41 04 10 15
091 893 30 00251 46 04 08 13
125 1226 45 00153 57 08 15 21
129 1265 40 00200 58 08 13 20
131 1285 35 00266 59 12 21 26
138 1354 30 00381 60 06 10 18
168 1648 45 00206 64 22 34 37
184 1805 30 00508 66 09 13 22
252 2472 45 00309 84 43 51 53
Average variability across all 15 test conditions 18 24
Table 1
Table 2 Descriptive characteristics of the study participants
Gender Sample
Size Age
Left
Handed
Right
Handed
Height
(cm)
Weight
(kg)
BMI
(kg∙m-2
)
Body Fat
()
Male 23 489 (68) 1 22 1762 (62) 806 (116) 259 (27) 207 (34)
Female 37 496 (64) 4 33 1628 (54) 629 (84) 238 (35) 328 (66)
Overall 60 494 (65) 5 55 1679 (87) 697 (130) 246 (34) 282 (81)
for the measurement of body fat there were 2 less participants (1 male and 1 female)
Table 2
Table 3 Average intensity (METS) and average left right and waist positioned GENEA output by activity
GENEA
(SVMgs (g middot minutes)
Actigraph (CountsMinute)
RT3 (VM CountsMinute)
Activity Grouping
N METS Left Wrist Right Wrist Waist Waist Waist
Mean SD Mean SD Mean SD Mean SD Mean SD Mean SD
Lateral Recumbent (lying on side) Posture
(all)
53 094 023 63 55 143 53 34 17 0 0 4 11
Seated Computer Work 55 122 029 185 86 242 67 48 33 1 3 9 21
Standing 55 113 025 100 66 103 177 48 15 0 0 3 9
Window Washing Lifestyle
(2 of 4)dagger
31 337 106 469 693 1808 708 185 61 138 177 463 344
Washing Dishes 24 235 045 634 177 768 239 132 164 51 80 160 74
Shelf Stacking 30 419 098 884 224 940 202 214 72 2620 1933 421 297
Sweeping 23 339 067 878 264 976 289 187 48 465 355 356 96
Slow Treadmill Walk (4 km∙hr-1
) Ambulatory
(all)
54 388 069 864 195 847 232 856 221 2323 643 1267 318
Medium Treadmill Walk (5 km∙hr-1
) 55 459 079 1177 299 1204 357 1264 214 3745 656 1659 331
Brisk Treadmill Walk (6 km∙hr-1
) 55 588 098 1506 400 1513 350 1815 272 4917 940 2228 450
Stair AscentDescent (80 steps∙min-1
) Stairs (all) 55 619 110 836 620 794 597 697 127 2427 780 811 208
Slow Treadmill Run (8 km∙hr-1
) Ambulatory
(1 of 3)Dagger
18 1113 138 3858 588 4087 798 3553 593 8936 1794 4578 799
Medium Treadmill Run (10 km∙hr-1
) 14 1200 124 5345 1073 4915 787 4043 325 8904 1826 5419 423
Fast Treadmill Run (12 km∙hr-1
) 5 1361 060 5096 2339 5358 2460 4066 299 6982 3233 6093 674
Brisk Free-living Walk (6 km∙hr-1
) Ambulatory
(all) 40 576 094 1433 171 1474 216 1769 227 4912 748 2434 559
Medium Free-living Run (10 km∙hr-1
) Ambulatory
(optional) 5 1262 117 5151 1113 4844 1232 3756 631 8825 1592 5525 787
listwise sample size dagger indicates that participants were randomly allocated 2 out of the 4 activities in this grouping
Dagger indicates that participants had the option to run (select 1 out of the 3 activities in this grouping) if they so chose
Note 1 MET = 35 ml∙kg∙min-1
Table 3
Table 4 Sensitivity specificity area under the ROC curve and GENEA SVMgs (g middot minutes)
cut points that maximized sensitivity and specificity at three wear positions
Intensity Sensitivity Specificity Area under ROC
curve (95 CI)
GENEA Cut points
SVMgs (g middot minutes)
Left Wrist
Sedentary 97 95 098 (098-099) lt 217
Light NA NA NA 217-644
Moderate 95 72 091 (088-093) 645-1810
Vigorous 78 98 091 (086-095) gt 1810
Right Wrist
Sedentary 99 96 098 (097-099) lt 386
Light NA NA NA 386-439
Moderate 100 56 084 (0-81-087) 440-2098
Vigorous 78 97 089 (084-094) gt 2098
Waist
Sedentary 99 96 097 (096-098) lt 77
Light NA NA NA 77-219
Moderate 96 80 093 (091-095) 220-2056
Vigorous 73 99 092 (088-096) gt 2056
Sedentary (lt15 METS) light (15-399 METS) moderate (400-699 METS) vigorous (7+
METS)
NA = not applicable as the sedentary and moderate cut points provide the boundaries for the light
intensity category
Table 4
0
10
20
30
40
50
60
70
80
90
100
GE
NE
A
SV
Mg
s (g
s
eco
nd
s)
Condition1 2 3 4 5 6 7 8 9 10 11 12 13 14 15
Figure 1
GENEA SVMgs (g minutes)
Figure 2
16
16
especially left handed users may know if wearing the GENEA on the right hand is possible The
small size of the GENEA and the fact that it can be positioned at the wrist a location intuitively
less obtrusive than the waist may help rectify issues related to participant compliance in future
studies and may allow for studies with extended physical activity monitoring periods (28)
Paragraph Number 26 Strengths and Limitations Several strengths are noteworthy in the
present study The first strength was the use of a mechanical shaker to perform a preliminary
technical reliability and validity assessment on the GENEA The use of this well controlled
experimental setup allowed for a robust assessment of this new technology Next the GENEA
output was collected analyzed and presented in a non-proprietary SI unit and as such can be
compared with other devices that retainemploy classical physics based measurements Next
ROC curve analysis was chosen to determine the physical activity intensity cut points which is
known to be superior to previous accelerometer calibration methods that employed linear
regression approaches (see Jago et al (10) for a more thorough discussion on this topic) To
date only four studies have employed ROC curve analysis to generate cut points and these were
done on children (3 6 10 31) A further strength of the ROC curve analyses was that the cut
points were chosen to optimize the balance between sensitivity and specificity (ie point nearest
01 on the ROC curve) which in all analyses also coincided with the Youden index ensuring the
optimality of the cut points The intuitive interpretation of the Youden index is that it is the point
on the curve farthest from chance (18) Finally the comparison to two widely used peer
technologies also strengthens the study as does the fact that energy expenditure (mlmiddotkg-1
middotmin-1
)
rather than direct observation was used to provide a continuous objective and physiologically
meaningful dependent variable with which to compare the GENEA data (25)
17
17
Paragraph Number 27 Several limitations of this study should be acknowledged First
the preliminary technical reliability and validity assessment was only performed on one axis the
vertical leaving the performance of the other two axes uncharacterized Next the comparison of
the GENEA would have been more appropriate with the triaxial Actigraph GT3X rather than the
GT1M accelerometer however at the time of this study the newer Actigraphs were not part of
our accelerometer inventory Next although our sample includes men and women of differing
ages and body size our population may not be representative Larger and more variable samples
(eg more left handed more overweight and obese participants) are needed to determine if these
factors might modify our findings In addition the activity conditions selected in this study may
not represent the full complement of activities undertaken by a population therefore caution
must be used when generalizing these results to other groups Finally cross-validation of the
GENEA physical activity intensity cut points by other research groups in different adult
populations is warranted
CONCLUSION
Paragraph Number 28 The GENEA demonstrated excellent technical reliability and validity and
excellent criterion validity compared to VO2 The GENEA cut points established in this study
can be used to estimate the time spent in sedentary light moderate and vigorous intensity
physical activity in adults As a result the GENEA has established itself as an objective and
feasible measurement tool comparable to other peer accelerometers such as the Actigraph
GT1M and RT3 with the potential of offering advanced measurement features in the future
Additional work is warranted to further refine the adult cut points and to develop cut points for
other age groups in an effort to calibrate the GENEA across the lifespan Given that the high
resolution sampling of the GENEA allows for advanced data mining (eg extraction of
18
18
frequency domain features) future research should strive to classifyrecognize activities of daily
living
Acknowledgments
This research was supported by a grant from Unilever Discover Colworth Bedford UK The
authors would like to thank the participants the graduate research assistants and the
administrative staff of the School of Sport and Health Sciences for their dedication to this
research project
Conflict of Interest
The results of the present study do not constitute endorsement by the authors or ACSM of
the products described in this paper This research was funded by an unrestricted research grant
awarded by Unilever Discover to the School of Sport and Health Sciences University of Exeter
The grant funded the salary of DE and small portions of the salaries of AR and RE At the time
of this research TH and MC were both employed by Unilever Discover However at the time of
manuscript submission MC and DE have no further relationship with Unilever Discover or any
of its operating companies None of the authors have a conflict of interest with Oralinsights the
manufacturer of the technology on which this manuscript is based
19
19
References
1 Bouten CV Koekkoek KT Verduin M Kodde R Janssen JD A triaxial accelerometer and
portable data processing unit for the assessment of daily physical activity IEEE Trans
Biomed Eng 199744(3)136-47
2 Brage S Brage N Wedderkopp N Froberg K Reliability and validity of the Computer
Science and Applications accelerometer in a mechanical setting Measurement in Physical
Education and Exercise Science 20037(2)101-19
3 Chu EY McManus AM Yu CC Calibration of the RT3 accelerometer for ambulation and
nonambulation in children Med Sci Sports Exerc 200739(11)2085-91
4 Esliger DW and Tremblay MS Physical activity and inactivity profiling the next generation
Can J Public Health 200798 Suppl 2S195-S207
5 Esliger DW and Tremblay MS Technical reliability assessment of three accelerometer
models in a mechanical setup Med Sci Sports Exerc 200638(12)2173-81
6 Evenson KR Catellier DJ Gill K Ondrak KS McMurray RG Calibration of two objective
measures of physical activity for children J Sports Sci 20081-9
7 Fruin ML and Rankin JW Validity of a multi-sensor armband in estimating rest and exercise
energy expenditure Med Sci Sports Exerc 200436(6)1063-9
8 Gizatullin AO and Edge KA Adaptive control for a multi-axis hydraulic test rig
Proceedings of the Institution of Mechanical Engineers Part I Journal of Systems and
Control Engineering 2007221(2)183-98
9 Grant PM Ryan CG Tigbe WW Granat MH The validation of a novel activity monitor in
the measurement of posture and motion during everyday activities Br J Sports Med
200640(12)992-7
10 Jago R Zakeri I Baranowski T Watson K Decision boundaries and receiver operating
characteristic curves new methods for determining accelerometer cutpoints J Sports Sci
200725(8)937-44
20
20
11 Karantonis DM Narayanan MR Mathie M Lovell NH Celler BG Implementation of a
real-time human movement classifier using a triaxial accelerometer for ambulatory
monitoring IEEE Trans Inf Technol Biomed 200610(1)156-67
12 Krasnoff JB Kohn MA Choy FK Doyle J Johansen K Painter PL Interunit and
intraunit reliability of the RT3 triaxial accelerometer J Phys Act Health 20085(4)527-38
13 McLaughlin JE King GA Howley ET Bassett DR Jr Ainsworth BE Validation of the
COSMED K4 b2 portable metabolic system Int J Sports Med 200122(4)280-4
14 McManus IC and Hartigan A Declining left-handedness in Victorian England seen in the
films of Mitchell and Kenyon Curr Biol 200717(18)R793-R794
15 Metcalf BS Curnow JS Evans C Voss LD Wilkin TJ Technical reliability of the CSA
activity monitor The EarlyBird Study Med Sci Sports Exerc 200234(9)1533-7
16 Moeller NC Korsholm L Kristensen PL Andersen LB Wedderkopp N Froberg K
Unit-specific calibration of Actigraph accelerometers in a mechanical setup - is it worth the
effort The effect on random output variation caused by technical inter-instrument variability
in the laboratory and in the field BMC Med Res Methodol 2008819
17 Montoye HJ Kemper HCG Saris WHM Washburn RA Measuring Physical Activity
and Energy Expenditure Champaign IL Human Kinetics 1996
18 Perkins NJ and Schisterman EF The inconsistency of optimal cutpoints obtained using
two criteria based on the receiver operating characteristic curve Am J Epidemiol
2006163(7)670-5
19 Porcari J McCarron R Kline G Freedson PS Ward A Ross JA Rippe JM Is fast
walking an adequate aerobic training stimulus for 30- to 69-year-old men and women
Physician Sportsmed 198715(2)119-29
20 Powell SM Jones DI Rowlands AV Technical variability of the RT3 accelerometer
Med Sci Sports Exerc 200335(10)1773-8
21 Rennie KL and Jebb SA Prevalence of obesity in Great Britain Obes Rev 20056(1)11-
2
21
21
22 Rothney MP Apker GA Song Y Chen KY Comparing the performance of three
generations of ActiGraph accelerometers J Appl Physiol 2008105(4)1091-7
23 Shephard RJ Absolute versus relative intensity of physical activity in a dose-response
context Med Sci Sports Exerc 200133(6 Suppl)S400-S418
24 Silva P Esliger DW Welk GJ Mota J Technical reliability assessment of the Actigraph
GT1M accelerometer Measurement in Physical Education and Exercise Science
20101479-91
25 Sirard JR Trost SG Pfeiffer KA Dowda M Pate RR Calibration and evaluation of an
objective measure of physical activity in preschool children Journal of Physical Activity and
Health 20053345-57
26 Van Hees V Slootmaker SM De GG Van MW Van Lummel RC Reproducibility of a
triaxial seismic accelerometer (DynaPort) Med Sci Sports Exerc 200941(4)810-7
27 Warburton DE Katzmarzyk PT Rhodes RE Shephard RJ Evidence-informed physical
activity guidelines for Canadian adults Can J Public Health 200798 Suppl 2S16-S68
28 Ware LJ Hurling R Bataveljic O Fairley BW Hurst TL Murray P Rennie KL
Tomkins CE Finn A Cobain MR Pearson DA Foreyt JP Rates and determinants of uptake
and use of an internet physical activity and weight management program in office and
manufacturing work sites in England cohort study J Med Internet Res 200810(4)e56
29 Welk G Physical Activity Assessments for Health-Related Research Champaign IL Human Kinetics 2002
30 Welk GJ Principles of design and analyses for the calibration of accelerometry-based
activity monitors Med Sci Sports Exerc 200537(11 Suppl)S501-S511
31 Welk GJ Eisenmann JC Schaben J Trost SG Dale D Calibration of the biotrainer pro
activity monitor in children Pediatr Exerc Sci 200719(2)145-58
32 Zhang K Werner P Sun M Pi-Sunyer FX Boozer CN Measurement of human daily
physical activity Obes Res 200311(1)33-40
22
22
Figure Captions
Figure 1 Inset right Overhead view of GENEA accelerometers positioned in the test jig Inset
left Multi-Axis Shaker Table (MAST) complete with the test jig secured in place Main Figure
Comparison of a typical output trace from one GENEA accelerometer across the 15 test
conditions
Notes i) the trace represents the middle 50 seconds of each of the 15 conditions
Figure 2 Relationship between physical activity intensity (METS) versus the outputs from the
waist worn GENEA SVMgs (g middot minutes) RT3 (countsminute) and Actigraph (countsmin)
accelerometers across the 16 activity conditions
Table 1 Reliability results for the GENEA for all 15 test conditions
Acceleration Frequency Amplitude GENEA SVMgs
(g ∙ seconds)
CV intra
CV inter
g (mmiddots-2
) (Hz) (m) Mean SD GENEA GENEA
005 049 10 00124 3 01 39 53
022 216 10 00547 11 02 17 20
046 451 30 00127 23 02 08 14
046 451 25 00183 24 02 09 14
048 471 20 00298 25 03 10 14
049 481 15 00541 25 03 11 16
079 775 50 00079 41 04 10 15
091 893 30 00251 46 04 08 13
125 1226 45 00153 57 08 15 21
129 1265 40 00200 58 08 13 20
131 1285 35 00266 59 12 21 26
138 1354 30 00381 60 06 10 18
168 1648 45 00206 64 22 34 37
184 1805 30 00508 66 09 13 22
252 2472 45 00309 84 43 51 53
Average variability across all 15 test conditions 18 24
Table 1
Table 2 Descriptive characteristics of the study participants
Gender Sample
Size Age
Left
Handed
Right
Handed
Height
(cm)
Weight
(kg)
BMI
(kg∙m-2
)
Body Fat
()
Male 23 489 (68) 1 22 1762 (62) 806 (116) 259 (27) 207 (34)
Female 37 496 (64) 4 33 1628 (54) 629 (84) 238 (35) 328 (66)
Overall 60 494 (65) 5 55 1679 (87) 697 (130) 246 (34) 282 (81)
for the measurement of body fat there were 2 less participants (1 male and 1 female)
Table 2
Table 3 Average intensity (METS) and average left right and waist positioned GENEA output by activity
GENEA
(SVMgs (g middot minutes)
Actigraph (CountsMinute)
RT3 (VM CountsMinute)
Activity Grouping
N METS Left Wrist Right Wrist Waist Waist Waist
Mean SD Mean SD Mean SD Mean SD Mean SD Mean SD
Lateral Recumbent (lying on side) Posture
(all)
53 094 023 63 55 143 53 34 17 0 0 4 11
Seated Computer Work 55 122 029 185 86 242 67 48 33 1 3 9 21
Standing 55 113 025 100 66 103 177 48 15 0 0 3 9
Window Washing Lifestyle
(2 of 4)dagger
31 337 106 469 693 1808 708 185 61 138 177 463 344
Washing Dishes 24 235 045 634 177 768 239 132 164 51 80 160 74
Shelf Stacking 30 419 098 884 224 940 202 214 72 2620 1933 421 297
Sweeping 23 339 067 878 264 976 289 187 48 465 355 356 96
Slow Treadmill Walk (4 km∙hr-1
) Ambulatory
(all)
54 388 069 864 195 847 232 856 221 2323 643 1267 318
Medium Treadmill Walk (5 km∙hr-1
) 55 459 079 1177 299 1204 357 1264 214 3745 656 1659 331
Brisk Treadmill Walk (6 km∙hr-1
) 55 588 098 1506 400 1513 350 1815 272 4917 940 2228 450
Stair AscentDescent (80 steps∙min-1
) Stairs (all) 55 619 110 836 620 794 597 697 127 2427 780 811 208
Slow Treadmill Run (8 km∙hr-1
) Ambulatory
(1 of 3)Dagger
18 1113 138 3858 588 4087 798 3553 593 8936 1794 4578 799
Medium Treadmill Run (10 km∙hr-1
) 14 1200 124 5345 1073 4915 787 4043 325 8904 1826 5419 423
Fast Treadmill Run (12 km∙hr-1
) 5 1361 060 5096 2339 5358 2460 4066 299 6982 3233 6093 674
Brisk Free-living Walk (6 km∙hr-1
) Ambulatory
(all) 40 576 094 1433 171 1474 216 1769 227 4912 748 2434 559
Medium Free-living Run (10 km∙hr-1
) Ambulatory
(optional) 5 1262 117 5151 1113 4844 1232 3756 631 8825 1592 5525 787
listwise sample size dagger indicates that participants were randomly allocated 2 out of the 4 activities in this grouping
Dagger indicates that participants had the option to run (select 1 out of the 3 activities in this grouping) if they so chose
Note 1 MET = 35 ml∙kg∙min-1
Table 3
Table 4 Sensitivity specificity area under the ROC curve and GENEA SVMgs (g middot minutes)
cut points that maximized sensitivity and specificity at three wear positions
Intensity Sensitivity Specificity Area under ROC
curve (95 CI)
GENEA Cut points
SVMgs (g middot minutes)
Left Wrist
Sedentary 97 95 098 (098-099) lt 217
Light NA NA NA 217-644
Moderate 95 72 091 (088-093) 645-1810
Vigorous 78 98 091 (086-095) gt 1810
Right Wrist
Sedentary 99 96 098 (097-099) lt 386
Light NA NA NA 386-439
Moderate 100 56 084 (0-81-087) 440-2098
Vigorous 78 97 089 (084-094) gt 2098
Waist
Sedentary 99 96 097 (096-098) lt 77
Light NA NA NA 77-219
Moderate 96 80 093 (091-095) 220-2056
Vigorous 73 99 092 (088-096) gt 2056
Sedentary (lt15 METS) light (15-399 METS) moderate (400-699 METS) vigorous (7+
METS)
NA = not applicable as the sedentary and moderate cut points provide the boundaries for the light
intensity category
Table 4
0
10
20
30
40
50
60
70
80
90
100
GE
NE
A
SV
Mg
s (g
s
eco
nd
s)
Condition1 2 3 4 5 6 7 8 9 10 11 12 13 14 15
Figure 1
GENEA SVMgs (g minutes)
Figure 2
17
17
Paragraph Number 27 Several limitations of this study should be acknowledged First
the preliminary technical reliability and validity assessment was only performed on one axis the
vertical leaving the performance of the other two axes uncharacterized Next the comparison of
the GENEA would have been more appropriate with the triaxial Actigraph GT3X rather than the
GT1M accelerometer however at the time of this study the newer Actigraphs were not part of
our accelerometer inventory Next although our sample includes men and women of differing
ages and body size our population may not be representative Larger and more variable samples
(eg more left handed more overweight and obese participants) are needed to determine if these
factors might modify our findings In addition the activity conditions selected in this study may
not represent the full complement of activities undertaken by a population therefore caution
must be used when generalizing these results to other groups Finally cross-validation of the
GENEA physical activity intensity cut points by other research groups in different adult
populations is warranted
CONCLUSION
Paragraph Number 28 The GENEA demonstrated excellent technical reliability and validity and
excellent criterion validity compared to VO2 The GENEA cut points established in this study
can be used to estimate the time spent in sedentary light moderate and vigorous intensity
physical activity in adults As a result the GENEA has established itself as an objective and
feasible measurement tool comparable to other peer accelerometers such as the Actigraph
GT1M and RT3 with the potential of offering advanced measurement features in the future
Additional work is warranted to further refine the adult cut points and to develop cut points for
other age groups in an effort to calibrate the GENEA across the lifespan Given that the high
resolution sampling of the GENEA allows for advanced data mining (eg extraction of
18
18
frequency domain features) future research should strive to classifyrecognize activities of daily
living
Acknowledgments
This research was supported by a grant from Unilever Discover Colworth Bedford UK The
authors would like to thank the participants the graduate research assistants and the
administrative staff of the School of Sport and Health Sciences for their dedication to this
research project
Conflict of Interest
The results of the present study do not constitute endorsement by the authors or ACSM of
the products described in this paper This research was funded by an unrestricted research grant
awarded by Unilever Discover to the School of Sport and Health Sciences University of Exeter
The grant funded the salary of DE and small portions of the salaries of AR and RE At the time
of this research TH and MC were both employed by Unilever Discover However at the time of
manuscript submission MC and DE have no further relationship with Unilever Discover or any
of its operating companies None of the authors have a conflict of interest with Oralinsights the
manufacturer of the technology on which this manuscript is based
19
19
References
1 Bouten CV Koekkoek KT Verduin M Kodde R Janssen JD A triaxial accelerometer and
portable data processing unit for the assessment of daily physical activity IEEE Trans
Biomed Eng 199744(3)136-47
2 Brage S Brage N Wedderkopp N Froberg K Reliability and validity of the Computer
Science and Applications accelerometer in a mechanical setting Measurement in Physical
Education and Exercise Science 20037(2)101-19
3 Chu EY McManus AM Yu CC Calibration of the RT3 accelerometer for ambulation and
nonambulation in children Med Sci Sports Exerc 200739(11)2085-91
4 Esliger DW and Tremblay MS Physical activity and inactivity profiling the next generation
Can J Public Health 200798 Suppl 2S195-S207
5 Esliger DW and Tremblay MS Technical reliability assessment of three accelerometer
models in a mechanical setup Med Sci Sports Exerc 200638(12)2173-81
6 Evenson KR Catellier DJ Gill K Ondrak KS McMurray RG Calibration of two objective
measures of physical activity for children J Sports Sci 20081-9
7 Fruin ML and Rankin JW Validity of a multi-sensor armband in estimating rest and exercise
energy expenditure Med Sci Sports Exerc 200436(6)1063-9
8 Gizatullin AO and Edge KA Adaptive control for a multi-axis hydraulic test rig
Proceedings of the Institution of Mechanical Engineers Part I Journal of Systems and
Control Engineering 2007221(2)183-98
9 Grant PM Ryan CG Tigbe WW Granat MH The validation of a novel activity monitor in
the measurement of posture and motion during everyday activities Br J Sports Med
200640(12)992-7
10 Jago R Zakeri I Baranowski T Watson K Decision boundaries and receiver operating
characteristic curves new methods for determining accelerometer cutpoints J Sports Sci
200725(8)937-44
20
20
11 Karantonis DM Narayanan MR Mathie M Lovell NH Celler BG Implementation of a
real-time human movement classifier using a triaxial accelerometer for ambulatory
monitoring IEEE Trans Inf Technol Biomed 200610(1)156-67
12 Krasnoff JB Kohn MA Choy FK Doyle J Johansen K Painter PL Interunit and
intraunit reliability of the RT3 triaxial accelerometer J Phys Act Health 20085(4)527-38
13 McLaughlin JE King GA Howley ET Bassett DR Jr Ainsworth BE Validation of the
COSMED K4 b2 portable metabolic system Int J Sports Med 200122(4)280-4
14 McManus IC and Hartigan A Declining left-handedness in Victorian England seen in the
films of Mitchell and Kenyon Curr Biol 200717(18)R793-R794
15 Metcalf BS Curnow JS Evans C Voss LD Wilkin TJ Technical reliability of the CSA
activity monitor The EarlyBird Study Med Sci Sports Exerc 200234(9)1533-7
16 Moeller NC Korsholm L Kristensen PL Andersen LB Wedderkopp N Froberg K
Unit-specific calibration of Actigraph accelerometers in a mechanical setup - is it worth the
effort The effect on random output variation caused by technical inter-instrument variability
in the laboratory and in the field BMC Med Res Methodol 2008819
17 Montoye HJ Kemper HCG Saris WHM Washburn RA Measuring Physical Activity
and Energy Expenditure Champaign IL Human Kinetics 1996
18 Perkins NJ and Schisterman EF The inconsistency of optimal cutpoints obtained using
two criteria based on the receiver operating characteristic curve Am J Epidemiol
2006163(7)670-5
19 Porcari J McCarron R Kline G Freedson PS Ward A Ross JA Rippe JM Is fast
walking an adequate aerobic training stimulus for 30- to 69-year-old men and women
Physician Sportsmed 198715(2)119-29
20 Powell SM Jones DI Rowlands AV Technical variability of the RT3 accelerometer
Med Sci Sports Exerc 200335(10)1773-8
21 Rennie KL and Jebb SA Prevalence of obesity in Great Britain Obes Rev 20056(1)11-
2
21
21
22 Rothney MP Apker GA Song Y Chen KY Comparing the performance of three
generations of ActiGraph accelerometers J Appl Physiol 2008105(4)1091-7
23 Shephard RJ Absolute versus relative intensity of physical activity in a dose-response
context Med Sci Sports Exerc 200133(6 Suppl)S400-S418
24 Silva P Esliger DW Welk GJ Mota J Technical reliability assessment of the Actigraph
GT1M accelerometer Measurement in Physical Education and Exercise Science
20101479-91
25 Sirard JR Trost SG Pfeiffer KA Dowda M Pate RR Calibration and evaluation of an
objective measure of physical activity in preschool children Journal of Physical Activity and
Health 20053345-57
26 Van Hees V Slootmaker SM De GG Van MW Van Lummel RC Reproducibility of a
triaxial seismic accelerometer (DynaPort) Med Sci Sports Exerc 200941(4)810-7
27 Warburton DE Katzmarzyk PT Rhodes RE Shephard RJ Evidence-informed physical
activity guidelines for Canadian adults Can J Public Health 200798 Suppl 2S16-S68
28 Ware LJ Hurling R Bataveljic O Fairley BW Hurst TL Murray P Rennie KL
Tomkins CE Finn A Cobain MR Pearson DA Foreyt JP Rates and determinants of uptake
and use of an internet physical activity and weight management program in office and
manufacturing work sites in England cohort study J Med Internet Res 200810(4)e56
29 Welk G Physical Activity Assessments for Health-Related Research Champaign IL Human Kinetics 2002
30 Welk GJ Principles of design and analyses for the calibration of accelerometry-based
activity monitors Med Sci Sports Exerc 200537(11 Suppl)S501-S511
31 Welk GJ Eisenmann JC Schaben J Trost SG Dale D Calibration of the biotrainer pro
activity monitor in children Pediatr Exerc Sci 200719(2)145-58
32 Zhang K Werner P Sun M Pi-Sunyer FX Boozer CN Measurement of human daily
physical activity Obes Res 200311(1)33-40
22
22
Figure Captions
Figure 1 Inset right Overhead view of GENEA accelerometers positioned in the test jig Inset
left Multi-Axis Shaker Table (MAST) complete with the test jig secured in place Main Figure
Comparison of a typical output trace from one GENEA accelerometer across the 15 test
conditions
Notes i) the trace represents the middle 50 seconds of each of the 15 conditions
Figure 2 Relationship between physical activity intensity (METS) versus the outputs from the
waist worn GENEA SVMgs (g middot minutes) RT3 (countsminute) and Actigraph (countsmin)
accelerometers across the 16 activity conditions
Table 1 Reliability results for the GENEA for all 15 test conditions
Acceleration Frequency Amplitude GENEA SVMgs
(g ∙ seconds)
CV intra
CV inter
g (mmiddots-2
) (Hz) (m) Mean SD GENEA GENEA
005 049 10 00124 3 01 39 53
022 216 10 00547 11 02 17 20
046 451 30 00127 23 02 08 14
046 451 25 00183 24 02 09 14
048 471 20 00298 25 03 10 14
049 481 15 00541 25 03 11 16
079 775 50 00079 41 04 10 15
091 893 30 00251 46 04 08 13
125 1226 45 00153 57 08 15 21
129 1265 40 00200 58 08 13 20
131 1285 35 00266 59 12 21 26
138 1354 30 00381 60 06 10 18
168 1648 45 00206 64 22 34 37
184 1805 30 00508 66 09 13 22
252 2472 45 00309 84 43 51 53
Average variability across all 15 test conditions 18 24
Table 1
Table 2 Descriptive characteristics of the study participants
Gender Sample
Size Age
Left
Handed
Right
Handed
Height
(cm)
Weight
(kg)
BMI
(kg∙m-2
)
Body Fat
()
Male 23 489 (68) 1 22 1762 (62) 806 (116) 259 (27) 207 (34)
Female 37 496 (64) 4 33 1628 (54) 629 (84) 238 (35) 328 (66)
Overall 60 494 (65) 5 55 1679 (87) 697 (130) 246 (34) 282 (81)
for the measurement of body fat there were 2 less participants (1 male and 1 female)
Table 2
Table 3 Average intensity (METS) and average left right and waist positioned GENEA output by activity
GENEA
(SVMgs (g middot minutes)
Actigraph (CountsMinute)
RT3 (VM CountsMinute)
Activity Grouping
N METS Left Wrist Right Wrist Waist Waist Waist
Mean SD Mean SD Mean SD Mean SD Mean SD Mean SD
Lateral Recumbent (lying on side) Posture
(all)
53 094 023 63 55 143 53 34 17 0 0 4 11
Seated Computer Work 55 122 029 185 86 242 67 48 33 1 3 9 21
Standing 55 113 025 100 66 103 177 48 15 0 0 3 9
Window Washing Lifestyle
(2 of 4)dagger
31 337 106 469 693 1808 708 185 61 138 177 463 344
Washing Dishes 24 235 045 634 177 768 239 132 164 51 80 160 74
Shelf Stacking 30 419 098 884 224 940 202 214 72 2620 1933 421 297
Sweeping 23 339 067 878 264 976 289 187 48 465 355 356 96
Slow Treadmill Walk (4 km∙hr-1
) Ambulatory
(all)
54 388 069 864 195 847 232 856 221 2323 643 1267 318
Medium Treadmill Walk (5 km∙hr-1
) 55 459 079 1177 299 1204 357 1264 214 3745 656 1659 331
Brisk Treadmill Walk (6 km∙hr-1
) 55 588 098 1506 400 1513 350 1815 272 4917 940 2228 450
Stair AscentDescent (80 steps∙min-1
) Stairs (all) 55 619 110 836 620 794 597 697 127 2427 780 811 208
Slow Treadmill Run (8 km∙hr-1
) Ambulatory
(1 of 3)Dagger
18 1113 138 3858 588 4087 798 3553 593 8936 1794 4578 799
Medium Treadmill Run (10 km∙hr-1
) 14 1200 124 5345 1073 4915 787 4043 325 8904 1826 5419 423
Fast Treadmill Run (12 km∙hr-1
) 5 1361 060 5096 2339 5358 2460 4066 299 6982 3233 6093 674
Brisk Free-living Walk (6 km∙hr-1
) Ambulatory
(all) 40 576 094 1433 171 1474 216 1769 227 4912 748 2434 559
Medium Free-living Run (10 km∙hr-1
) Ambulatory
(optional) 5 1262 117 5151 1113 4844 1232 3756 631 8825 1592 5525 787
listwise sample size dagger indicates that participants were randomly allocated 2 out of the 4 activities in this grouping
Dagger indicates that participants had the option to run (select 1 out of the 3 activities in this grouping) if they so chose
Note 1 MET = 35 ml∙kg∙min-1
Table 3
Table 4 Sensitivity specificity area under the ROC curve and GENEA SVMgs (g middot minutes)
cut points that maximized sensitivity and specificity at three wear positions
Intensity Sensitivity Specificity Area under ROC
curve (95 CI)
GENEA Cut points
SVMgs (g middot minutes)
Left Wrist
Sedentary 97 95 098 (098-099) lt 217
Light NA NA NA 217-644
Moderate 95 72 091 (088-093) 645-1810
Vigorous 78 98 091 (086-095) gt 1810
Right Wrist
Sedentary 99 96 098 (097-099) lt 386
Light NA NA NA 386-439
Moderate 100 56 084 (0-81-087) 440-2098
Vigorous 78 97 089 (084-094) gt 2098
Waist
Sedentary 99 96 097 (096-098) lt 77
Light NA NA NA 77-219
Moderate 96 80 093 (091-095) 220-2056
Vigorous 73 99 092 (088-096) gt 2056
Sedentary (lt15 METS) light (15-399 METS) moderate (400-699 METS) vigorous (7+
METS)
NA = not applicable as the sedentary and moderate cut points provide the boundaries for the light
intensity category
Table 4
0
10
20
30
40
50
60
70
80
90
100
GE
NE
A
SV
Mg
s (g
s
eco
nd
s)
Condition1 2 3 4 5 6 7 8 9 10 11 12 13 14 15
Figure 1
GENEA SVMgs (g minutes)
Figure 2
18
18
frequency domain features) future research should strive to classifyrecognize activities of daily
living
Acknowledgments
This research was supported by a grant from Unilever Discover Colworth Bedford UK The
authors would like to thank the participants the graduate research assistants and the
administrative staff of the School of Sport and Health Sciences for their dedication to this
research project
Conflict of Interest
The results of the present study do not constitute endorsement by the authors or ACSM of
the products described in this paper This research was funded by an unrestricted research grant
awarded by Unilever Discover to the School of Sport and Health Sciences University of Exeter
The grant funded the salary of DE and small portions of the salaries of AR and RE At the time
of this research TH and MC were both employed by Unilever Discover However at the time of
manuscript submission MC and DE have no further relationship with Unilever Discover or any
of its operating companies None of the authors have a conflict of interest with Oralinsights the
manufacturer of the technology on which this manuscript is based
19
19
References
1 Bouten CV Koekkoek KT Verduin M Kodde R Janssen JD A triaxial accelerometer and
portable data processing unit for the assessment of daily physical activity IEEE Trans
Biomed Eng 199744(3)136-47
2 Brage S Brage N Wedderkopp N Froberg K Reliability and validity of the Computer
Science and Applications accelerometer in a mechanical setting Measurement in Physical
Education and Exercise Science 20037(2)101-19
3 Chu EY McManus AM Yu CC Calibration of the RT3 accelerometer for ambulation and
nonambulation in children Med Sci Sports Exerc 200739(11)2085-91
4 Esliger DW and Tremblay MS Physical activity and inactivity profiling the next generation
Can J Public Health 200798 Suppl 2S195-S207
5 Esliger DW and Tremblay MS Technical reliability assessment of three accelerometer
models in a mechanical setup Med Sci Sports Exerc 200638(12)2173-81
6 Evenson KR Catellier DJ Gill K Ondrak KS McMurray RG Calibration of two objective
measures of physical activity for children J Sports Sci 20081-9
7 Fruin ML and Rankin JW Validity of a multi-sensor armband in estimating rest and exercise
energy expenditure Med Sci Sports Exerc 200436(6)1063-9
8 Gizatullin AO and Edge KA Adaptive control for a multi-axis hydraulic test rig
Proceedings of the Institution of Mechanical Engineers Part I Journal of Systems and
Control Engineering 2007221(2)183-98
9 Grant PM Ryan CG Tigbe WW Granat MH The validation of a novel activity monitor in
the measurement of posture and motion during everyday activities Br J Sports Med
200640(12)992-7
10 Jago R Zakeri I Baranowski T Watson K Decision boundaries and receiver operating
characteristic curves new methods for determining accelerometer cutpoints J Sports Sci
200725(8)937-44
20
20
11 Karantonis DM Narayanan MR Mathie M Lovell NH Celler BG Implementation of a
real-time human movement classifier using a triaxial accelerometer for ambulatory
monitoring IEEE Trans Inf Technol Biomed 200610(1)156-67
12 Krasnoff JB Kohn MA Choy FK Doyle J Johansen K Painter PL Interunit and
intraunit reliability of the RT3 triaxial accelerometer J Phys Act Health 20085(4)527-38
13 McLaughlin JE King GA Howley ET Bassett DR Jr Ainsworth BE Validation of the
COSMED K4 b2 portable metabolic system Int J Sports Med 200122(4)280-4
14 McManus IC and Hartigan A Declining left-handedness in Victorian England seen in the
films of Mitchell and Kenyon Curr Biol 200717(18)R793-R794
15 Metcalf BS Curnow JS Evans C Voss LD Wilkin TJ Technical reliability of the CSA
activity monitor The EarlyBird Study Med Sci Sports Exerc 200234(9)1533-7
16 Moeller NC Korsholm L Kristensen PL Andersen LB Wedderkopp N Froberg K
Unit-specific calibration of Actigraph accelerometers in a mechanical setup - is it worth the
effort The effect on random output variation caused by technical inter-instrument variability
in the laboratory and in the field BMC Med Res Methodol 2008819
17 Montoye HJ Kemper HCG Saris WHM Washburn RA Measuring Physical Activity
and Energy Expenditure Champaign IL Human Kinetics 1996
18 Perkins NJ and Schisterman EF The inconsistency of optimal cutpoints obtained using
two criteria based on the receiver operating characteristic curve Am J Epidemiol
2006163(7)670-5
19 Porcari J McCarron R Kline G Freedson PS Ward A Ross JA Rippe JM Is fast
walking an adequate aerobic training stimulus for 30- to 69-year-old men and women
Physician Sportsmed 198715(2)119-29
20 Powell SM Jones DI Rowlands AV Technical variability of the RT3 accelerometer
Med Sci Sports Exerc 200335(10)1773-8
21 Rennie KL and Jebb SA Prevalence of obesity in Great Britain Obes Rev 20056(1)11-
2
21
21
22 Rothney MP Apker GA Song Y Chen KY Comparing the performance of three
generations of ActiGraph accelerometers J Appl Physiol 2008105(4)1091-7
23 Shephard RJ Absolute versus relative intensity of physical activity in a dose-response
context Med Sci Sports Exerc 200133(6 Suppl)S400-S418
24 Silva P Esliger DW Welk GJ Mota J Technical reliability assessment of the Actigraph
GT1M accelerometer Measurement in Physical Education and Exercise Science
20101479-91
25 Sirard JR Trost SG Pfeiffer KA Dowda M Pate RR Calibration and evaluation of an
objective measure of physical activity in preschool children Journal of Physical Activity and
Health 20053345-57
26 Van Hees V Slootmaker SM De GG Van MW Van Lummel RC Reproducibility of a
triaxial seismic accelerometer (DynaPort) Med Sci Sports Exerc 200941(4)810-7
27 Warburton DE Katzmarzyk PT Rhodes RE Shephard RJ Evidence-informed physical
activity guidelines for Canadian adults Can J Public Health 200798 Suppl 2S16-S68
28 Ware LJ Hurling R Bataveljic O Fairley BW Hurst TL Murray P Rennie KL
Tomkins CE Finn A Cobain MR Pearson DA Foreyt JP Rates and determinants of uptake
and use of an internet physical activity and weight management program in office and
manufacturing work sites in England cohort study J Med Internet Res 200810(4)e56
29 Welk G Physical Activity Assessments for Health-Related Research Champaign IL Human Kinetics 2002
30 Welk GJ Principles of design and analyses for the calibration of accelerometry-based
activity monitors Med Sci Sports Exerc 200537(11 Suppl)S501-S511
31 Welk GJ Eisenmann JC Schaben J Trost SG Dale D Calibration of the biotrainer pro
activity monitor in children Pediatr Exerc Sci 200719(2)145-58
32 Zhang K Werner P Sun M Pi-Sunyer FX Boozer CN Measurement of human daily
physical activity Obes Res 200311(1)33-40
22
22
Figure Captions
Figure 1 Inset right Overhead view of GENEA accelerometers positioned in the test jig Inset
left Multi-Axis Shaker Table (MAST) complete with the test jig secured in place Main Figure
Comparison of a typical output trace from one GENEA accelerometer across the 15 test
conditions
Notes i) the trace represents the middle 50 seconds of each of the 15 conditions
Figure 2 Relationship between physical activity intensity (METS) versus the outputs from the
waist worn GENEA SVMgs (g middot minutes) RT3 (countsminute) and Actigraph (countsmin)
accelerometers across the 16 activity conditions
Table 1 Reliability results for the GENEA for all 15 test conditions
Acceleration Frequency Amplitude GENEA SVMgs
(g ∙ seconds)
CV intra
CV inter
g (mmiddots-2
) (Hz) (m) Mean SD GENEA GENEA
005 049 10 00124 3 01 39 53
022 216 10 00547 11 02 17 20
046 451 30 00127 23 02 08 14
046 451 25 00183 24 02 09 14
048 471 20 00298 25 03 10 14
049 481 15 00541 25 03 11 16
079 775 50 00079 41 04 10 15
091 893 30 00251 46 04 08 13
125 1226 45 00153 57 08 15 21
129 1265 40 00200 58 08 13 20
131 1285 35 00266 59 12 21 26
138 1354 30 00381 60 06 10 18
168 1648 45 00206 64 22 34 37
184 1805 30 00508 66 09 13 22
252 2472 45 00309 84 43 51 53
Average variability across all 15 test conditions 18 24
Table 1
Table 2 Descriptive characteristics of the study participants
Gender Sample
Size Age
Left
Handed
Right
Handed
Height
(cm)
Weight
(kg)
BMI
(kg∙m-2
)
Body Fat
()
Male 23 489 (68) 1 22 1762 (62) 806 (116) 259 (27) 207 (34)
Female 37 496 (64) 4 33 1628 (54) 629 (84) 238 (35) 328 (66)
Overall 60 494 (65) 5 55 1679 (87) 697 (130) 246 (34) 282 (81)
for the measurement of body fat there were 2 less participants (1 male and 1 female)
Table 2
Table 3 Average intensity (METS) and average left right and waist positioned GENEA output by activity
GENEA
(SVMgs (g middot minutes)
Actigraph (CountsMinute)
RT3 (VM CountsMinute)
Activity Grouping
N METS Left Wrist Right Wrist Waist Waist Waist
Mean SD Mean SD Mean SD Mean SD Mean SD Mean SD
Lateral Recumbent (lying on side) Posture
(all)
53 094 023 63 55 143 53 34 17 0 0 4 11
Seated Computer Work 55 122 029 185 86 242 67 48 33 1 3 9 21
Standing 55 113 025 100 66 103 177 48 15 0 0 3 9
Window Washing Lifestyle
(2 of 4)dagger
31 337 106 469 693 1808 708 185 61 138 177 463 344
Washing Dishes 24 235 045 634 177 768 239 132 164 51 80 160 74
Shelf Stacking 30 419 098 884 224 940 202 214 72 2620 1933 421 297
Sweeping 23 339 067 878 264 976 289 187 48 465 355 356 96
Slow Treadmill Walk (4 km∙hr-1
) Ambulatory
(all)
54 388 069 864 195 847 232 856 221 2323 643 1267 318
Medium Treadmill Walk (5 km∙hr-1
) 55 459 079 1177 299 1204 357 1264 214 3745 656 1659 331
Brisk Treadmill Walk (6 km∙hr-1
) 55 588 098 1506 400 1513 350 1815 272 4917 940 2228 450
Stair AscentDescent (80 steps∙min-1
) Stairs (all) 55 619 110 836 620 794 597 697 127 2427 780 811 208
Slow Treadmill Run (8 km∙hr-1
) Ambulatory
(1 of 3)Dagger
18 1113 138 3858 588 4087 798 3553 593 8936 1794 4578 799
Medium Treadmill Run (10 km∙hr-1
) 14 1200 124 5345 1073 4915 787 4043 325 8904 1826 5419 423
Fast Treadmill Run (12 km∙hr-1
) 5 1361 060 5096 2339 5358 2460 4066 299 6982 3233 6093 674
Brisk Free-living Walk (6 km∙hr-1
) Ambulatory
(all) 40 576 094 1433 171 1474 216 1769 227 4912 748 2434 559
Medium Free-living Run (10 km∙hr-1
) Ambulatory
(optional) 5 1262 117 5151 1113 4844 1232 3756 631 8825 1592 5525 787
listwise sample size dagger indicates that participants were randomly allocated 2 out of the 4 activities in this grouping
Dagger indicates that participants had the option to run (select 1 out of the 3 activities in this grouping) if they so chose
Note 1 MET = 35 ml∙kg∙min-1
Table 3
Table 4 Sensitivity specificity area under the ROC curve and GENEA SVMgs (g middot minutes)
cut points that maximized sensitivity and specificity at three wear positions
Intensity Sensitivity Specificity Area under ROC
curve (95 CI)
GENEA Cut points
SVMgs (g middot minutes)
Left Wrist
Sedentary 97 95 098 (098-099) lt 217
Light NA NA NA 217-644
Moderate 95 72 091 (088-093) 645-1810
Vigorous 78 98 091 (086-095) gt 1810
Right Wrist
Sedentary 99 96 098 (097-099) lt 386
Light NA NA NA 386-439
Moderate 100 56 084 (0-81-087) 440-2098
Vigorous 78 97 089 (084-094) gt 2098
Waist
Sedentary 99 96 097 (096-098) lt 77
Light NA NA NA 77-219
Moderate 96 80 093 (091-095) 220-2056
Vigorous 73 99 092 (088-096) gt 2056
Sedentary (lt15 METS) light (15-399 METS) moderate (400-699 METS) vigorous (7+
METS)
NA = not applicable as the sedentary and moderate cut points provide the boundaries for the light
intensity category
Table 4
0
10
20
30
40
50
60
70
80
90
100
GE
NE
A
SV
Mg
s (g
s
eco
nd
s)
Condition1 2 3 4 5 6 7 8 9 10 11 12 13 14 15
Figure 1
GENEA SVMgs (g minutes)
Figure 2
19
19
References
1 Bouten CV Koekkoek KT Verduin M Kodde R Janssen JD A triaxial accelerometer and
portable data processing unit for the assessment of daily physical activity IEEE Trans
Biomed Eng 199744(3)136-47
2 Brage S Brage N Wedderkopp N Froberg K Reliability and validity of the Computer
Science and Applications accelerometer in a mechanical setting Measurement in Physical
Education and Exercise Science 20037(2)101-19
3 Chu EY McManus AM Yu CC Calibration of the RT3 accelerometer for ambulation and
nonambulation in children Med Sci Sports Exerc 200739(11)2085-91
4 Esliger DW and Tremblay MS Physical activity and inactivity profiling the next generation
Can J Public Health 200798 Suppl 2S195-S207
5 Esliger DW and Tremblay MS Technical reliability assessment of three accelerometer
models in a mechanical setup Med Sci Sports Exerc 200638(12)2173-81
6 Evenson KR Catellier DJ Gill K Ondrak KS McMurray RG Calibration of two objective
measures of physical activity for children J Sports Sci 20081-9
7 Fruin ML and Rankin JW Validity of a multi-sensor armband in estimating rest and exercise
energy expenditure Med Sci Sports Exerc 200436(6)1063-9
8 Gizatullin AO and Edge KA Adaptive control for a multi-axis hydraulic test rig
Proceedings of the Institution of Mechanical Engineers Part I Journal of Systems and
Control Engineering 2007221(2)183-98
9 Grant PM Ryan CG Tigbe WW Granat MH The validation of a novel activity monitor in
the measurement of posture and motion during everyday activities Br J Sports Med
200640(12)992-7
10 Jago R Zakeri I Baranowski T Watson K Decision boundaries and receiver operating
characteristic curves new methods for determining accelerometer cutpoints J Sports Sci
200725(8)937-44
20
20
11 Karantonis DM Narayanan MR Mathie M Lovell NH Celler BG Implementation of a
real-time human movement classifier using a triaxial accelerometer for ambulatory
monitoring IEEE Trans Inf Technol Biomed 200610(1)156-67
12 Krasnoff JB Kohn MA Choy FK Doyle J Johansen K Painter PL Interunit and
intraunit reliability of the RT3 triaxial accelerometer J Phys Act Health 20085(4)527-38
13 McLaughlin JE King GA Howley ET Bassett DR Jr Ainsworth BE Validation of the
COSMED K4 b2 portable metabolic system Int J Sports Med 200122(4)280-4
14 McManus IC and Hartigan A Declining left-handedness in Victorian England seen in the
films of Mitchell and Kenyon Curr Biol 200717(18)R793-R794
15 Metcalf BS Curnow JS Evans C Voss LD Wilkin TJ Technical reliability of the CSA
activity monitor The EarlyBird Study Med Sci Sports Exerc 200234(9)1533-7
16 Moeller NC Korsholm L Kristensen PL Andersen LB Wedderkopp N Froberg K
Unit-specific calibration of Actigraph accelerometers in a mechanical setup - is it worth the
effort The effect on random output variation caused by technical inter-instrument variability
in the laboratory and in the field BMC Med Res Methodol 2008819
17 Montoye HJ Kemper HCG Saris WHM Washburn RA Measuring Physical Activity
and Energy Expenditure Champaign IL Human Kinetics 1996
18 Perkins NJ and Schisterman EF The inconsistency of optimal cutpoints obtained using
two criteria based on the receiver operating characteristic curve Am J Epidemiol
2006163(7)670-5
19 Porcari J McCarron R Kline G Freedson PS Ward A Ross JA Rippe JM Is fast
walking an adequate aerobic training stimulus for 30- to 69-year-old men and women
Physician Sportsmed 198715(2)119-29
20 Powell SM Jones DI Rowlands AV Technical variability of the RT3 accelerometer
Med Sci Sports Exerc 200335(10)1773-8
21 Rennie KL and Jebb SA Prevalence of obesity in Great Britain Obes Rev 20056(1)11-
2
21
21
22 Rothney MP Apker GA Song Y Chen KY Comparing the performance of three
generations of ActiGraph accelerometers J Appl Physiol 2008105(4)1091-7
23 Shephard RJ Absolute versus relative intensity of physical activity in a dose-response
context Med Sci Sports Exerc 200133(6 Suppl)S400-S418
24 Silva P Esliger DW Welk GJ Mota J Technical reliability assessment of the Actigraph
GT1M accelerometer Measurement in Physical Education and Exercise Science
20101479-91
25 Sirard JR Trost SG Pfeiffer KA Dowda M Pate RR Calibration and evaluation of an
objective measure of physical activity in preschool children Journal of Physical Activity and
Health 20053345-57
26 Van Hees V Slootmaker SM De GG Van MW Van Lummel RC Reproducibility of a
triaxial seismic accelerometer (DynaPort) Med Sci Sports Exerc 200941(4)810-7
27 Warburton DE Katzmarzyk PT Rhodes RE Shephard RJ Evidence-informed physical
activity guidelines for Canadian adults Can J Public Health 200798 Suppl 2S16-S68
28 Ware LJ Hurling R Bataveljic O Fairley BW Hurst TL Murray P Rennie KL
Tomkins CE Finn A Cobain MR Pearson DA Foreyt JP Rates and determinants of uptake
and use of an internet physical activity and weight management program in office and
manufacturing work sites in England cohort study J Med Internet Res 200810(4)e56
29 Welk G Physical Activity Assessments for Health-Related Research Champaign IL Human Kinetics 2002
30 Welk GJ Principles of design and analyses for the calibration of accelerometry-based
activity monitors Med Sci Sports Exerc 200537(11 Suppl)S501-S511
31 Welk GJ Eisenmann JC Schaben J Trost SG Dale D Calibration of the biotrainer pro
activity monitor in children Pediatr Exerc Sci 200719(2)145-58
32 Zhang K Werner P Sun M Pi-Sunyer FX Boozer CN Measurement of human daily
physical activity Obes Res 200311(1)33-40
22
22
Figure Captions
Figure 1 Inset right Overhead view of GENEA accelerometers positioned in the test jig Inset
left Multi-Axis Shaker Table (MAST) complete with the test jig secured in place Main Figure
Comparison of a typical output trace from one GENEA accelerometer across the 15 test
conditions
Notes i) the trace represents the middle 50 seconds of each of the 15 conditions
Figure 2 Relationship between physical activity intensity (METS) versus the outputs from the
waist worn GENEA SVMgs (g middot minutes) RT3 (countsminute) and Actigraph (countsmin)
accelerometers across the 16 activity conditions
Table 1 Reliability results for the GENEA for all 15 test conditions
Acceleration Frequency Amplitude GENEA SVMgs
(g ∙ seconds)
CV intra
CV inter
g (mmiddots-2
) (Hz) (m) Mean SD GENEA GENEA
005 049 10 00124 3 01 39 53
022 216 10 00547 11 02 17 20
046 451 30 00127 23 02 08 14
046 451 25 00183 24 02 09 14
048 471 20 00298 25 03 10 14
049 481 15 00541 25 03 11 16
079 775 50 00079 41 04 10 15
091 893 30 00251 46 04 08 13
125 1226 45 00153 57 08 15 21
129 1265 40 00200 58 08 13 20
131 1285 35 00266 59 12 21 26
138 1354 30 00381 60 06 10 18
168 1648 45 00206 64 22 34 37
184 1805 30 00508 66 09 13 22
252 2472 45 00309 84 43 51 53
Average variability across all 15 test conditions 18 24
Table 1
Table 2 Descriptive characteristics of the study participants
Gender Sample
Size Age
Left
Handed
Right
Handed
Height
(cm)
Weight
(kg)
BMI
(kg∙m-2
)
Body Fat
()
Male 23 489 (68) 1 22 1762 (62) 806 (116) 259 (27) 207 (34)
Female 37 496 (64) 4 33 1628 (54) 629 (84) 238 (35) 328 (66)
Overall 60 494 (65) 5 55 1679 (87) 697 (130) 246 (34) 282 (81)
for the measurement of body fat there were 2 less participants (1 male and 1 female)
Table 2
Table 3 Average intensity (METS) and average left right and waist positioned GENEA output by activity
GENEA
(SVMgs (g middot minutes)
Actigraph (CountsMinute)
RT3 (VM CountsMinute)
Activity Grouping
N METS Left Wrist Right Wrist Waist Waist Waist
Mean SD Mean SD Mean SD Mean SD Mean SD Mean SD
Lateral Recumbent (lying on side) Posture
(all)
53 094 023 63 55 143 53 34 17 0 0 4 11
Seated Computer Work 55 122 029 185 86 242 67 48 33 1 3 9 21
Standing 55 113 025 100 66 103 177 48 15 0 0 3 9
Window Washing Lifestyle
(2 of 4)dagger
31 337 106 469 693 1808 708 185 61 138 177 463 344
Washing Dishes 24 235 045 634 177 768 239 132 164 51 80 160 74
Shelf Stacking 30 419 098 884 224 940 202 214 72 2620 1933 421 297
Sweeping 23 339 067 878 264 976 289 187 48 465 355 356 96
Slow Treadmill Walk (4 km∙hr-1
) Ambulatory
(all)
54 388 069 864 195 847 232 856 221 2323 643 1267 318
Medium Treadmill Walk (5 km∙hr-1
) 55 459 079 1177 299 1204 357 1264 214 3745 656 1659 331
Brisk Treadmill Walk (6 km∙hr-1
) 55 588 098 1506 400 1513 350 1815 272 4917 940 2228 450
Stair AscentDescent (80 steps∙min-1
) Stairs (all) 55 619 110 836 620 794 597 697 127 2427 780 811 208
Slow Treadmill Run (8 km∙hr-1
) Ambulatory
(1 of 3)Dagger
18 1113 138 3858 588 4087 798 3553 593 8936 1794 4578 799
Medium Treadmill Run (10 km∙hr-1
) 14 1200 124 5345 1073 4915 787 4043 325 8904 1826 5419 423
Fast Treadmill Run (12 km∙hr-1
) 5 1361 060 5096 2339 5358 2460 4066 299 6982 3233 6093 674
Brisk Free-living Walk (6 km∙hr-1
) Ambulatory
(all) 40 576 094 1433 171 1474 216 1769 227 4912 748 2434 559
Medium Free-living Run (10 km∙hr-1
) Ambulatory
(optional) 5 1262 117 5151 1113 4844 1232 3756 631 8825 1592 5525 787
listwise sample size dagger indicates that participants were randomly allocated 2 out of the 4 activities in this grouping
Dagger indicates that participants had the option to run (select 1 out of the 3 activities in this grouping) if they so chose
Note 1 MET = 35 ml∙kg∙min-1
Table 3
Table 4 Sensitivity specificity area under the ROC curve and GENEA SVMgs (g middot minutes)
cut points that maximized sensitivity and specificity at three wear positions
Intensity Sensitivity Specificity Area under ROC
curve (95 CI)
GENEA Cut points
SVMgs (g middot minutes)
Left Wrist
Sedentary 97 95 098 (098-099) lt 217
Light NA NA NA 217-644
Moderate 95 72 091 (088-093) 645-1810
Vigorous 78 98 091 (086-095) gt 1810
Right Wrist
Sedentary 99 96 098 (097-099) lt 386
Light NA NA NA 386-439
Moderate 100 56 084 (0-81-087) 440-2098
Vigorous 78 97 089 (084-094) gt 2098
Waist
Sedentary 99 96 097 (096-098) lt 77
Light NA NA NA 77-219
Moderate 96 80 093 (091-095) 220-2056
Vigorous 73 99 092 (088-096) gt 2056
Sedentary (lt15 METS) light (15-399 METS) moderate (400-699 METS) vigorous (7+
METS)
NA = not applicable as the sedentary and moderate cut points provide the boundaries for the light
intensity category
Table 4
0
10
20
30
40
50
60
70
80
90
100
GE
NE
A
SV
Mg
s (g
s
eco
nd
s)
Condition1 2 3 4 5 6 7 8 9 10 11 12 13 14 15
Figure 1
GENEA SVMgs (g minutes)
Figure 2
20
20
11 Karantonis DM Narayanan MR Mathie M Lovell NH Celler BG Implementation of a
real-time human movement classifier using a triaxial accelerometer for ambulatory
monitoring IEEE Trans Inf Technol Biomed 200610(1)156-67
12 Krasnoff JB Kohn MA Choy FK Doyle J Johansen K Painter PL Interunit and
intraunit reliability of the RT3 triaxial accelerometer J Phys Act Health 20085(4)527-38
13 McLaughlin JE King GA Howley ET Bassett DR Jr Ainsworth BE Validation of the
COSMED K4 b2 portable metabolic system Int J Sports Med 200122(4)280-4
14 McManus IC and Hartigan A Declining left-handedness in Victorian England seen in the
films of Mitchell and Kenyon Curr Biol 200717(18)R793-R794
15 Metcalf BS Curnow JS Evans C Voss LD Wilkin TJ Technical reliability of the CSA
activity monitor The EarlyBird Study Med Sci Sports Exerc 200234(9)1533-7
16 Moeller NC Korsholm L Kristensen PL Andersen LB Wedderkopp N Froberg K
Unit-specific calibration of Actigraph accelerometers in a mechanical setup - is it worth the
effort The effect on random output variation caused by technical inter-instrument variability
in the laboratory and in the field BMC Med Res Methodol 2008819
17 Montoye HJ Kemper HCG Saris WHM Washburn RA Measuring Physical Activity
and Energy Expenditure Champaign IL Human Kinetics 1996
18 Perkins NJ and Schisterman EF The inconsistency of optimal cutpoints obtained using
two criteria based on the receiver operating characteristic curve Am J Epidemiol
2006163(7)670-5
19 Porcari J McCarron R Kline G Freedson PS Ward A Ross JA Rippe JM Is fast
walking an adequate aerobic training stimulus for 30- to 69-year-old men and women
Physician Sportsmed 198715(2)119-29
20 Powell SM Jones DI Rowlands AV Technical variability of the RT3 accelerometer
Med Sci Sports Exerc 200335(10)1773-8
21 Rennie KL and Jebb SA Prevalence of obesity in Great Britain Obes Rev 20056(1)11-
2
21
21
22 Rothney MP Apker GA Song Y Chen KY Comparing the performance of three
generations of ActiGraph accelerometers J Appl Physiol 2008105(4)1091-7
23 Shephard RJ Absolute versus relative intensity of physical activity in a dose-response
context Med Sci Sports Exerc 200133(6 Suppl)S400-S418
24 Silva P Esliger DW Welk GJ Mota J Technical reliability assessment of the Actigraph
GT1M accelerometer Measurement in Physical Education and Exercise Science
20101479-91
25 Sirard JR Trost SG Pfeiffer KA Dowda M Pate RR Calibration and evaluation of an
objective measure of physical activity in preschool children Journal of Physical Activity and
Health 20053345-57
26 Van Hees V Slootmaker SM De GG Van MW Van Lummel RC Reproducibility of a
triaxial seismic accelerometer (DynaPort) Med Sci Sports Exerc 200941(4)810-7
27 Warburton DE Katzmarzyk PT Rhodes RE Shephard RJ Evidence-informed physical
activity guidelines for Canadian adults Can J Public Health 200798 Suppl 2S16-S68
28 Ware LJ Hurling R Bataveljic O Fairley BW Hurst TL Murray P Rennie KL
Tomkins CE Finn A Cobain MR Pearson DA Foreyt JP Rates and determinants of uptake
and use of an internet physical activity and weight management program in office and
manufacturing work sites in England cohort study J Med Internet Res 200810(4)e56
29 Welk G Physical Activity Assessments for Health-Related Research Champaign IL Human Kinetics 2002
30 Welk GJ Principles of design and analyses for the calibration of accelerometry-based
activity monitors Med Sci Sports Exerc 200537(11 Suppl)S501-S511
31 Welk GJ Eisenmann JC Schaben J Trost SG Dale D Calibration of the biotrainer pro
activity monitor in children Pediatr Exerc Sci 200719(2)145-58
32 Zhang K Werner P Sun M Pi-Sunyer FX Boozer CN Measurement of human daily
physical activity Obes Res 200311(1)33-40
22
22
Figure Captions
Figure 1 Inset right Overhead view of GENEA accelerometers positioned in the test jig Inset
left Multi-Axis Shaker Table (MAST) complete with the test jig secured in place Main Figure
Comparison of a typical output trace from one GENEA accelerometer across the 15 test
conditions
Notes i) the trace represents the middle 50 seconds of each of the 15 conditions
Figure 2 Relationship between physical activity intensity (METS) versus the outputs from the
waist worn GENEA SVMgs (g middot minutes) RT3 (countsminute) and Actigraph (countsmin)
accelerometers across the 16 activity conditions
Table 1 Reliability results for the GENEA for all 15 test conditions
Acceleration Frequency Amplitude GENEA SVMgs
(g ∙ seconds)
CV intra
CV inter
g (mmiddots-2
) (Hz) (m) Mean SD GENEA GENEA
005 049 10 00124 3 01 39 53
022 216 10 00547 11 02 17 20
046 451 30 00127 23 02 08 14
046 451 25 00183 24 02 09 14
048 471 20 00298 25 03 10 14
049 481 15 00541 25 03 11 16
079 775 50 00079 41 04 10 15
091 893 30 00251 46 04 08 13
125 1226 45 00153 57 08 15 21
129 1265 40 00200 58 08 13 20
131 1285 35 00266 59 12 21 26
138 1354 30 00381 60 06 10 18
168 1648 45 00206 64 22 34 37
184 1805 30 00508 66 09 13 22
252 2472 45 00309 84 43 51 53
Average variability across all 15 test conditions 18 24
Table 1
Table 2 Descriptive characteristics of the study participants
Gender Sample
Size Age
Left
Handed
Right
Handed
Height
(cm)
Weight
(kg)
BMI
(kg∙m-2
)
Body Fat
()
Male 23 489 (68) 1 22 1762 (62) 806 (116) 259 (27) 207 (34)
Female 37 496 (64) 4 33 1628 (54) 629 (84) 238 (35) 328 (66)
Overall 60 494 (65) 5 55 1679 (87) 697 (130) 246 (34) 282 (81)
for the measurement of body fat there were 2 less participants (1 male and 1 female)
Table 2
Table 3 Average intensity (METS) and average left right and waist positioned GENEA output by activity
GENEA
(SVMgs (g middot minutes)
Actigraph (CountsMinute)
RT3 (VM CountsMinute)
Activity Grouping
N METS Left Wrist Right Wrist Waist Waist Waist
Mean SD Mean SD Mean SD Mean SD Mean SD Mean SD
Lateral Recumbent (lying on side) Posture
(all)
53 094 023 63 55 143 53 34 17 0 0 4 11
Seated Computer Work 55 122 029 185 86 242 67 48 33 1 3 9 21
Standing 55 113 025 100 66 103 177 48 15 0 0 3 9
Window Washing Lifestyle
(2 of 4)dagger
31 337 106 469 693 1808 708 185 61 138 177 463 344
Washing Dishes 24 235 045 634 177 768 239 132 164 51 80 160 74
Shelf Stacking 30 419 098 884 224 940 202 214 72 2620 1933 421 297
Sweeping 23 339 067 878 264 976 289 187 48 465 355 356 96
Slow Treadmill Walk (4 km∙hr-1
) Ambulatory
(all)
54 388 069 864 195 847 232 856 221 2323 643 1267 318
Medium Treadmill Walk (5 km∙hr-1
) 55 459 079 1177 299 1204 357 1264 214 3745 656 1659 331
Brisk Treadmill Walk (6 km∙hr-1
) 55 588 098 1506 400 1513 350 1815 272 4917 940 2228 450
Stair AscentDescent (80 steps∙min-1
) Stairs (all) 55 619 110 836 620 794 597 697 127 2427 780 811 208
Slow Treadmill Run (8 km∙hr-1
) Ambulatory
(1 of 3)Dagger
18 1113 138 3858 588 4087 798 3553 593 8936 1794 4578 799
Medium Treadmill Run (10 km∙hr-1
) 14 1200 124 5345 1073 4915 787 4043 325 8904 1826 5419 423
Fast Treadmill Run (12 km∙hr-1
) 5 1361 060 5096 2339 5358 2460 4066 299 6982 3233 6093 674
Brisk Free-living Walk (6 km∙hr-1
) Ambulatory
(all) 40 576 094 1433 171 1474 216 1769 227 4912 748 2434 559
Medium Free-living Run (10 km∙hr-1
) Ambulatory
(optional) 5 1262 117 5151 1113 4844 1232 3756 631 8825 1592 5525 787
listwise sample size dagger indicates that participants were randomly allocated 2 out of the 4 activities in this grouping
Dagger indicates that participants had the option to run (select 1 out of the 3 activities in this grouping) if they so chose
Note 1 MET = 35 ml∙kg∙min-1
Table 3
Table 4 Sensitivity specificity area under the ROC curve and GENEA SVMgs (g middot minutes)
cut points that maximized sensitivity and specificity at three wear positions
Intensity Sensitivity Specificity Area under ROC
curve (95 CI)
GENEA Cut points
SVMgs (g middot minutes)
Left Wrist
Sedentary 97 95 098 (098-099) lt 217
Light NA NA NA 217-644
Moderate 95 72 091 (088-093) 645-1810
Vigorous 78 98 091 (086-095) gt 1810
Right Wrist
Sedentary 99 96 098 (097-099) lt 386
Light NA NA NA 386-439
Moderate 100 56 084 (0-81-087) 440-2098
Vigorous 78 97 089 (084-094) gt 2098
Waist
Sedentary 99 96 097 (096-098) lt 77
Light NA NA NA 77-219
Moderate 96 80 093 (091-095) 220-2056
Vigorous 73 99 092 (088-096) gt 2056
Sedentary (lt15 METS) light (15-399 METS) moderate (400-699 METS) vigorous (7+
METS)
NA = not applicable as the sedentary and moderate cut points provide the boundaries for the light
intensity category
Table 4
0
10
20
30
40
50
60
70
80
90
100
GE
NE
A
SV
Mg
s (g
s
eco
nd
s)
Condition1 2 3 4 5 6 7 8 9 10 11 12 13 14 15
Figure 1
GENEA SVMgs (g minutes)
Figure 2
21
21
22 Rothney MP Apker GA Song Y Chen KY Comparing the performance of three
generations of ActiGraph accelerometers J Appl Physiol 2008105(4)1091-7
23 Shephard RJ Absolute versus relative intensity of physical activity in a dose-response
context Med Sci Sports Exerc 200133(6 Suppl)S400-S418
24 Silva P Esliger DW Welk GJ Mota J Technical reliability assessment of the Actigraph
GT1M accelerometer Measurement in Physical Education and Exercise Science
20101479-91
25 Sirard JR Trost SG Pfeiffer KA Dowda M Pate RR Calibration and evaluation of an
objective measure of physical activity in preschool children Journal of Physical Activity and
Health 20053345-57
26 Van Hees V Slootmaker SM De GG Van MW Van Lummel RC Reproducibility of a
triaxial seismic accelerometer (DynaPort) Med Sci Sports Exerc 200941(4)810-7
27 Warburton DE Katzmarzyk PT Rhodes RE Shephard RJ Evidence-informed physical
activity guidelines for Canadian adults Can J Public Health 200798 Suppl 2S16-S68
28 Ware LJ Hurling R Bataveljic O Fairley BW Hurst TL Murray P Rennie KL
Tomkins CE Finn A Cobain MR Pearson DA Foreyt JP Rates and determinants of uptake
and use of an internet physical activity and weight management program in office and
manufacturing work sites in England cohort study J Med Internet Res 200810(4)e56
29 Welk G Physical Activity Assessments for Health-Related Research Champaign IL Human Kinetics 2002
30 Welk GJ Principles of design and analyses for the calibration of accelerometry-based
activity monitors Med Sci Sports Exerc 200537(11 Suppl)S501-S511
31 Welk GJ Eisenmann JC Schaben J Trost SG Dale D Calibration of the biotrainer pro
activity monitor in children Pediatr Exerc Sci 200719(2)145-58
32 Zhang K Werner P Sun M Pi-Sunyer FX Boozer CN Measurement of human daily
physical activity Obes Res 200311(1)33-40
22
22
Figure Captions
Figure 1 Inset right Overhead view of GENEA accelerometers positioned in the test jig Inset
left Multi-Axis Shaker Table (MAST) complete with the test jig secured in place Main Figure
Comparison of a typical output trace from one GENEA accelerometer across the 15 test
conditions
Notes i) the trace represents the middle 50 seconds of each of the 15 conditions
Figure 2 Relationship between physical activity intensity (METS) versus the outputs from the
waist worn GENEA SVMgs (g middot minutes) RT3 (countsminute) and Actigraph (countsmin)
accelerometers across the 16 activity conditions
Table 1 Reliability results for the GENEA for all 15 test conditions
Acceleration Frequency Amplitude GENEA SVMgs
(g ∙ seconds)
CV intra
CV inter
g (mmiddots-2
) (Hz) (m) Mean SD GENEA GENEA
005 049 10 00124 3 01 39 53
022 216 10 00547 11 02 17 20
046 451 30 00127 23 02 08 14
046 451 25 00183 24 02 09 14
048 471 20 00298 25 03 10 14
049 481 15 00541 25 03 11 16
079 775 50 00079 41 04 10 15
091 893 30 00251 46 04 08 13
125 1226 45 00153 57 08 15 21
129 1265 40 00200 58 08 13 20
131 1285 35 00266 59 12 21 26
138 1354 30 00381 60 06 10 18
168 1648 45 00206 64 22 34 37
184 1805 30 00508 66 09 13 22
252 2472 45 00309 84 43 51 53
Average variability across all 15 test conditions 18 24
Table 1
Table 2 Descriptive characteristics of the study participants
Gender Sample
Size Age
Left
Handed
Right
Handed
Height
(cm)
Weight
(kg)
BMI
(kg∙m-2
)
Body Fat
()
Male 23 489 (68) 1 22 1762 (62) 806 (116) 259 (27) 207 (34)
Female 37 496 (64) 4 33 1628 (54) 629 (84) 238 (35) 328 (66)
Overall 60 494 (65) 5 55 1679 (87) 697 (130) 246 (34) 282 (81)
for the measurement of body fat there were 2 less participants (1 male and 1 female)
Table 2
Table 3 Average intensity (METS) and average left right and waist positioned GENEA output by activity
GENEA
(SVMgs (g middot minutes)
Actigraph (CountsMinute)
RT3 (VM CountsMinute)
Activity Grouping
N METS Left Wrist Right Wrist Waist Waist Waist
Mean SD Mean SD Mean SD Mean SD Mean SD Mean SD
Lateral Recumbent (lying on side) Posture
(all)
53 094 023 63 55 143 53 34 17 0 0 4 11
Seated Computer Work 55 122 029 185 86 242 67 48 33 1 3 9 21
Standing 55 113 025 100 66 103 177 48 15 0 0 3 9
Window Washing Lifestyle
(2 of 4)dagger
31 337 106 469 693 1808 708 185 61 138 177 463 344
Washing Dishes 24 235 045 634 177 768 239 132 164 51 80 160 74
Shelf Stacking 30 419 098 884 224 940 202 214 72 2620 1933 421 297
Sweeping 23 339 067 878 264 976 289 187 48 465 355 356 96
Slow Treadmill Walk (4 km∙hr-1
) Ambulatory
(all)
54 388 069 864 195 847 232 856 221 2323 643 1267 318
Medium Treadmill Walk (5 km∙hr-1
) 55 459 079 1177 299 1204 357 1264 214 3745 656 1659 331
Brisk Treadmill Walk (6 km∙hr-1
) 55 588 098 1506 400 1513 350 1815 272 4917 940 2228 450
Stair AscentDescent (80 steps∙min-1
) Stairs (all) 55 619 110 836 620 794 597 697 127 2427 780 811 208
Slow Treadmill Run (8 km∙hr-1
) Ambulatory
(1 of 3)Dagger
18 1113 138 3858 588 4087 798 3553 593 8936 1794 4578 799
Medium Treadmill Run (10 km∙hr-1
) 14 1200 124 5345 1073 4915 787 4043 325 8904 1826 5419 423
Fast Treadmill Run (12 km∙hr-1
) 5 1361 060 5096 2339 5358 2460 4066 299 6982 3233 6093 674
Brisk Free-living Walk (6 km∙hr-1
) Ambulatory
(all) 40 576 094 1433 171 1474 216 1769 227 4912 748 2434 559
Medium Free-living Run (10 km∙hr-1
) Ambulatory
(optional) 5 1262 117 5151 1113 4844 1232 3756 631 8825 1592 5525 787
listwise sample size dagger indicates that participants were randomly allocated 2 out of the 4 activities in this grouping
Dagger indicates that participants had the option to run (select 1 out of the 3 activities in this grouping) if they so chose
Note 1 MET = 35 ml∙kg∙min-1
Table 3
Table 4 Sensitivity specificity area under the ROC curve and GENEA SVMgs (g middot minutes)
cut points that maximized sensitivity and specificity at three wear positions
Intensity Sensitivity Specificity Area under ROC
curve (95 CI)
GENEA Cut points
SVMgs (g middot minutes)
Left Wrist
Sedentary 97 95 098 (098-099) lt 217
Light NA NA NA 217-644
Moderate 95 72 091 (088-093) 645-1810
Vigorous 78 98 091 (086-095) gt 1810
Right Wrist
Sedentary 99 96 098 (097-099) lt 386
Light NA NA NA 386-439
Moderate 100 56 084 (0-81-087) 440-2098
Vigorous 78 97 089 (084-094) gt 2098
Waist
Sedentary 99 96 097 (096-098) lt 77
Light NA NA NA 77-219
Moderate 96 80 093 (091-095) 220-2056
Vigorous 73 99 092 (088-096) gt 2056
Sedentary (lt15 METS) light (15-399 METS) moderate (400-699 METS) vigorous (7+
METS)
NA = not applicable as the sedentary and moderate cut points provide the boundaries for the light
intensity category
Table 4
0
10
20
30
40
50
60
70
80
90
100
GE
NE
A
SV
Mg
s (g
s
eco
nd
s)
Condition1 2 3 4 5 6 7 8 9 10 11 12 13 14 15
Figure 1
GENEA SVMgs (g minutes)
Figure 2

22
22
Figure Captions
Figure 1 Inset right Overhead view of GENEA accelerometers positioned in the test jig Inset
left Multi-Axis Shaker Table (MAST) complete with the test jig secured in place Main Figure
Comparison of a typical output trace from one GENEA accelerometer across the 15 test
conditions
Notes i) the trace represents the middle 50 seconds of each of the 15 conditions
Figure 2 Relationship between physical activity intensity (METS) versus the outputs from the
waist worn GENEA SVMgs (g middot minutes) RT3 (countsminute) and Actigraph (countsmin)
accelerometers across the 16 activity conditions
Table 1 Reliability results for the GENEA for all 15 test conditions
Acceleration Frequency Amplitude GENEA SVMgs
(g ∙ seconds)
CV intra
CV inter
g (mmiddots-2
) (Hz) (m) Mean SD GENEA GENEA
005 049 10 00124 3 01 39 53
022 216 10 00547 11 02 17 20
046 451 30 00127 23 02 08 14
046 451 25 00183 24 02 09 14
048 471 20 00298 25 03 10 14
049 481 15 00541 25 03 11 16
079 775 50 00079 41 04 10 15
091 893 30 00251 46 04 08 13
125 1226 45 00153 57 08 15 21
129 1265 40 00200 58 08 13 20
131 1285 35 00266 59 12 21 26
138 1354 30 00381 60 06 10 18
168 1648 45 00206 64 22 34 37
184 1805 30 00508 66 09 13 22
252 2472 45 00309 84 43 51 53
Average variability across all 15 test conditions 18 24
Table 1
Table 2 Descriptive characteristics of the study participants
Gender Sample
Size Age
Left
Handed
Right
Handed
Height
(cm)
Weight
(kg)
BMI
(kg∙m-2
)
Body Fat
()
Male 23 489 (68) 1 22 1762 (62) 806 (116) 259 (27) 207 (34)
Female 37 496 (64) 4 33 1628 (54) 629 (84) 238 (35) 328 (66)
Overall 60 494 (65) 5 55 1679 (87) 697 (130) 246 (34) 282 (81)
for the measurement of body fat there were 2 less participants (1 male and 1 female)
Table 2
Table 3 Average intensity (METS) and average left right and waist positioned GENEA output by activity
GENEA
(SVMgs (g middot minutes)
Actigraph (CountsMinute)
RT3 (VM CountsMinute)
Activity Grouping
N METS Left Wrist Right Wrist Waist Waist Waist
Mean SD Mean SD Mean SD Mean SD Mean SD Mean SD
Lateral Recumbent (lying on side) Posture
(all)
53 094 023 63 55 143 53 34 17 0 0 4 11
Seated Computer Work 55 122 029 185 86 242 67 48 33 1 3 9 21
Standing 55 113 025 100 66 103 177 48 15 0 0 3 9
Window Washing Lifestyle
(2 of 4)dagger
31 337 106 469 693 1808 708 185 61 138 177 463 344
Washing Dishes 24 235 045 634 177 768 239 132 164 51 80 160 74
Shelf Stacking 30 419 098 884 224 940 202 214 72 2620 1933 421 297
Sweeping 23 339 067 878 264 976 289 187 48 465 355 356 96
Slow Treadmill Walk (4 km∙hr-1
) Ambulatory
(all)
54 388 069 864 195 847 232 856 221 2323 643 1267 318
Medium Treadmill Walk (5 km∙hr-1
) 55 459 079 1177 299 1204 357 1264 214 3745 656 1659 331
Brisk Treadmill Walk (6 km∙hr-1
) 55 588 098 1506 400 1513 350 1815 272 4917 940 2228 450
Stair AscentDescent (80 steps∙min-1
) Stairs (all) 55 619 110 836 620 794 597 697 127 2427 780 811 208
Slow Treadmill Run (8 km∙hr-1
) Ambulatory
(1 of 3)Dagger
18 1113 138 3858 588 4087 798 3553 593 8936 1794 4578 799
Medium Treadmill Run (10 km∙hr-1
) 14 1200 124 5345 1073 4915 787 4043 325 8904 1826 5419 423
Fast Treadmill Run (12 km∙hr-1
) 5 1361 060 5096 2339 5358 2460 4066 299 6982 3233 6093 674
Brisk Free-living Walk (6 km∙hr-1
) Ambulatory
(all) 40 576 094 1433 171 1474 216 1769 227 4912 748 2434 559
Medium Free-living Run (10 km∙hr-1
) Ambulatory
(optional) 5 1262 117 5151 1113 4844 1232 3756 631 8825 1592 5525 787
listwise sample size dagger indicates that participants were randomly allocated 2 out of the 4 activities in this grouping
Dagger indicates that participants had the option to run (select 1 out of the 3 activities in this grouping) if they so chose
Note 1 MET = 35 ml∙kg∙min-1
Table 3
Table 4 Sensitivity specificity area under the ROC curve and GENEA SVMgs (g middot minutes)
cut points that maximized sensitivity and specificity at three wear positions
Intensity Sensitivity Specificity Area under ROC
curve (95 CI)
GENEA Cut points
SVMgs (g middot minutes)
Left Wrist
Sedentary 97 95 098 (098-099) lt 217
Light NA NA NA 217-644
Moderate 95 72 091 (088-093) 645-1810
Vigorous 78 98 091 (086-095) gt 1810
Right Wrist
Sedentary 99 96 098 (097-099) lt 386
Light NA NA NA 386-439
Moderate 100 56 084 (0-81-087) 440-2098
Vigorous 78 97 089 (084-094) gt 2098
Waist
Sedentary 99 96 097 (096-098) lt 77
Light NA NA NA 77-219
Moderate 96 80 093 (091-095) 220-2056
Vigorous 73 99 092 (088-096) gt 2056
Sedentary (lt15 METS) light (15-399 METS) moderate (400-699 METS) vigorous (7+
METS)
NA = not applicable as the sedentary and moderate cut points provide the boundaries for the light
intensity category
Table 4
0
10
20
30
40
50
60
70
80
90
100
GE
NE
A
SV
Mg
s (g
s
eco
nd
s)
Condition1 2 3 4 5 6 7 8 9 10 11 12 13 14 15
Figure 1
GENEA SVMgs (g minutes)
Figure 2
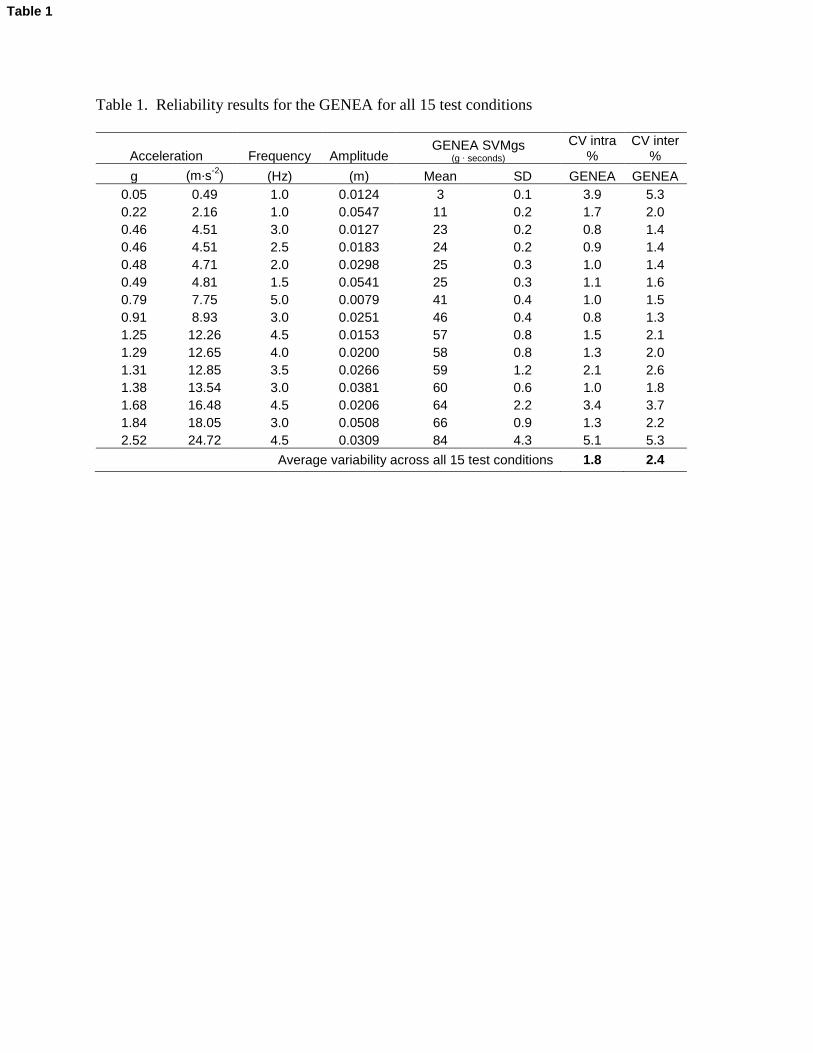
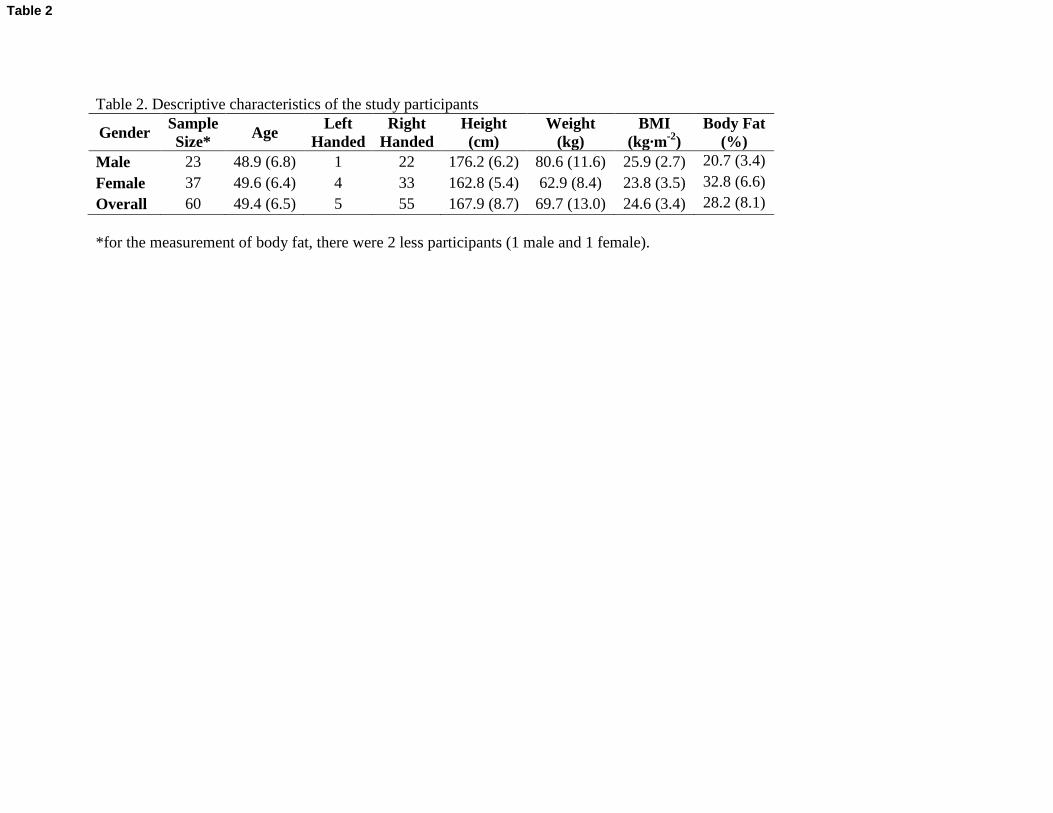
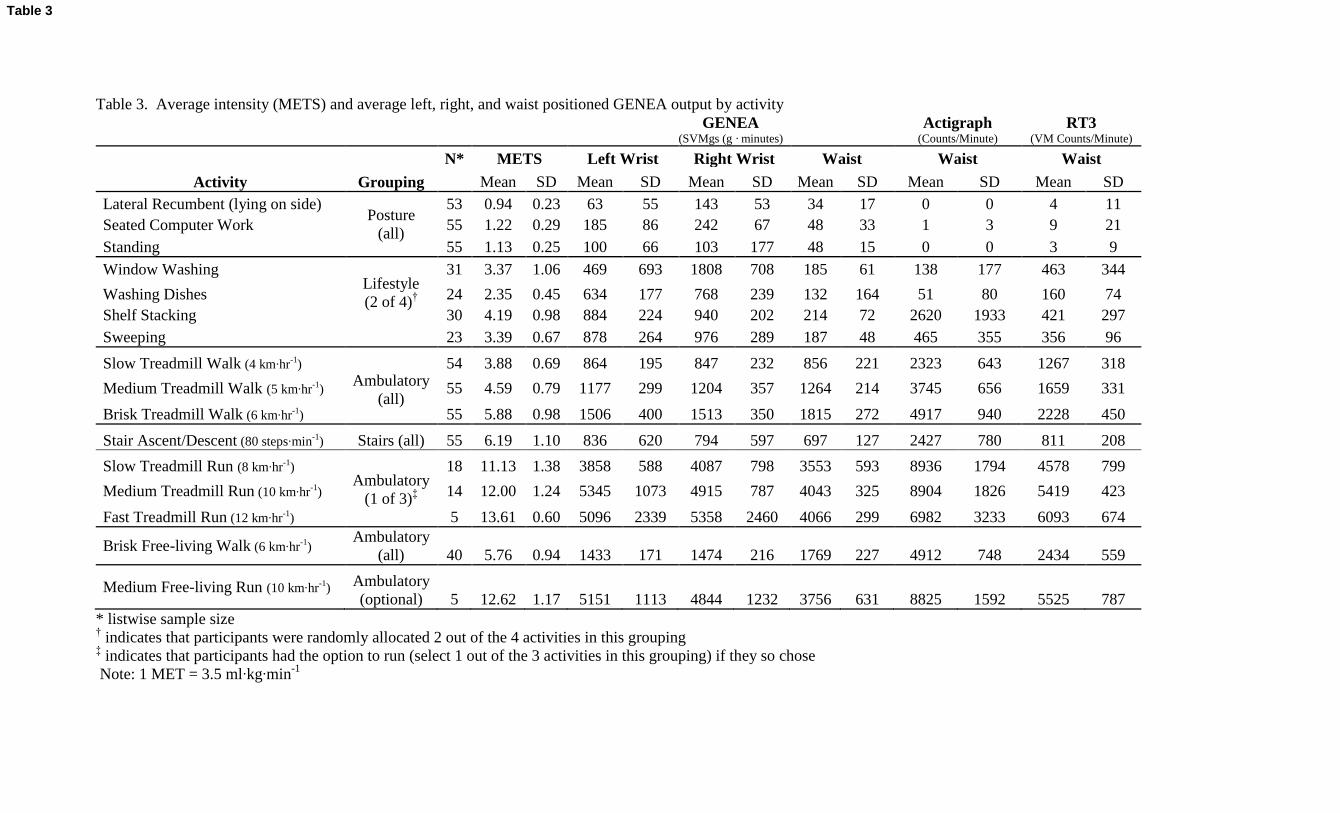
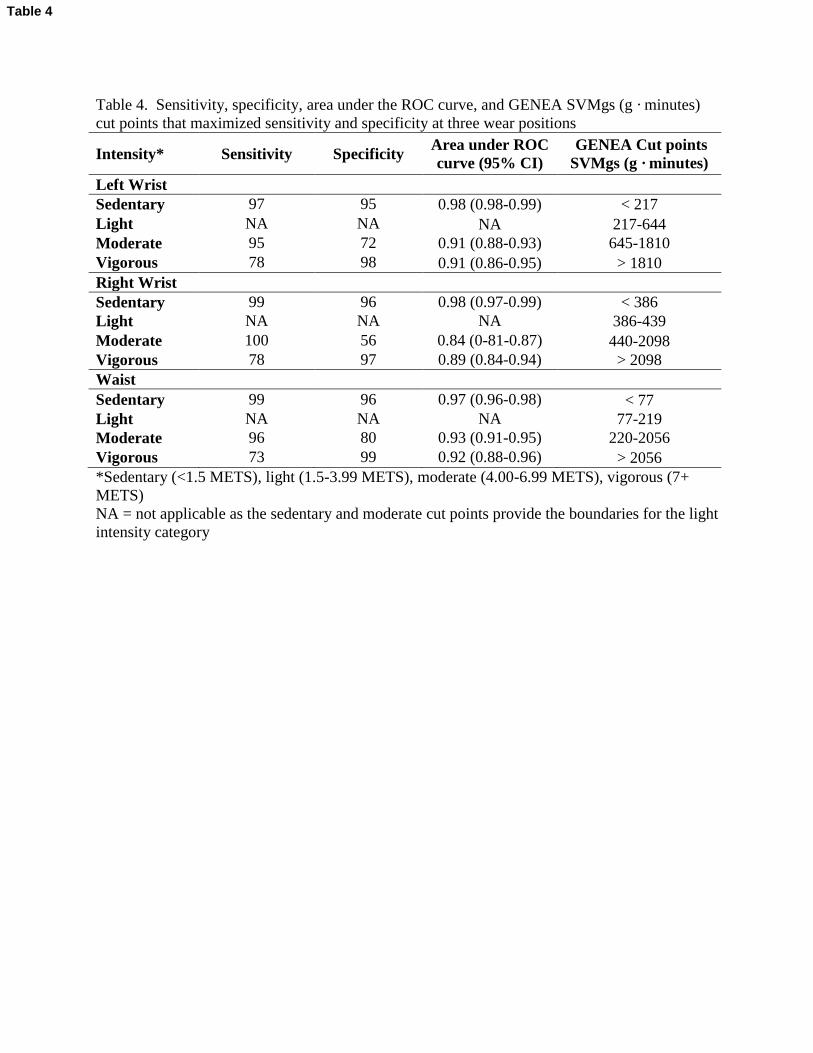
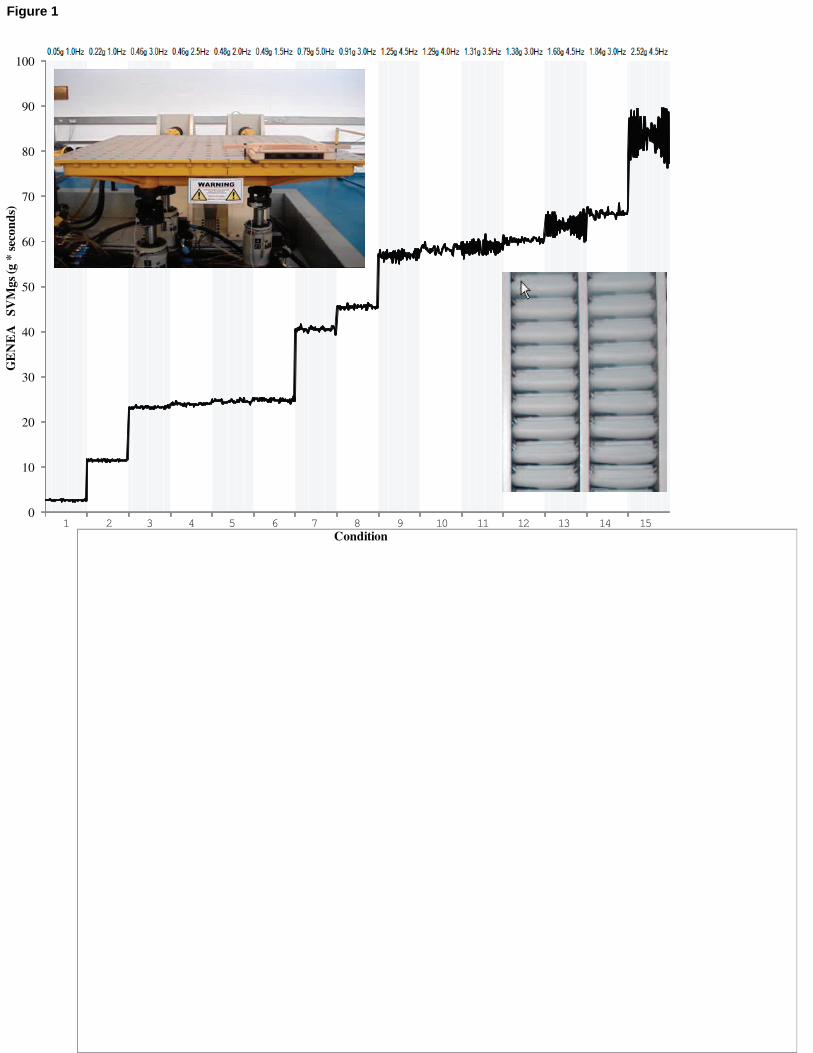
0
10
20
30
40
50
60
70
80
90
100
GE
NE
A
SV
Mg
s (g
s
eco
nd
s)
Condition1 2 3 4 5 6 7 8 9 10 11 12 13 14 15
Figure 1
GENEA SVMgs (g minutes)
Figure 2
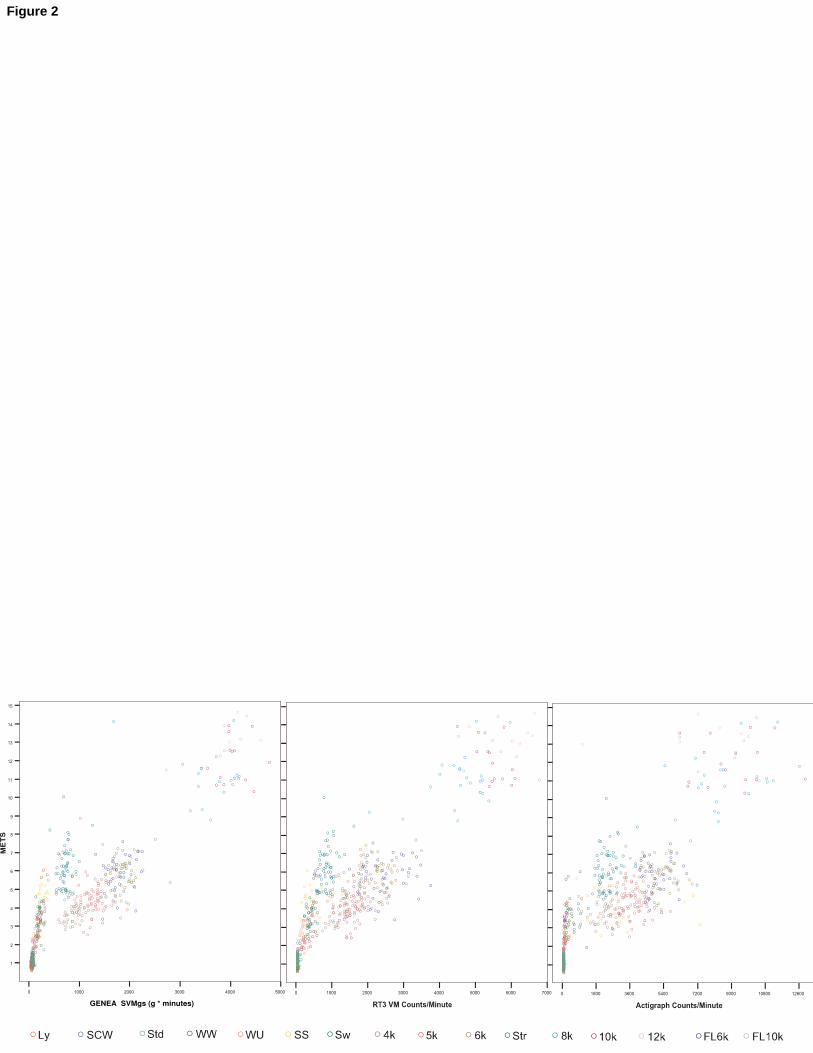
GENEA SVMgs (g minutes)
Figure 2