Embed Size (px)
Citation preview

BioMed CentralBMC Public Health
ss
Open AcceResearch articleValidation of self reported diagnosis of hypertension in a cohort of university graduates in SpainAlvaro Alonso*1,2, Juan José Beunza1,3, Miguel Delgado-Rodríguez4 and Miguel Angel Martínez-González1Address: 1Department of Preventive Medicine and Public Health, University of Navarra, Pamplona, Spain, 2Department of Epidemiology, Harvard School of Public Health, Boston, MA, USA, 3Service of Internal Medicine, University Clinic, University of Navarra, Pamplona, Spain and 4Department of Health Sciences, University of Jaén, Jaén, Spain
Email: Alvaro Alonso* - [email protected]; Juan José Beunza - [email protected]; Miguel Delgado-Rodríguez - [email protected]; Miguel Angel Martínez-González - [email protected]
* Corresponding author
AbstractBackground: The search for risk factors of hypertension requires the study of large populations.Sometimes, the only feasible way of studying these populations is to rely on self-reported data ofthe outcome. The objective of this study was to evaluate validity of self-reported diagnosis ofhypertension in a cohort of university graduates in Spain.
Methods: The Seguimiento Universidad de Navarra (SUN) Study is a cohort of more than 15,000university graduates in Spain. We selected a random sample of 79 cohort participants whoreported a diagnosis of hypertension and 48 participants who did not report such diagnosis (76%participation proportion). Then, we compared information on the self-reported diagnosis ofhypertension and hypertension status as assessed through two personal blood pressuremeasurements and an interview. Additionally, we compared self-reported and measured bloodpressure levels with intraclass correlation coefficients and the survival-agreement plot.
Results: From those 79 reporting a diagnosis of hypertension, 65 (82.3%, 95% CI 72.8–92.8) wereconfirmed through conventional measurement of blood pressure and the interview. From those 48that did not report a diagnosis of hypertension, 41 (85.4%, 95% CI 72.4–89.1) were confirmed asnon hypertensives. Results were similar among men and women, but were worse for overweightand obese individuals, and for those with a family history of hypertension. The agreement betweenself-reported and measured blood pressure levels (as a continuous variable), as estimated by theintraclass correlation coefficient, was 0.35 for both systolic and diastolic blood pressure.
Conclusion: Self-reported hypertension among highly educated participants in a cohort study is arelatively valid tool to assess the hypertensive status of participants. However, the investigatorsshould be cautious when using self-reported blood pressure values.
Published: 12 September 2005
BMC Public Health 2005, 5:94 doi:10.1186/1471-2458-5-94
Received: 02 June 2005Accepted: 12 September 2005
This article is available from: http://www.biomedcentral.com/1471-2458/5/94
© 2005 Alonso et al; licensee BioMed Central Ltd. This is an Open Access article distributed under the terms of the Creative Commons Attribution License (http://creativecommons.org/licenses/by/2.0), which permits unrestricted use, distribution, and reproduction in any medium, provided the original work is properly cited.
Page 1 of 7(page number not for citation purposes)
BMC Public Health 2005, 5:94 http://www.biomedcentral.com/1471-2458/5/94
BackgroundHigh blood pressure or hypertension (HT) is a majorhealth problem in our environment.[1] The low degree ofawareness among the population and the difficulties tocomply with prescribed treatments, stress the importanceof primary prevention of this disease.[2]
The search for risk factors of incident HT requires thestudy of large populations. Sometimes, the only feasibleway of studying these populations is to rely on self-reported data of the outcome. As a consequence, it is ofthe utmost importance to assess the validity of thatinformation.
The validity of the self-reported diagnosis of HT has beenassessed in several populations, including a subsample ofthe EPIC-Spain cohort.[3] Results vary depending on thepopulation and on the gold standard used (conventionalmeasurement of blood pressure (BP) or examination ofmedical records).
Our objective was to assess the validity of self-reporteddiagnosis of HT in a random sample of the participants inthe Seguimiento Universidad de Navarra (SUN, Univer-sity of Navarra Follow-up) study, a cohort study in Spain.
MethodsThe SUN StudyThe SUN Study is a dynamic cohort of university gradu-ates, recruited and followed up through mailed question-naires. The main objective of the study was to assess theassociation between a Mediterranean dietary pattern andthe risk of cardiovascular disease, diabetes, obesity, andHT. Its methods have been extensively described else-where.[4] Briefly, beginning in December 1999, all gradu-ates of the University of Navarra, Registered Nurses inNavarra, and members of other professional associationsreceived a questionnaire and a letter of invitation, explain-ing the objectives and design of the study. At December2004, 17,500 had answered the initial questionnaire, andthe recruitment is permanently open. Every other year, afollow-up questionnaire is mailed to each participant,gathering information about new medical diagnosis andchanges in exposures of interest. The SUN Study wasapproved by the Institutional Review Board of the Univer-sity of Navarra, and conforms to the principles embodiedin the Declaration of Helsinki.
QuestionnairesThe baseline questionnaire gathered information aboutsociodemographic variables, anthropometric measures(weight, height), lifestyle factors (smoking, physical activ-ity), diet, and clinical variables. The participants wereasked whether they had ever received a medical diagnosisof HT, their habitual use of medications, and their most
recent BP measurement (choosing among the followingcategories, in mm Hg: lower than 100, 101–110, 111–120, 121–130, 131–140, 141–150, 151–160, 161–175,greater than 175 for systolic BP; lower than 60, 61 to 70,71 to 80, 81 to 90, 91 to 100, 101 to 110, 111 to 120, 121to 130, greater than 130 for diastolic BP). This questiondid not differentiate between casual BP determinations ormore formal BP measurements carried out according todiagnostic protocols.
The follow-up questionnaire inquired about new diagno-sis of HT asking whether the participant had been diag-nosed by a physician since the last questionnaire.
Validation studyIn September 2003, there were 2,929 SUN participantsliving in the metropolitan area of Pamplona (postal codesbeginning by 310). Among them, 151 referred to behypertensive (5.2%). Based in results from the literature,[3,5,6] we assumed that 80% of them would be true casesof HT. In order to obtain an 8% precision in the estimatesand expecting 10% of non-response, we selected a ran-dom sample of 107 individuals that referred a diagnosisof HT in the baseline or in the two-year follow-up ques-tionnaires, residing in the metropolitan area of Pam-plona, that were alive and did not participate in a previousstudy on validation of diet and physical activity informa-tion. Similarly, assuming that 90% of those not reportingHT would be true normotensives, an 8% precision in theestimate and a non-response rate of 10%, we randomlyselected 61 individuals, with the same inclusion/exclu-sion criteria than for the self-reported hypertensives.
We sent them a letter with the objectives of the validationstudy, an informed consent form and a contact informa-tion form (e-mail address, telephone number and hoursto be called), together with a postage-paid envelope. Afterthree months, non-respondents were sent a second orthird mailing if needed. Finally, we tried to contact non-respondents by phone or email. A hundred and fifty two(response rate 90.5%) individuals accepted to participatein the validation study, 97 (response rate 90.7%) amongthe hypertensives and 55 among normotensives (responserate 90.2%).
After the participants gave their written consent, anappointment was made at their home, working place, orthe Check up Unit at the University Clinic for the BPmeasurement. A structured interview was done includingtwo BP measurements and a questionnaire about medica-tion use and lifestyle issues related to HT. Two medicaldoctors (AA, JJB) carried out the field work, including theBP measurements, from September 2003 to November2004. At the time of the measurement, both study
Page 2 of 7(page number not for citation purposes)

BMC Public Health 2005, 5:94 http://www.biomedcentral.com/1471-2458/5/94
physicians were unaware of the hypertensive status of theparticipant as defined in the questionnaire.
During the first minutes of the interview and with boththe participant and the investigator sited down, the inves-tigator explained the participant the objectives of thestudy, the type of interview, the BP measurements proce-dure and the confidentiality of the information. Then, thefirst BP measurement was done using an automatic BPmeasurement device Omrom M4-I. This device has beenpreviously validated. [7] After another five minutes, usedto complete the rest of the questionnaire, the second BPmeasurement was done. Hypertensive patients under drugtherapy were not asked to stop using antihypertensivemedication, because current use of antihypertensive med-ication was considered confirmatory of being truehypertensives.
A total of 127 participants (83.6%) completed the valida-tion protocol. The remaining 25 (7 normotensives and 18hypertensives) were lost either because they changed theircontact information and could not be located, theyrefused to participate, failed to make an appointmentwith the investigator or had changed the place of resi-dency out of the region and could not make an appoint-ment in Pamplona. Final participation amonghypertensives and normotensives was, respectively,78.7% and 73.8%.
Definition of self-reported HT and 'true' HTWe considered a participant had self-reported HT when s/he answered to have been diagnosed as hypertensive by aphysician either in the basal or in the follow-up question-naire. Otherwise, s/he was considered as non-hyperten-sive.
We considered a participant as true hypertensive when theaverage of both BP measurements was ≥140 mmHg forsystolic BP and/or ≥ 90 mmHg for diastolic BP, when s/hewas currently using antihypertensive drug treatment orwhen s/he presented a medical report with a diagnosis ofHT.[8]
Statistical analysisWe computed the proportion of confirmed cases of HT asthe number of those who reported a diagnosis of HT andhad HT according to our gold standard, divided by allthose reporting a diagnosis of HT. Similarly, we computedthe proportion of confirmed non hypertensives as thenumber of those who did not report a diagnosis of HT andwere non hypertensives according to our gold standard,divided by the total number of individuals non reportinga HT diagnosis. We studied agreement between self-reported and measured BP using a random-effects modelintraclass correlation coefficient [9] and the survival-agreement plot proposed by Luiz et al.[10] In the survival-agreement plot, the absolute difference Xi between BPmeasures was plotted in the x-axis against the proportionof pair of observations with an absolute difference equalor lower than Xi using the Kaplan-Meier method.[10] Wealso used the modification proposed by Llorca and Del-gado to detect bias in any of the measurement meth-ods.[11] According to the proposed modification, weseparated those observations with self-reported BP higherthan measured BP, and those with measured BP higherthan self-reported BP. Then, we compared absolute differ-ences both groups using the log-rank test.
To compute the sensitivity and the specificity of the self-reported diagnosis of HT, we estimated the expected dis-tribution of true and false positives and negatives in thesampled population, based on the sampling fractions andthe observed percentages of confirmed diagnosis. Then,we computed the kappa coefficient and the true preva-lence of HT in that population. Confidence interval (CI)for the prevalence of HT was estimated as suggested byCochran for stratified sampling.[12]
ResultsWe included 70 men and 57 women in our analyses.Mean age was 53 among those self-reporting HT and 37among those not reporting a HT diagnosis (range 22–83and 23–72 respectively). A total of 60 (47.3%) had a BMI≥ 25 kg/m2. Table 1 shows the main characteristics of thestudy participants.
We confirmed 65 (82.3%) of the 79 self-reported HT cases(95% CI 72.8–92.8%). Among 48 participants who didnot report a HT diagnosis in the questionnaires, 41(85.4%, 95% CI 72.4–89.1%) could be considered nor-motensives according to our gold standard (table 2). In
Table 1: Characteristics of participants in the validation study by self-reported HT status.
Self-reported HT (n = 79)
Non self-reported HT (n = 48)
Women (%) 36.8 54.2Age
≤ 40 y (%) 16.5 68.841–55 y (%) 30.4 22.9>55 y (%) 53.2 8.2
Body mass index<25 kg/m2 (%) 40.5 72.9≥ 25 kg/m2 (%) 59.5 27.1
Family history of HT (% yes)
45.6 27.1
Page 3 of 7(page number not for citation purposes)

BMC Public Health 2005, 5:94 http://www.biomedcentral.com/1471-2458/5/94
this last group, when the cut-off point for HT was 160/95instead of 140/90, the proportion of confirmed normo-tensives increased to 97.9% (95% CI 88.7% to 100%).
There were no antihypertensive drug users among thosereporting no hypertension, and 46% of those reporting adiagnosis of hypertension (36 out of 79) were taking anti-hypertensive drugs at the time of the interview. Amongthe remaining 43, only 14 (33%) had their BPmeasurements under 140/90 and were not receiving drugtreatment for hypertension.
The proportion of confirmed hypertensives was higheramong those groups with an expected higher prevalenceof HT (men, older people, and those with high BMI orwith a family history of HT). The proportion of confirmednormotensives followed an inverse pattern (table 2).
Taking into account our sampling fractions and assumingour estimate for the proportion of confirmed hyperten-sives, we expected that 124 out of the 151 individualsreporting a medical diagnosis of HT in the source popula-tion were true hypertensives (true positives) and 27 werenormotensives (false positives).
Likewise, the number of true normotensives (true nega-tives) in the source population would be 2373 (from2778 self-reported normotensives) and 405 would behypertensives (false negatives). Based on these assump-tions, the values for sensitivity, specificity and kappa coef-ficient would be 0.23, 0.99, and 0.31, respectively. Theprevalence of HT in this population was 18.1%.
In spite of the categorization used to collect self-reporteddata about BP (see above), we calculated the intraclasscorrelation coefficient and its 95% CI to assess the abso-lute agreement between self-reported BP and directlymeasured BP as a continuous variable (Table 3). In gen-eral, the correlation between self-reported and directlyobserved information was low, similar for systolic anddiastolic BP and higher for men than women.
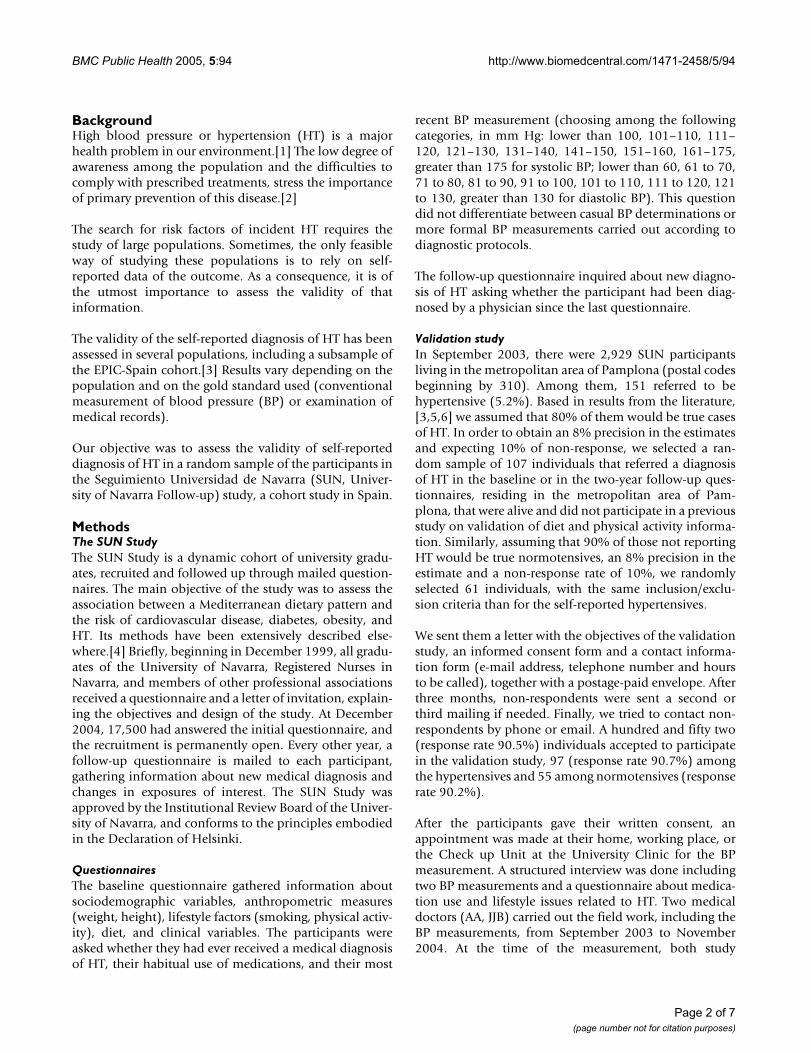
Finally, we used the survival-agreement plot to depictgraphically the agreement between self-reported and BPmeasurements (Figure 1). Using the modification of thismethod proposed by Llorca and Delgado to detect bias,we noted that measured systolic BP tended to be higherthan self-reported systolic BP (log-rank test, p = 0.0005).However, this bias was not apparent for diastolic BP (log-rank test, p = 1.00).
Table 2: Hypertension status and validity of self-reported hypertension according to relevant variables
N (%) % Confirmed HT (95% CI)§
P-value* % Confirmed non-HT (95% CI)†
P-value*
Total 127 (100) 82.3 (72.8–92.8) 85.4 (72.4–89.1)
Men 70 (55.1) 85.4 (72.8–92.8) 0.53 77.3 (56.6–89.9) 0.22Women 57 (44.9) 78.6 (60.5–89.8) 92.3 (75.9–97.9)
Age 0.27 0.73≤ 40 46 (36.2) 69.2 (42.4–87.3) 87.9 (72.7–95.2)41–55 35 (27.6) 79.2 (59.5–90.8) 81.8 (52.3–94.9)>55 46 (36.2) 88.1 (75.0–94.8) 75.0 (30.1–95.4)
Body mass index (kg/m2) 0.84 0.37<25 67 (52.7) 81.3 (64.9–71.1) 88.6 (74.0–95.5)≥ 25 60 (47.3) 83.0 (70.9–91.1) 76.9 (49.7–91.8)
Family history of HT 0.01 0.004No 78 (61.4%) 72.1 (57.3–83.3) 94.3 (81.4–98.4)Yes 49 (38.6%) 94.4 (81.9–98.5) 61.5 (35.5–82.3)
Biomedical degree 0.72 0.32No 101 (61.4%) 81.0 (69.6–88.8) 81.6 (66.6–90.8)Yes 26 (38.6%) 87.5 (64.0–96.5) 100.0 (72.2–100.0)
HT: hypertension. CI: confidence interval.§True positives (according to both methods)/Positives (according to self-reporting)† True negatives (according to both methods)/Negatives (according to self-reporting)* Pearson's chi squared
Page 4 of 7(page number not for citation purposes)
BMC Public Health 2005, 5:94 http://www.biomedcentral.com/1471-2458/5/94
DiscussionOur findings showed an acceptable degree of confirma-tion of self-reported diagnoses of HT, but the overallagreement was not very high. Particularly, our assump-tions for HT prevalence and taking into account the sam-pling fractions, the sensitivity and the kappa coefficientwere low. On the other side, specificity was excellent.Although these results may seem discouraging, we shouldconsider that the use of self-reported diagnoses with lowsensitivity but very high specificity in a cohort study donot represent a substantial drawback, because it is verylikely that HT, as other chronic diseases, will end eventu-ally showing themselves up during the follow-up of par-ticipants. Then, in this particular setting, it would be moreimportant to retain a high specificity, hoping that in thelong-term new cases of HT will eventually be diagnosed.In addition, it is important not to forget that all except oneof our false negative cases disappeared when the cut-offpoint for HT was 160/95 instead of 140/90 mmHg, andthat there were no individuals taking antihypertensivemedication among those reporting normal bloodpressure.
Several studies with different methodology have evalu-ated the validity of self-reported diagnosis of HT. Forexample, in the EPIC-Murcia cohort, the kappa coefficientbetween self-reported and medical record-based diagnosisof HT was 0.58, but the investigators did not personallymeasured the BP of participants, as we did, because theirgold standard were only the clinical records.[3] In theSouth Carolina Cardiovascular Disease PreventionProject, the sensitivity, specificity and positive andnegative predictive values were, respectively, 79, 91, 76and 93 for white women, and 62, 91, 75, and 85 for white
men, with no differences between overweight and normalweight subjects.[13] In a sample of Finnish individuals,self-reported HT was confirmed reviewing medicalrecords, obtaining similar results.[6] In the NationalHealth and Nutritional Examination Survey III, thesensitivity for the self-reported diagnosis of HT was 71%and the specificity 90%.[14] Other studies have foundsimilar results. [15-18] Finally, in the Nurses' HealthStudy and the Health Professional Follow-up Study, witha design similar to the SUN Study, the observed concord-ance rates among true HT diagnosis and self-reportedcases of HT were comparable to ours. [5,19]
Our study has several drawbacks. First, the number ofstudy subjects was relatively small and, thus, validity esti-mations had wide confidence intervals. Particularly, theseparate analysis for different subgroups should be inter-preted cautiously. Second, our 'gold standard', two iso-lated BP measurements, has a limited validity. Actually,HT diagnosis should be based on multiple BP measure-ments, taken on separate occasions. [8,20] Third, ourstudy design did not allow the direct computation of con-fidence intervals for sensitivity, specificity and the kappastatistic. On the other side, the high educational level ofour study participants ensures that health care utilizationand, consequently, HT diagnosis are not influenced byeducational status. And, finally, the physicians that per-formed the BP measurements were unaware of the ques-tionnaire answers, making both assessments of HT
Table 3: Intraclass correlation coefficients (95% CI) between self-reported Blood Pressure* and directly measured blood pressure §
Systolic BP Diastolic BP
Total 0.35 (0.09–0.55) 0.35 (0.16–0.51)Men 0.36 (0.01–0.62) 0.45 (0.20–0.64)Women 0.30 (0.01–0.54) 0.24 (-0.07–0.51)
≤ 55 years 0.29 (0.02–0.52) 0.23 (-0.04–0.47)>55 years 0.27 (-0.03–0.53) 0.41 (0.12–0.63)
BP: blood pressure. CI: confidence interval.* Seven categories for systolic BP (from <100 to >150 mmHg) and 7 categories for diastolic BP (<60 to >130) were offered for participants' choice in the questionnaire. We assigned to each category its middle point (95 to 155 mmHg for systolic and 55 to 135 mmHg for diastolic BP) in order to compute the correlation coefficients.§ The average of two measurements taken 5 minutes apart.
Survival-agreement plot, as proposed by Luiz et al.[10]Figure 1Survival-agreement plot, as proposed by Luiz et al.[10] The x-axis shows the absolute difference between self-reported and measured blood pressure (BP), and the y-axis shows the pro-portion of observations with differences that are at least the observed difference. Separate lines for systolic and diastolic BP.
0
0.1
0.2
0.3
0.4
0.5
0.6
0.7
0.8
0.9
1
0 10 20 30 40 50 60 70 80 90
Absolute difference (mmHg)
Dis
co
rda
nc
ep
rop
ort
ion
Systolic BP
Diastolic BP
Page 5 of 7(page number not for citation purposes)
BMC Public Health 2005, 5:94 http://www.biomedcentral.com/1471-2458/5/94
diagnosis completely independent, a condition requiredfor validation studies.
The observed agreement between observed and self-reported values of systolic and diastolic BP, as expressedby the intraclass correlation coefficient and the survival-agreement plot, was not high. However, BP levels have ahigh within-person variability and, in fact, BP is very dif-ficult to track in a population (tracking being defined asthe stability of a certain variable over time or the predict-ability of later values from earlier measurements).[21] Infact, systolic BP measurements tended to be higher thanself-reported BP in our population, probably due to a realincrease in BP levels over time and also due to a possiblewhite-coat effect.[22]
Finally, we acknowledge that some misclassification willalways exist in the self-reported diagnosis of HT. But, onthe other side, the study of large populations would beunfeasible if we could only rely on conventional measure-ments, given the high amount of resources required toperform an accurate diagnosis of HT. The trade-offbetween precision and sample size has to be kept in mind.
ConclusionIn conclusion, self-reported HT diagnosis in the SUNStudy participants showed enough validity as to be usedin this large cohort study. However, our results do notsupport the use of self-reported BP levels (i.e. a continu-ous variable) as a valid measurement of usual BP levels.
List of abbreviationsBP: blood pressure
CI: confidence interval
HT: hypertension
SUN: Seguimiento Universidad de Navarra, University ofNavarra Follow-up Study
Competing interestsThe author(s) declare that they have no competinginterests.
Authors' contributionsAA participated in the study design, the acquisition ofdata, the study analysis, and the first drafting of the man-uscript. JJB participated in the acquisition of data and inthe interpretation of results. MDR participated in thestudy design and in the interpretation of data, and pro-vided statistical expertise. MAM have made substantialcontributions to conception and design of the study, par-ticipated in the statistical analysis and the interpretationof data. All authors participated have revised the manu-
script for important intellectual content and read andapproved the final manuscript.
AcknowledgementsThe authors thank the collaboration of the participants in the SUN Study. The SUN Study has received funding from the Spanish Ministry of Health (Grants PI030678, PI040233 and G03/140), the Navarra Regional Govern-ment (PI41/2005) and the University of Navarra. Dr. Alonso was supported partially by a Fulbright fellowship and a MMA Foundation grant.
References1. Wolf-Maier K, Cooper RS, Banegas JR, Giampaoli S, Hense HW, Jof-
fres M, Kastarinen M, Poulter NR, Primatesta P, Rodríguez-Artalejo F,Stegmayr B, Thamm M, Tuomilehto J, Vanuzzo D, Vescio F: Hyper-tension prevalence and blood pressure levels in 6 Europeancountries, Canada, and the United States. Journal of the Ameri-can Medical Association 2003, 289:2363-2369.
2. Whelton PK, He J, Appel LJ, Cutler JA, Havas S, Kotchen TA, RoccellaEJ, Stout R, Vallbona C, Winston MC, Karimbakas J, for the NationalHigh Blood Pressure Education Program Coordinating Committee:Primary prevention of hypertension: clinical and publichealth advisory from the National High Blood Pressure Edu-cation Program. Journal of the American Medical Association 2002,288:1882-1888.
3. Tormo MJ, Navarro C, Chirlaque MD, Barber X: Validation of selfdiagnosis of high blood pressure in a sample of the SpanishEPIC cohort: overall agreement and predictive values. EpicGroup of Spain. J Epidemiol Community Health 2000, 54:221-226.
4. Martínez-González MA, Sánchez-Villegas A, de Irala-Estévez J, MartíA, Martínez JA: Mediterranean diet and stroke: objectives anddesign of the SUN Project. Nutritional Neuroscience 2002, 5:65-73.
5. Colditz GA, Martin P, Stampfer MJ, Willett WC, Sampson L, RosnerB, Hennekens CH, Speizer FE: Validation of questionnaire infor-mation on risk factors and disease outcomes in a prospectivecohort study of women. American Journal of Epidemiology 1986,123:894-900.
6. Haapanen N, Miilunpalo S, Pasanen M, Oja P, Vuori I: Agreementbetween questionnaire data and medical records of chronicdiseases in middle-aged and elderly Finnish men and women.American Journal of Epidemiology 1997, 145:762-769.
7. Artigao M, Llavador J, Rubio M, Torres C, López J, Sanchís C, Vidal A,Puras A: Evaluation of two devices for self-measurement ofblood pressure according to the British Hypertension Soci-ety protocol: The Omrom M4 and MX2. American Journal ofHypertension 1998, 16:S276.
8. Chobanian AV, Bakris GL, Black HR, Cushman WC, Green LA, IzzoJLJ, Jones DW, Materson BJ, Oparil S, Wright JTJ, Roccella EJ, NationalHigh Blood Pressure Education Program Coordinating Committee:The Seventh Report of the Joint National Committee onPrevention, Detection, Evaluation, and Treatment of HighBlood Pressure: The JNC 7 Report. JAMA 2003, 289:2560-2571.
9. Shrout PE, Fleiss JL: Intraclass correlations: uses in assessingrater reliability. Psychological Bulletin 1979, 86:420-428.
10. Luiz RR, Leal Costa AJ, Kale PL, Werneck GL: Assessment ofagreement of a quantitative variable: a new graphicalapproach. Journal of Clinical Epidemiology 2003, 56:963-967.
11. Llorca J, Delgado-Rodríguez M: Survival techniques were used toassess agreement of a quantitative variable. Journal of ClinicalEpidemiology 2005, 58:314-315.
12. Cochran WG: Stratified random sampling. In Sampling Tech-niques 3rd edition. Edited by: Cochran WG. New York, John Wileyand Sons; 1977:89-114.
13. Giles WH, Croft JB, Keenan NL, Lane MJ, Wheeler FC: The validityof self-reported hypertension and correlates of hypertensionawareness among blacks and whites within the stroke belt.American Journal of Preventive Medicine 1995, 11:163-169.
14. Vargas CM, Burt VL, Gillum RF, Pamuk ER: Validity of self-reported hypertension in the National Health and NutritionExamination Survey III, 1988-1991. Preventive Medicine 1997,26:678-685.
15. Bush TL, Miller SR, Golden AL, Hale WE: Self-report and medicalrecord report agreement of selected medical conditions inthe elderly. American Journal of Public Health 1989, 79:1554-1556.
Page 6 of 7(page number not for citation purposes)
BMC Public Health 2005, 5:94 http://www.biomedcentral.com/1471-2458/5/94
Publish with BioMed Central and every scientist can read your work free of charge
"BioMed Central will be the most significant development for disseminating the results of biomedical research in our lifetime."
Sir Paul Nurse, Cancer Research UK
Your research papers will be:
available free of charge to the entire biomedical community
peer reviewed and published immediately upon acceptance
cited in PubMed and archived on PubMed Central
yours — you keep the copyright
Submit your manuscript here:http://www.biomedcentral.com/info/publishing_adv.asp
BioMedcentral
16. Kehoe R, Wu SY, Leske MC, Chylack LTJ: Comparing self-reported and physician reported medical history. AmericanJournal of Epidemiology 1994, 139:813-818.
17. Martin LM, Leff M, Calonge N, Garrett C, Nelson DE: Validation ofself-reported chronic conditions and health services in amanaged care population. American Journal of Preventive Medicine2000, 18:215-218.
18. Bergmann MM, Jacobs EJ, Hoffmann K, Boeing H: Agreement ofself-reported medical history: comparison of an in-personinterview with a self-administered questionnaire. EuropeanJournal of Epidemiology 2004, 19:411-416.
19. Ascherio A, Rimm EB, Giovanucci EL, Colditz GA, Rosner B, WillettWC, Sacks FM, Stampfer MJ: A prospective study of nutritionalfactors and hypertension among US men. Circulation 1992,86:1475-1484.
20. European Society of Hypertension - European Society of CardiologyGuidelines Committee: 2003 European Society of Hypertension- European Society of Cardiology guidelines for the manage-ment of arterial hypertension. Journal of Hypertension 2003,21:1011-1053.
21. Wilsgaard T, Jacobsen BK, Schirmer H, Thune I, Lochen ML, NjolstadI, Arnesen E: Tracking of cardiovascular risk factors. TheTromso Study, 1979-1995. American Journal of Epidemiology 2001,154:418-426.
22. Hoegholm A, Kristensen KS, Madsen NH, Svendsen TL: White coathypertension diagnosed by 24-h ambulatory monitoring.Examination of 159 newly diagnosed hypertensive patients.American Journal of Hypertension 1992, 5:64-70.
Pre-publication historyThe pre-publication history for this paper can be accessedhere:
http://www.biomedcentral.com/1471-2458/5/94/prepub
Page 7 of 7(page number not for citation purposes)