Embed Size (px)
Citation preview
13th World Conference on Earthquake Engineering Vancouver, B.C., Canada
August 1-6, 2004 Paper No. 2581
VALIDATION OF SEISMIC DESIGN CRITERIA FOR CONCRETE
FRAMES BASED ON MONTE CARLO SIMULATION AND FULL–SCALE PSEUDODYNAMIC TESTS
Fabio BIONDINI 1, Giandomenico TONIOLO 1
SUMMARY The paper presents an accurate method to quantify the behavior factor of structural systems, by means of a full probabilistic evaluation of the involved quantities. The criteria of the probabilistic evaluation of seismic capacity are based on Monte Carlo method for which hundreds of dynamic analyses are performed with different material properties and seismic actions. The ground motions are described by artificial accelerograms compatible with the response spectrum assumed in Eurocode 8. The assessment of the design rules of the Eurocode is made with reference to two reinforced concrete frames, one representing a cast-in-situ structure, the other representing a precast structure, both analyzed in four levels of sway stiffness. The results are expressed in terms of frequency distribution curves of the overstrength ratio between actual and design seismic capacity. The results show that cast-in-situ and precast frames have the same seismic behavior with respect to ductility resources and ultimate capacity. The experimental verification of these theoretical results is also found by means of pseudodynamic tests on full-scale cast-in-situ and precast prototypes. The results of the tests are presented and compared with the results of a numerical simulation. The good agreement between numerical and experimental results confirms the reliability of the theoretical model and, with it, the results of the statistical analysis too.
INTRODUCTION Eurocode 8 (EC8), like many other codes for the seismic design of structures, defines the design seismic actions for an elastic analysis of the structure. These actions represent the forces corresponding to the peak acceleration of the structure subjected to the ground motion. They are properly reduced by a coefficient q called behavior factor in order to take into account the actual behavior of the structure, which has some resources able to attenuate the effects of the ground motion (ductility, overstrength, damping, redundancy). EC8 gives a scale of q-factors related to the different types of structures, with their potential capacity of energy dissipation conventionally evaluated on the base of the ultimate failure mechanism. At present such q-values are defined more or less on the base of empirical choices, not supported by a rigorous investigation of sufficient reliability. Therefore, even if the experience of different seismic countries contributed to this definition through compromises reached during the works of the competent 1 Dept. of Structural Engineering, Technical University of Milan. P.za L. da Vinci, 32 – 20133 Milan (Italy). [email protected], [email protected]
European committee, such empirical procedure may lead to unjustified inequalities between different materials and structures.
The paper is dedicated to the validation of the seismic design criteria proposed by EC8 for a specific type of reinforced concrete structure, consisting of the one-storey frames largely employed for industrial buildings. In particular, in order to try a more reliable definition of the behavior factor for such kind of structures, an accurate method based on a full probabilistic analysis of the seismic structural response is presented. The criteria of the probabilistic procedure are based on Monte Carlo simulation, for which hundreds of dynamic analyses are performed with different material properties and seismic actions. The ground motions are described by artificial accelerograms, generated so to be compatible with the response spectrum assumed in EC8.
Based on such criteria, the assessment of EC8 design rules is made with reference to two reinforced concrete frames, one representing a cast-in-situ structure, the other representing a precast structure, both analyzed in four levels of sway stiffness. The overstrength ratio between the actual seismic capacity obtained by the simulation process and the design seismic capacity deduced by the criteria of EC8 is assumed as representative quantity of the seismic structural performance. The results of the probabilistic analysis are expressed in terms of frequency distribution curves of the overstrength, which show that cast-in-situ and precast frames have the same seismic behavior with respect to ductility resources and ultimate capacity. Finally, the experimental verification of these theoretical results is searched for by means of pseudodynamic tests on full-scale cast-in-situ and precast structures. The results of the tests are presented and compared with the results of a numerical simulation in order to confirms the reliability of the theoretical model and, with it, the results of the statistical analysis too.
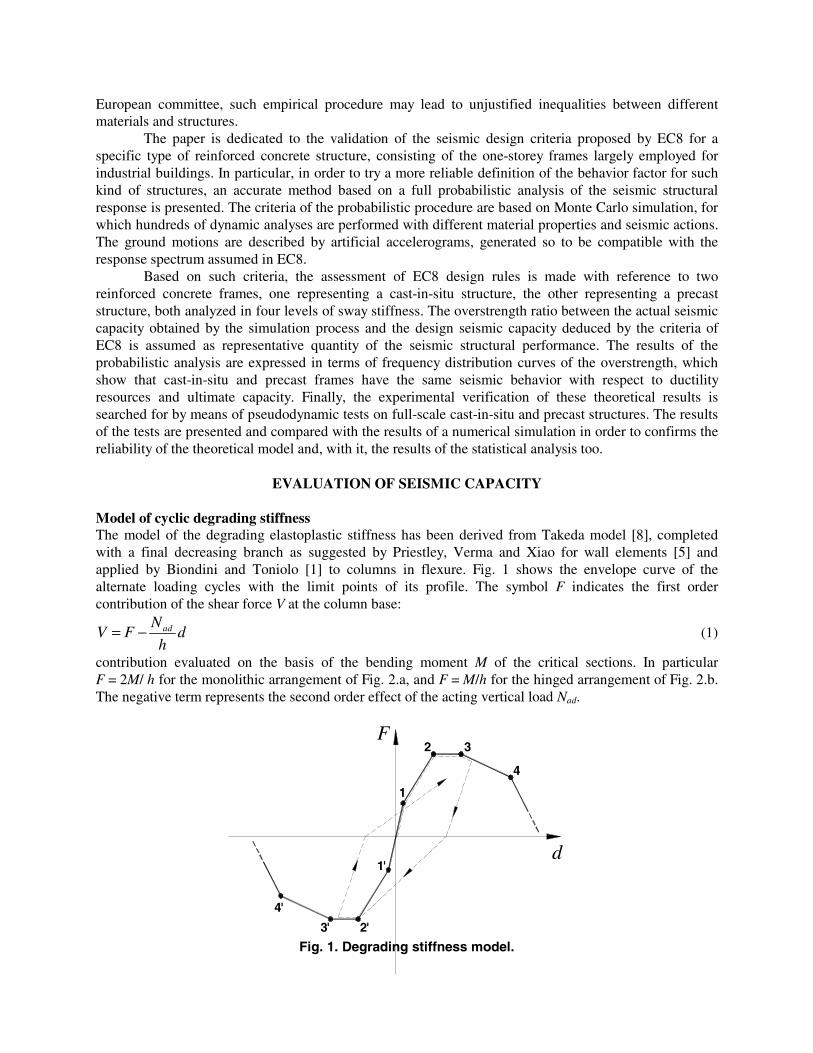
EVALUATION OF SEISMIC CAPACITY Model of cyclic degrading stiffness The model of the degrading elastoplastic stiffness has been derived from Takeda model [8], completed with a final decreasing branch as suggested by Priestley, Verma and Xiao for wall elements [5] and applied by Biondini and Toniolo [1] to columns in flexure. Fig. 1 shows the envelope curve of the alternate loading cycles with the limit points of its profile. The symbol F indicates the first order contribution of the shear force V at the column base:
dh
NFV ad−= (1)
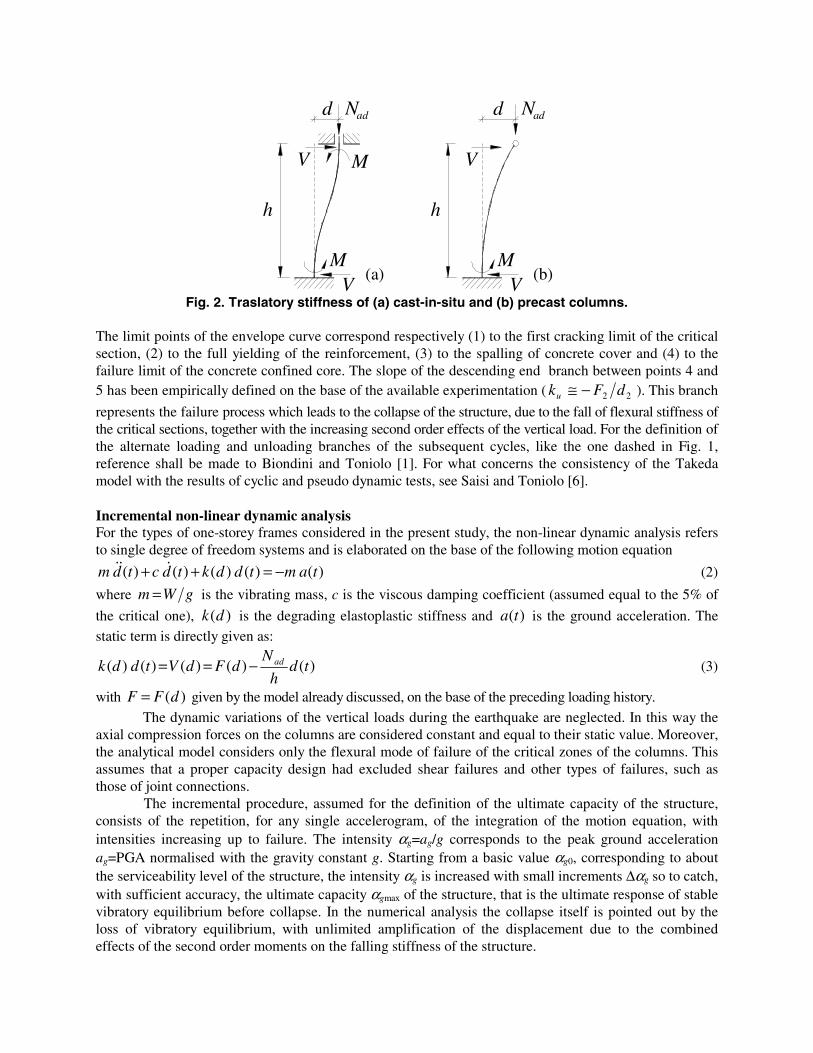
contribution evaluated on the basis of the bending moment M of the critical sections. In particular F = 2M/ h for the monolithic arrangement of Fig. 2.a, and F = M/h for the hinged arrangement of Fig. 2.b. The negative term represents the second order effect of the acting vertical load Nad.
1
F
d1'
4
4'
2 3
2'3' Fig. 1. Degrading stiffness model.
h
MV
Nadd
MV
(a)V
h
M(b)
Nd
V
ad
Fig. 2. Traslatory stiffness of (a) cast-in-situ and (b) precast columns.
The limit points of the envelope curve correspond respectively (1) to the first cracking limit of the critical section, (2) to the full yielding of the reinforcement, (3) to the spalling of concrete cover and (4) to the failure limit of the concrete confined core. The slope of the descending end branch between points 4 and 5 has been empirically defined on the base of the available experimentation ( 22 dFku −≅ ). This branch
represents the failure process which leads to the collapse of the structure, due to the fall of flexural stiffness of the critical sections, together with the increasing second order effects of the vertical load. For the definition of the alternate loading and unloading branches of the subsequent cycles, like the one dashed in Fig. 1, reference shall be made to Biondini and Toniolo [1]. For what concerns the consistency of the Takeda model with the results of cyclic and pseudo dynamic tests, see Saisi and Toniolo [6]. Incremental non-linear dynamic analysis For the types of one-storey frames considered in the present study, the non-linear dynamic analysis refers to single degree of freedom systems and is elaborated on the base of the following motion equation
)( )( )()( )( tamtddktdctdm −=++ &&& (2)
where gWm = is the vibrating mass, c is the viscous damping coefficient (assumed equal to the 5% of
the critical one), )(dk is the degrading elastoplastic stiffness and )(ta is the ground acceleration. The static term is directly given as:
)()()()( )( tdh
NdFdVtddk ad−== (3)
with )(dFF = given by the model already discussed, on the base of the preceding loading history. The dynamic variations of the vertical loads during the earthquake are neglected. In this way the axial compression forces on the columns are considered constant and equal to their static value. Moreover, the analytical model considers only the flexural mode of failure of the critical zones of the columns. This assumes that a proper capacity design had excluded shear failures and other types of failures, such as those of joint connections. The incremental procedure, assumed for the definition of the ultimate capacity of the structure, consists of the repetition, for any single accelerogram, of the integration of the motion equation, with intensities increasing up to failure. The intensity αg=ag/g corresponds to the peak ground acceleration ag=PGA normalised with the gravity constant g. Starting from a basic value αg0, corresponding to about the serviceability level of the structure, the intensity αg is increased with small increments ∆αg so to catch, with sufficient accuracy, the ultimate capacity αgmax of the structure, that is the ultimate response of stable vibratory equilibrium before collapse. In the numerical analysis the collapse itself is pointed out by the loss of vibratory equilibrium, with unlimited amplification of the displacement due to the combined effects of the second order moments on the falling stiffness of the structure.
ASSESSMENT OF EC8 DESIGN RULES Comparison between “tested” and “calculated” capacity In order to find a reliable definition of the behavior factor q assumed by EC8 for the seismic design of concrete frames, a comparison shall be made between the ultimate capacity calculated with the design rules and the ultimate capacity tested on the structure under the same seismic action. The “tested” capacity is assumed to be the characteristic value corresponding to the 5% fractile of the ultimate acceleration αgmax computed following the full probabilistic approach and with the incremental dynamic analysis described before. The input accelerograms of this analysis shall be compatible with the response spectrum of EC8. The “calculated” capacity is deduced from the EC8 rules as a function of the natural vibration period
δπ kmT 2= (4)
where m=W/g is the vibration mass corresponding to the gravity load W. The traslatory stiffness κδ of the single degree of freedom systems shown in Fig. 2, inclusive of the second order effects, is given by:
h
N
h
kk ad−=
3
12 ϕδ
h
N
h
kk ad−=
3
3 ϕδ (5)
for the cast-in-situ solution of Fig. 2a and for the precast solution of Fig. 2b, respectively, where kϕ is the flexural stiffness of the cracked cross-section subjected to the combined action of the bending moment M=0.75Mrd and the axial force N=Nad. With the reduction function η=η(T) of the design response spectrum of EC8, the calculated capacity becomes
WT
qF
g
ardgd
gd )(5.2 ηα ==
h
McF rd
rd = (6)
with c=2 for the cast-in-situ frame, c=1 for the precast frame, and where:
TTqT
TTST
TTTqT
TST
TTTST
DDC
DCC
CB
<≥=
≤≤≥=
≤≤=
for 08.0)(
for 08.0)(
for )(
2η
η
η
(7)
In the present application a subsoil type 1B is assumed (very dense sand or gravel), with S=1.2, TB=0.15 sec, TC=0.50 sec and TD=2.00 sec. The comparison between the “tested” and the “calculated” capacity can be made with reference to their ratio
gd
g
αα
κ max= (8)
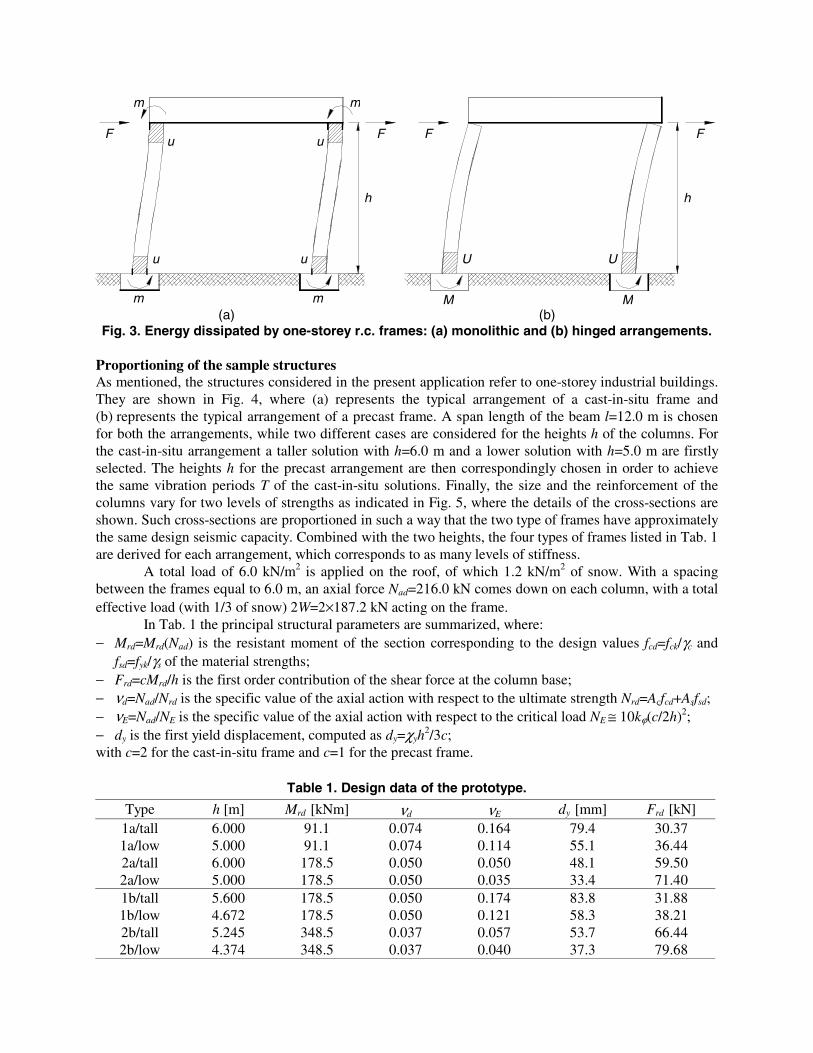
where κ =1 indicates the perfect correspondence and κ >1 indicates an overstrength of the structure with respect to the previsions of EC8 design rules. Misconceptions about the seismic behavior of precast structures The structures considered in the following refer to the structural schemes of Fig. 3, which represent the typical cast-in-situ monolithic solution and precast hinged solution, respectively. As known, some proposals would penalize the precast solution by a lower q-factor, since the critical zones where the energy dissipation develops are four in the monolithic case and only two in the hinged case. Contrarily to this assumption, the thesis assumed in this paper is that, under the same seismic force, the monolithic arrangement of Fig. 3.a, with four critical sections dimensioned for a bending moment m≅Fh/2, may dissipate the same amount of energy which the hinged arrangement of Fig. 3.b dissipates in its two critical sections, dimensioned as they are for a doubled bending moment M=Fh≅2m (4u ≅ 2U).
u
u
u
u
m m
m m
h
FF
U U
M M
F F
h
(a) (b) Fig. 3. Energy dissipated by one-storey r.c. frames: (a) monolithic and (b) hinged arrangements.
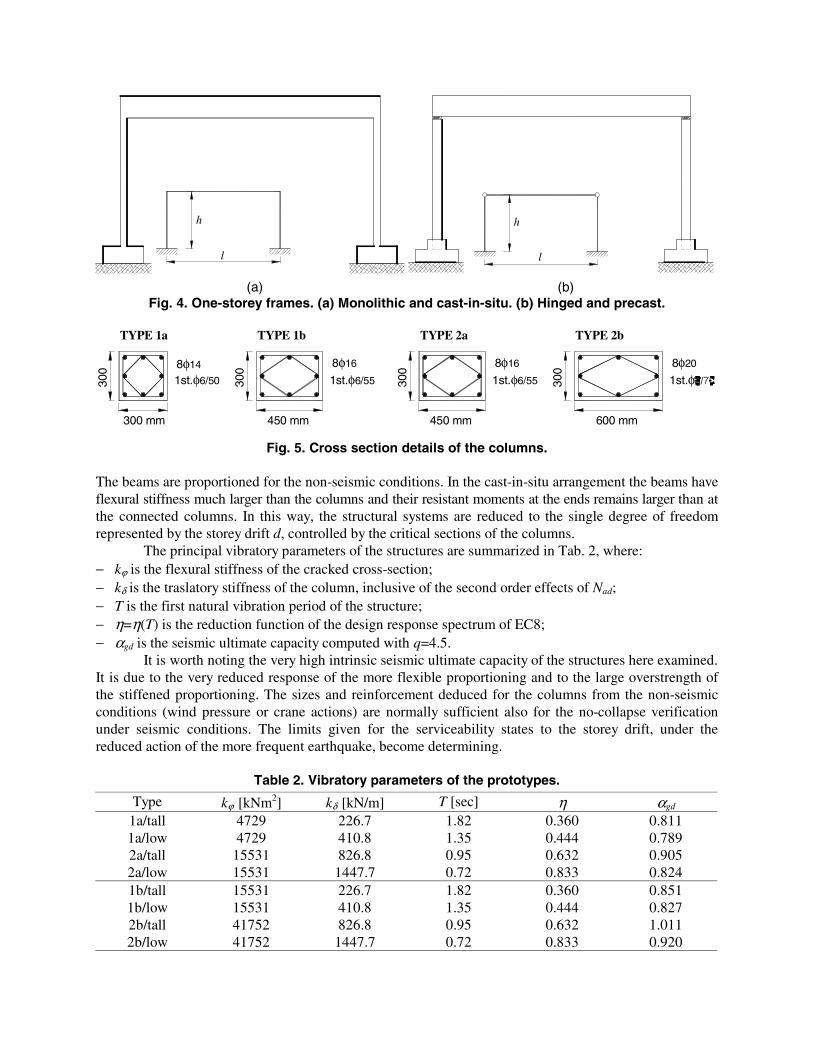
Proportioning of the sample structures As mentioned, the structures considered in the present application refer to one-storey industrial buildings. They are shown in Fig. 4, where (a) represents the typical arrangement of a cast-in-situ frame and (b) represents the typical arrangement of a precast frame. A span length of the beam l=12.0 m is chosen for both the arrangements, while two different cases are considered for the heights h of the columns. For the cast-in-situ arrangement a taller solution with h=6.0 m and a lower solution with h=5.0 m are firstly selected. The heights h for the precast arrangement are then correspondingly chosen in order to achieve the same vibration periods T of the cast-in-situ solutions. Finally, the size and the reinforcement of the columns vary for two levels of strengths as indicated in Fig. 5, where the details of the cross-sections are shown. Such cross-sections are proportioned in such a way that the two type of frames have approximately the same design seismic capacity. Combined with the two heights, the four types of frames listed in Tab. 1 are derived for each arrangement, which corresponds to as many levels of stiffness. A total load of 6.0 kN/m2 is applied on the roof, of which 1.2 kN/m2 of snow. With a spacing between the frames equal to 6.0 m, an axial force Nad=216.0 kN comes down on each column, with a total effective load (with 1/3 of snow) 2W=2×187.2 kN acting on the frame. In Tab. 1 the principal structural parameters are summarized, where: − Mrd=Mrd(Nad) is the resistant moment of the section corresponding to the design values fcd=fck/γc and
fsd=fyk/γs of the material strengths; − Frd=cMrd/h is the first order contribution of the shear force at the column base; − νd=Nad/Nrd is the specific value of the axial action with respect to the ultimate strength Nrd=Acfcd+Asfsd; − νE=Nad/NE is the specific value of the axial action with respect to the critical load NE ≅ 10kϕ(c/2h)2; − dy is the first yield displacement, computed as dy=χyh
2/3c; with c=2 for the cast-in-situ frame and c=1 for the precast frame.
Table 1. Design data of the prototype. Type h [m] Mrd [kNm] νd νE dy [mm] Frd [kN] 1a/tall 6.000 91.1 0.074 0.164 79.4 30.37 1a/low 5.000 91.1 0.074 0.114 55.1 36.44 2a/tall 6.000 178.5 0.050 0.050 48.1 59.50 2a/low 5.000 178.5 0.050 0.035 33.4 71.40 1b/tall 5.600 178.5 0.050 0.174 83.8 31.88 1b/low 4.672 178.5 0.050 0.121 58.3 38.21 2b/tall 5.245 348.5 0.037 0.057 53.7 66.44 2b/low 4.374 348.5 0.037 0.040 37.3 79.68
l
h h
l
(a) (b)
Fig. 4. One-storey frames. (a) Monolithic and cast-in-situ. (b) Hinged and precast.
300 mm
300 8φ14
1st.φ6/50
TYPE 1a
450 mm
TYPE 1b
300
1st.φ1st.φ6/55
8φ16
450 mm
1st.φ6/55
8φ16
300
TYPE 2a
600 mm
TYPE 2b
300
8φ20
Fig. 5. Cross section details of the columns.
The beams are proportioned for the non-seismic conditions. In the cast-in-situ arrangement the beams have flexural stiffness much larger than the columns and their resistant moments at the ends remains larger than at the connected columns. In this way, the structural systems are reduced to the single degree of freedom represented by the storey drift d, controlled by the critical sections of the columns. The principal vibratory parameters of the structures are summarized in Tab. 2, where: − kϕ is the flexural stiffness of the cracked cross-section; − kδ is the traslatory stiffness of the column, inclusive of the second order effects of Nad; − T is the first natural vibration period of the structure; − η=η(T) is the reduction function of the design response spectrum of EC8; − αgd is the seismic ultimate capacity computed with q=4.5. It is worth noting the very high intrinsic seismic ultimate capacity of the structures here examined. It is due to the very reduced response of the more flexible proportioning and to the large overstrength of the stiffened proportioning. The sizes and reinforcement deduced for the columns from the non-seismic conditions (wind pressure or crane actions) are normally sufficient also for the no-collapse verification under seismic conditions. The limits given for the serviceability states to the storey drift, under the reduced action of the more frequent earthquake, become determining.
Table 2. Vibratory parameters of the prototypes.
Type kϕ [kNm2] kδ [kN/m] T [sec] η αgd 1a/tall 4729 226.7 1.82 0.360 0.811 1a/low 4729 410.8 1.35 0.444 0.789 2a/tall 15531 826.8 0.95 0.632 0.905 2a/low 15531 1447.7 0.72 0.833 0.824 1b/tall 15531 226.7 1.82 0.360 0.851 1b/low 15531 410.8 1.35 0.444 0.827 2b/tall 41752 826.8 0.95 0.632 1.011 2b/low 41752 1447.7 0.72 0.833 0.920
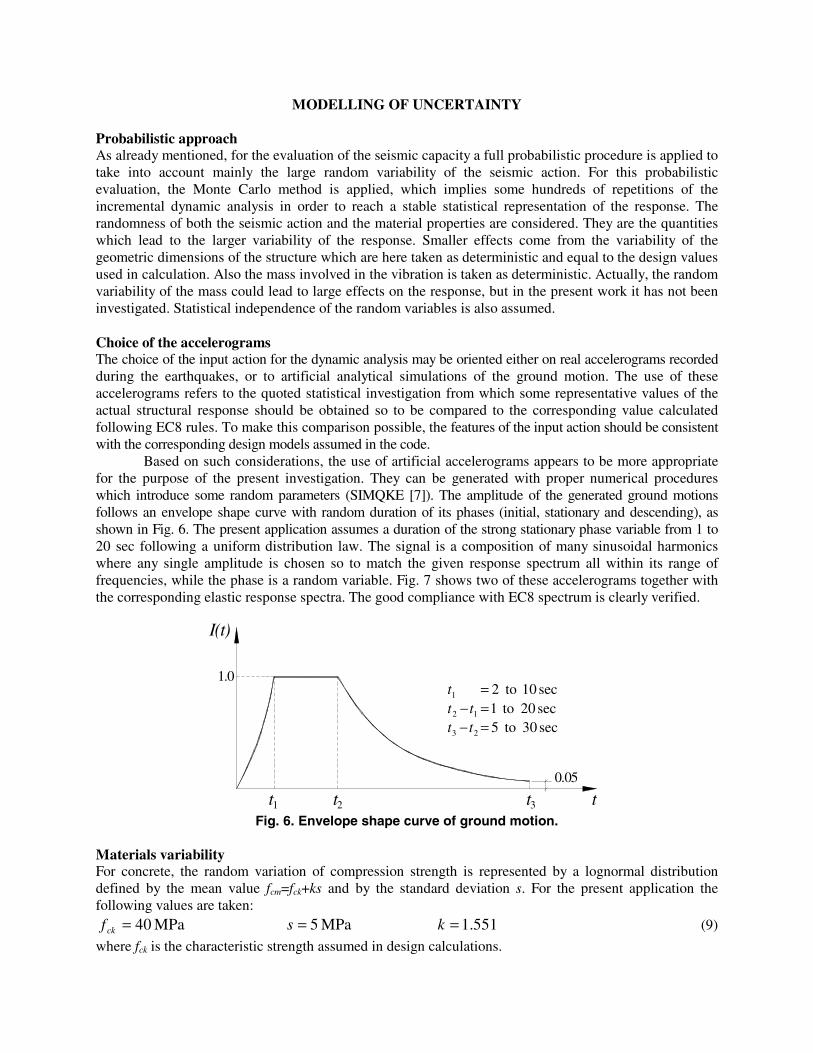
MODELLING OF UNCERTAINTY Probabilistic approach As already mentioned, for the evaluation of the seismic capacity a full probabilistic procedure is applied to take into account mainly the large random variability of the seismic action. For this probabilistic evaluation, the Monte Carlo method is applied, which implies some hundreds of repetitions of the incremental dynamic analysis in order to reach a stable statistical representation of the response. The randomness of both the seismic action and the material properties are considered. They are the quantities which lead to the larger variability of the response. Smaller effects come from the variability of the geometric dimensions of the structure which are here taken as deterministic and equal to the design values used in calculation. Also the mass involved in the vibration is taken as deterministic. Actually, the random variability of the mass could lead to large effects on the response, but in the present work it has not been investigated. Statistical independence of the random variables is also assumed. Choice of the accelerograms The choice of the input action for the dynamic analysis may be oriented either on real accelerograms recorded during the earthquakes, or to artificial analytical simulations of the ground motion. The use of these accelerograms refers to the quoted statistical investigation from which some representative values of the actual structural response should be obtained so to be compared to the corresponding value calculated following EC8 rules. To make this comparison possible, the features of the input action should be consistent with the corresponding design models assumed in the code.
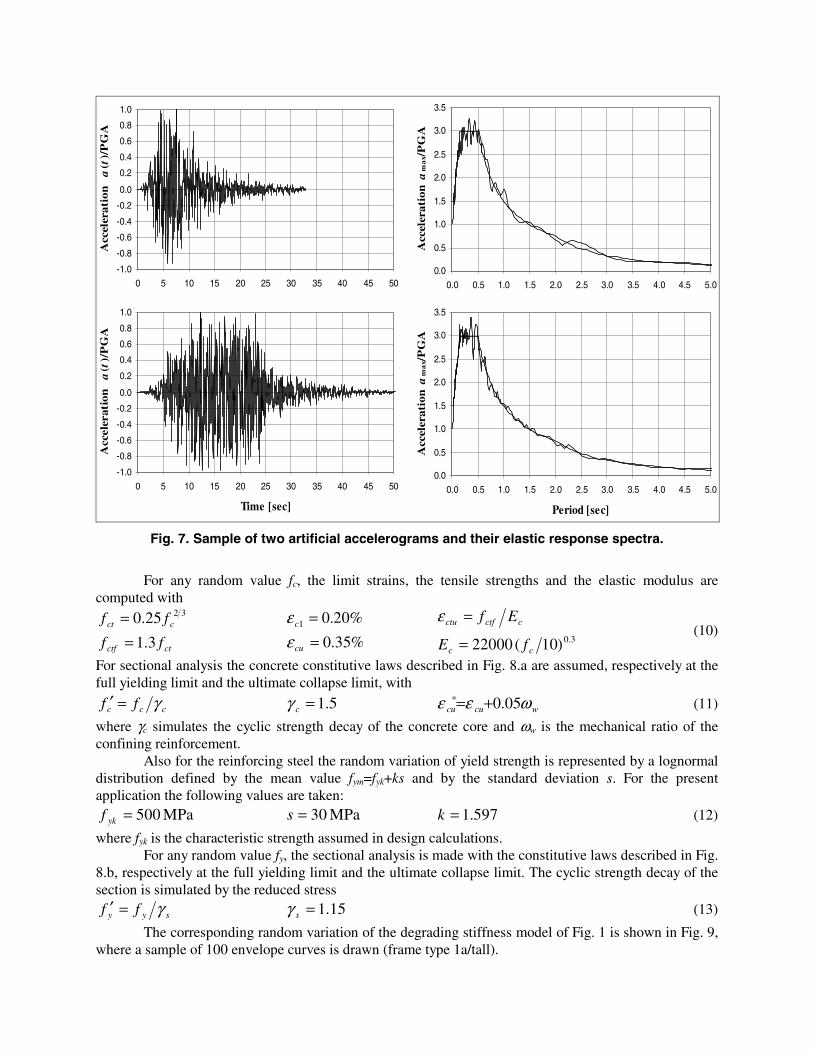
Based on such considerations, the use of artificial accelerograms appears to be more appropriate for the purpose of the present investigation. They can be generated with proper numerical procedures which introduce some random parameters (SIMQKE [7]). The amplitude of the generated ground motions follows an envelope shape curve with random duration of its phases (initial, stationary and descending), as shown in Fig. 6. The present application assumes a duration of the strong stationary phase variable from 1 to 20 sec following a uniform distribution law. The signal is a composition of many sinusoidal harmonics where any single amplitude is chosen so to match the given response spectrum all within its range of frequencies, while the phase is a random variable. Fig. 7 shows two of these accelerograms together with the corresponding elastic response spectra. The good compliance with EC8 spectrum is clearly verified.
I(t)
tt t t0.05
1 2 3
1.0
Fig. 6. Envelope shape curve of ground motion.
Materials variability For concrete, the random variation of compression strength is represented by a lognormal distribution defined by the mean value fcm=fck+ks and by the standard deviation s. For the present application the following values are taken:
MPa 40=ckf MPa 5=s 551.1=k (9)
where fck is the characteristic strength assumed in design calculations.
sec 30 to5 sec 20 to1 sec 10 to2
23
12
1
===
−−
tttt
t
Time [sec]
-1.0
-0.8
-0.6
-0.4
-0.2
0.0
0.2
0.4
0.6
0.8
1.0
0 5 10 15 20 25 30 35 40 45 50
Time [sec]
Acc
eler
atio
n
a(t
)/P
GA
-1.0
-0.8
-0.6
-0.4
-0.2
0.0
0.2
0.4
0.6
0.8
1.0
0 5 10 15 20 25 30 35 40 45 50
Time [sec]
Acc
eler
atio
n
a(t
)/P
GA
Period [sec]
0.0
0.5
1.0
1.5
2.0
2.5
3.0
3.5
0.0 0.5 1.0 1.5 2.0 2.5 3.0 3.5 4.0 4.5 5.0
Period [sec]
Acc
eler
atio
n a
ma
x/P
GA
0.0
0.5
1.0
1.5
2.0
2.5
3.0
3.5
0.0 0.5 1.0 1.5 2.0 2.5 3.0 3.5 4.0 4.5 5.0
Period [sec]
Acc
eler
atio
n a
ma
x/P
GA
Fig. 7. Sample of two artificial accelerograms and their elastic response spectra.
For any random value fc, the limit strains, the tensile strengths and the elastic modulus are computed with
ctctf
cct
ff
ff
3.1
25.0 32
==
%35.0
%20.01
==
cu
c
εε
3.0)10( 22000 cc
cctfctu
fE
Ef
=
=ε (10)
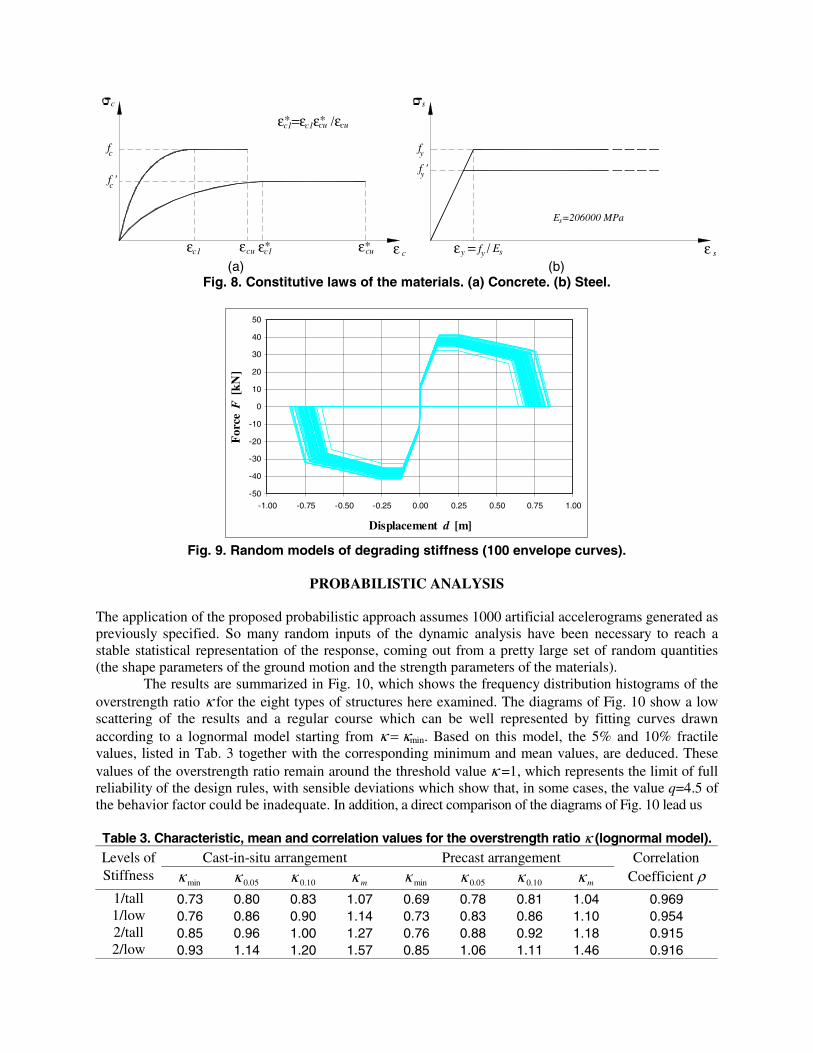
For sectional analysis the concrete constitutive laws described in Fig. 8.a are assumed, respectively at the full yielding limit and the ultimate collapse limit, with
ccc ff γ=′ 5.1=cγ wcucu ωεε 05.0+=∗ (11)
where γc simulates the cyclic strength decay of the concrete core and ωw is the mechanical ratio of the confining reinforcement.
Also for the reinforcing steel the random variation of yield strength is represented by a lognormal distribution defined by the mean value fym=fyk+ks and by the standard deviation s. For the present application the following values are taken:
MPa 500=ykf MPa 30=s 597.1=k (12)
where fyk is the characteristic strength assumed in design calculations. For any random value fy, the sectional analysis is made with the constitutive laws described in Fig. 8.b, respectively at the full yielding limit and the ultimate collapse limit. The cyclic strength decay of the section is simulated by the reduced stress
syy ff γ=′ 15.1=sγ (13)
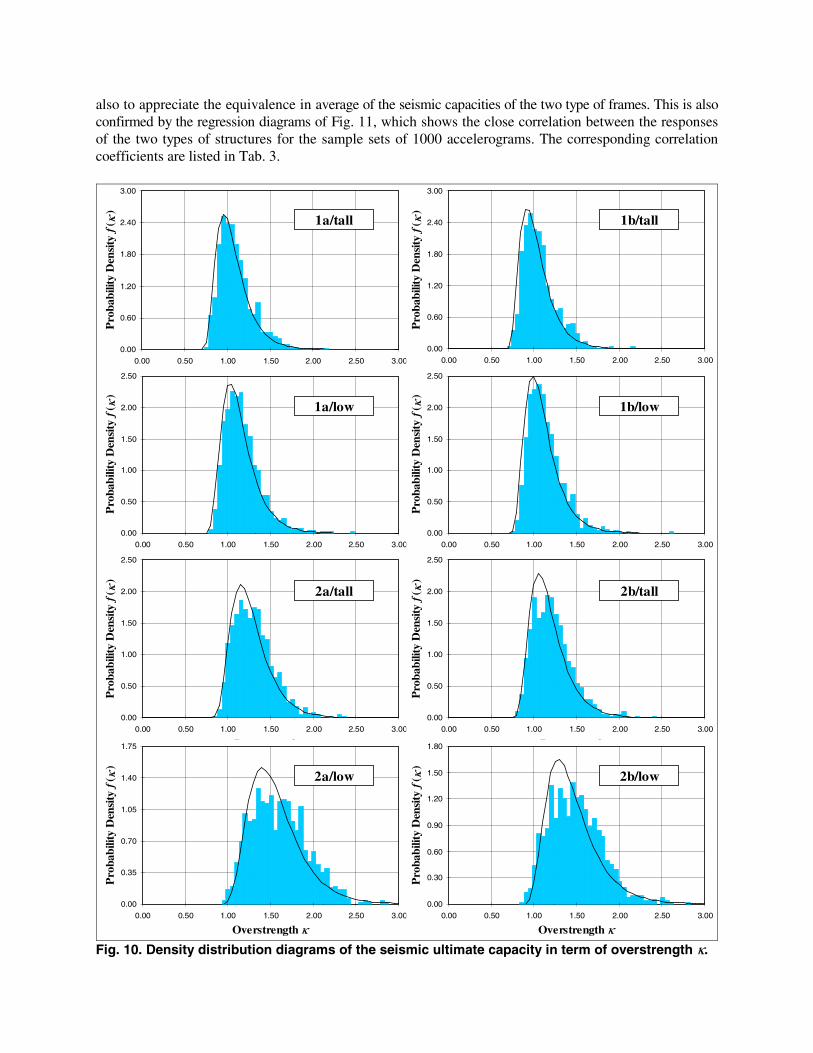
The corresponding random variation of the degrading stiffness model of Fig. 1 is shown in Fig. 9, where a sample of 100 envelope curves is drawn (frame type 1a/tall).
c
c
f
f 'c
ε
c
cuεε ε cuε∗ ∗c1 c1
cuε =ε ε /ε c1∗c1
∗cu
f
ε
s
s
y
yf '
ε = / Ey sy f
E =206000 MPas
(a) (b)
Fig. 8. Constitutive laws of the materials. (a) Concrete. (b) Steel.
-50
-40
-30
-20
-10
0
10
20
30
40
50
-1.00 -0.75 -0.50 -0.25 0.00 0.25 0.50 0.75 1.00
Displacement d [m]
For
ce F
[kN
]
Fig. 9. Random models of degrading stiffness (100 envelope curves).
PROBABILISTIC ANALYSIS
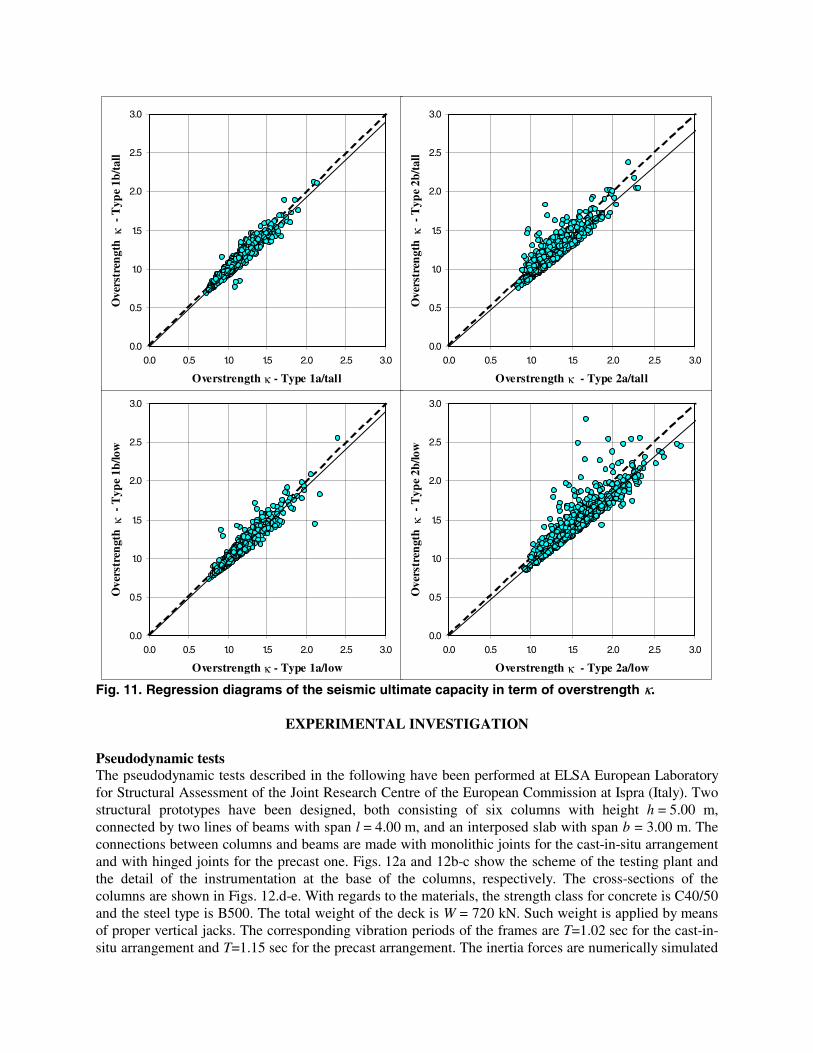
The application of the proposed probabilistic approach assumes 1000 artificial accelerograms generated as previously specified. So many random inputs of the dynamic analysis have been necessary to reach a stable statistical representation of the response, coming out from a pretty large set of random quantities (the shape parameters of the ground motion and the strength parameters of the materials).
The results are summarized in Fig. 10, which shows the frequency distribution histograms of the overstrength ratio κ for the eight types of structures here examined. The diagrams of Fig. 10 show a low scattering of the results and a regular course which can be well represented by fitting curves drawn according to a lognormal model starting from κ = κmin. Based on this model, the 5% and 10% fractile values, listed in Tab. 3 together with the corresponding minimum and mean values, are deduced. These values of the overstrength ratio remain around the threshold value κ =1, which represents the limit of full reliability of the design rules, with sensible deviations which show that, in some cases, the value q=4.5 of the behavior factor could be inadequate. In addition, a direct comparison of the diagrams of Fig. 10 lead us
Table 3. Characteristic, mean and correlation values for the overstrength ratio κ (lognormal model). Levels of Cast-in-situ arrangement Precast arrangement Correlation Stiffness
minκ 05.0κ 10.0κ mκ minκ 05.0κ 10.0κ mκ Coefficient ρ
1/tall 0.73 0.80 0.83 1.07 0.69 0.78 0.81 1.04 0.969 1/low 0.76 0.86 0.90 1.14 0.73 0.83 0.86 1.10 0.954 2/tall 0.85 0.96 1.00 1.27 0.76 0.88 0.92 1.18 0.915 2/low 0.93 1.14 1.20 1.57 0.85 1.06 1.11 1.46 0.916
also to appreciate the equivalence in average of the seismic capacities of the two type of frames. This is also confirmed by the regression diagrams of Fig. 11, which shows the close correlation between the responses of the two types of structures for the sample sets of 1000 accelerograms. The corresponding correlation coefficients are listed in Tab. 3.
0.00
0.60
1.20
1.80
2.40
3.00
0.00 0.50 1.00 1.50 2.00 2.50 3.00
Overstrength κ
Pro
babi
lity
Den
sity
f( κ
)
0.00
0.60
1.20
1.80
2.40
3.00
0.00 0.50 1.00 1.50 2.00 2.50 3.00
Overstrength κ
Pro
babi
lity
Den
sity
f( κ
)
0.00
0.50
1.00
1.50
2.00
2.50
0.00 0.50 1.00 1.50 2.00 2.50 3.00
Overstrength κ
Pro
babi
lity
Den
sity
f( κ
)
0.00
0.50
1.00
1.50
2.00
2.50
0.00 0.50 1.00 1.50 2.00 2.50 3.00
Overstrength κ
Pro
babi
lity
Den
sity
f( κ
)
1a/tall 1b/tall
1a/low 1b/low
0.00
0.50
1.00
1.50
2.00
2.50
0.00 0.50 1.00 1.50 2.00 2.50 3.00
Overstrength κ
Pro
babi
lity
Den
sity
f( κ
)
0.00
0.50
1.00
1.50
2.00
2.50
0.00 0.50 1.00 1.50 2.00 2.50 3.00
Overstrength κ
Pro
babi
lity
Den
sity
f( κ
)
0.00
0.35
0.70
1.05
1.40
1.75
0.00 0.50 1.00 1.50 2.00 2.50 3.00
Overstrength κ
Pro
babi
lity
Den
sity
f( κ
)
0.00
0.30
0.60
0.90
1.20
1.50
1.80
0.00 0.50 1.00 1.50 2.00 2.50 3.00
Overstrength κ
Pro
babi
lity
Den
sity
f( κ
)
2a/low 2b/low
2a/tall 2b/tall
Fig. 10. Density distribution diagrams of the seismic ultimate capacity in term of overstrength κ.
0.0
0.5
1.0
1.5
2.0
2.5
3.0
0.0 0.5 1.0 1.5 2.0 2.5 3.0
Overstrength κ - Type 1a/low
Ove
rstr
engt
h κ
- T
ype
1b/lo
w
0.0
0.5
1.0
1.5
2.0
2.5
3.0
0.0 0.5 1.0 1.5 2.0 2.5 3.0
Overstrength κ - Type 2a/low
Ove
rstr
engt
h κ
- T
ype
2b/lo
w
0.0
0.5
1.0
1.5
2.0
2.5
3.0
0.0 0.5 1.0 1.5 2.0 2.5 3.0
Overstrength κ - Type 1a/tall
Ove
rstr
engt
h κ
- T
ype
1b/t
all
0.0
0.5
1.0
1.5
2.0
2.5
3.0
0.0 0.5 1.0 1.5 2.0 2.5 3.0
Overstrength κ - Type 2a/tall
Ove
rstr
engt
h κ
- T
ype
2b/t
all
Fig. 11. Regression diagrams of the seismic ultimate capacity in term of overstrength κ.
EXPERIMENTAL INVESTIGATION
Pseudodynamic tests The pseudodynamic tests described in the following have been performed at ELSA European Laboratory for Structural Assessment of the Joint Research Centre of the European Commission at Ispra (Italy). Two structural prototypes have been designed, both consisting of six columns with height h = 5.00 m, connected by two lines of beams with span l = 4.00 m, and an interposed slab with span b = 3.00 m. The connections between columns and beams are made with monolithic joints for the cast-in-situ arrangement and with hinged joints for the precast one. Figs. 12a and 12b-c show the scheme of the testing plant and the detail of the instrumentation at the base of the columns, respectively. The cross-sections of the columns are shown in Figs. 12.d-e. With regards to the materials, the strength class for concrete is C40/50 and the steel type is B500. The total weight of the deck is W = 720 kN. Such weight is applied by means of proper vertical jacks. The corresponding vibration periods of the frames are T=1.02 sec for the cast-in-situ arrangement and T=1.15 sec for the precast arrangement. The inertia forces are numerically simulated
in the model governing the pseudodynamic procedure, together with the related second order effects. For more detailed information about the testing set up see Biondini et al. [3].
The seismic action for the pseudodynamic test has been simulated by the artificial accelerogram shown in Fig. 13, generated so to be compatible with the EC8 response spectrum for a subsoil type 1B (very dense sand or gravel). Taking into account the expected collapse limits αgu=0.90 for the cast-in-situ frame and αgu =1.08 for the precast frame, as computed by using the EC8 design rules, the following three load steps have been scheduled: αg = 0.32 (0.33αgu), αg = 0.64 (0.67αgu), and αg = 0.80 (0.83αgu) for the cast-in-situ frame; αg = 0.36 (0.33αgu), αg = 0.72 (0.67αgu), and αg = 1.08 (1.00αgu) for the precast frame.
PRECAST PROTOTYPE
RIGHT JACK
LEFT JACK
HORIZONTAL JACKS
VERTICAL
JACK
VERTICAL
JACK
(a) Fig. 12. (a) Testing plant and location of the actuators. Details of the instrumentation at the base of the columns for (b) the cast-in-situ and (c) the precast prototypes, respectively. Cross-sections of the colums for (d) the cast-in-situ and (e) the precast prototypes, respectively.
-1.00
-0.75
-0.50
-0.25
0.00
0.25
0.50
0.75
1.00
0.0 5.0 10.0 15.0 20.0 25.0 30.0
Time[sec]
Acc
ele
rati
on
a(t
)/P
GA
0.0
0.5
1.0
1.5
2.0
2.5
3.0
3.5
4.0
0.0 0.5 1.0 1.5 2.0 2.5 3.0
Period [sec]
Acc
ele
rati
on
a(t
)/P
GA
Fig. 13. (a) Time history and (b) elastic response spectrum of the artificial accelerogram used in the pseudodynamic tests.
(b) (c)
300 mm
300
8φ14
450 mm
300
8φ16
(d) (e)
(a) (b)
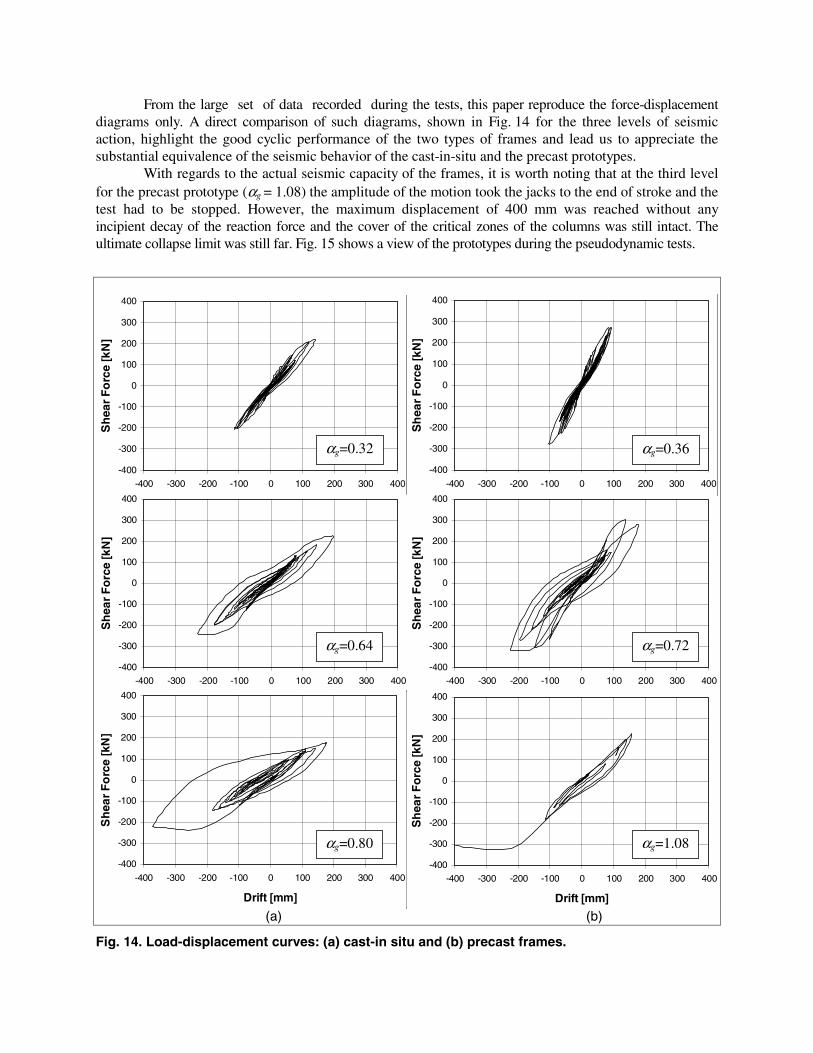
From the large set of data recorded during the tests, this paper reproduce the force-displacement diagrams only. A direct comparison of such diagrams, shown in Fig. 14 for the three levels of seismic action, highlight the good cyclic performance of the two types of frames and lead us to appreciate the substantial equivalence of the seismic behavior of the cast-in-situ and the precast prototypes.
With regards to the actual seismic capacity of the frames, it is worth noting that at the third level for the precast prototype (αg = 1.08) the amplitude of the motion took the jacks to the end of stroke and the test had to be stopped. However, the maximum displacement of 400 mm was reached without any incipient decay of the reaction force and the cover of the critical zones of the columns was still intact. The ultimate collapse limit was still far. Fig. 15 shows a view of the prototypes during the pseudodynamic tests.
-400
-300
-200
-100
0
100
200
300
400
-400 -300 -200 -100 0 100 200 300 400
Sh
ear
Fo
rce
[kN
]
-400
-300
-200
-100
0
100
200
300
400
-400 -300 -200 -100 0 100 200 300 400
Sh
ear
Fo
rce
[kN
]
-400
-300
-200
-100
0
100
200
300
400
-400 -300 -200 -100 0 100 200 300 400
Sh
ear
Fo
rce
[kN
]
-400
-300
-200
-100
0
100
200
300
400
-400 -300 -200 -100 0 100 200 300 400
Sh
ear
Fo
rce
[kN
]
-400
-300
-200
-100
0
100
200
300
400
-400 -300 -200 -100 0 100 200 300 400
Drift [mm]
Sh
ear
Fo
rce
[kN
]
-400
-300
-200
-100
0
100
200
300
400
-400 -300 -200 -100 0 100 200 300 400
Drift [mm]
Sh
ear
Fo
rce
[kN
]
(a) (b)
Fig. 14. Load-displacement curves: (a) cast-in situ and (b) precast frames.
αg=0.32
αg=0.64
αg=0.80
αg=0.36
αg=0.72
αg=1.08
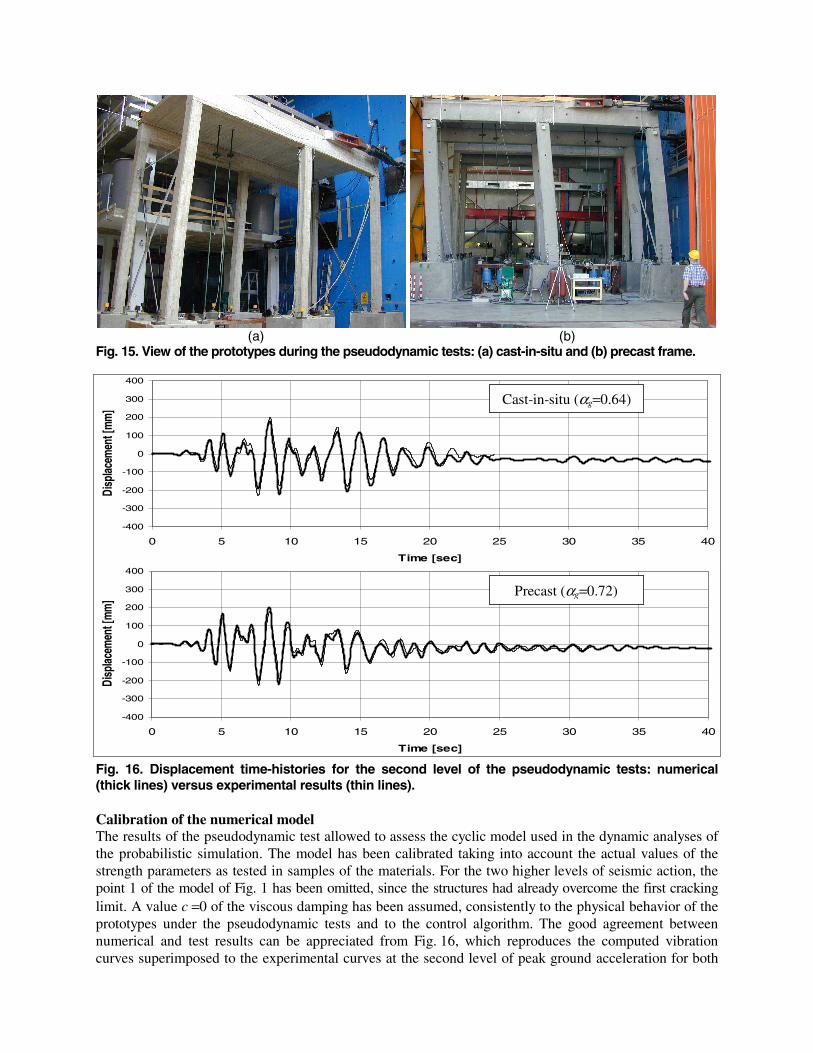
(a) (b) Fig. 15. View of the prototypes during the pseudodynamic tests: (a) cast-in-situ and (b) precast frame.
-400
-300
-200
-100
0
100
200
300
400
0 5 10 15 20 25 30 35 40
Time [sec]
Disp
lacem
ent [
mm
]
-400
-300
-200
-100
0
100
200
300
400
0 5 10 15 20 25 30 35 40
Time [sec]
Disp
lacem
ent [
mm
]
Fig. 16. Displacement time-histories for the second level of the pseudodynamic tests: numerical (thick lines) versus experimental results (thin lines). Calibration of the numerical model The results of the pseudodynamic test allowed to assess the cyclic model used in the dynamic analyses of the probabilistic simulation. The model has been calibrated taking into account the actual values of the strength parameters as tested in samples of the materials. For the two higher levels of seismic action, the point 1 of the model of Fig. 1 has been omitted, since the structures had already overcome the first cracking limit. A value c =0 of the viscous damping has been assumed, consistently to the physical behavior of the prototypes under the pseudodynamic tests and to the control algorithm. The good agreement between numerical and test results can be appreciated from Fig. 16, which reproduces the computed vibration curves superimposed to the experimental curves at the second level of peak ground acceleration for both
Cast-in-situ (αg=0.64)
Precast (αg=0.72)
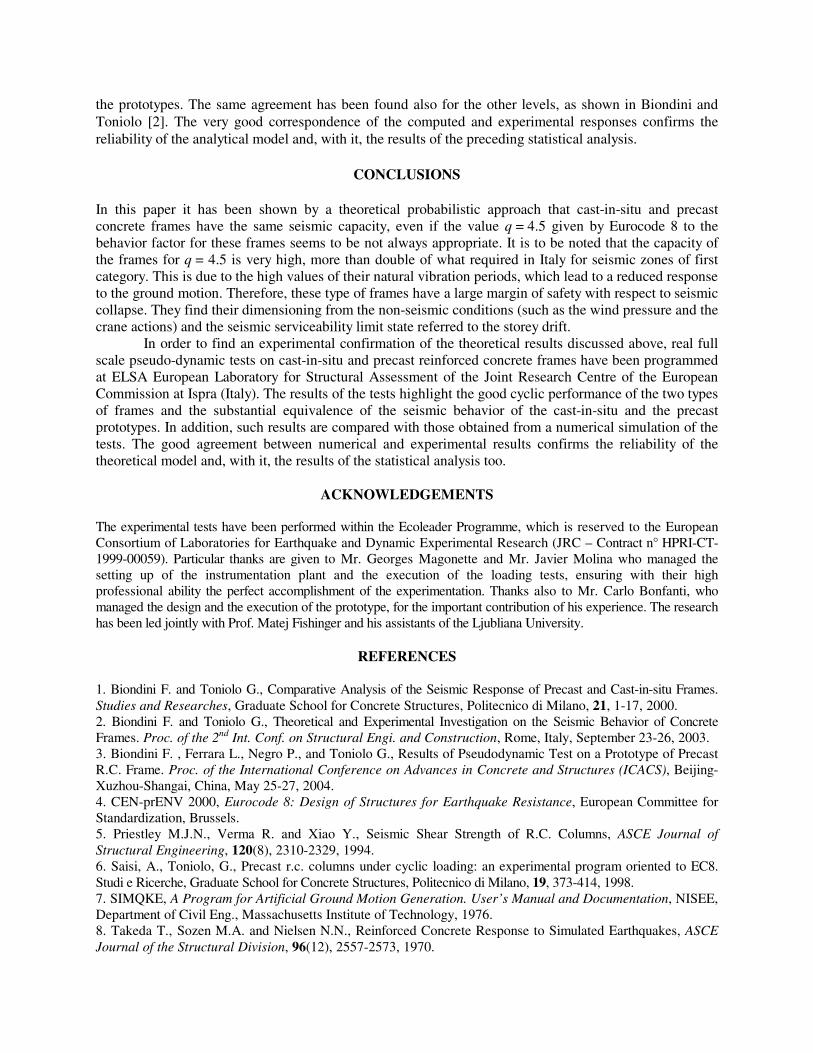
the prototypes. The same agreement has been found also for the other levels, as shown in Biondini and Toniolo [2]. The very good correspondence of the computed and experimental responses confirms the reliability of the analytical model and, with it, the results of the preceding statistical analysis.
CONCLUSIONS In this paper it has been shown by a theoretical probabilistic approach that cast-in-situ and precast concrete frames have the same seismic capacity, even if the value q = 4.5 given by Eurocode 8 to the behavior factor for these frames seems to be not always appropriate. It is to be noted that the capacity of the frames for q = 4.5 is very high, more than double of what required in Italy for seismic zones of first category. This is due to the high values of their natural vibration periods, which lead to a reduced response to the ground motion. Therefore, these type of frames have a large margin of safety with respect to seismic collapse. They find their dimensioning from the non-seismic conditions (such as the wind pressure and the crane actions) and the seismic serviceability limit state referred to the storey drift.
In order to find an experimental confirmation of the theoretical results discussed above, real full scale pseudo-dynamic tests on cast-in-situ and precast reinforced concrete frames have been programmed at ELSA European Laboratory for Structural Assessment of the Joint Research Centre of the European Commission at Ispra (Italy). The results of the tests highlight the good cyclic performance of the two types of frames and the substantial equivalence of the seismic behavior of the cast-in-situ and the precast prototypes. In addition, such results are compared with those obtained from a numerical simulation of the tests. The good agreement between numerical and experimental results confirms the reliability of the theoretical model and, with it, the results of the statistical analysis too.
ACKNOWLEDGEMENTS
The experimental tests have been performed within the Ecoleader Programme, which is reserved to the European Consortium of Laboratories for Earthquake and Dynamic Experimental Research (JRC – Contract n° HPRI-CT-1999-00059). Particular thanks are given to Mr. Georges Magonette and Mr. Javier Molina who managed the setting up of the instrumentation plant and the execution of the loading tests, ensuring with their high professional ability the perfect accomplishment of the experimentation. Thanks also to Mr. Carlo Bonfanti, who managed the design and the execution of the prototype, for the important contribution of his experience. The research has been led jointly with Prof. Matej Fishinger and his assistants of the Ljubliana University.
REFERENCES 1. Biondini F. and Toniolo G., Comparative Analysis of the Seismic Response of Precast and Cast-in-situ Frames. Studies and Researches, Graduate School for Concrete Structures, Politecnico di Milano, 21, 1-17, 2000. 2. Biondini F. and Toniolo G., Theoretical and Experimental Investigation on the Seismic Behavior of Concrete Frames. Proc. of the 2nd Int. Conf. on Structural Engi. and Construction, Rome, Italy, September 23-26, 2003. 3. Biondini F. , Ferrara L., Negro P., and Toniolo G., Results of Pseudodynamic Test on a Prototype of Precast R.C. Frame. Proc. of the International Conference on Advances in Concrete and Structures (ICACS), Beijing-Xuzhou-Shangai, China, May 25-27, 2004. 4. CEN-prENV 2000, Eurocode 8: Design of Structures for Earthquake Resistance, European Committee for Standardization, Brussels. 5. Priestley M.J.N., Verma R. and Xiao Y., Seismic Shear Strength of R.C. Columns, ASCE Journal of Structural Engineering, 120(8), 2310-2329, 1994. 6. Saisi, A., Toniolo, G., Precast r.c. columns under cyclic loading: an experimental program oriented to EC8. Studi e Ricerche, Graduate School for Concrete Structures, Politecnico di Milano, 19, 373-414, 1998. 7. SIMQKE, A Program for Artificial Ground Motion Generation. User’s Manual and Documentation, NISEE, Department of Civil Eng., Massachusetts Institute of Technology, 1976. 8. Takeda T., Sozen M.A. and Nielsen N.N., Reinforced Concrete Response to Simulated Earthquakes, ASCE Journal of the Structural Division, 96(12), 2557-2573, 1970.