Embed Size (px)
Citation preview
research papers
1020 doi:10.1107/S2052520614022902 Acta Cryst. (2014). B70, 1020–1032
Acta Crystallographica Section B
Structural Science,Crystal Engineeringand Materials
ISSN 2052-5206
Validation of molecular crystal structures frompowder diffraction data with dispersion-correcteddensity functional theory (DFT-D)
Jacco van de Streeka* and
Marcus A. Neumannb
aDepartment of Pharmacy, University of
Copenhagen, Universitetsparken 2, 2100
Copenhagen, Denmark, and bAvant-garde
Materials Simulation Deutschland GmbH,
Merzhauser Strasse 177, D-79100 Freiburg,
Germany
Correspondence e-mail:
In 2010 we energy-minimized 225 high-quality single-crystal
(SX) structures with dispersion-corrected density functional
theory (DFT-D) to establish a quantitative benchmark. For
the current paper, 215 organic crystal structures determined
from X-ray powder diffraction (XRPD) data and published in
an IUCr journal were energy-minimized with DFT-D and
compared to the SX benchmark. The on average slightly less
accurate atomic coordinates of XRPD structures do lead to
systematically higher root mean square Cartesian displace-
ment (RMSCD) values upon energy minimization than for SX
structures, but the RMSCD value is still a good indicator for
the detection of structures that deserve a closer look. The
upper RMSCD limit for a correct structure must be increased
from 0.25 A for SX structures to 0.35 A for XRPD structures;
the grey area must be extended from 0.30 to 0.40 A. Based on
the energy minimizations, three structures are re-refined to
give more precise atomic coordinates. For six structures our
calculations provide the missing positions for the H atoms, for
five structures they provide corrected positions for some H
atoms. Seven crystal structures showed a minor error for a
non-H atom. For five structures the energy minimizations
suggest a higher space-group symmetry. For the 225 SX
structures, the only deviations observed upon energy mini-
mization were three minor H-atom related issues. Preferred
orientation is the most important cause of problems. A
preferred-orientation correction is the only correction where
the experimental data are modified to fit the model. We
conclude that molecular crystal structures determined from
powder diffraction data that are published in IUCr journals
are of high quality, with less than 4% containing an error in a
non-H atom.
Received 19 August 2014
Accepted 18 October 2014
1. Introduction
In 2010, we published the validation of a dispersion-corrected
density functional theory (DFT-D) method for the reproduc-
tion of molecular crystal structures against 225 high-quality
single-crystal (SX) structures (Van de Streek & Neumann,
2010). The same computational technique successfully
predicted all four target crystal structures in the 2007 blind test
of crystal structure prediction (Day et al., 2009). In the vali-
dation study, 225 high-quality crystal structures from SX X-ray
data were energy-minimized in full, including the unit-cell
parameters. On average, the root mean square (r.m.s.)
Cartesian displacement of the non-H atoms upon energy
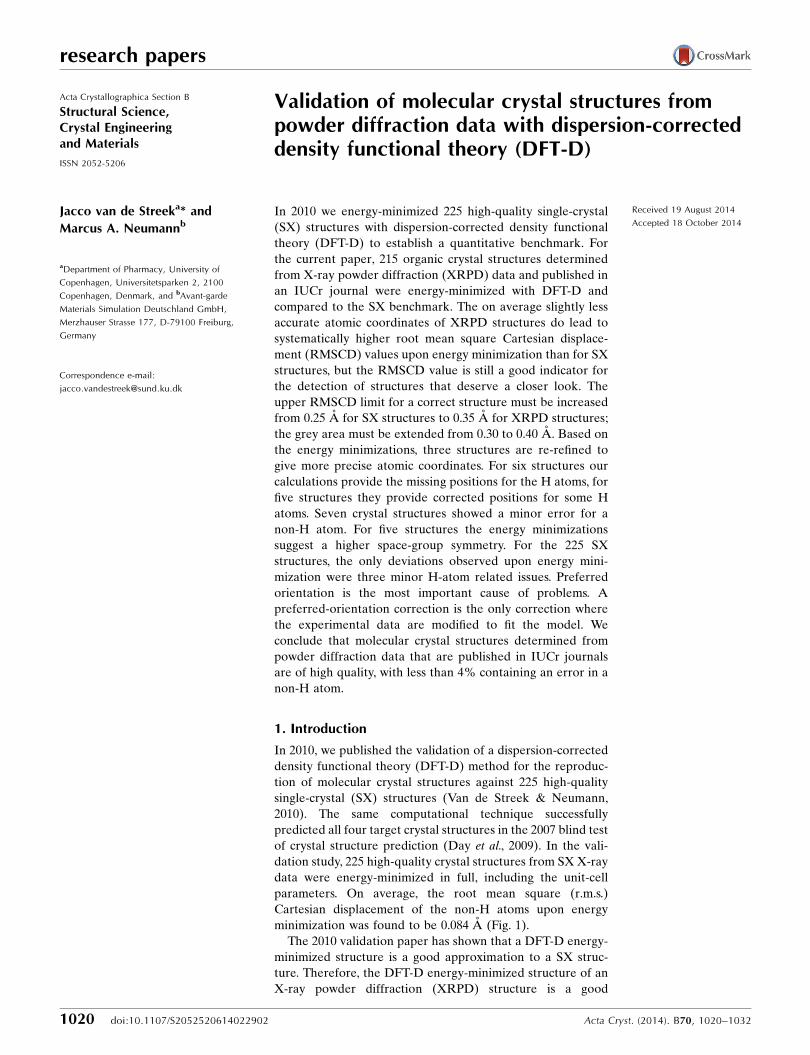
minimization was found to be 0.084 A (Fig. 1).
The 2010 validation paper has shown that a DFT-D energy-
minimized structure is a good approximation to a SX struc-
ture. Therefore, the DFT-D energy-minimized structure of an
X-ray powder diffraction (XRPD) structure is a good
approximation to what the SX structure would have looked
like for that specific XRPD structure. In other words, DFT-D
provides us with an approximate SX structure for each XRPD
structure! Comparing an XRPD structure with its DFT-D
structure therefore allows a semi-quantitative comparison of
an XRPD structure with its ‘virtual’ SX structure.
The use of quantum-mechanical calculations to supplement
XRPD data is becoming more and more common these days
(see e.g. Neumann et al., 2002; Avila et al., 2008; Florence et al.,
2009; Beko et al., 2010; Blanton et al., 2011, Smrcok, 2012), but
a quantitative benchmark has not been published.
In the current paper, we present the results of DFT-D
energy minimizations for 215 molecular crystal structures
determined from powder diffraction data and published in one
of the IUCr journals. It serves as a quantitative benchmark as
to what to expect when combining XRPD and DFT-D, and at
the same time provides a thorough quantitative analysis of the
quality of molecular crystal structures determined from
XRPD data.
2. Methods
The Cambridge Structural Database (CSD, Allen, 2002) was
searched for all organic crystal structures determined from
powder diffraction data, both X-ray and neutron, with the
atomic coordinates reported, and published in Acta Crystal-
lographica Sections B, C or E, the Journal of Applied Crys-
tallography or the Journal of Synchrotron Radiation. Some
new structures were energy-minimized as they were published
and the three structures from the publication by Zvirgzdins et
al. (2014) have also been included as zb5033_FormA, X and Z
(Zvirgzdins et al., 2014).
A short overview of DFT terminology is helpful here, the
reader is referred to e.g. the text book by Sholl & Steckel
(2009) and references therein for further information. Of the
many flavours of quantum-mechanical (QM) calculations,
density functional theory methods are very popular because of
their very favourable accuracy versus speed trade-off. When a
plane-wave basis set is used (as opposed to the more familiar
atom-centred basis sets), the electron density is (indirectly)
described as a Fourier series, automatically rendering the
electron density three-dimensional periodic: an obvious
choice for crystals. Within the DFT formalism, different
approximations called ‘functionals’, such as ‘PBE’ or ‘BLYP’,
have been published. These functionals can be improved on by
cleverly mixing in the results from a Hartee–Fock (HF, a non-
DFT method) calculation to combine the strengths of the HF
and DFT approximations, giving rise to the so-called ‘hybrid
functionals’ such as ‘PBE0’ and ‘B3LYP’. It turns out,
however, that the HF contribution cannot be evaluated effi-
ciently for plane-wave basis sets and increases computation
times by an order of magnitude, and calculations on crystal
structures with hybrid functionals are still rare. Last but not
least, it needs to be mentioned that the incomplete description
of electron correlation in these functionals causes a partial loss
of the interactions that keep molecular crystals together: the
dispersion or attractive van der Waals interactions; for systems
where van der Waals interactions are important, such as
molecular crystals, this shortcoming must be corrected for by
means of a dispersion correction (Grimme et al., 2010).
The energy minimizations were carried out with GRACE
(Neumann, 2013), VASP (Kresse & Furthmuller, 1996a,b) or
CASTEP (Clark et al., 2005). Details of the DFT-D energy
minimizations are given elsewhere (Van de Streek &
Neumann, 2010). In brief, the Perdew–Burke–Ernzerhof
(PBE) functional (Perdew et al., 1996) was used with a
dispersion correction (Neumann & Perrin, 2005; Grimme,
2006; Grimme et al., 2010). The plane-wave cut-off energy was
520 eV, the k-point spacing approximately 0.07 A�1. Inaccu-
rate atomic positions can cause extreme forces in the initial
steps of the energy minimization, which can in turn confuse
the energy-minimization algorithm. As a result, the mini-
mization may converge to the wrong minimum. To prevent
this, the energy minimizations were carried out in stages,
gradually releasing more and more degrees of freedom: in the
first stage only the intramolecular degrees of freedom were
relaxed, in the second stage the unit cell was kept fixed, in the
third stage all degrees of freedom including the unit cell were
energy minimized simultaneously. CASTEP has no option to
fix the molecular positions and orientations, so in CASTEP a
two-stage minimization was used: in the first stage the unit cell
was kept fixed, in the second stage all degrees of freedom
including the unit cell were energy-minimized simultaneously.
The quantity used for the comparison of the experimental
and the energy-minimized crystal structures with the unit-cell
parameters included in the energy minimization is the root
mean square Cartesian displacement excluding H atoms.
‘Cartesian displacement’ is not uniquely defined when the unit
cells of the two crystal structures to be compared are different,
as is the case when we compare the experimental crystal
structure to the DFT-D optimized structure with the unit cell
allowed to vary. In this work the Cartesian displacement for an
atom in two crystal structures (1) and (2) is
Cartesian displacement ¼
ðjG1 � r1 �G1 � r2j þ jG2 � r1 �G2 � r2jÞ=2;
research papers
Acta Cryst. (2014). B70, 1020–1032 Jacco van de Streek et al. � Validation of structures from powder diffraction data 1021
Figure 1Overlay of a crystal structure with an r.m.s. Cartesian displacement(RMSCD) value of 0.084 A, illustrating the average reproduction of anexperimental single-crystal structure by energy minimization withdispersion-corrected density functional theory with the unit cell free.The H atoms are omitted in the calculation of the RMSCD and in thefigure.
where ri are the fractional coordinates of the atoms in crystal
structure i, and Gi is the transformation matrix from fractional
to Cartesian coordinates for crystal structure i. This definition
of Cartesian displacement has the advantages that it is
symmetric with respect to the two structures to be compared,
that it varies smoothly upon smooth distortions of either or
both of the two structures to be compared, and that there is no
need for a user-defined parameter such as the number of
molecules used for the comparison.
To ensure that the results obtained for the XRPD structures
could be compared against those for the SX structures, crystal
structures with disorder [BOVDUM (Rohlicek et al., 2009),
CNITBZ02 (Meriles et al., 2000), FURHUV08 (David,
Ibberson et al., 2006), HEGJAF (Brunelli & Fitch, 2003),
HUSQAN, HUSQIV (Wunschel et al., 2003), LIWRAK01
(Neumann et al., 2002), LUKKAD02 (Bhuvanesh et al., 2005),
NIWFEE02 (Derollez et al., 2005), PAHFIO (Johnston et al.,
2004), SILVAL01 (Helmholdt et al., 2007), ZZZUXA04
(Damay et al., 2008), ZZZVCO01, ZZZVCO02 (Damay et al.,
2006) and ZZZURY01 (Jaron & Grochala, 2011)] were not
attempted, even though experience shows that the main
occupancy is always reproduced very well. Although the
dispersion correction used in the present paper provides a
correction for all elements up to Pu, the elements were
restricted to C, H, B, Br, Cl, F, I, N, O and S as in the previous
paper. This eliminated ten CSD entries: GUFMOJ,
GUFMOJ01 (Si) (Dinnebier et al., 1999), MEYGII,
MEYGII01 (P) (Chernyshev et al., 2013), PUXLUP01 (P)
(Hernandez et al., 2002), SILVEP (Se) (Helmholdt et al.,
2007), XOZJOM (P) (Chernyshev et al., 2009), XUDTEV
(Tremayne et al., 2002), ZZZWNG01, ZZZWNG02 and
ZZZWNG03 (Si) (Dinnebier et al., 1999). For most of these
structures, the energy-minimized structures can be found in
the supporting information, but they are ignored in the
analysis part of this paper.
13 reference codes [COTYOA, COTYOA01, COTYOA02,
COTYOA03, COTZAN, COTZAN01, COTZAN02,
COTZAN03, COTZAN04, COTZAN05, HXACAN26,
IBPRAC03 and WEXWUT (Stone et al., 2009)] correspond to
redeterminations of paracetamol and ibuprofen to test a new
refinement algorithm and were not energy-minimized.
In the case of discrepancies between the experimental and
the energy-minimized crystal structure, no new experimental
data was collected for the current paper, but where available
the original data was downloaded from the IUCr website.
DASH (David, Shankland et al., 2006) was used for
crystal-structure solution, TOPAS (Coelho, 2012) was used
for Rietveld refinement with restraints and the March–
Dollase correction (Dollase, 1986) was used if deemed
necessary. After Rietveld refinement, the positions of the
H atoms were energy-minimized with the unit-cell para-
meters and the positions of the non-H atoms kept fixed. A
representative and detailed description of our structure
solution and refinement procedure in combination with
DFT-D calculations is given in Naelapaa et al. (2012). The
corrected or re-refined crystal structures were added to the
supporting information unless a SX structure is known, in
which case the SX structure should be considered the final
structure.
The March–Dollase correction requires the user to supply a
direction in the form of h, k and l. The directions (100), (010)
and (001) are always tried, if only to get a feel for the possible
extent of the preferred orientation. Then the BFDH
morphology is calculated in Mercury (Macrae et al., 2008) and
the directions of the needles or plates, if any, are tried. Finally,
the hydrogen-bond network is expanded (again in Mercury) to
see if this points to any favoured one-dimensional or two-
dimensional growth directions, and these directions are then
tried. The last two approaches have the advantage of
providing a physical explanation for the preferred orientation,
especially if the data are flat-plate data. However, none of
these three approaches nor their combined use is guaranteed
to yield a sensible direction.
If a molecular geometry looked unreasonable, it was
checked using Mogul (Bruno et al., 2004) to compare all bond
lengths and valence angles against distributions from SX data.
The relevant measure is the maximum absolute value of the z-
score, which measures by how many standard deviations each
value in the crystal structure differs from the mean of the
distribution from the SX data. Normally, it should be possible
to obtain a structure with all values smaller than about 3.
In the course of this work, some inaccuracies in the CSD
were discovered. The coordinates of four atoms on special
positions in CICYES01 (Ochando et al., 1997) had been
reported as 0.667000 and 0.333000, these should have been
0.666667 and 0.333333. FEFREP, FEFREP02 and FEFREP03
(Halasz et al., 2012) had been inadvertently marked as
containing large voids. GEYREH and GEYREH01 (Pawley
& Whitley, 1988) had been reported in orthogonal coordinates
and something had gone wrong during the conversion to
fractional coordinates. For HAXMAW and HAXMAW01
(Vella-Zarb & Dinnebier, 2012), the two-dimensional
diagrams incorrectly showed the monomer instead of the
dimer. A 2.6 A C� � �C contact in VANGAT (Brenner et al.,
2002) leads to spurious bonds in GRACE; the short contact
can be rectified by a minor rotation of the t-butyl group. The
disordered C atoms that were shown for ZZZVCO03 (Damay
et al., 2006) and ZZZVCO05 (Palatinus & Damay, 2009) were
meant to be deuterium atoms or dummy atoms. WIMWOE
(Arnott & Dover, 1968) had been reported in cylindrical
coordinates and something had gone wrong during the
conversion to fractional coordinates. Apart from CICYES01
and VANGAT, which correctly reflect the (incorrect) inten-
tions of the authors, these CSD entries have now been edited.
2.1. High temperature
Lattice-energy minimizations lead to static structures and as
such refer to T = 0 K. For the SX structures, we noticed that all
slightly exceptional cases pertained to structures determined
at room temperature, whereas structures determined around
120 K were always reproduced very well.
research papers
1022 Jacco van de Streek et al. � Validation of structures from powder diffraction data Acta Cryst. (2014). B70, 1020–1032
2.2. High pressure
A PV term is added to the energy minimization for crystal
structures that are the result of experiments conducted at non-
ambient pressures.
2.3. H atoms
Due to their low X-ray scattering power, H atoms can
hardly be observed directly and their positions are almost
invariably the result of some kind of modelling based on
assumptions made by the authors. This makes H-atom posi-
tions rather uncertain and the quantum-mechanical calcula-
tions are ideal for establishing the final H atom locations. Note
that the coordinates of the H atoms in the CIF files in the
supporting information of this work reflect nuclear positions
rather than maxima in the electron density. Three cases that at
first glance might appear to be very similar must be clearly
distinguished.
2.3.1. Case I: positioning H atoms accurately. DFT-D
calculations are very effective for positioning H atoms
(Deringer et al., 2012), even if the H-atom positions have been
reported, even for SX structures. In this work, DFT-D will
only be applied if the position of at least one of the H atoms
was missing from the original structure.
2.3.2. Case II: resolving ambiguous H-atom positions. Even
if all H atoms are included in the CIF file, occasionally the
number and positions of the hydrogen-bond donors and
acceptors are such that the hydrogen-bonding network is
ambiguous. Although the DFT-D method has never been
properly validated for this purpose, both the large energy
differences between the alternatives and the large distortions
of the non-H atoms in what are presumably the wrong models
are usually significant enough for reliable conclusions to be
drawn, because the error on the energy differences of poly-
morphs and the distortions of the non-H atoms have both
been documented thoroughly.
2.3.3. Case III: deciding if a structure is a co-crystal or asalt. Once it has been established which hydrogen bonds are
formed, the only ambiguity that remains is whether the proton
dissociates to form a salt or whether the structure remains a
co-crystal. In our experience, the DFT-D minimizations nearly
always clearly favour either the salt or the co-crystal, inde-
pendent of the initial position of the proton; i.e. only one of
the two models is a stable local minimum. Unfortunately,
comparison with H-atom positions in crystal structures
determined from neutron diffraction data shows that the PBE
functional is not always reliable and that the decision whether
a crystal structure is a co-crystal or a salt cannot be resolved
with the DFT-D calculations as presented in this paper. The
positions of the non-H atoms are not affected at all and the
calculation of the r.m.s. Cartesian displacement with the unit
cell free and excluding the H atoms remains a valid measure
for the reliability of the crystal structure.
2.4. Space-group revisions
The experimental space group is imposed throughout the
energy minimizations; the space-group symmetry can there-
fore not be lowered as a result of the energy minimization, but
additional symmetry elements may be introduced into the
structure. All experimental structures (before energy mini-
mization) and all energy-minimized structures were checked
for additional symmetry elements with the algorithm in
GRACE. The search for new symmetry elements was tried
with and without taking into account the H or D atoms. The
tolerance on all atoms was 0.1 A. This was also done retro-
spectively for the SX structures from the 2010 validation study.
3. Results and discussion
3.1. Structures that were not attempted or failed
Some crystal structures could not be energy-optimized.
GLUCIT03 (Rukiah, Lefebvre, Hernandez et al., 2004):
Two —OH groups meet across a twofold axis: no sensible
hydrogen-bond pattern is possible within the experimental
space group. Even if the space-group symmetry is lowered, a
chain of hydrogen bonds remains that both starts and stops at
the same OH group and no reasonable hydrogen-bond pattern
could be constructed.
HAXJIB (Racz, 2012), MUPNEQ, MUPNEQ01 (Pop et al.,
2002): The unit cells contain several hundred A3 of water-
accessible voids. None of the dozens of –OH groups and none
of the water molecules has H atoms assigned to it. The amount
of work that would be needed to assign the positions of the H
atoms was considered to be beyond the scope of the current
paper.
JEMRUP (van Mechelen et al., 2006a), JEMRUP01 (van
Mechelen et al., 2006b), JEMSAW (van Mechelen et al.,
2006a), JEMSAW01 (van Mechelen et al., 2006b), MEZMOT,
MEZMUZ, MEZNAG (Helmholdt et al., 2002), QESHUS,
QESJAA (van Mechelen et al., 2006a), QESJAA01 (van
Mechelen et al., 2006b), QESJEE, QESJEE01, QESJII (van
Mechelen et al., 2006a), QESJII01 (van Mechelen et al.,
2006b), QESJOO (van Mechelen et al., 2006a), QESJOO01
(van Mechelen et al., 2006b), ROLFEE, ROLFEE01,
ROLFEE02 (van Mechelen et al., 2008), XEHQEG (Van
Langevelde et al., 2000). These CSD entries report the crystal
structures of triacylglycerols. The extremely soft modes meant
that the minimization algorithm was not able to make any
progress and after 2 months the energy minimizations were
aborted. The unit-cell volumes are well within the range of the
DFT-D method and the failure of the optimization is under
investigation.
LAQSON (Noguchi et al., 2012). The positions of the H
atoms do not allow for a sensible hydrogen-bonding network
in this structure of clarithromycin monohydrate. Meanwhile a
correction of the structure based on the original diffraction
data has been published (LAQSON01; Van de Streek, 2012) in
which the structure was shown to be a trihydrate, in which the
chirality of one of the chiral centres was corrected and in
which the positions of the H atoms were adjusted to form a
hydrogen-bond network. The LAQSON structure was not
considered any further, the RMSCD of the corrected structure
LAQSON01 is 0.14 A.
research papers
Acta Cryst. (2014). B70, 1020–1032 Jacco van de Streek et al. � Validation of structures from powder diffraction data 1023
LIBYAX (Rybakov et al., 2007). This Pbca, Z0 = 2 structure
has a unit-cell volume of 6251 A3. After 2 months the energy
minimization showed little progress and was aborted.
RUJTEW, RUJTIA, RUJTOG (Seijas et al., 2009). These
compounds contain a long n-alkyl chain. The first two stages of
the energy minimization finish normally, but the final energy
minimization with the unit cell free aborts with an error. For
some atomic configurations the DFT calculations with the
VASP program fail for no obvious reason; GRACE imple-
ments several correction mechanisms to intercept such fail-
ures, but on rare occasions there is no appropriate strategy.
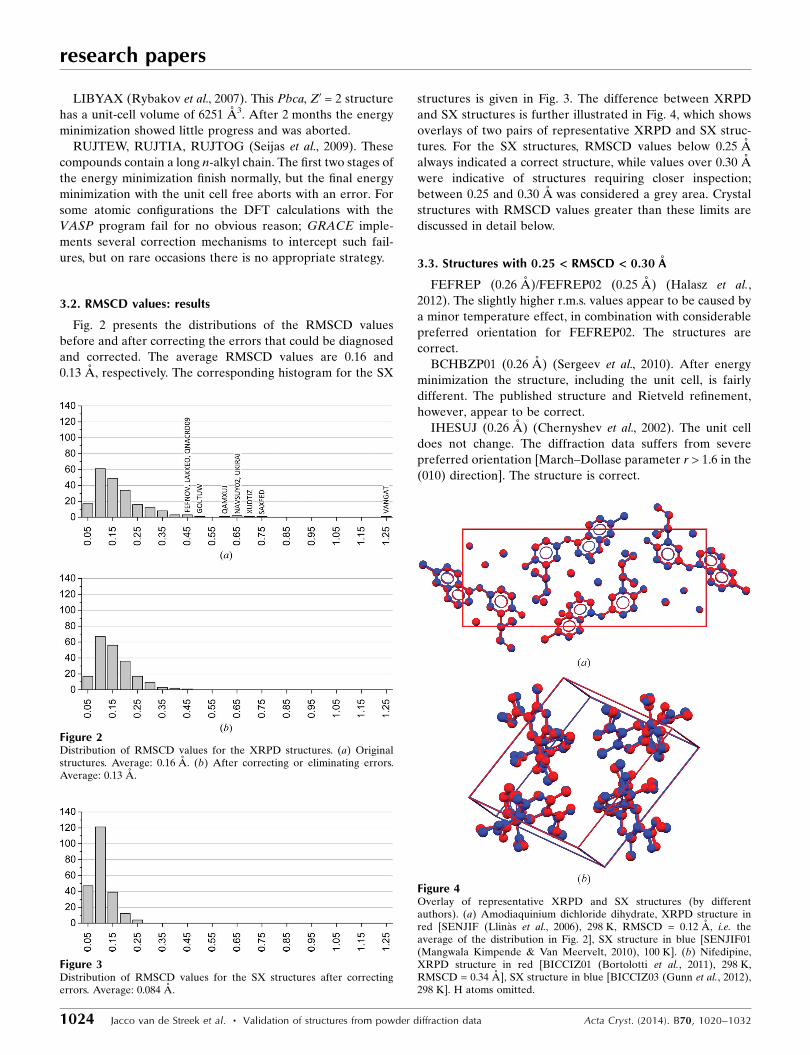
3.2. RMSCD values: results
Fig. 2 presents the distributions of the RMSCD values
before and after correcting the errors that could be diagnosed
and corrected. The average RMSCD values are 0.16 and
0.13 A, respectively. The corresponding histogram for the SX
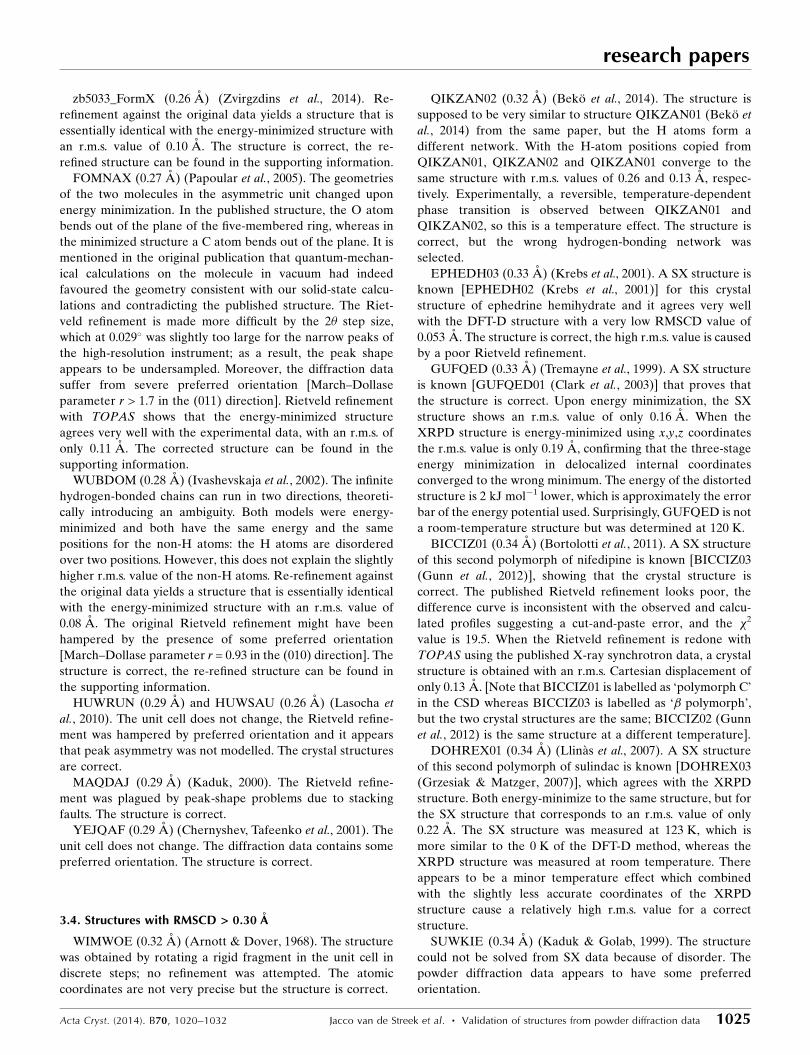
structures is given in Fig. 3. The difference between XRPD
and SX structures is further illustrated in Fig. 4, which shows
overlays of two pairs of representative XRPD and SX struc-
tures. For the SX structures, RMSCD values below 0.25 A
always indicated a correct structure, while values over 0.30 A
were indicative of structures requiring closer inspection;
between 0.25 and 0.30 A was considered a grey area. Crystal
structures with RMSCD values greater than these limits are
discussed in detail below.
3.3. Structures with 0.25 < RMSCD < 0.30 A
FEFREP (0.26 A)/FEFREP02 (0.25 A) (Halasz et al.,
2012). The slightly higher r.m.s. values appear to be caused by
a minor temperature effect, in combination with considerable
preferred orientation for FEFREP02. The structures are
correct.
BCHBZP01 (0.26 A) (Sergeev et al., 2010). After energy
minimization the structure, including the unit cell, is fairly
different. The published structure and Rietveld refinement,
however, appear to be correct.
IHESUJ (0.26 A) (Chernyshev et al., 2002). The unit cell
does not change. The diffraction data suffers from severe
preferred orientation [March–Dollase parameter r > 1.6 in the
(010) direction]. The structure is correct.
research papers
1024 Jacco van de Streek et al. � Validation of structures from powder diffraction data Acta Cryst. (2014). B70, 1020–1032
Figure 2Distribution of RMSCD values for the XRPD structures. (a) Originalstructures. Average: 0.16 A. (b) After correcting or eliminating errors.Average: 0.13 A.
Figure 3Distribution of RMSCD values for the SX structures after correctingerrors. Average: 0.084 A.
Figure 4Overlay of representative XRPD and SX structures (by differentauthors). (a) Amodiaquinium dichloride dihydrate, XRPD structure inred [SENJIF (Llinas et al., 2006), 298 K, RMSCD = 0.12 A, i.e. theaverage of the distribution in Fig. 2], SX structure in blue [SENJIF01(Mangwala Kimpende & Van Meervelt, 2010), 100 K]. (b) Nifedipine,XRPD structure in red [BICCIZ01 (Bortolotti et al., 2011), 298 K,RMSCD = 0.34 A], SX structure in blue [BICCIZ03 (Gunn et al., 2012),298 K]. H atoms omitted.
zb5033_FormX (0.26 A) (Zvirgzdins et al., 2014). Re-
refinement against the original data yields a structure that is
essentially identical with the energy-minimized structure with
an r.m.s. value of 0.10 A. The structure is correct, the re-
refined structure can be found in the supporting information.
FOMNAX (0.27 A) (Papoular et al., 2005). The geometries
of the two molecules in the asymmetric unit changed upon
energy minimization. In the published structure, the O atom
bends out of the plane of the five-membered ring, whereas in
the minimized structure a C atom bends out of the plane. It is
mentioned in the original publication that quantum-mechan-
ical calculations on the molecule in vacuum had indeed
favoured the geometry consistent with our solid-state calcu-
lations and contradicting the published structure. The Riet-
veld refinement is made more difficult by the 2� step size,
which at 0.029� was slightly too large for the narrow peaks of
the high-resolution instrument; as a result, the peak shape
appears to be undersampled. Moreover, the diffraction data
suffer from severe preferred orientation [March–Dollase
parameter r > 1.7 in the (011) direction]. Rietveld refinement
with TOPAS shows that the energy-minimized structure
agrees very well with the experimental data, with an r.m.s. of
only 0.11 A. The corrected structure can be found in the
supporting information.
WUBDOM (0.28 A) (Ivashevskaja et al., 2002). The infinite
hydrogen-bonded chains can run in two directions, theoreti-
cally introducing an ambiguity. Both models were energy-
minimized and both have the same energy and the same
positions for the non-H atoms: the H atoms are disordered
over two positions. However, this does not explain the slightly
higher r.m.s. value of the non-H atoms. Re-refinement against
the original data yields a structure that is essentially identical
with the energy-minimized structure with an r.m.s. value of
0.08 A. The original Rietveld refinement might have been
hampered by the presence of some preferred orientation
[March–Dollase parameter r = 0.93 in the (010) direction]. The
structure is correct, the re-refined structure can be found in
the supporting information.
HUWRUN (0.29 A) and HUWSAU (0.26 A) (Lasocha et
al., 2010). The unit cell does not change, the Rietveld refine-
ment was hampered by preferred orientation and it appears
that peak asymmetry was not modelled. The crystal structures
are correct.
MAQDAJ (0.29 A) (Kaduk, 2000). The Rietveld refine-
ment was plagued by peak-shape problems due to stacking
faults. The structure is correct.
YEJQAF (0.29 A) (Chernyshev, Tafeenko et al., 2001). The
unit cell does not change. The diffraction data contains some
preferred orientation. The structure is correct.
3.4. Structures with RMSCD > 0.30 A
WIMWOE (0.32 A) (Arnott & Dover, 1968). The structure
was obtained by rotating a rigid fragment in the unit cell in
discrete steps; no refinement was attempted. The atomic
coordinates are not very precise but the structure is correct.
QIKZAN02 (0.32 A) (Beko et al., 2014). The structure is
supposed to be very similar to structure QIKZAN01 (Beko et
al., 2014) from the same paper, but the H atoms form a
different network. With the H-atom positions copied from
QIKZAN01, QIKZAN02 and QIKZAN01 converge to the
same structure with r.m.s. values of 0.26 and 0.13 A, respec-
tively. Experimentally, a reversible, temperature-dependent
phase transition is observed between QIKZAN01 and
QIKZAN02, so this is a temperature effect. The structure is
correct, but the wrong hydrogen-bonding network was
selected.
EPHEDH03 (0.33 A) (Krebs et al., 2001). A SX structure is
known [EPHEDH02 (Krebs et al., 2001)] for this crystal
structure of ephedrine hemihydrate and it agrees very well
with the DFT-D structure with a very low RMSCD value of
0.053 A. The structure is correct, the high r.m.s. value is caused
by a poor Rietveld refinement.
GUFQED (0.33 A) (Tremayne et al., 1999). A SX structure
is known [GUFQED01 (Clark et al., 2003)] that proves that
the structure is correct. Upon energy minimization, the SX
structure shows an r.m.s. value of only 0.16 A. When the
XRPD structure is energy-minimized using x,y,z coordinates
the r.m.s. value is only 0.19 A, confirming that the three-stage
energy minimization in delocalized internal coordinates
converged to the wrong minimum. The energy of the distorted
structure is 2 kJ mol�1 lower, which is approximately the error
bar of the energy potential used. Surprisingly, GUFQED is not
a room-temperature structure but was determined at 120 K.
BICCIZ01 (0.34 A) (Bortolotti et al., 2011). A SX structure
of this second polymorph of nifedipine is known [BICCIZ03
(Gunn et al., 2012)], showing that the crystal structure is
correct. The published Rietveld refinement looks poor, the
difference curve is inconsistent with the observed and calcu-
lated profiles suggesting a cut-and-paste error, and the �2
value is 19.5. When the Rietveld refinement is redone with
TOPAS using the published X-ray synchrotron data, a crystal
structure is obtained with an r.m.s. Cartesian displacement of
only 0.13 A. [Note that BICCIZ01 is labelled as ‘polymorph C’
in the CSD whereas BICCIZ03 is labelled as ‘� polymorph’,
but the two crystal structures are the same; BICCIZ02 (Gunn
et al., 2012) is the same structure at a different temperature].
DOHREX01 (0.34 A) (Llinas et al., 2007). A SX structure
of this second polymorph of sulindac is known [DOHREX03
(Grzesiak & Matzger, 2007)], which agrees with the XRPD
structure. Both energy-minimize to the same structure, but for
the SX structure that corresponds to an r.m.s. value of only
0.22 A. The SX structure was measured at 123 K, which is
more similar to the 0 K of the DFT-D method, whereas the
XRPD structure was measured at room temperature. There
appears to be a minor temperature effect which combined
with the slightly less accurate coordinates of the XRPD
structure cause a relatively high r.m.s. value for a correct
structure.
SUWKIE (0.34 A) (Kaduk & Golab, 1999). The structure
could not be solved from SX data because of disorder. The
powder diffraction data appears to have some preferred
orientation.
research papers
Acta Cryst. (2014). B70, 1020–1032 Jacco van de Streek et al. � Validation of structures from powder diffraction data 1025
IBPRAC04 (0.38 A) (Derollez et al., 2010). The unit cell
does not change. The maximum Mogul z-scores for the bond
lengths and valence angles are 5.6 and 5.7, respectively,
pointing to inaccuracies in the molecular geometry. There is
considerable preferred orientation [March–Dollase parameter
r > 1.2 in the (100) direction] and the isopropyl group appears
to be disordered. The structure appears to be correct.
IJEKAJ (0.38 A) (Ivashevskaja et al., 2003). With real-
space crystal-structure solution in DASH we find the same
structure. However, Rietveld refinement against the published
data reveals considerable preferred orientation [March–
Dollase parameter r = 0.82 in the (100) direction] and when
this preferred orientation is included in the real-space crystal-
structure solution, a different structure with a lower �2 (3.9
versus 4.3) and more reasonable short contacts is found in
three of 50 simulated annealing runs. In the new structure the
two C atoms of the central C C group have rearranged.
Rietveld refinement on the new structure reveals severe
preferred orientation: the final March–Dollase parameter r is
0.69 in the (100) direction. The r.m.s. value of the new struc-
ture is 0.14 A, its energy is 1.4 kJ mol�1 more favourable. The
corrected structure can be found in the supporting informa-
tion.
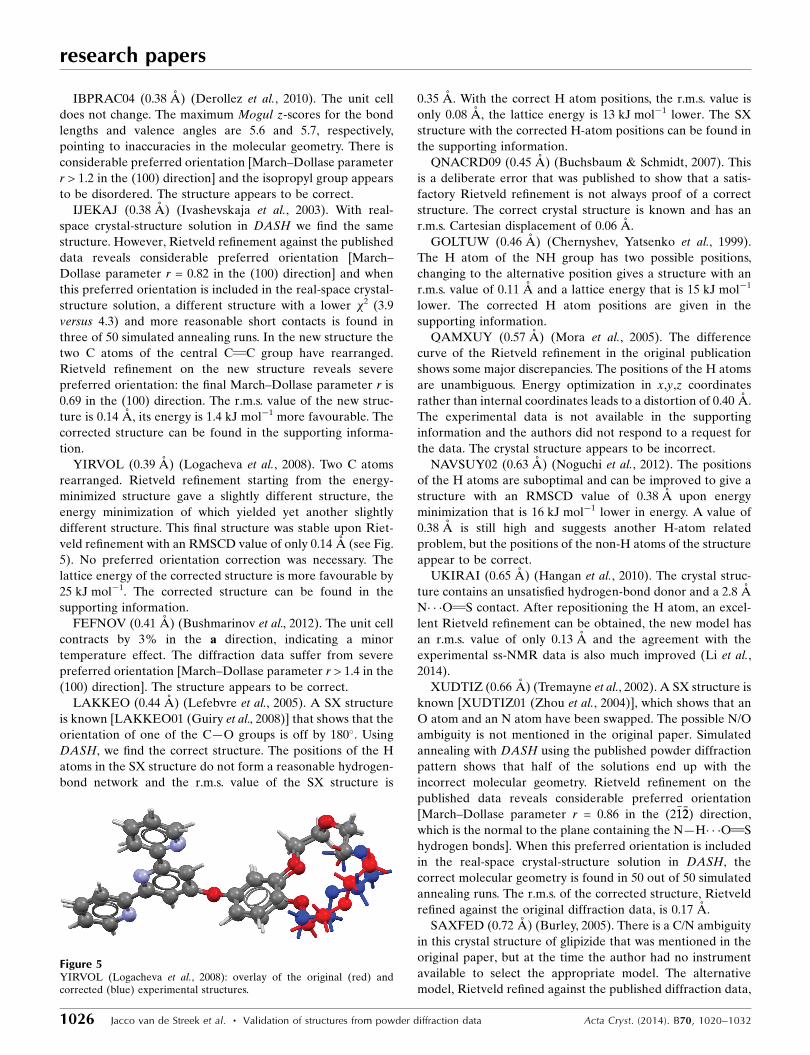
YIRVOL (0.39 A) (Logacheva et al., 2008). Two C atoms
rearranged. Rietveld refinement starting from the energy-
minimized structure gave a slightly different structure, the
energy minimization of which yielded yet another slightly
different structure. This final structure was stable upon Riet-
veld refinement with an RMSCD value of only 0.14 A (see Fig.
5). No preferred orientation correction was necessary. The
lattice energy of the corrected structure is more favourable by
25 kJ mol�1. The corrected structure can be found in the
supporting information.
FEFNOV (0.41 A) (Bushmarinov et al., 2012). The unit cell
contracts by 3% in the a direction, indicating a minor
temperature effect. The diffraction data suffer from severe
preferred orientation [March–Dollase parameter r > 1.4 in the
(100) direction]. The structure appears to be correct.
LAKKEO (0.44 A) (Lefebvre et al., 2005). A SX structure
is known [LAKKEO01 (Guiry et al., 2008)] that shows that the
orientation of one of the C—O groups is off by 180�. Using
DASH, we find the correct structure. The positions of the H
atoms in the SX structure do not form a reasonable hydrogen-
bond network and the r.m.s. value of the SX structure is
0.35 A. With the correct H atom positions, the r.m.s. value is
only 0.08 A, the lattice energy is 13 kJ mol�1 lower. The SX
structure with the corrected H-atom positions can be found in
the supporting information.
QNACRD09 (0.45 A) (Buchsbaum & Schmidt, 2007). This
is a deliberate error that was published to show that a satis-
factory Rietveld refinement is not always proof of a correct
structure. The correct crystal structure is known and has an
r.m.s. Cartesian displacement of 0.06 A.
GOLTUW (0.46 A) (Chernyshev, Yatsenko et al., 1999).
The H atom of the NH group has two possible positions,
changing to the alternative position gives a structure with an
r.m.s. value of 0.11 A and a lattice energy that is 15 kJ mol�1
lower. The corrected H atom positions are given in the
supporting information.
QAMXUY (0.57 A) (Mora et al., 2005). The difference
curve of the Rietveld refinement in the original publication
shows some major discrepancies. The positions of the H atoms
are unambiguous. Energy optimization in x,y,z coordinates
rather than internal coordinates leads to a distortion of 0.40 A.
The experimental data is not available in the supporting
information and the authors did not respond to a request for
the data. The crystal structure appears to be incorrect.
NAVSUY02 (0.63 A) (Noguchi et al., 2012). The positions
of the H atoms are suboptimal and can be improved to give a
structure with an RMSCD value of 0.38 A upon energy
minimization that is 16 kJ mol�1 lower in energy. A value of
0.38 A is still high and suggests another H-atom related
problem, but the positions of the non-H atoms of the structure
appear to be correct.
UKIRAI (0.65 A) (Hangan et al., 2010). The crystal struc-
ture contains an unsatisfied hydrogen-bond donor and a 2.8 A
N� � �O S contact. After repositioning the H atom, an excel-
lent Rietveld refinement can be obtained, the new model has
an r.m.s. value of only 0.13 A and the agreement with the
experimental ss-NMR data is also much improved (Li et al.,
2014).
XUDTIZ (0.66 A) (Tremayne et al., 2002). A SX structure is
known [XUDTIZ01 (Zhou et al., 2004)], which shows that an
O atom and an N atom have been swapped. The possible N/O
ambiguity is not mentioned in the original paper. Simulated
annealing with DASH using the published powder diffraction
pattern shows that half of the solutions end up with the
incorrect molecular geometry. Rietveld refinement on the
published data reveals considerable preferred orientation
[March–Dollase parameter r = 0.86 in the (2�11�22) direction,
which is the normal to the plane containing the N—H� � �O S
hydrogen bonds]. When this preferred orientation is included
in the real-space crystal-structure solution in DASH, the
correct molecular geometry is found in 50 out of 50 simulated
annealing runs. The r.m.s. of the corrected structure, Rietveld
refined against the original diffraction data, is 0.17 A.
SAXFED (0.72 A) (Burley, 2005). There is a C/N ambiguity
in this crystal structure of glipizide that was mentioned in the
original paper, but at the time the author had no instrument
available to select the appropriate model. The alternative
model, Rietveld refined against the published diffraction data,
research papers
1026 Jacco van de Streek et al. � Validation of structures from powder diffraction data Acta Cryst. (2014). B70, 1020–1032
Figure 5YIRVOL (Logacheva et al., 2008): overlay of the original (red) andcorrected (blue) experimental structures.
has an r.m.s. value of 0.13 A and an energy that is 19 kJ mol�1
lower. The corrected structure can be found in the supporting
information.
VANGAT (1.21 A) (Brenner et al., 2002). As published, the
structure contains a 2.6 A C� � �C contact, the conformation of
one of the C( O)—O—C groups is unusual, the maximum
Mogul z-score is 6.5, there is some preferred orientation and
the publication describes problems with a possible phase
transition taking place during the diffraction measurements.
We were able to find a structure with a lower Rwp value, fewer
short contacts throughout the structure, an r.m.s. value of
0.67 A and a lattice energy that is 6 kJ mol�1 lower. It there-
fore seems reasonable to assume that the published structure
is incorrect, but we were not able to find a structural model
that could reasonably be assumed to be correct.
3.5. RMSCD values: discussion
On the one hand, Fig. 2 shows that the less accurate atomic
coordinates of XRPD structures lead to systematically higher
r.m.s. Cartesian displacement values on average. The upper
limit on the RMSCD values for a correct crystal structure,
which is 0.25 A for SX structures, must be increased to 0.35 A
for structures from XRPD. The grey area must be extended
from 0.30 to 0.40 A. On the other hand, it is clear from the
data that for 95% of all molecular crystal structures deter-
mined from powder diffraction data the quality of the struc-
ture is comparable to that of a SX structure. It is therefore an
interesting question whether some crystal structures deter-
mined from XRPD are inherently less well defined than SX
structures. For example, when crystals shatter due to the
physical treatment necessary for the preparation of a parti-
cular polymorph, such as heating, cooling or grinding, the
reason behind the need for a powder study may simulta-
neously explain why the quality of that crystal structure can
never equal that of a SX study. Our data suggests that this may
be the case for at most 5% of all structures determined from
XRPD; for the majority of cases suspicious structures are just
the result of substandard data collection, substandard struc-
ture solution or substandard Rietveld refinement.
A significant difference between the 225 SX structures from
the 2010 validation study and the 215 XRPD structures in the
current paper is that the SX structures were all sourced from
the August 2008 issue of Acta Crystallographica Section E,
whereas the XRPD structures were published between 1968
and 2014. In a previous validation study of crystal structures in
the Cambridge Structural Database, we showed that the
quality of SX structures varied with time (Van de Streek,
2006). Attempts to discover a similar trend for XRPD struc-
tures failed because of an insufficient number of structures.
Another difference is that approximately 50% of the SX
structures had been determined at low temperature (< 150 K),
which is easier to reproduce for the static energy minimiza-
tions. For the XRPD structures, only 25% had been deter-
mined at low temperature, introducing a slight bias towards
slightly higher RMSCD values.
The strength of the DFT-D method is the detection of
possible problems; but only on rare occasions – FOMNAX is a
good example – is the DFT-D calculation of direct assistance
in determining the actual cause of the problem. For the vast
majority of cases, it is still up to the experience and imagina-
tion of the crystallographer to come up with a list of alter-
native models that can be tested. For some of the structures
presented here, such as IJEKAJ where only 1.5% of all
structure solution runs gave a correct solution and only when
the structure solution was biased with the correct preferred
orientation, finding a better model took expertise, tenacity and
several months of hard work. In the same context, it is worth
mentioning that energy optimization with DFT-D is very
sensitive even for small inaccuracies in a structure; as a result,
even a minor error in the position of a H atom can lead to a
major distortion in the energy-minimized crystal structure,
and there is no relationship between the degree of the
distortion and the severity of the error. On the one hand, this
feature is a strength, as it makes it virtually impossible even
for slight shortcomings in the model to slip through the maze;
but at the same time it is a weakness, because it puts insig-
nificant oversights and real errors on equal footing – without
giving the user a hint as to which is which. NAVSUY02, for
example, appears to be a high-quality crystal structure from
synchrotron data supported by an excellent Rietveld refine-
ment, but as long as the correct hydrogen-bonding pattern
remains elusive, the structure as a whole will never pass the
DFT-D check.
Preferred orientation is the greatest source of problems and
uncertainties. A preferred-orientation correction ignores the
structural model (the atomic coordinates and the unit cell) and
adjusts the calculated structure factors directly so as to fit the
experimental data; the one-to-one relationship between the
measured intensities and the structural model is lost. This is
mathematically equivalent to stating that a preferred-orien-
tation correction modifies the experimental intensities to fit
the model – without changing the model. More importantly,
severe preferred orientation suppresses the intensities of
reflections for particular directions: the information in the
powder pattern is not merely redistributed, it is irretrievably
lost. Clearly, the presence of preferred orientation should be
regarded with much more suspicion than is currently the
norm. The authors of papers reporting crystal structures from
XRPD that required a substantial preferred-orientation
correction during Rietveld refinement should ask themselves:
if I am prepared to ignore the experimental data in favour of
my model, why did I measure the experimental data in the first
place? The use of spherical harmonics for the preferred-
orientation correction may obscure the underlying physics,
whereas the March–Dollase model retains a link with the
physics of the sample. A March–Dollase r value between 0.8
and 1.2 appears to be relatively harmless, and, when discov-
ered, must of course be included in the refinement (as the use
of a least-squares refinement requires that the model be
complete, i.e. that the experimental data is described exactly
by the model with the exception of the random noise). Values
greater or smaller than that should be treated with suspicion;
research papers
Acta Cryst. (2014). B70, 1020–1032 Jacco van de Streek et al. � Validation of structures from powder diffraction data 1027
ideally, such data should be discarded, but at the very least the
structure solution should be repeated from scratch with the
preferred orientation imposed.
One of the 215 crystal structures (GUFQED) converged to
the wrong minimum, for the SX structures one of the 225
crystal structures converged to the wrong minimum. There is
therefore no difference between XRPD and SX in this respect
in spite of the slightly less accurate atomic coordinates of
XRPD structures, presumably because of the controlled
manner in which the energy minimization proceeds.
3.6. High pressure
Four structures, LSERIN22, LSERIN23, LSERIN24 and
LSERIN25 (Moggach et al., 2006), were measured at pressures
of 4.5, 5.2, 7.3 and 8.1 GPa, respectively. Upon energy mini-
mization with the experimental pressure imposed, the r.m.s.
values are 0.07, 0.14, 0.28 and 0.23 A, respectively, i.e. it
appears that LSERIN24 is not reproduced that well. Minor
errors in the DFT-D potential can upset the balance between
the DFT-D contribution and the PV term, and as a result a
structure may be better reproduced at a slightly different
pressure. Therefore, LSERIN24 was energy-minimized at a
range of pressures, which revealed that the experimental
structure is computationally reproduced very well at 4, 5 and
6 GPa (average r.m.s. = 0.16 A), but changes abruptly at 7 GPa
(r.m.s. = 0.27 A).
The structures are correct, but minor errors in the DFT-D
potential may cause the pressure at which a structure is
reproduced computationally to differ from the experimental
pressure.
3.7. H atoms
3.7.1. Case I: missing H atoms. GUFQED, HUWSAU,
UKIRAI, VANGAT and WIMWOE have been dealt with
above. Structures for which the positions of the H atoms are
ambiguous are treated below. SX structures are known for
BPHENO02 (Kutzke et al., 2000), CYCHEX07 (Wilding et al.,
1993) and SIKLIH06 (Muangsin et al., 2004). This leaves
CEWVOP01 (Reck et al., 1988), CNITBZ01 (Meriles et al.,
2000) and WOVTEG (Chernyshev, Paseshnichenko et al.,
2001), for which the H-atom positions after energy mini-
mization with the non-H atoms and the unit cell fixed are
given in the supporting information.
3.7.2. Case II: ambiguous H-atom positions. GOLTUW,
LAKKEO, WUBDOM and QIKZAN02 have been dealt with
above.
FANDOO (Rukiah, Lefebvre, Descamps et al., 2004). As
reported, the NH2 H atoms point towards each other. The
corrected H-atom positions are given in the supporting
information.
FOGVIG02 (Shankland et al., 2002). The H atoms of the
O2S—NH2 group do not form hydrogen bonds, which can be
resolved by a minor rotation. A SX structure [FOGVIG03
(Florence et al., 2003)] is known.
LIPVUB/LIPVUB01/LIPVUB02 (Chernyshev, Fitch et al.,
1999). In the paper the crystal structure is determined from
laboratory data, from synchrotron data and from neutron
data. The three crystal structures are the same, including the
positions of the H atoms. However, in spite of the availability
of neutron data, the H atoms of the NH2 group rearrange
upon energy minimization to form a more plausible hydrogen-
bond network. After Rietveld refinement with TOPAS using
the published neutron powder data the same rearrangement
of H atoms is observed, confirming that the original refine-
ments had not located the correct H-atom positions for the
NH2 group. The corrected H-atom positions are given in the
supporting information.
MEXZOG (0.16 A) (Derollez et al., 2013). The positions of
the H atoms as reported constitute an unusual geometry for
the CH2—O—H group. Two directions are possible for the
infinite chain of hydrogen bonds, changing to the alternative
direction fixes the awkward CH2—O—H geometry, reduces
the r.m.s. value upon energy minimization from 0.16 to 0.07 A
and reduces the lattice energy by 5 kJ mol�1. The corrected H-
atom positions are given in the supporting information.
QIBQIB01 (Tanahashi et al., 2001). No positions were
reported for the H atoms. Two alternatives are possible for the
carboxylic acid dimer, and two directions for the infinite chain
of hydrogen bonds, for a total of four different models. One
model has the lowest energy and the lowest r.m.s. value at
0.09 A, the least likely model has an r.m.s. value of 0.31 A and
a lattice energy that is 2 kJ mol�1 higher. The H-atom posi-
tions are given in the supporting information.
XARNAG (Bhuvanesh et al., 2005). No positions were
reported for the H atoms. Two alternatives are possible for the
infinite chain of hydrogen bonds. One model has an r.m.s.
value of 0.27 A, the other has an r.m.s. value of 0.21 A and a
lattice energy that is 4 kJ mol�1 more favourable. The H-atom
positions are given in the supporting information.
3.7.3. Case III: co-crystal or salt. For two reference code
families the proton jumps upon energy minimization: refer-
ence codes OXACDH31 (Putkonen et al., 1985),
OXACDH32, OXACDH33 (Lehmann et al., 1994) and
LIPWEM (Chernyshev, Fitch et al., 1999). All four were
determined from neutron diffraction data and the experi-
mental deuterium positions must therefore be assumed to be
correct; i.e. the calculated deuterium positions are wrong. The
PBE functional is known to overbind hydrogen bonds and
better functionals, such as the B3LYP hybrid functional, may
give better results, but calculations with these functionals are
currently too slow when applied with a plane-wave basis set.
The positions of the non-H atoms, however, are not affected
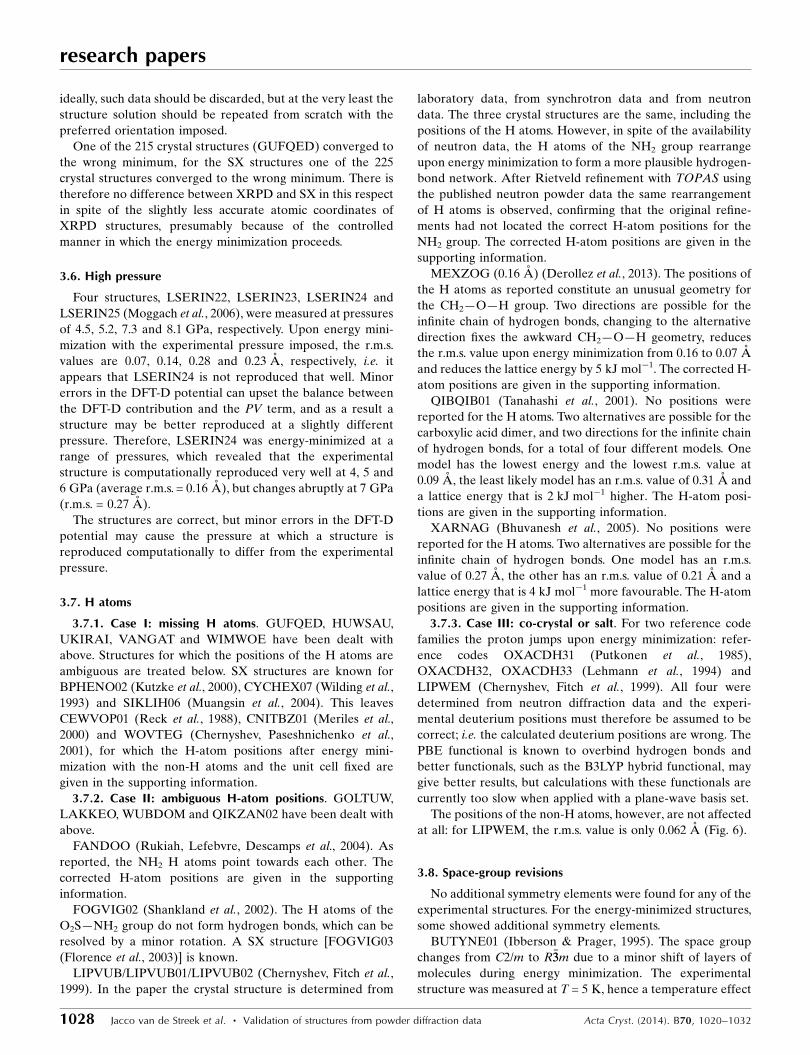
at all: for LIPWEM, the r.m.s. value is only 0.062 A (Fig. 6).
3.8. Space-group revisions
No additional symmetry elements were found for any of the
experimental structures. For the energy-minimized structures,
some showed additional symmetry elements.
BUTYNE01 (Ibberson & Prager, 1995). The space group
changes from C2/m to R�33m due to a minor shift of layers of
molecules during energy minimization. The experimental
structure was measured at T = 5 K, hence a temperature effect
research papers
1028 Jacco van de Streek et al. � Validation of structures from powder diffraction data Acta Cryst. (2014). B70, 1020–1032
seems unlikely. There appears to be a subtle feature of the 2-
butyne crystal structure that DFT-D is not able to reproduce.
The published space group is correct.
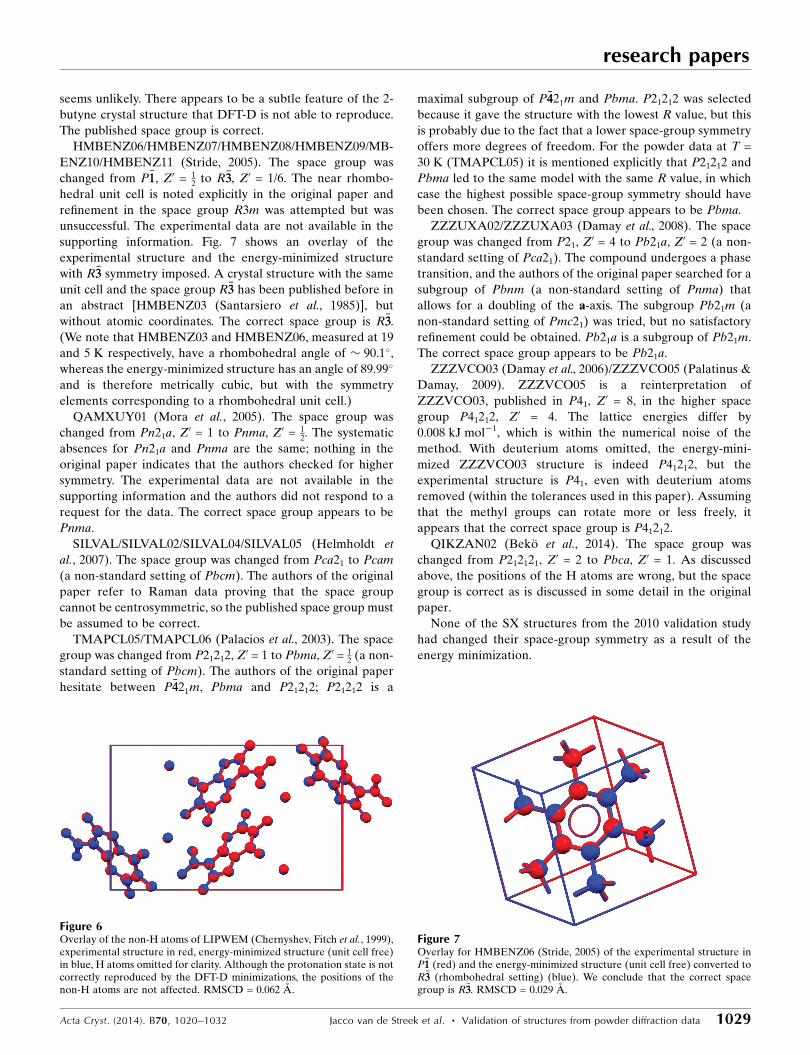
HMBENZ06/HMBENZ07/HMBENZ08/HMBENZ09/MB-
ENZ10/HMBENZ11 (Stride, 2005). The space group was
changed from P�11, Z0 = 12 to R�33, Z0 = 1/6. The near rhombo-
hedral unit cell is noted explicitly in the original paper and
refinement in the space group R3m was attempted but was
unsuccessful. The experimental data are not available in the
supporting information. Fig. 7 shows an overlay of the
experimental structure and the energy-minimized structure
with R�33 symmetry imposed. A crystal structure with the same
unit cell and the space group R�33 has been published before in
an abstract [HMBENZ03 (Santarsiero et al., 1985)], but
without atomic coordinates. The correct space group is R�33.
(We note that HMBENZ03 and HMBENZ06, measured at 19
and 5 K respectively, have a rhombohedral angle of � 90.1�,
whereas the energy-minimized structure has an angle of 89.99�
and is therefore metrically cubic, but with the symmetry
elements corresponding to a rhombohedral unit cell.)
QAMXUY01 (Mora et al., 2005). The space group was
changed from Pn21a, Z0 = 1 to Pnma, Z0 = 12. The systematic
absences for Pn21a and Pnma are the same; nothing in the
original paper indicates that the authors checked for higher
symmetry. The experimental data are not available in the
supporting information and the authors did not respond to a
request for the data. The correct space group appears to be
Pnma.
SILVAL/SILVAL02/SILVAL04/SILVAL05 (Helmholdt et
al., 2007). The space group was changed from Pca21 to Pcam
(a non-standard setting of Pbcm). The authors of the original
paper refer to Raman data proving that the space group
cannot be centrosymmetric, so the published space group must
be assumed to be correct.
TMAPCL05/TMAPCL06 (Palacios et al., 2003). The space
group was changed from P21212, Z0 = 1 to Pbma, Z0 = 12 (a non-
standard setting of Pbcm). The authors of the original paper
hesitate between P�4421m, Pbma and P21212; P21212 is a
maximal subgroup of P�4421m and Pbma. P21212 was selected
because it gave the structure with the lowest R value, but this
is probably due to the fact that a lower space-group symmetry
offers more degrees of freedom. For the powder data at T =
30 K (TMAPCL05) it is mentioned explicitly that P21212 and
Pbma led to the same model with the same R value, in which
case the highest possible space-group symmetry should have
been chosen. The correct space group appears to be Pbma.
ZZZUXA02/ZZZUXA03 (Damay et al., 2008). The space
group was changed from P21, Z0 = 4 to Pb21a, Z0 = 2 (a non-
standard setting of Pca21). The compound undergoes a phase
transition, and the authors of the original paper searched for a
subgroup of Pbnm (a non-standard setting of Pnma) that
allows for a doubling of the a-axis. The subgroup Pb21m (a
non-standard setting of Pmc21) was tried, but no satisfactory
refinement could be obtained. Pb21a is a subgroup of Pb21m.
The correct space group appears to be Pb21a.
ZZZVCO03 (Damay et al., 2006)/ZZZVCO05 (Palatinus &
Damay, 2009). ZZZVCO05 is a reinterpretation of
ZZZVCO03, published in P41, Z0 = 8, in the higher space
group P41212, Z0 = 4. The lattice energies differ by
0.008 kJ mol�1, which is within the numerical noise of the
method. With deuterium atoms omitted, the energy-mini-
mized ZZZVCO03 structure is indeed P41212, but the
experimental structure is P41, even with deuterium atoms
removed (within the tolerances used in this paper). Assuming
that the methyl groups can rotate more or less freely, it
appears that the correct space group is P41212.
QIKZAN02 (Beko et al., 2014). The space group was
changed from P212121, Z0 = 2 to Pbca, Z0 = 1. As discussed
above, the positions of the H atoms are wrong, but the space
group is correct as is discussed in some detail in the original
paper.
None of the SX structures from the 2010 validation study
had changed their space-group symmetry as a result of the
energy minimization.
research papers
Acta Cryst. (2014). B70, 1020–1032 Jacco van de Streek et al. � Validation of structures from powder diffraction data 1029
Figure 7Overlay for HMBENZ06 (Stride, 2005) of the experimental structure inP�11 (red) and the energy-minimized structure (unit cell free) converted toR�33 (rhombohedral setting) (blue). We conclude that the correct spacegroup is R�33. RMSCD = 0.029 A.
Figure 6Overlay of the non-H atoms of LIPWEM (Chernyshev, Fitch et al., 1999),experimental structure in red, energy-minimized structure (unit cell free)in blue, H atoms omitted for clarity. Although the protonation state is notcorrectly reproduced by the DFT-D minimizations, the positions of thenon-H atoms are not affected. RMSCD = 0.062 A.
Space-group errors appear to be more common in struc-
tures from XRPD data than in those from SX data. Peak
overlap hampers the space-group determination from the
systematic absences, whereas the lower accuracy of the atomic
coordinates makes it difficult to detect the space-group
symmetry in real space. The higher space-group symmetry
only becomes apparent after energy minimization, so the
missed symmetry cannot be detected from the experimental
structure directly; the energy minimization, however, always
refers to 0 K and obscures temperature-dependent space-
group changes.
4. Conclusion
For 225 single-crystal structures, approximately three, or 1.3%,
were incorrect; all three errors pertained to H-atom positions.
For 215 XRPD structures, at least seven (FOMNAX, IJEKAJ,
LAKKEO, LAQSON, SAXFED, XUDTIZ, YIRVOL) show
an error in a non-H atom position, five (FANDOO,
GOLTUW, MEXZOG, UKIRAI, QIKZAN02) have incor-
rectly placed H atoms and five (HMBENZ, QAMXUY,
TMAPCL, ZZZUXA, ZZZVCO) were almost certainly
determined in a subgroup of the actual space group. Two
structures are almost certainly wrong (QAMXUY, VANGAT)
but no satisfactory model could be found. In total, 19/215 =
8.8% of the crystal structures determined from XRPD are
demonstrably in error. Reassuringly, at least for those XRPD
structures that are published in IUCr journals, the errors that
are present in the published crystal structures are virtually all
minor: minor space-group revisions, exchanges of e.g. C and N,
and ambiguities involving H atoms. In some cases the possible
ambiguities had already been spotted by the original authors,
but no instrument existed to resolve the ambiguity; we have
shown here that Dispersion-corrected Density Functional
Theory (DFT-D) calculations provide an independent source
of structural information about organic crystal structures and
as such are ideally suited to boost the reduced information
content of an experimental powder diffraction pattern.
Based on the DFT-D calculations, three crystal structures
(BICCIZ01, WUBDOM, zb5033_FormX) could be re-refined
using the original powder diffraction data to give substantially
more precise atomic coordinates.
Preferred orientation is the greatest source of problems and
uncertainties. Clearly, the presence of preferred orientation
should be regarded with much more suspicion than is currently
the norm.
The Villum Foundation (Denmark) is gratefully acknowl-
edged for financial support (project No. VKR023111). Crystal
structures were visualized using Mercury (Macrae et al., 2008).
References
Allen, F. H. (2002). Acta Cryst. B58, 380–388.Arnott, S. & Dover, S. D. (1968). Acta Cryst. B24, 599–601.Avila, E. E., Mora, A. J., Delgado, G. E., Contreras, R. R., Fitch, A. N.
& Brunelli, M. (2008). Acta Cryst. B64, 217–222.Beko, S. L., Alig, E., Schmidt, M. U. & Van de Streek, J. (2014).
IUCrJ, 1 61–73.
Beko, S. L., Thoms, S. D., Bruning, J., Alig, E., Van de Streek, J.,Lakatos, A., Glaubitz, C. & Schmidt, M. U. (2010). Z. Kristallogr.225, 382–387.
Bhuvanesh, N. S. P., Reibenspies, J. H., Zhang, Y. & Lee, P. L. (2005).J. Appl. Cryst. 38, 632–638.
Blanton, T. N., Rajeswaran, M., Stephens, P. W., Whitcomb, D. R.,Misture, S. T. & Kaduk, J. A. (2011). Powder Diffr. 26, 313–320.
Bortolotti, M., Lonardelli, I. & Pepponi, G. (2011). Acta Cryst. B67,357–364.
Brenner, S., McCusker, L. B. & Baerlocher, C. (2002). J. Appl. Cryst.35, 243–252.
Brunelli, M. & Fitch, A. N. (2003). J. Synchrotron Rad. 10, 337–339.Bruno, I. J., Cole, J. C., Kessler, M., Luo, J., Motherwell, W. D. S.,
Purkis, L. H., Smith, B. R., Taylor, R., Cooper, R. I., Harris, S. E. &Orpen, A. G. (2004). J. Chem. Inf. Comput. Sci. 44, 2133–2144.
Buchsbaum, C. & Schmidt, M. U. (2007). Acta Cryst. B63, 926–932.Burley, J. C. (2005). Acta Cryst. B61, 710–716.Bushmarinov, I. S., Dmitrienko, A. O., Korlyukov, A. A. & Antipin,
M. Yu. (2012). J. Appl. Cryst. 45, 1187–1197.Chernyshev, V. V., Fitch, A. N., Sonneveld, E. J., Kurbakov, A. I.,
Makarov, V. A. & Tafeenko, V. A. (1999). Acta Cryst. B55, 554–562.Chernyshev, V. V., Machula, A. A., Kukushkin, S. Y. & Velikodny, Y.
A. (2009). Acta Cryst. E65, o2020–o2021.Chernyshev, V. V., Paseshnichenko, K. A., Makarov, V. A., Sonneveld,
E. J. & Schenk, H. (2001). Acta Cryst. C57, 72–75.Chernyshev, V. V., Shkavrov, S. V., Paseshnichenko, K. A., Puryaeva,
T. P. & Velikodny, Y. A. (2013). Acta Cryst. C69, 263–266.Chernyshev, V. V., Tafeenko, V. A., Ryabova, S. Y., Sonneveld, E. J. &
Schenk, H. (2001). Acta Cryst. C57, 982–984.Chernyshev, V. V., Yatsenko, A. V., Kuvshinov, A. M. & Shevelev,
S. A. (2002). J. Appl. Cryst. 35, 669–673.Chernyshev, V. V., Yatsenko, A. V., Tafeenko, V. A., Makarov, V. A.,
Sonneveld, E. J. & Schenk, H. (1999). Acta Cryst. C55, 1099–1101.Clark, J. C., McLaughlin, M. L. & Fronczek, F. R. (2003). Acta Cryst.
E59, o2005–o2006.Clark, S. J., Segall, M. D., Pickard, C. J., Hasnip, P. J., Probert, M. J.,
Refson, K. & Payne, M. C. (2005). Z. Kristallogr. 220, 567–570.Coelho, A. A. (2012). TOPAS-Academic, Version 5. Coelho
Software, Brisbane.David, W. I. F., Ibberson, R. M., Cox, S. F. J. & Wood, P. T. (2006).
Acta Cryst. B62, 953–959.David, W. I. F., Shankland, K., Van de Streek, J., Pidcock, E.,
Motherwell, W. D. S. & Cole, J. C. (2006). J. Appl. Cryst. 39, 910–915.
Day, G. M. et al. (2009). Acta Cryst. B65, 107–125.Damay, F., Carretero-Genevrier, A., Cousson, A., Van Beek, W.,
Rodriguez-Carvajal, J. & Fillaux, F. (2006). Acta Cryst. B62, 627–633.
Damay, F., Rodrıguez-Carvajal, J., Andre, D., Dunstetter, F. &Szwarc, H. (2008). Acta Cryst. B64, 589–595.
Deringer, V. L., Hoepfner, V. & Dronskowski, R. (2012). Cryst.Growth Des. 12, 1014–1021.
Derollez, P., Correia, N. T., Danede, F., Capet, F., Affouard, F.,Lefebvre, J. & Descamps, M. (2005). Acta Cryst. B61, 329–334.
Derollez, P., Dudognon, E., Affouard, F., Danede, F., Correia, N. T. &Descamps, M. (2010). Acta Cryst. B66, 76–80.
Derollez, P., Hedoux, A., Guinet, Y., Danede, F. & Paccou, L. (2013).Acta Cryst. B69, 195–202.
Dinnebier, R. E., Dollase, W. A., Helluy, X., Kummerlen, J., Sebald,A., Schmidt, M. U., Pagola, S., Stephens, P. W. & van Smaalen, S.(1999). Acta Cryst. B55, 1014–1029.
Dollase, W. A. (1986). J. Appl. Cryst. 19, 267–272.Florence, A. J., Bardin, J., Johnston, B., Shankland, N., Griffin, T. A.
N. & Shankland, K. (2009). Z. Kristallogr. 30, 215–220.Florence, A. J., Baumgartner, B., Weston, C., Shankland, N., Kennedy,
A. R., Shankland, K. & David, W. I. F. (2003). J. Pharm. Sci. 92,1930–1938.
Grimme, S. (2006). J. Comput. Chem. 27, 1787–1799.
research papers
1030 Jacco van de Streek et al. � Validation of structures from powder diffraction data Acta Cryst. (2014). B70, 1020–1032
Grimme, S., Antony, J., Ehrlich, S. & Krieg, H. (2010). J. Chem. Phys.132, 154104-1–154104-19.
Grzesiak, A. L. & Matzger, A. J. (2007). J. Pharm. Sci. 96, 2978–2986.
Guiry, K. P., Coles, S. J., Moynihan, H. A. & Lawrence, S. E. (2008).Cryst. Growth Des. 8, 3927–3934.
Gunn, E., Guzei, I. A., Cai, T. & Yu, L. (2012). Cryst. Growth Des. 12,2037–2043.
Halasz, I., Dinnebier, R., Chiodo, T. & Saxell, H. (2012). Acta Cryst.B68, 661–666.
Hangan, A., Borodi, G., Filip, X., Tripon, C., Morari, C., Oprean, L. &Filip, C. (2010). Acta Cryst. B66, 615–621.
Helmholdt, R. B., Peschar, R. & Schenk, H. (2002). Acta Cryst. B58,134–139.
Helmholdt, R. B., Sonneveld, E. J., Vande Velde, C. M. L., Blockhuys,F., Lenstra, A. T. H., Geise, H. J. & Peschar, R. (2007). Acta Cryst.B63, 783–790.
Hernandez, O., Hedoux, A., Lefebvre, J., Guinet, Y., Descamps, M.,Papoular, R. & Masson, O. (2002). J. Appl. Cryst. 35, 212–219.
Ibberson, R. M. & Prager, M. (1995). Acta Cryst. B51, 71–76.Ivashevskaja, S. N., Aleshina, L. A., Andreev, V. P., Nizhnik, Y. P. &
Chernyshev, V. V. (2002). Acta Cryst. E58, o920–o922.Ivashevskaja, S. N., Aleshina, L. A., Andreev, V. P., Nizhnik, Y. P.,
Chernyshev, V. V. & Schenk, H. (2003). Acta Cryst. E59, o1006–o1008.
Jaron, T. & Grochala, W. (2011). Acta Cryst. E67, o2171.Johnston, A., Florence, A. J., Shankland, K., Markvardsen, A.,
Shankland, N., Steele, G. & Cosgrove, S. D. (2004). Acta Cryst. E60,o1751–o1753.
Kaduk, J. A. (2000). Acta Cryst. B56, 474–485.Kaduk, J. A. & Golab, J. T. (1999). Acta Cryst. B55, 85–94.Krebs, F. C., Jørgensen, M., Lebech, B. & Frydenvang, K. (2001). J.
Appl. Cryst. 34, 203–207.Kresse, G. & Furthmuller, J. (1996a). Comput. Mater. Sci, 6, 15–50.Kresse, G. & Furthmuller, J. (1996b). Phys. Rev. B, 54, 11169–11186.Kutzke, H., Klapper, H., Hammond, R. B. & Roberts, K. J. (2000).
Acta Cryst. B56, 486–496.Lasocha, W., Gaweł, B., Rafalska-Lasocha, A., Pawłowski, M., Talik,
P. & Paszkowicz, W. (2010). J. Appl. Cryst. 43, 163–167.Lefebvre, J., Willart, J.-F., Caron, V., Lefort, R., Affouard, F. &
Danede, F. (2005). Acta Cryst. B61, 455–463.Lehmann, A., Luger, P., Lehmann, C. W. & Ibberson, R. M. (1994).
Acta Cryst. B50, 344–348.Li, X., Bond, A. D., Johansson, K. E. & Van de Streek, J. (2014). Acta
Cryst. C70, 784–789.Llinas, A., Box, K. J., Burley, J. C., Glen, R. C. & Goodman, J. M.
(2007). J. Appl. Cryst. 40, 379–381.Llinas, A., Fabian, L., Burley, J. C., Van de Streek, J. & Goodman, J.
M. (2006). Acta Cryst. E62, o4196–o4199.Logacheva, N. M., Puryaeva, T. P., Tsivadze, A. Y., Velikodny, Y. A. &
Chernyshev, V. V. (2008). Acta Cryst. E64, o225.Macrae, C. F., Bruno, I. J., Chisholm, J. A., Edgington, P. R., McCabe,
P., Pidcock, E., Rodriguez-Monge, L., Taylor, R., Van de Streek, J.& Wood, P. A. (2008). J. Appl. Cryst. 41, 466–470.
Mangwala Kimpende, P. & Van Meervelt, L. (2010). Acta Cryst. E66,o2353–o2354.
Mechelen, J. B. van, Goubitz, K., Pop, M., Peschar, R. & Schenk, H.(2008). Acta Cryst. B64, 771–779.
Mechelen, J. B. van, Peschar, R. & Schenk, H. (2006a). Acta Cryst.B62, 1121–1130.
Mechelen, J. B. van, Peschar, R. & Schenk, H. (2006b). Acta Cryst.B62, 1131–1138.
Meriles, C. A., Schneider, J. F., Mascarenhas, Y. P. & Brunetti, A. H.(2000). J. Appl. Cryst. 33, 71–81.
Moggach, S. A., Marshall, W. G. & Parsons, S. (2006). Acta Cryst. B62,815–825.
Mora, A. J., Avila, E. E., Delgado, G. E., Fitch, A. N. & Brunelli, M.(2005). Acta Cryst. B61, 96–102.
Muangsin, N., Prajuabsook, M., Chimsook, P., Chantarasiri, N.,Siraleartmukul, K., Chaichit, N. & Hannongbua, S. (2004). J. Appl.Cryst. 37, 288–294.
Naelapaa, K., Van de Streek, J., Rantanen, J. & Bond, A. D. (2012). J.Pharm. Sci. 101, 4214–4219.
Neumann, M. A. (2013). GRACE, Version 2.1, http://www.avmat-sim.eu. Avant-garde Materials Simulation SARL, France.
Neumann, M. A. & Perrin, M.-A. (2005). J. Phys. Chem. B, 109,15531–15541.
Neumann, M. A., Tedesco, C., Destri, S., Ferro, D. R. & Porzio, W.(2002). J. Appl. Cryst. 35, 296–303.
Noguchi, S., Fujiki, S., Iwao, Y., Miura, K. & Itai, S. (2012). Acta Cryst.E68, o667–o668.
Noguchi, S., Miura, K., Fujiki, S., Iwao, Y. & Itai, S. (2012). Acta Cryst.C68, o41–o44.
Ochando, L. E., Rius, J., Louer, D., Claramunt, R. M., Lopez, C.,Elguero, J. & Amigo, J. M. (1997). Acta Cryst. B53, 939–944.
Palacios, E., Burriel, R. & Ferloni, P. (2003). Acta Cryst. B59, 625–633.
Palatinus, L. & Damay, F. (2009). Acta Cryst. B65, 784–786.Papoular, R. J., Allouchi, H., Chagnes, A., Dzyabchenko, A., Carre,
B., Lemordant, D. & Agafonov, V. (2005). Acta Cryst. B61, 312–320.Pawley, G. S. & Whitley, E. (1988). Acta Cryst. C44, 1249–1251.Perdew, J. P., Burke, K. & Ernzerhof, M. (1996). Phys. Rev. Lett. 77,
3865–3868.Pop, M. M., Goubitz, K., Borodi, G., Bogdan, M., De Ridder, D. J. A.,
Peschar, R. & Schenk, H. (2002). Acta Cryst. B58, 1036–1043.Putkonen, M.-L., Feld, R., Vettier, C. & Lehmann, M. S. (1985). Acta
Cryst. B41, 77–79.Racz, C.-P., Borodi, G., Pop, M. M., Kacso, I., Santa, S. & Tomoaia-
Cotisel, M. (2012). Acta Cryst. B68, 164–170.Reck, G., Kretschmer, R.-G., Kutschabsky, L. & Pritzkow, W. (1988).
Acta Cryst. A44, 417–421.Rohlicek, J., Husak, M., Gavenda, A., Jegorov, A., Kratochvil, B. &
Fitch, A. (2009). Acta Cryst. E65, o1325–o1326.Rukiah, M., Lefebvre, J., Descamps, M., Hemon, S. & Dzyabchenko,
A. (2004). J. Appl. Cryst. 37, 464–471.Rukiah, M., Lefebvre, J., Hernandez, O., van Beek, W. & Serpelloni,
M. (2004). J. Appl. Cryst. 37, 766–772.Rybakov, V. B., Babaev, E. V., Sonneveld, E. J., Zhukov, S. G. &
Chernyshev, V. V. (2007). Acta Cryst. E63, o1861–o1863.Santarsiero, B. D., Bronikowski, M. J. & Samson, S. O. (1985). ACA
Abstr. Papers (Winter), 13, 55.Seijas, L. E., Mora, A. J., Delgado, G. E., Lopez-Carrasquero, F.,
Baez, M. E., Brunelli, M. & Fitch, A. N. (2009). Acta Cryst. B65,724–730.
Sergeev, G. B., Sergeev, B. M., Morosov, Y. N. & Chernyshev, V. V.(2010). Acta Cryst. E66, o2623.
Shankland, K., McBride, L., David, W. I. F., Shankland, N. & Steele,G. (2002). J. Appl. Cryst. 35, 443–454.
Sholl, D. S. & Steckel, J. A. (2009). Density Functional Theory – APractical Introduction. New Jersey: John Wiley and Sons Inc.
Smrcok, L. (2012). Uniting Electron Crystallography and PowderDiffraction, edited by U. Kolb, K. Shankland, L. Meshi, A. Avilov &W. I. F. David. Dordrecht: Springer Science + Business Media.
Stone, K. H., Lapidus, S. H. & Stephens, P. W. (2009). J. Appl. Cryst.42, 385–391.
Stride, J. A. (2005). Acta Cryst. B61, 200–206.Tanahashi, Y., Nakamura, H., Yamazaki, S., Kojima, Y., Saito, H., Ida,
T. & Toraya, H. (2001). Acta Cryst. B57, 184–189.Tremayne, M., MacLean, E. J., Tang, C. C. & Glidewell, C. (1999).
Acta Cryst. B55, 1068–1074.Tremayne, M., Seaton, C. C. & Glidewell, C. (2002). Acta Cryst. B58,
823–834.Van de Streek, J. (2006). Acta Cryst. B62, 567–579.Van de Streek, J. (2012). Acta Cryst. C68, o369–o372.Van de Streek, J. & Neumann, M. A. (2010). Acta Cryst. B66, 544–
558.
research papers
Acta Cryst. (2014). B70, 1020–1032 Jacco van de Streek et al. � Validation of structures from powder diffraction data 1031

Van Langevelde, A., Van Malssen, K., Driessen, R., Goubitz, K.,Hollander, F., Peschar, R., Zwart, P. & Schenk, H. (2000). ActaCryst. B56, 1103–1111.
Vella-Zarb, L. & Dinnebier, R. E. (2012). Acta Cryst. B68, 204–208.Wilding, N. B., Crain, J., Hatton, P. D. & Bushnell-Wye, G. (1993).
Acta Cryst. B49, 320–328.
Wunschel, M., Dinnebier, R. E., Carlson, S., Bernatowicz, P. & vanSmaalen, S. (2003). Acta Cryst. B59, 60–71.
Zhou, T., Zhang, Q., Chen, G. & Zhou, Z. (2004). Acta Cryst. E60,o1767–o1768.
Zvirgzdins, A., Mishnev, A. & Actins, A. (2014). Acta Cryst. B70, 342–346.
research papers
1032 Jacco van de Streek et al. � Validation of structures from powder diffraction data Acta Cryst. (2014). B70, 1020–1032


![Crystal structure of a dimeric [beta]-diketiminate magnesium …journals.iucr.org/e/issues/2016/12/00/zl2683/zl2683.pdf · 2016-11-30 · containing a covalent magnesium–magnesium](https://img.pdfslide.us/doc/110x75/5e3fbff9d5f7513ddc38ab02/crystal-structure-of-a-dimeric-beta-diketiminate-magnesium-2016-11-30-containing.jpg)
![Crystal structure of hexakis([mu]2-4-tert-butoxy-4 …journals.iucr.org/e/issues/2014/12/00/gk2617/gk2617.pdf2. Structural commentary The crystal structure of the zinc complex synthesized](https://img.pdfslide.us/doc/110x75/5ab990d37f8b9ac60e8e3564/crystal-structure-of-hexakismu2-4-tert-butoxy-4-structural-commentary-the.jpg)
![research communications Crystal structure of 5,7,12,14 ...journals.iucr.org/e/issues/2016/12/00/zl2675/zl2675.pdf · bis([1,2]benzeno)pentacene-6,13-dione1 Mohammad Nozari,a* Jerry](https://img.pdfslide.us/doc/110x75/5c648e7209d3f2916e8b5e53/research-communications-crystal-structure-of-571214-bis12benzenopentacene-613-dione1.jpg)


![Crystal structure of bis[(phenylmethanamine-[kappa]N ...journals.iucr.org/e/issues/2015/09/00/hb7468/hb7468.pdf · conducting materials (Yang et al., 2015), as homogeneous and heterogeneous](https://img.pdfslide.us/doc/110x75/5e1d9bec8b9684692e68efc7/crystal-structure-of-bisphenylmethanamine-kappan-conducting-materials-yang.jpg)