Embed Size (px)
Citation preview
Validation of models for Laser Ultrasonic spectra as a function of the grain size in steel
H. Wirdelius1, M. Malmström2, A. Duijster3, A. Volker3, D. Krix4, M. Stolzenberg4, A. Martinez-de-Guerenu5, I. Gutierrez5, D. Jorge-Badiola5, F.D. van den Berg6 and P.J.J. Kok6
1 Chalmers University of Technology, Sweden, [email protected] 2 Swerea-KIMAB, Sweden, [email protected] 3 TNO, The Netherlands, [email protected] 4 Salzgitter Mannesmann Forschung GmbH, Germany, [email protected] 5 CEIT, Spain, [email protected] 6 Tata Steel, The Netherlands, [email protected]
Abstract To reduce costs of production and increase economic sustainability it is necessary to introduce quality assessment in an early stage in the manufacturing process. In the European project (Product Uniformity Control – PUC), the intention is to use ultrasonic information to assess microstructure parameters that are related to macroscale qualities such as mechanical properties. Laser induced ultrasonic technique (LUS) requires no media and can generate and detect ultrasonic information at some distance from the component. This technique is therefore addressed within this project as a solution to measure ultrasonic properties in an industrial environment. Mathematical modelling of the ultrasonic wave propagation problem has been used in order to get a deeper understanding of the physics and to identify ultrasonic properties that can be used as an indirect measurement of grain size. The use of both analytical and numerical models enabled extensive parametric studies together with investigation of ultrasonic interactions with well-defined individual microstructures. The LUS technique has previously been applied to e.g. monitor grain growth during thermomechanical processing of metals. These applications identified and used a correlation with the frequency content of the attenuation. This have been investigated as a possible indirect measurement of grain size, also in this project. The models have been used to verify the correlations and to evaluate different procedures that could be applied as an industrial solution. The suggested procedure is based on deconvolving two successive echoes and has been experimentally validated by two different LUS systems. The reference samples used in the validation were produced by changing the annealing temperature and time to obtain a variation in grain sizes. These grain sizes were then identified by EBSD and the samples were examined in terms of grain size influence on spectral attenuation.
1. Introduction Different process steps influence the final properties of the steel strip and any intention to improve the quality (or to keep it uniform) inherently means that these properties must be monitored during the hole production process. Non-destructive material characterisation methods can be applied inline to monitor parameters (e.g. grain size, texture or composition) that are related to the mechanical properties over the length of the steel strips. When inline measured material parameters can be correlated to the acceptance limits, removal of excess material may be avoided and the quality can be preserved. The primary objective of the PUC (Product Uniformity Control) project (1) is to achieve enhanced and sustained product uniformity in steel strip production. If this is achieved in an early stage in the manufacturing process the quality within the finished product can be predicted to large extent.
The use of ultrasonic (US) information to assess microstructure parameters is an established method with the correlation normally based on empirical models. These models are then based on costly and time consuming experimental processes that includes both ultrasonic together with destructive examinations on a large scale. In pure scattering of ultrasonic waves, the energy of motion is not converted to heat; instead, it is diverted into waves traveling in directions other than the main wave. These diverted waves appear as random noise and the amount of wave energy that is scattered depends mainly on the impedance mismatch and size of the scattering particles (grain size) compared to the wavelength of the ultrasonic wave.
Attenuation of ultrasonic waves in a material can have several causes. In a pure, perfect crystal there will be no attenuation, but this case is rarely met in practice. In all real crystals there will be dislocations of different kinds and this leads to some attenuation (2,3). However, for cases of interest in the present project this type of attenuation is of minor importance; instead the attenuation due to grain boundary scattering is expected to be the main source of attenuation.
The effects of grains boundaries on the propagation of ultrasonic waves have been investigated using perturbation methods, mostly the Born approximation (4,5) where weak anisotropy and equally-sized and spherical grains are assumed. A similar approach is used by Stanke (6), but incorporating also anisotropic grains and the full frequency range. Other associated works are based on using the Dyson equation (7,8) and in some cases also incorporating effects of elongated grains (9). Another type of weak-scattering method to calculate the back-scattering coefficient is developed by Rose (10) and has been further extended and used for a number of cases by Thompson et. al. (11).
It should be noted that in all methods mentioned above the shape of the grains is not taken into account, the shape is simply assumed to be spherical or spheroidal at most. A further point is that all methods above rely on some sort of statistics about the grains and the material properties. At low frequencies the scattering is mainly a volume effect so the exact shape should not be very important. A completely different type of approach is to make a detailed numerical model of the material including every grain and solve this with FEM or some other numerical method. A related approach is to take a (large) number of scatterers representing typical grains and compute the scattering without or with the inclusion of multiple scattering effects (the scatterers need not fill the complete domain, some extrapolation can be performed). These two latter methods do not rely on any statistical data, instead they assume a typical configuration, which can of course be realized repeatedly to give a measure of the spreading.
Laser induced ultrasonic technique (LUS) requires no media and can generate and detect ultrasonic information at some distance from the component. This technique is therefore addressed within this project as a solution to measure ultrasonic properties in an industrial environment.
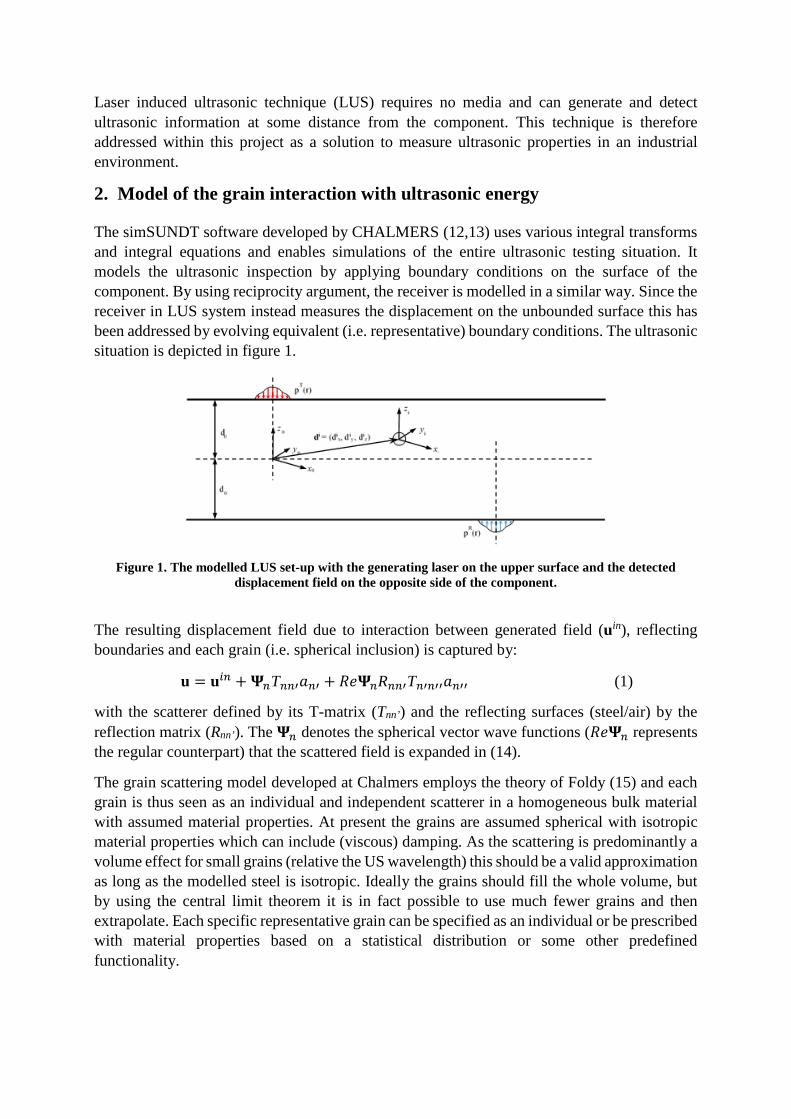
2. Model of the grain interaction with ultrasonic energy The simSUNDT software developed by CHALMERS (12,13) uses various integral transforms and integral equations and enables simulations of the entire ultrasonic testing situation. It models the ultrasonic inspection by applying boundary conditions on the surface of the component. By using reciprocity argument, the receiver is modelled in a similar way. Since the receiver in LUS system instead measures the displacement on the unbounded surface this has been addressed by evolving equivalent (i.e. representative) boundary conditions. The ultrasonic situation is depicted in figure 1.
Figure 1. The modelled LUS set-up with the generating laser on the upper surface and the detected
displacement field on the opposite side of the component.
The resulting displacement field due to interaction between generated field (uin), reflecting boundaries and each grain (i.e. spherical inclusion) is captured by:
u = u𝑖𝑖𝑖𝑖 + 𝚿𝚿𝑖𝑖T𝑖𝑖𝑖𝑖′𝑎𝑎𝑖𝑖′ + 𝑅𝑅𝑅𝑅𝚿𝚿𝑖𝑖R𝑖𝑖𝑖𝑖′T𝑖𝑖′𝑖𝑖′′𝑎𝑎𝑖𝑖′′ (1)
with the scatterer defined by its T-matrix (Tnn’) and the reflecting surfaces (steel/air) by the reflection matrix (Rnn’). The 𝚿𝚿𝑖𝑖 denotes the spherical vector wave functions (𝑅𝑅𝑅𝑅𝚿𝚿𝑖𝑖 represents the regular counterpart) that the scattered field is expanded in (14).
The grain scattering model developed at Chalmers employs the theory of Foldy (15) and each grain is thus seen as an individual and independent scatterer in a homogeneous bulk material with assumed material properties. At present the grains are assumed spherical with isotropic material properties which can include (viscous) damping. As the scattering is predominantly a volume effect for small grains (relative the US wavelength) this should be a valid approximation as long as the modelled steel is isotropic. Ideally the grains should fill the whole volume, but by using the central limit theorem it is in fact possible to use much fewer grains and then extrapolate. Each specific representative grain can be specified as an individual or be prescribed with material properties based on a statistical distribution or some other predefined functionality.
3. Results 3.1 Experimental set-up and procedure Swerea KIMAB have conducted laser ultrasonic measurements on samples provided by CEIT. With different annealing temperature CEIT have produced and characterized (16) samples with well-defined grain sizes (20 µm, 37.8 µm and 76.3 µm). The ultrasonic system consists of a generating laser working in the ablation regime with a pulse energy of 100 mJ, pulse length of ~10 ns and a spot size diameter of ~1 mm. The detection laser was a single longitudinal mode laser with a pulsed power amplifier generating ~100 µs pulses and interrogated with a GaAs two wave interferometer. The ultrasonic properties are measured in transmission. A procedure based on a frequency dependent correlation between ultrasonic attenuation and grain size is used in situ for continuous measurements of recrystallization and grain growth (17). This procedure has been evaluated within this project with the intention to apply it in the application addressed in this project (i.e. online monitoring of grain size in steel production). The ultrasonic scattering that describes the attenuation for the frequencies and grain sizes of interest here, is in between the Rayleigh region and Stochastic region. This attenuation has been shown to be proportional to the third power of frequency (19) as:
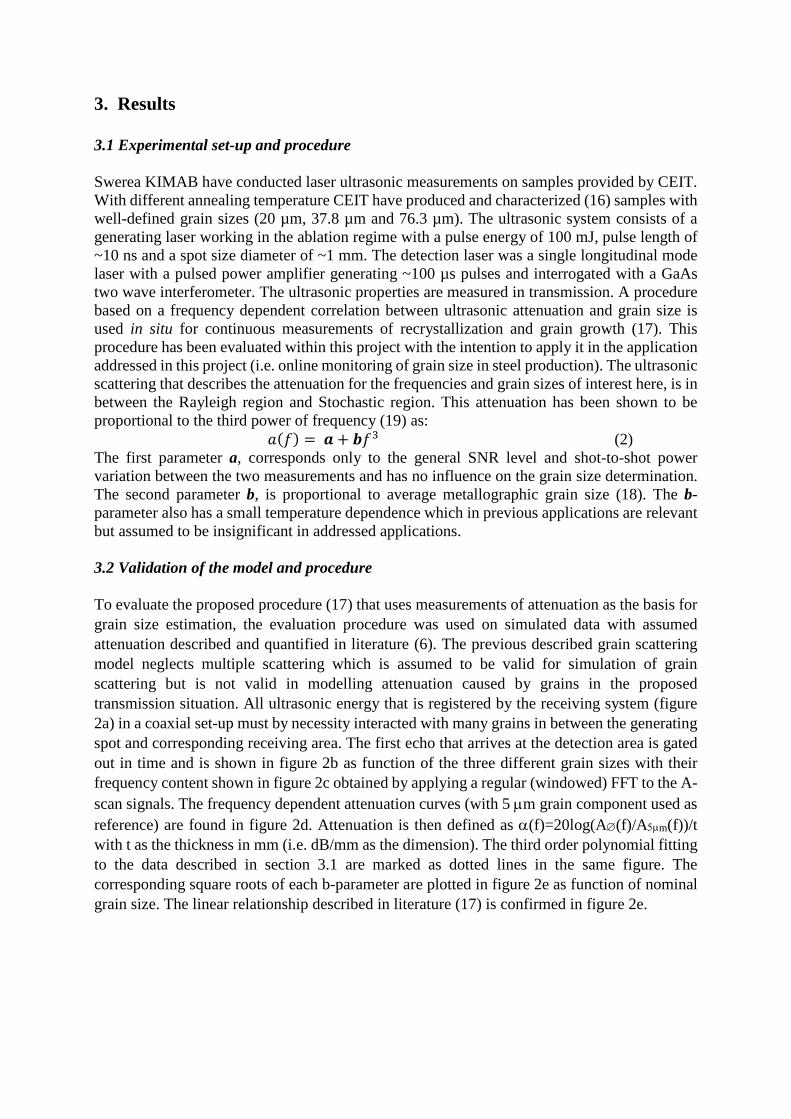
𝑎𝑎(𝑓𝑓) = 𝒂𝒂 + 𝒃𝒃𝑓𝑓3 (2) The first parameter a, corresponds only to the general SNR level and shot-to-shot power variation between the two measurements and has no influence on the grain size determination. The second parameter b, is proportional to average metallographic grain size (18). The b-parameter also has a small temperature dependence which in previous applications are relevant but assumed to be insignificant in addressed applications. 3.2 Validation of the model and procedure To evaluate the proposed procedure (17) that uses measurements of attenuation as the basis for grain size estimation, the evaluation procedure was used on simulated data with assumed attenuation described and quantified in literature (6). The previous described grain scattering model neglects multiple scattering which is assumed to be valid for simulation of grain scattering but is not valid in modelling attenuation caused by grains in the proposed transmission situation. All ultrasonic energy that is registered by the receiving system (figure 2a) in a coaxial set-up must by necessity interacted with many grains in between the generating spot and corresponding receiving area. The first echo that arrives at the detection area is gated out in time and is shown in figure 2b as function of the three different grain sizes with their frequency content shown in figure 2c obtained by applying a regular (windowed) FFT to the A-scan signals. The frequency dependent attenuation curves (with 5 µm grain component used as reference) are found in figure 2d. Attenuation is then defined as α(f)=20log(A∅(f)/A5µm(f))/t with t as the thickness in mm (i.e. dB/mm as the dimension). The third order polynomial fitting to the data described in section 3.1 are marked as dotted lines in the same figure. The corresponding square roots of each b-parameter are plotted in figure 2e as function of nominal grain size. The linear relationship described in literature (17) is confirmed in figure 2e.
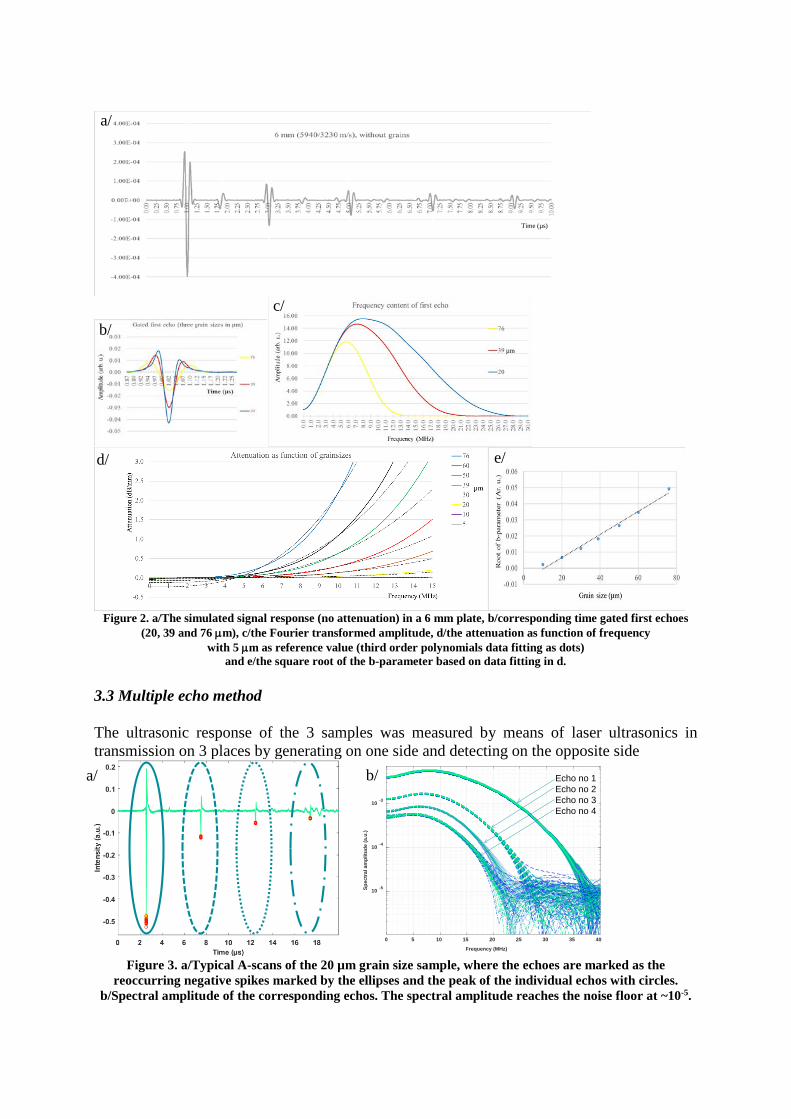
Figure 2. a/The simulated signal response (no attenuation) in a 6 mm plate, b/corresponding time gated first echoes
(20, 39 and 76 µm), c/the Fourier transformed amplitude, d/the attenuation as function of frequency with 5 µm as reference value (third order polynomials data fitting as dots)
and e/the square root of the b-parameter based on data fitting in d. 3.3 Multiple echo method The ultrasonic response of the 3 samples was measured by means of laser ultrasonics in transmission on 3 places by generating on one side and detecting on the opposite side
Figure 3. a/Typical A-scans of the 20 µm grain size sample, where the echoes are marked as the
reoccurring negative spikes marked by the ellipses and the peak of the individual echos with circles. b/Spectral amplitude of the corresponding echos. The spectral amplitude reaches the noise floor at ~10-5.
0 5 10 15 20 25 30 35 40
Frequency (MHz)
10 -5
10 -4
10 -3
Spec
tral
am
plitu
de (a
.u.)
Echo no 1Echo no 2Echo no 3Echo no 4
b/ c/
d/ e/
a/
Time (µs)
µm
a/ b/
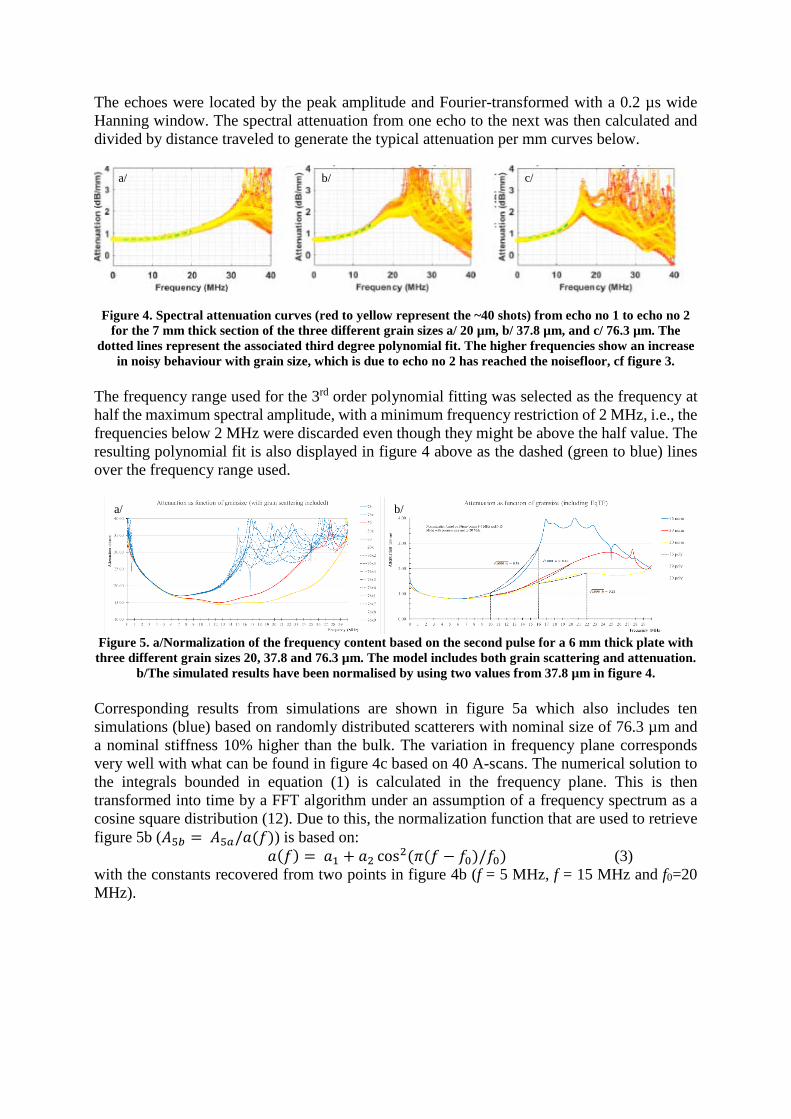
The echoes were located by the peak amplitude and Fourier-transformed with a 0.2 µs wide Hanning window. The spectral attenuation from one echo to the next was then calculated and divided by distance traveled to generate the typical attenuation per mm curves below.
Figure 4. Spectral attenuation curves (red to yellow represent the ~40 shots) from echo no 1 to echo no 2 for the 7 mm thick section of the three different grain sizes a/ 20 µm, b/ 37.8 µm, and c/ 76.3 µm. The
dotted lines represent the associated third degree polynomial fit. The higher frequencies show an increase in noisy behaviour with grain size, which is due to echo no 2 has reached the noisefloor, cf figure 3.
The frequency range used for the 3rd order polynomial fitting was selected as the frequency at half the maximum spectral amplitude, with a minimum frequency restriction of 2 MHz, i.e., the frequencies below 2 MHz were discarded even though they might be above the half value. The resulting polynomial fit is also displayed in figure 4 above as the dashed (green to blue) lines over the frequency range used.
Figure 5. a/Normalization of the frequency content based on the second pulse for a 6 mm thick plate with three different grain sizes 20, 37.8 and 76.3 µm. The model includes both grain scattering and attenuation.
b/The simulated results have been normalised by using two values from 37.8 µm in figure 4. Corresponding results from simulations are shown in figure 5a which also includes ten simulations (blue) based on randomly distributed scatterers with nominal size of 76.3 µm and a nominal stiffness 10% higher than the bulk. The variation in frequency plane corresponds very well with what can be found in figure 4c based on 40 A-scans. The numerical solution to the integrals bounded in equation (1) is calculated in the frequency plane. This is then transformed into time by a FFT algorithm under an assumption of a frequency spectrum as a cosine square distribution (12). Due to this, the normalization function that are used to retrieve figure 5b (𝐴𝐴5𝑏𝑏 = 𝐴𝐴5𝑎𝑎/𝑎𝑎(𝑓𝑓)) is based on:
𝑎𝑎(𝑓𝑓) = 𝑎𝑎1 + 𝑎𝑎2 cos2(𝜋𝜋(𝑓𝑓 − 𝑓𝑓0)/𝑓𝑓0) (3) with the constants recovered from two points in figure 4b (f = 5 MHz, f = 15 MHz and f0=20 MHz).
a/ b/ c/
a/ b/
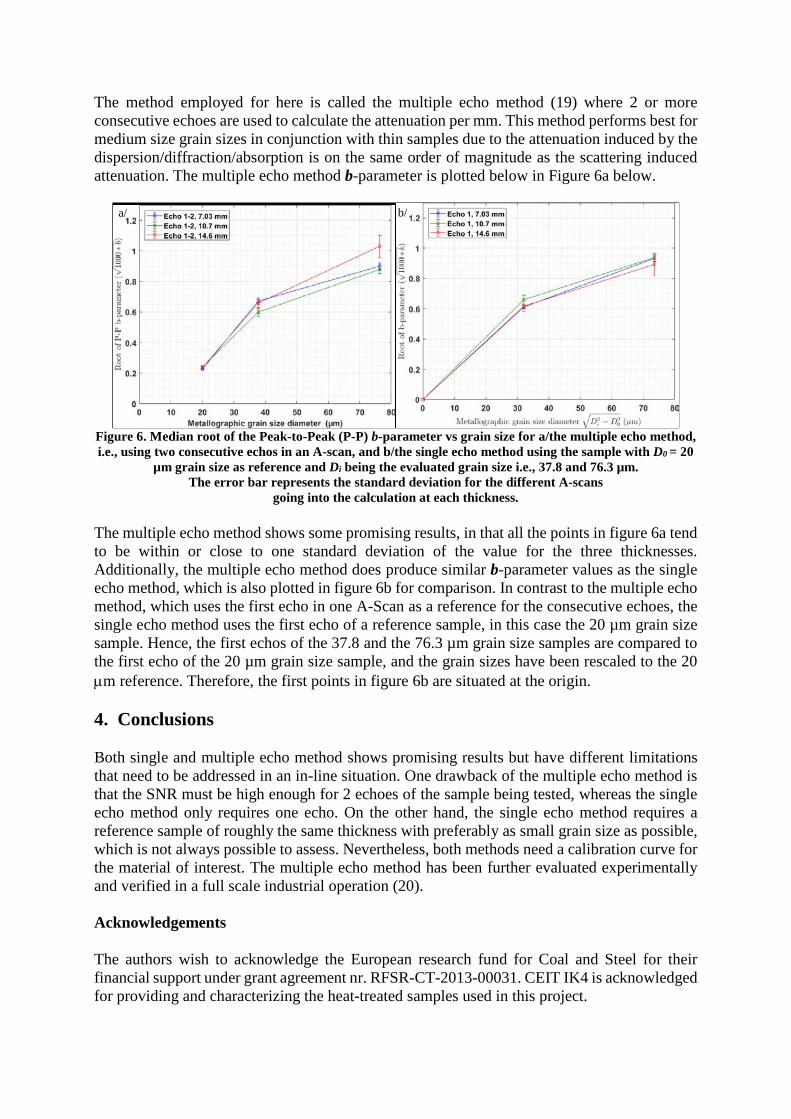
The method employed for here is called the multiple echo method (19) where 2 or more consecutive echoes are used to calculate the attenuation per mm. This method performs best for medium size grain sizes in conjunction with thin samples due to the attenuation induced by the dispersion/diffraction/absorption is on the same order of magnitude as the scattering induced attenuation. The multiple echo method b-parameter is plotted below in Figure 6a below.
Figure 6. Median root of the Peak-to-Peak (P-P) b-parameter vs grain size for a/the multiple echo method, i.e., using two consecutive echos in an A-scan, and b/the single echo method using the sample with D0 = 20
µm grain size as reference and Di being the evaluated grain size i.e., 37.8 and 76.3 µm. The error bar represents the standard deviation for the different A-scans
going into the calculation at each thickness. The multiple echo method shows some promising results, in that all the points in figure 6a tend to be within or close to one standard deviation of the value for the three thicknesses. Additionally, the multiple echo method does produce similar b-parameter values as the single echo method, which is also plotted in figure 6b for comparison. In contrast to the multiple echo method, which uses the first echo in one A-Scan as a reference for the consecutive echoes, the single echo method uses the first echo of a reference sample, in this case the 20 µm grain size sample. Hence, the first echos of the 37.8 and the 76.3 µm grain size samples are compared to the first echo of the 20 µm grain size sample, and the grain sizes have been rescaled to the 20 µm reference. Therefore, the first points in figure 6b are situated at the origin. 4. Conclusions Both single and multiple echo method shows promising results but have different limitations that need to be addressed in an in-line situation. One drawback of the multiple echo method is that the SNR must be high enough for 2 echoes of the sample being tested, whereas the single echo method only requires one echo. On the other hand, the single echo method requires a reference sample of roughly the same thickness with preferably as small grain size as possible, which is not always possible to assess. Nevertheless, both methods need a calibration curve for the material of interest. The multiple echo method has been further evaluated experimentally and verified in a full scale industrial operation (20). Acknowledgements The authors wish to acknowledge the European research fund for Coal and Steel for their financial support under grant agreement nr. RFSR-CT-2013-00031. CEIT IK4 is acknowledged for providing and characterizing the heat-treated samples used in this project.
a/ b/
References 1. F Van den Berg et al., “In-line characterisation of microstructure and mechanical
properties in manufacturing of steel strip for the purpose of Product Uniformity Control”, Proc. 19th WCNDT, München, 2016.
2. A Granato and K Lücke, “Theory of mechanical damping due to dislocations”, J. Appl. Phys. 27, pp 583-593, 1956.
3. A Maurel, V Pagneux, F Barra, and F Lund, “Wave propagation through a random array of pinned dislocations: velocity change and attenuation in generalized Granato and Lücke theory”, Phys. Rev. B 72, pp 174111, 2005.
4. S Hirsekorn, “The scattering of ultrasonic waves by polycrystals”, J. Acoust. Soc. Am. 72, pp 1021-1031, 1982.
5. S Hirsekorn, “The scattering of ultrasonic waves in polycrystalline materials with texture”, J. Acoust. Soc. Am. 77, pp 832-843, 1985.
6. FE Stanke and GS Kino, “A unified theory for elastic wave propagation in polycrystalline materials”, J. Acoust. Soc. Am. 75, pp 665-681, 1984.
7. RL Weaver, “Diffusivity of ultrasound in polycrystals”, J. Mech. Phys. Solids 38, pp 55-86, 1990.
8. JA Turner, “Elastic wave propagation and scattering in heterogeneous, anisotropic media: textured polycrystalline materials”, J. Acoust. Soc. Am. 106, pp 541-552, 1999.
9. L Yang, OI Lobkis and SI Rokhlin, ”Explicit model for ultrasonic attenuation in equiaxial hexagonal polycrystalline materials”, Ultrasonics 51, pp 303-309, 2011.
10. JH Rose, “Ultrasonic backscattering from polycrystalline aggregates using time-domain linear response theory”, Review of Quantitative Nondestructive Evaluation Vol. 10, Eds. DO Thompson and DE Chimenti, Am. Inst. Phys., pp 1715-1720, 1991.
11. RB Thompson, FJ Margetan, P Haldipur, L Yu, P Li, P Panetta and H Wasan, ”Scattering of elastic waves in simple and complex polycrystals”, Wave Motion 45, pp 655-674, 2008.
12. A Boström and H Wirdelius, “Ultrasonic probe modeling and non-destructive crack detection”, J. Acoust. Soc. Am. 97, pp 2836-2848, 1995.
13. H Wirdelius, “Experimental validation of the UTDefect simulation software”, Proc. 6th Int. Conf. on NDE in Relation to Structural Integrity for Nuclear and Pressurized Components, Budapest, 2007.
14. A Boström and A Karlsson, “Point-force excitation of an elastic Plate with an embedded cavity”,J. Appl. Mech. 52, pp 937-942, 1985.
15. LL Foldy, “The multiple scattering of waves. I. General theory of isotropic scattering by randomly distributed scatterers”, Phys. Rev., 67, pp 107-119, 1945.
16. L Zhou et al., WCNDT 2016 Munich Proceedings, paper Tu2H2. 17. T Garcin, JH Schmitt and M Militzer, “In-Situ Laser Ultrasonic Grain Size Measurement
in Superalloy INCONEL 718”, J. of Alloys and Compounds 670, pp 329-336, 2016. 18. M Dubois, M Militzer, A Moreau, and JF Bussière, “A New Technique for the
Quantitative Real-Time Monitoring of Austenite Grain Growth in Steel”, Scripta Materialia 42, 9, pp 867-874, 2000.
19. JD Aussel and JP Monchalin, “Measurement of Ultrasound Attenuation by Laser Ultrasonics”, J. Appl. Phys. 65, 8, pp 2918 – 2922, 1989.
20. M. Malmström et al., “Laser ultrasonics for real-time monitoring of microstructures for efficient development and manufacturing of high performance steel”, ECNDT 2018.