Embed Size (px)
Citation preview

Validation of Dust Devil-like Vortex SimulationsKuan-Chih Chen and Carlos F. Lange
CFD Laboratory, Department of Mechanical Engineering, University of Alberta, Edmonton, Alberta, T6G 2G8,Canada
Email: [email protected], [email protected]
ABSTRACT
The Phoenix Mars mission has confirmed the existenceof water ice and the occurrence of dust devils at thePhoenix landing site on Mars. It is believed that dustdevil-like vortices would influence the Martian watervapour transport. This numerical study has focused onthe ability of reproducing dust devil-like vortices usingCFD in order to reveal more details of the Martian wa-ter cycle in future studies. Characteristic parameters,such as aspect ratio, swirl ratio, and Reynolds numberwere explored to validate the dust devil-like flows.
Stereo particle image velocimetry was used to inves-tigate the flow velocity field generated by the vortexgenerator. A numerical model was created based onthe physical scale of vortex generator at the Univer-sity of Alberta. This transient simulation was studiedusing a commercial software package, ANSYS/CFX13.0. The Reynolds stress turbulence model (RSM-SSG) was employed for producing a better vortex fieldnumerically. The laboratory conditions in the experi-ments were applied to the model for validation of thenumerical solutions. The results indicated this numer-ical model can reproduce the desired dust devil-likeflows by comparing the characteristic parameters.
1 INTRODUCTION
Many observational evidences of dust devils have beenpresented from several Mars missions. One exampleis the photographs taken from the Surface Stereo Im-ager (SSI) of Phoenix Mars lander mission [2]. Totalof 502 vortices with pressure drop higher than 0.3 Pawere measured by the meteorological station (MET)on Phoenix lander [2, 4, 5]. A significant tempera-ture increase would influence the amount of thermalplumes and would result in convective vortices anddust devils. It has been reported that 502 vortices withpressure drop larger than 0.3 Pa were observed duringthe Phoenix mission [2].
Since a dust devil is hard to locate the event’s placeand to control its strength, a vortex generator was of-ten used to study this type of vortex flow. It shouldbe able to produce the desired structure of vorticesand kinematically similar to dust devil-like vortices.A modified vortex generator is constructed based onthe Gallus-type [3]. The experiments were carried outunder Earth ambient conditions. With this approach,the experiment was then numerically simulated withthe same laboratory’s conditions for validation. Ve-locity profiles in the experiments, which are producedwith different fan speeds, are measured using the SPIVtechnique. The results are verified by comparisonwith Gallus’s experimental data. It is possible to testthe experiments under the Martian conditions. How-ever, considering the relatively large dimensions of thesetup, it is extremely difficult to control and/or quan-tify all the influencing parameters. The cost will be tooexpensive comparing with numerical simulations.
2 CHARACTERISTIC PARAMETERS OFDUST DEVILS
Dust devils are usually characterized by 1) swirl ratio,2) Reynolds number, and 3) aspect ratio, which can bewritten as,
Score =rcoreUtcore
2hcoreUrcore
(1)
Recore =2πrcoreUrcore
ν. (2)
acore =hcore
rcore(3)
where Utcore is an average maximum tangential veloc-ity, Urcore the average radial velocity at rcore region,and hcore the depth of inflow at rcore region. It shouldbe noted that the updraft volume flow rate within thecore (2πr2
coreUzcore) has the same amount as the inflowvolume flow rate through the depth of the core region

(2πrcorehcoreUrcore). Hence, hcore can be calculated by
hcore =rcoreUzcore
Urcore
(4)
where Uzcore is the average vertical velocity at the ra-dius of vortex core. Note that the difined swirl ratiodiffers from the Gallus’ swirl ratio [3] which is definedas
Sgallus =πr2
coreUθmax
Q∗updra f t
. (5)
where Uθmax is the maximum average tangential ve-locity at rcore and Q∗
updra f t the updraft volume flowrate through the system, which is the volume flow ratethrough the fan in the experiments and numerical mod-els.
3 NUMERICAL MODEL SETUP
Figure 1 shows a three dimensional numerical modelwhich is used for validation with the flow field exper-iments (see Figure 2). It should be noted that the bot-tom domain represents the porous medium which iscreated for the extensional study in the future. Thetop part is a vortex generator domain. The middle partis an open area which represented the region betweenwater tank and vortex generator. Both the top and themiddle domains are simulated as air regions. The di-mensions of vortex generator is summarized in Table1.
Figure 1: A three-dimensional numerical model setupand the use of typical mesh at the YZ plane.
An unstructured tetrahedral grid was applied to the en-tire model. Transient simulations are resolved with
Inflow Height
VortexHeight
Inlet
Foams
Scale
Fan
Fins
Outflow Section
VisualizationSection
Tank
Water
Table
Radius
InflowRadius
OutflowRadius
Duct Width
Figure 2: Schematic of experimental set-up with therelevant geometric parameters.
Table 1: Apparatus geometry used forthree-dimensional numerical model.
Parameter description ValueInlet radius 500 mm
Inflow radius 445 mmInflow/Inlet height 150 mm
Outflow radius 225 mm & 120 mmVortex height 700 mmDuct width 55 mmFin angle 90o
Fin radius 200 mmFin space 45o

a second order backward Euler discretization schemeand a high resolution scheme for the transient termsand advection terms, respectively. The atmosphericconditions were set to an isothermal, incompressible,and Newtonian fluid of air. The dry blub tempera-ture of 21.2 oC was used from the average room tem-perature in the experiments. Convergence criteria re-quired the value of maximum residual RMS to be lessthan 10−4. [1] simulated a Gallus type vortex genera-tor with the smaller scales and only a pie-shaped sec-tion was used. The k-ε turbulence model was not thebest modeling set-up for the vortex flow simulationsbecause a significant amount of artificial diffusion isadded to the simulation results. The use of ReynoldsStress Model (RSM-SSG) turbulence model was thenemployed for producing better flow field.
The boundary conditions of the middle part was set tobe free-slip wall, since it was assumed to be no flowpassing through the boundaries. An axial momentumsource is introduced at a cylindrical domain which rep-resents the fan inside the internal cylinder. Note that afan blade has the ability to generate the volume flowrate of 0.94 m3 s−1 at the maximum RPM of 1725 inthe experiment. Hence, axial momentum sources werelimited within this range of volume flow rate.
4 A BRIEF DESCRIPTION OF SPIVRESULTS
Figure 3 shows a visible dust devil-like vortex cre-ated using the vortex generator. The experiments weretaken at the volume flow rate between 0.25 m3 s−1 and0.75 m3 s−1 with both the outflow diameter of 450 mmand 240 mm. It should be noted that the system cancreate a maximum flow rate of up to 0.75 m3 s−1, de-spite the fan blade being capable to produce the maxi-mum volume flow rate of 0.94 m3 s−1. This is becausethe flow is recirculated in the vortex generator, causingan energy loss by re-directing the flow. However, theefficiency of the fan blade is 80%, which is an accept-able value.
Figure 4 and Figure 5 illustrate the average contourviews of total and tangential velocities, respectively.The images are taken from the case using the outflowdiameter of 240 mm with the maximum volume flowrate of 0.62 m3 s−1. Each image consists of eight sub-images of the flow contour because the maximum fieldof view in the SPIV measurement is about 130 mm by100 mm. The results show a small amount of velocityjump at the overlap area. This is acceptable using thismeasurement technique. In practice, the results show agood agreement on the axisymmetric behaviour of dust
Figure 3: Simulated dust devil with dry ice.
devil when taking the results and averaging in time.Noise appears at the height between 150 mm and 200mm on each velocity profile. It was caused by the op-tical blockage from the metallic frame. The centre ofdust devil is offset by 20 mm. This phenomenon iscaused by the restriction ring which has a small offsetvalue at the outflow region.
Figure 4: A contour view of mean total velocity in theSPIV experiment.
5 NUMERICAL RESULTS ANDDISCUSSION
Figure 6 illustrates the streamlines in the fluid domain.It provides significant information about how the flowconverged to the core region. A few streamlines out-side the vortex generator indicated that the flow wasnot completely recirculated. However, their speedswere very slow, which means there was almost no flowacross the open boundaries. Figure 7 illustrates the ve-locity vectors within the core and corner regions. Fromthe velocity vectors, it is apparent that the flow wasgoing slightly in and out across the interface betweenthe porous media and fluid domain. The effect of flow
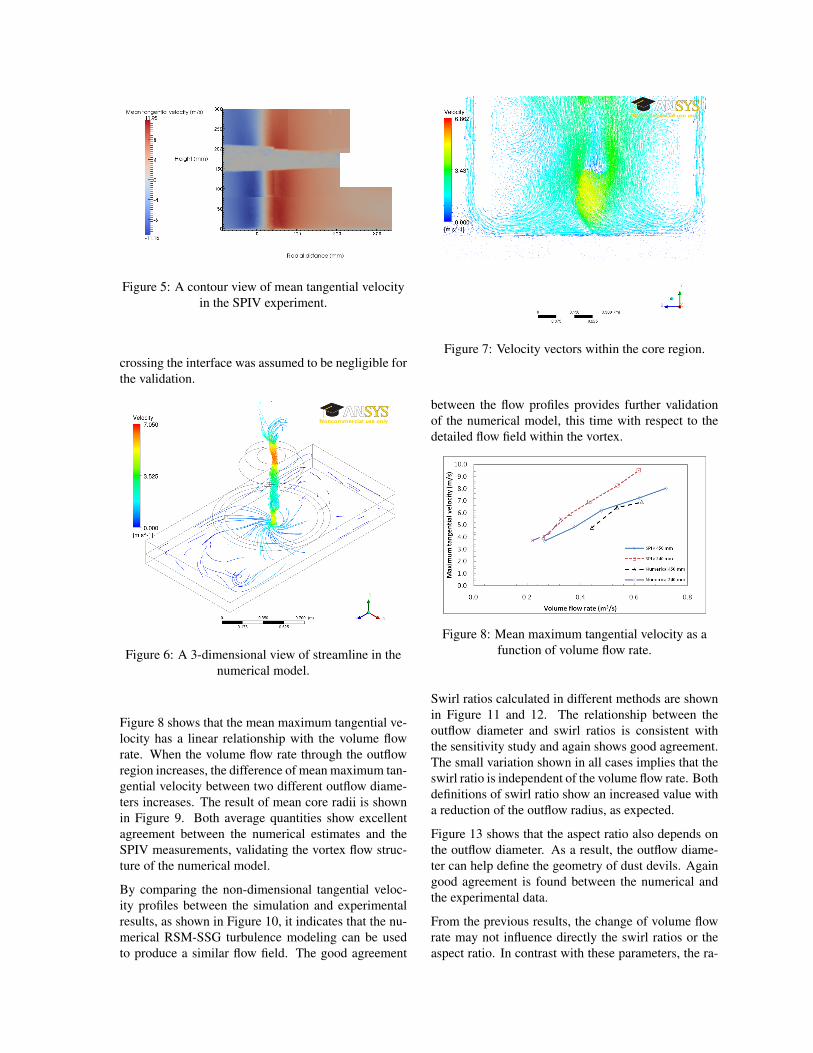
Figure 5: A contour view of mean tangential velocityin the SPIV experiment.
crossing the interface was assumed to be negligible forthe validation.
Figure 6: A 3-dimensional view of streamline in thenumerical model.
Figure 8 shows that the mean maximum tangential ve-locity has a linear relationship with the volume flowrate. When the volume flow rate through the outflowregion increases, the difference of mean maximum tan-gential velocity between two different outflow diame-ters increases. The result of mean core radii is shownin Figure 9. Both average quantities show excellentagreement between the numerical estimates and theSPIV measurements, validating the vortex flow struc-ture of the numerical model.
By comparing the non-dimensional tangential veloc-ity profiles between the simulation and experimentalresults, as shown in Figure 10, it indicates that the nu-merical RSM-SSG turbulence modeling can be usedto produce a similar flow field. The good agreement
Figure 7: Velocity vectors within the core region.
between the flow profiles provides further validationof the numerical model, this time with respect to thedetailed flow field within the vortex.
Figure 8: Mean maximum tangential velocity as afunction of volume flow rate.
Swirl ratios calculated in different methods are shownin Figure 11 and 12. The relationship between theoutflow diameter and swirl ratios is consistent withthe sensitivity study and again shows good agreement.The small variation shown in all cases implies that theswirl ratio is independent of the volume flow rate. Bothdefinitions of swirl ratio show an increased value witha reduction of the outflow radius, as expected.
Figure 13 shows that the aspect ratio also depends onthe outflow diameter. As a result, the outflow diame-ter can help define the geometry of dust devils. Againgood agreement is found between the numerical andthe experimental data.
From the previous results, the change of volume flowrate may not influence directly the swirl ratios or theaspect ratio. In contrast with these parameters, the ra-

Figure 9: Mean core radius as a function of volumeflow rate.
Figure 10: Tangential velocity comparison betweenthe experiment and simulation at the elevation of 0.06
m.
Figure 11: Swirl ratio using Gallus definition as afunction of volume flow rate.
Figure 12: Swirl ratio within vortex core as a functionof volume flow rate.
Figure 13: Aspect ratio as a function of volume flowrate.
Figure 14: Radial Reynolds number as a function ofvolume flow rate.

dial Reynolds number seems to be mainly a functionof the volume flow rate, as shown in Figure 14.
6 CONCLUSION
SPIV flow measurement technique was used to obtainthe velocity field of laboratory dust devils for valida-tion of the numerical model. In general, the numer-ical results have a good agreement with SPIV experi-ments. It indicated that the RSM-SSG turbulence mod-eling is essential when simulating the dust devil-likevortices. It was also observed that the wider outflowradius would result in a wider vortex core radius. Theincrease of updraft volume flow rate did increase max-imum tangential velocity in the experiments.
The swirl ratios of both Gallus and core definitions es-sentially did not change with the volume flow rate, de-spite small variations. This is because the fin anglewas fixed. In other words, the flow passing through thefixed fin angle would create a similar strength of swirlratio. Furthermore, the aspect ratio was independentof either the outflow radius or the updraft volume flowrate, since it is a scaling factor for the vortex shape.
As a result, it can be concluded that the numericalmodel can be adapted to simulate the dust devil-likevortices. When the Martian conditions are applied tothis numerical model, the desired dust devil-like vor-tices can be reproduced.
ACKNOWLEDGEMENTS
The funding from the Canadian space agency is grate-fully acknowledged.
REFERENCES
[1] G. Altimas. Evaluation of local kinematics of at-mospheric vortex flow. Master’s thesis, Universityof Alberta, 2007.
[2] M. D. Ellehoj, H. P. Gunnlaugsson, P. A. Tay-lor, H. Kahanpää, K. M. Bean, B. A. Cantor,B. T. Gheynani, L. Drube, D. Fisher, A.-M. Harri,C. Holstein-Rathlou, M. T. Lemmon, M. B. Mad-sen, M. C. Malin, J. Polkko, P. H. Smith, L. K.Tamppari, W. Weng, and J. Whiteway. Convectivevortices and dust devils at the Phoenix Mars mis-sion landing site. J. Geophys. Res., 115(E00E16),2010. doi:10.1029/2009JE003413.
[3] W. A. Gallus, F. L. Haan, P. P. Sarkar, K. Le,and J. Wurman. Comparison of numerical modeland laboratory simulator tornado wind fields withradar observations of the Spencer, South Dakota
tornado. In Symposium on the Challenges of Se-vere Convective Storms, Atlanta, GA, USA, 2006.Amer. Meteor. Soc.
[4] P. A. Taylor, H. Kahanpää, W. Weng,A. Akingunola, C. Cook, M. Daly, C. Dick-inson, A. Harri, D. Hill, V. Hipkin, J. Polkko,and J. Whiteway. On pressure measurement andseasonal pressure variations during the Phoenixmission. J. Geophys. Res., 115(E00E15), 2010.doi:10.1029/2009JE003422.
[5] A. P. Zent, M. H. Hecht, D. R. Cobos, S. E. Wood,T. L. Hudson, S. M. Milkovich, L. P. DeFlores,and M. T. Mellon. Initial results from the ther-mal and electrical conductivity probe (TECP) onPhoenix. J. Geophys. Res., 115(E00E14), 2010.doi:10.1029/2009JE003420.