Embed Size (px)
Citation preview

1
Validation of a commercial system for the continuous and automated monitoring 1 of dairy cows activity 2 3 I. Fontana1, E. Tullo1, D. Gottardo1, C. Bahr2, S. Viazzi2, K. H. Sloth3, and M. Guarino1 4 1Department of Veterinary and Technological Sciences for Food Safety, Faculty of 5 Veterinary Medicine, Università degli Studi, Via Celoria 10, 20133 Milan, Italy 6 2Department of Biosystems, Division M3-BIORES: Measure, Model & Manage Biore-7 sponses, KU Leuven, Kasteelpark Arenberg 30, 3001 Heverlee, Belgium 8 3GEA Farm Technologies GmbH Siemensstraße 25 59199 Bönen Germany 9 [email protected] 10 11 Abstract 12 13 In order to improve animal welfare and enhance the comfort of dairy cows, the 14 application of information technology (IT) within the intensive livestock farming takes 15 a key role in a proper routine management. 16 This study aims to compare localisation and activity data provided by the CowView 17 system, an automatic indoor localisation system for dairy cattle, with those obtained by 18 a manual labelling procedure, twice within an observation period of minimum 25 hours 19 per dataset. 20 Data from five selected dairy cows were represented by behaviours performed in 21 relation to the occupied zones, and were classified in two categories: activity and 22 localisation. 23 The identified activities performed by the dairy cows were standing, walking (both 24 considered as being in the alley), resting (being in the cubicle) and feeding (being at the 25 feeder). Indeed, the zone considered in the analysis were alley, in bed and feeding zone. 26 Data automatically and manually classified (used as a reference) were compared. 27 Among all the behaviours detected by the automated software, the most reliable results 28 are those related to the activity of feeding (accuracy higher than 95%). The results 29 showed that the CowView automatic monitoring system is able to identify activity zone 30 classification (ALLEY, THROUGH, CUBICLES) with higher reliability compared to 31 the specific activities performed by dairy cows. The results obtained support the 32 CowView system as an innovative and effective solution for an easier management of 33 dairy cows. 34 35 Keywords: behaviour, welfare, PLF, cow, herd monitoring 36 37 Introduction 38 39 Changes in the global demand of dairy products currently mean that the dairy industry is 40 under pressure in increasing its productivity and efficiency (Gerber et al., 2011); 41 moreover, the consolidation of farms has resulted in larger herd sizes (Von Keyserlingk 42 et al., 2013), leading to difficulties for the farmer in identifying each individual cow and 43 tracking its health and behaviour records. 44 Monitoring the behaviour of dairy cows is useful to assess their welfare, health status 45 and comfort at farm level (Mattachini et al., 2013). Indeed as reported by Huhtala et al. 46 (2007) it has been seen that changes in cows' behaviour are strong indicators for their 47 health and welfare problems and therefore they can be used as input to an early warning 48 system. 49

2
Knowing the position of the cows is substantially important to monitor their behavioural 50 patterns and activity (Huhtala et al., 2007) obtaining also information about the time 51 spent in the different locations of the shed. In fact, the time spent by the cows lying or 52 feeding plays an important role in terms of milk production (Fregonesi et al., 2007; 53 Mattachini et al., 2011); therefore, continuous observation of those behaviours is a tool 54 for the farmer to monitor and control cows' health status and production. 55 However the continuous monitoring requires a lot of manpower/labour and it is time-56 consuming (Fontana et al., 2014), for this reason Precision Livestock Farming (PLF) 57 can combine information technology into on-line automated tools that can be used to 58 control, monitor and model the behaviour of animals and their biological response 59 (Tullo et al., 2013). 60 Nowadays, the application of information technology (IT) within the intensive dairy 61 farming takes a key role in a proper routine management in order to improve animal 62 welfare and to enhance the comfort of dairy cows. 63 Indeed, several studies confirmed the feasibility of the use of IT achieving excellent 64 results in the identification and localisations of the animals, feeding patterns recognition 65 and oestrus detection (Porto et al., 2014). 66 67 The CowView system is an automatic indoor localisation system for dairy cattle 68 providing positions and zone-related behavioural activities of tagged animals based on 69 triangulation of very short radio-signals (Ultra Wide Band). The system is able to detect 70 and monitor animal behavioural activities based on positioning, time at feeding table, 71 time in bed, time standing and walking in the alley and distance travelled. 72 This study aims to compare localisation and activity data provided by the CowView 73 system with those obtained by a manual labelling procedure. The manual labelling of 74 the video was used as Gold Standard for the comparison, in order to check the accuracy 75 of the system in localising zone occupied by the cows and their activity. 76 Therefore, data performed by five selected dairy cows were represented by behaviours 77 in relation to the occupied zones, and were classified in two categories: activity and 78 localisation. 79 80 Materials and methods 81 Data used for the comparison were divided in two datasets; the first one was used for 82 the preliminary analysis of the output of the system, while the latter was obtained after 83 the design optimisation of the CowView installation. The analysis consisted in the 84 comparison between data collected automatically with the CowView system and the 85 manual labelling performed on the video recordings obtained with a camera (Axis P5534 86 PTZ Dome Network, 30 fps, and 1280x720 pixel) placed in top down perspective under 87 the roof of the barn. 88 Five selected cows (with a yellow letter on both flanks, and on the back of each cow) 89 that were equipped with the CowView electronic tag were followed. 90 Data used for the comparisons were represented by the zone-related activities performed 91 by the selected dairy cows, and were classified in two categories: activity and 92 localisation (Table 1). In both datasets, the “feeding” behaviour was considered when 93 the cow’s head was in the fodder line. “In bed” behaviour was considered when at least 94 two legs were in the cubicle, but the system was not able to recognise if the cows were 95 lying or not. 96 97

3
Table1. Classification of data used for the analysis according to the behaviours 98 performed by the cows or their localisation. 99
Activity type Localisation of the cow Standing Alley Walking Alley In bed Cubicles
Feeding Through At the drinker (only in the second dataset) At the drinker (only in the second dataset) 100 First data set 101 Data collection consisted in around 38 hours of video recordings divided in 5 days. 102 Since, one hour a day (5 days) for five marked cows were considered, the dataset for the 103 validation analysis included only 25 hours (90,000 seconds - 2.7x10⁶ frames) of 104 recordings. During the manual labelling procedure, each activity/localisation was 105 classified recording the type, the zone and the duration. The resulting dataset was 106 merged with the output of the CowView system, in order to obtain the true 107 positives/negatives and the false positives/negatives. Data from manually labelled 108 videos were used as reference value (Gold Standard). 109 110 Second data set 111 The video data set covered around 42 hours of labelled video (150,405 seconds - around 112 4.5x10⁶ frames) in 6 days. After the manual labelling, about 37 hours (132,053 seconds 113 - around 3.9 x10⁶ frames) of activity and localisation data were available. 114 Also in this case, each activity/localisation was classified with the manual labelling 115 procedure, recording the type, the zone and the duration. 116 Only in this dataset the categories “at the drinker” were added to the cow 117 activity/localisation classification. This activity was not classified as “drinking” since 118 the CowView system could not identify this behaviour precisely . 119 The resulting dataset was merged with the output of the CowView system, in order to 120 obtain the true positives/negatives and the false positives/negatives. Data from manually 121 labelled videos were used as reference values (Gold Standard). 122 123 The parameters evaluated for each activity/localisation were: 124 • Sensitivity, parameter that tests the true positive rate: 125
Sensitivity =true positives
true positive + false negative
• Specificity, parameter that tests the true negative rate: 126
Specificity = true negatives
true negative + false positives
Predictive value for a positive result (PV+), parameter that tests the probability that the 127 CowView detects behaviour that cow is actually performing: 128
PV+= true positive
true positive + false positive
Predictive value for a negative result (PV-): parameter that tests the probability that the 129 CowView does not detect behaviour that cow is actually not performing: 130
PV-= true negatives
true negatives + false negatives
4
Accuracy: parameter that expresses the proportion of correctly classified behaviours 131 among all events detected 132
Accuracy=true positive + true negative
all events
Results and discussion 133 134 In Figure 1 an example of comparison between data manually labelled and 135 automatically detected by the CowView system in relation to the activity of FEEDING 136 is reported. Grey parts represent the amount of time (in seconds) spent by the selected 137 cow in the activity of FEEDING detected by the CowView system. Black lines 138 represent the actual time spent by that cow in the specific activity. Grey parts with the 139 black frame represent the results obtained with the automated system that can be 140 overlapped to the reference values (manual labelling). Black lines without grey filling 141 represent a mismatch between the automated detection and the reference values. 142 Figure1. Example of comparison between data manually labelled and automatically 143 detected by the CowView system in relation to the activity of FEEDING on a selected 144 Cow (A) and on a selected day. Values of “1” indicate the activity detection 145 (manual/automated) 146
147 In Tables 2 – 5 the results of the manual labelling and the continuous monitoring of the 148 cow activity/localisation obtained with the CowView are reported for the first and the 149 second dataset respectively. On the diagonal of the tables the acitivities/localisation that 150 were detected both by the manual labelling and by the CowView System (true positive) 151 are reported, while the rows represent the behaviours/localisation detected by the 152 automated system that did not match with the reference values (manual labelling). 153 All data are expressed in seconds. The last row is the total and actual amount of time 154 spent by the five cows in a determinate activity/location, while the last column on the 155 right represents the total amount of time that the cow spent in an activity /location 156 according to the automated system. 157 158

5
Table 2. Results of the manual labelling and the continuous monitoring obtained on cow 159 activity data with the CowView on the first dataset. 160 Manually labelled STANDING WALKING IN BED FEEDING Total
CowView
STANDING 11,851 171 686 323 13,031 WALKING 2,300 2,322 671 2,488 7,781 IN BED 17,542 137 22,870 76 40,625 FEEDING 571 289 0 27,703 28,563
Total 32,264 2,919 24,227 30,590 90,000
Table 3. Results of the manual labelling and the continuous monitoring obtained on cow 161 localisation data with the CowView on the first dataset. 162
Manually labelled
ALLEY IN BED FEEDING Total
CowView
ALLEY 16,305 1,623 2,776 20,704 IN BED 2,799 37,812 76 40,687
FEEDING 871 0 27,738 28,609 Total 19,975 39,435 30,590 90,000
Table 4. Results of the manual labelling and the continuous monitoring obtained on cow 163 activity data with the CowView on the second dataset. 164
Manually labelled
STANDING WALKING CUBICLES THROUGH AT THE DRINKER Total
CowView
STANDING 13,125 237 1,014 798 947 16,121 WALKING 3,075 4,801 243 697 267 9,083 CUBICLES 889 214 44,336 0 1 45,440 THROUGH 1,068 603 1,110 48,497 66 51,344
AT THE DRINKER 2,687 316 0 0 7,062 10,065
Total 20,844 6,171 46,703 49,992 8,343 132053
Table 5. Results of the manual labelling and the continuous monitoring obtained on cow 165 localisation data with the CowView on the second dataset. 166
Manually labelled ALLEY CUBICLES THROUGH AT THE DRINKER
CowView
ALLEY 21,147 1,207 1,457 1,151 24,962 CUBICLES 1,132 44,386 0 1 45,519 THROUGH 1,682 1,110 48,535 66 51,393
AT THE DRINKER 3,054 0 0 7,125 10,179 27,015 46,703 49,992 8,343 132,053
In Figures 2-8 the comparison between the sensitivity, specificity, PV+, PV- and the 167 accuracy of the activity/location detected with the CowView system on the two data sets 168 are displayed. After the design optimisation of the installation the five parameters 169 considered (sensitivity, specificity, PV+, PV- and the accuracy) increased. In particular, 170 the sensitivity for the STANDING activity and the specificity of the WALKING 171 activity had nearly doubled. 172 In general, there was an increase of accuracy for all the activities/locations that reached 173 values between 92 and 97 %. 174 The increase in sensitivity indicates an increase of the rate of true positives detected, 175 meaning that the CowView system detected the same activity/location as the reference 176 (manual labelling). The increase in specificity indicates an increase of the rate of true 177 negative detected. In other words, the manual labelling and the CowView system can 178 both detect if a behaviour is not occurring. 179

6
The increase in PV+ (Predictive value for a positive result) indicates the increased 180 probability that the CowView detects a behaviour that the cow is actually performing. 181 The increase in Predictive value for a negative result (PV-) indicates the increased 182 probability that CowView does not detect behaviour that cow is actually not 183 performing. 184
Figure2. Comparison between the sensitivity, specificity, PV+, PV- and the accuracy of 185 the activity of STANDING detected with the CowView system on the two data sets. 186
187 Figure3. Comparison between the sensitivity, specificity, PV+, PV- and the accuracy of 188 the activity WALKING detected with the CowView system on the two data sets. 189
190 Figure4. Comparison between the sensitivity, specificity, PV+, PV- and the accuracy of 191 the activity IN BED detected with the CowView system on the two data sets.192
193 194
0%
20%
40%
60%
80%
100%
SENSITIVITY SPECIFICITY PV+ PV- ACCURACY
STANDING 1st dataset STANDING 2nd dataset
0%
20%
40%
60%
80%
100%
SENSITIVITY SPECIFICITY PV+ PV- ACCURACY
WALKING 1st dataset WALKING 2nd dataset
0%
20%
40%
60%
80%
100%
SENSITIVITY SPECIFICITY PV+ PV- ACCURACY
IN BED 1st dataset IN BED 2nd dataset
7
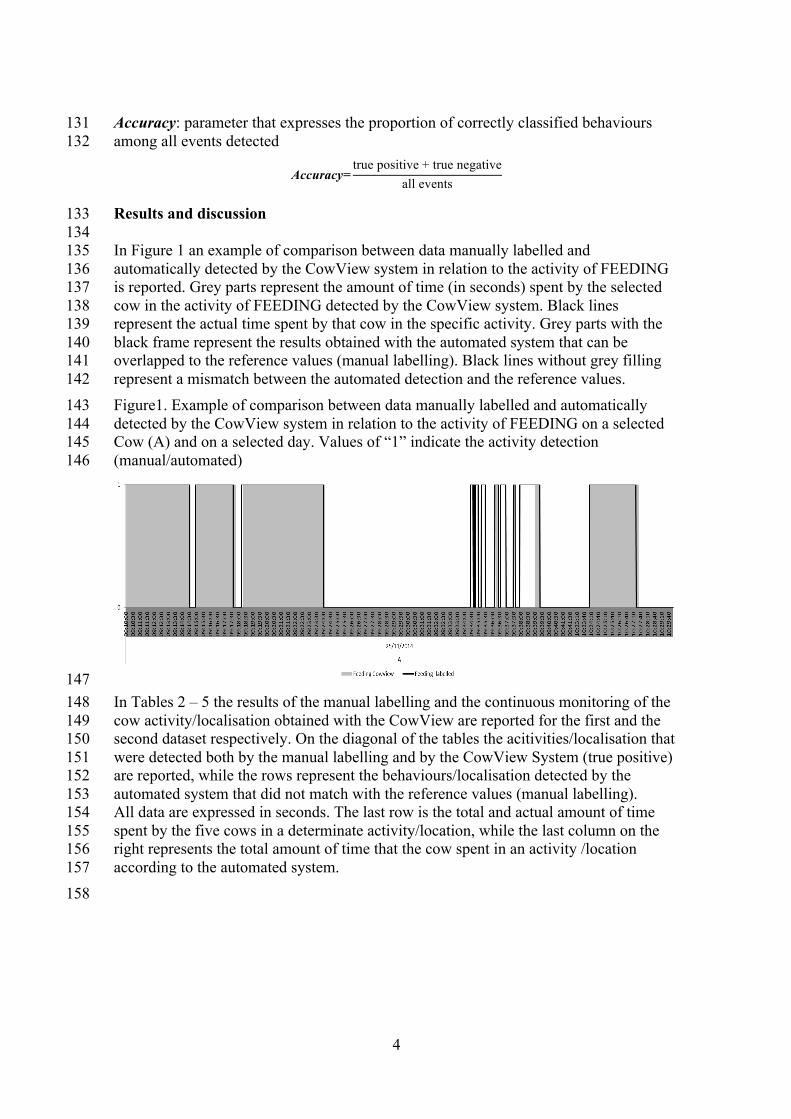
Figure5. Comparison between the sensitivity, specificity, PV+, PV- and the accuracy of 195 the activity FEEDING detected with the CowView system on the two data sets. 196
197 Figure6. Comparison between the sensitivity, specificity, PV+, PV- and the accuracy of 198 the location ALLEY detected with the CowView system on the two data sets. 199
200 Figure7. Comparison between the sensitivity, specificity, PV+, PV- and the accuracy of 201 the location CUBICLES detected with the CowView system on the two data sets. 202
203 Figure8. Comparison between the sensitivity, specificity, PV+, PV- and the accuracy of 204 the location THROUGH detected with the CowView system on the two data sets. 205
206
0%
20%
40%
60%
80%
100%
SENSITIVITY SPECIFICITY PV+ PV- ACCURACY
FEEDING 1st dataset FEEDING 2nd dataset
0%
20%
40%
60%
80%
100%
SENSITIVITY SPECIFICITY PV + PV- ACCURACY
ALLEY 1st dataset ALLEY 2nd dataset
0%
20%
40%
60%
80%
100%
SENSITIVITY SPECIFICITY PV + PV- ACCURACY
CUBICLES 1st dataset CUBICLES 2nd dataset
0%
20%
40%
60%
80%
100%
SENSITIVITY SPECIFICITY PV + PV- ACCURACY
THROUGH 1st dataset THROUGH 2nd dataset
8
Conclusions 207 The results of this comparison study showed that the CowView automatic monitoring 208 system is able to identify activity zone classification (ALLEY, THROUGH, 209 CUBICLES) with higher reliability compared to the zone –related activities performed 210 by dairy cows. 211 The preliminary results obtained are overall very encouraging even if the accuracy does 212 not reach the 100%. 213 Anyway, the software is an innovative solution and an extremely valuable tool for the 214 management of large herds of dairy cattle. 215 Further design optimisations of the CowView installation and relative validation will be 216 necessary if the accuracy and the reliability of the system must be improved. 217 218 Acknowledgements 219 This project was funded by the European project no: 311825 EU-PLF (Animal and farm-220 centric approach to precision livestock farming in Europe), co-financed by the European 221 Commission. 222 References 223 224 Fontana, I., Tullo, E., Butterworth, A. and Guarino, M. 2014. Broiler vocalisation 225
analysis used to predict growth. Proceedings of Measuring Behavior 2014, 226 Wageningen, The Netherlands. 227
Fregonesi, J.A., Tucker, C.B. and Weary, D.M. 2007. Overstocking Reduces Lying 228 Time in Dairy Cows. Journal of Dairy Science 90(7): 3349-3354. 229
Gerber, P., Vellinga, T., Opio, C. and Steinfeld, H. 2011. Productivity gains and 230 greenhouse gas emissions intensity in dairy systems. Livestock Science 139(1): 231 100-108. 232
Huhtala, A., Suhonen, K., Mäkelä, P., Hakojärvi, M. and Ahokas, J. 2007. Evaluation of 233 Instrumentation for Cow Positioning and Tracking Indoors. Biosystems 234 Engineering 96(3): 399-405. 235
Mattachini, G., Antler, A., Riva, E., Arbel, A. and Provolo, G. 2013. Automated 236 measurement of lying behavior for monitoring the comfort and welfare of 237 lactating dairy cows. Livestock Science 158(1–3): 145-150. 238
Mattachini, G., Riva, E. and Provolo, G. 2011. The lying and standing activity indices 239 of dairy cows in free-stall housing. Applied Animal Behaviour Science 129(1): 240 18-27. 241
Porto, S.M.C., Arcidiacono, C., Giummarra, A., Anguzza, U. and Cascone, G. 2014. 242 Localisation and identification performances of a real-time location system 243 based on ultra wide band technology for monitoring and tracking dairy cow 244 behaviour in a semi-open free-stall barn. Computers and Electronics in 245 Agriculture 108: 221-229. 246
Tullo, E., Fontana, I. and Guarino, M. 2013. Precision livestock farming: An overview 247 of image and sound labelling. Precision Livestock Farming 2013 - Papers 248 Presented at the 6th European Conference on Precision Livestock Farming, 249 ECPLF 2013. 250
Von Keyserlingk, M., Martin, N., Kebreab, E., Knowlton, K., Grant, R., Stephenson, 251 M., Sniffen, C., Harner, J., Wright, A. and Smith, S. 2013. Invited review: 252 Sustainability of the US dairy industry. Journal of Dairy Science 96(9): 5405-253 5425. 254
255