Embed Size (px)
Citation preview
Validation Manual
Release 2.0
Page 2
Proprietary & Restricted Rights Notice © 2015-7 SIMSOLID Corporation All Rights Reserved. This software and related documentation are proprietary to SIMSOLID Corporation. Unauthorized use, distribution or duplication is prohibited.
The SIMSOLID software and related documentation is SIMSOLID Corporation confidential information provided under the SIMSOLID software license agreement that contains provisions concerning non-disclosure, copying, redistribution, warranties, disclaimers, remedies and other provisions. The software and documentation may only be used or copied in accordance with the terms of that license agreement.
Abaqus is a trademark of Dassault Systemes
ANSYS is a trademark of ANSYS Inc.
All other trademarks are the property of their respective owners.
Page 3
Table of Contents
Introduction.................................................................................................................................................. 5
Document Purpose .................................................................................................................................. 5
Test Documentation Format .................................................................................................................... 5
Section 1: Static Analysis Tests .................................................................................................................. 6 Test VS01: Straight Cantilever Beam ...................................................................................................... 6
Test VS02: Twisted Cantilever Beam ...................................................................................................... 8
Test VS03: Curved Beam ...................................................................................................................... 10
Test VS04: Simply Supported Thin Plate .............................................................................................. 12
Test VS05: Clamped Thin Plate ............................................................................................................ 14
Test VS06: Tapered Solid Bar ............................................................................................................... 16
Test VS07: Cantilever Plate .................................................................................................................. 18
Test VS08: Plate with a Hole ................................................................................................................. 20
Test VS09: Scordelis-Lo Roof ............................................................................................................... 22
Test VS10: Curved Thick Elliptical Plate ............................................................................................... 24
Test VS11: Raasch Challenge .............................................................................................................. 26
Test VS12: Notched Plate ..................................................................................................................... 28
Test VS13: Simply supported beam with mid-span load ....................................................................... 30
Test VS14: Skew Plate Under Pressure ............................................................................................... 31
Test VS15: Stress Concentration of Filleted Bar ................................................................................... 34
Section 2: Modal Analysis Tests ............................................................................................................... 36 Test VM01: Free Vibration of a Wedge ................................................................................................. 36
Test VM02: In-plane Vibration of a Cantilever Plate ............................................................................. 37
Test VM03: Cylindrical Shell ................................................................................................................. 38
Test VM04: Free Thin Square Plate ...................................................................................................... 39
Test VM05: Thick Skewed Plate ........................................................................................................... 41
Test VM06: Thick Square Plate ............................................................................................................. 42
Test VM07: In-plane Vibration of a Pin-ended Cross ............................................................................ 45
Test VM08: Cantilevered Beam ............................................................................................................ 47
Test VM09: Circular Ring -- In-plane and Out-of-plane Vibration ........................................................ 48
Test VM10: Triangular Wing -- Fixed Vibration ..................................................................................... 49
Section 3: Thermal Analysis Tests ........................................................................................................... 50 Test VT01: Cooling Fin .......................................................................................................................... 50
Test VT02: Insulated Wall ..................................................................................................................... 51
Test VT03: Cylinder with Prescribed Heat Flux .................................................................................... 52
Test VT04: Heat Generating Plate ........................................................................................................ 54
Test VT05: Heat Generating Wire ......................................................................................................... 56
Test VT06: Table Frame........................................................................................................................ 58
Section 4: Thermal Loading Tests ........................................................................................................... 60 Test VTL01: Thermally Loaded Support Structure ................................................................................ 60
Test VTL02: Bimetallic Cantilever Beam under Thermal Loading ........................................................ 62
Test VTL03: Coupled Thermal-Structural Analysis - Constrained Straight Bar Under Uniform Temperature .......................................................................................................................................... 64
Test VTL04: Coupled Thermal-Structural Analysis - Constrained Straight Bar Under Linear Temperature Field ................................................................................................................................. 66
Page 4
Section 5: Non-linear Tests ...................................................................................................................... 69 Test VNL01: Coupled Analysis - Bimetallic Beam Under Thermal Load .............................................. 69
Test VNL02: Z-Shaped Cantilever ........................................................................................................ 72
Test VNL03: Lateral Buckling of a Right Angle Frame .......................................................................... 74
Test VNL04: Reactions at the ends of statically undefined axially loaded plastic bar .......................... 77
Test VNL05: Residual deformations in an axially loaded plastic bar .................................................... 80
Test VNL06: Pure bending of a plastic beam ........................................................................................ 83
Test VNL07: Separating beams ............................................................................................................ 88
Test VNL08: Pinched Hemispherical Shell............................................................................................ 93
Test VNL09: Rigid Punch Plasticity ....................................................................................................... 97
Händlerinformation
Schweiz:Ruchstuckstrasse 21CH-8306 BrüttisellenTelefon: +41 (0) 44 805 1010Fax: +41 (0) 44 805 1011
Deutschland:Rindelbacher Straße 4273479 EllwangenTelefon: +49 (0) 7961 890-0Fax: +49 (0) 7961 890-177
INNEO Solutions GmbH · [email protected] · www.inneo.com
Page 5
INTRODUCTION SIMSOLID is a new generation of structural analysis software. SIMSOLID’s unique approach works directly on fully featured CAD assemblies and complex part geometry models and does not use a mesh. The SIMSOLID computational engine is based on significant extensions to the theory of external approximations. External approximations are a generalization of Finite Element Method (FEM) in terms that:
• absolutely arbitrary geometrical shapes can be used as “finite elements”
• basis functions which approximate field of interest in the part volume can be of arbitrary class
and are independent of the volume shape
SIMSOLID does not use the point-wise degrees of freedom (DOF) inherent in traditional FEA. SIMSOLID DOF are functionals with geometrical support in form of volumes, areas, line clouds, and point clouds. This provides the ability to handle geometrical imperfections, as well as assembly contact imperfections like gaps, penetrations and ragged contact areas. SIMSOLID controls solution accuracy using multi-pass adaptive analysis. Adaptivity can be defined on a global or part local basis and adaptivity is always active. The SIMSOLID methodology is fast and efficient. It provides superior performance metrics for computational time and memory footprint that allow very large and/or complex assemblies to be solved quickly on desktop class PC’s.
DOCUMENT PURPOSE
The primary purpose of this document is to demonstrate the theoretical robustness of the SIMSOLID software product across a range of typical solution domains. Comparisons are made against well-known reference solutions. Please note that while many reference solutions are based on closed form solutions with simplifying assumptions, SIMSOLID solves all domains with full 3D models. This sometimes leads to ambiguity about boundary condition handling. A secondary purpose is to illustrate the format of typical SIMSOLID product inputs and outputs. However, this document is not intended to be used as a training manual. It is assumed the reader has a basic understanding of analysis software systems including how to define loads, constraints, materials and specify units. Tests are provided in five sections that cover Statics, Modal, Thermal, Thermal Loading and Non-linear solutions. Unless otherwise noted, all tests are performed using default solution settings.
TEST DOCUMENTATION FORMAT
In this document, tests are labeled using the format V<x><nn> where <x> is S, M, T, TL or NL and <nn> is the test number. Each test is documented with a:
• Problem description - provides geometry, loading, constraints, material properties and units used (SI or IPS)
• Reference Solution - reference results are provided along with their relevant source
• SIMSOLID Results - SIMSOLID results with a comparison to the reference solution
• Supporting Figures & Results - where appropriate figures, tables, graphs, and SIMSOLID results plots are provided to illustrate the test
• Unless noted, all problems are run using SIMSOLID standard solution settings
Page 6
SECTION 1: STATIC ANALYSIS TESTS
TEST VS01: STRAIGHT CANTILEVER BEAM
PROBLEM DEFINITION
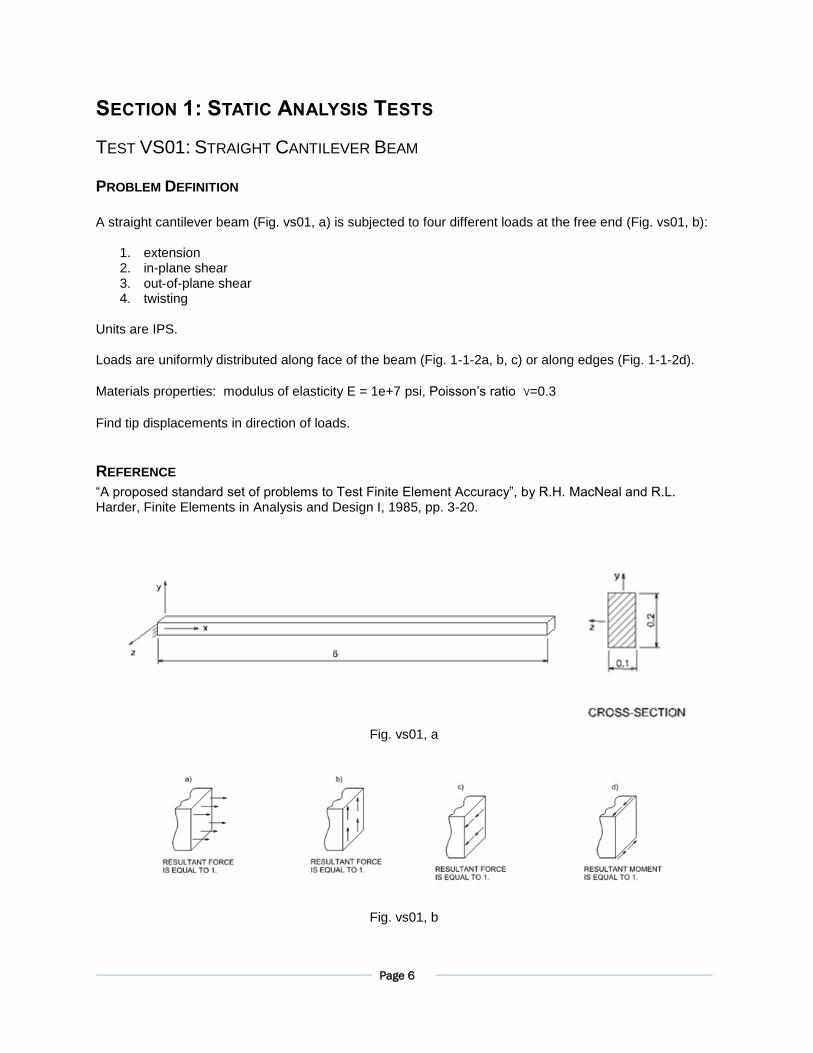
A straight cantilever beam (Fig. vs01, a) is subjected to four different loads at the free end (Fig. vs01, b):
1. extension 2. in-plane shear 3. out-of-plane shear 4. twisting
Units are IPS. Loads are uniformly distributed along face of the beam (Fig. 1-1-2a, b, c) or along edges (Fig. 1-1-2d).
Materials properties: modulus of elasticity E = 1e+7 psi, Poisson’s ratio ν=0.3
Find tip displacements in direction of loads.
REFERENCE
“A proposed standard set of problems to Test Finite Element Accuracy”, by R.H. MacNeal and R.L. Harder, Finite Elements in Analysis and Design I, 1985, pp. 3-20.
Fig. vs01, a
Fig. vs01, b
Page 7
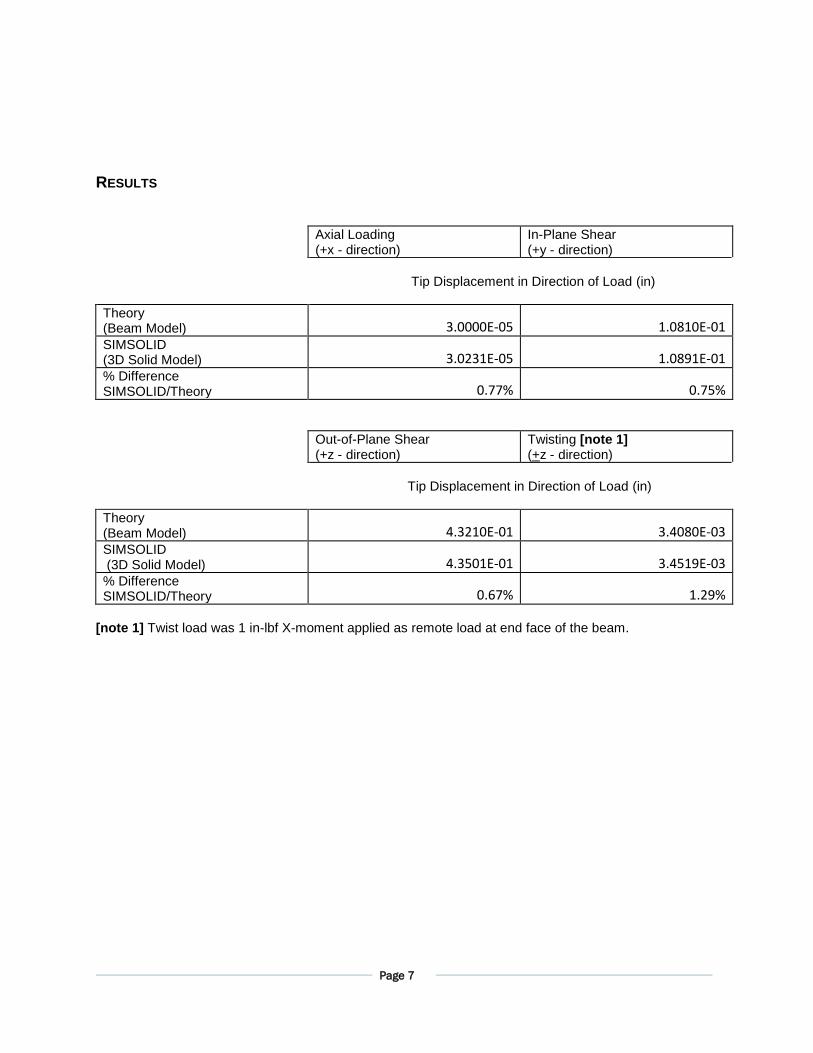
RESULTS
Axial Loading (+x - direction)
In-Plane Shear (+y - direction)
Tip Displacement in Direction of Load (in)
Theory (Beam Model) 3.0000E-05 1.0810E-01 SIMSOLID (3D Solid Model) 3.0231E-05 1.0891E-01 % Difference SIMSOLID/Theory 0.77% 0.75%
Out-of-Plane Shear (+z - direction)
Twisting [note 1] (+z - direction)
Tip Displacement in Direction of Load (in)
Theory (Beam Model) 4.3210E-01 3.4080E-03 SIMSOLID (3D Solid Model) 4.3501E-01 3.4519E-03 % Difference SIMSOLID/Theory 0.67% 1.29%
[note 1] Twist load was 1 in-lbf X-moment applied as remote load at end face of the beam.
Page 8
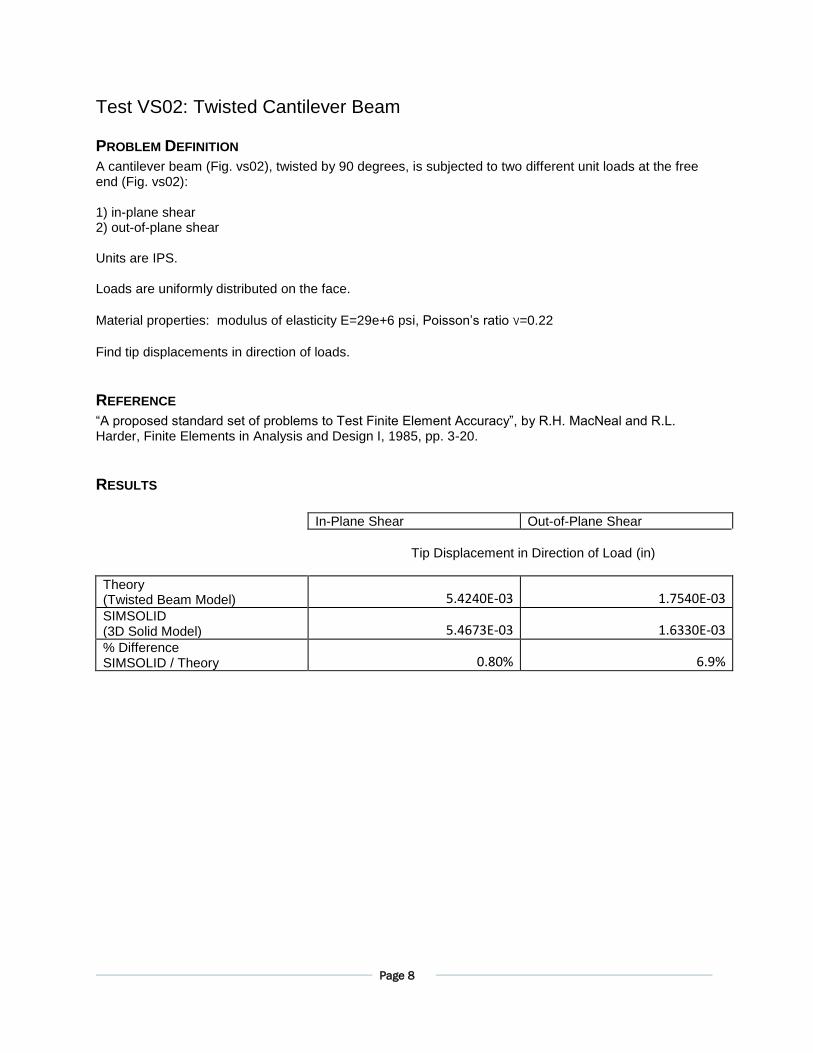
Test VS02: Twisted Cantilever Beam
PROBLEM DEFINITION
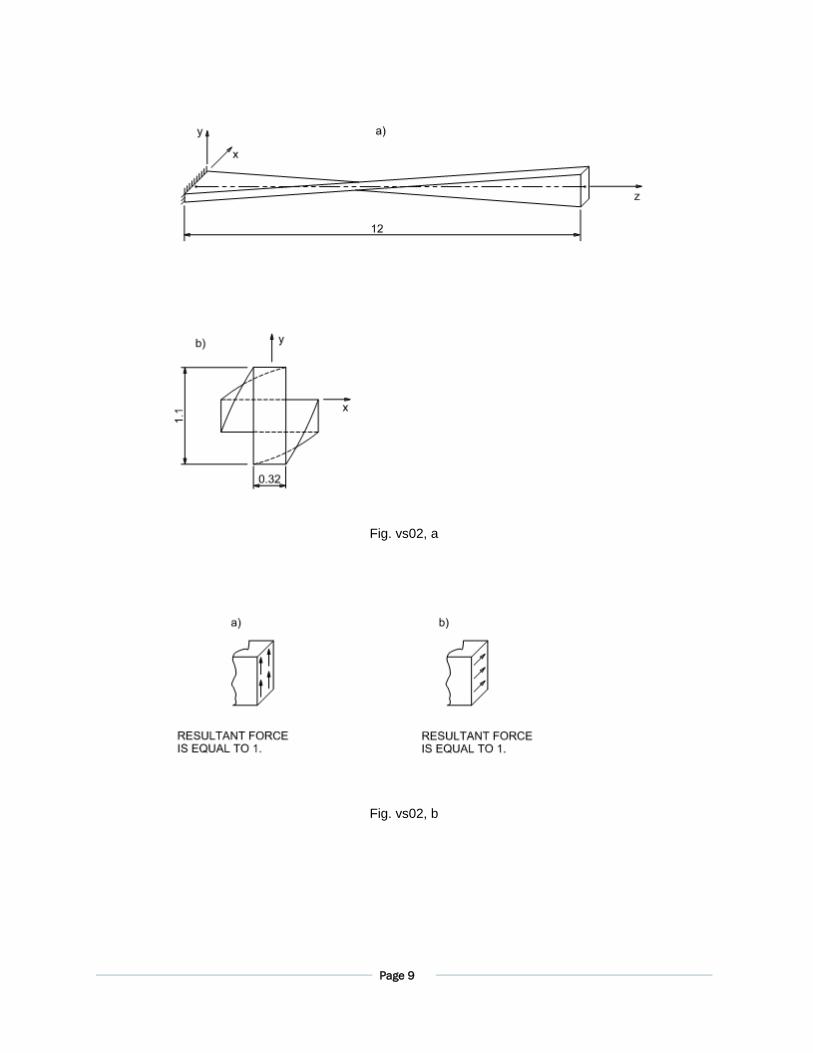
A cantilever beam (Fig. vs02), twisted by 90 degrees, is subjected to two different unit loads at the free end (Fig. vs02): 1) in-plane shear 2) out-of-plane shear Units are IPS. Loads are uniformly distributed on the face.
Material properties: modulus of elasticity E=29e+6 psi, Poisson’s ratio ν=0.22
Find tip displacements in direction of loads.
REFERENCE
“A proposed standard set of problems to Test Finite Element Accuracy”, by R.H. MacNeal and R.L. Harder, Finite Elements in Analysis and Design I, 1985, pp. 3-20.
RESULTS
In-Plane Shear Out-of-Plane Shear
Tip Displacement in Direction of Load (in)
Theory (Twisted Beam Model) 5.4240E-03 1.7540E-03 SIMSOLID (3D Solid Model) 5.4673E-03 1.6330E-03 % Difference SIMSOLID / Theory 0.80% 6.9%
Page 9
Fig. vs02, a
Fig. vs02, b
Page 10
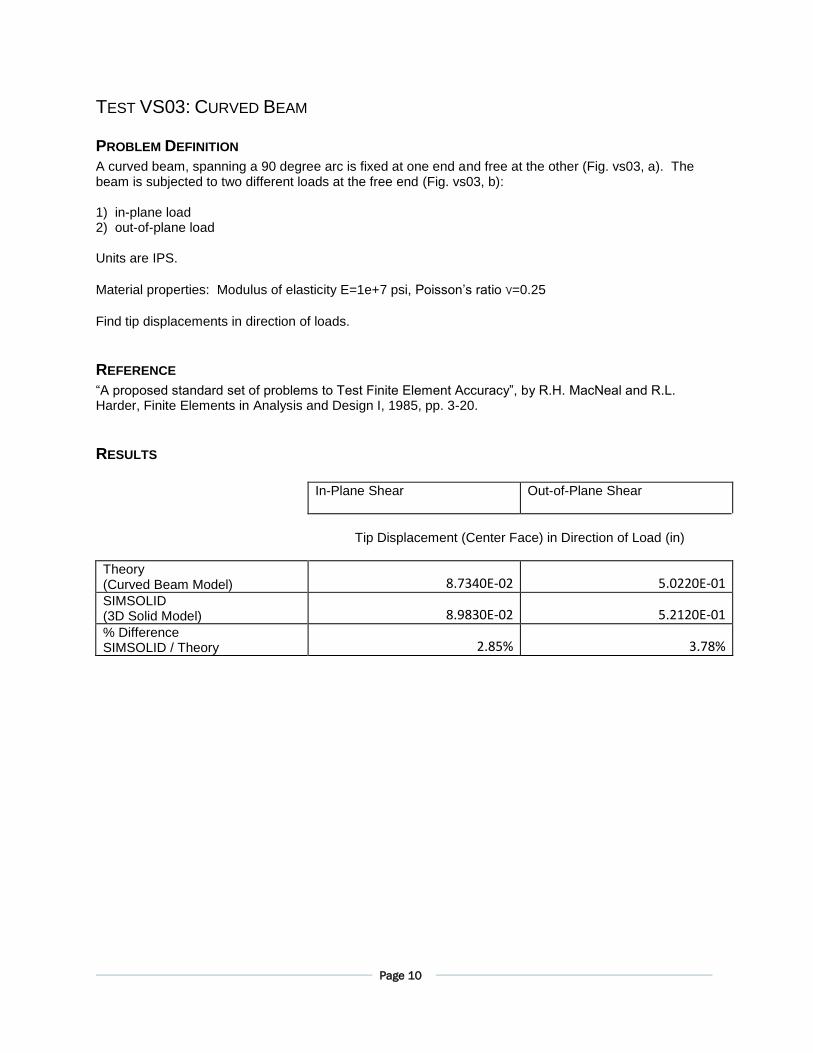
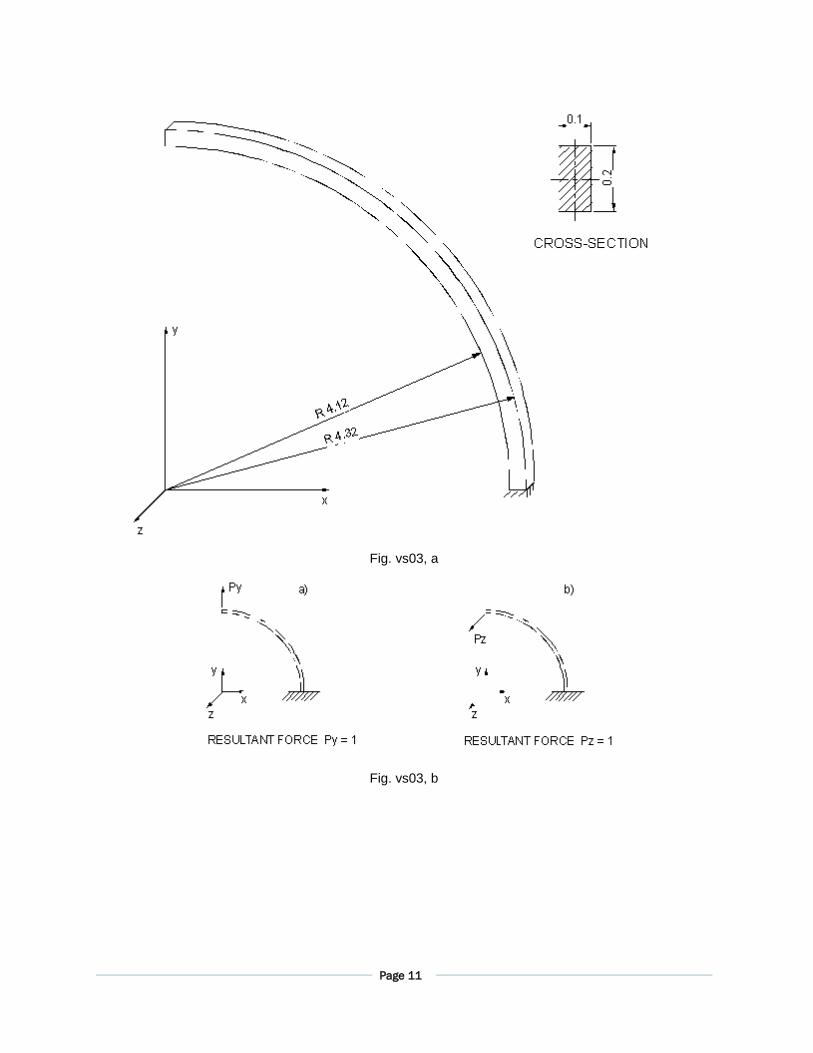
TEST VS03: CURVED BEAM
PROBLEM DEFINITION
A curved beam, spanning a 90 degree arc is fixed at one end and free at the other (Fig. vs03, a). The beam is subjected to two different loads at the free end (Fig. vs03, b): 1) in-plane load 2) out-of-plane load Units are IPS.
Material properties: Modulus of elasticity E=1e+7 psi, Poisson’s ratio ν=0.25
Find tip displacements in direction of loads.
REFERENCE
“A proposed standard set of problems to Test Finite Element Accuracy”, by R.H. MacNeal and R.L. Harder, Finite Elements in Analysis and Design I, 1985, pp. 3-20.
RESULTS
In-Plane Shear
Out-of-Plane Shear
Tip Displacement (Center Face) in Direction of Load (in)
Theory (Curved Beam Model) 8.7340E-02 5.0220E-01 SIMSOLID (3D Solid Model) 8.9830E-02 5.2120E-01 % Difference SIMSOLID / Theory 2.85% 3.78%
Page 11
Fig. vs03, a
Fig. vs03, b
Page 12
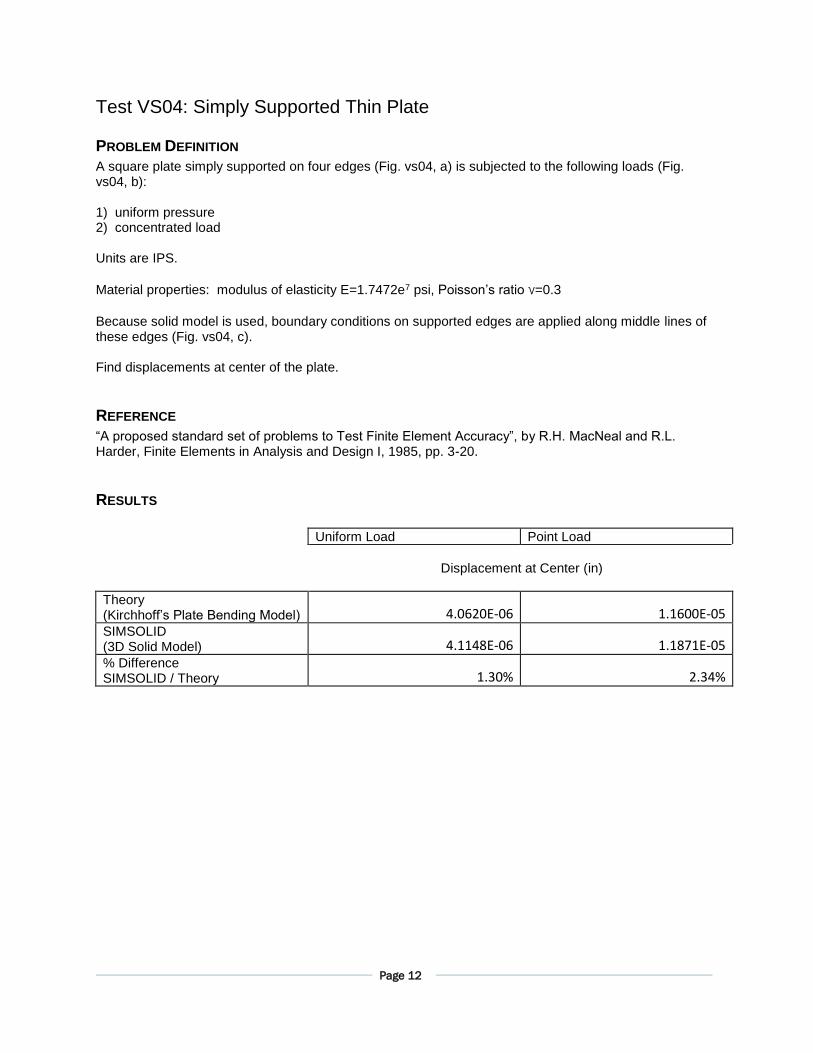
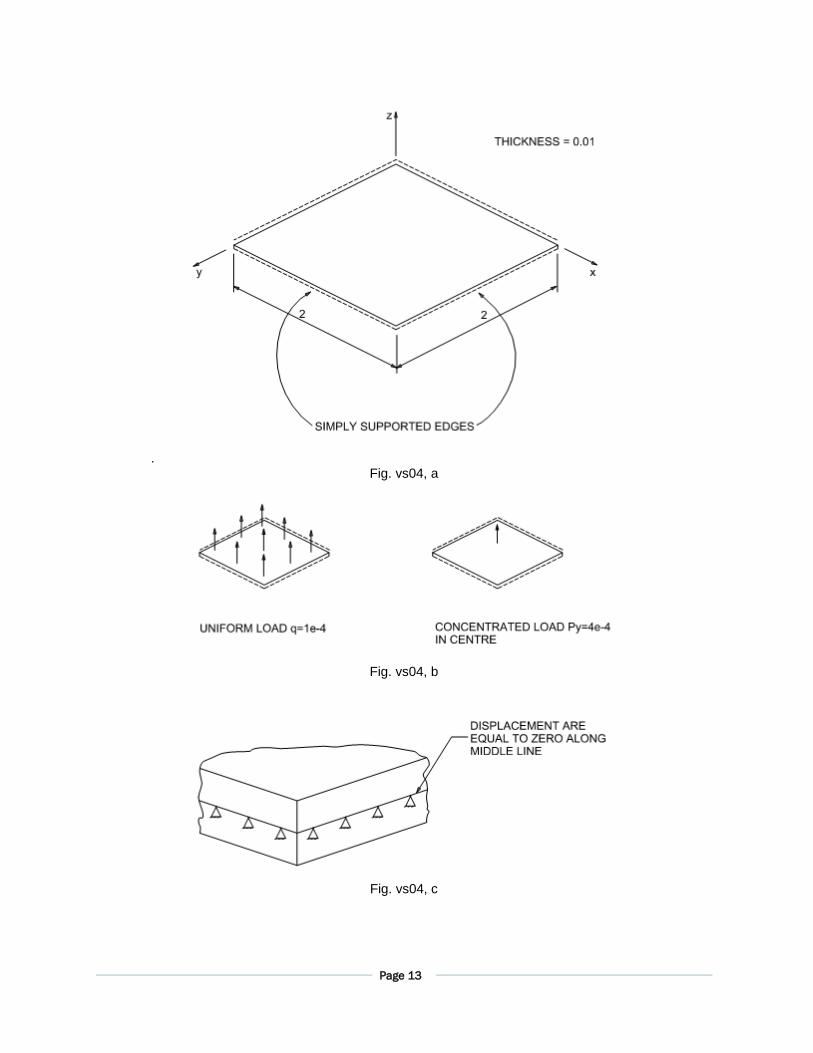
Test VS04: Simply Supported Thin Plate
PROBLEM DEFINITION
A square plate simply supported on four edges (Fig. vs04, a) is subjected to the following loads (Fig. vs04, b): 1) uniform pressure 2) concentrated load Units are IPS.
Material properties: modulus of elasticity E=1.7472e7 psi, Poisson’s ratio ν=0.3
Because solid model is used, boundary conditions on supported edges are applied along middle lines of these edges (Fig. vs04, c). Find displacements at center of the plate.
REFERENCE
“A proposed standard set of problems to Test Finite Element Accuracy”, by R.H. MacNeal and R.L. Harder, Finite Elements in Analysis and Design I, 1985, pp. 3-20.
RESULTS
Uniform Load Point Load
Displacement at Center (in)
Theory (Kirchhoff’s Plate Bending Model) 4.0620E-06 1.1600E-05 SIMSOLID (3D Solid Model) 4.1148E-06 1.1871E-05 % Difference SIMSOLID / Theory 1.30% 2.34%
Page 13
. Fig. vs04, a
Fig. vs04, b
Fig. vs04, c
Page 14
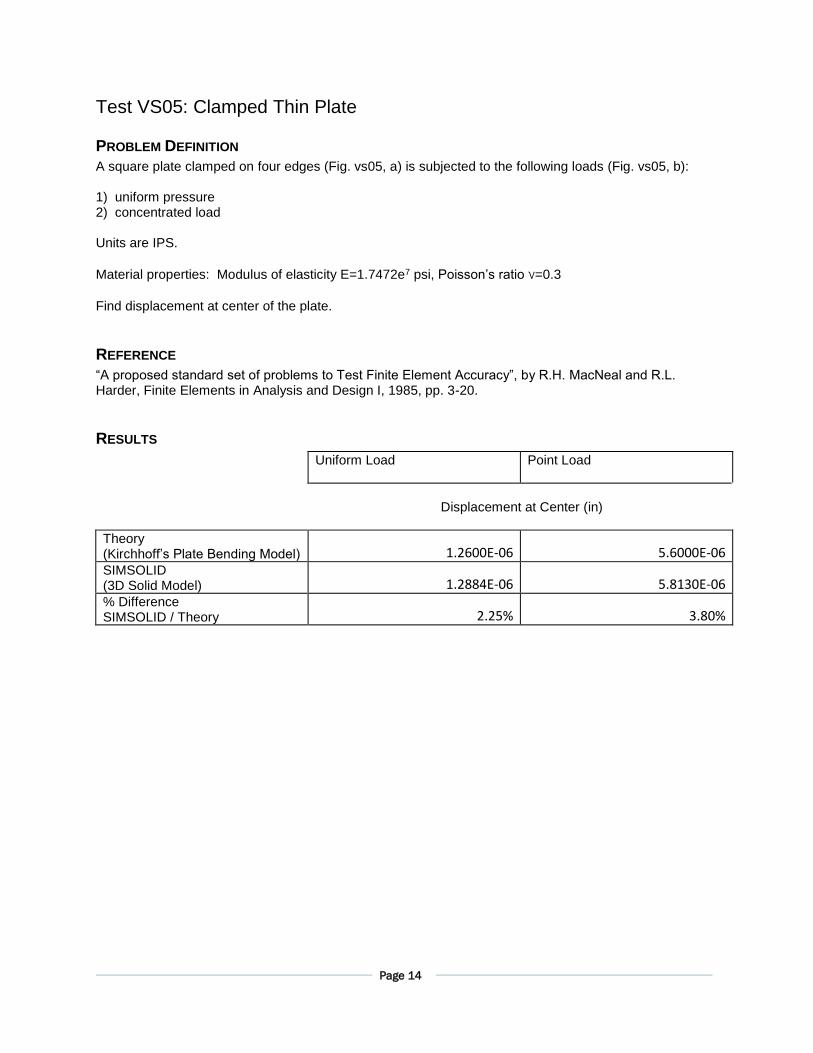
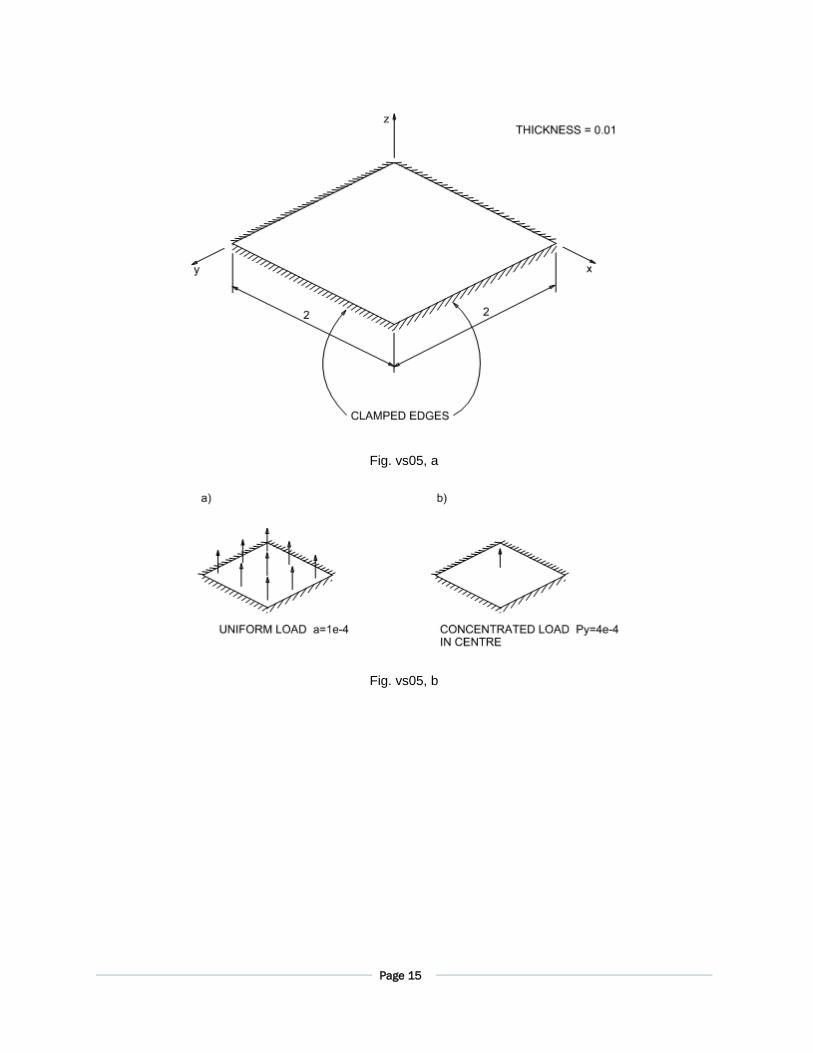
Test VS05: Clamped Thin Plate
PROBLEM DEFINITION
A square plate clamped on four edges (Fig. vs05, a) is subjected to the following loads (Fig. vs05, b): 1) uniform pressure 2) concentrated load Units are IPS.
Material properties: Modulus of elasticity E=1.7472e7 psi, Poisson’s ratio ν=0.3
Find displacement at center of the plate.
REFERENCE
“A proposed standard set of problems to Test Finite Element Accuracy”, by R.H. MacNeal and R.L. Harder, Finite Elements in Analysis and Design I, 1985, pp. 3-20.
RESULTS
Uniform Load
Point Load
Displacement at Center (in)
Theory (Kirchhoff’s Plate Bending Model) 1.2600E-06 5.6000E-06 SIMSOLID (3D Solid Model) 1.2884E-06 5.8130E-06 % Difference SIMSOLID / Theory 2.25% 3.80%
Page 15
Fig. vs05, a
Fig. vs05, b
Page 16
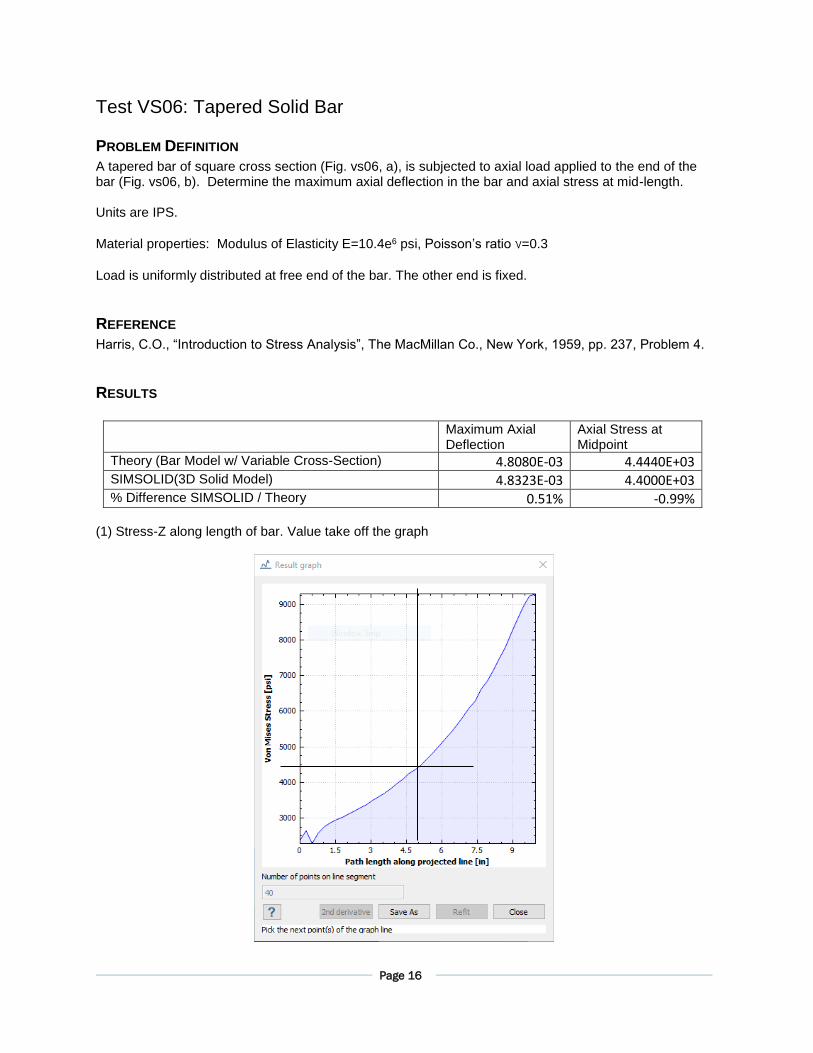
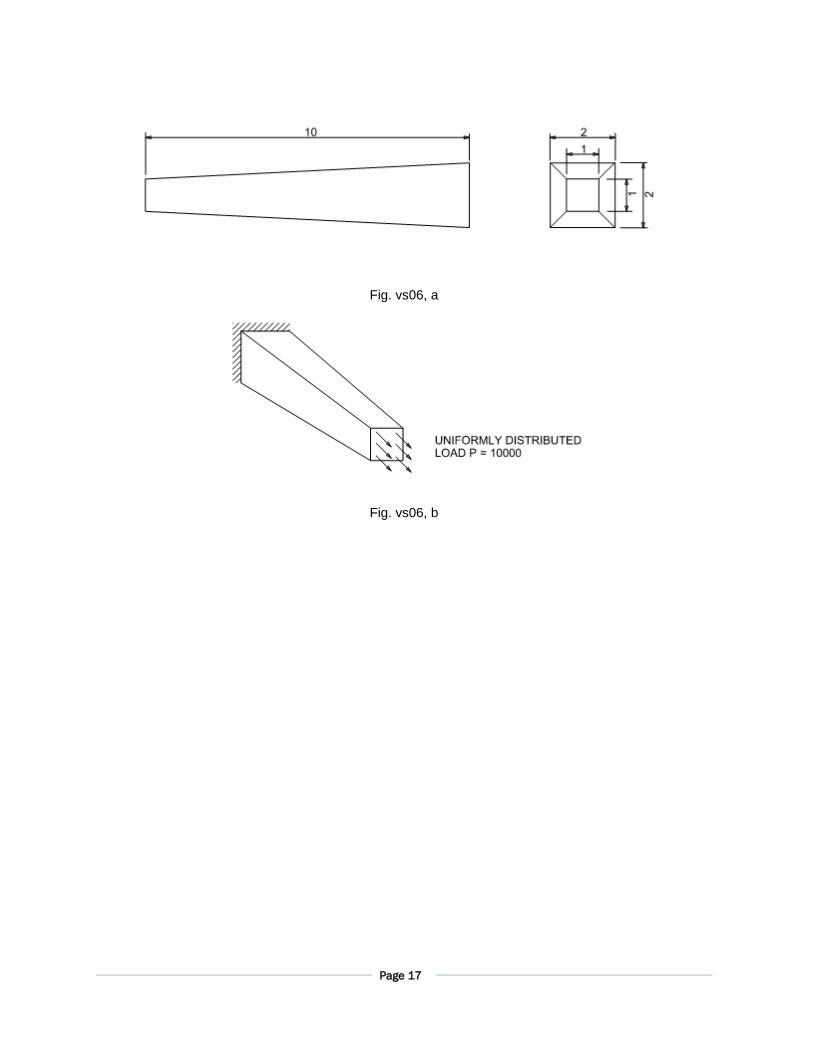
Test VS06: Tapered Solid Bar
PROBLEM DEFINITION
A tapered bar of square cross section (Fig. vs06, a), is subjected to axial load applied to the end of the bar (Fig. vs06, b). Determine the maximum axial deflection in the bar and axial stress at mid-length. Units are IPS.
Material properties: Modulus of Elasticity E=10.4e6 psi, Poisson’s ratio ν=0.3
Load is uniformly distributed at free end of the bar. The other end is fixed.
REFERENCE
Harris, C.O., “Introduction to Stress Analysis”, The MacMillan Co., New York, 1959, pp. 237, Problem 4.
RESULTS
Maximum Axial Deflection
Axial Stress at Midpoint
Theory (Bar Model w/ Variable Cross-Section) 4.8080E-03 4.4440E+03 SIMSOLID(3D Solid Model) 4.8323E-03 4.4000E+03 % Difference SIMSOLID / Theory 0.51% -0.99%
(1) Stress-Z along length of bar. Value take off the graph
Page 17
Fig. vs06, a
Fig. vs06, b
Page 18
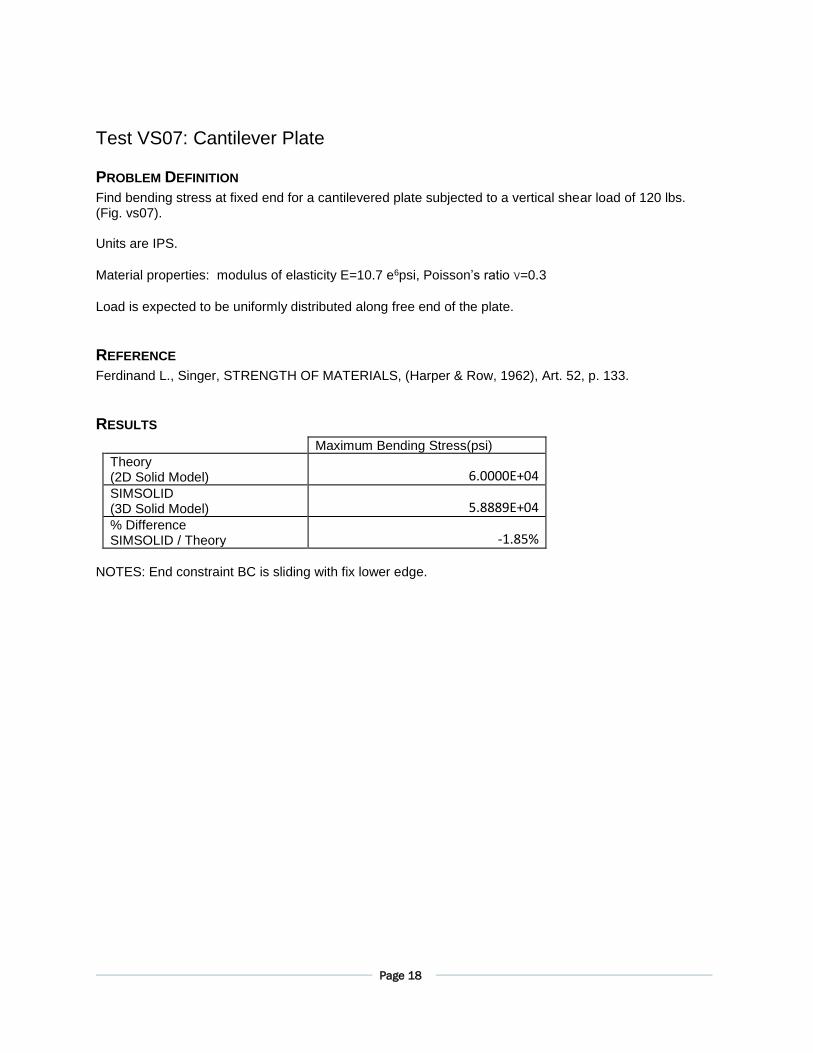
Test VS07: Cantilever Plate
PROBLEM DEFINITION
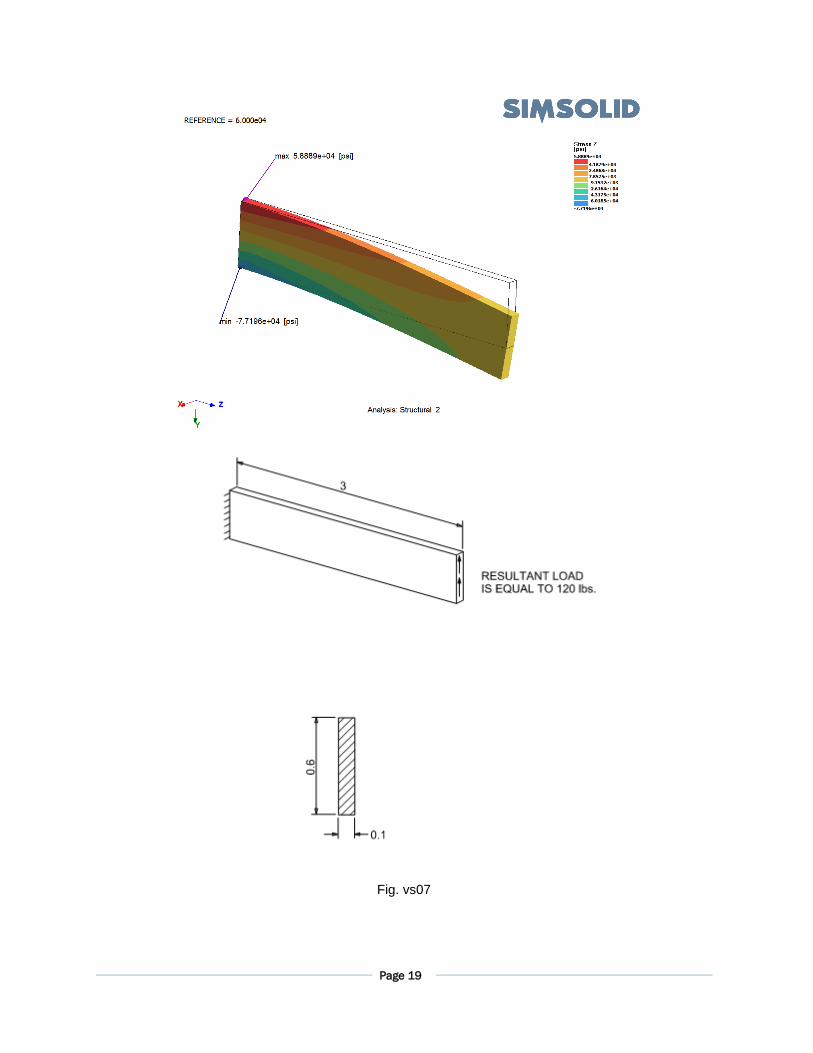
Find bending stress at fixed end for a cantilevered plate subjected to a vertical shear load of 120 lbs. (Fig. vs07). Units are IPS.
Material properties: modulus of elasticity E=10.7 e6psi, Poisson’s ratio ν=0.3
Load is expected to be uniformly distributed along free end of the plate.
REFERENCE
Ferdinand L., Singer, STRENGTH OF MATERIALS, (Harper & Row, 1962), Art. 52, p. 133.
RESULTS
Maximum Bending Stress(psi)
Theory (2D Solid Model) 6.0000E+04 SIMSOLID (3D Solid Model) 5.8889E+04 % Difference SIMSOLID / Theory -1.85%
NOTES: End constraint BC is sliding with fix lower edge.
Page 19
Fig. vs07
Page 20
TEST VS08: PLATE WITH A HOLE
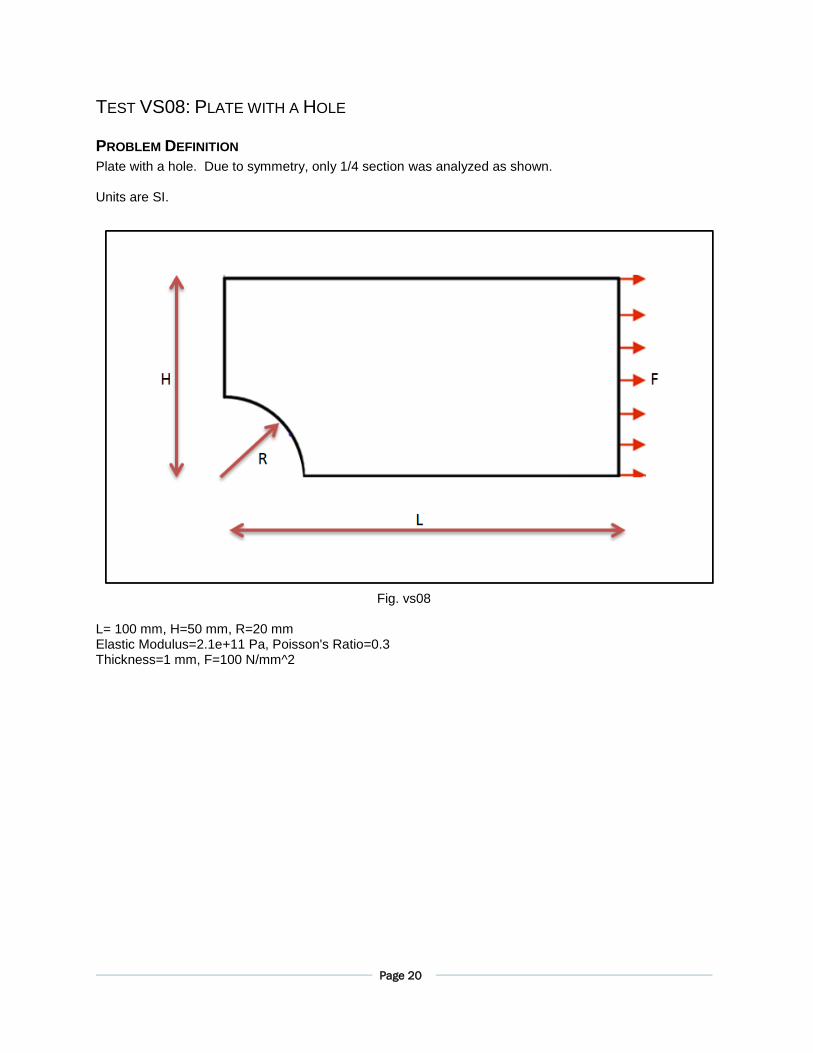
PROBLEM DEFINITION
Plate with a hole. Due to symmetry, only 1/4 section was analyzed as shown. Units are SI.
Fig. vs08
L= 100 mm, H=50 mm, R=20 mm Elastic Modulus=2.1e+11 Pa, Poisson's Ratio=0.3 Thickness=1 mm, F=100 N/mm^2
Page 21
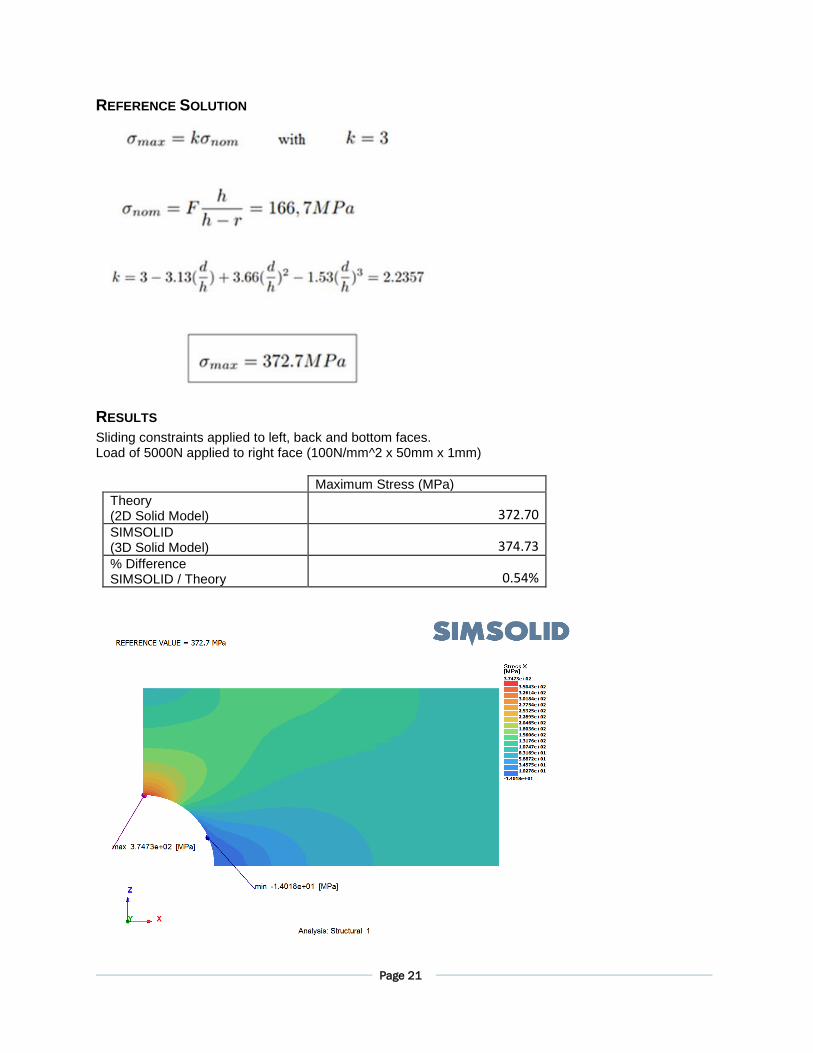
REFERENCE SOLUTION
RESULTS
Sliding constraints applied to left, back and bottom faces. Load of 5000N applied to right face (100N/mm^2 x 50mm x 1mm)
Maximum Stress (MPa)
Theory (2D Solid Model) 372.70 SIMSOLID (3D Solid Model) 374.73 % Difference SIMSOLID / Theory 0.54%
Page 22
TEST VS09: SCORDELIS-LO ROOF
PROBLEM DEFINITION
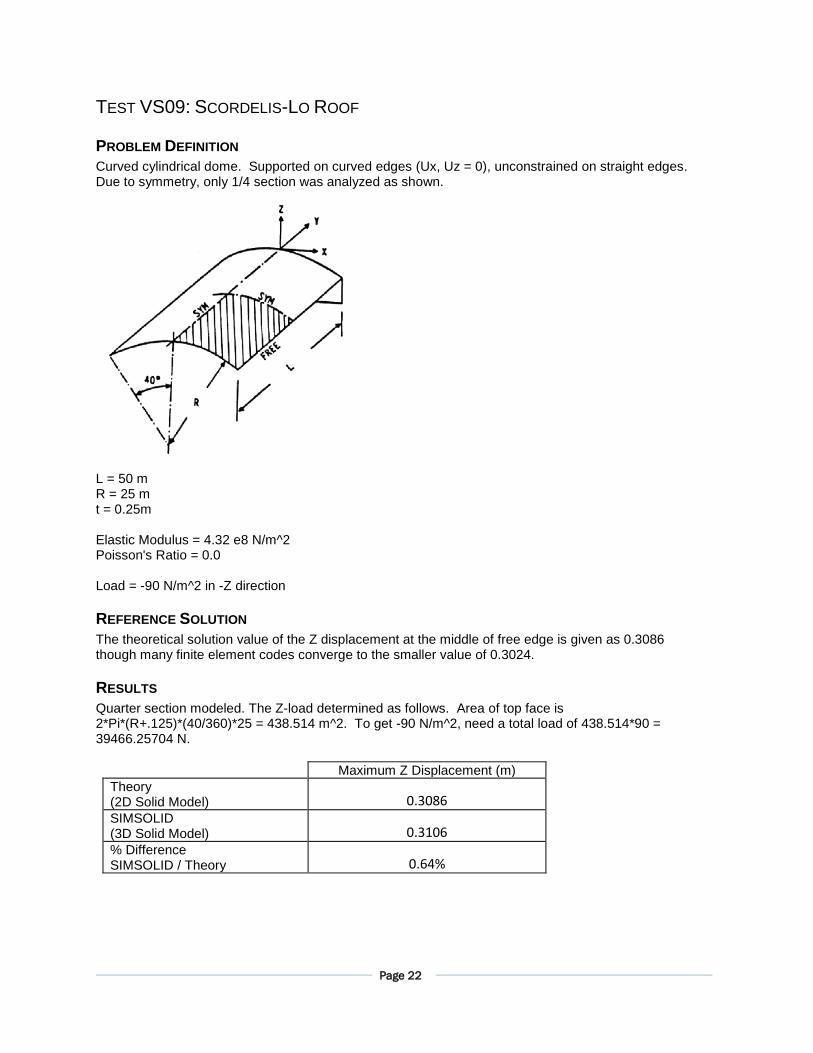
Curved cylindrical dome. Supported on curved edges (Ux, Uz = 0), unconstrained on straight edges. Due to symmetry, only 1/4 section was analyzed as shown.
L = 50 m R = 25 m t = 0.25m Elastic Modulus = 4.32 e8 N/m^2 Poisson's Ratio = 0.0 Load = -90 N/m^2 in -Z direction
REFERENCE SOLUTION
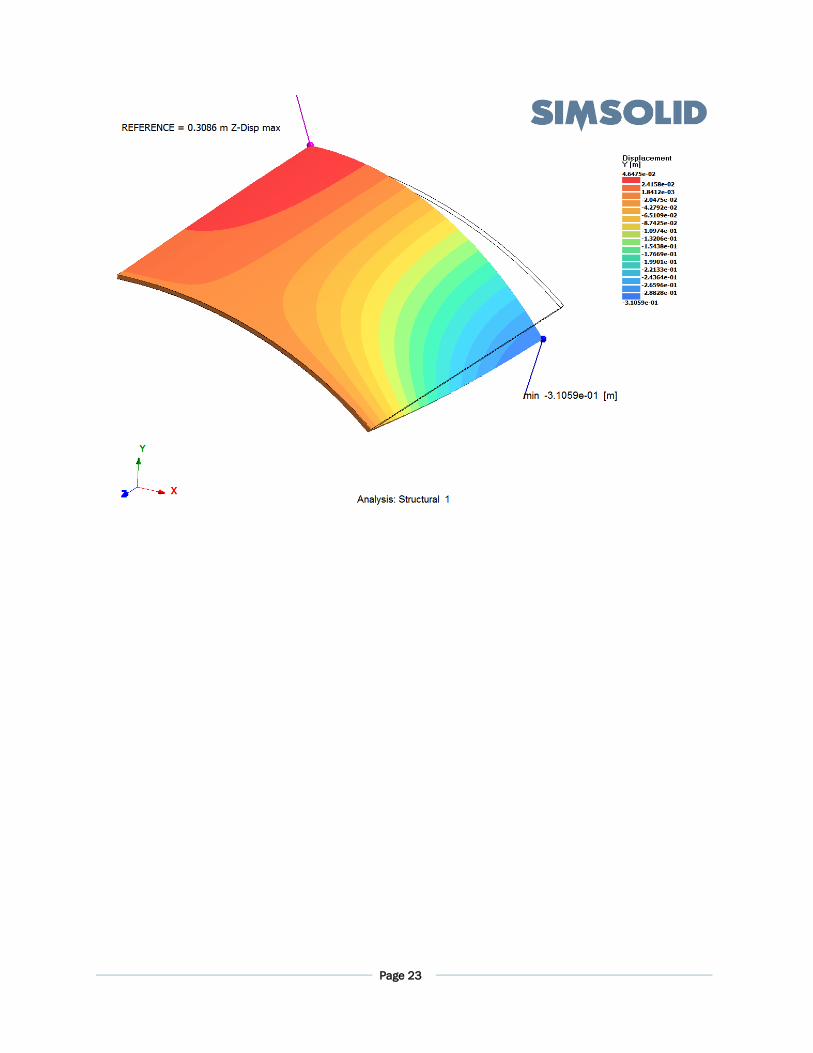
The theoretical solution value of the Z displacement at the middle of free edge is given as 0.3086 though many finite element codes converge to the smaller value of 0.3024.
RESULTS
Quarter section modeled. The Z-load determined as follows. Area of top face is 2*Pi*(R+.125)*(40/360)*25 = 438.514 m^2. To get -90 N/m^2, need a total load of 438.514*90 = 39466.25704 N.
Maximum Z Displacement (m)
Theory (2D Solid Model) 0.3086 SIMSOLID (3D Solid Model) 0.3106 % Difference SIMSOLID / Theory 0.64%
Page 23
Page 24
Test VS10: Curved Thick Elliptical Plate
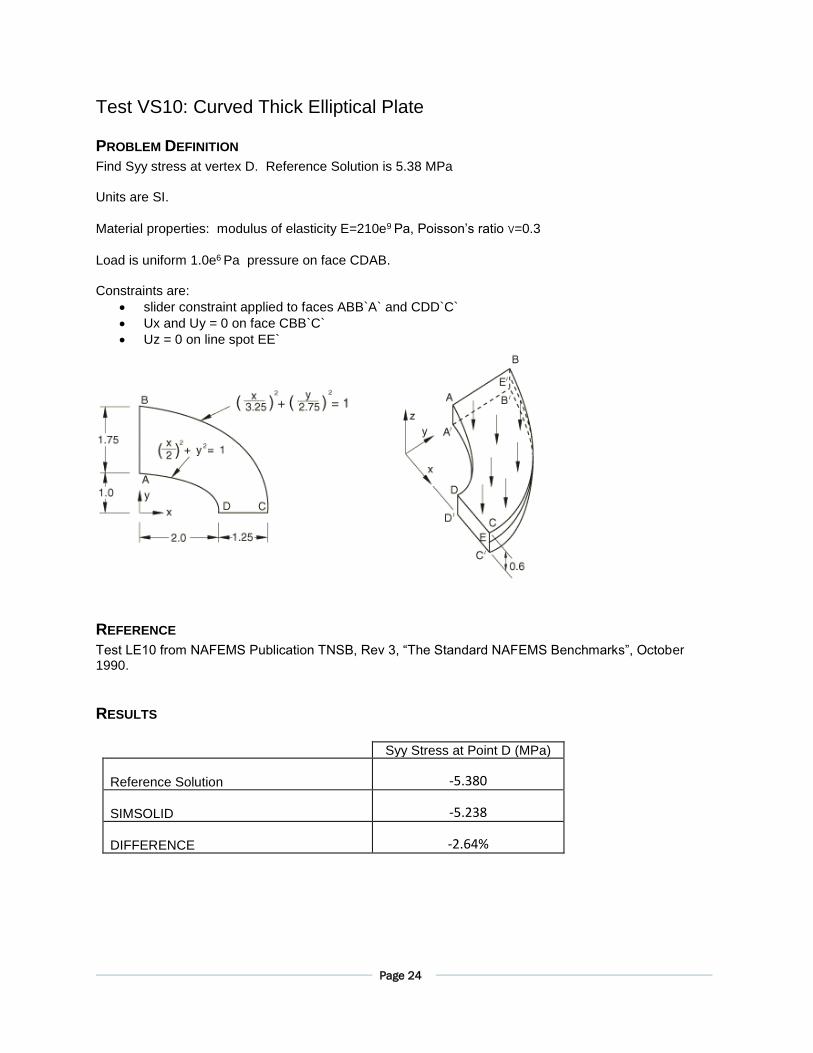
PROBLEM DEFINITION
Find Syy stress at vertex D. Reference Solution is 5.38 MPa Units are SI.
Material properties: modulus of elasticity E=210e9 Pa, Poisson’s ratio ν=0.3
Load is uniform 1.0e6 Pa pressure on face CDAB. Constraints are:
• slider constraint applied to faces ABB`A` and CDD`C`
• Ux and Uy = 0 on face CBB`C`
• Uz = 0 on line spot EE`
REFERENCE
Test LE10 from NAFEMS Publication TNSB, Rev 3, “The Standard NAFEMS Benchmarks”, October 1990.
RESULTS
Syy Stress at Point D (MPa)
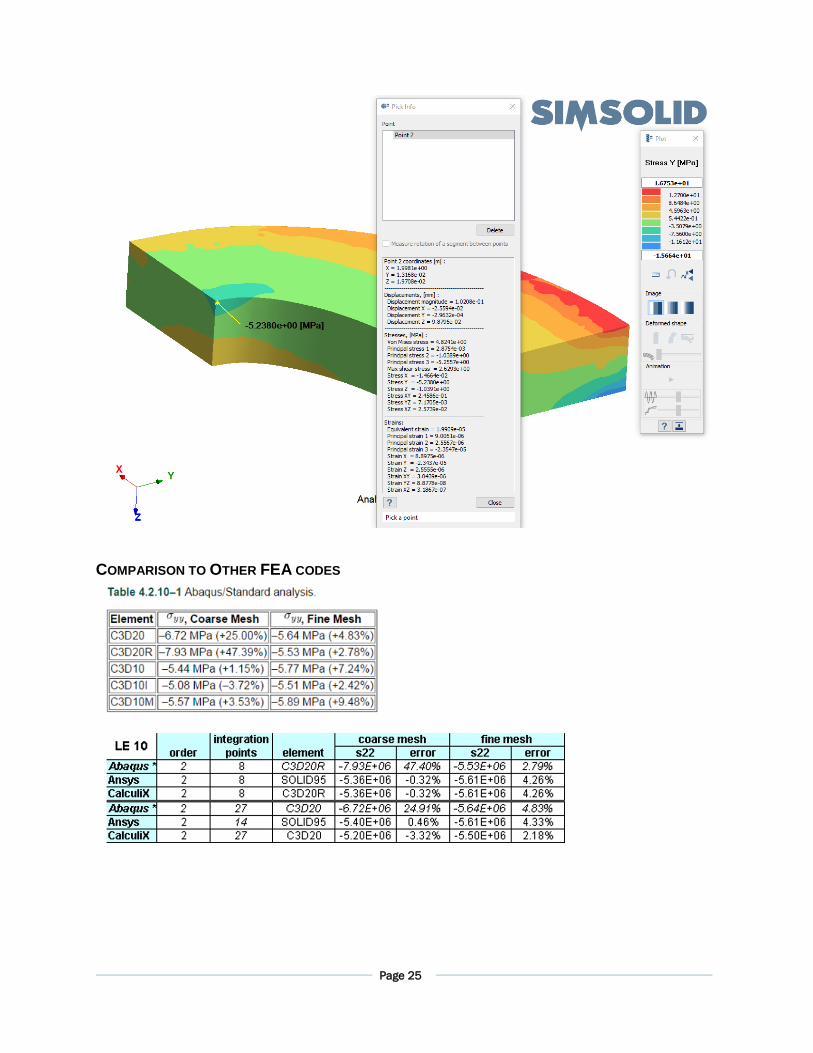
Reference Solution -5.380 SIMSOLID -5.238 DIFFERENCE -2.64%
Page 25
COMPARISON TO OTHER FEA CODES
Page 26
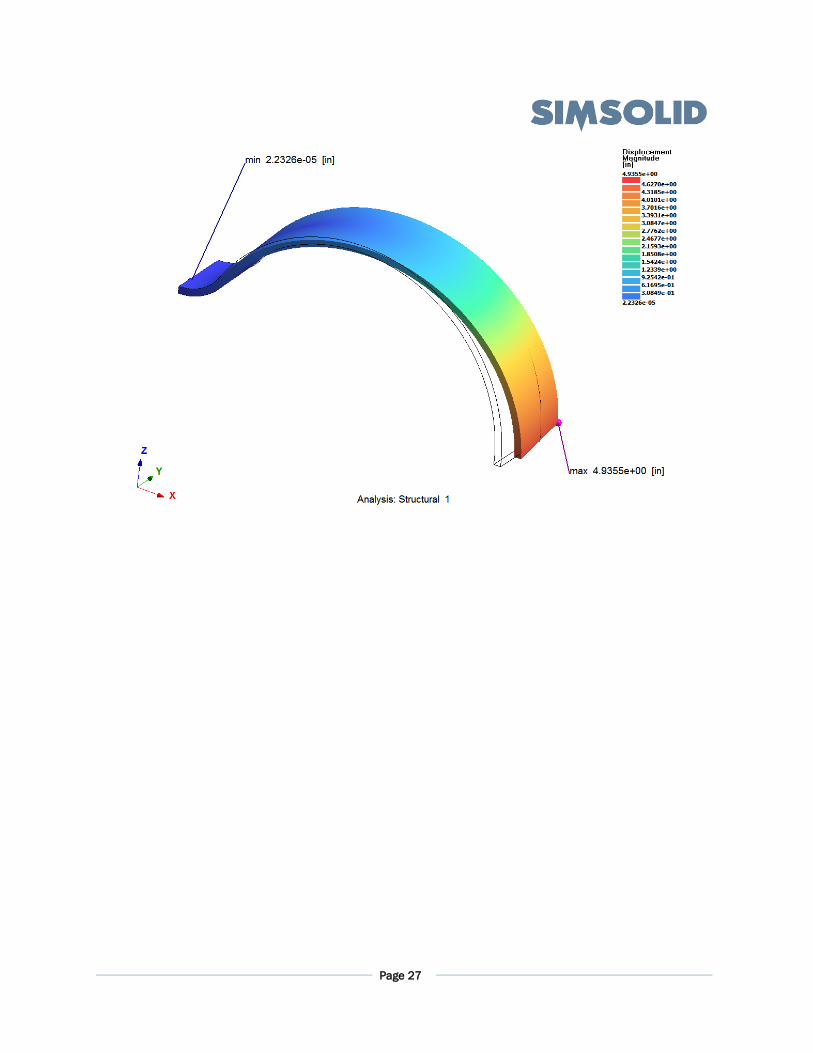
Test VS11: Raasch Challenge
PROBLEM DEFINITION
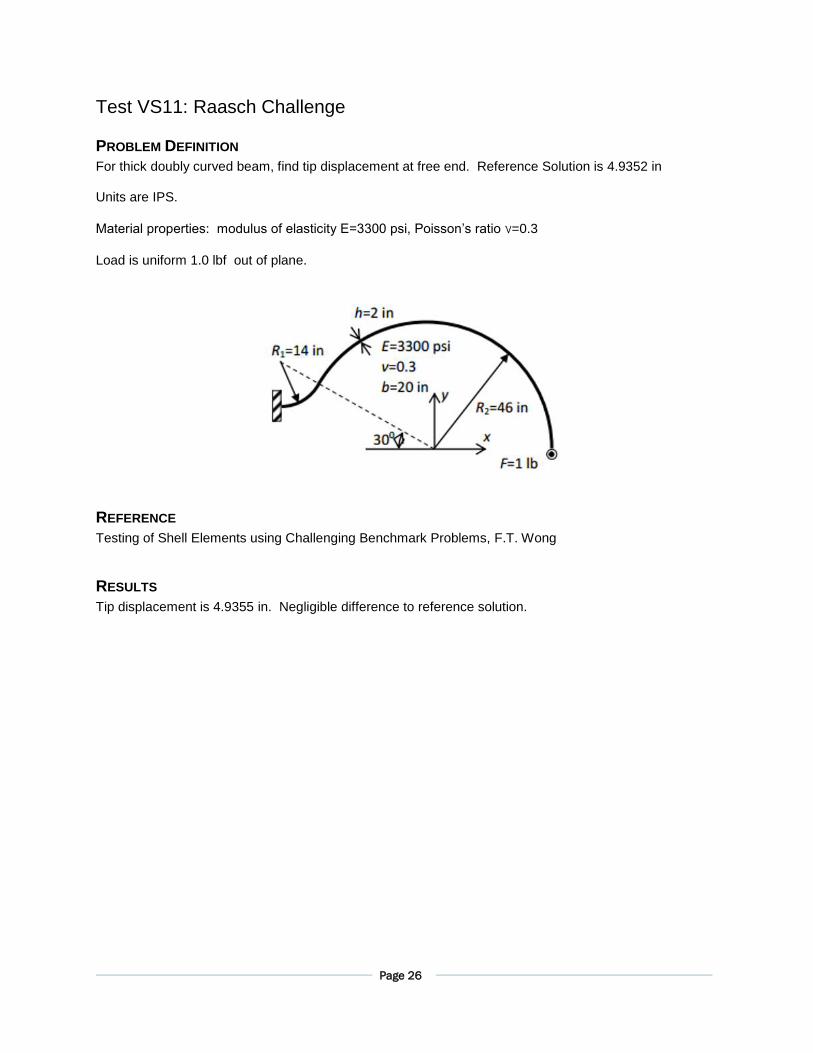
For thick doubly curved beam, find tip displacement at free end. Reference Solution is 4.9352 in Units are IPS.
Material properties: modulus of elasticity E=3300 psi, Poisson’s ratio ν=0.3
Load is uniform 1.0 lbf out of plane.
REFERENCE
Testing of Shell Elements using Challenging Benchmark Problems, F.T. Wong
RESULTS
Tip displacement is 4.9355 in. Negligible difference to reference solution.
Page 27
Page 28
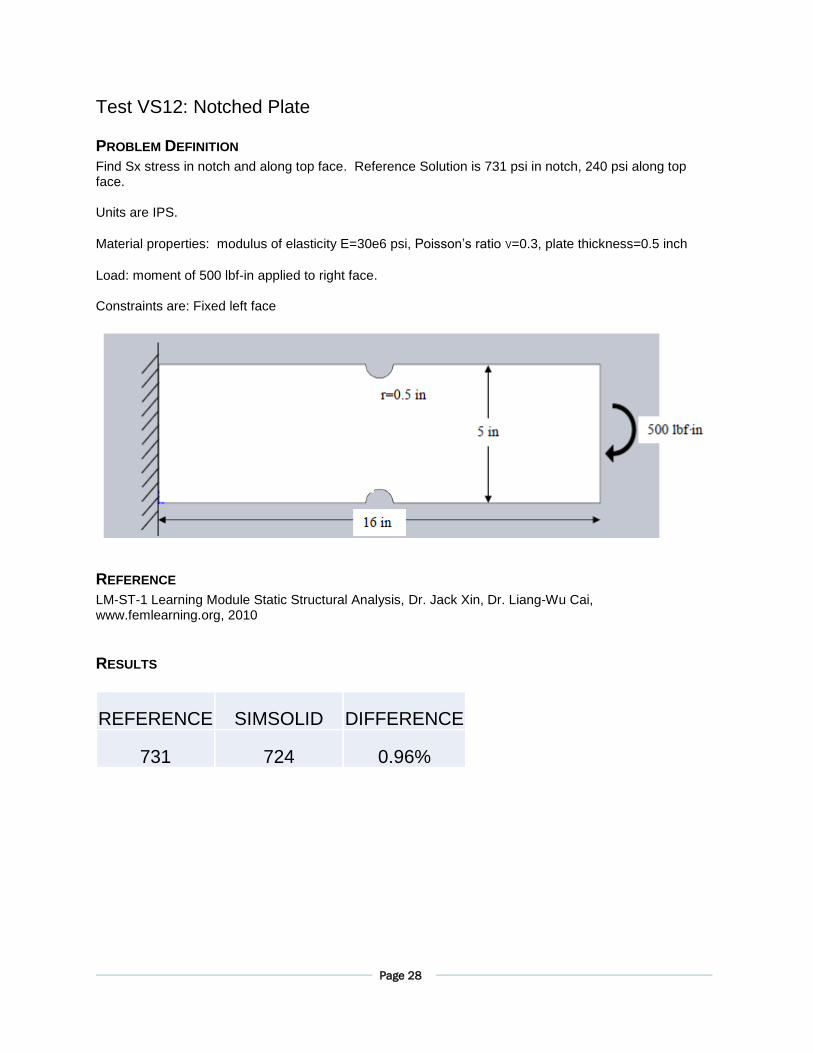
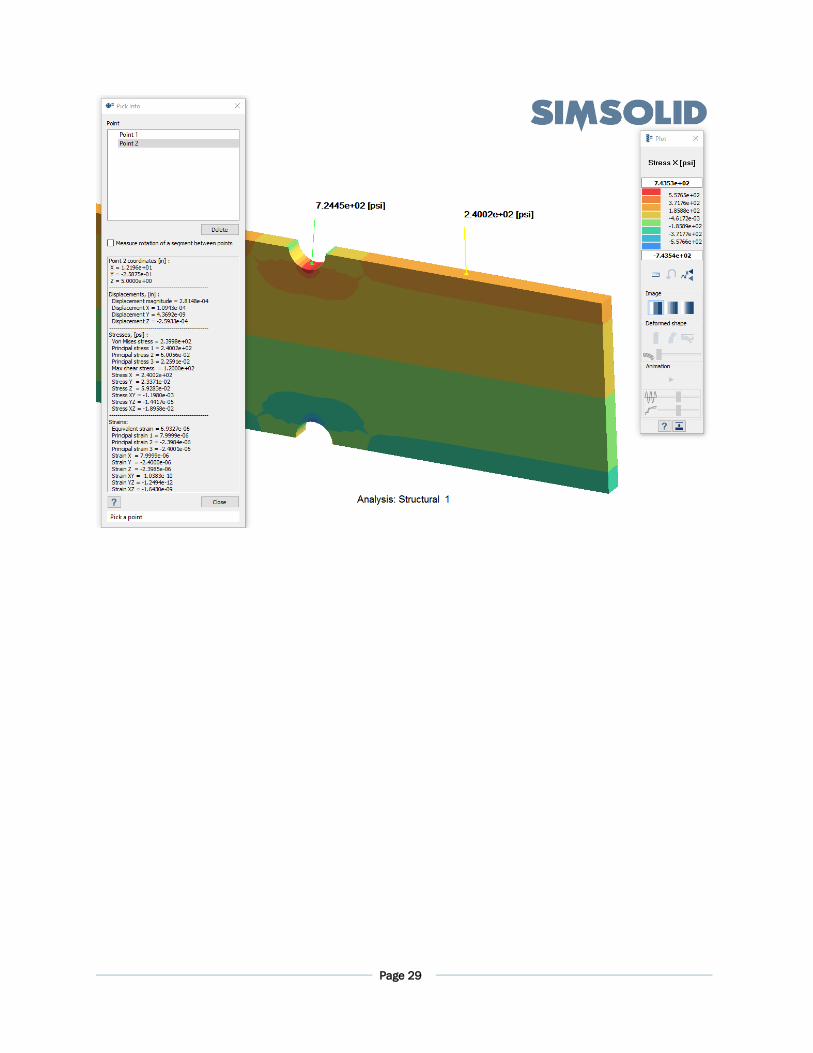
Test VS12: Notched Plate
PROBLEM DEFINITION
Find Sx stress in notch and along top face. Reference Solution is 731 psi in notch, 240 psi along top face. Units are IPS.
Material properties: modulus of elasticity E=30e6 psi, Poisson’s ratio ν=0.3, plate thickness=0.5 inch
Load: moment of 500 lbf-in applied to right face. Constraints are: Fixed left face
REFERENCE
LM-ST-1 Learning Module Static Structural Analysis, Dr. Jack Xin, Dr. Liang-Wu Cai, www.femlearning.org, 2010
RESULTS
REFERENCE SIMSOLID DIFFERENCE
731 724 0.96%
Page 29
Page 30
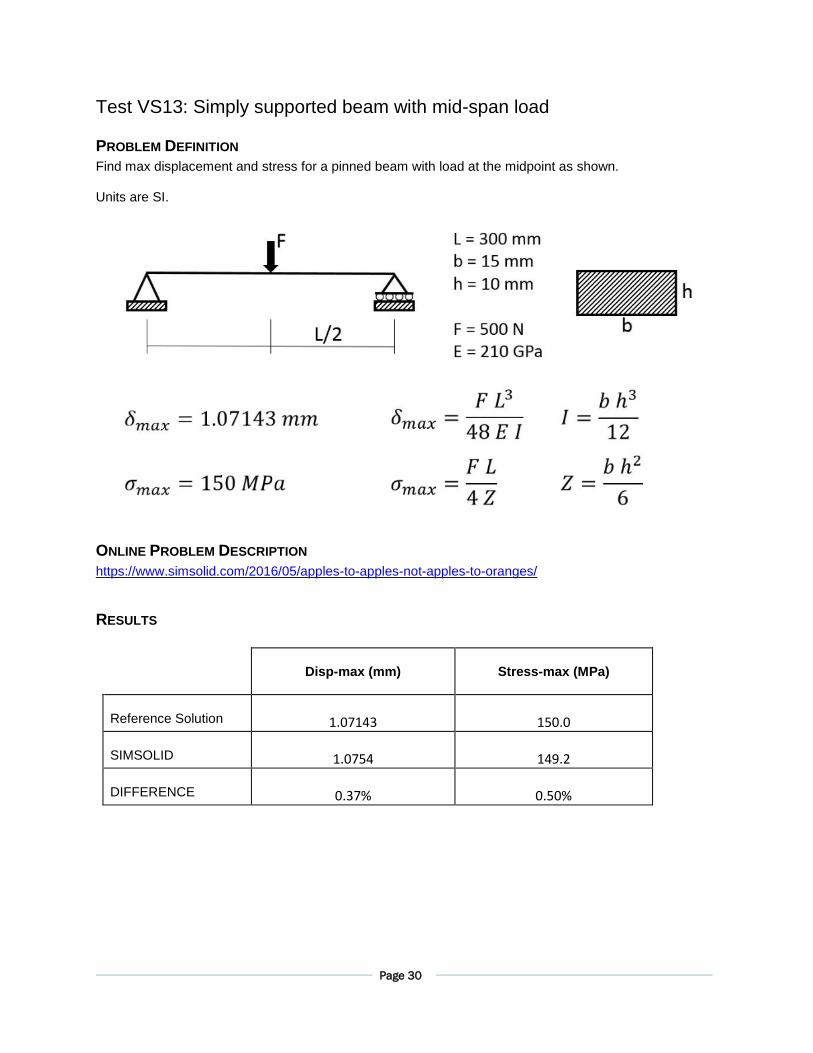
Test VS13: Simply supported beam with mid-span load
PROBLEM DEFINITION
Find max displacement and stress for a pinned beam with load at the midpoint as shown. Units are SI.
ONLINE PROBLEM DESCRIPTION
https://www.simsolid.com/2016/05/apples-to-apples-not-apples-to-oranges/
RESULTS
Disp-max (mm)
Stress-max (MPa)
Reference Solution 1.07143
150.0
SIMSOLID 1.0754
149.2
DIFFERENCE 0.37%
0.50%
Page 31
TEST VS14: SKEW PLATE UNDER PRESSURE
PROBLEM DEFINITION
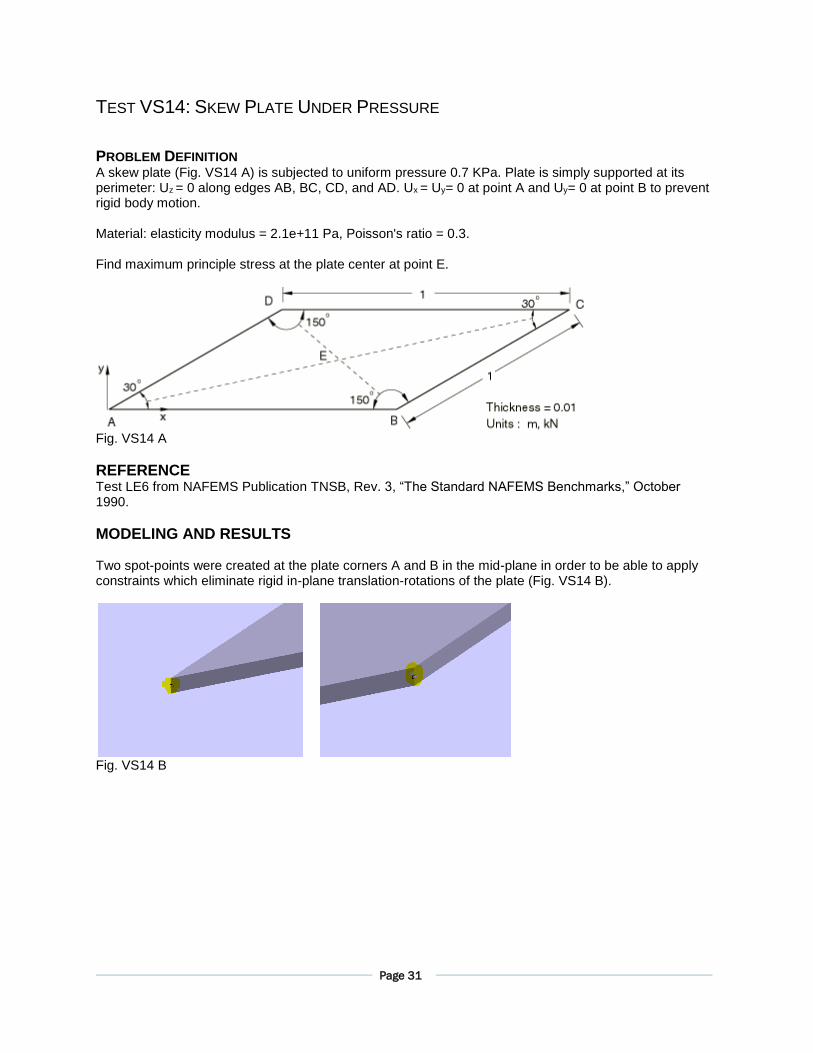
A skew plate (Fig. VS14 A) is subjected to uniform pressure 0.7 KPa. Plate is simply supported at its perimeter: Uz = 0 along edges AB, BC, CD, and AD. Ux = Uy= 0 at point A and Uy= 0 at point B to prevent rigid body motion. Material: elasticity modulus = 2.1e+11 Pa, Poisson's ratio = 0.3. Find maximum principle stress at the plate center at point E.
Fig. VS14 A
REFERENCE Test LE6 from NAFEMS Publication TNSB, Rev. 3, “The Standard NAFEMS Benchmarks,” October 1990.
MODELING AND RESULTS Two spot-points were created at the plate corners A and B in the mid-plane in order to be able to apply constraints which eliminate rigid in-plane translation-rotations of the plate (Fig. VS14 B).
Fig. VS14 B
Page 32
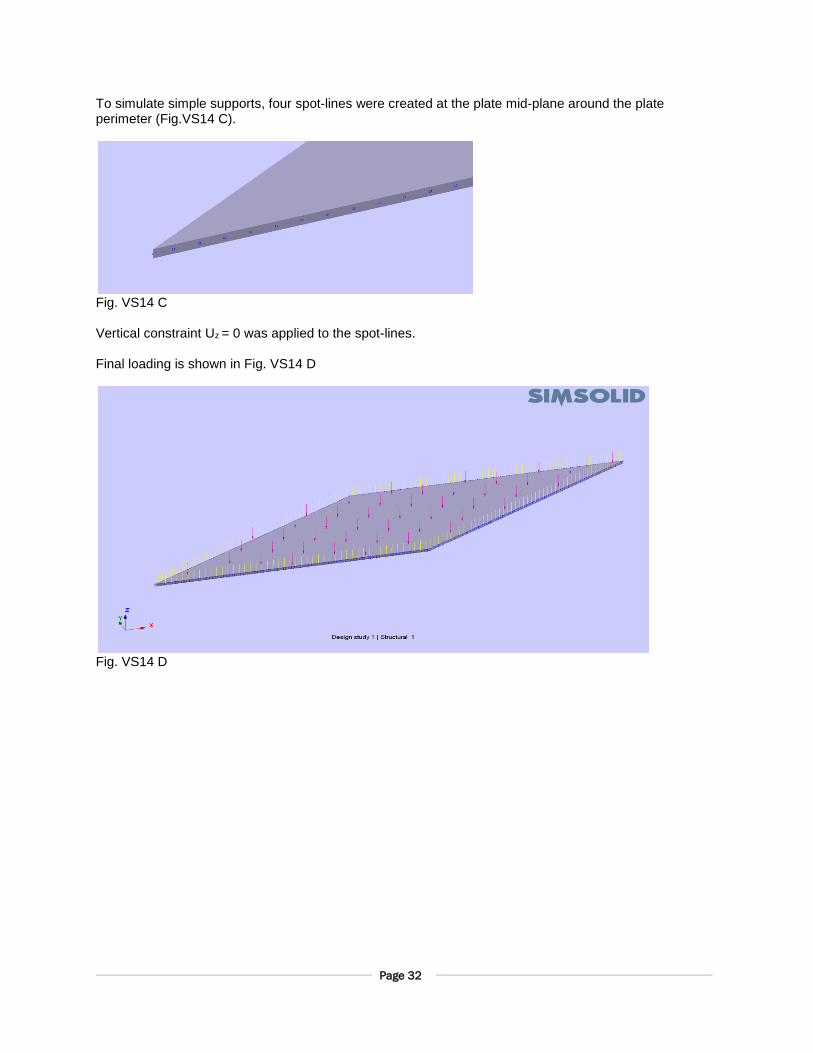
To simulate simple supports, four spot-lines were created at the plate mid-plane around the plate perimeter (Fig.VS14 C).
Fig. VS14 C Vertical constraint Uz = 0 was applied to the spot-lines. Final loading is shown in Fig. VS14 D
Fig. VS14 D
Page 33
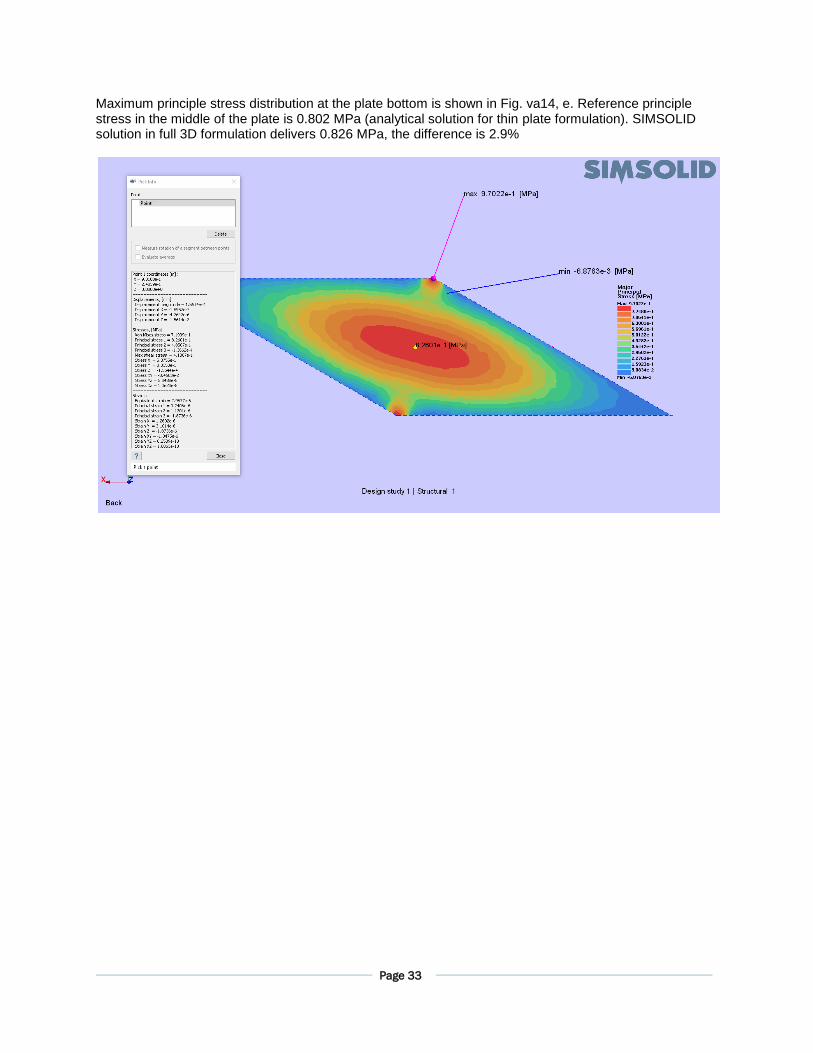
Maximum principle stress distribution at the plate bottom is shown in Fig. va14, e. Reference principle stress in the middle of the plate is 0.802 MPa (analytical solution for thin plate formulation). SIMSOLID solution in full 3D formulation delivers 0.826 MPa, the difference is 2.9%
Page 34
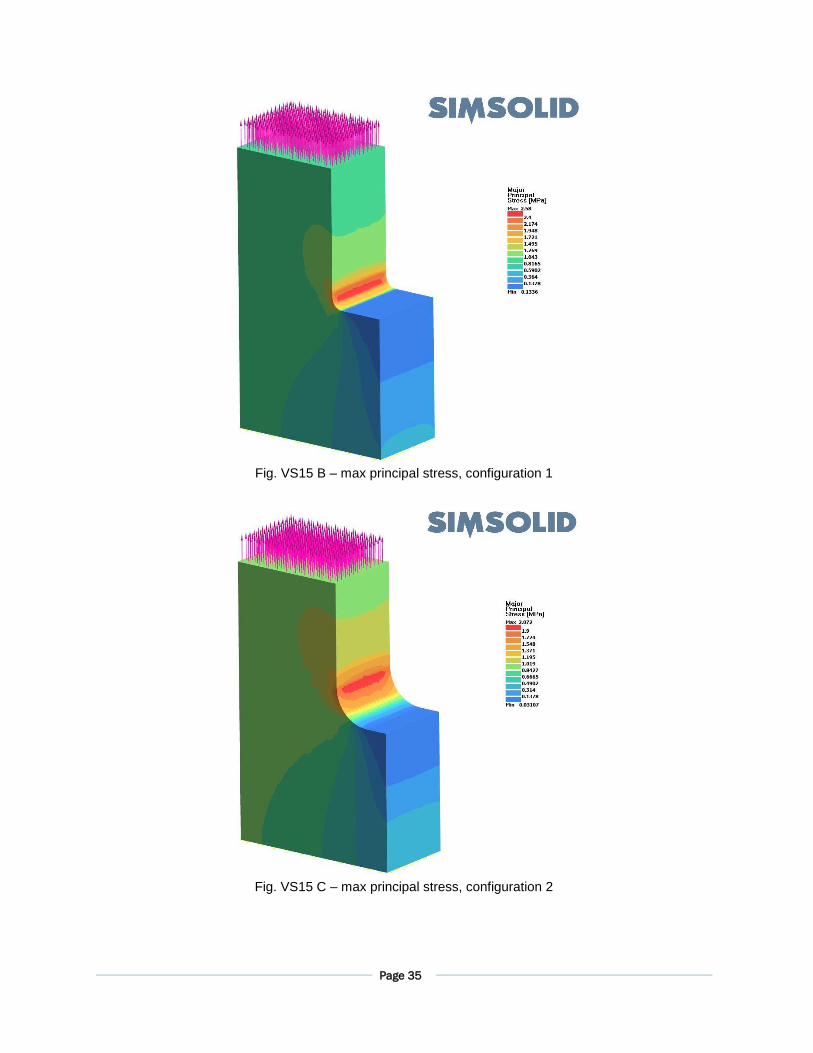
TEST VS15: STRESS CONCENTRATION OF FILLETED BAR
PROBLEM DEFINITION
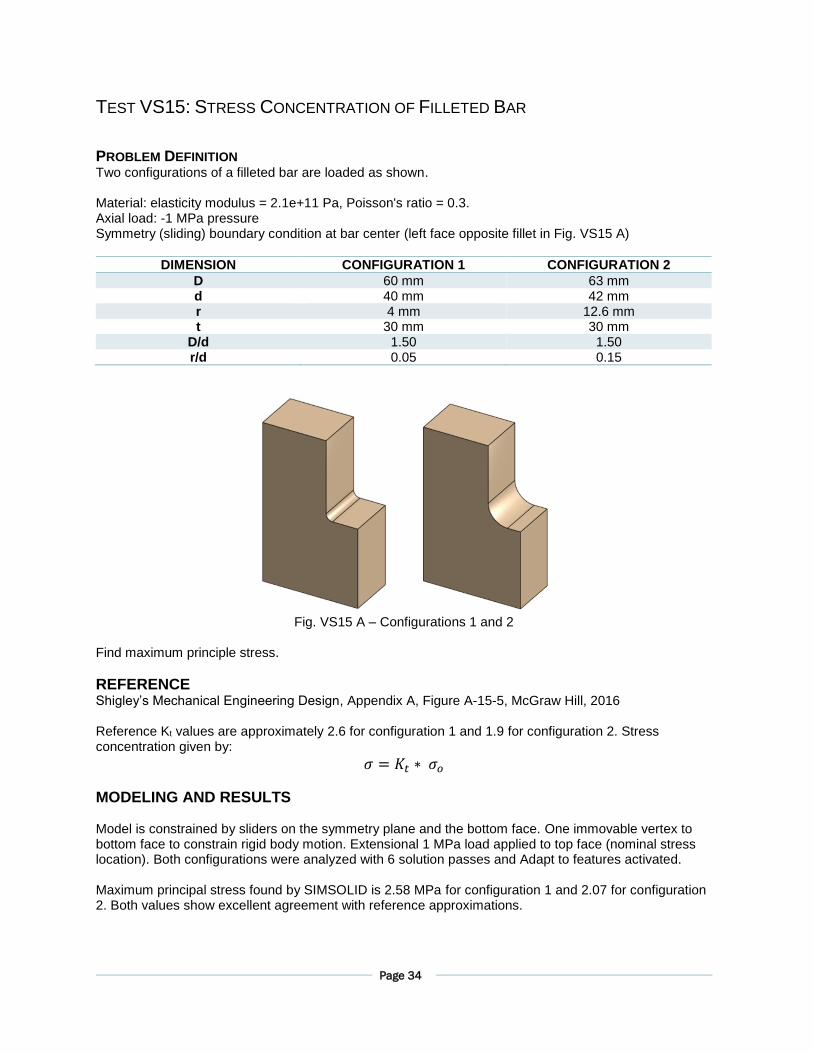
Two configurations of a filleted bar are loaded as shown. Material: elasticity modulus = 2.1e+11 Pa, Poisson's ratio = 0.3. Axial load: -1 MPa pressure Symmetry (sliding) boundary condition at bar center (left face opposite fillet in Fig. VS15 A)
DIMENSION CONFIGURATION 1 CONFIGURATION 2
D 60 mm 63 mm d 40 mm 42 mm r 4 mm 12.6 mm t 30 mm 30 mm
D/d 1.50 1.50 r/d 0.05 0.15
Fig. VS15 A – Configurations 1 and 2
Find maximum principle stress.
REFERENCE Shigley’s Mechanical Engineering Design, Appendix A, Figure A-15-5, McGraw Hill, 2016 Reference Kt values are approximately 2.6 for configuration 1 and 1.9 for configuration 2. Stress concentration given by:
𝜎 = 𝐾𝑡 ∗ 𝜎𝑜
MODELING AND RESULTS Model is constrained by sliders on the symmetry plane and the bottom face. One immovable vertex to bottom face to constrain rigid body motion. Extensional 1 MPa load applied to top face (nominal stress location). Both configurations were analyzed with 6 solution passes and Adapt to features activated. Maximum principal stress found by SIMSOLID is 2.58 MPa for configuration 1 and 2.07 for configuration 2. Both values show excellent agreement with reference approximations.
Page 35
Fig. VS15 B – max principal stress, configuration 1
Fig. VS15 C – max principal stress, configuration 2
Page 36
SECTION 2: MODAL ANALYSIS TESTS
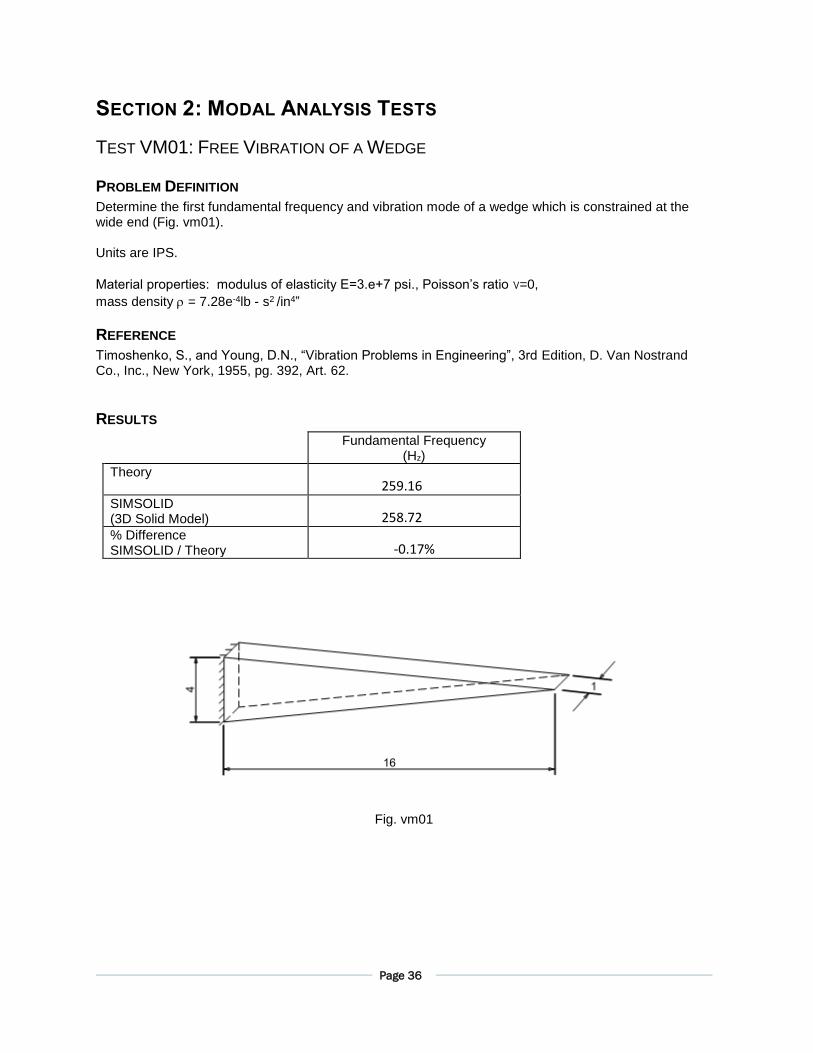
TEST VM01: FREE VIBRATION OF A WEDGE
PROBLEM DEFINITION
Determine the first fundamental frequency and vibration mode of a wedge which is constrained at the wide end (Fig. vm01). Units are IPS.
Material properties: modulus of elasticity E=3.e+7 psi., Poisson’s ratio ν=0,
mass density = 7.28e-4lb - s2 /in4”
REFERENCE
Timoshenko, S., and Young, D.N., “Vibration Problems in Engineering”, 3rd Edition, D. Van Nostrand Co., Inc., New York, 1955, pg. 392, Art. 62.
RESULTS
Fundamental Frequency (Hz)
Theory 259.16 SIMSOLID (3D Solid Model) 258.72 % Difference SIMSOLID / Theory -0.17%
Fig. vm01
Page 37
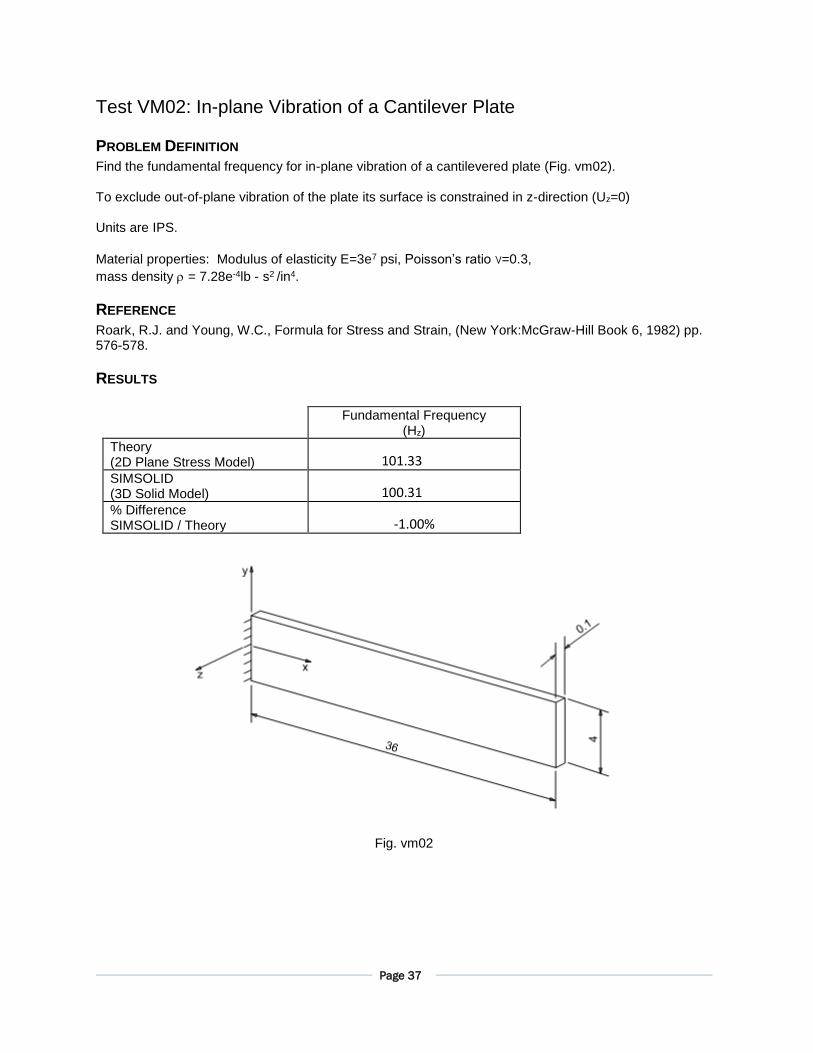
Test VM02: In-plane Vibration of a Cantilever Plate
PROBLEM DEFINITION
Find the fundamental frequency for in-plane vibration of a cantilevered plate (Fig. vm02). To exclude out-of-plane vibration of the plate its surface is constrained in z-direction (Uz=0) Units are IPS.
Material properties: Modulus of elasticity E=3e7 psi, Poisson’s ratio ν=0.3,
mass density = 7.28e-4lb - s2 /in4.
REFERENCE
Roark, R.J. and Young, W.C., Formula for Stress and Strain, (New York:McGraw-Hill Book 6, 1982) pp. 576-578.
RESULTS
Fundamental Frequency (Hz)
Theory (2D Plane Stress Model) 101.33 SIMSOLID (3D Solid Model) 100.31 % Difference SIMSOLID / Theory -1.00%
Fig. vm02
Page 38
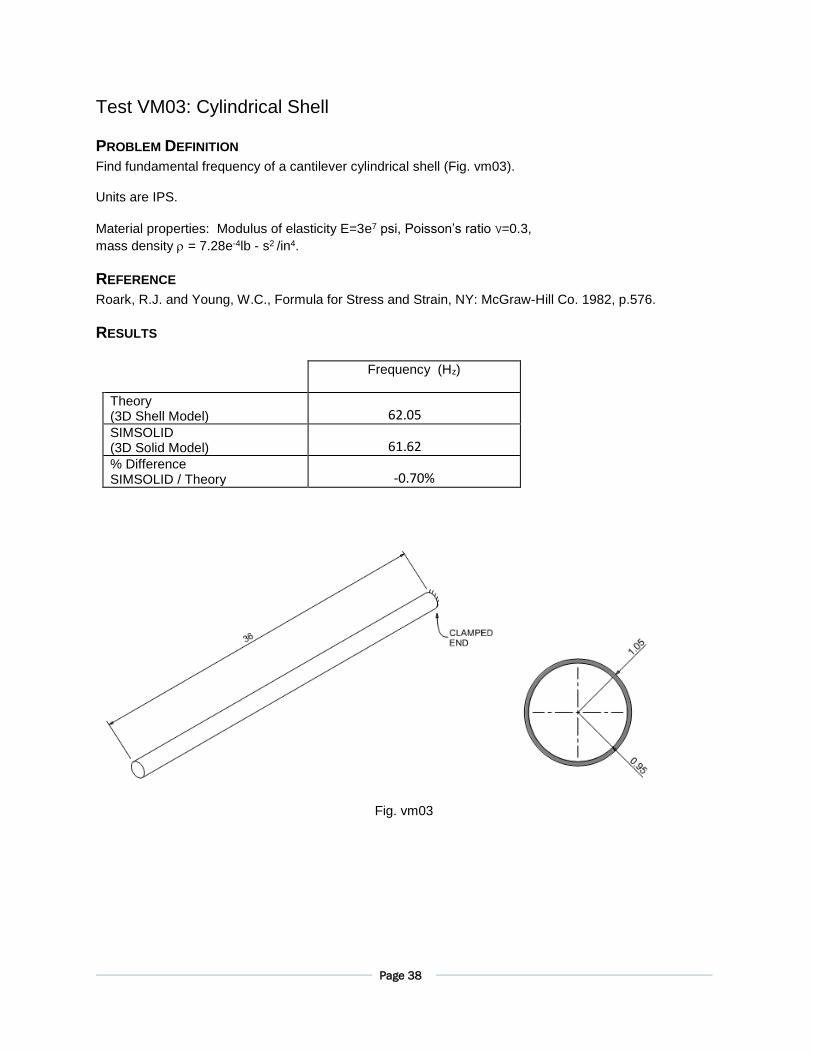
Test VM03: Cylindrical Shell
PROBLEM DEFINITION
Find fundamental frequency of a cantilever cylindrical shell (Fig. vm03). Units are IPS.
Material properties: Modulus of elasticity E=3e7 psi, Poisson’s ratio ν=0.3,
mass density = 7.28e-4lb - s2 /in4.
REFERENCE
Roark, R.J. and Young, W.C., Formula for Stress and Strain, NY: McGraw-Hill Co. 1982, p.576.
RESULTS
Frequency (Hz)
Theory (3D Shell Model) 62.05 SIMSOLID (3D Solid Model) 61.62 % Difference SIMSOLID / Theory -0.70%
Fig. vm03
Page 39
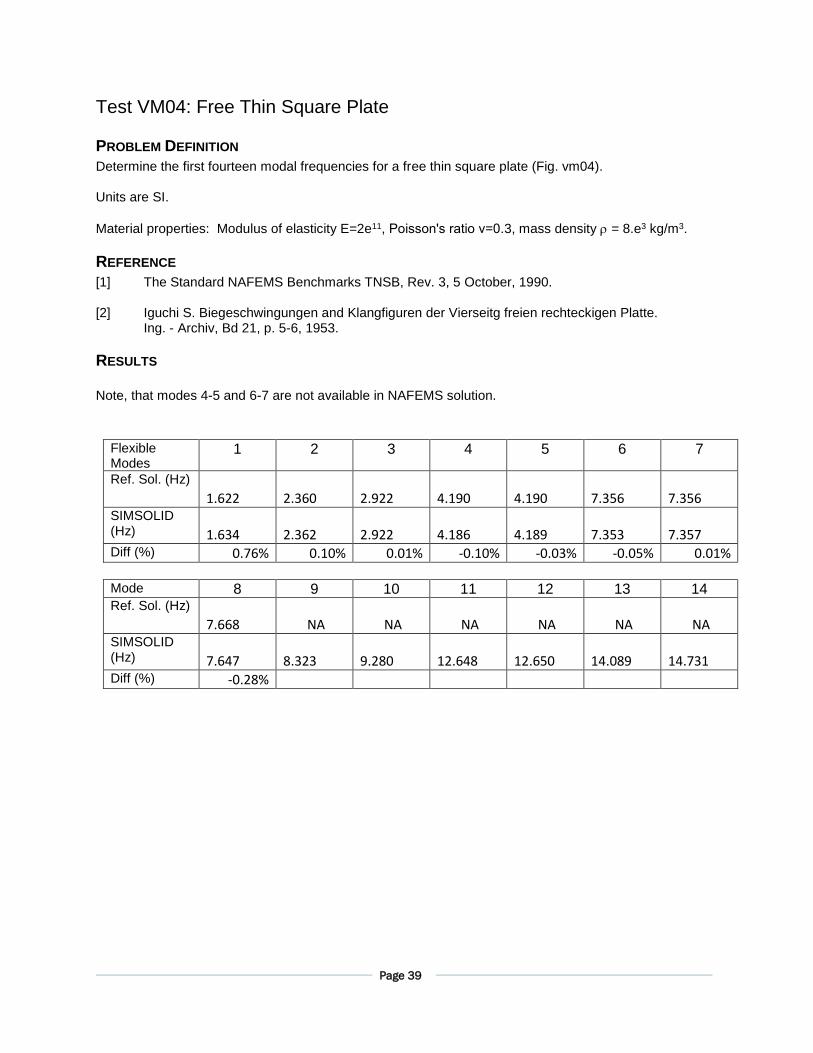
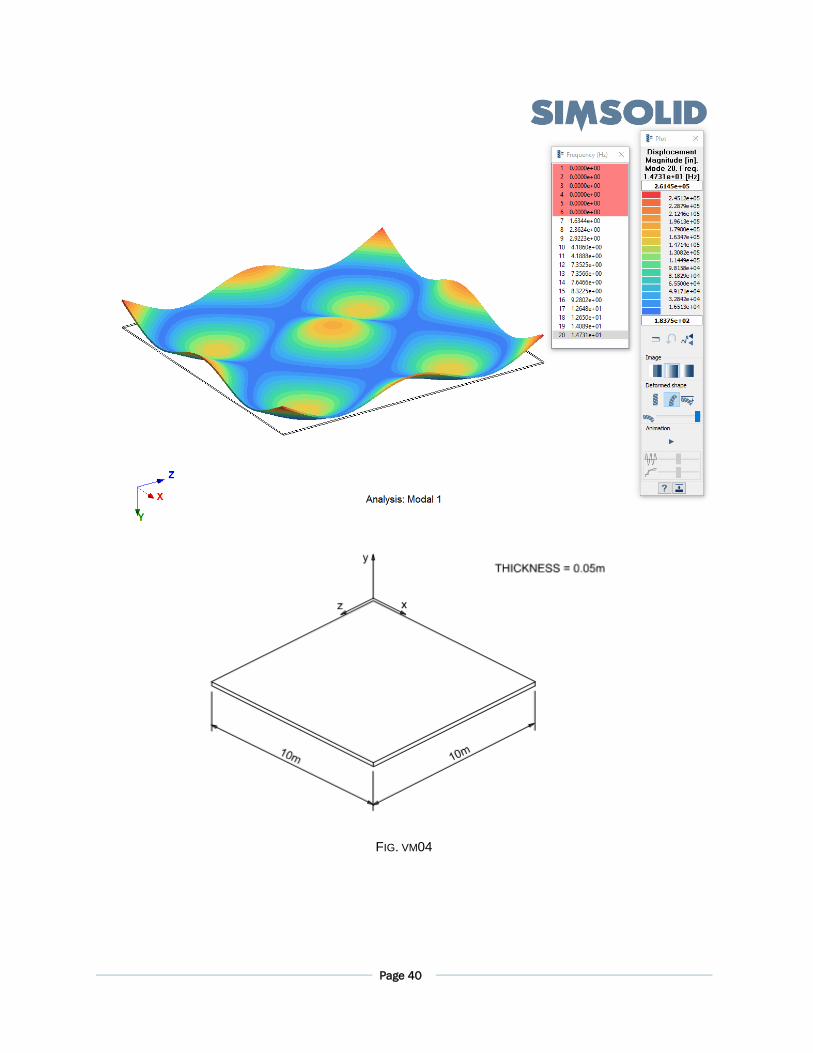
Test VM04: Free Thin Square Plate
PROBLEM DEFINITION
Determine the first fourteen modal frequencies for a free thin square plate (Fig. vm04). Units are SI.
Material properties: Modulus of elasticity E=2e11, Poisson's ratio ν=0.3, mass density = 8.e3 kg/m3.
REFERENCE
[1] The Standard NAFEMS Benchmarks TNSB, Rev. 3, 5 October, 1990. [2] Iguchi S. Biegeschwingungen and Klangfiguren der Vierseitg freien rechteckigen Platte. Ing. - Archiv, Bd 21, p. 5-6, 1953.
RESULTS Note, that modes 4-5 and 6-7 are not available in NAFEMS solution.
Flexible Modes
1 2 3 4 5 6 7
Ref. Sol. (Hz) 1.622
2.360
2.922
4.190
4.190
7.356
7.356
SIMSOLID (Hz)
1.634
2.362
2.922
4.186
4.189
7.353
7.357
Diff (%) 0.76% 0.10% 0.01% -0.10% -0.03% -0.05% 0.01%
Mode 8 9 10 11 12 13 14 Ref. Sol. (Hz)
7.668 NA NA NA NA NA NA SIMSOLID (Hz)
7.647
8.323
9.280
12.648
12.650
14.089
14.731
Diff (%) -0.28%
Page 40
FIG. VM04
Page 41
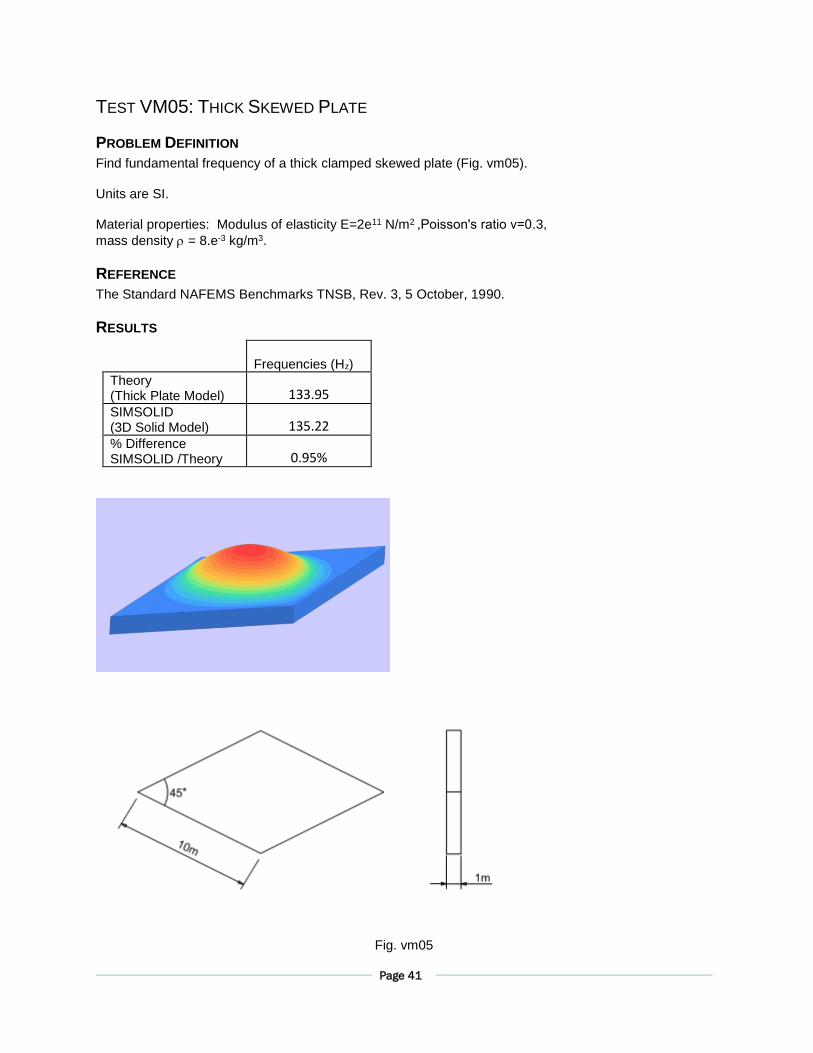
TEST VM05: THICK SKEWED PLATE
PROBLEM DEFINITION
Find fundamental frequency of a thick clamped skewed plate (Fig. vm05). Units are SI. Material properties: Modulus of elasticity E=2e11 N/m2 ,Poisson's ratio ν=0.3,
mass density = 8.e-3 kg/m3.
REFERENCE
The Standard NAFEMS Benchmarks TNSB, Rev. 3, 5 October, 1990.
RESULTS
Frequencies (Hz)
Theory (Thick Plate Model) 133.95 SIMSOLID (3D Solid Model) 135.22 % Difference SIMSOLID /Theory 0.95%
Fig. vm05
Page 42
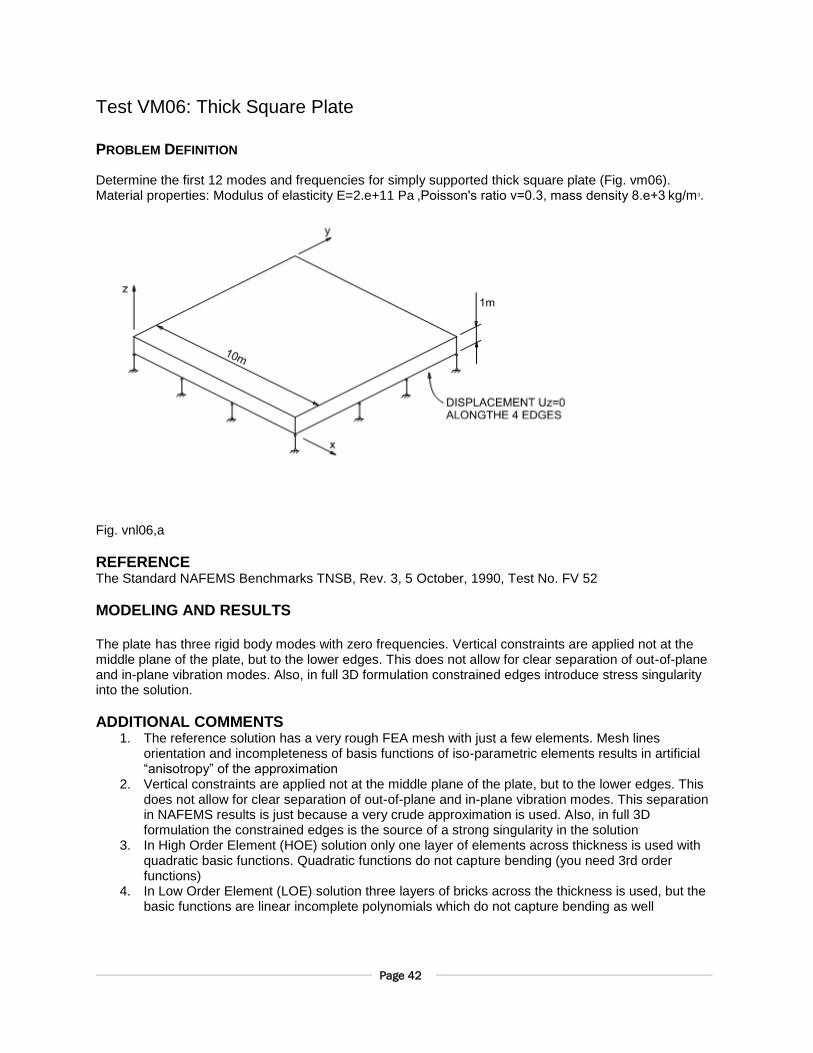
Test VM06: Thick Square Plate
PROBLEM DEFINITION
Determine the first 12 modes and frequencies for simply supported thick square plate (Fig. vm06). Material properties: Modulus of elasticity E=2.e+11 Pa ,Poisson's ratio ν=0.3, mass density 8.e+3 kg/m3.
Fig. vnl06,a
REFERENCE The Standard NAFEMS Benchmarks TNSB, Rev. 3, 5 October, 1990, Test No. FV 52
MODELING AND RESULTS The plate has three rigid body modes with zero frequencies. Vertical constraints are applied not at the middle plane of the plate, but to the lower edges. This does not allow for clear separation of out-of-plane and in-plane vibration modes. Also, in full 3D formulation constrained edges introduce stress singularity into the solution.
ADDITIONAL COMMENTS 1. The reference solution has a very rough FEA mesh with just a few elements. Mesh lines
orientation and incompleteness of basis functions of iso-parametric elements results in artificial “anisotropy” of the approximation
2. Vertical constraints are applied not at the middle plane of the plate, but to the lower edges. This does not allow for clear separation of out-of-plane and in-plane vibration modes. This separation in NAFEMS results is just because a very crude approximation is used. Also, in full 3D formulation the constrained edges is the source of a strong singularity in the solution
3. In High Order Element (HOE) solution only one layer of elements across thickness is used with quadratic basic functions. Quadratic functions do not capture bending (you need 3rd order functions)
4. In Low Order Element (LOE) solution three layers of bricks across the thickness is used, but the basic functions are linear incomplete polynomials which do not capture bending as well
Page 43
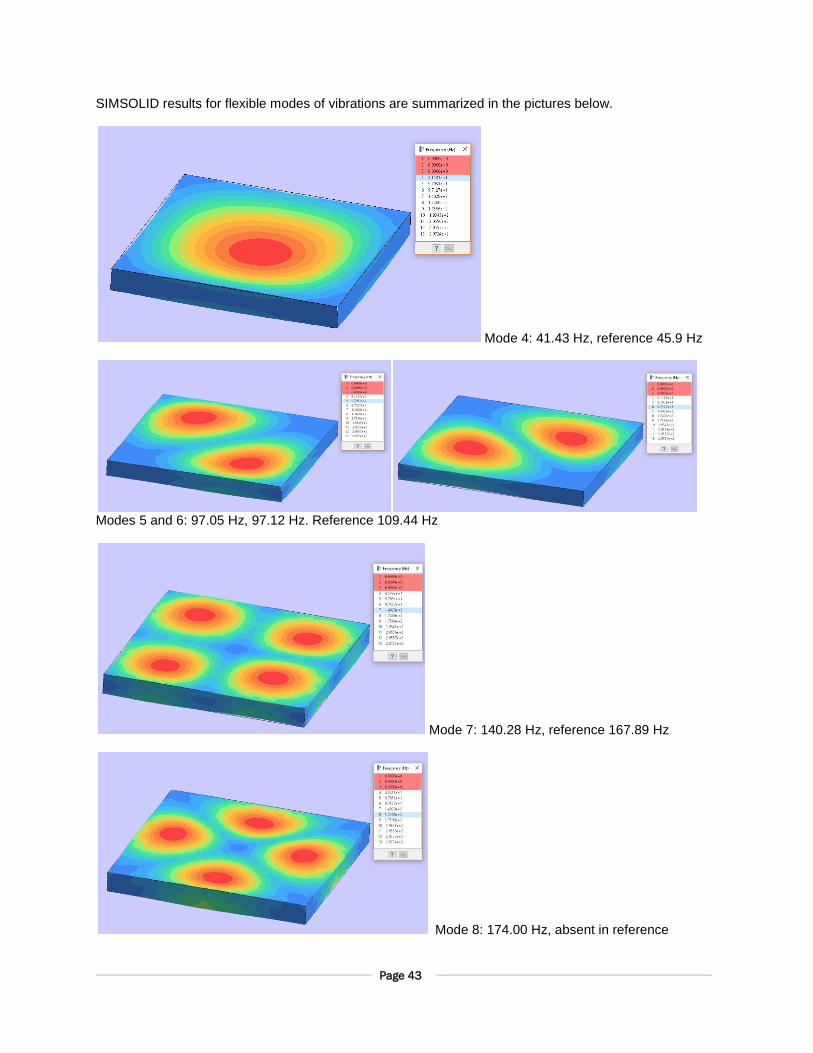
SIMSOLID results for flexible modes of vibrations are summarized in the pictures below.
Mode 4: 41.43 Hz, reference 45.9 Hz
Modes 5 and 6: 97.05 Hz, 97.12 Hz. Reference 109.44 Hz
Mode 7: 140.28 Hz, reference 167.89 Hz
Mode 8: 174.00 Hz, absent in reference
Page 44
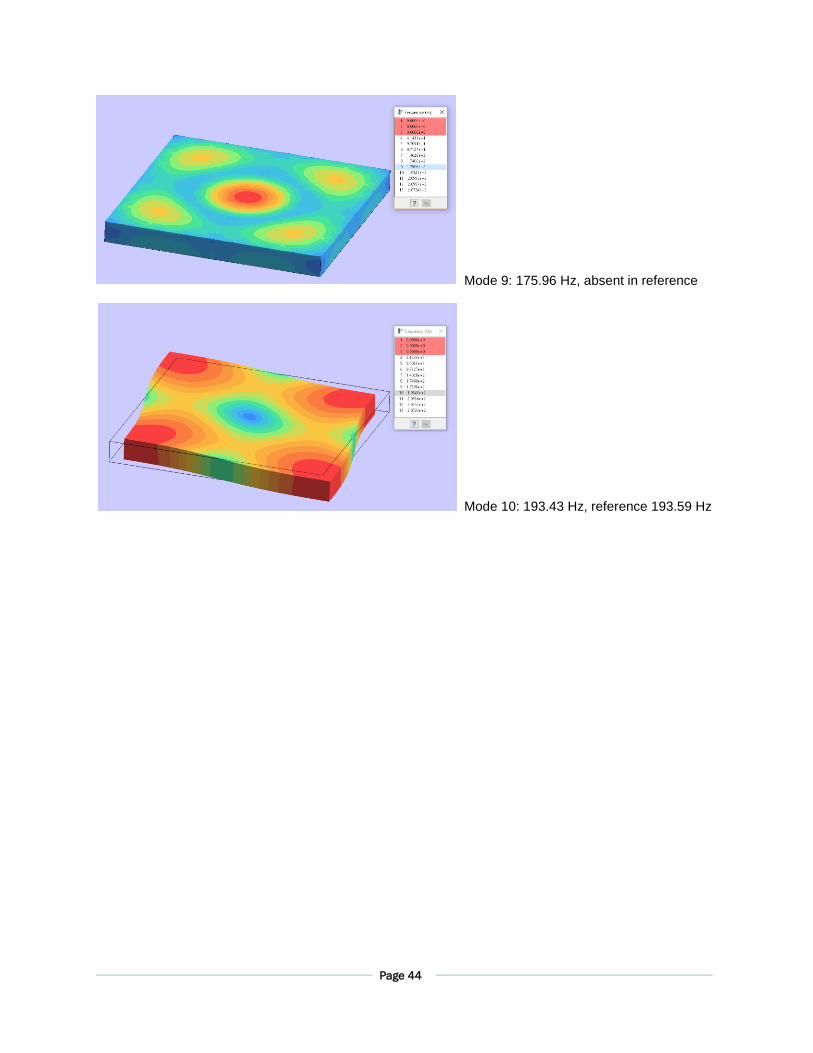
Mode 9: 175.96 Hz, absent in reference
Mode 10: 193.43 Hz, reference 193.59 Hz
Page 45
Test VM07: In-plane Vibration of a Pin-ended Cross
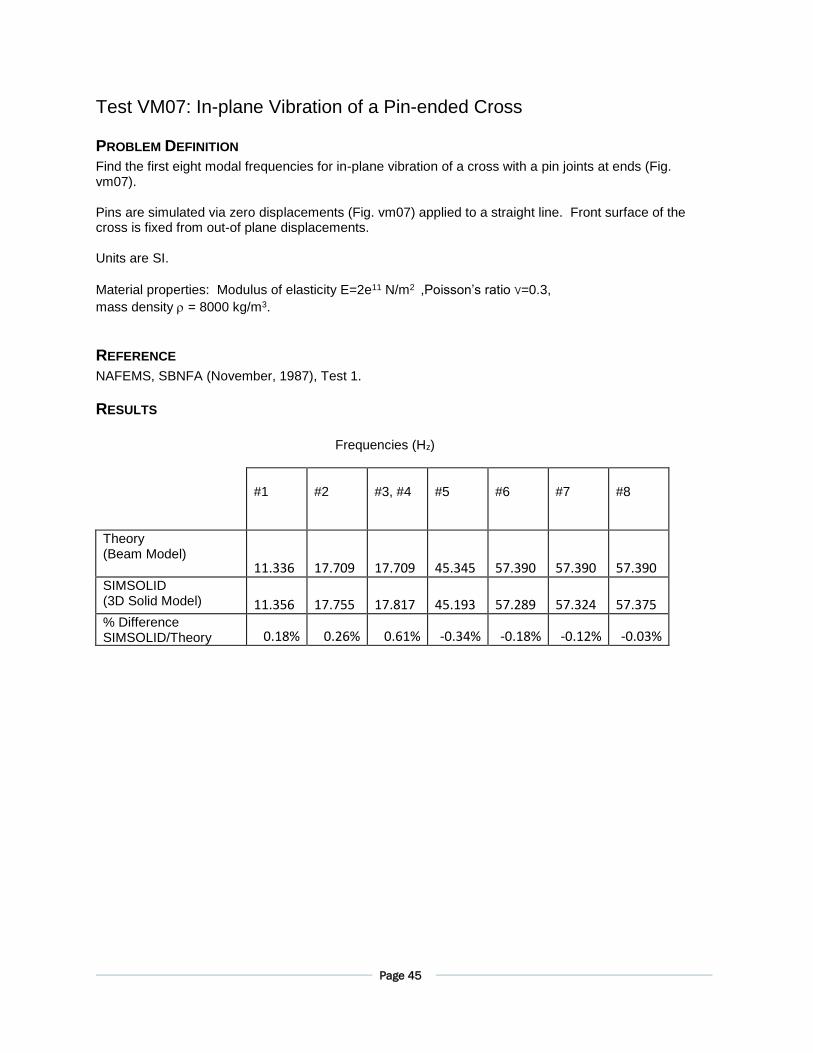
PROBLEM DEFINITION
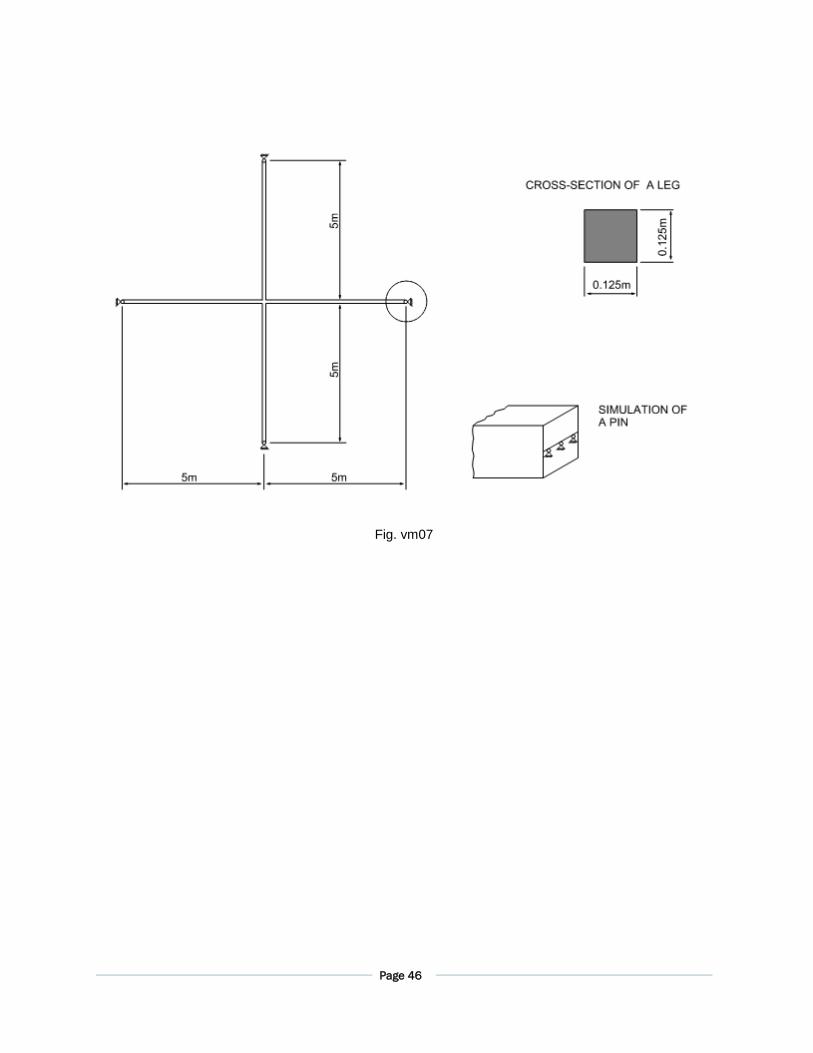
Find the first eight modal frequencies for in-plane vibration of a cross with a pin joints at ends (Fig. vm07). Pins are simulated via zero displacements (Fig. vm07) applied to a straight line. Front surface of the cross is fixed from out-of plane displacements. Units are SI.
Material properties: Modulus of elasticity E=2e11 N/m2 ,Poisson’s ratio ν=0.3,
mass density = 8000 kg/m3.
REFERENCE
NAFEMS, SBNFA (November, 1987), Test 1.
RESULTS
Frequencies (Hz)
#1
#2
#3, #4
#5
#6
#7
#8
Theory (Beam Model)
11.336
17.709
17.709
45.345
57.390
57.390
57.390
SIMSOLID (3D Solid Model)
11.356
17.755
17.817
45.193
57.289
57.324
57.375
% Difference SIMSOLID/Theory 0.18% 0.26% 0.61% -0.34% -0.18% -0.12% -0.03%
Page 46
Fig. vm07
Page 47
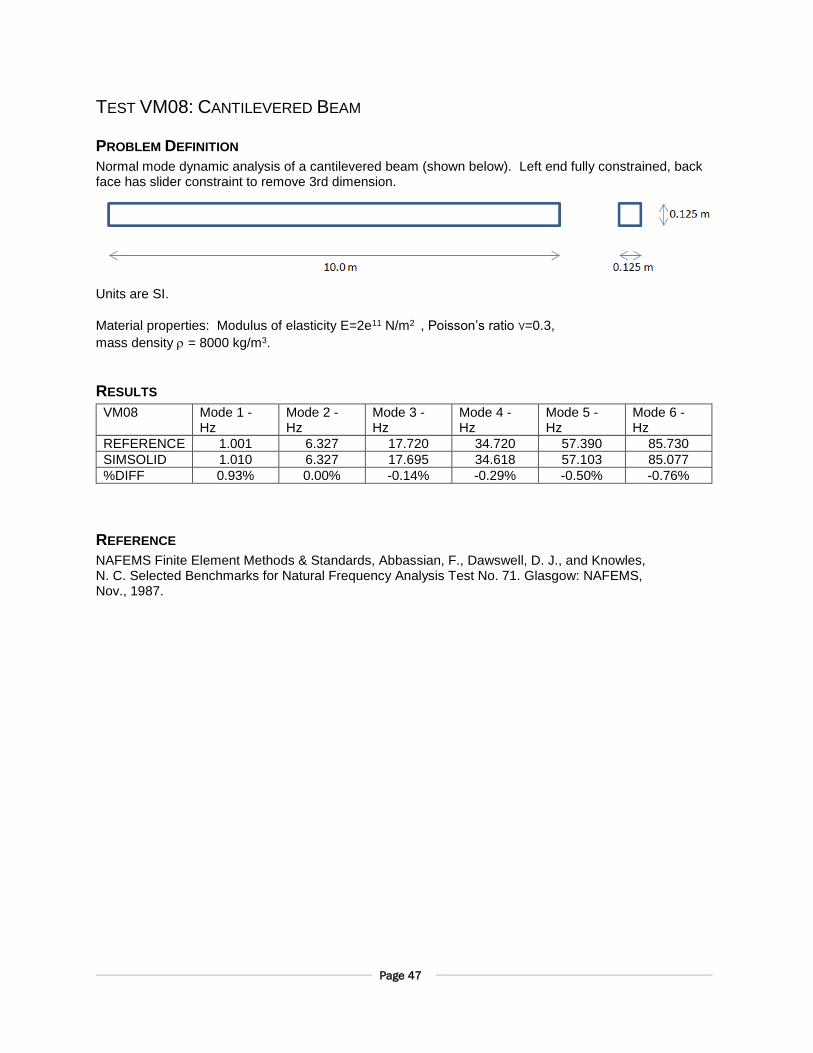
TEST VM08: CANTILEVERED BEAM
PROBLEM DEFINITION
Normal mode dynamic analysis of a cantilevered beam (shown below). Left end fully constrained, back face has slider constraint to remove 3rd dimension.
Units are SI.
Material properties: Modulus of elasticity E=2e11 N/m2 , Poisson’s ratio ν=0.3,
mass density = 8000 kg/m3.
RESULTS
VM08 Mode 1 - Hz
Mode 2 - Hz
Mode 3 - Hz
Mode 4 - Hz
Mode 5 - Hz
Mode 6 - Hz
REFERENCE 1.001 6.327 17.720 34.720 57.390 85.730
SIMSOLID 1.010 6.327 17.695 34.618 57.103 85.077
%DIFF 0.93% 0.00% -0.14% -0.29% -0.50% -0.76%
REFERENCE
NAFEMS Finite Element Methods & Standards, Abbassian, F., Dawswell, D. J., and Knowles, N. C. Selected Benchmarks for Natural Frequency Analysis Test No. 71. Glasgow: NAFEMS, Nov., 1987.
Page 48
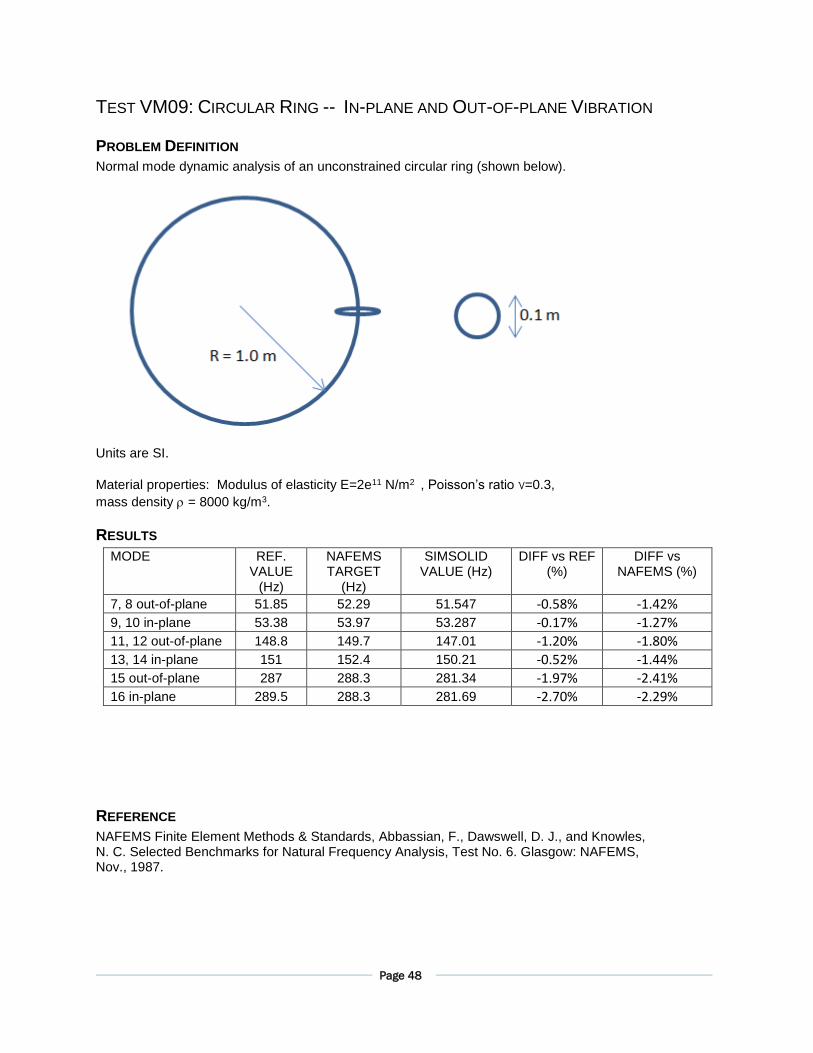
TEST VM09: CIRCULAR RING -- IN-PLANE AND OUT-OF-PLANE VIBRATION
PROBLEM DEFINITION
Normal mode dynamic analysis of an unconstrained circular ring (shown below).
Units are SI.
Material properties: Modulus of elasticity E=2e11 N/m2 , Poisson’s ratio ν=0.3,
mass density = 8000 kg/m3.
RESULTS
MODE REF. VALUE
(Hz)
NAFEMS TARGET
(Hz)
SIMSOLID VALUE (Hz)
DIFF vs REF (%)
DIFF vs NAFEMS (%)
7, 8 out-of-plane 51.85 52.29 51.547 -0.58% -1.42%
9, 10 in-plane 53.38 53.97 53.287 -0.17% -1.27% 11, 12 out-of-plane 148.8 149.7 147.01 -1.20% -1.80%
13, 14 in-plane 151 152.4 150.21 -0.52% -1.44% 15 out-of-plane 287 288.3 281.34 -1.97% -2.41% 16 in-plane 289.5 288.3 281.69 -2.70% -2.29%
REFERENCE
NAFEMS Finite Element Methods & Standards, Abbassian, F., Dawswell, D. J., and Knowles, N. C. Selected Benchmarks for Natural Frequency Analysis, Test No. 6. Glasgow: NAFEMS, Nov., 1987.
Page 49
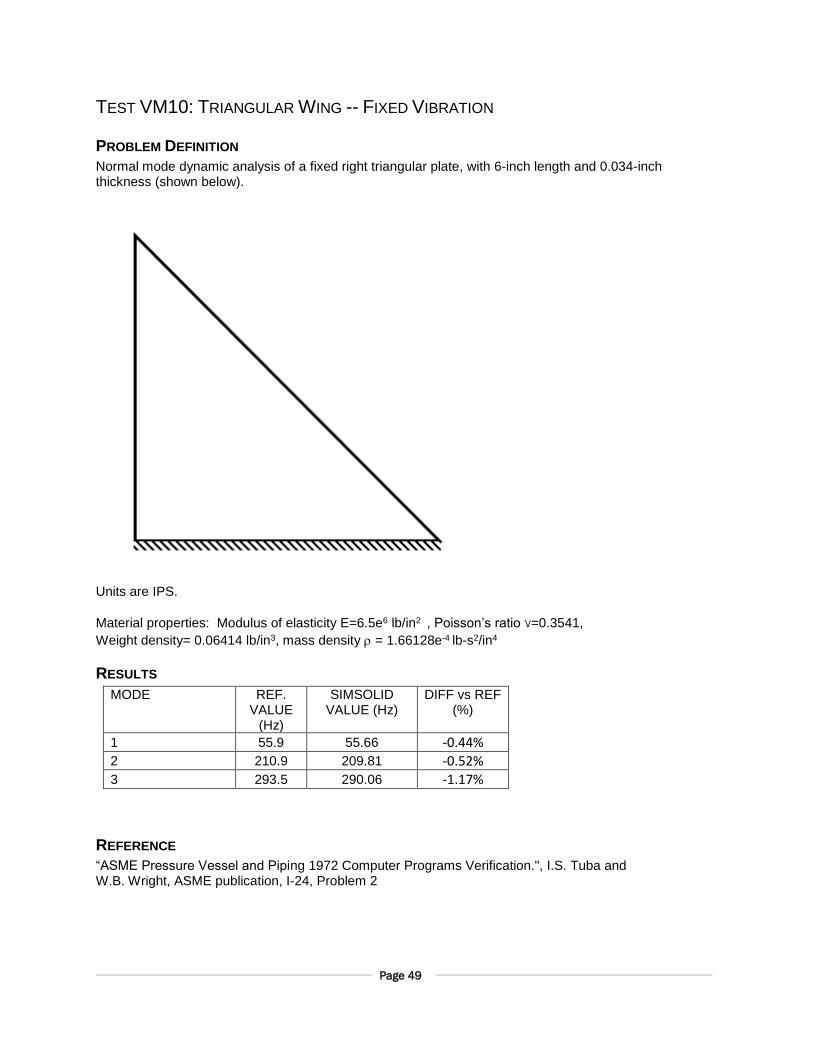
TEST VM10: TRIANGULAR WING -- FIXED VIBRATION
PROBLEM DEFINITION
Normal mode dynamic analysis of a fixed right triangular plate, with 6-inch length and 0.034-inch thickness (shown below).
Units are IPS.
Material properties: Modulus of elasticity E=6.5e6 lb/in2 , Poisson’s ratio ν=0.3541,
Weight density= 0.06414 lb/in3, mass density = 1.66128e-4 lb-s2/in4
RESULTS
MODE REF. VALUE
(Hz)
SIMSOLID VALUE (Hz)
DIFF vs REF (%)
1 55.9 55.66 -0.44% 2 210.9 209.81 -0.52%
3 293.5 290.06 -1.17%
REFERENCE
“ASME Pressure Vessel and Piping 1972 Computer Programs Verification.", I.S. Tuba and W.B. Wright, ASME publication, I-24, Problem 2
Page 50
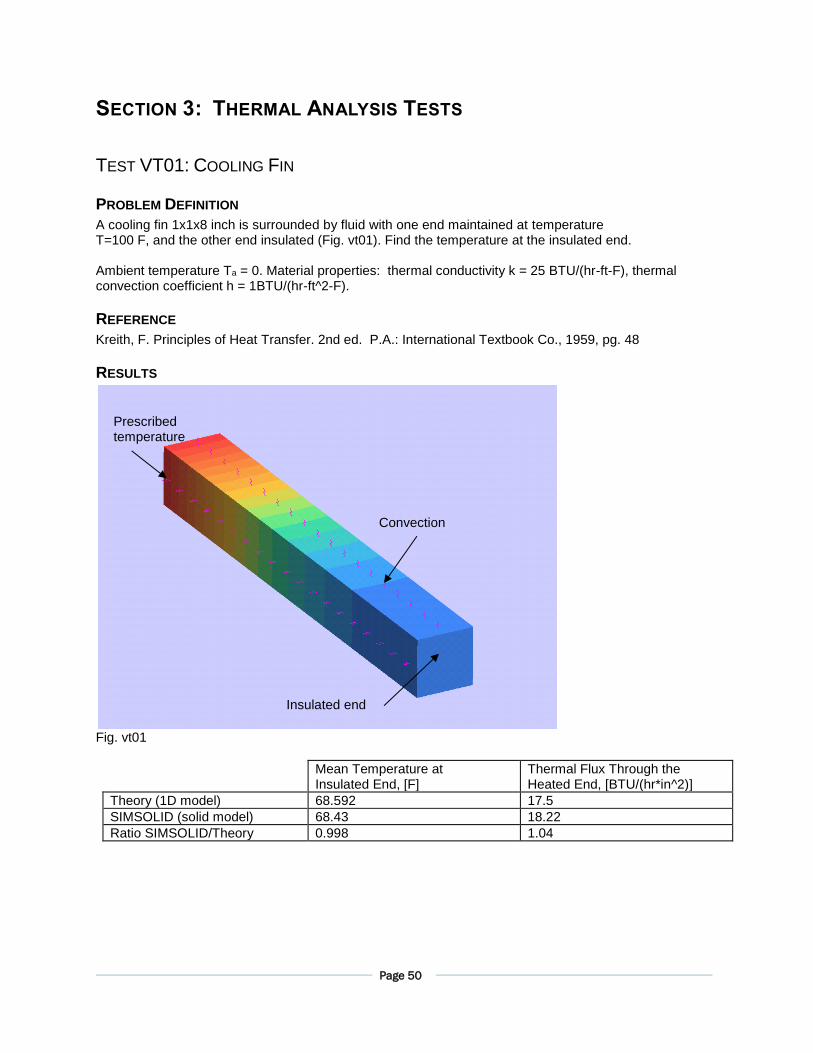
SECTION 3: THERMAL ANALYSIS TESTS
TEST VT01: COOLING FIN
PROBLEM DEFINITION
A cooling fin 1x1x8 inch is surrounded by fluid with one end maintained at temperature T=100 F, and the other end insulated (Fig. vt01). Find the temperature at the insulated end. Ambient temperature Ta = 0. Material properties: thermal conductivity k = 25 BTU/(hr-ft-F), thermal convection coefficient h = 1BTU/(hr-ft^2-F).
REFERENCE
Kreith, F. Principles of Heat Transfer. 2nd ed. P.A.: International Textbook Co., 1959, pg. 48
RESULTS
Fig. vt01
Mean Temperature at Insulated End, [F]
Thermal Flux Through the Heated End, [BTU/(hr*in^2)]
Theory (1D model) 68.592 17.5
SIMSOLID (solid model) 68.43 18.22
Ratio SIMSOLID/Theory 0.998 1.04
Prescribed temperature
Insulated end
Convection
Page 51
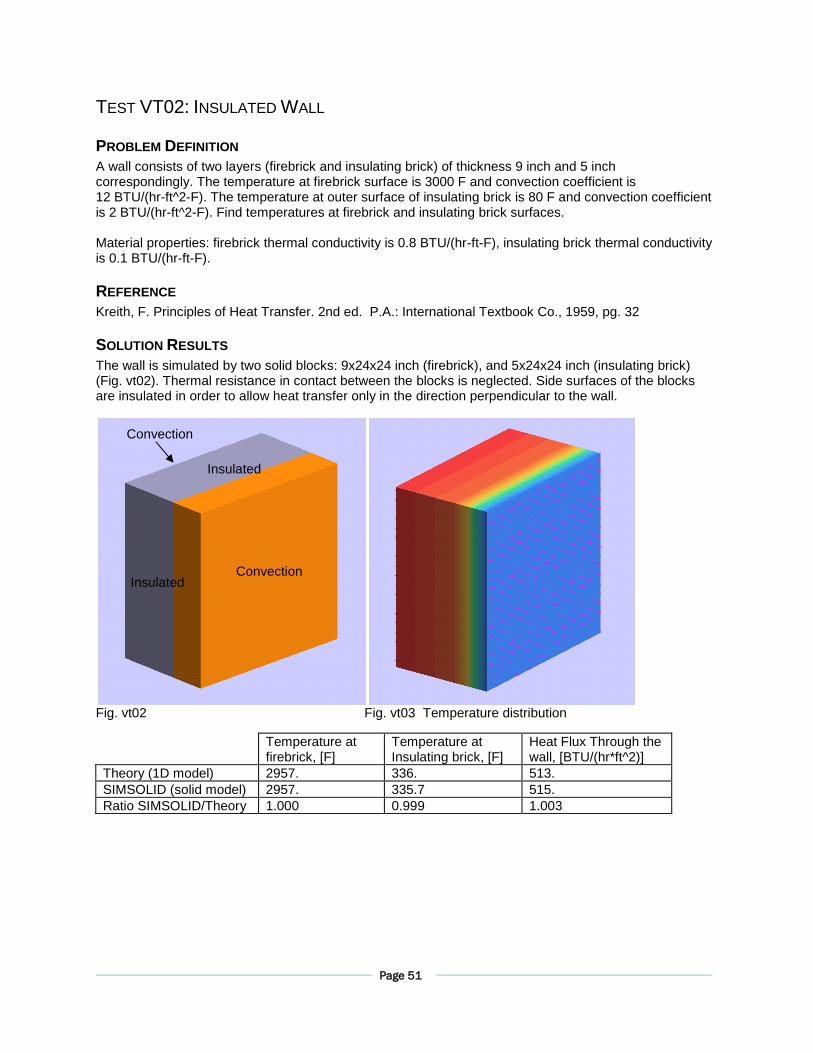
TEST VT02: INSULATED WALL
PROBLEM DEFINITION
A wall consists of two layers (firebrick and insulating brick) of thickness 9 inch and 5 inch correspondingly. The temperature at firebrick surface is 3000 F and convection coefficient is 12 BTU/(hr-ft^2-F). The temperature at outer surface of insulating brick is 80 F and convection coefficient is 2 BTU/(hr-ft^2-F). Find temperatures at firebrick and insulating brick surfaces. Material properties: firebrick thermal conductivity is 0.8 BTU/(hr-ft-F), insulating brick thermal conductivity is 0.1 BTU/(hr-ft-F).
REFERENCE
Kreith, F. Principles of Heat Transfer. 2nd ed. P.A.: International Textbook Co., 1959, pg. 32
SOLUTION RESULTS
The wall is simulated by two solid blocks: 9x24x24 inch (firebrick), and 5x24x24 inch (insulating brick) (Fig. vt02). Thermal resistance in contact between the blocks is neglected. Side surfaces of the blocks are insulated in order to allow heat transfer only in the direction perpendicular to the wall.
Fig. vt02 Fig. vt03 Temperature distribution
Temperature at
firebrick, [F] Temperature at Insulating brick, [F]
Heat Flux Through the wall, [BTU/(hr*ft^2)]
Theory (1D model) 2957. 336. 513.
SIMSOLID (solid model) 2957. 335.7 515.
Ratio SIMSOLID/Theory 1.000 0.999 1.003
Convection
Convection
Insulated
Insulated
Page 52
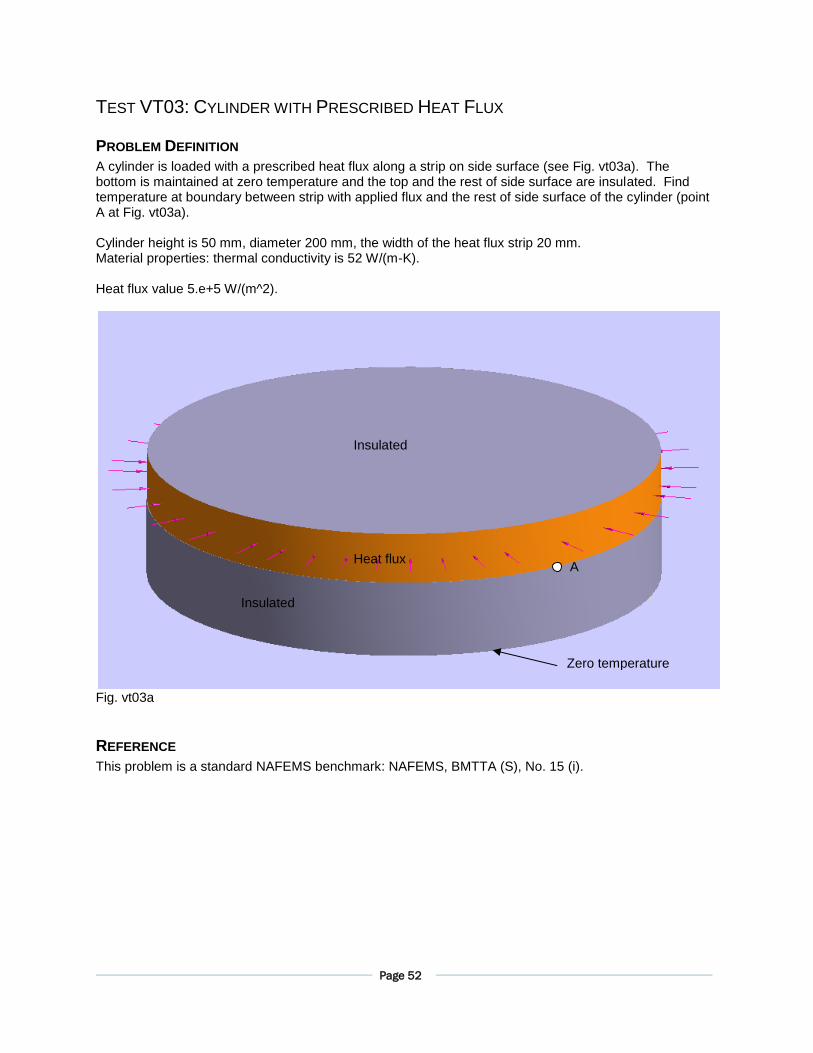
TEST VT03: CYLINDER WITH PRESCRIBED HEAT FLUX
PROBLEM DEFINITION
A cylinder is loaded with a prescribed heat flux along a strip on side surface (see Fig. vt03a). The bottom is maintained at zero temperature and the top and the rest of side surface are insulated. Find temperature at boundary between strip with applied flux and the rest of side surface of the cylinder (point A at Fig. vt03a). Cylinder height is 50 mm, diameter 200 mm, the width of the heat flux strip 20 mm. Material properties: thermal conductivity is 52 W/(m-K). Heat flux value 5.e+5 W/(m^2).
Fig. vt03a
REFERENCE
This problem is a standard NAFEMS benchmark: NAFEMS, BMTTA (S), No. 15 (i).
Insulated
Insulated
Heat flux
Zero temperature
A
Page 53
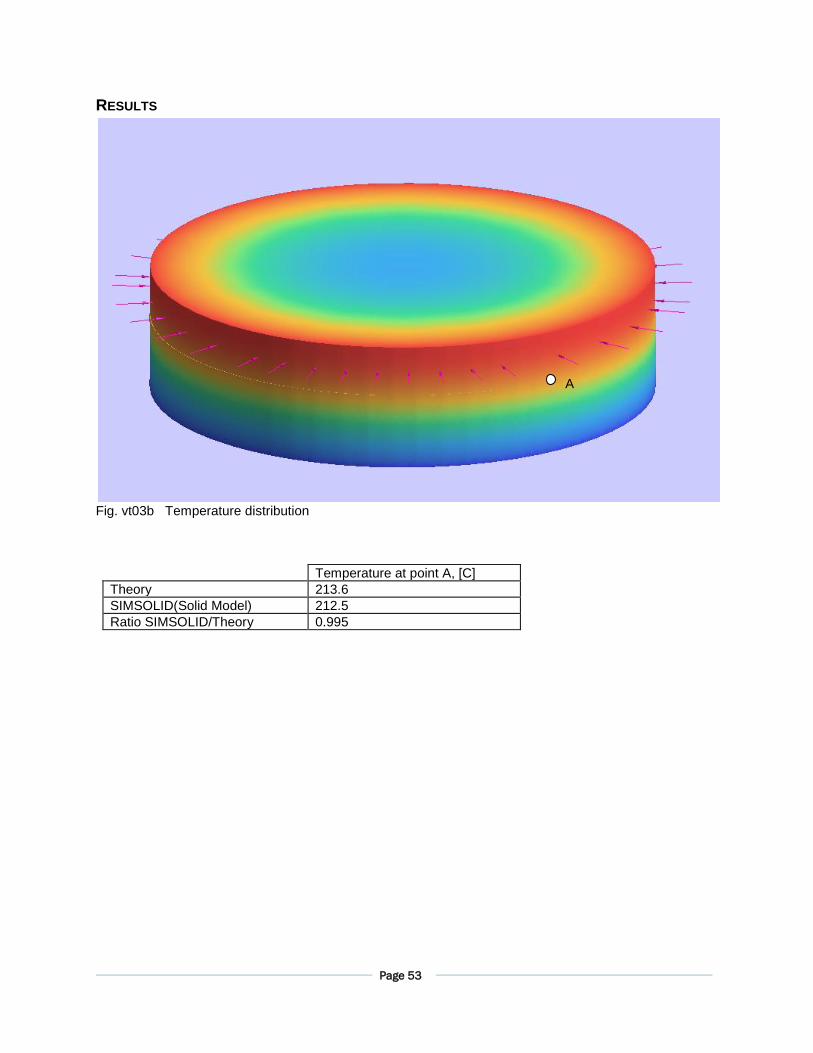
RESULTS
Fig. vt03b Temperature distribution
Temperature at point A, [C]
Theory 213.6
SIMSOLID(Solid Model) 212.5
Ratio SIMSOLID/Theory 0.995
A
Page 54
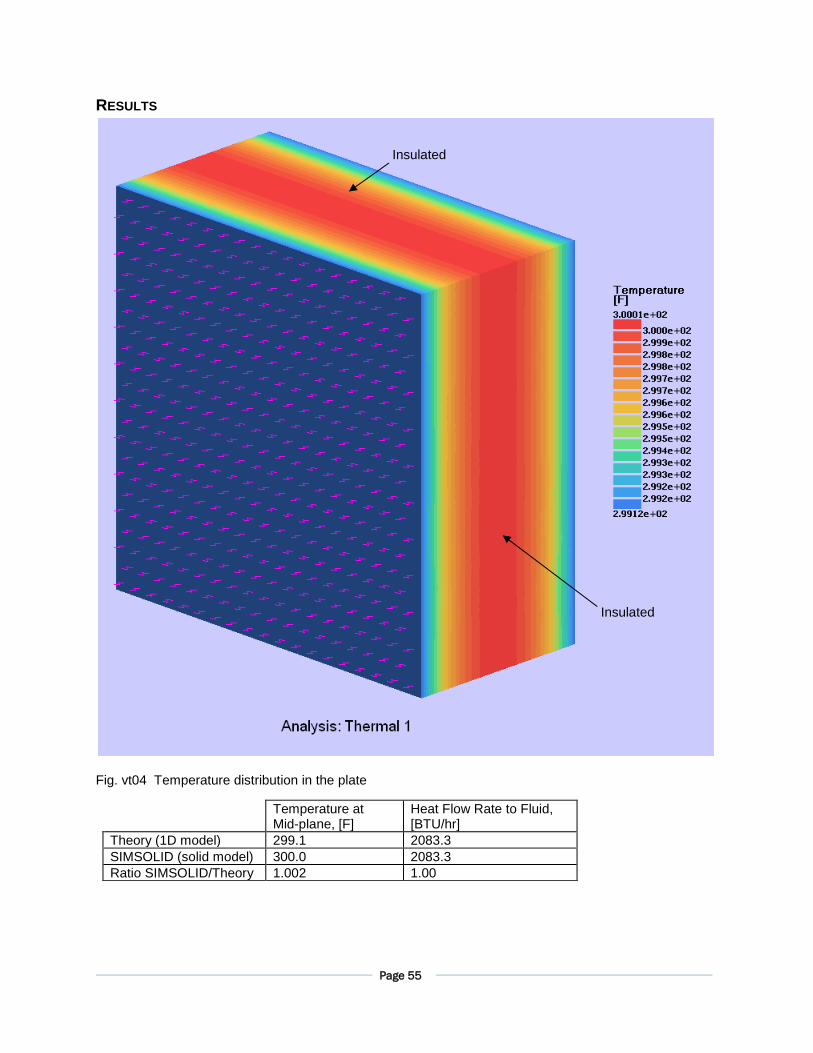
TEST VT04: HEAT GENERATING PLATE
PROBLEM DEFINITION
A fluid is heated by a steel plate (Fig. vt04). Heat is uniformly generated in the plate volume. Find temperature in the plate mid-plane and heat flow rate to the fluid. A piece of plate is simulated by a 1x1x0.5 inch solid. Side surfaces of the solid are insulated in order to allow heat transfer only in the direction perpendicular to the plate surface. Plate material thermal conductivity is 25 BTU/(hr-ft-F), surface convection coefficient is 13.969738 BTU/(hr-ft^2-F), fluid temperature is 150 F, volume heat generation rate is 1.e+5 BTU/(hr-ft^3).
REFERENCE
Kreith, F. Principles of Heat Transfer. 2nd ed. P.A.: International Textbook Co., 1959, pg. 42, ex. 2-9
Page 55
RESULTS
Fig. vt04 Temperature distribution in the plate
Temperature at Mid-plane, [F]
Heat Flow Rate to Fluid, [BTU/hr]
Theory (1D model) 299.1 2083.3
SIMSOLID (solid model) 300.0 2083.3
Ratio SIMSOLID/Theory 1.002 1.00
Insulated
Insulated
Page 56
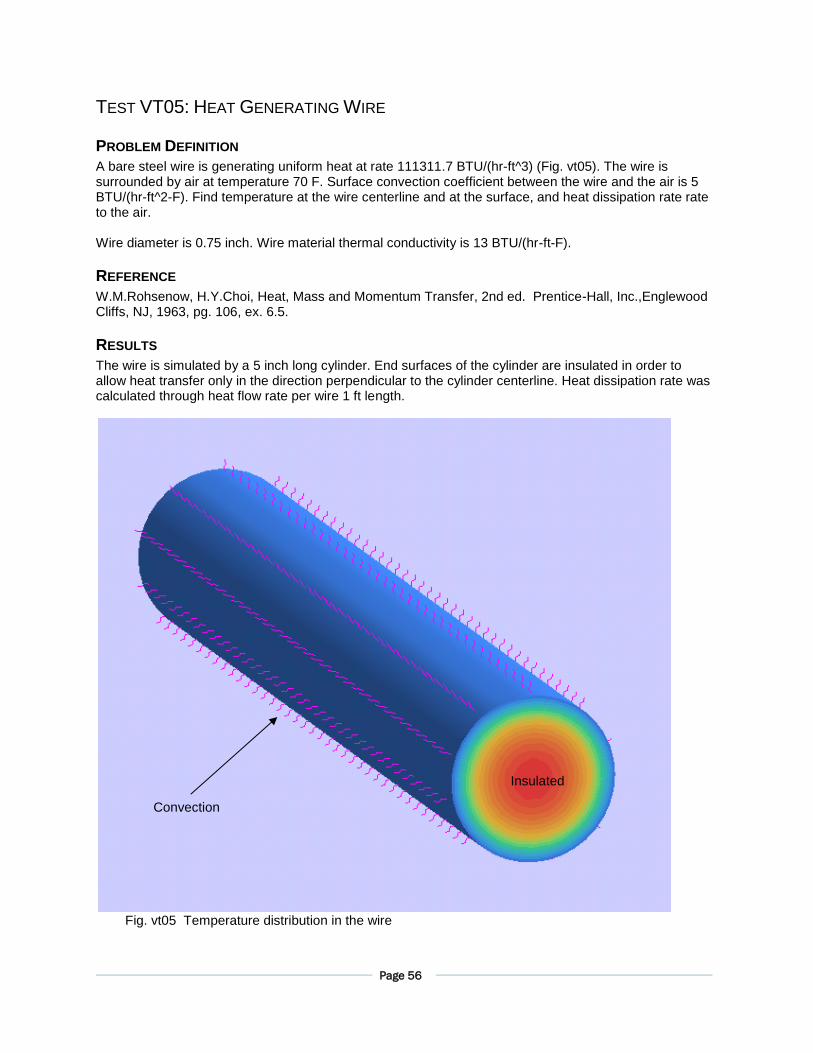
TEST VT05: HEAT GENERATING WIRE
PROBLEM DEFINITION
A bare steel wire is generating uniform heat at rate 111311.7 BTU/(hr-ft^3) (Fig. vt05). The wire is surrounded by air at temperature 70 F. Surface convection coefficient between the wire and the air is 5 BTU/(hr-ft^2-F). Find temperature at the wire centerline and at the surface, and heat dissipation rate rate to the air. Wire diameter is 0.75 inch. Wire material thermal conductivity is 13 BTU/(hr-ft-F).
REFERENCE
W.M.Rohsenow, H.Y.Choi, Heat, Mass and Momentum Transfer, 2nd ed. Prentice-Hall, Inc.,Englewood Cliffs, NJ, 1963, pg. 106, ex. 6.5.
RESULTS
The wire is simulated by a 5 inch long cylinder. End surfaces of the cylinder are insulated in order to allow heat transfer only in the direction perpendicular to the cylinder centerline. Heat dissipation rate was calculated through heat flow rate per wire 1 ft length.
Fig. vt05 Temperature distribution in the wire
Insulated
Convection

Page 57
Temperature at Centerline, [F]
Temperature at Surface, [F]
Heat Dissipation Rate, [BTU/hr]
Theory (1D model) 419.9 417.9 341.5
SIMSOLID (solid model)
418.6 416.5 341.2
Ratio SIMSOLID/Theory
0.997 0.997 0.998
Page 58
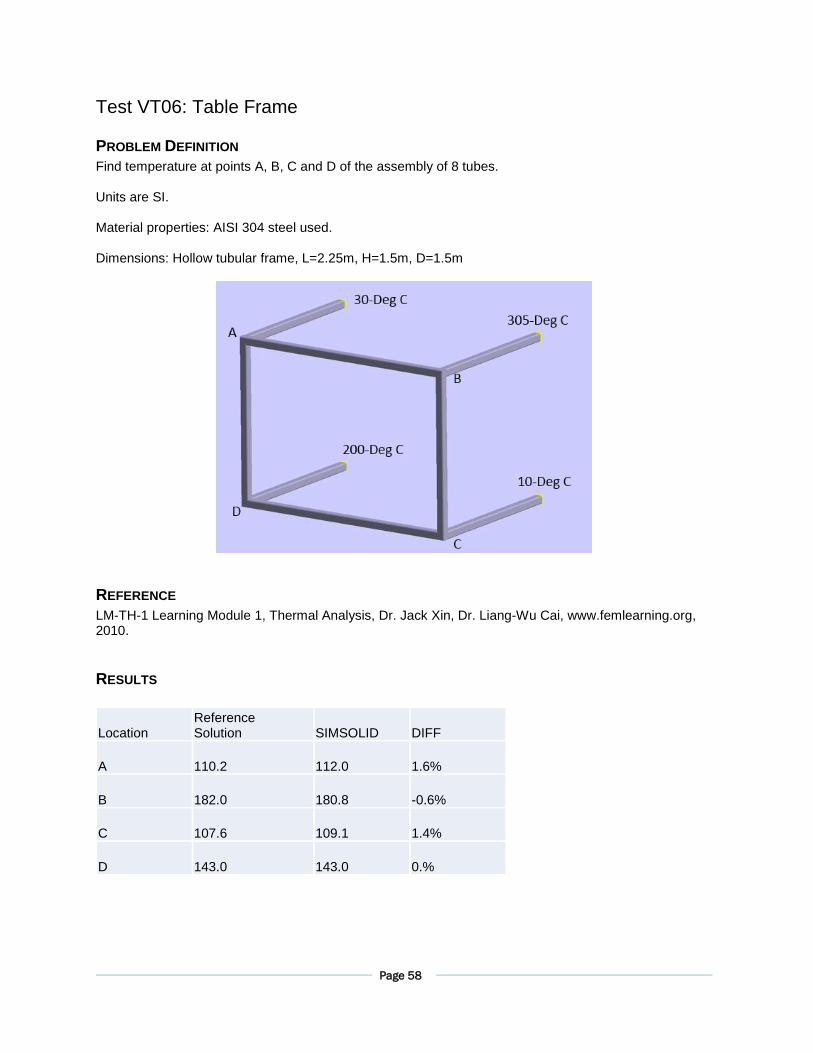
Test VT06: Table Frame
PROBLEM DEFINITION
Find temperature at points A, B, C and D of the assembly of 8 tubes. Units are SI. Material properties: AISI 304 steel used. Dimensions: Hollow tubular frame, L=2.25m, H=1.5m, D=1.5m
REFERENCE
LM-TH-1 Learning Module 1, Thermal Analysis, Dr. Jack Xin, Dr. Liang-Wu Cai, www.femlearning.org, 2010.
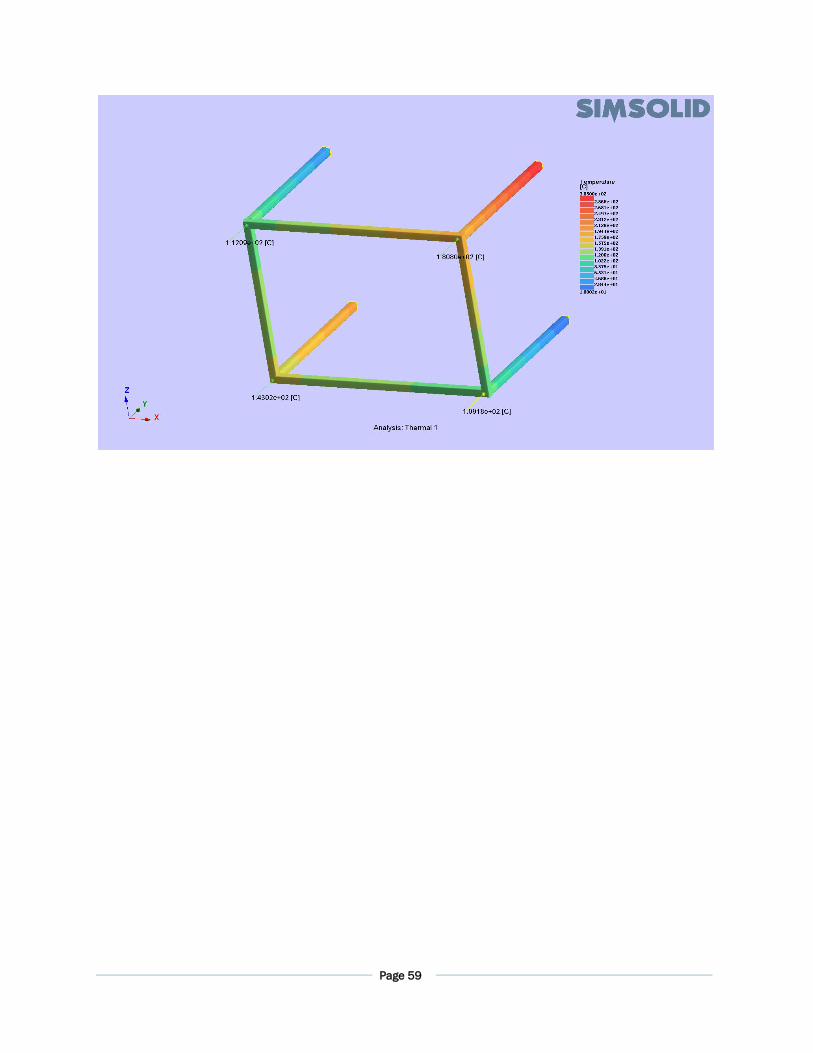
RESULTS
Location Reference Solution SIMSOLID DIFF
A 110.2 112.0
1.6%
B 182.0 180.8
-0.6%
C 107.6 109.1
1.4%
D 143.0 143.0
0.%
Page 59
Page 60
SECTION 4: THERMAL LOADING TESTS
TEST VTL01: THERMALLY LOADED SUPPORT STRUCTURE
PROBLEM DEFINITION
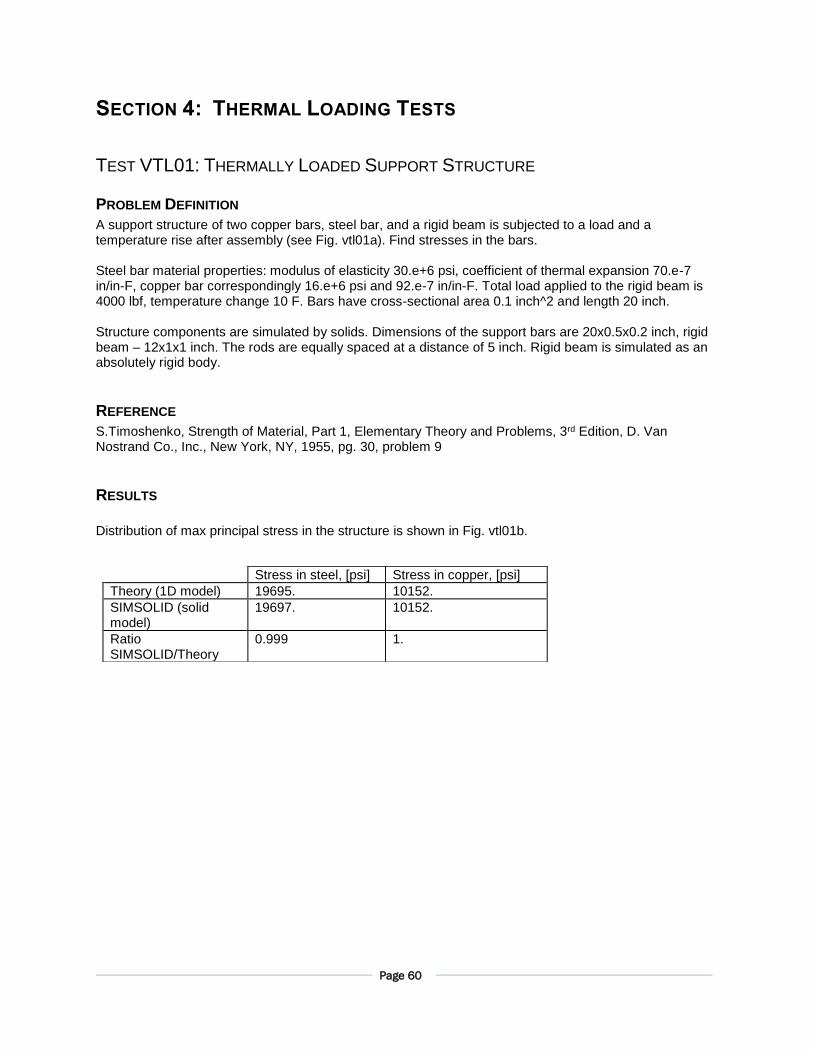
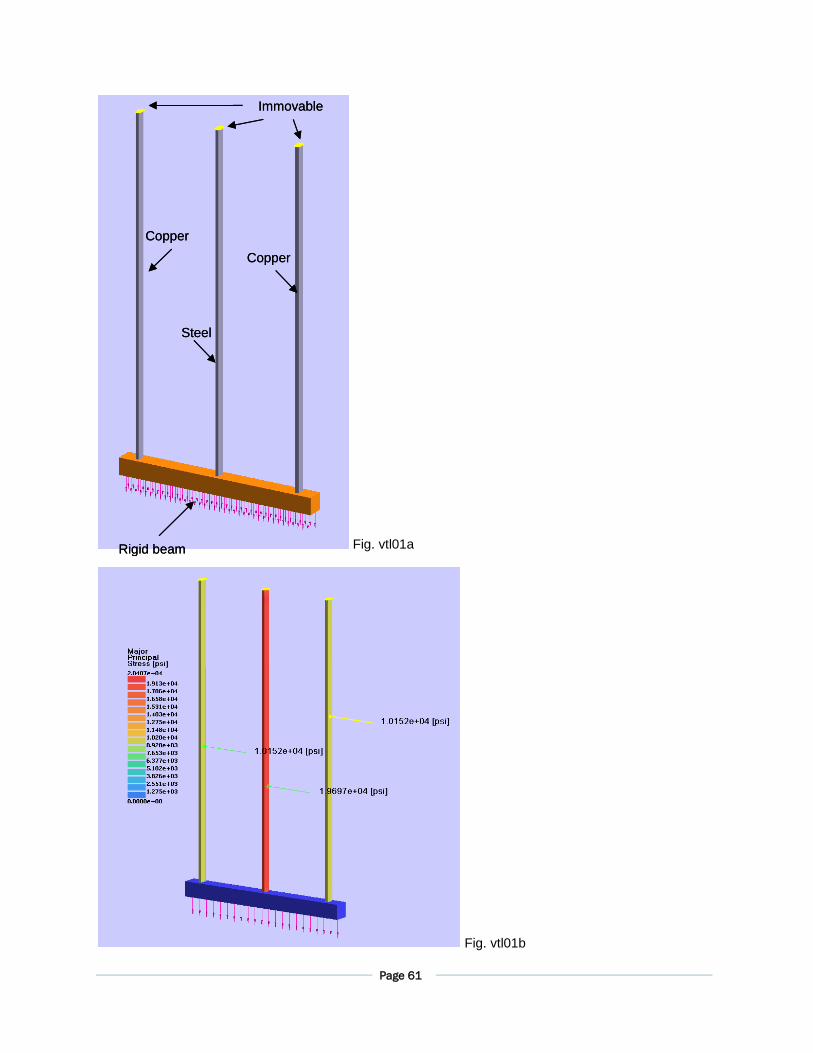
A support structure of two copper bars, steel bar, and a rigid beam is subjected to a load and a temperature rise after assembly (see Fig. vtl01a). Find stresses in the bars. Steel bar material properties: modulus of elasticity 30.e+6 psi, coefficient of thermal expansion 70.e-7 in/in-F, copper bar correspondingly 16.e+6 psi and 92.e-7 in/in-F. Total load applied to the rigid beam is 4000 lbf, temperature change 10 F. Bars have cross-sectional area 0.1 inch^2 and length 20 inch. Structure components are simulated by solids. Dimensions of the support bars are 20x0.5x0.2 inch, rigid beam – 12x1x1 inch. The rods are equally spaced at a distance of 5 inch. Rigid beam is simulated as an absolutely rigid body.
REFERENCE
S.Timoshenko, Strength of Material, Part 1, Elementary Theory and Problems, 3rd Edition, D. Van Nostrand Co., Inc., New York, NY, 1955, pg. 30, problem 9
RESULTS
Distribution of max principal stress in the structure is shown in Fig. vtl01b.
Stress in steel, [psi] Stress in copper, [psi]
Theory (1D model) 19695. 10152.
SIMSOLID (solid model)
19697. 10152.
Ratio SIMSOLID/Theory
0.999 1.
Page 61
Fig. vtl01a
Fig. vtl01b
Immovable
Copper
Steel
Copper
Rigid beam
Immovable
Copper
Steel
Copper
Rigid beam
Page 62
TEST VTL02: BIMETALLIC CANTILEVER BEAM UNDER THERMAL LOADING
PROBLEM DEFINITION
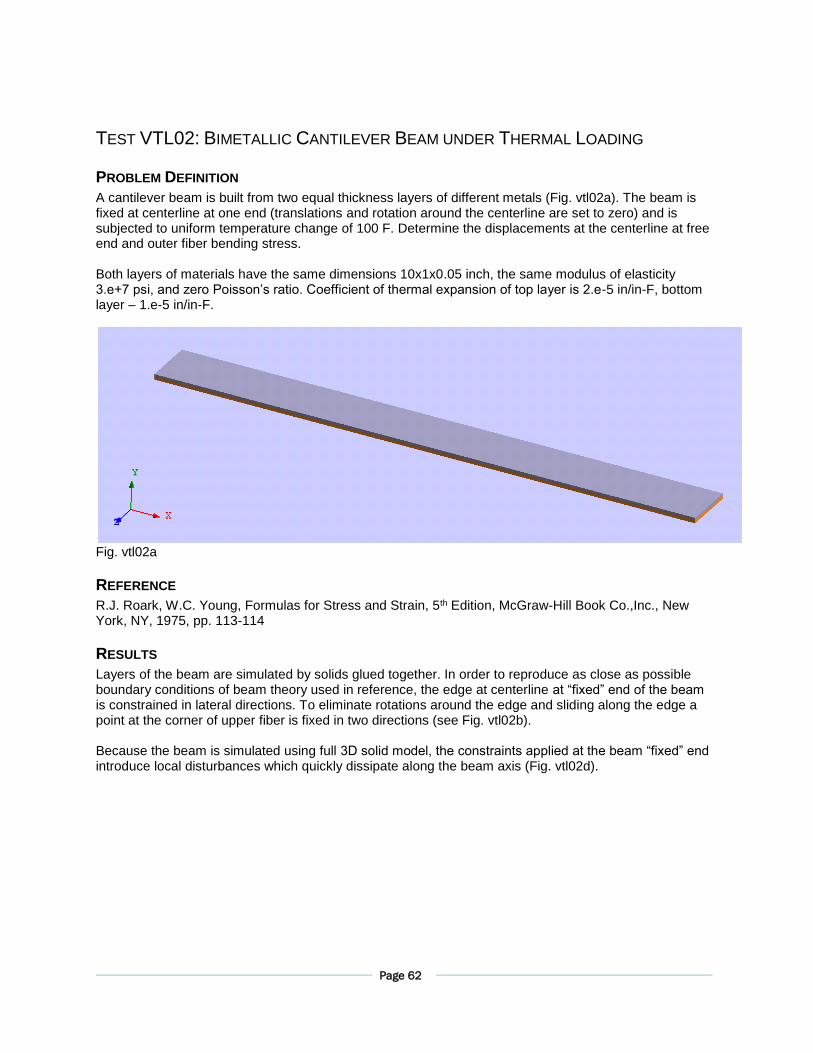
A cantilever beam is built from two equal thickness layers of different metals (Fig. vtl02a). The beam is fixed at centerline at one end (translations and rotation around the centerline are set to zero) and is subjected to uniform temperature change of 100 F. Determine the displacements at the centerline at free end and outer fiber bending stress. Both layers of materials have the same dimensions 10x1x0.05 inch, the same modulus of elasticity 3.e+7 psi, and zero Poisson’s ratio. Coefficient of thermal expansion of top layer is 2.e-5 in/in-F, bottom layer – 1.e-5 in/in-F.
Fig. vtl02a
REFERENCE
R.J. Roark, W.C. Young, Formulas for Stress and Strain, 5th Edition, McGraw-Hill Book Co.,Inc., New York, NY, 1975, pp. 113-114
RESULTS
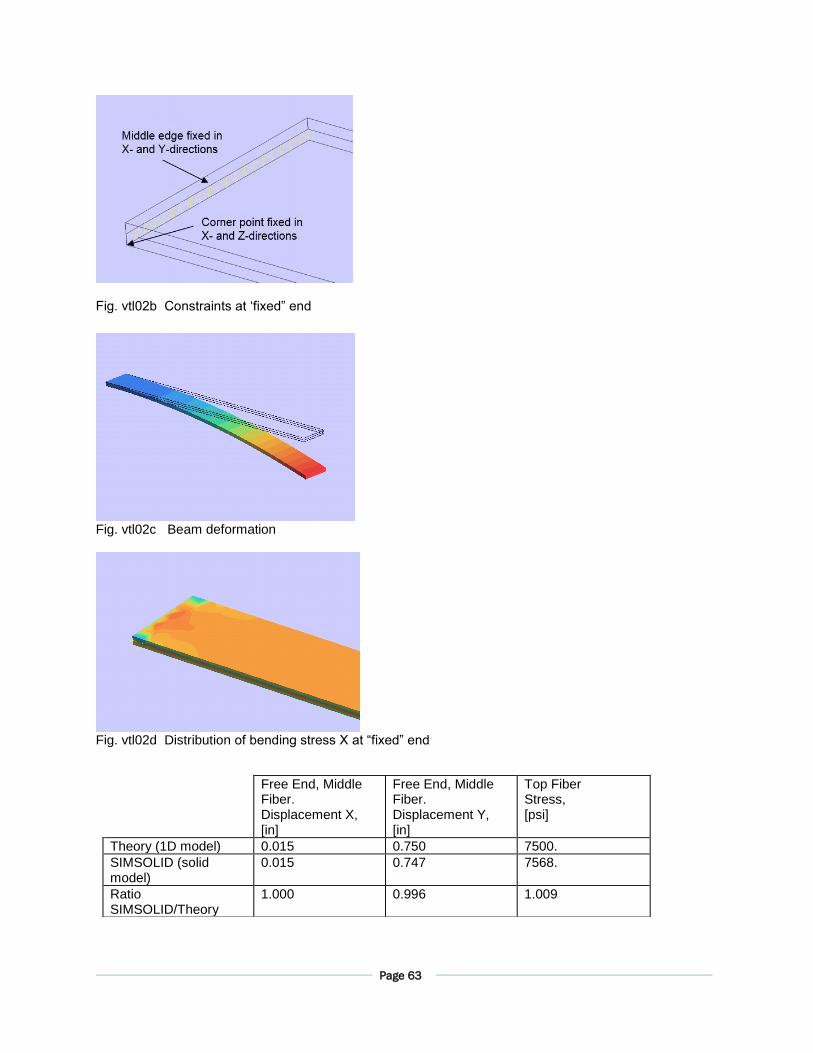
Layers of the beam are simulated by solids glued together. In order to reproduce as close as possible boundary conditions of beam theory used in reference, the edge at centerline at “fixed” end of the beam is constrained in lateral directions. To eliminate rotations around the edge and sliding along the edge a point at the corner of upper fiber is fixed in two directions (see Fig. vtl02b). Because the beam is simulated using full 3D solid model, the constraints applied at the beam “fixed” end introduce local disturbances which quickly dissipate along the beam axis (Fig. vtl02d).
Page 63
Fig. vtl02b Constraints at ‘fixed” end
Fig. vtl02c Beam deformation
Fig. vtl02d Distribution of bending stress X at “fixed” end
Free End, Middle
Fiber. Displacement X, [in]
Free End, Middle Fiber. Displacement Y, [in]
Top Fiber Stress, [psi]
Theory (1D model) 0.015 0.750 7500.
SIMSOLID (solid model)
0.015 0.747 7568.
Ratio SIMSOLID/Theory
1.000 0.996 1.009
Page 64
TEST VTL03: COUPLED THERMAL-STRUCTURAL ANALYSIS - CONSTRAINED
STRAIGHT BAR UNDER UNIFORM TEMPERATURE
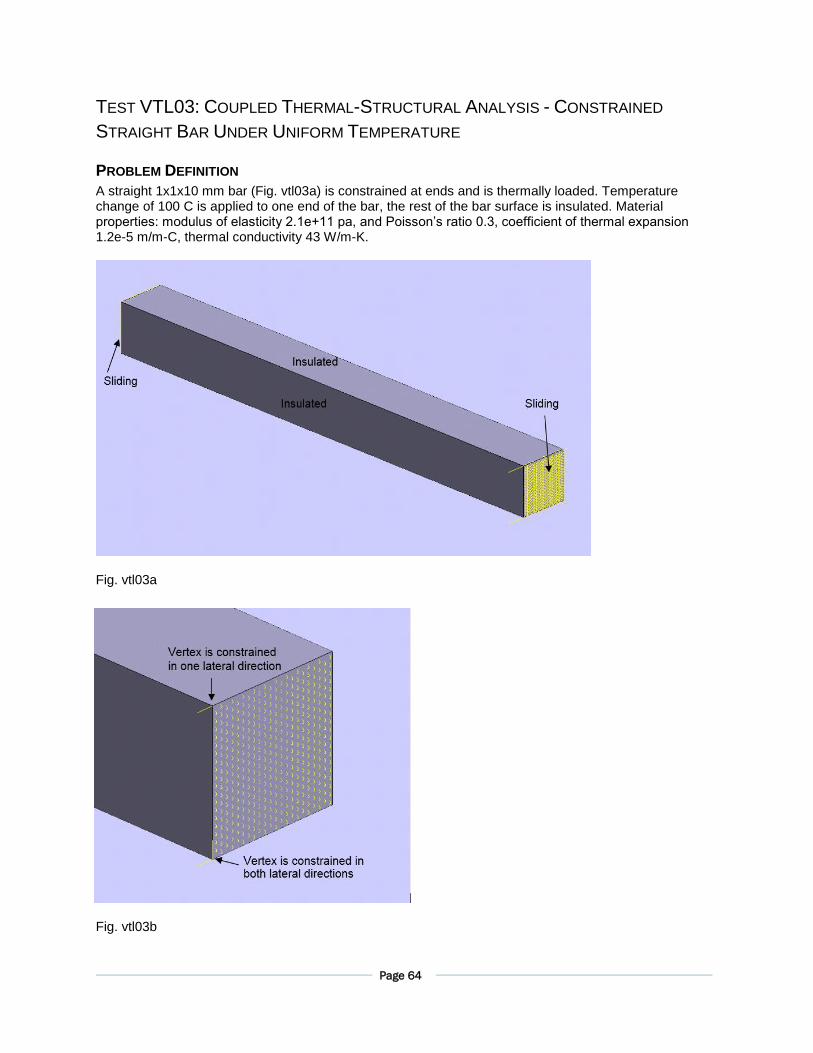
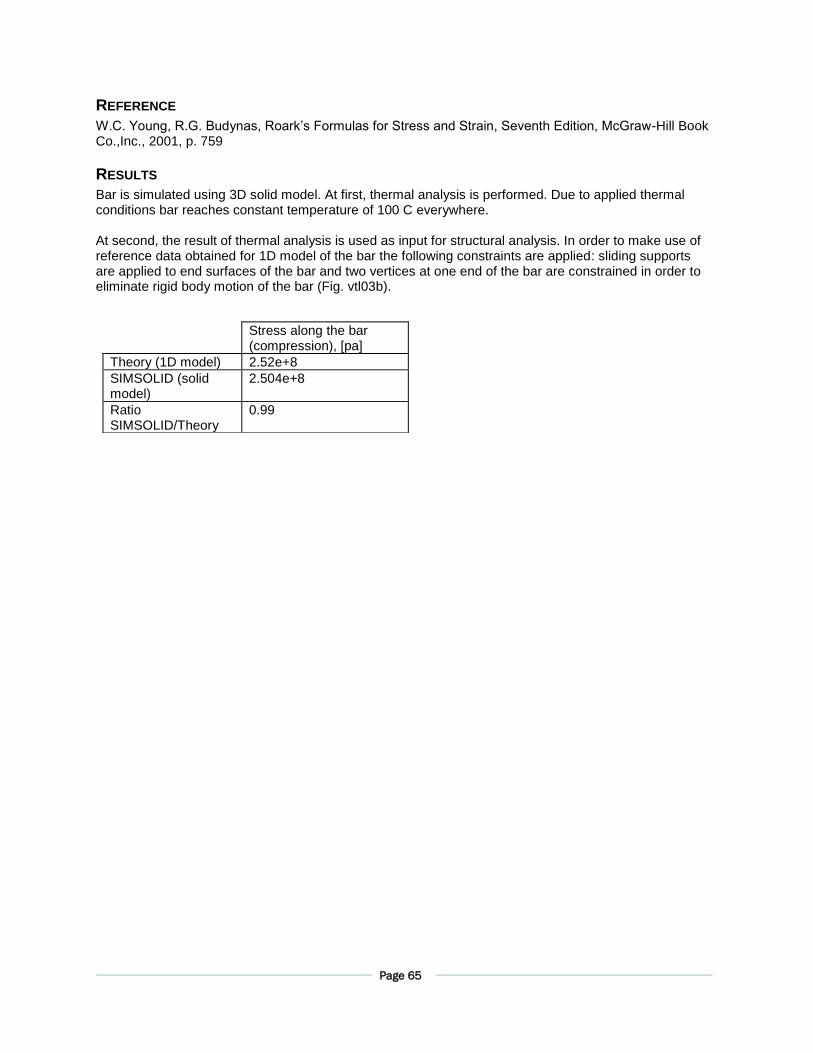
PROBLEM DEFINITION
A straight 1x1x10 mm bar (Fig. vtl03a) is constrained at ends and is thermally loaded. Temperature change of 100 C is applied to one end of the bar, the rest of the bar surface is insulated. Material properties: modulus of elasticity 2.1e+11 pa, and Poisson’s ratio 0.3, coefficient of thermal expansion 1.2e-5 m/m-C, thermal conductivity 43 W/m-K.
Fig. vtl03a
Fig. vtl03b
Page 65
REFERENCE
W.C. Young, R.G. Budynas, Roark’s Formulas for Stress and Strain, Seventh Edition, McGraw-Hill Book Co.,Inc., 2001, p. 759
RESULTS
Bar is simulated using 3D solid model. At first, thermal analysis is performed. Due to applied thermal conditions bar reaches constant temperature of 100 C everywhere. At second, the result of thermal analysis is used as input for structural analysis. In order to make use of reference data obtained for 1D model of the bar the following constraints are applied: sliding supports are applied to end surfaces of the bar and two vertices at one end of the bar are constrained in order to eliminate rigid body motion of the bar (Fig. vtl03b).
Stress along the bar (compression), [pa]
Theory (1D model) 2.52e+8
SIMSOLID (solid model)
2.504e+8
Ratio SIMSOLID/Theory
0.99
Page 66
TEST VTL04: COUPLED THERMAL-STRUCTURAL ANALYSIS - CONSTRAINED
STRAIGHT BAR UNDER LINEAR TEMPERATURE FIELD
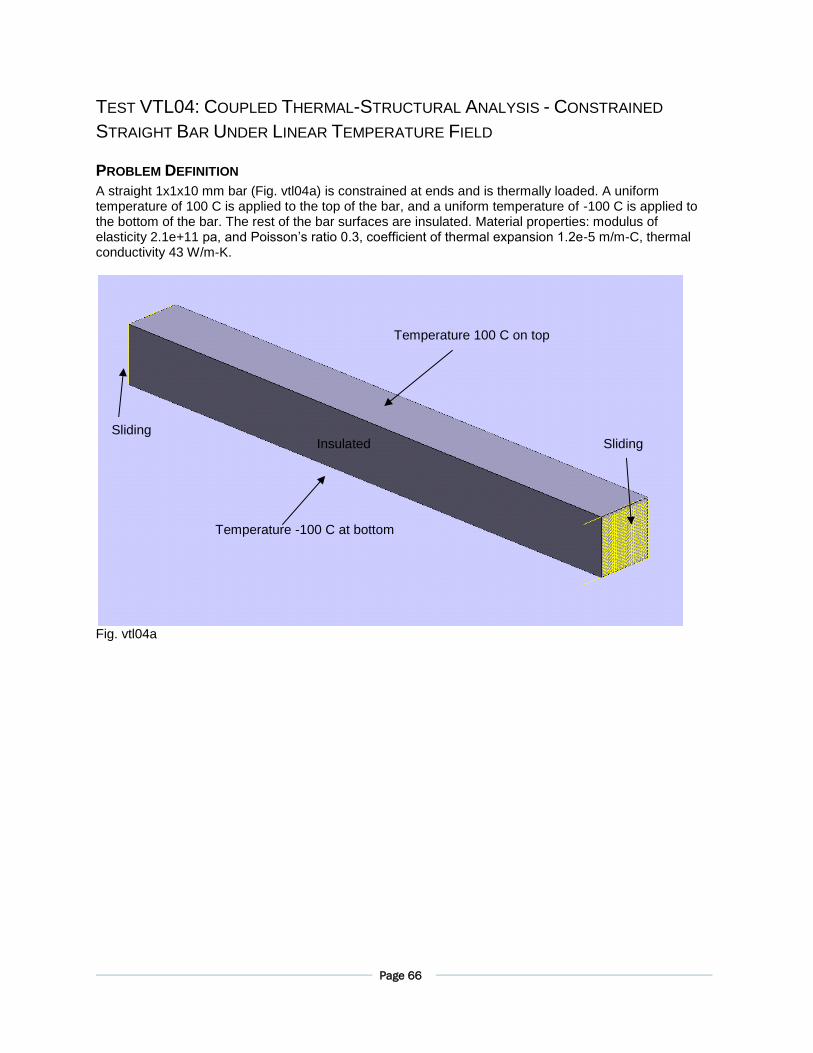
PROBLEM DEFINITION
A straight 1x1x10 mm bar (Fig. vtl04a) is constrained at ends and is thermally loaded. A uniform temperature of 100 C is applied to the top of the bar, and a uniform temperature of -100 C is applied to the bottom of the bar. The rest of the bar surfaces are insulated. Material properties: modulus of elasticity 2.1e+11 pa, and Poisson’s ratio 0.3, coefficient of thermal expansion 1.2e-5 m/m-C, thermal conductivity 43 W/m-K.
Fig. vtl04a
Sliding
Temperature 100 C on top
Insulated Sliding
Temperature -100 C at bottom
Page 67
Fig. vtl04b
REFERENCE
W.C. Young, R.G. Budynas, Roark’s Formulas for Stress and Strain, Seventh Edition, McGraw-Hill Book Co.,Inc., 2001, p. 759
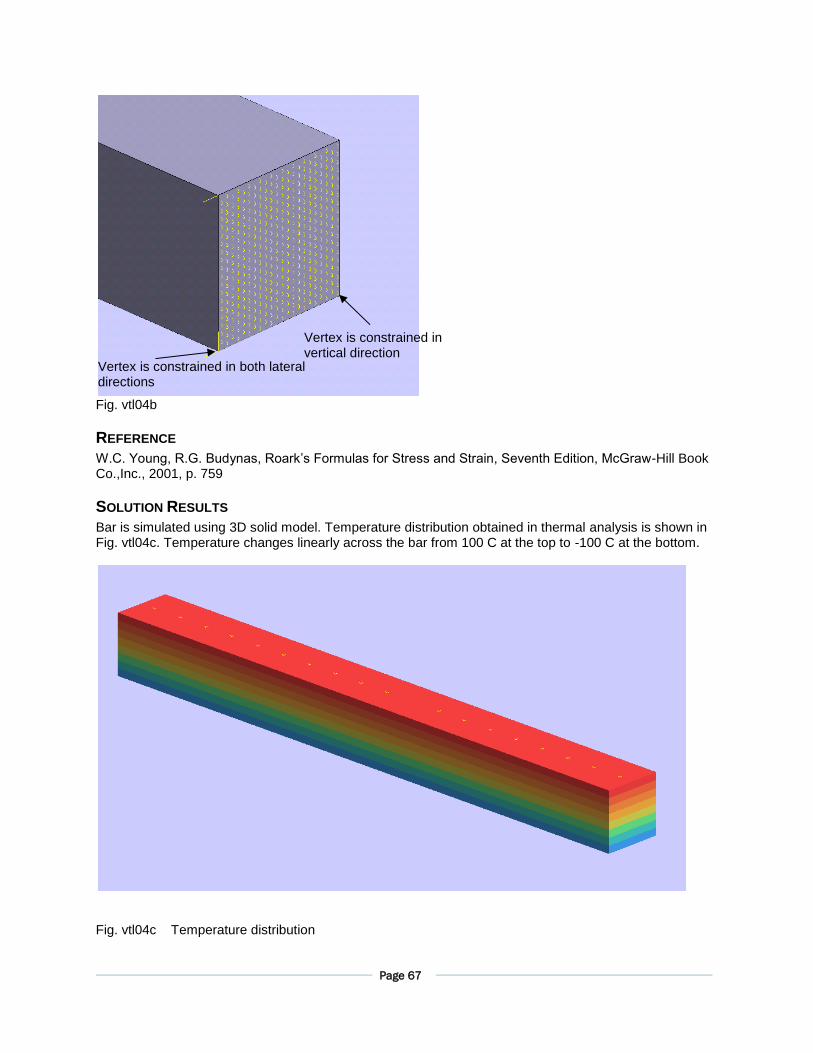
SOLUTION RESULTS
Bar is simulated using 3D solid model. Temperature distribution obtained in thermal analysis is shown in Fig. vtl04c. Temperature changes linearly across the bar from 100 C at the top to -100 C at the bottom.
Fig. vtl04c Temperature distribution
Vertex is constrained in both lateral directions
Vertex is constrained in vertical direction
Page 68
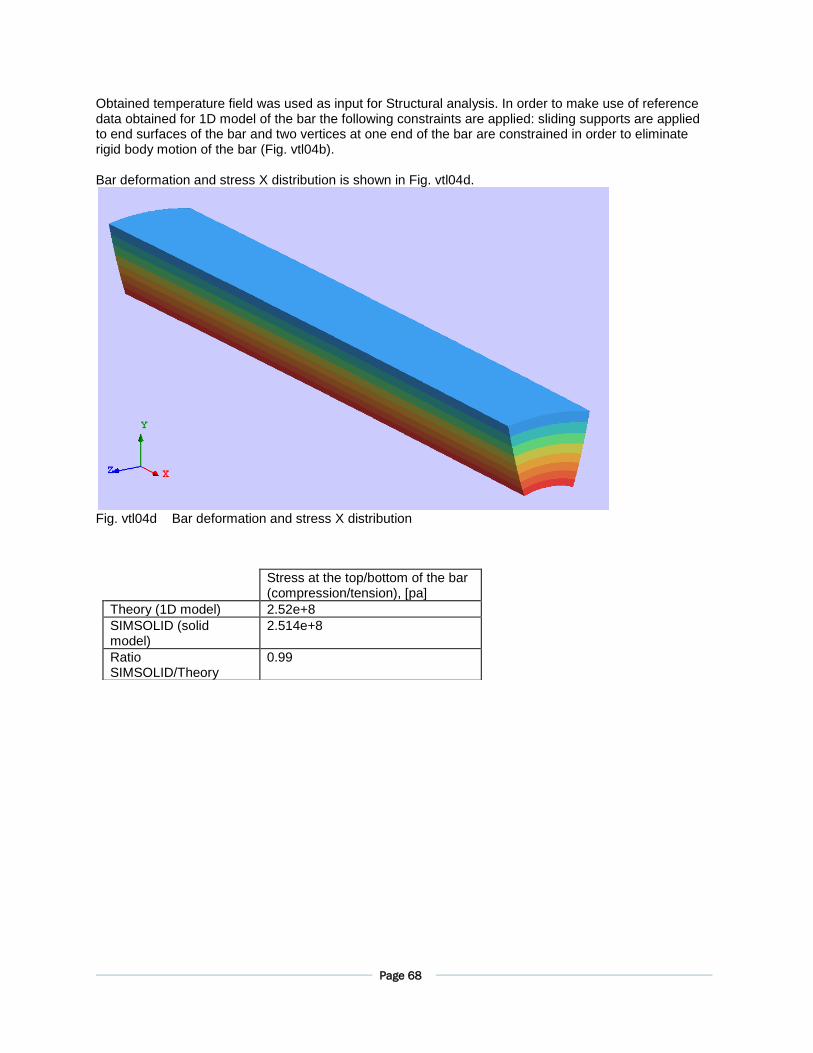
Obtained temperature field was used as input for Structural analysis. In order to make use of reference data obtained for 1D model of the bar the following constraints are applied: sliding supports are applied to end surfaces of the bar and two vertices at one end of the bar are constrained in order to eliminate rigid body motion of the bar (Fig. vtl04b). Bar deformation and stress X distribution is shown in Fig. vtl04d.
Fig. vtl04d Bar deformation and stress X distribution
Stress at the top/bottom of the bar (compression/tension), [pa]
Theory (1D model) 2.52e+8
SIMSOLID (solid model)
2.514e+8
Ratio SIMSOLID/Theory
0.99
Page 69
SECTION 5: NON-LINEAR TESTS
TEST VNL01: COUPLED ANALYSIS - BIMETALLIC BEAM UNDER THERMAL LOAD
PROBLEM DEFINITION
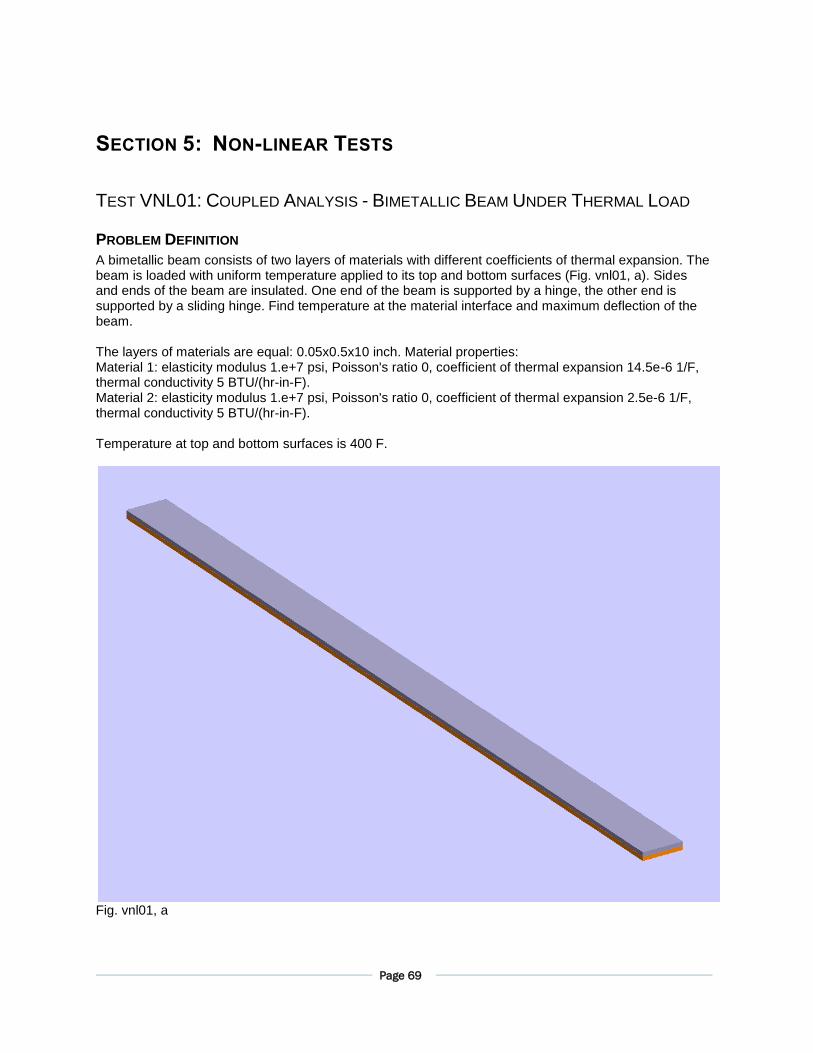
A bimetallic beam consists of two layers of materials with different coefficients of thermal expansion. The beam is loaded with uniform temperature applied to its top and bottom surfaces (Fig. vnl01, a). Sides and ends of the beam are insulated. One end of the beam is supported by a hinge, the other end is supported by a sliding hinge. Find temperature at the material interface and maximum deflection of the beam. The layers of materials are equal: 0.05x0.5x10 inch. Material properties: Material 1: elasticity modulus 1.e+7 psi, Poisson's ratio 0, coefficient of thermal expansion 14.5e-6 1/F, thermal conductivity 5 BTU/(hr-in-F). Material 2: elasticity modulus 1.e+7 psi, Poisson's ratio 0, coefficient of thermal expansion 2.5e-6 1/F, thermal conductivity 5 BTU/(hr-in-F). Temperature at top and bottom surfaces is 400 F.
Fig. vnl01, a
Page 70
REFERENCE
B.A.Boley, J.H.Weiner, Theory of Thermal Stress, R.E.Krieger Publishing Co, Malabar, FL, 1985, pg. 429
RESULTS
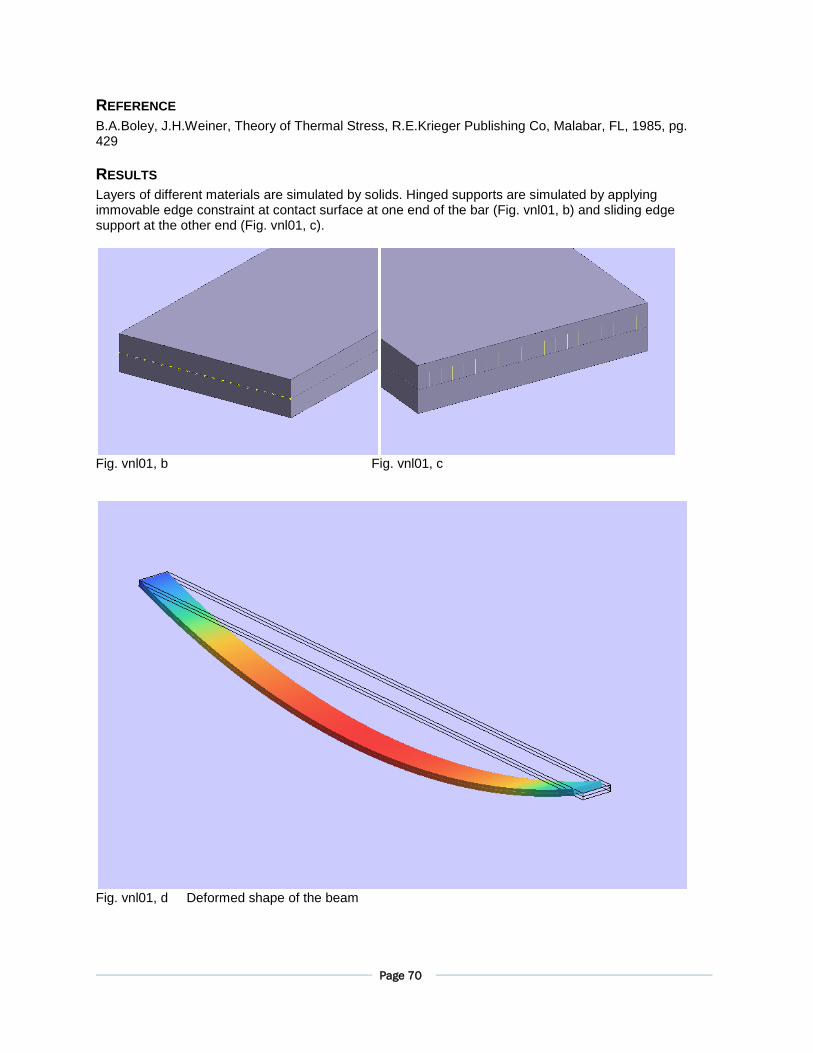
Layers of different materials are simulated by solids. Hinged supports are simulated by applying immovable edge constraint at contact surface at one end of the bar (Fig. vnl01, b) and sliding edge support at the other end (Fig. vnl01, c).
Fig. vnl01, b Fig. vnl01, c
Fig. vnl01, d Deformed shape of the beam
Page 71
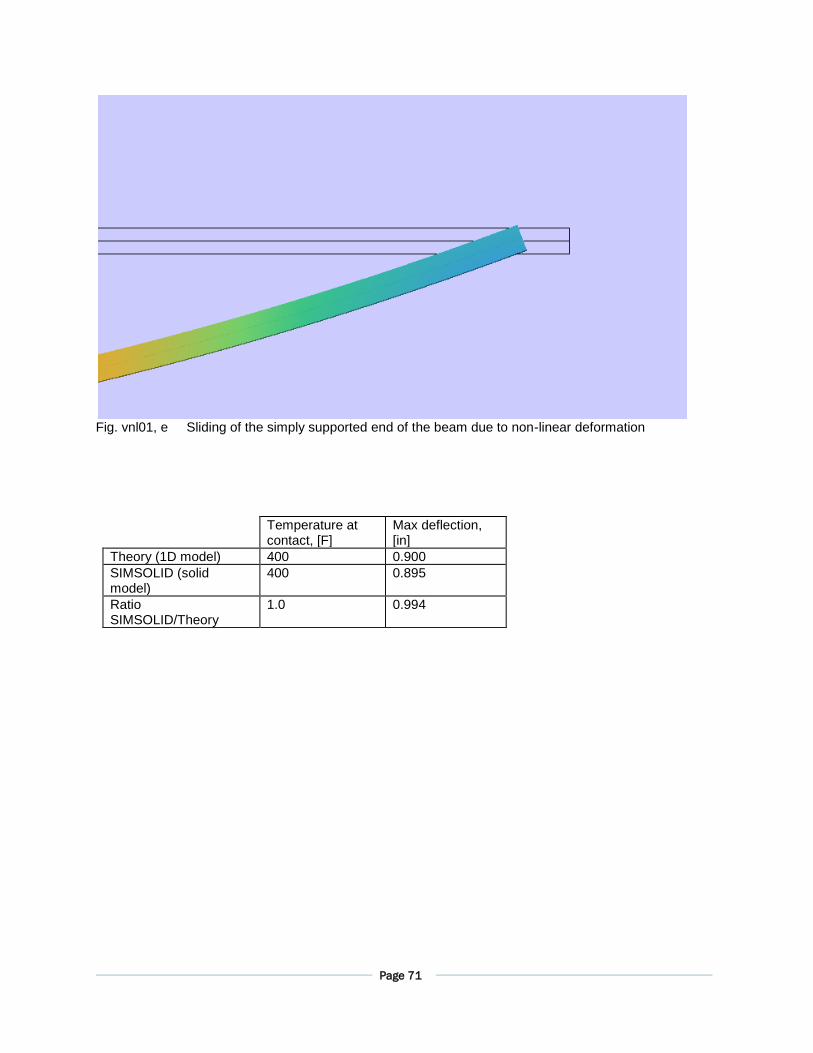
Fig. vnl01, e Sliding of the simply supported end of the beam due to non-linear deformation
Temperature at contact, [F]
Max deflection, [in]
Theory (1D model) 400 0.900
SIMSOLID (solid model)
400 0.895
Ratio SIMSOLID/Theory
1.0 0.994
Page 72
TEST VNL02: Z-SHAPED CANTILEVER
PROBLEM DEFINITION
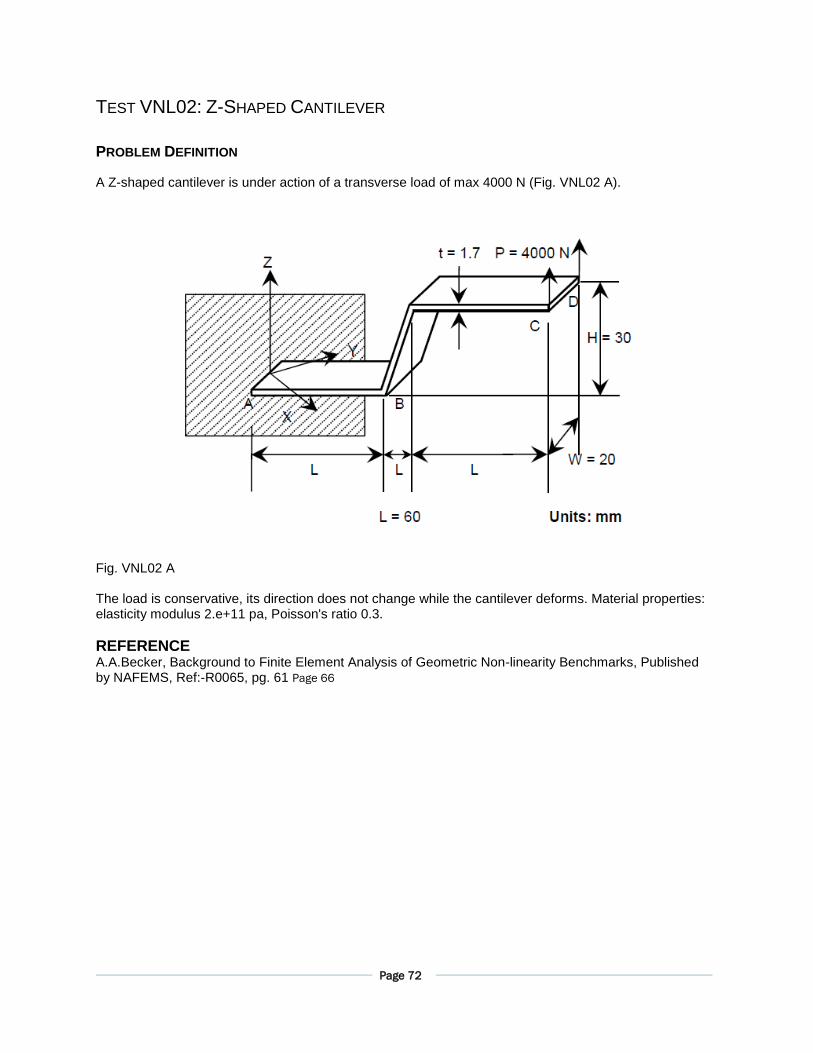
A Z-shaped cantilever is under action of a transverse load of max 4000 N (Fig. VNL02 A).
Fig. VNL02 A The load is conservative, its direction does not change while the cantilever deforms. Material properties: elasticity modulus 2.e+11 pa, Poisson's ratio 0.3.
REFERENCE A.A.Becker, Background to Finite Element Analysis of Geometric Non-linearity Benchmarks, Published by NAFEMS, Ref:-R0065, pg. 61 Page 66
Page 73
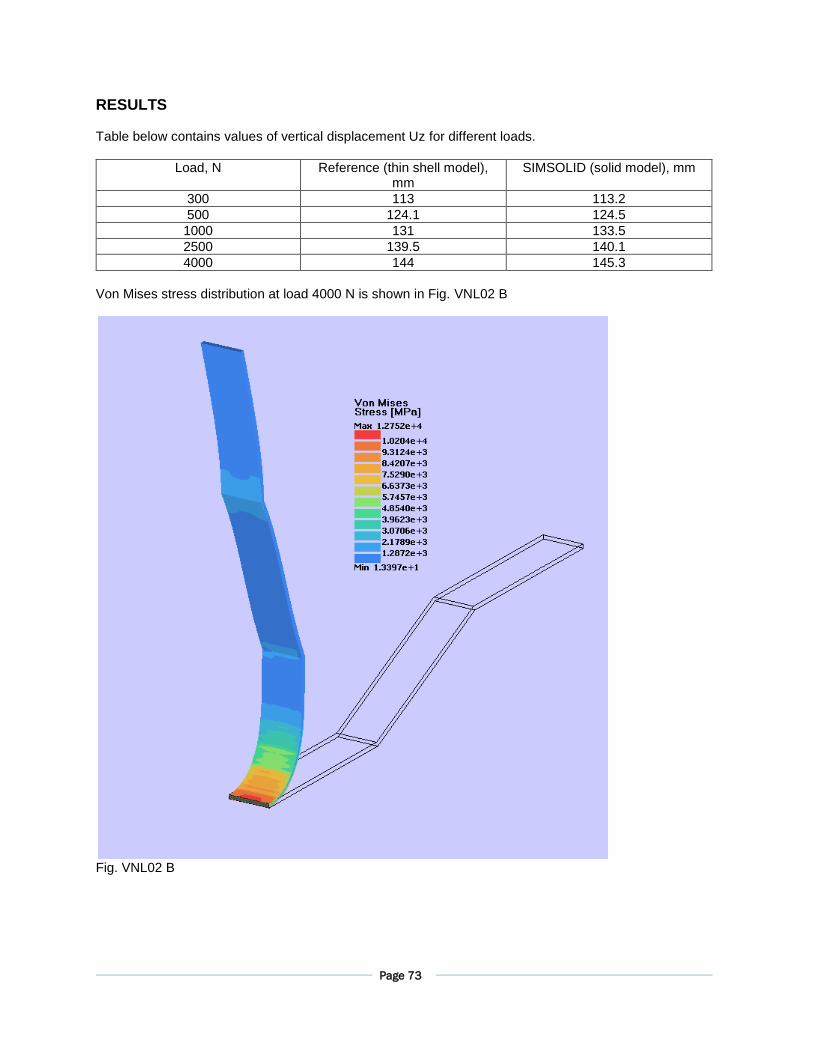
RESULTS Table below contains values of vertical displacement Uz for different loads.
Load, N Reference (thin shell model), mm
SIMSOLID (solid model), mm
300 113 113.2
500 124.1 124.5
1000 131 133.5
2500 139.5 140.1
4000 144 145.3
Von Mises stress distribution at load 4000 N is shown in Fig. VNL02 B
Fig. VNL02 B
Page 74
TEST VNL03: LATERAL BUCKLING OF A RIGHT ANGLE FRAME
PROBLEM DEFINITION
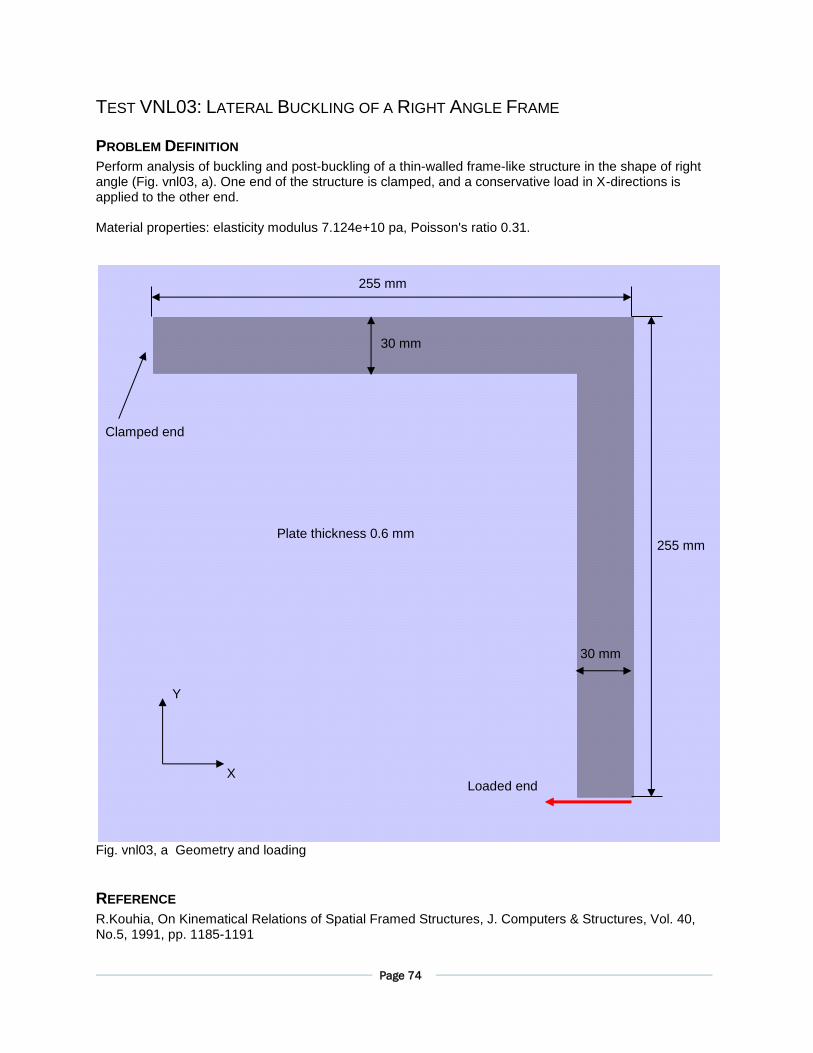
Perform analysis of buckling and post-buckling of a thin-walled frame-like structure in the shape of right angle (Fig. vnl03, a). One end of the structure is clamped, and a conservative load in X-directions is applied to the other end. Material properties: elasticity modulus 7.124e+10 pa, Poisson's ratio 0.31.
Fig. vnl03, a Geometry and loading
REFERENCE
R.Kouhia, On Kinematical Relations of Spatial Framed Structures, J. Computers & Structures, Vol. 40, No.5, 1991, pp. 1185-1191
X
Y
Clamped end
Plate thickness 0.6 mm
255 mm
255 mm
30 mm
30 mm
Loaded end
Page 75
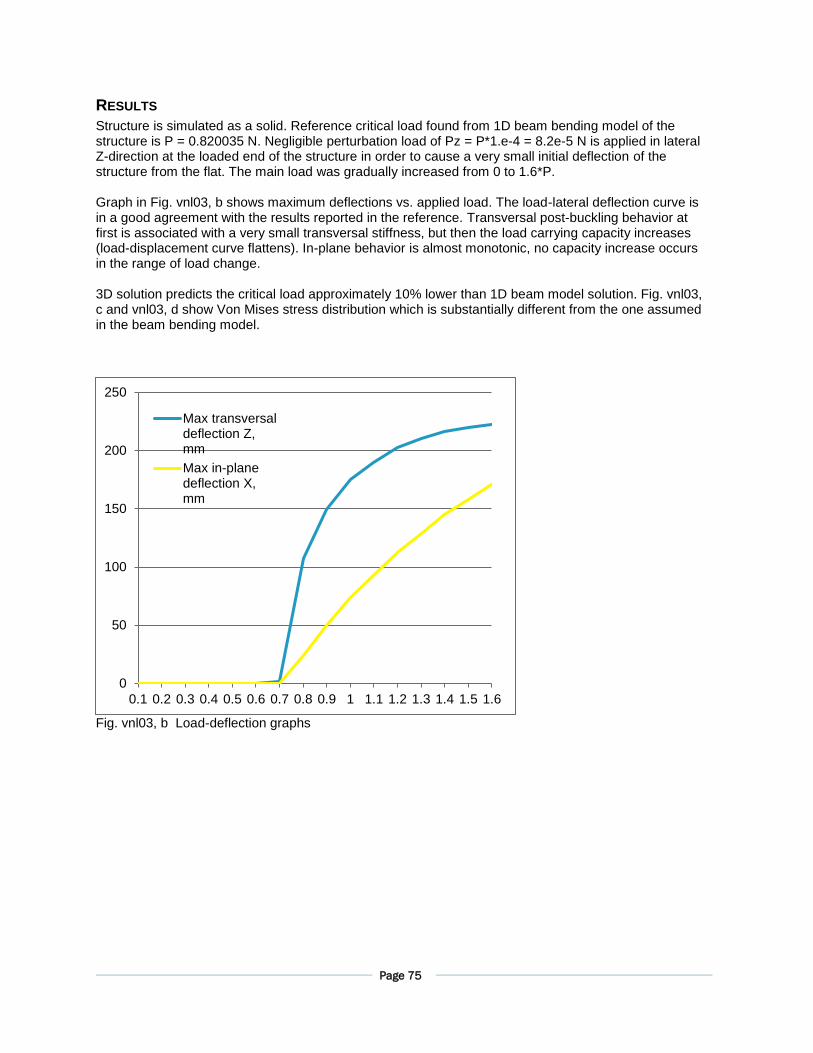
RESULTS
Structure is simulated as a solid. Reference critical load found from 1D beam bending model of the structure is P = 0.820035 N. Negligible perturbation load of Pz = P*1.e-4 = 8.2e-5 N is applied in lateral Z-direction at the loaded end of the structure in order to cause a very small initial deflection of the structure from the flat. The main load was gradually increased from 0 to 1.6*P. Graph in Fig. vnl03, b shows maximum deflections vs. applied load. The load-lateral deflection curve is in a good agreement with the results reported in the reference. Transversal post-buckling behavior at first is associated with a very small transversal stiffness, but then the load carrying capacity increases (load-displacement curve flattens). In-plane behavior is almost monotonic, no capacity increase occurs in the range of load change. 3D solution predicts the critical load approximately 10% lower than 1D beam model solution. Fig. vnl03, c and vnl03, d show Von Mises stress distribution which is substantially different from the one assumed in the beam bending model.
Fig. vnl03, b Load-deflection graphs
0
50
100
150
200
250
0.1 0.2 0.3 0.4 0.5 0.6 0.7 0.8 0.9 1 1.1 1.2 1.3 1.4 1.5 1.6
Max transversaldeflection Z,mm
Max in-planedeflection X,mm
Page 76
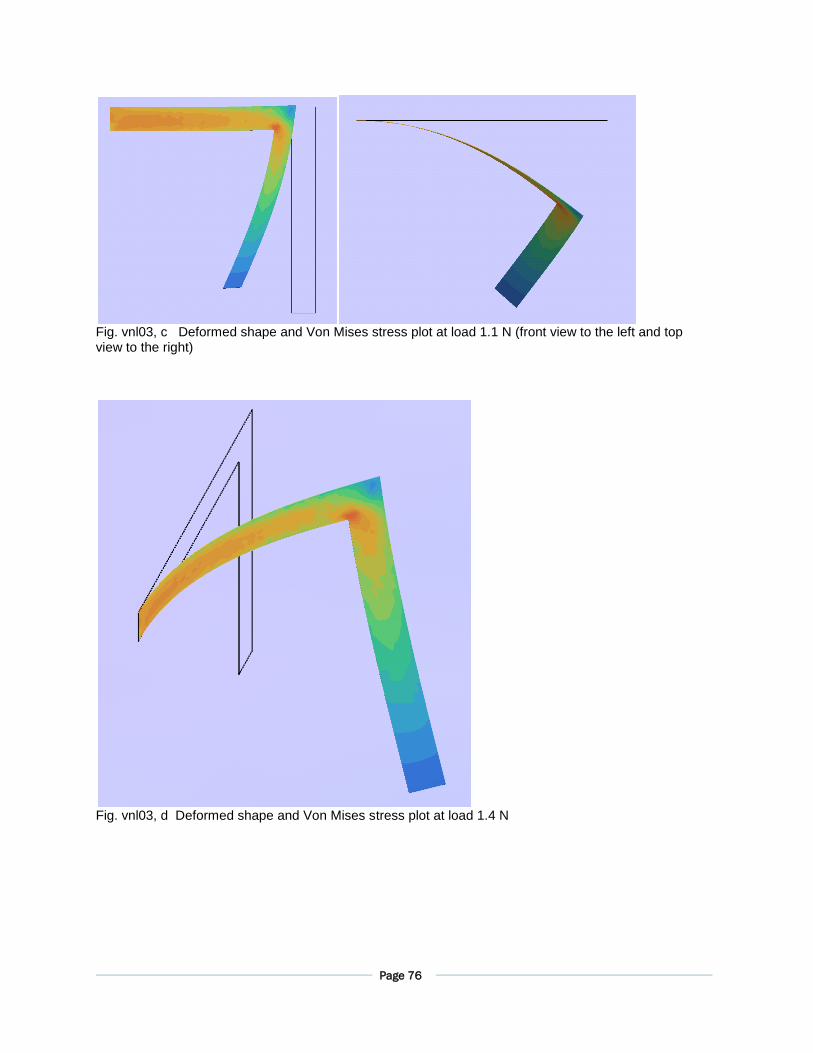
Fig. vnl03, c Deformed shape and Von Mises stress plot at load 1.1 N (front view to the left and top view to the right)
Fig. vnl03, d Deformed shape and Von Mises stress plot at load 1.4 N
Page 77
TEST VNL04: REACTIONS AT THE ENDS OF STATICALLY UNDEFINED AXIALLY
LOADED PLASTIC BAR
PROBLEM DEFINITION
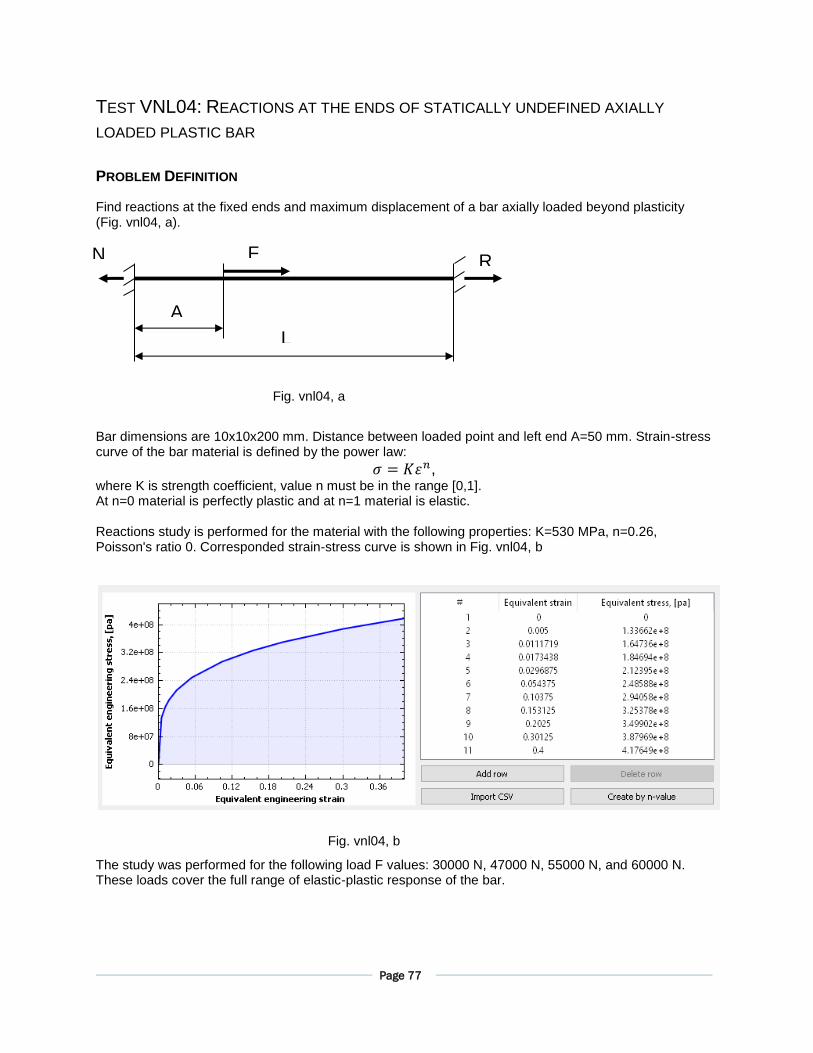
Find reactions at the fixed ends and maximum displacement of a bar axially loaded beyond plasticity (Fig. vnl04, a). Bar dimensions are 10x10x200 mm. Distance between loaded point and left end A=50 mm. Strain-stress curve of the bar material is defined by the power law:
𝜎 = 𝐾𝜀𝑛, where K is strength coefficient, value n must be in the range [0,1]. At n=0 material is perfectly plastic and at n=1 material is elastic. Reactions study is performed for the material with the following properties: K=530 MPa, n=0.26, Poisson's ratio 0. Corresponded strain-stress curve is shown in Fig. vnl04, b
The study was performed for the following load F values: 30000 N, 47000 N, 55000 N, and 60000 N. These loads cover the full range of elastic-plastic response of the bar.
A
L
F
Fig. vnl04, a
Fig. vnl04, b
R N
Page 78
REFERENCE SOLUTION
One-dimensional analytical reference solution can be found as follows. Let us designate ε1 is tensile strain at the left span of the bar, ε2 is compressive strain at the right span of the bar, N is reaction force at left end of the bar, R=F-N is reaction force at the right end of the bar. The length of the bar does not change under the load, therefore
∫ 𝜀1𝑑𝑥 − ∫ 𝜀2𝑑𝑥 = 0𝐿−𝐴
0
𝐴
0
or
∫ √𝑁/(𝐾 ∗ 𝐴)𝑛
𝑑𝑥 − ∫ √(𝐹 − 𝑁)/(𝐾 ∗ 𝐴)𝑛
𝑑𝑥 = 0𝐿−𝐴
0
𝐴
0
Here A is the bar cross section area. From this equation one can find the reaction at the left end of the bar
𝑁 = 𝐹 (1 + (𝑎/𝑏)𝑛)⁄ and
𝑅 = 𝐹 − 𝑁 at the right end. MODELING AND RESULTS
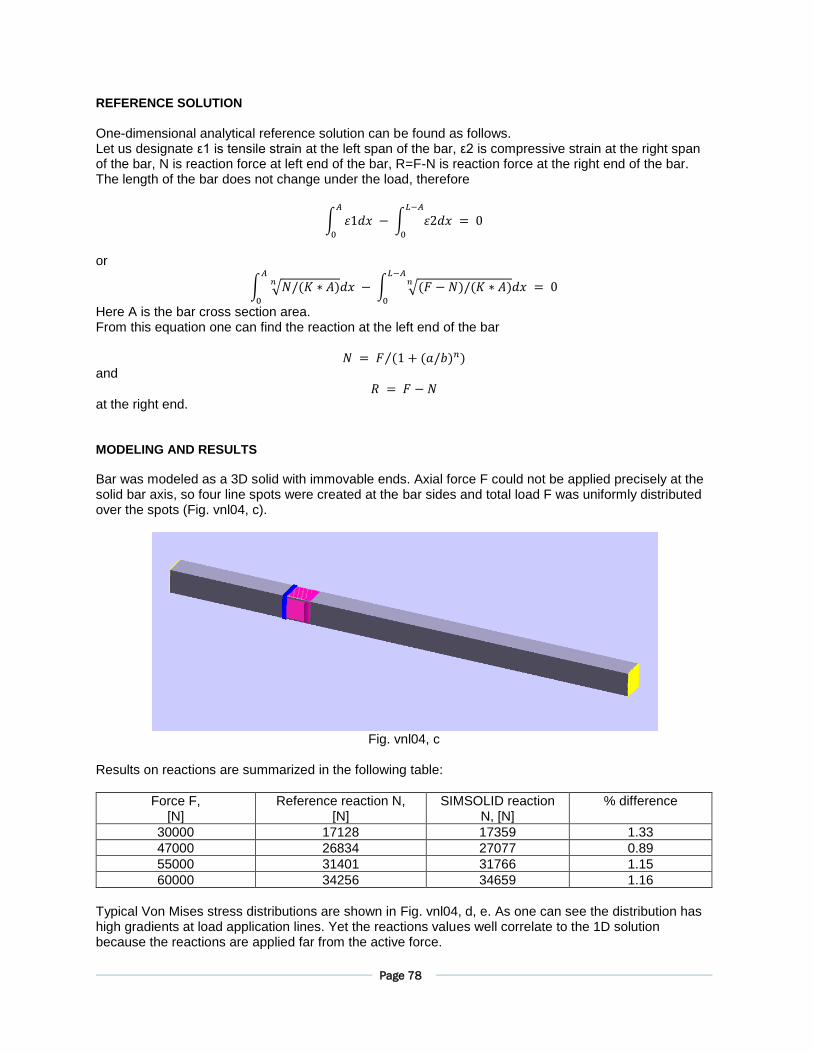
Bar was modeled as a 3D solid with immovable ends. Axial force F could not be applied precisely at the solid bar axis, so four line spots were created at the bar sides and total load F was uniformly distributed over the spots (Fig. vnl04, c).
Fig. vnl04, c
Results on reactions are summarized in the following table:
Force F, [N]
Reference reaction N, [N]
SIMSOLID reaction N, [N]
% difference
30000 17128 17359 1.33
47000 26834 27077 0.89
55000 31401 31766 1.15
60000 34256 34659 1.16
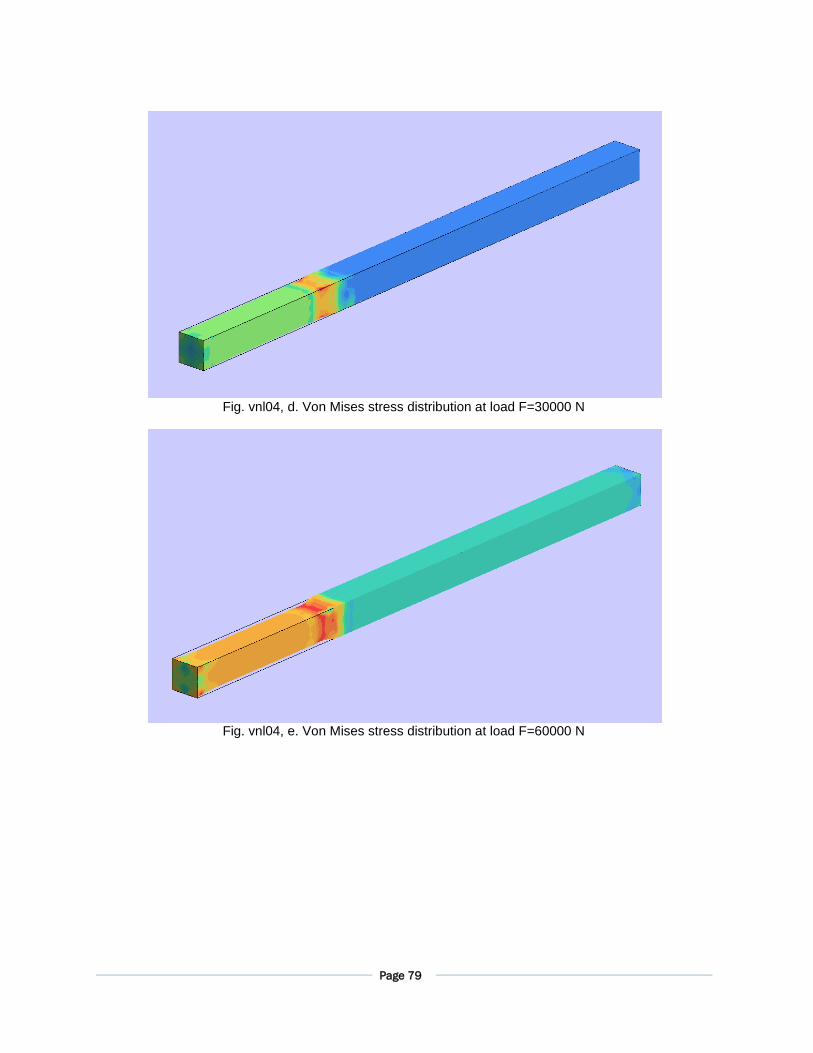
Typical Von Mises stress distributions are shown in Fig. vnl04, d, e. As one can see the distribution has high gradients at load application lines. Yet the reactions values well correlate to the 1D solution because the reactions are applied far from the active force.
Page 79
Fig. vnl04, d. Von Mises stress distribution at load F=30000 N
Fig. vnl04, e. Von Mises stress distribution at load F=60000 N
Page 80
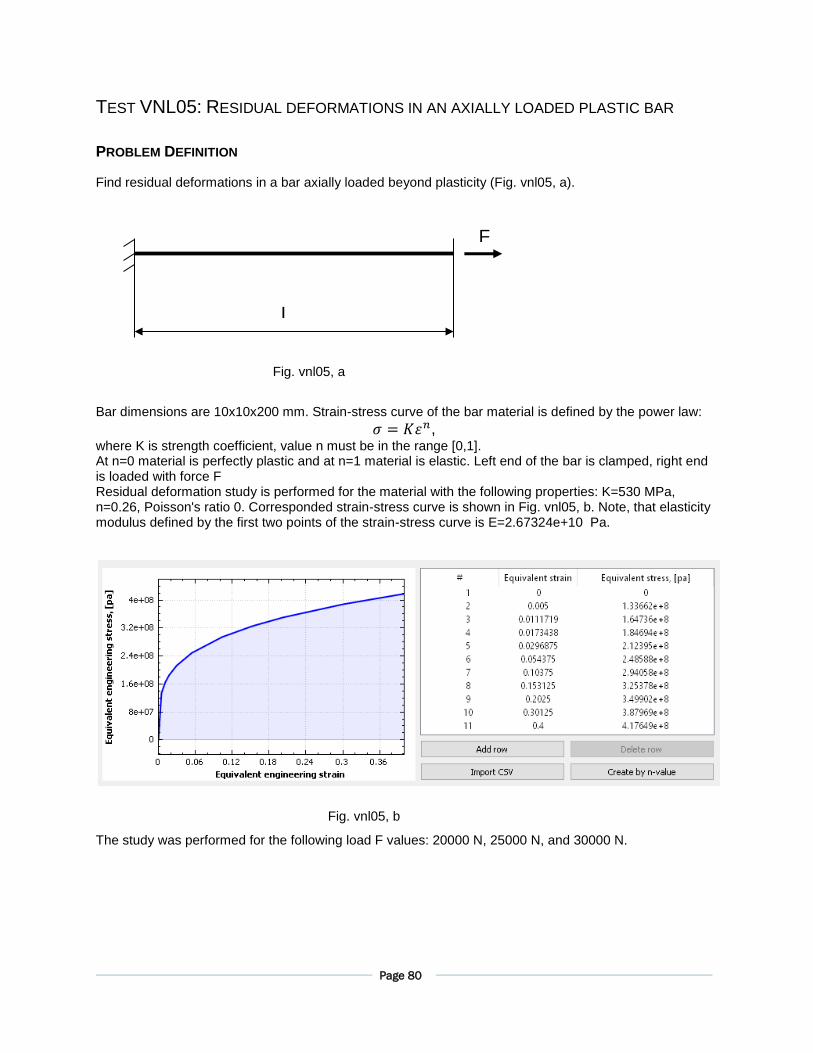
TEST VNL05: RESIDUAL DEFORMATIONS IN AN AXIALLY LOADED PLASTIC BAR
PROBLEM DEFINITION
Find residual deformations in a bar axially loaded beyond plasticity (Fig. vnl05, a). Bar dimensions are 10x10x200 mm. Strain-stress curve of the bar material is defined by the power law:
𝜎 = 𝐾𝜀𝑛, where K is strength coefficient, value n must be in the range [0,1]. At n=0 material is perfectly plastic and at n=1 material is elastic. Left end of the bar is clamped, right end is loaded with force F Residual deformation study is performed for the material with the following properties: K=530 MPa, n=0.26, Poisson's ratio 0. Corresponded strain-stress curve is shown in Fig. vnl05, b. Note, that elasticity modulus defined by the first two points of the strain-stress curve is E=2.67324e+10 Pa.
The study was performed for the following load F values: 20000 N, 25000 N, and 30000 N.
L
Fig. vnl05, a
Fig. vnl05, b
F
Page 81
REFERENCE SOLUTION
One-dimensional analytical reference solution can be found as follows. Let us designate ε is total strain in the bar, εe is elastic component of the total strain, εr is residual strain. At strain ε and stress σ the residual strain is
εr = ε - εe = (σ/K)1/n - σ/E = (F/(K*A))1/n - F/(E*A),
where A is cross-section area of the bar. Then residual displacement at the right end of the bar
𝑈𝑟 = ∫ ( √𝐹
𝐾 ∗ 𝐴
𝑛𝐿
0
− 𝐹/(𝐸 ∗ 𝐴))𝑑𝑥
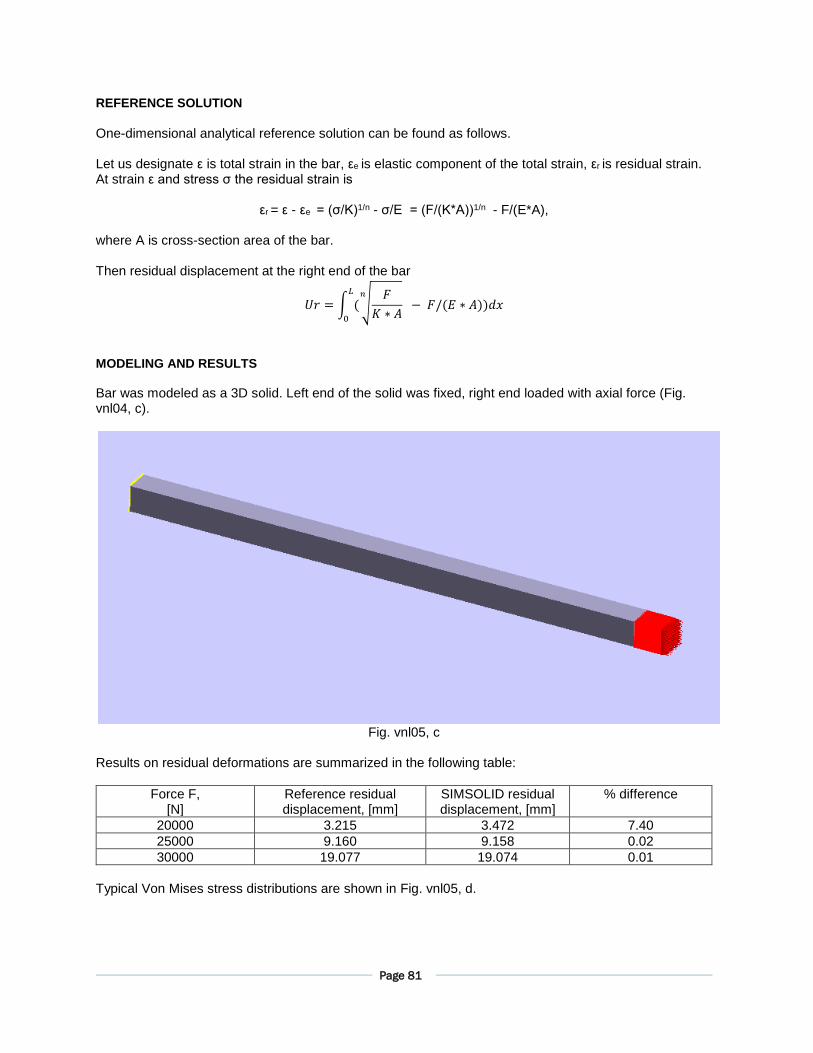
MODELING AND RESULTS
Bar was modeled as a 3D solid. Left end of the solid was fixed, right end loaded with axial force (Fig. vnl04, c).
Fig. vnl05, c
Results on residual deformations are summarized in the following table:
Force F, [N]
Reference residual displacement, [mm]
SIMSOLID residual displacement, [mm]
% difference
20000 3.215 3.472 7.40
25000 9.160 9.158 0.02
30000 19.077 19.074 0.01
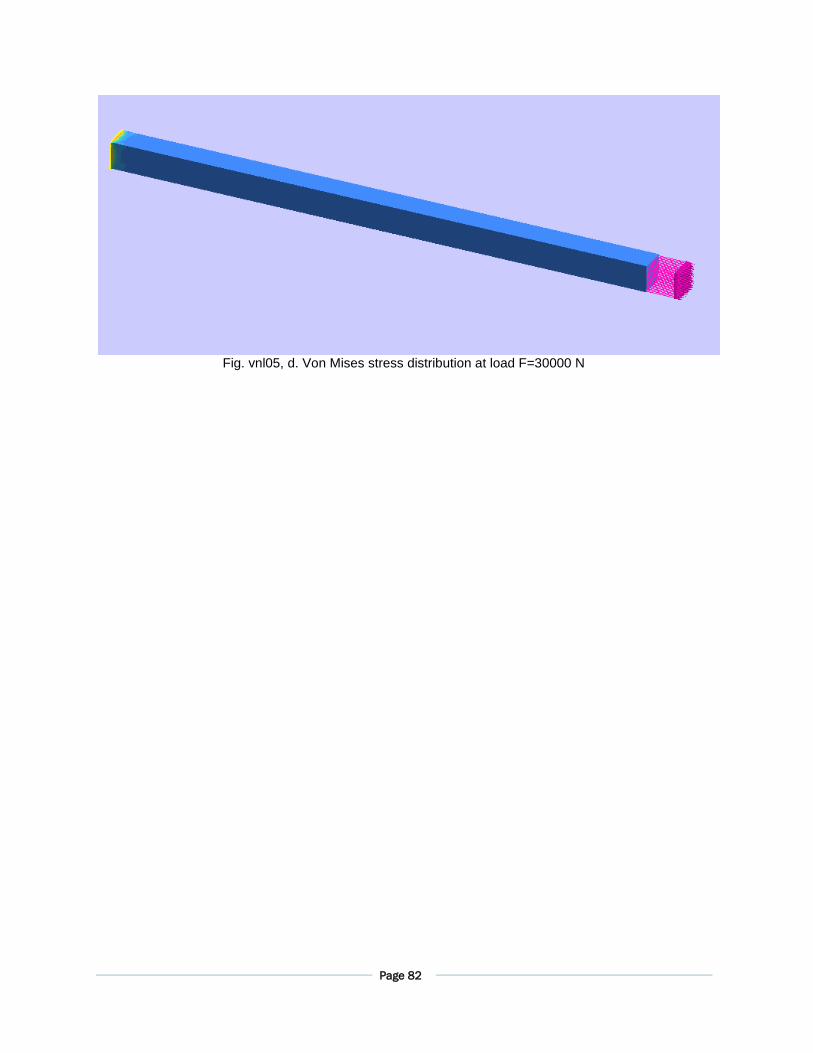
Typical Von Mises stress distributions are shown in Fig. vnl05, d.
Page 82
Fig. vnl05, d. Von Mises stress distribution at load F=30000 N
Page 83
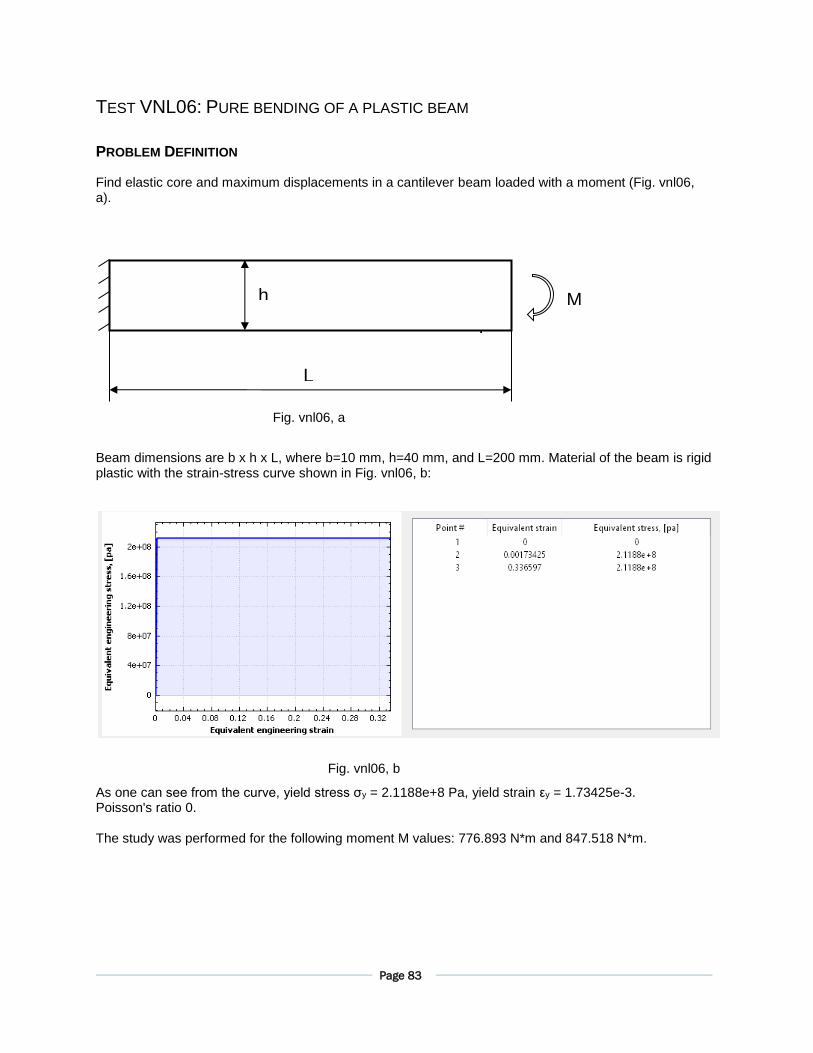
TEST VNL06: PURE BENDING OF A PLASTIC BEAM
PROBLEM DEFINITION
Find elastic core and maximum displacements in a cantilever beam loaded with a moment (Fig. vnl06, a). Beam dimensions are b x h x L, where b=10 mm, h=40 mm, and L=200 mm. Material of the beam is rigid plastic with the strain-stress curve shown in Fig. vnl06, b:
As one can see from the curve, yield stress σy = 2.1188e+8 Pa, yield strain εy = 1.73425e-3. Poisson's ratio 0. The study was performed for the following moment M values: 776.893 N*m and 847.518 N*m.
L
Fig. vnl06, a
Fig. vnl06, b
F
h M
Page 84
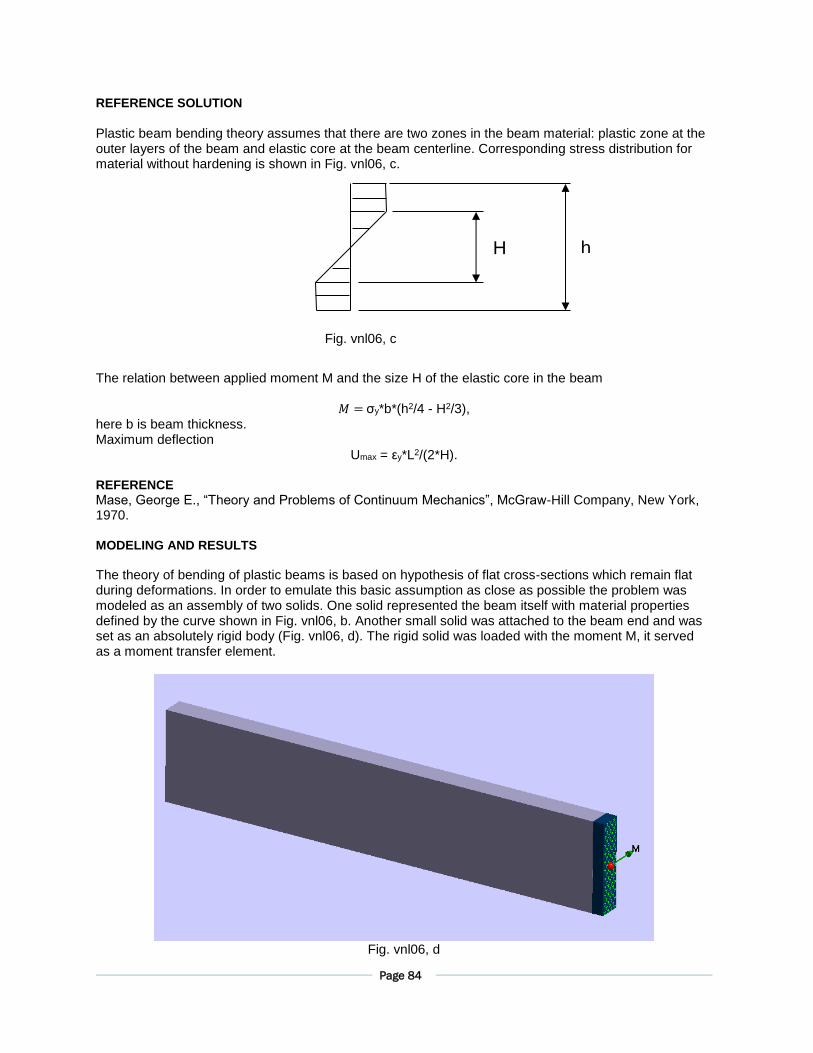
REFERENCE SOLUTION
Plastic beam bending theory assumes that there are two zones in the beam material: plastic zone at the outer layers of the beam and elastic core at the beam centerline. Corresponding stress distribution for material without hardening is shown in Fig. vnl06, c. The relation between applied moment M and the size H of the elastic core in the beam
𝑀 = σy*b*(h2/4 - H2/3), here b is beam thickness. Maximum deflection
Umax = εy*L2/(2*H). REFERENCE
Mase, George E., “Theory and Problems of Continuum Mechanics”, McGraw-Hill Company, New York, 1970. MODELING AND RESULTS
The theory of bending of plastic beams is based on hypothesis of flat cross-sections which remain flat during deformations. In order to emulate this basic assumption as close as possible the problem was modeled as an assembly of two solids. One solid represented the beam itself with material properties defined by the curve shown in Fig. vnl06, b. Another small solid was attached to the beam end and was set as an absolutely rigid body (Fig. vnl06, d). The rigid solid was loaded with the moment M, it served as a moment transfer element.
Fig. vnl06, d
h H
Fig. vnl06, c
Page 85
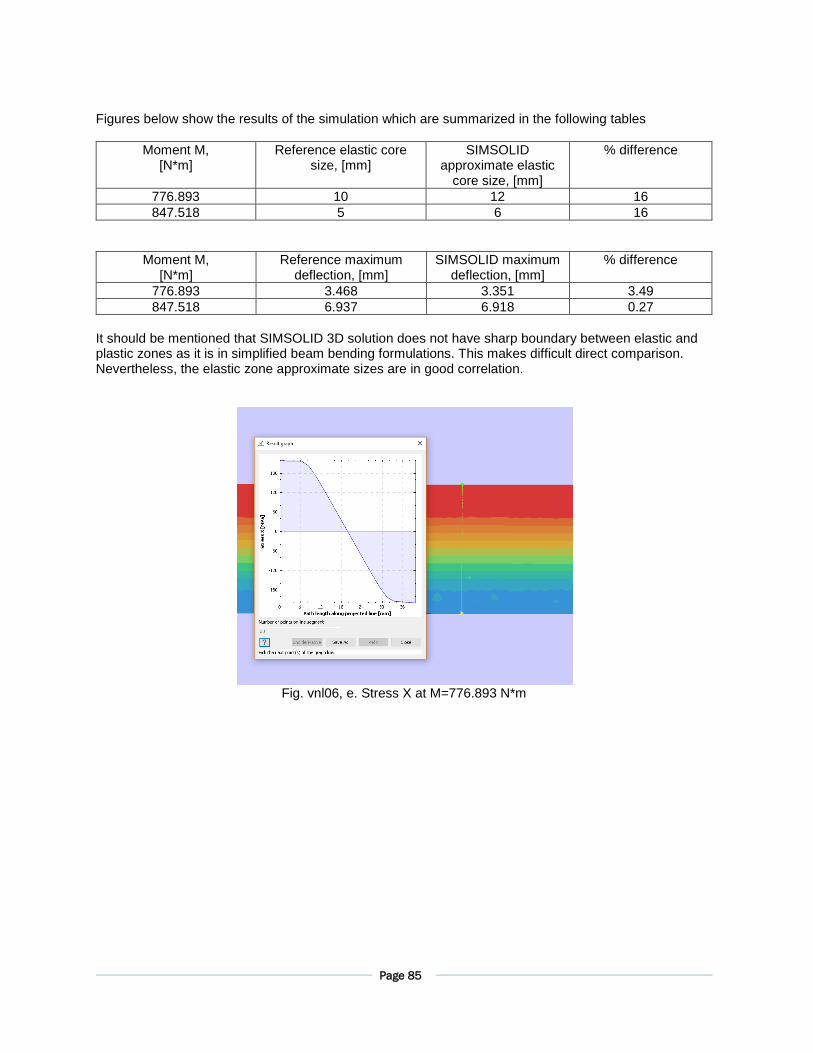
Figures below show the results of the simulation which are summarized in the following tables
Moment M, [N*m]
Reference elastic core size, [mm]
SIMSOLID approximate elastic
core size, [mm]
% difference
776.893 10 12 16
847.518 5 6 16
Moment M, [N*m]
Reference maximum deflection, [mm]
SIMSOLID maximum deflection, [mm]
% difference
776.893 3.468 3.351 3.49
847.518 6.937 6.918 0.27
It should be mentioned that SIMSOLID 3D solution does not have sharp boundary between elastic and plastic zones as it is in simplified beam bending formulations. This makes difficult direct comparison. Nevertheless, the elastic zone approximate sizes are in good correlation.
Fig. vnl06, e. Stress X at M=776.893 N*m
Page 86
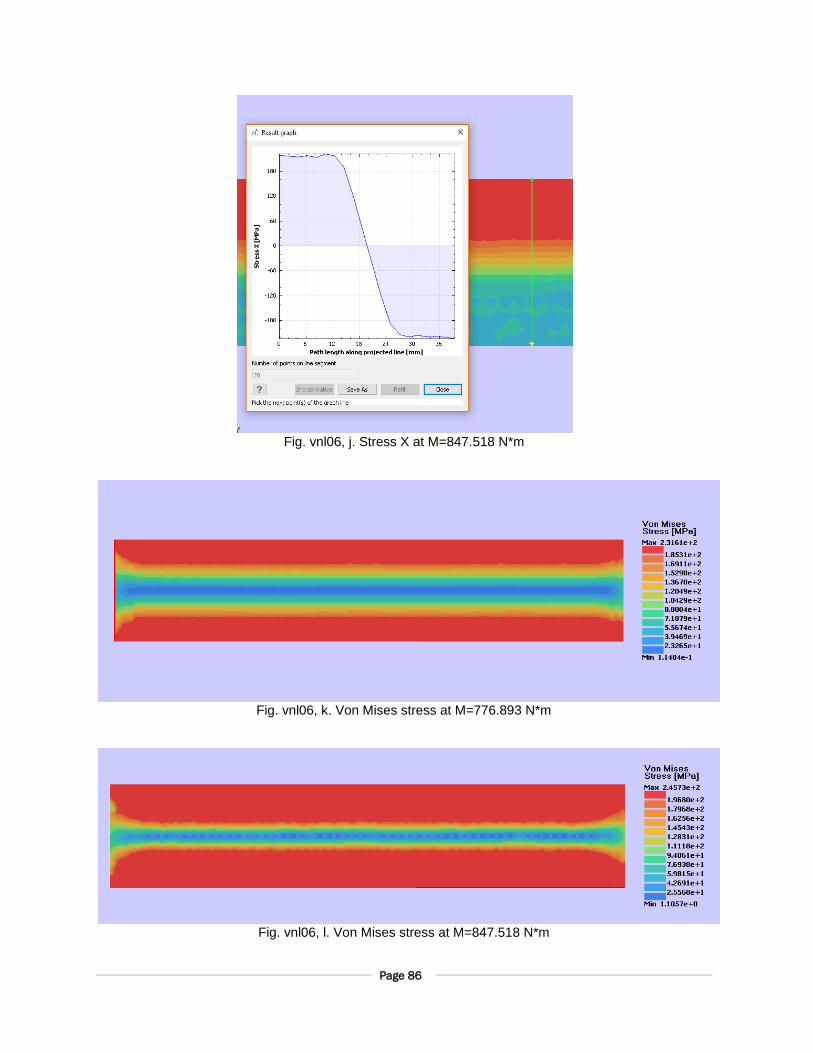
Fig. vnl06, j. Stress X at M=847.518 N*m
Fig. vnl06, k. Von Mises stress at M=776.893 N*m
Fig. vnl06, l. Von Mises stress at M=847.518 N*m
Page 87
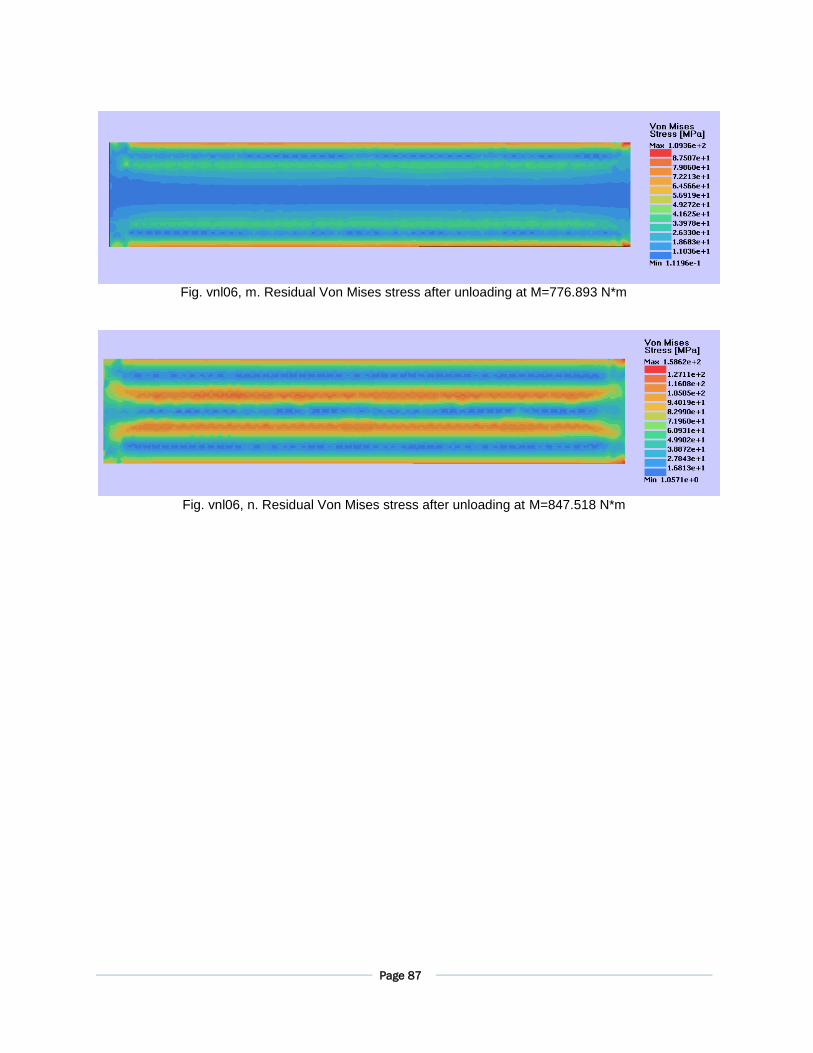
Fig. vnl06, m. Residual Von Mises stress after unloading at M=776.893 N*m
Fig. vnl06, n. Residual Von Mises stress after unloading at M=847.518 N*m
Page 88
TEST VNL07: SEPARATING BEAMS
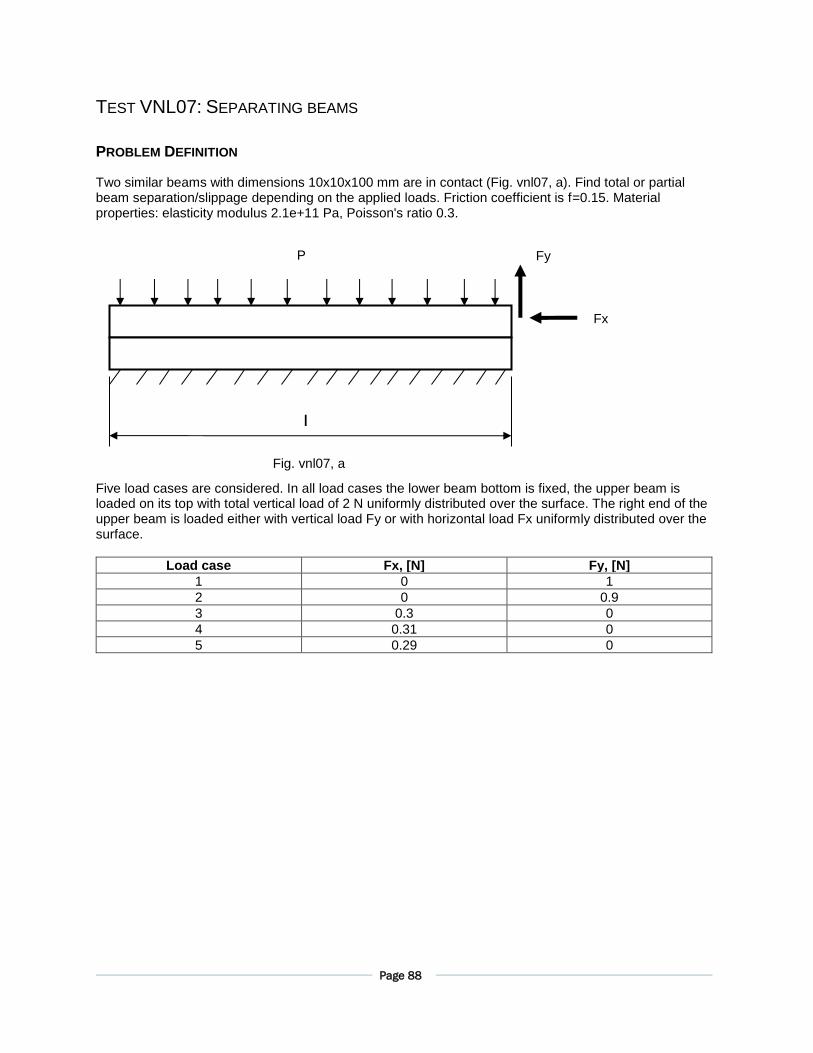
PROBLEM DEFINITION
Two similar beams with dimensions 10x10x100 mm are in contact (Fig. vnl07, a). Find total or partial beam separation/slippage depending on the applied loads. Friction coefficient is f=0.15. Material properties: elasticity modulus 2.1e+11 Pa, Poisson's ratio 0.3. Five load cases are considered. In all load cases the lower beam bottom is fixed, the upper beam is loaded on its top with total vertical load of 2 N uniformly distributed over the surface. The right end of the upper beam is loaded either with vertical load Fy or with horizontal load Fx uniformly distributed over the surface.
Load case Fx, [N] Fy, [N]
1 0 1
2 0 0.9
3 0.3 0
4 0.31 0
5 0.29 0
L
Fig. vnl07, a
P
Fx
Fy
Page 89
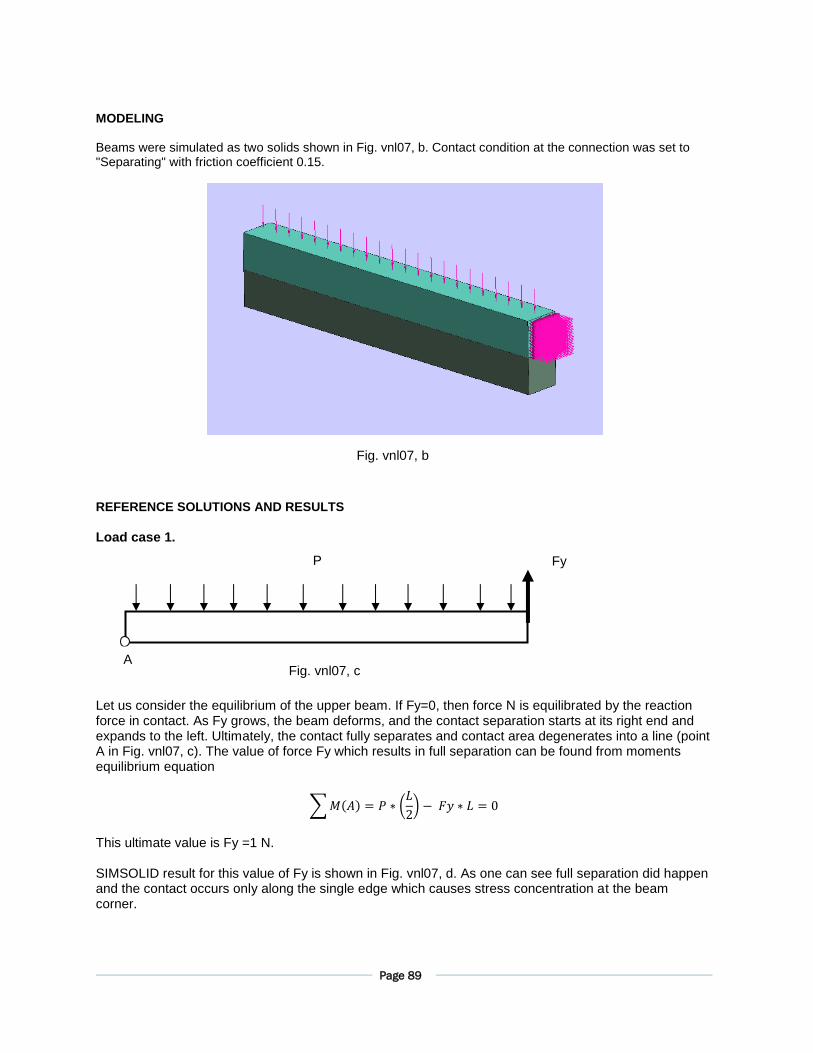
MODELING Beams were simulated as two solids shown in Fig. vnl07, b. Contact condition at the connection was set to "Separating" with friction coefficient 0.15.
REFERENCE SOLUTIONS AND RESULTS
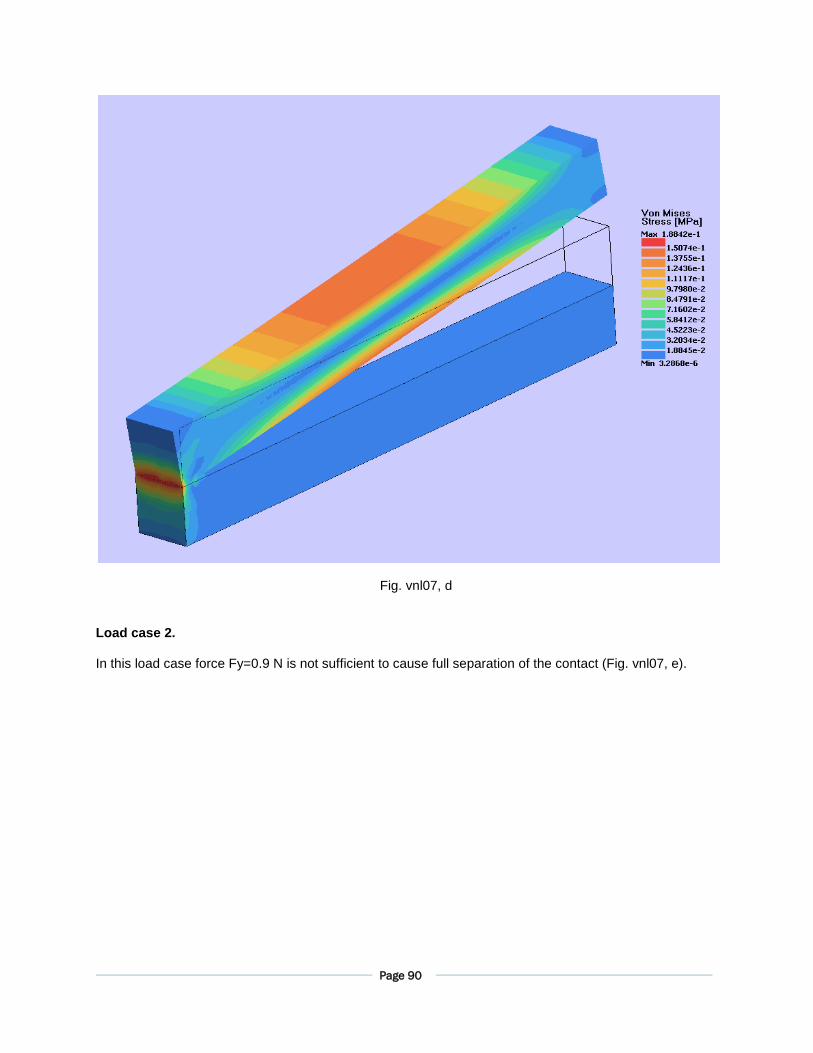
Load case 1. Let us consider the equilibrium of the upper beam. If Fy=0, then force N is equilibrated by the reaction force in contact. As Fy grows, the beam deforms, and the contact separation starts at its right end and expands to the left. Ultimately, the contact fully separates and contact area degenerates into a line (point A in Fig. vnl07, c). The value of force Fy which results in full separation can be found from moments equilibrium equation
∑ 𝑀(𝐴) = 𝑃 ∗ (𝐿
2) − 𝐹𝑦 ∗ 𝐿 = 0
This ultimate value is Fy =1 N. SIMSOLID result for this value of Fy is shown in Fig. vnl07, d. As one can see full separation did happen and the contact occurs only along the single edge which causes stress concentration at the beam corner.
P Fy
A Fig. vnl07, c
Fig. vnl07, b
Page 90
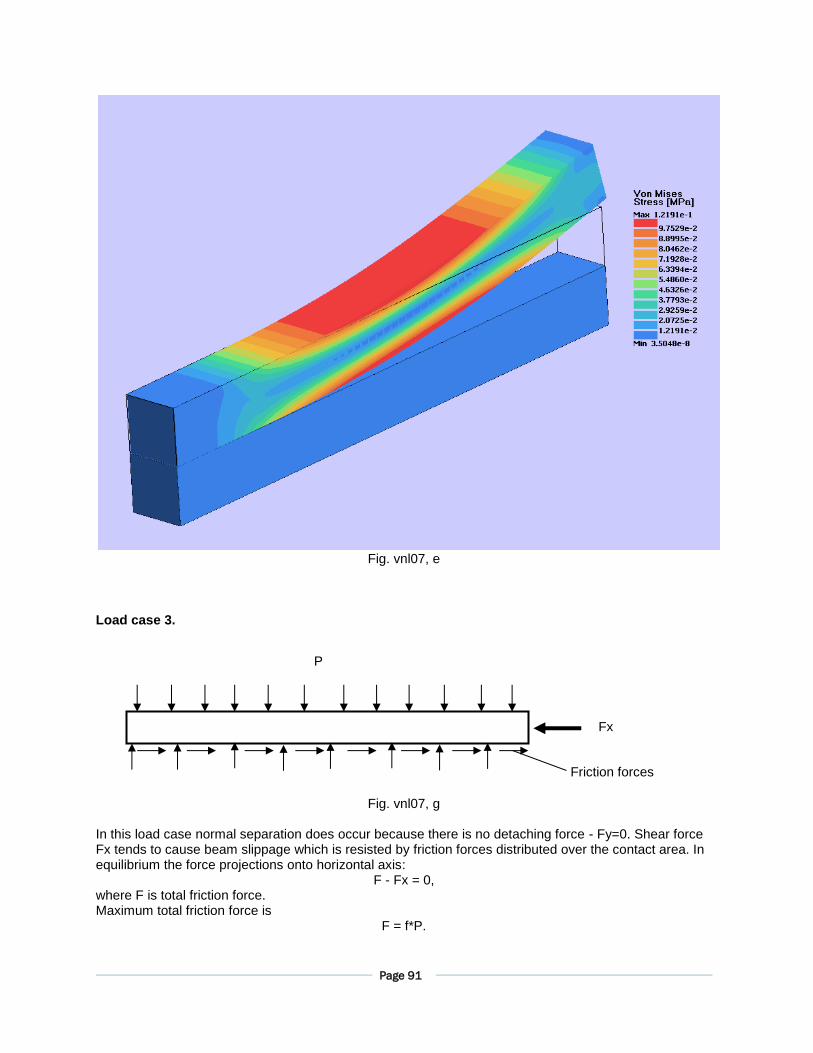
Load case 2. In this load case force Fy=0.9 N is not sufficient to cause full separation of the contact (Fig. vnl07, e).
Fig. vnl07, d
Page 91
Fig. vnl07, e
Load case 3.
Fig. vnl07, g In this load case normal separation does occur because there is no detaching force - Fy=0. Shear force Fx tends to cause beam slippage which is resisted by friction forces distributed over the contact area. In equilibrium the force projections onto horizontal axis:
F - Fx = 0, where F is total friction force. Maximum total friction force is
F = f*P.
P
Fx
Friction forces
Page 92
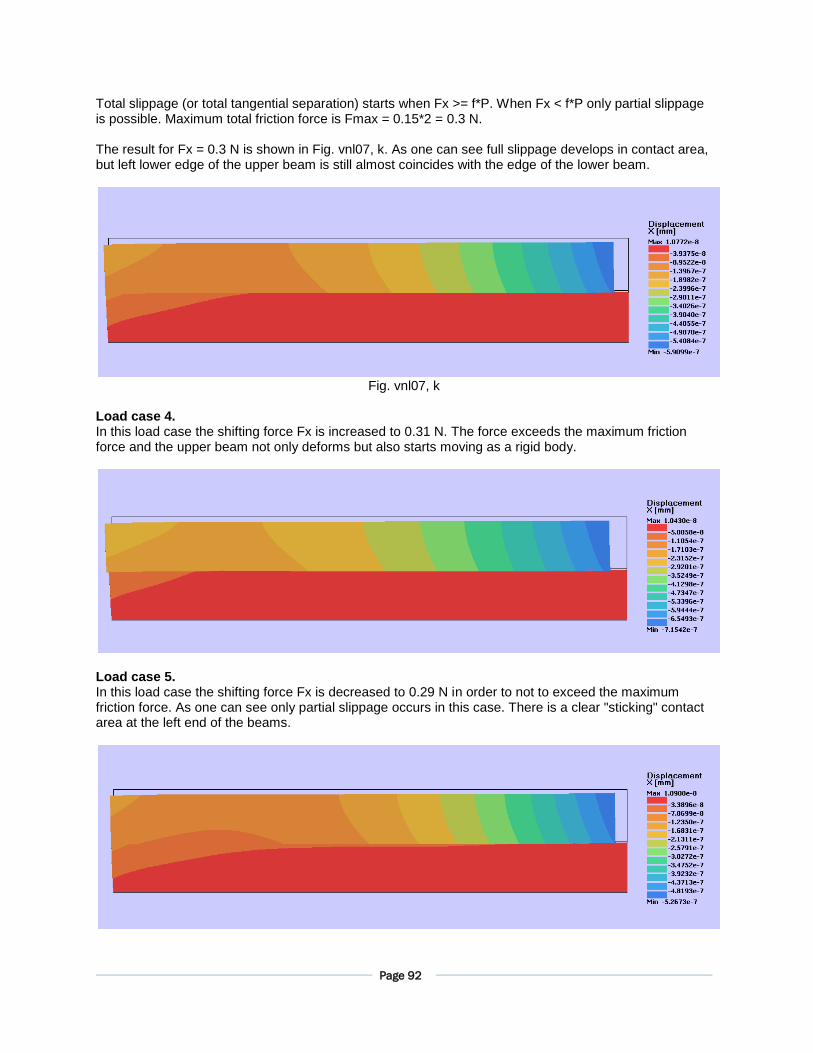
Total slippage (or total tangential separation) starts when Fx >= f*P. When Fx < f*P only partial slippage is possible. Maximum total friction force is Fmax = 0.15*2 = 0.3 N. The result for Fx = 0.3 N is shown in Fig. vnl07, k. As one can see full slippage develops in contact area, but left lower edge of the upper beam is still almost coincides with the edge of the lower beam.
Fig. vnl07, k
Load case 4. In this load case the shifting force Fx is increased to 0.31 N. The force exceeds the maximum friction force and the upper beam not only deforms but also starts moving as a rigid body.
Load case 5. In this load case the shifting force Fx is decreased to 0.29 N in order to not to exceed the maximum friction force. As one can see only partial slippage occurs in this case. There is a clear "sticking" contact area at the left end of the beams.
Page 93
TEST VNL08: PINCHED HEMISPHERICAL SHELL
PROBLEM DEFINITION
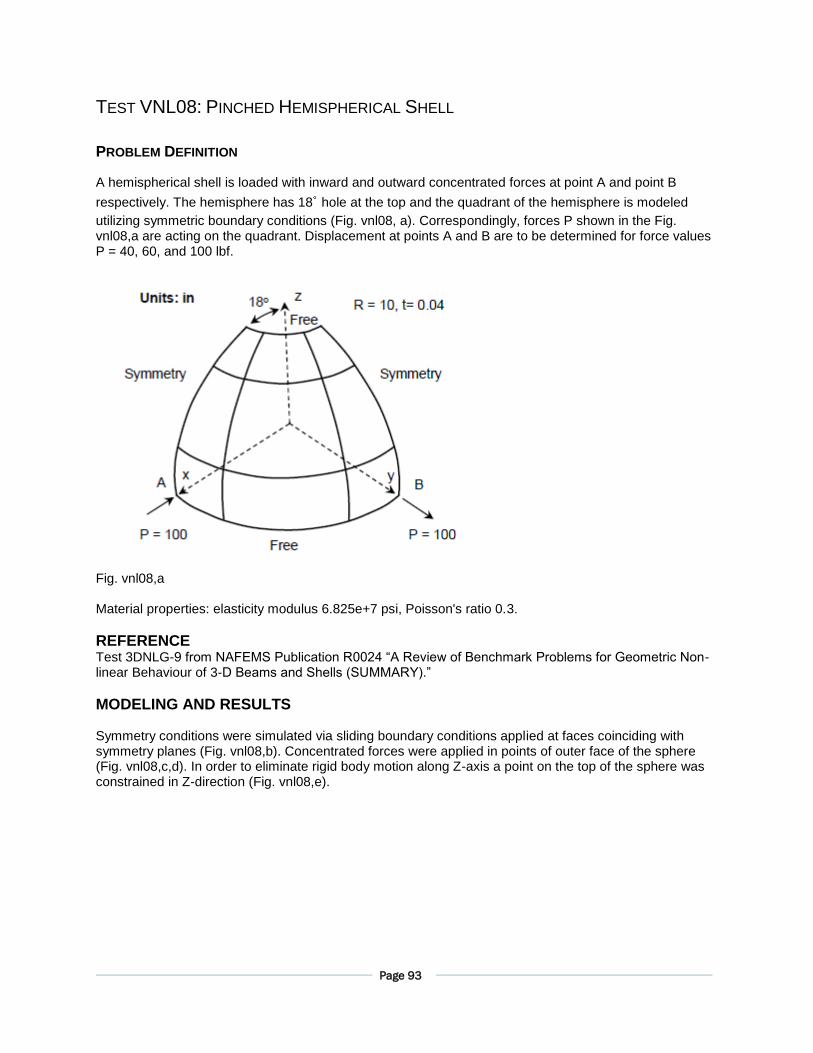
A hemispherical shell is loaded with inward and outward concentrated forces at point A and point B
respectively. The hemisphere has 18˚ hole at the top and the quadrant of the hemisphere is modeled
utilizing symmetric boundary conditions (Fig. vnl08, a). Correspondingly, forces P shown in the Fig. vnl08,a are acting on the quadrant. Displacement at points A and B are to be determined for force values P = 40, 60, and 100 lbf.
Fig. vnl08,a Material properties: elasticity modulus 6.825e+7 psi, Poisson's ratio 0.3.
REFERENCE Test 3DNLG-9 from NAFEMS Publication R0024 “A Review of Benchmark Problems for Geometric Non-linear Behaviour of 3-D Beams and Shells (SUMMARY).”
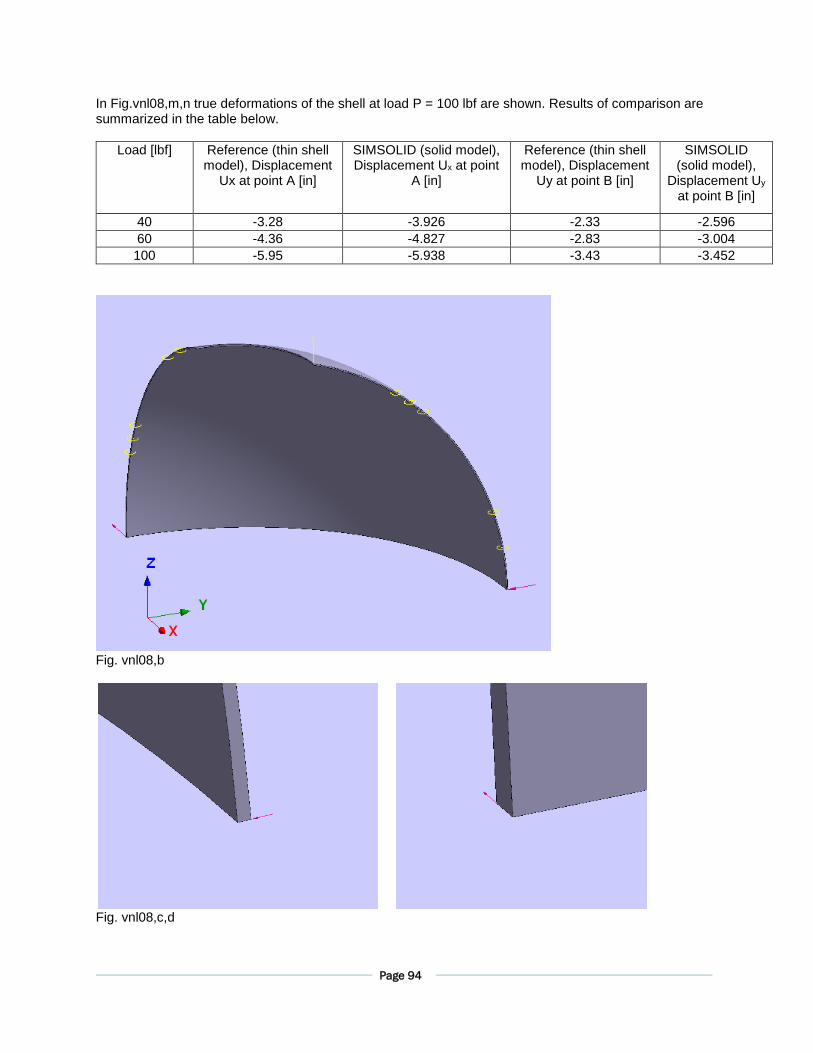
MODELING AND RESULTS Symmetry conditions were simulated via sliding boundary conditions applied at faces coinciding with symmetry planes (Fig. vnl08,b). Concentrated forces were applied in points of outer face of the sphere (Fig. vnl08,c,d). In order to eliminate rigid body motion along Z-axis a point on the top of the sphere was constrained in Z-direction (Fig. vnl08,e).
Page 94
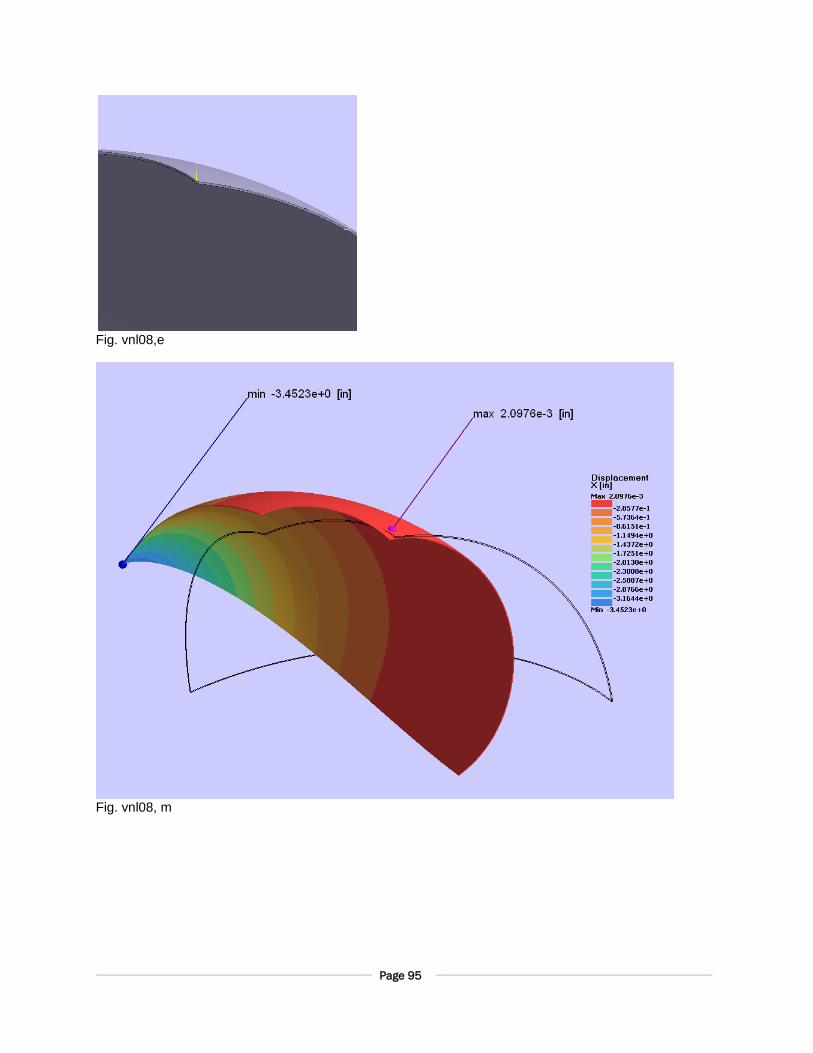
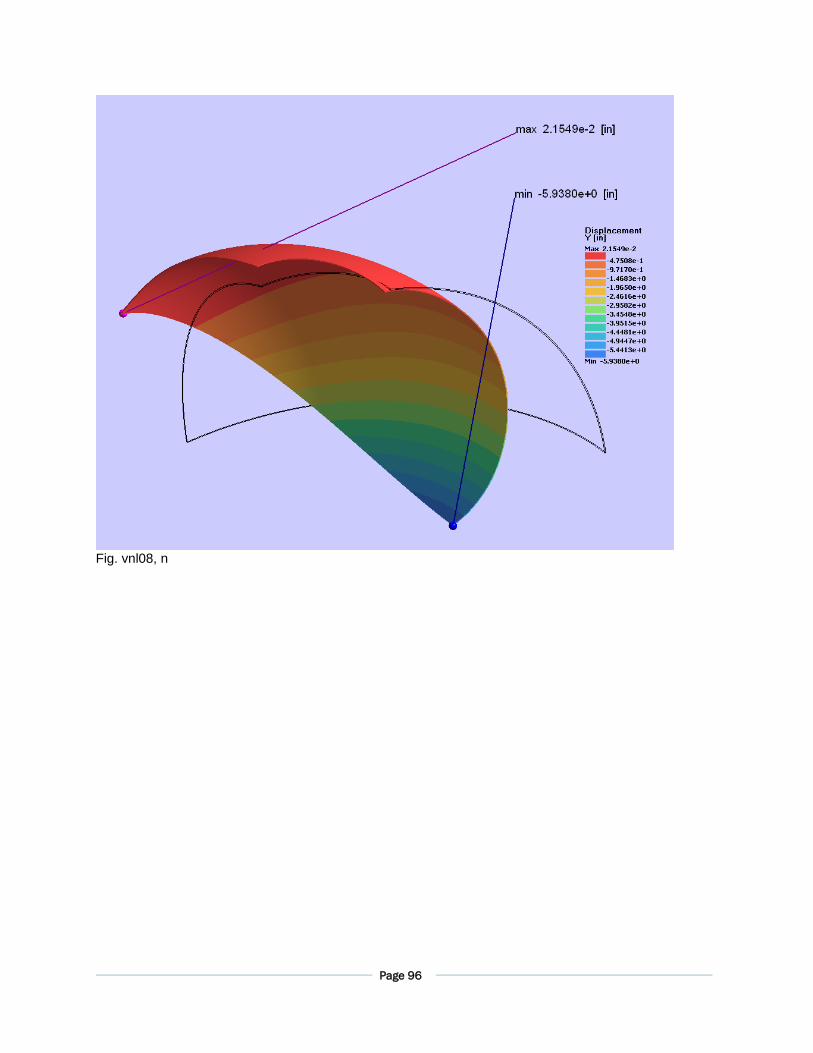
In Fig.vnl08,m,n true deformations of the shell at load P = 100 lbf are shown. Results of comparison are summarized in the table below.
Load [lbf] Reference (thin shell model), Displacement
Ux at point A [in]
SIMSOLID (solid model), Displacement Ux at point
A [in]
Reference (thin shell model), Displacement
Uy at point B [in]
SIMSOLID (solid model),
Displacement Uy at point B [in]
40 -3.28 -3.926 -2.33 -2.596
60 -4.36 -4.827 -2.83 -3.004
100 -5.95 -5.938 -3.43 -3.452
Fig. vnl08,b
Fig. vnl08,c,d
Page 95
Fig. vnl08,e
Fig. vnl08, m
Page 96
Fig. vnl08, n
Page 97
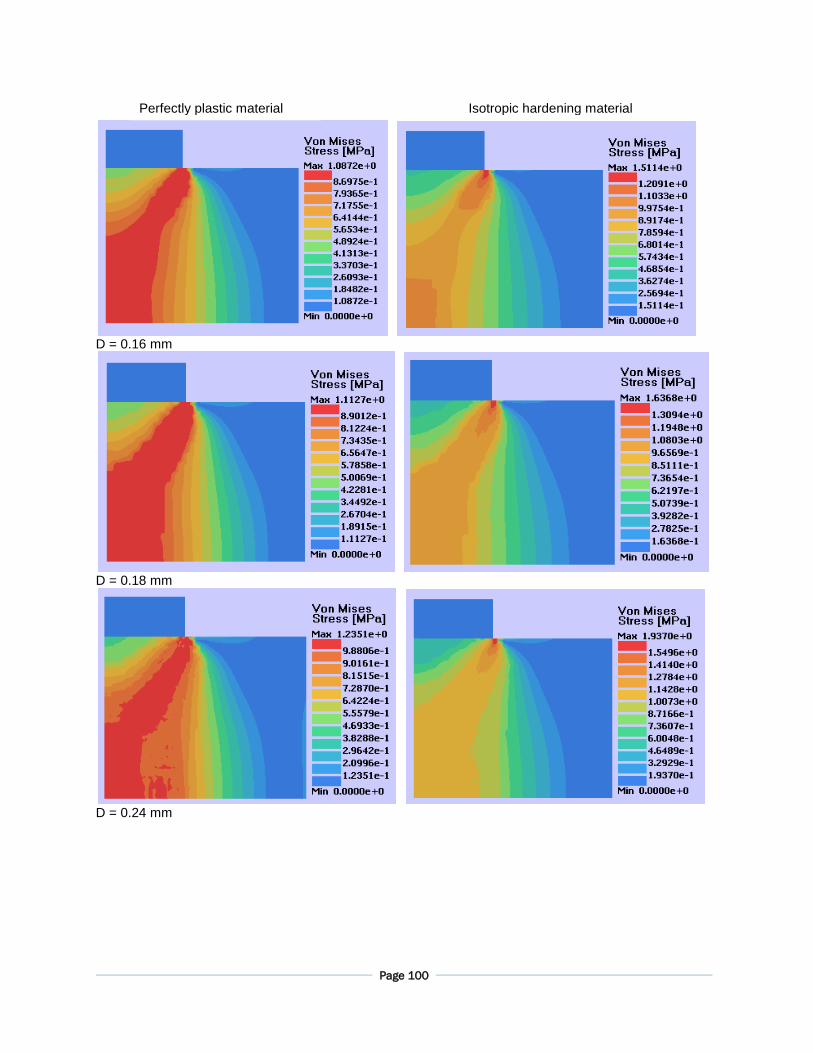
TEST VNL09: RIGID PUNCH PLASTICITY
PROBLEM DEFINITION
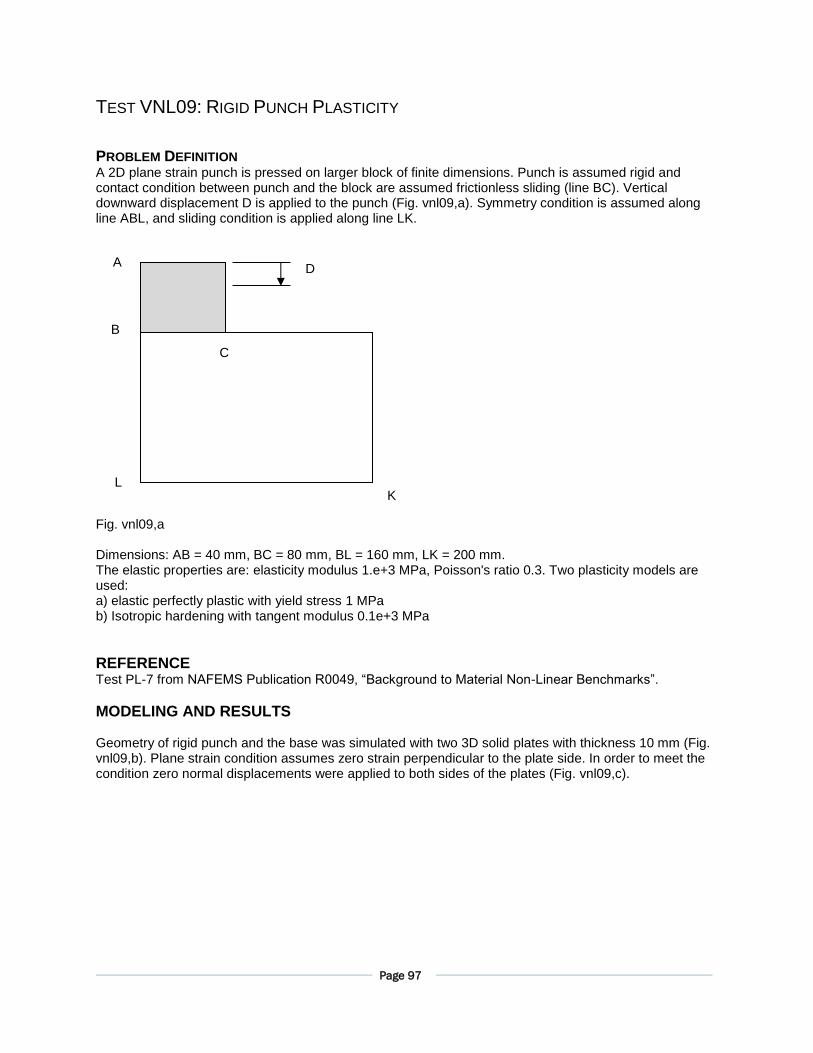
A 2D plane strain punch is pressed on larger block of finite dimensions. Punch is assumed rigid and contact condition between punch and the block are assumed frictionless sliding (line BC). Vertical downward displacement D is applied to the punch (Fig. vnl09,a). Symmetry condition is assumed along line ABL, and sliding condition is applied along line LK. Fig. vnl09,a Dimensions: AB = 40 mm, BC = 80 mm, BL = 160 mm, LK = 200 mm. The elastic properties are: elasticity modulus 1.e+3 MPa, Poisson's ratio 0.3. Two plasticity models are used: a) elastic perfectly plastic with yield stress 1 MPa b) Isotropic hardening with tangent modulus 0.1e+3 MPa
REFERENCE Test PL-7 from NAFEMS Publication R0049, “Background to Material Non-Linear Benchmarks”.
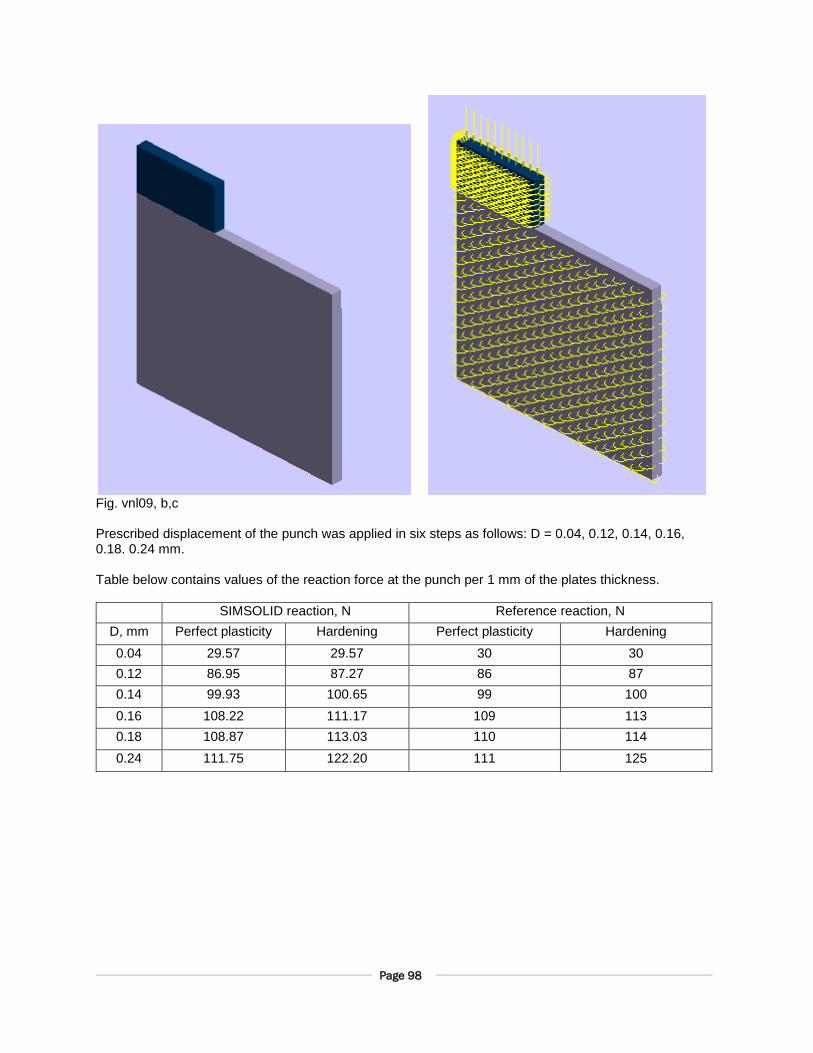
MODELING AND RESULTS Geometry of rigid punch and the base was simulated with two 3D solid plates with thickness 10 mm (Fig. vnl09,b). Plane strain condition assumes zero strain perpendicular to the plate side. In order to meet the condition zero normal displacements were applied to both sides of the plates (Fig. vnl09,c).
A
B
L K
D
C
Page 98
Fig. vnl09, b,c Prescribed displacement of the punch was applied in six steps as follows: D = 0.04, 0.12, 0.14, 0.16, 0.18. 0.24 mm. Table below contains values of the reaction force at the punch per 1 mm of the plates thickness.
SIMSOLID reaction, N Reference reaction, N
D, mm Perfect plasticity Hardening Perfect plasticity Hardening
0.04 29.57 29.57 30 30
0.12 86.95 87.27 86 87
0.14 99.93 100.65 99 100
0.16 108.22 111.17 109 113
0.18 108.87 113.03 110 114
0.24 111.75 122.20 111 125
Page 99
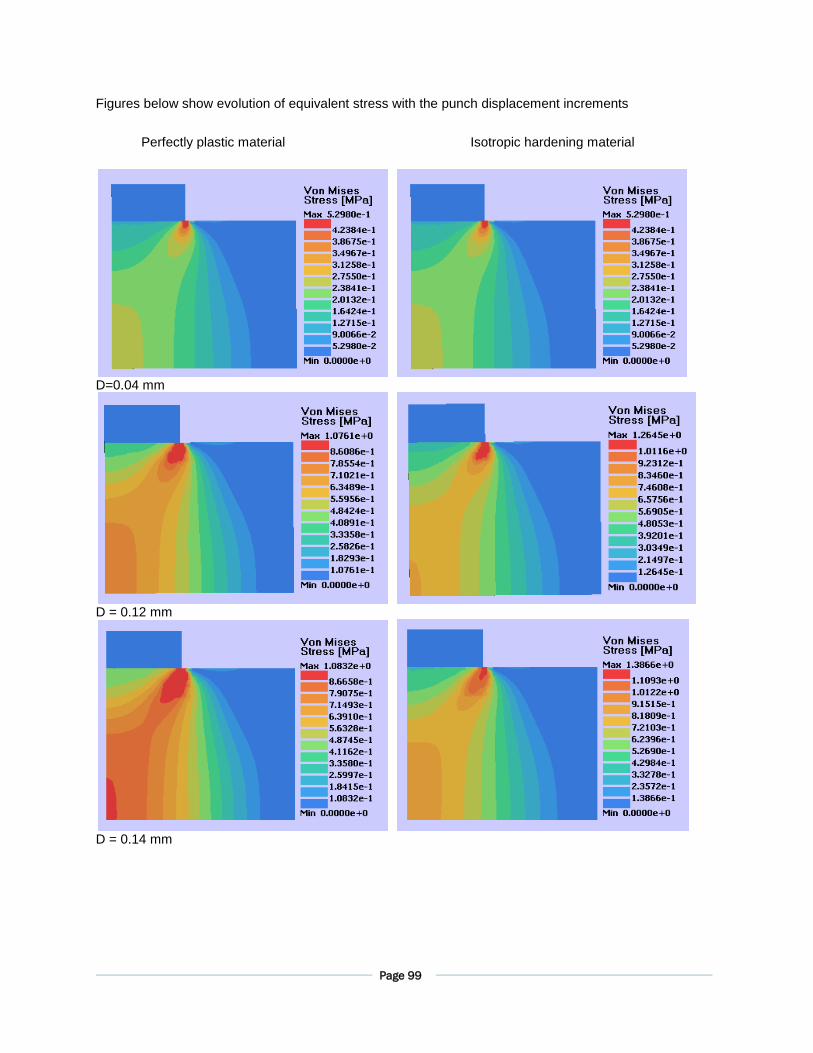
Figures below show evolution of equivalent stress with the punch displacement increments
D=0.04 mm
D = 0.12 mm
D = 0.14 mm
Perfectly plastic material Isotropic hardening material
Page 100
D = 0.16 mm
D = 0.18 mm
D = 0.24 mm
Perfectly plastic material Isotropic hardening material