Embed Size (px)
Citation preview

�
�������������������������� �������������������������������������������������������
�������������������������������������
���������������������������������������������
������ �� ��� ���� ����� ��������� ����� �������� ���� ��� � ��� ���� ��������
���������������� �������������������������������������������������
�������������������������������������������������
����������������� ��
�
�
�
�
������������ ���
an author's https://oatao.univ-toulouse.fr/18407
http://dx.doi.org/10.1016/j.compstruct.2017.08.055
Serra, Joël and Pierré, Jean-Emmanuel and Passieux, Jean-Charles and Périé, Jean-Noel and Bouvet, Christophe and
Castanié, Bruno and Petiot, Caroline Validation and modeling of aeronautical composite structures subjected to
combined loadings: The VERTEX project. Part 2: Load envelopes for the assessment of panels with large notches.
(2017) Composite Structures, vol. 180. pp. 550-567. ISSN 0263-8223
Validation and modeling of aeronautical composite structures subjectedto combined loadings: The VERTEX project. Part 2: Load envelopes forthe assessment of panels with large notches
⇑ Corresponding author.E-mail address: [email protected] (B. Castanié).
Joël Serra a, J.E. Pierré a, J.C. Passieux a, J.N Périé a, Christophe Bouvet a, Bruno Castanié a,⇑, C. Petiot ba Institut Clément Ader (ICA), Université de Toulouse, CNRS UMR 5312-INSA-ISAE-Mines Albi-UPS, Toulouse, FrancebAirbus Group Innovations, 12 rue Pasteur, 92152 Suresnes, France
Keywords:Composite structuresStructural testingMultiaxial loadingFinite element-digital image correlationDamageFailureModel
a b s t r a c t
One of the important issues in the certification of composite aeronautical structures is large notches. Inthis paper, tests are carried out on technological specimens under tensile, shear and combined loadingsusing the VERTEX test rig presented in the first part of this publication. Strong interactions between post-buckling and propagation of cuts are observed. The specifically developed FE-SDIC methodology pre-sented allows a first dialog between calculation and testing. The Discrete Ply Modeling method is ableto compute the onset of failure in such complex tests. New test responses called ‘‘envelope curves” areproposed and are obtained by following a load path that allows the behavior of the notched structureto be validated for certification purposes. This methodology should eventually lead to a new vision ofthe test pyramid with the help of ‘‘Predictive Virtual Testing” procedures.
1. Introduction
The general context of the validation of composite aeronauticalstructures was recalled in the first part of this article [1]. Certifica-tion is still largely based on an experimental, semi-empiricalapproach called the ‘‘pyramid of tests” (Rouchon [2]). Thisapproach is applied to structural sizing in general (common areas,structural details, junctions, etc.), taking into account non-detectable low energy impact damage (below the Barely VisibleImpact Damage - BVID) or exceptional damage. In the latter cate-gory, aircraft manufacturers must justify their structure under sta-tic loads with a large crack that could occur as a result of anexceptional event. Moreover, for certification purposes, this crackmust pass through a fuselage frame and is commonly named a‘‘two-bay crack”. In general, the certification tests are carried outat full scale with internal pressure as shown in the Airbus test(Fig. 1). As part of aeronautical programs, tests of sandwich panelswith large cuts have also been carried out by means of the FASTERFixture Test [3]. These tests were widely instrumented by a combi-nation of DIC (Digital Image Correlation) analysis, infrared ther-mography and acoustic emission. They were carried out under
various combinations of biaxial tension and internal pressure.The size of the panels was several square meters. Cross-cuttingtests were also carried out on PRSEUS type structures on the samesystem [4].
However, the majority of academic studies on notches are per-formed at the coupon scale for practical reasons. From an applica-tion point of view, due to the complexity of crack tip failure modes,many holes or cracks are sized using point-stress, by calculatingthe damage at a distance d0 from the stress concentration [5,6].For this model, the stress is averaged over this distance d0, calledthe ‘‘average distance”, in order to smooth the stress field in thesurroundings of the hole/notch. One of the important issues gener-ated by the study of holes and cracks is the scaling effect [7–12],which can be rendered by ‘‘averaged stresses” type models evenif the distance d0 can depend on several factors [6], such as stack-ing sequence, material, and hole/notch size. The size effect leads, inparticular, to a small hole being less penalizing than a large hole(for homothetic size of structures). Numerous experimental andnumerical investigations have been conducted in order to explainthe physical meaning of the size effect [7–12]. For example,Wisnom et al. [9,10] showed that the strength of notched compos-ite laminates decreased when the notch size increased andconcluded that the hole size effect was triggered by the presenceof non-critical damage at the ply level, such as fiber failure, ply

Fig. 1. Typical ‘‘Two-bay crack” test (Courtesy of Airbus). Fig. 3. View of a notched specimen bolted on the test rig.
splitting, delamination or matrix cracking in the vicinity of thehole, smoothing the stress concentration. The ratio of the size ofthis ‘‘fracture process zone” to the specimen size explains thestrength difference between small and large specimens. Recently,by using our ownmodeling strategies known as ‘‘DPM” for DiscretePly Modelling, we succeeded in capturing this size effect on openhole tensile specimens [12] and also on notched specimens [13].This strategy was initially developed to simulate low energyimpact on laminates [14,15] or pull-through [16]. Thanks to itsunique capability to capture the failure scenario, the discrete nat-ure of matrix cracking and inter- and intra-laminar damage cou-pling, this strategy was recently extended to in-plane issues[12,13,17]. In the present paper, this strategy will be extended tothe issue of large notches under complex loading and will berecalled only very briefly below.
The VERTEX test method and the FE-SDIC (Finite Element-Stereo Digital Image correlation) measurement strategy have beenpresented in the first part [1] and are based on the authors’ pastexperience on complex loadings and structural testing [18,19].Details of the VERTEX collaborative project are given in [20]. Testscarried out on technological specimens and under complex tensile,shear and combined loadings using the VERTEX method are pre-sented in the first part of this paper. A first approach to the calcu-lation/tests dialog on double thickness specimens under tensileand shear loading is then developed. Eventually, new tests called‘‘envelope” tests are proposed and performed. They allow a loadpath to be followed with the aim of validating the behavior of
Fig. 2. Vertex
the notched structure. Prospects regarding research directionsand in terms of approaches for the certification of composite struc-tures are also proposed.
2. Materials and methods
2.1. Description of specimens and tests
The stacking sequences were the same as in [12,13]. The plieswere made of Hexcel’s T700-M21 carbon epoxy unidirectionallaminate with a nominal thickness of 0.125 mm. Two specimenswere also manufactured with a double thickness ply of0.250 mm. Three symmetrical stacking sequences of 13 plies werestudied. The three different stackings (C3-1, C3-2, C3-3) presentedthe same number of plies in each direction (0�, 90� and ±45�), andonly the relative position of the plies changed between layups:
– C3-1 [45/�45/X/X/X/90/0/90/X/X/X/�45/45]– C3-2 [X/X/X/X/0/90/0/90/0/X/X/X/X]– C3-3 [X/X/X/X/X/0/0/0/X/X/X/X/X]
Specimen dimensions were 560 � 540 mm2 with a central areaof interest of 400 � 400 mm2 [1]. A central crack 100 mm long and2 mm wide was milled in the center of the specimen [13]. The pre-liminary test carried out in [1] made it possible to demonstratethat the fasteners sustained the loads without the need for rein-forcement plies and therefore the test specimens had a constant
test Rig.
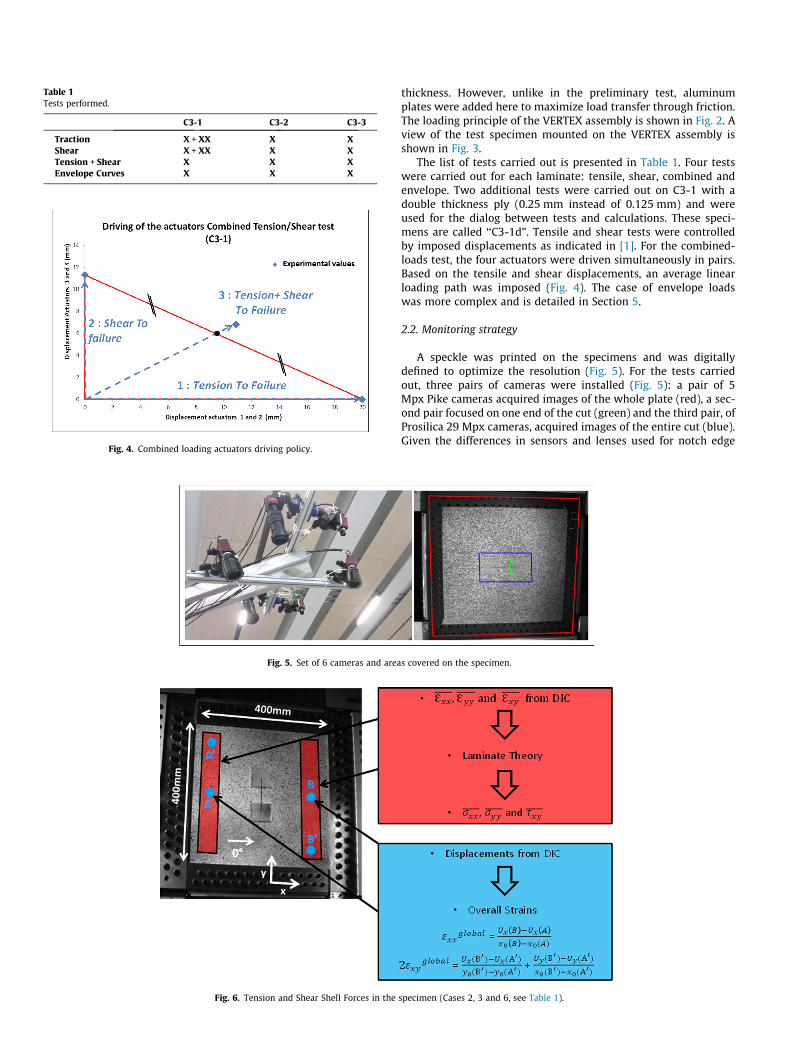
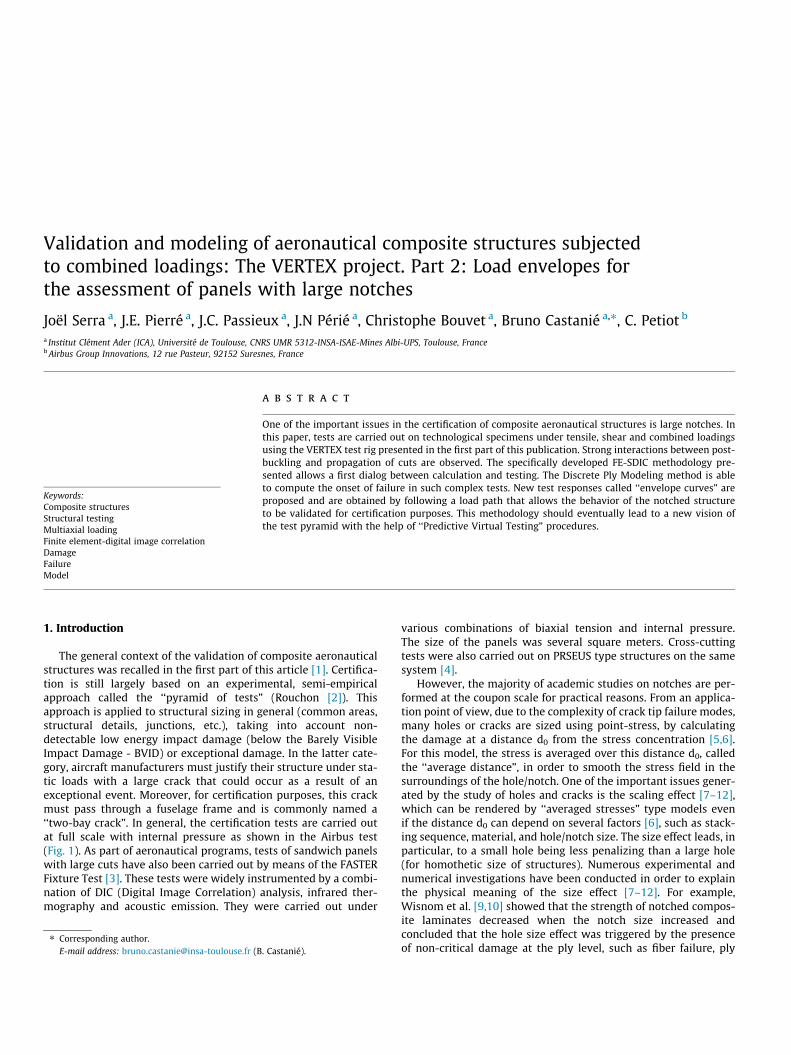
Table 1Tests performed.
C3-1 C3-2 C3-3
Traction X + XX X XShear X + XX X XTension + Shear X X XEnvelope Curves X X X
Fig. 4. Combined loading actuators driving policy.
Fig. 5. Set of 6 cameras and area
Fig. 6. Tension and Shear Shell Forces in the
thickness. However, unlike in the preliminary test, aluminumplates were added here to maximize load transfer through friction.The loading principle of the VERTEX assembly is shown in Fig. 2. Aview of the test specimen mounted on the VERTEX assembly isshown in Fig. 3.
The list of tests carried out is presented in Table 1. Four testswere carried out for each laminate: tensile, shear, combined andenvelope. Two additional tests were carried out on C3-1 with adouble thickness ply (0.25 mm instead of 0.125 mm) and wereused for the dialog between tests and calculations. These speci-mens are called ‘‘C3-1d”. Tensile and shear tests were controlledby imposed displacements as indicated in [1]. For the combined-loads test, the four actuators were driven simultaneously in pairs.Based on the tensile and shear displacements, an average linearloading path was imposed (Fig. 4). The case of envelope loadswas more complex and is detailed in Section 5.
2.2. Monitoring strategy
A speckle was printed on the specimens and was digitallydefined to optimize the resolution (Fig. 5). For the tests carriedout, three pairs of cameras were installed (Fig. 5): a pair of 5Mpx Pike cameras acquired images of the whole plate (red), a sec-ond pair focused on one end of the cut (green) and the third pair, ofProsilica 29 Mpx cameras, acquired images of the entire cut (blue).Given the differences in sensors and lenses used for notch edge
s covered on the specimen.
specimen (Cases 2, 3 and 6, see Table 1).
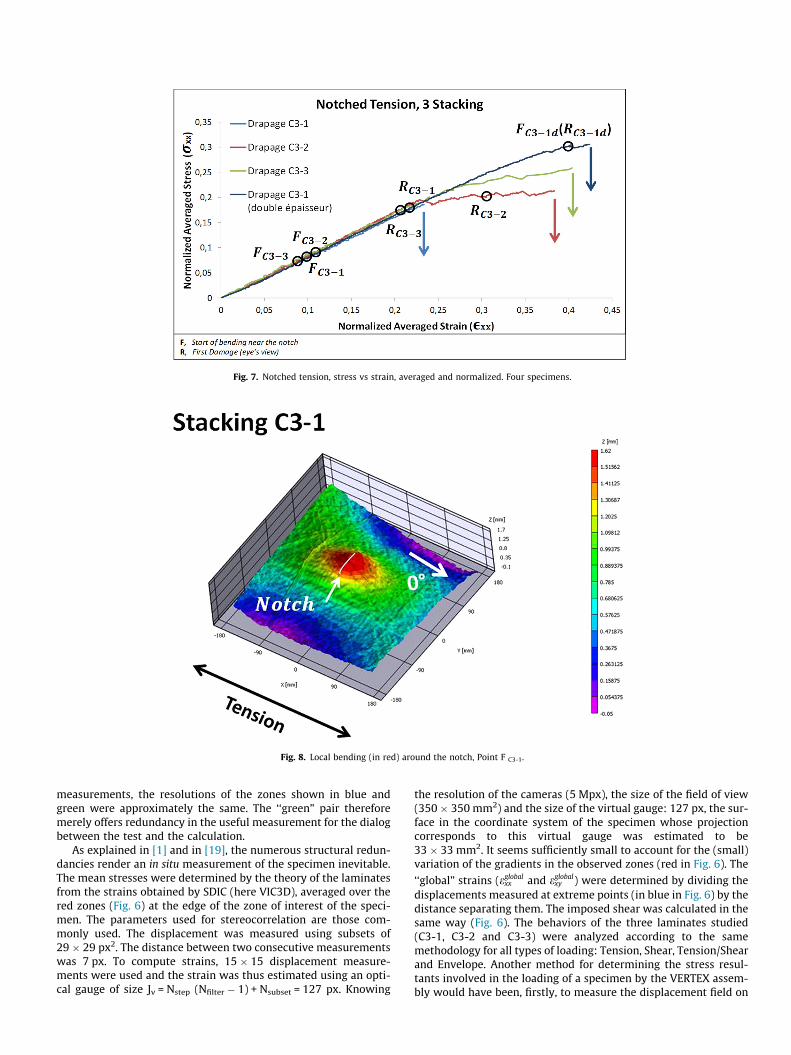
Fig. 7. Notched tension, stress vs strain, averaged and normalized. Four specimens.
Fig. 8. Local bending (in red) around the notch, Point F C3-1.
measurements, the resolutions of the zones shown in blue andgreen were approximately the same. The ‘‘green” pair thereforemerely offers redundancy in the useful measurement for the dialogbetween the test and the calculation.
As explained in [1] and in [19], the numerous structural redun-dancies render an in situ measurement of the specimen inevitable.The mean stresses were determined by the theory of the laminatesfrom the strains obtained by SDIC (here VIC3D), averaged over thered zones (Fig. 6) at the edge of the zone of interest of the speci-men. The parameters used for stereocorrelation are those com-monly used. The displacement was measured using subsets of29 � 29 px2. The distance between two consecutive measurementswas 7 px. To compute strains, 15 � 15 displacement measure-ments were used and the strain was thus estimated using an opti-cal gauge of size Jv = Nstep (Nfilter � 1) + Nsubset = 127 px. Knowing
the resolution of the cameras (5 Mpx), the size of the field of view(350 � 350 mm2) and the size of the virtual gauge: 127 px, the sur-face in the coordinate system of the specimen whose projectioncorresponds to this virtual gauge was estimated to be33 � 33 mm2. It seems sufficiently small to account for the (small)variation of the gradients in the observed zones (red in Fig. 6). The
‘‘global” strains (eglobalxx and eglobalxy ) were determined by dividing thedisplacements measured at extreme points (in blue in Fig. 6) by thedistance separating them. The imposed shear was calculated in thesame way (Fig. 6). The behaviors of the three laminates studied(C3-1, C3-2 and C3-3) were analyzed according to the samemethodology for all types of loading: Tension, Shear, Tension/Shearand Envelope. Another method for determining the stress resul-tants involved in the loading of a specimen by the VERTEX assem-bly would have been, firstly, to measure the displacement field on
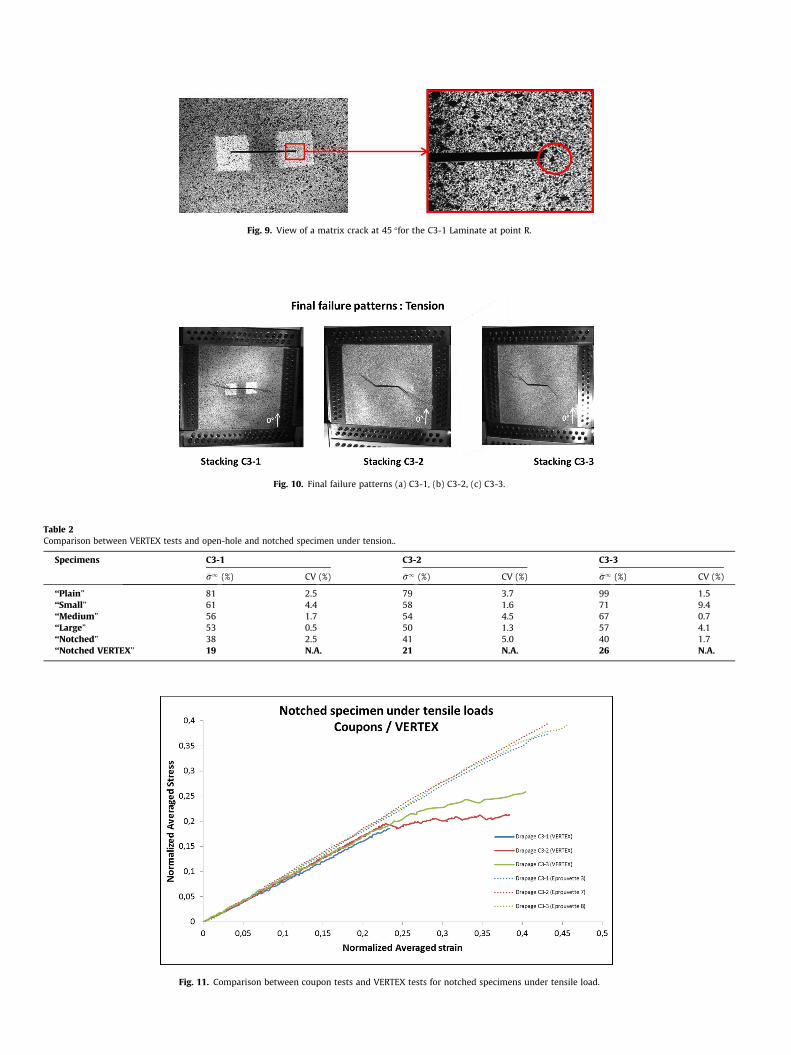
Fig. 9. View of a matrix crack at 45 �for the C3-1 Laminate at point R.
Fig. 10. Final failure patterns (a) C3-1, (b) C3-2, (c) C3-3.
Table 2Comparison between VERTEX tests and open-hole and notched specimen under tension..
Specimens C3-1 C3-2 C3-3
�r1 (%) CV (%) �r1 (%) CV (%) �r1 (%) CV (%)
‘‘Plain” 81 2.5 79 3.7 99 1.5‘‘Small” 61 4.4 58 1.6 71 9.4‘‘Medium” 56 1.7 54 4.5 67 0.7‘‘Large” 53 0.5 50 1.3 57 4.1‘‘Notched” 38 2.5 41 5.0 40 1.7‘‘Notched VERTEX” 19 N.A. 21 N.A. 26 N.A.
Fig. 11. Comparison between coupon tests and VERTEX tests for notched specimens under tensile load.
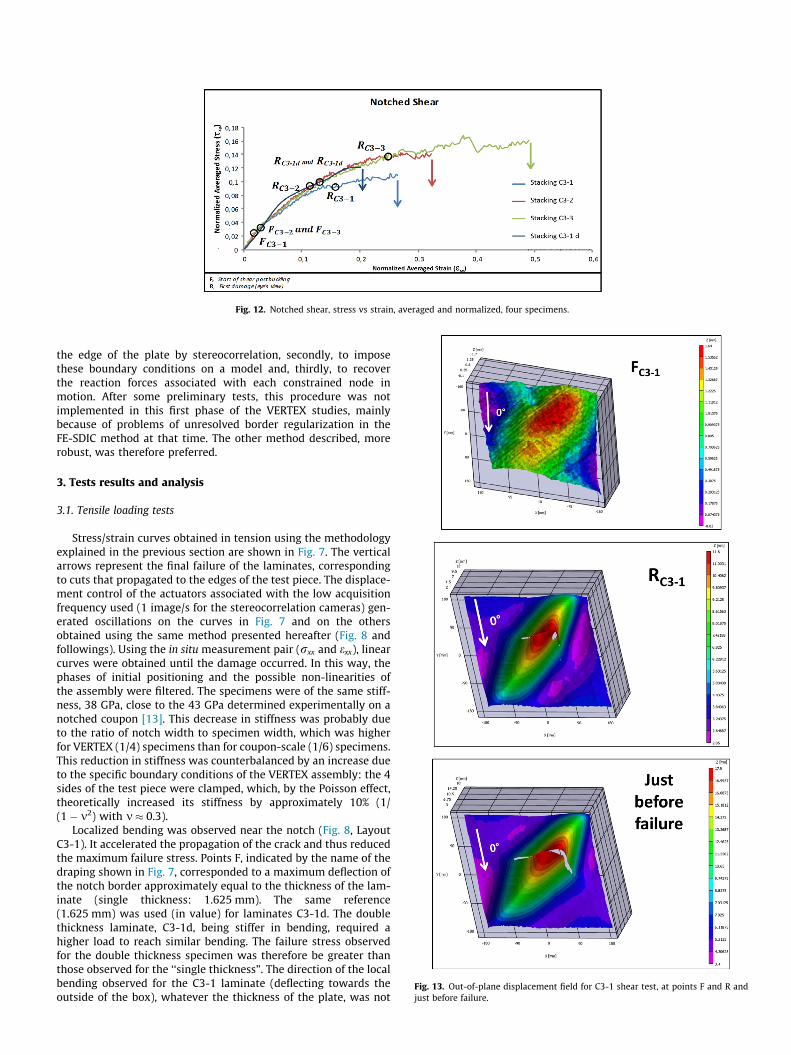
Fig. 13. Out-of-plane displacement field for C3-1 shear test, at points F and R andjust before failure.
Fig. 12. Notched shear, stress vs strain, averaged and normalized, four specimens.
the edge of the plate by stereocorrelation, secondly, to imposethese boundary conditions on a model and, thirdly, to recoverthe reaction forces associated with each constrained node inmotion. After some preliminary tests, this procedure was notimplemented in this first phase of the VERTEX studies, mainlybecause of problems of unresolved border regularization in theFE-SDIC method at that time. The other method described, morerobust, was therefore preferred.
3. Tests results and analysis
3.1. Tensile loading tests
Stress/strain curves obtained in tension using the methodologyexplained in the previous section are shown in Fig. 7. The verticalarrows represent the final failure of the laminates, correspondingto cuts that propagated to the edges of the test piece. The displace-ment control of the actuators associated with the low acquisitionfrequency used (1 image/s for the stereocorrelation cameras) gen-erated oscillations on the curves in Fig. 7 and on the othersobtained using the same method presented hereafter (Fig. 8 andfollowings). Using the in situ measurement pair (rxx and exx), linearcurves were obtained until the damage occurred. In this way, thephases of initial positioning and the possible non-linearities ofthe assembly were filtered. The specimens were of the same stiff-ness, 38 GPa, close to the 43 GPa determined experimentally on anotched coupon [13]. This decrease in stiffness was probably dueto the ratio of notch width to specimen width, which was higherfor VERTEX (1/4) specimens than for coupon-scale (1/6) specimens.This reduction in stiffness was counterbalanced by an increase dueto the specific boundary conditions of the VERTEX assembly: the 4sides of the test piece were clamped, which, by the Poisson effect,theoretically increased its stiffness by approximately 10% (1/(1 � m2) with m � 0.3).
Localized bending was observed near the notch (Fig. 8, LayoutC3-1). It accelerated the propagation of the crack and thus reducedthe maximum failure stress. Points F, indicated by the name of thedraping shown in Fig. 7, corresponded to a maximum deflection ofthe notch border approximately equal to the thickness of the lam-inate (single thickness: 1.625 mm). The same reference(1.625 mm) was used (in value) for laminates C3-1d. The doublethickness laminate, C3-1d, being stiffer in bending, required ahigher load to reach similar bending. The failure stress observedfor the double thickness specimen was therefore be greater thanthose observed for the ‘‘single thickness”. The direction of the localbending observed for the C3-1 laminate (deflecting towards theoutside of the box), whatever the thickness of the plate, was not
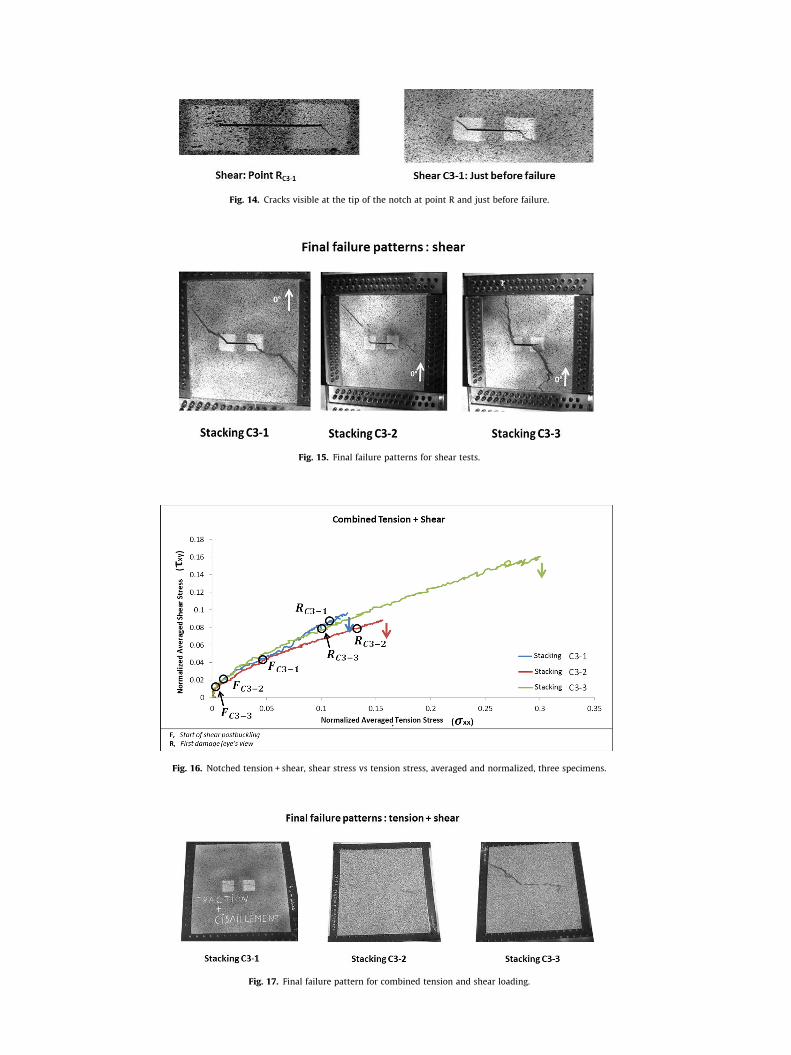
Fig. 14. Cracks visible at the tip of the notch at point R and just before failure.
Fig. 15. Final failure patterns for shear tests.
Fig. 16. Notched tension + shear, shear stress vs tension stress, averaged and normalized, three specimens.
Fig. 17. Final failure pattern for combined tension and shear loading.

Fig. 18. Summary of the behavior of the three notched laminates under tension, shear and combined loading.
Fig. 19. Discrete ply model main principle and mesh coincidence at interface.
the same as that observed for laminates C3-2 and C3-3 (towardsthe inside of the loading box). The phenomenon thus seems veryunstable and may depend on the initial imperfections of the plate.To verify the latter hypothesis, several tension tests should be car-ried out on the same laminate and the imperfections measured. Itis also possible that this nonlinear geometrical phenomenon wasdue to the introduction of a local bending moment at the junctionbetween the frame and the upper part of the central box formed bythe composite specimen, a problem already identified in [19]. Nev-ertheless, this behavior was not detected on preliminary tests onaluminum plates [1].
The first failures visually identified are indicated by the points Rin Fig. 7. For the C3-1 laminate, the failure was initiated at the
notch tip and appeared just before total laminate failure. Crackingof the matrix oriented at 45� on the right side of the notch (Fig. 9),was detected (RC3�1). The main difference between the rupture sce-nario of the VERTEX test specimens and those of the simple testspecimens studied in [13] were the influence of boundary condi-tions. The tension applied in the Vertex test bench is ‘‘quasi pure”because the plate is bolted on the 4 sides. Also, the edges of thenotch are relatively close to the bolted areas. In this case, the prin-ciple of Saint-Venant is not satisfied, and this is what happens inmost ‘‘structural” tests. Nevertheless, this type of complex test ismore representative of the real structures, such as a stiffened fuse-lage and provides more information than classical tests performedon coupons (Fig. 1).
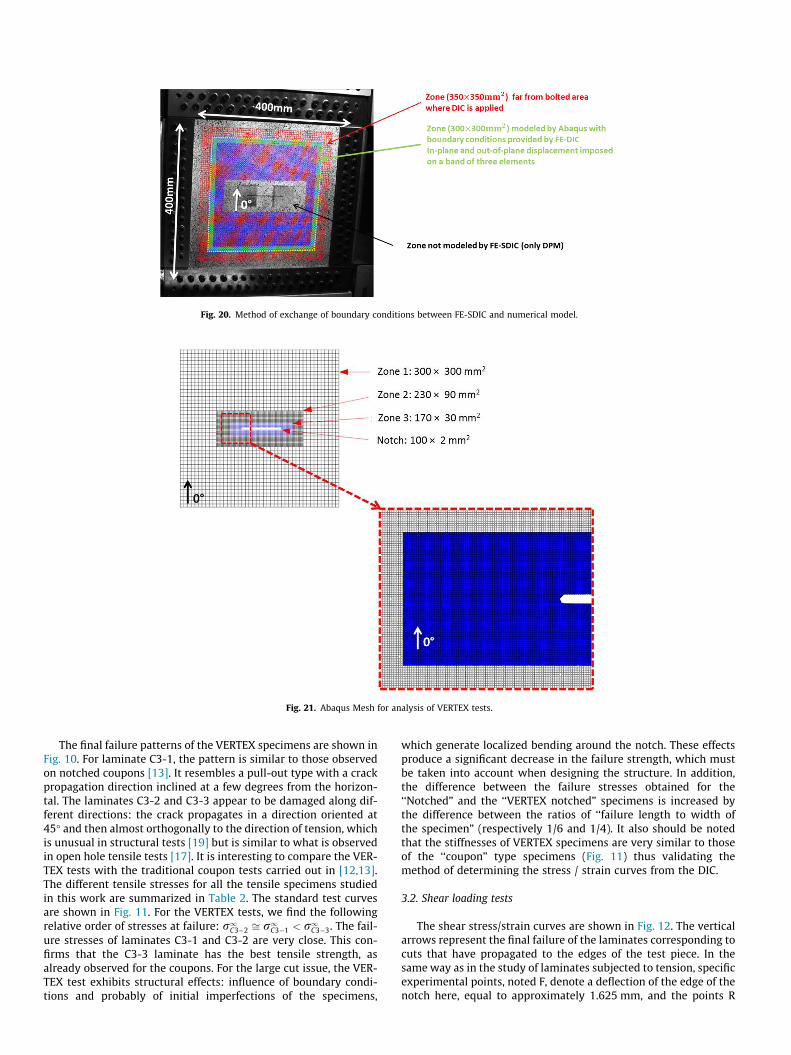
Fig. 20. Method of exchange of boundary conditions between FE-SDIC and numerical model.
Fig. 21. Abaqus Mesh for analysis of VERTEX tests.
The final failure patterns of the VERTEX specimens are shown inFig. 10. For laminate C3-1, the pattern is similar to those observedon notched coupons [13]. It resembles a pull-out type with a crackpropagation direction inclined at a few degrees from the horizon-tal. The laminates C3-2 and C3-3 appear to be damaged along dif-ferent directions: the crack propagates in a direction oriented at45� and then almost orthogonally to the direction of tension, whichis unusual in structural tests [19] but is similar to what is observedin open hole tensile tests [17]. It is interesting to compare the VER-TEX tests with the traditional coupon tests carried out in [12,13].The different tensile stresses for all the tensile specimens studiedin this work are summarized in Table 2. The standard test curvesare shown in Fig. 11. For the VERTEX tests, we find the followingrelative order of stresses at failure: r1
C3�2 ffi r1C3�1 < r1
C3�3. The fail-ure stresses of laminates C3-1 and C3-2 are very close. This con-firms that the C3-3 laminate has the best tensile strength, asalready observed for the coupons. For the large cut issue, the VER-TEX test exhibits structural effects: influence of boundary condi-tions and probably of initial imperfections of the specimens,
which generate localized bending around the notch. These effectsproduce a significant decrease in the failure strength, which mustbe taken into account when designing the structure. In addition,the difference between the failure stresses obtained for the‘‘Notched” and the ‘‘VERTEX notched” specimens is increased bythe difference between the ratios of ‘‘failure length to width ofthe specimen” (respectively 1/6 and 1/4). It also should be notedthat the stiffnesses of VERTEX specimens are very similar to thoseof the ‘‘coupon” type specimens (Fig. 11) thus validating themethod of determining the stress / strain curves from the DIC.
3.2. Shear loading tests
The shear stress/strain curves are shown in Fig. 12. The verticalarrows represent the final failure of the laminates corresponding tocuts that have propagated to the edges of the test piece. In thesame way as in the study of laminates subjected to tension, specificexperimental points, noted F, denote a deflection of the edge of thenotch here, equal to approximately 1.625 mm, and the points R

Fig. 22. Experimental/numerical comparison for VERTEX tension test.
Fig. 23. DPM modeling of the first damage (point R).
represent the first damage visually observed (on the surface).Because of the large area of the specimens and their small thick-ness, the shear buckling occurs quite early and explains the posi-tion of points F and the first inflection of the test curves.Buckling occurs a little later in C3-3 and C3-2 than in C3-1 dueto the presence of external plies at ±45�. The ‘‘double thickness”plate C3-1d logically buckles even later because of its greater stiff-ness. The shear buckling can be clearly seen at 45� in Fig. 13. Fromthe points R, the behavior of the test pieces shows a strong interac-tion between the propagation of the cracks and the postbucklingbehavior which is very difficult to describe (snap-through). Refer-ence may be made to one of the films of the shear tests (see[21]). As for tension, the first visible damage is a crack at 45� atthe notch tip (Fig. 14). The crack propagates slightly but interactswith the postbuckling [21] until sudden final failure. The shear fail-ure patterns for the three laminates are shown in Fig. 15. The fail-ure scenarios and patterns are substantially identical. Crackpropagation at 45� is expected in the case of a shear test [19],which is the case for C3-1 and C3-2 – but not for C3-3, where prop-agation is rather in the 0� direction. This can be explained by thepresence of the three 0� plies cluster in the center of the laminate.
3.3. Combined tension/Shear loading tests
The curves of the combined tensile and shear tests are pre-sented in Fig. 16. The vertical arrows here also represent sudden,and loud, propagation of the damage, associated with a significantloss of stiffness. There is a rapid change of slope due to shear buck-ling despite the presence of a tension stress. The direction of thebuckling is, however, deflected with respect to the shear (45�) witha slightly different direction (about 30�). The failure initiations(points R) are very similar to those observed previously except thatthe cracks at 45� on the surface are not observed here. The film of
one of the tests is visible in Ref. [21,22]. The final failure patternsfor the three laminates are shown in Fig. 17. The patterns are quitedifferent: for C3-1 and C3-2, the propagation is horizontal, as inpure tension and over practically the entire width of the plate.For C3-3, the failure pattern is completely asymmetrical: the prop-agation of the crack occurs almost horizontally to the left of theoriginal notch, and is oriented at +45� on the other side. In addition,the combined stress strength of this laminate is much greater thanfor the other two.
Thanks to the VERTEX tests, it is possible to draw the responseof the notched structures under under the three loading conditions.In Fig. 18, the three experimental points recorded for each config-uration (laminate/loading) studied are represented: F correspondsto the local bending (or buckling), R to the first damage visuallyobserved on the surface and the total breakage is defined when afirst significant decrease in stiffness is observed. The points corre-sponding to the tensile stresses are the closest to the abscissa axis.Those associated with shear stresses are closest to the ordinateaxis. The markers representing the tensile/shear stresses arelocated between the points mentioned above. The markers are con-nected by straight line segments to ease understanding. In the caseof tensile and shear loading, the uniaxial character of the testdegrades as a coupling mode exists in connection with the controldisplacement driving explained in [1] and the local nonlinear phe-nomena (postbuckling and local bending). Overall, C3-1 and C3-2show similar behavior. The crack propagation for C3-3 across theR-points and up to total failure is observed to be much more pro-gressive than for the other two lay-ups. Thus the results on largersamples appear to confirm that the C3-3 laminate has the bestresistance, as already noted on the coupon samples subjected totension [12,13]. In general, at this scale, the different interactionsbetween the various phenomena make it difficult to give simplepredictions of the quadratic criterion type.

Fig. 24. Comparison of the displacement fields resulting from measurement (DIC) and the numerical model between B and R (W) for maximum tension.
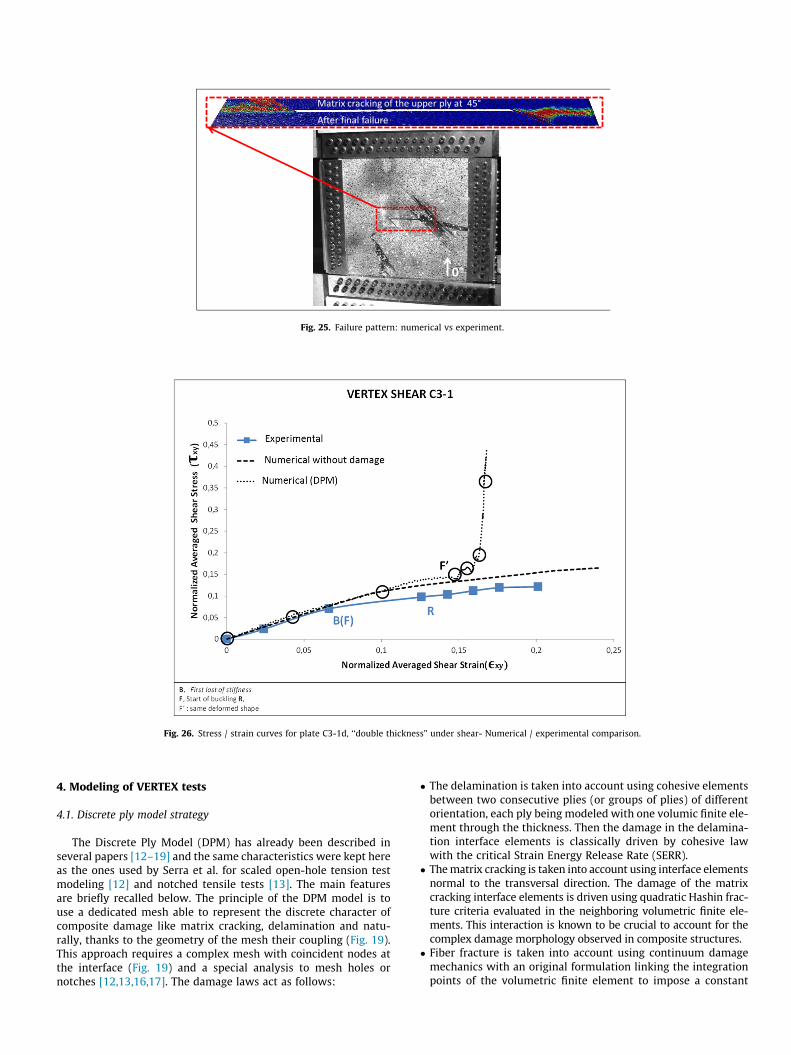
Fig. 25. Failure pattern: numerical vs experiment.
Fig. 26. Stress / strain curves for plate C3-1d, ‘‘double thickness” under shear- Numerical / experimental comparison.
4. Modeling of VERTEX tests
4.1. Discrete ply model strategy
The Discrete Ply Model (DPM) has already been described inseveral papers [12–19] and the same characteristics were kept hereas the ones used by Serra et al. for scaled open-hole tension testmodeling [12] and notched tensile tests [13]. The main featuresare briefly recalled below. The principle of the DPM model is touse a dedicated mesh able to represent the discrete character ofcomposite damage like matrix cracking, delamination and natu-rally, thanks to the geometry of the mesh their coupling (Fig. 19).This approach requires a complex mesh with coincident nodes atthe interface (Fig. 19) and a special analysis to mesh holes ornotches [12,13,16,17]. The damage laws act as follows:
� The delamination is taken into account using cohesive elementsbetween two consecutive plies (or groups of plies) of differentorientation, each ply being modeled with one volumic finite ele-ment through the thickness. Then the damage in the delamina-tion interface elements is classically driven by cohesive lawwith the critical Strain Energy Release Rate (SERR).
� Thematrix cracking is taken into account using interface elementsnormal to the transversal direction. The damage of the matrixcracking interface elements is driven using quadratic Hashin frac-ture criteria evaluated in the neighboring volumetric finite ele-ments. This interaction is known to be crucial to account for thecomplex damage morphology observed in composite structures.
� Fiber fracture is taken into account using continuum damagemechanics with an original formulation linking the integrationpoints of the volumetric finite element to impose a constant

Fig. 27. First damage in the upper ply for double thickness shear test, comparison between experiment and DPM modelling.
Fig. 28. Displacements at point F0 , shear test double thickness, comparison between DPM and test.

Fig. 29. Final failure for shear test, double thickness, comparison between experimental and numerical result.
Fig. 30. Qualitative overview of sizing policy for aeronautical composite structure.
SERR per unit area [23]. This approach can be compared tomethods using the characteristic element length, which allowmesh-size independent modeling [24–26].
Another strong advantage of this approach is the limited num-ber of parameters, all of which are provided by experimental tests[12,14,16].
4.2. Test/computation dialog
Only the test specimens with double thickness plies C3-1d aremodeled here. The general method of data exchange between afinite element model and the FE-SDIC measurements has beenexplained in the first part of this publication [1] and [27,28]. Itgives access to an experimental displacement field directlyexpressed on the finite element mesh of the model. This avoidscomplex projections and interpolations between classic DIC andFEA tools. Doing so, experimental displacement-driven simulationsare very easy to perform. In the case of the notched compositespecimens, it is described in Fig. 20. The measurement is madeon the red zone (350 � 350 mm2), which is smaller than the areaof interest (400 � 400 mm2) in order to limit edge effects due to
bolting. FE-SDIC [27,28] measurements are provided in a300 � 300 mm2 area (where the material is assumed to behaveelastically) minus a central rectangle around the notch (in whichthe evolution of the response can become strongly nonlinear).The boundary conditions are introduced in linear increments asin [1] and following the method described by Sztefek and Olsson[30]. To optimize the computation time, the Abaqus mesh usesthree different zones (Fig. 21), generally following the same princi-ple as in [13].
The three components of the displacements measured by FE-SDIC method are first imposed on the edge of zone 1,300 � 300 mm2 (white square, Fig. 20). Then, in order to be able tosimulate the rotation better, an out-of-plane displacement isimposed on 3 rows of additional nodes, (green area Fig. 20). In Zone1 (Fig. 21), the size of the FE-SDIC and Abaqus meshes are identical.The boundary conditions are then simply prescribed dof by dof. TheAbaqus mesh is made with SC8 R linear elements with one elementin the thickness, size 10 � 10 � 3.25 mm3. In Zone 2, amesh ismadefor each ply with C3D8R linear brick elements. The size of the ele-ments are equal to twice the thickness, i.e. 0.5 � 0.5 � 0.25 mm3.In Zone 3, at the edge of the crack, the DPMmethod is applied withC3D8/COH3D8 damaging elements of the same size
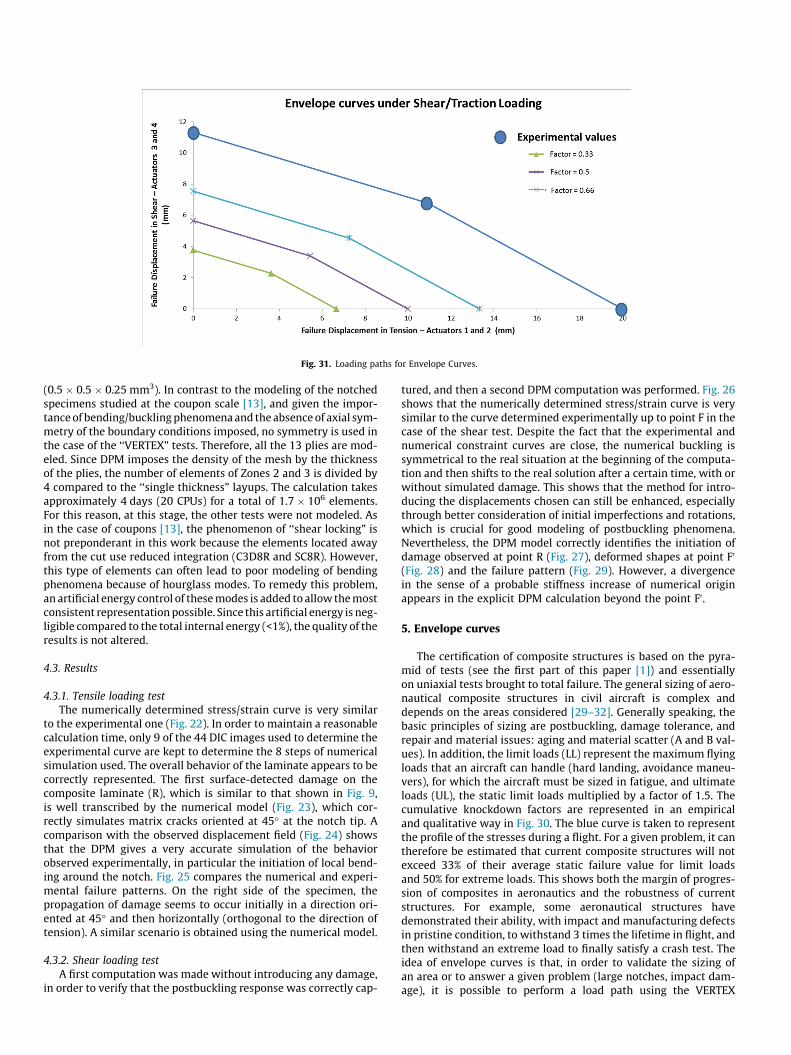
Fig. 31. Loading paths for Envelope Curves.
(0.5 � 0.5 � 0.25 mm3). In contrast to the modeling of the notchedspecimens studied at the coupon scale [13], and given the impor-tanceof bending/bucklingphenomenaand the absence of axial sym-metry of the boundary conditions imposed, no symmetry is used inthe case of the ‘‘VERTEX” tests. Therefore, all the 13 plies are mod-eled. Since DPM imposes the density of the mesh by the thicknessof the plies, the number of elements of Zones 2 and 3 is divided by4 compared to the ‘‘single thickness” layups. The calculation takesapproximately 4 days (20 CPUs) for a total of 1.7 � 106 elements.For this reason, at this stage, the other tests were not modeled. Asin the case of coupons [13], the phenomenon of ‘‘shear locking” isnot preponderant in this work because the elements located awayfrom the cut use reduced integration (C3D8R and SC8R). However,this type of elements can often lead to poor modeling of bendingphenomena because of hourglass modes. To remedy this problem,an artificial energy control of thesemodes is added to allow themostconsistent representationpossible. Since this artificial energy is neg-ligible compared to the total internal energy (<1%), the quality of theresults is not altered.
4.3. Results
4.3.1. Tensile loading testThe numerically determined stress/strain curve is very similar
to the experimental one (Fig. 22). In order to maintain a reasonablecalculation time, only 9 of the 44 DIC images used to determine theexperimental curve are kept to determine the 8 steps of numericalsimulation used. The overall behavior of the laminate appears to becorrectly represented. The first surface-detected damage on thecomposite laminate (R), which is similar to that shown in Fig. 9,is well transcribed by the numerical model (Fig. 23), which cor-rectly simulates matrix cracks oriented at 45� at the notch tip. Acomparison with the observed displacement field (Fig. 24) showsthat the DPM gives a very accurate simulation of the behaviorobserved experimentally, in particular the initiation of local bend-ing around the notch. Fig. 25 compares the numerical and experi-mental failure patterns. On the right side of the specimen, thepropagation of damage seems to occur initially in a direction ori-ented at 45� and then horizontally (orthogonal to the direction oftension). A similar scenario is obtained using the numerical model.
4.3.2. Shear loading testA first computation was made without introducing any damage,
in order to verify that the postbuckling response was correctly cap-
tured, and then a second DPM computation was performed. Fig. 26shows that the numerically determined stress/strain curve is verysimilar to the curve determined experimentally up to point F in thecase of the shear test. Despite the fact that the experimental andnumerical constraint curves are close, the numerical buckling issymmetrical to the real situation at the beginning of the computa-tion and then shifts to the real solution after a certain time, with orwithout simulated damage. This shows that the method for intro-ducing the displacements chosen can still be enhanced, especiallythrough better consideration of initial imperfections and rotations,which is crucial for good modeling of postbuckling phenomena.Nevertheless, the DPM model correctly identifies the initiation ofdamage observed at point R (Fig. 27), deformed shapes at point F0
(Fig. 28) and the failure pattern (Fig. 29). However, a divergencein the sense of a probable stiffness increase of numerical originappears in the explicit DPM calculation beyond the point F0.
5. Envelope curves
The certification of composite structures is based on the pyra-mid of tests (see the first part of this paper [1]) and essentiallyon uniaxial tests brought to total failure. The general sizing of aero-nautical composite structures in civil aircraft is complex anddepends on the areas considered [29–32]. Generally speaking, thebasic principles of sizing are postbuckling, damage tolerance, andrepair and material issues: aging and material scatter (A and B val-ues). In addition, the limit loads (LL) represent the maximum flyingloads that an aircraft can handle (hard landing, avoidance maneu-vers), for which the aircraft must be sized in fatigue, and ultimateloads (UL), the static limit loads multiplied by a factor of 1.5. Thecumulative knockdown factors are represented in an empiricaland qualitative way in Fig. 30. The blue curve is taken to representthe profile of the stresses during a flight. For a given problem, it cantherefore be estimated that current composite structures will notexceed 33% of their average static failure value for limit loadsand 50% for extreme loads. This shows both the margin of progres-sion of composites in aeronautics and the robustness of currentstructures. For example, some aeronautical structures havedemonstrated their ability, with impact and manufacturing defectsin pristine condition, to withstand 3 times the lifetime in flight, andthen withstand an extreme load to finally satisfy a crash test. Theidea of envelope curves is that, in order to validate the sizing ofan area or to answer a given problem (large notches, impact dam-age), it is possible to perform a load path using the VERTEX

Fig. 33. Envelope tests in the stress space.
Fig. 32. Envelope tests in the strain space.
methodology at a percentage of the first failure load (R Points) forwhich the structure remains undamaged. In our case, the percent-ages used are 0.33, 0.5 and 0.66 and the results for the C3-1 lami-nate will be presented here. The loading path required by the testresults is bilinear (Fig. 31). At this stage of the development of VER-TEX, the path will be determined from the displacements of thejacks obtained for the first failures.
The results of the envelope tests are presented in Fig. 32 in astrain space and Fig. 33 in a stress space. These two figures showthe behavior of the envelopes performed for the different coeffi-cients (0.33, 0.5 and 0.66) and those of the previous tests (Tensile,Shear, Tensile/Shear) for the C3-1 laminate. The continuous cyclecorresponds to: O-A-B-C-D-A-B-C-D-A-B-C-D. The points associ-ated with the first damage to the surface (R) visually observed
are shown on the three test curves (Tensile, Shear, Tensile/Shear).In Fig. 31, the segments drawn represent the load displacementpaths of the actuators of the Vertex machine. These figures showthe influence of the nature of the structural tests and of the ‘‘blind”control by the displacement of the actuators at this stage of the useof the VERTEX methodology. The average stresses and strains arenot pure because of secondary strains or stresses. A suddenunbuckling is at the origin of the strong discontinuities observedduring the paths C? D. It is important to note that a state of stress(or strain) is influenced by the ‘‘path” followed to establish it. Forthe coefficient 0.33, the points A of the envelope curves are veryclose to the tensile curves while the points B and C are respectivelydistant from the curves of tension/shear and shear. These devia-tions between the points obtained by non-proportional loading
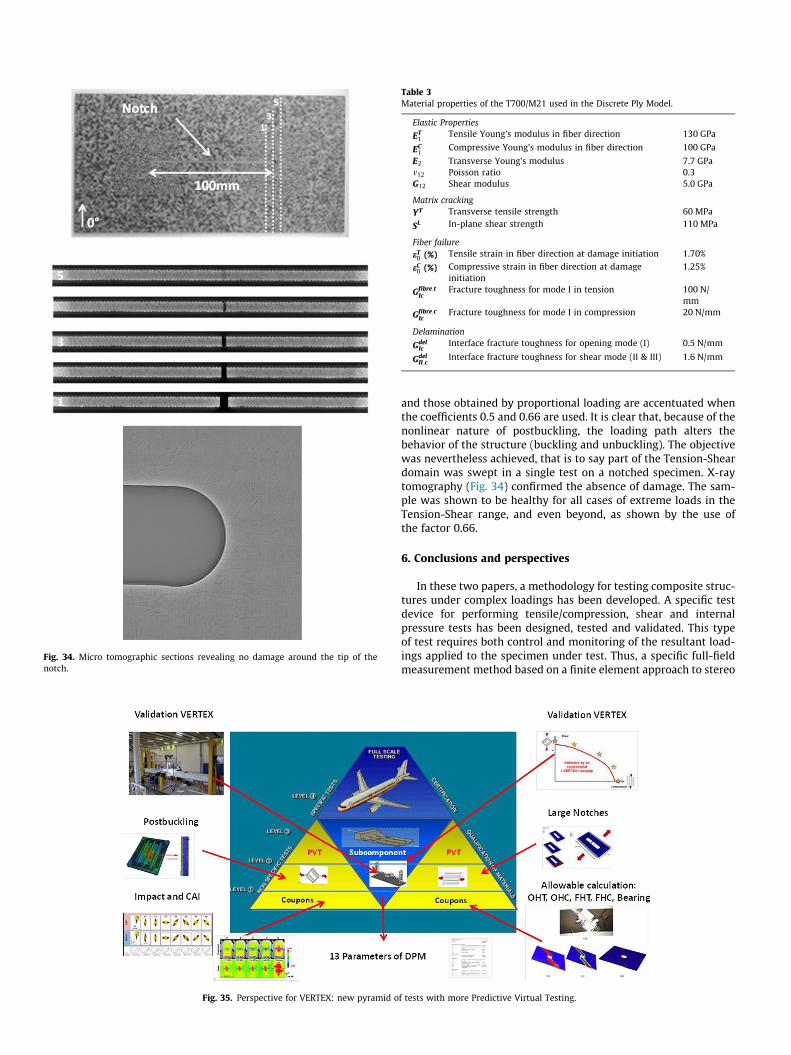
Fig. 34. Micro tomographic sections revealing no damage around the tip of thenotch.
Fig. 35. Perspective for VERTEX: new pyramid o
Table 3Material properties of the T700/M21 used in the Discrete Ply Model.
Elastic Properties
ET1
Tensile Young’s modulus in fiber direction 130 GPa
EC1
Compressive Young’s modulus in fiber direction 100 GPa
E2 Transverse Young’s modulus 7.7 GPam12 Poisson ratio 0.3G12 Shear modulus 5.0 GPa
Matrix crackingYT Transverse tensile strength 60 MPa
SL In-plane shear strength 110 MPa
Fiber failureeT0 (%) Tensile strain in fiber direction at damage initiation 1.70%
eC0 (%) Compressive strain in fiber direction at damageinitiation
1.25%
Gfibre;tIc
Fracture toughness for mode I in tension 100 N/mm
Gfibre;cIc
Fracture toughness for mode I in compression 20 N/mm
Delamination
GdelIc
Interface fracture toughness for opening mode (I) 0.5 N/mm
GdelII;c
Interface fracture toughness for shear mode (II & III) 1.6 N/mm
and those obtained by proportional loading are accentuated whenthe coefficients 0.5 and 0.66 are used. It is clear that, because of thenonlinear nature of postbuckling, the loading path alters thebehavior of the structure (buckling and unbuckling). The objectivewas nevertheless achieved, that is to say part of the Tension-Sheardomain was swept in a single test on a notched specimen. X-raytomography (Fig. 34) confirmed the absence of damage. The sam-ple was shown to be healthy for all cases of extreme loads in theTension-Shear range, and even beyond, as shown by the use ofthe factor 0.66.
6. Conclusions and perspectives
In these two papers, a methodology for testing composite struc-tures under complex loadings has been developed. A specific testdevice for performing tensile/compression, shear and internalpressure tests has been designed, tested and validated. This typeof test requires both control and monitoring of the resultant load-ings applied to the specimen under test. Thus, a specific full-fieldmeasurement method based on a finite element approach to stereo
f tests with more Predictive Virtual Testing.

image correlation (FE-SDIC) has been developed. The measurementmesh is shared with the finite element model, making dataexchanges much easier. A specific protocol has been created andallows for effective and direct test/computation communicationsbetween simulated and experimental quantities. This methodologywas then applied to the large cuts issue. The experiments revealedvery complex behavior with coupling between postbuckling andcrack propagation. DPM modeling was then used to successfullypredict the first damage and crack propagation onset. The very longcomputation times (4 days) have allowed only two tests to bemodeled for the moment, with plies 0.25 mm thick. Efforts there-fore need to be made in terms of optimization of computation timeand the damage model. A concept of envelope curves has also beenpresented. By means of a suitable load path, it enables validation ofthe structure integrity by means of a swept zone. At this stage, theboundaries of the domain are the experimental results obtained intensile, shear and combined loadings. The next step will be tocompute these boundaries numerically by the DPM method or bythe VERTEX partners’ approaches [24–26]. In the long term, certifi-cation of structures should evolve towards even more PredictiveVirtual Testing (Fig. 35). The VERTEX approach and the principlesof envelope test methodology open the way towards multipleperspectives leading to savings in cost and lead time in thecertification process for aeronautical products. They contribute toperspectives of savings in testing, especially at expensive sub-component and component levels, and to the de-risking at lowerpyramid scale level, earlier in the process and at cheaper price, ofdesign principles by intensive usage of numerical predictions sup-ported by a smaller number of test validations. The contribution ofVERTEX should ultimately lead to a significant reduction in thenumber of design loops and the cost of certification of aeronauticalstructures (Table 3).
Acknowledgments
The research that led to the results presented above receivedfunds from the French National Research Agency under the VER-TEX project MATETPRO program (ANR – 12 – RMNP-0001).The aca-demic authors gratefully acknowledge the support provided byAirbus Group Innovation. The test rig was funded by Region Occi-tanie through a CPER 2010-2014 grant. The authors also wish tothank Sogeclair Aerospace for their work as the contractor on thedesign and manufacture of the test rig.
References
[1] Serra J, Pierré JE, Passieux JC, Périé JN, Bouvet C, Castanié B. Validation ofaeronautical composite structures under multiaxial loading: the VERTEXProject. Part 1: Experimental Setup, Instrumentation with FE-SDIC andProcedures, Composite Structures (in revision).
[2] Rouchon J. Certification of large airplane composite structures, recent progressand new trends in compliance philosophy. ICAS 1990;2:1439–47.
[3] Leone FA, Bakuckas JG, Shyprykevich P, Davies C. Structural testing andanalysis of honeycomb sandwich composite fuselage panels November 2008.DOT/FAA/AR-08/51.
[4] Bergan A, Bakuckas JG, Lovejoy A, Jegley D, Linton K, Korkosz G, Awerbuch J,Tan TM. Full-scale test and analysis of a PRSEUS fuselage panel to assessdamage-containment features. In: 2011 Aircraft airworthiness & sustainmentconference, San Diego, California, April 18–21.
[5] Awerbuch J, Madhukar MS. Notched strength of composite laminates:predictions and experiments – a review. J Reinf Plast Comp 1985;4(1):3–159.
[6] Tan SC. Stress concentrations in laminated composites. CRC Press, Taylor andFrancis Group; 1994.
[7] Bazant ZP. The scaling of structural strength. London: HPS; 2002.[8] Bazant ZP, Daniel IM, Li Z. Size effect and fracture characteristics of composite
laminates. J Eng Mater Technol 1996;118(3):317–24.[9] WisnomMR, Hallett SR, Soutis C. Scaling effects in notched composites. J Comp
Mat 2010;44(2):195–210.[10] Xu X, Wisnom MR, Mahadik Y, Hallett SR. An experimental investigation into
size effects in quasi-isotropic carbon/epoxy laminates with sharp and bluntnotches. Comp Sci Tech 2014;100:220–7.
[11] Camanho PP, Maimí P, Dávila CG. Prediction of size effects in notchedlaminates using continuum damage mechanics. Comp Sci Tech 2007;67(13):2715–27.
[12] Serra J, Bouvet C, Castanié B, Petiot C. Scaling effect in notched composites: theDiscrete Ply Model approach. Comp Struct 2016;148:127–43.
[13] Serra J, Bouvet C, Castanié B, Petiot C. Experimental and numerical analysis ofCFRP notched coupons under tensile loading. Submitted to CompositeStructures.
[14] Bouvet C, Castanié B, Bizeul M, Barrau JJ. Low velocity impact modelling inlaminate composite panels with discrete interface elements. Int J Sol Struct2009;46(14-15):2809–21.
[15] Rivallant S, Bouvet C, Hongkarnjanakul N. Failure analysis of CFRP laminatessubjected to compression after impact: FE simulation using discrete interfaceelements. Comp Part A 2013;55:83–93.
[16] Adam L, Bouvet C, Castanié B, Daidié A, Bonhomme E. Discrete ply model ofcircular pull-through test of fasteners in laminates. Comp Struct 2012;94(10):3082–91.
[17] Achard V, Bouvet C, Castanié B, Chirol C. Discrete ply modelling of open holetensile tests. Compos Struct 2014;113:369–81.
[18] Castanié B, Barrau JJ, Jaouen JP. Theoretical and experimental analysis ofasymmetric sandwich structures. Comp Struct 2002;55(3):295–306.
[19] Castanié B, Barrau JJ, Jaouen JP, Rivallant S. Combined shear/compressionstructural testing of asymmetric sandwich structures. Exp Mech 2004;44(5):461–72.
[20] http://www.institut-clement-ader.org/vertex/.[21] Vertex Shear Test: https://www.youtube.com/watch?v=G5nbiq3b7OA.[22] Vertex Tension + Shear Test: https://www.youtube.com/watch?v=
45AgoMu3fXs.[23] Ostré B, Bouvet C, Minot C, Aboissière J. Edge impact modeling on stiffened
composite structures. Comp Struct 2015;126:314–28.[24] Abisset E, Daghia F, Ladevèze P. On the validation of a damage mesomodel for
laminated composites by means of open-hole tensile tests on quasi-isotropiclaminates. Comp Part A 2011;42(10):1515–24.
[25] Marcin L, Maire JF, Carrère N, Martin E. Development of a macroscopic damagemodel for woven ceramic matrix composites. Int J Dam Mech 2011;20(6):939–57.
[26] Laurin F, Carrere N, Huchette C, Maire JF. A multiscale hybrid approach fordamage and final failure predictions of composite structures. J Comp Mat2013;47(20–21):2713–47.
[27] Pierré JE, Passieux JC, Périé JN. Finite element stereo digital image correlation:framework and mechanical regularization. Exp Mech 2017;53(7):443–56.
[28] Pierré JE, Passieux JC, Périé JN, Bugarin F, Robert L. Unstructured FiniteElement-based Digital Image Correlation with enhanced management ofquadrature and lens distortions. Opt Lasers Eng 2016;77:44–53.
[29] Niu MCY. Composite airframe structures. Hong Kong: Hong-Kong ConmilitPress; 1992.
[30] Zagainov GL, Lozino-lozinsky GE, Composite materials in aerospace design,Chapman and Hall London; 1996.
[31] Kassapouglou C. Design and analysis of composite structures. Wiley; 2010.[32] Abrate S, Castanié B. Rajapakse YDS. Dynamic Failure of Composite and
sandwich structures. Springer; 2013.