Embed Size (px)
Citation preview

Running head: Validating the Safety Measurement Culture Survey
Validating the Safety Measurement Culture Survey: Assessing Employee Safety Reporting
by
Ava M. Young
Honors Thesis
Appalachian State University
Submitted to the Department of Psychology in partial fulfillment of the requirements for the degree of
Bachelor of Science
April 2021
Approved by:
__________________________________________________ Timothy Ludwig, Ph.D., Thesis Director
__________________________________________________ Yalçın Açıkgöz, Ph.D., Second Reader
__________________________________________________ Andrew Smith, Ph.D., Honors Director

Running head: Validating the Safety Measurement Culture Survey
1
Validating the Safety Measurement Culture Survey: Assessing Employee Safety Reporting
Ava M. Young, Dr. Timothy D. Ludwig, Dr. Shawn Bergman, and Dr. Yalcin Açıkgöz
Appalachian State University

Running head: Validating the Safety Measurement Culture Survey
2
Abstract
Organizations are increasingly using data and the outcome of data analysis to make
decisions. However, certain organizational practices may reduce the value of the data, thereby
hindering the decisions made based on analytics. The safety measurement culture of an
organization, which we define as the culture of an organization around collecting, recording, and
using data, arguably plays a large role in determining the quality of data. Accordingly, if
organizations can improve their safety measurement culture, their data may more accurately
represent behaviors occurring in their facilities and decisions based on data analytics will
become more valuable. To assess employee perceptions that impact data quality, a Safety
Measurement Culture Survey was developed to assess factors impacting employee participation
and management action in promoting safety measurement. This study examines the tool’s
criterion-related validity by assessing the relationship between the results of the survey and
actual employee reporting, such as near misses and minor injuries, in an organization. The results
of this study indicate that questions 6 (My supervisor encourages employees to participate in
decisions that affect safety), 11 (I help investigate safety incidents and near misses) and 15
(When we report safety issues it helps prevent potentially serious injuries), on the survey are
significantly correlated with the aforementioned outcomes of the companies in our study. This
study also measures the content validity of the safety measurement culture survey by assessing
the relationships between average survey response and number of incidents. The results from this
analysis indicate a positive relationship with the average survey response and number of
incidents of the companies in our study.

Running head: Validating the Safety Measurement Culture Survey
3
Permission is granted to Appalachian State University and the
Department of Psychology to display and provide access to this
thesis for appropriate academic and research purposes

Running head: Validating the Safety Measurement Culture Survey
4
Validating the Safety Measurement Culture Survey: Assessing Employee Safety Reporting
In addition to the emotional and psychological toll an injury in the workplace can cause an
employee and organization, there are the associated medical bills, lost productivity, potential
lawsuits, property damage, and a myriad of financial consequences. According to the National
Safety Council, in the year 2017, there were approximately 4,572 preventable workplace deaths
and workplace injuries cost $171 billion in 2019 (National Safety Council, 2020).
The three leading causes of major injuries (i.e., overexertion, slips/trips/falls, and contact
with objects and equipment) account for 84% of all injuries (National Safety Council, 2020) yet
are among the most preventable. Injuries such as these can be mitigated by interventions in the
workplace informed when employees voluntarily report near miss incidents and minor injuries.
However, 8.8% of minor injuries and 90.9% of near misses are not reported (Marsden, 2020).
Measures of Safety
The planning for safety interventions (e.g., better tools and equipment, rules and
procedures, staffing, and training) can be helped by analyzing past injuries which suggest root
causes of injury trends. Injuries are “lagging indicators” of safety performance that occur after
an intervention could have prevented the incident (Sheehan, C., Donohue, R., Shea, T., Cooper,
B., & Cieri, H. D., 2016). As a result, analyzing data on lagging indicators may not provide the
right information to act as predictors for future accidents (Hinze, Thurman, & Wehle, 2013).
Unfortunately, lagging indicators are the only data collected and analyzed to introduce
interventions in most organizations. Approaching safety through lagging indicators is a reactive,
“failure-focused” response as the consideration of safety interventions occurs after an event or
failure has occurred (Sheehan, Donohue, Shea, Cooper, & Cieri, 2016).

Running head: Validating the Safety Measurement Culture Survey
5
In contrast, “leading indicators” of safety performance can provide early warning signs of
future accidents (Sinelnikov, Inouye, & Kerper, 2015). Collecting data on leading indicators is
the result of an approach called active monitoring (Shiskin & Moore, 1968). Active monitoring
“evaluates the present state of a facility” allowing failures to be found before they result in
accidents (Hopkins, 2009, p. 7). The use of leading indicators allows management to actively
enable workers to get involved and demonstrate commitment by acting on employee reports
(Toellner, 2001).
Heinrich, in the second edition of his book, Industrial Accident Prevention: A Scientific
Approach, proposed a ratio suggesting that for every fatal accident approximately 30 injuries
occur, and for every injury approximately 300 minor incidents such as near misses and minor
injuries take place (Heinrich, H.W. 1941). According to this ratio, near misses and minor injuries
occur much more frequently than major injuries (Heinrich, H. W., 1969). In other words,
attempting to identify near misses and minor injuries should help direct interventions reduce the
overall number of injuries, both minor and major. Because they happen more frequently, near
misses and minor injuries result in more chances to identify safety issues and fix them. However,
timely data must be collected through employee reporting. In most cases, the collection of data
for safety and health interventions requires workers to commit time and effort in observing and
recording leading indicators.
Near Misses and Minor Injuries
According to OSHA, minor injuries are those incidents that do not involve death, loss of
consciousness, days away from work, restriction of work or motion, transfer to another job,
medical treatment other than first aid, or diagnosis of a significant injury or illness by a physician
or other licensed health care professional (OSHA, 2001). A near miss is “any situation in which
an ongoing sequence of events was prevented from developing further… preventing the

Running head: Validating the Safety Measurement Culture Survey
6
occurrence of potentially serious (safety related) consequences” (van der Schaaf, 2013, p. 5).
Minor injuries and near misses happen frequently without producing many negative effects,
making them a good leading indicator to find trends in the data. Therefore, employee reporting
of minor injuries and near misses offers management a low risk method to reduce accidents
(McKinnon, 2012).
The occurrence of minor safety incidents can be recorded in two main ways: by the
person who experienced the incident or by observations performed by equipment or human
observers (van der Schaaf, 2013). Both methods of recording near misses require the
participation of employees working on the frontlines.
Employee Participation and Management Action
Employee participation in safety interventions has been found to improve the outcomes
of those interventions (Hagge, McGee, Matthews, & Alberle, 2017). Many safety interventions
rely on the collection of data, such as minor injuries and near misses, by frontline workers.
Because minor injuries and near misses often occur in private moments, management often do
not know they have occurred unless an employee voluntarily reports the incident. A company
may have the best possible safety system, but the system will be ineffective if employees are not
willing to participate in reporting data (Compagnone, M. (2020).
Often there are barriers to reporting incidents such as minor injuries and near misses.
Employees may be hesitant to report a minor injury because they want to avoid a) potential
punishment for safety violations, b) the time and effort it takes to complete reporting forms, c)
the embarrassment from the attention raised by reporting and d) lack of management action
responding to reporting (Ludwig & Laske, in press; Prang & Jelsness-Jørgensen, 2014).

Running head: Validating the Safety Measurement Culture Survey
7
To overcome these barriers, it is necessary to create a non-blaming culture at employee
and management levels (Vrbnjak, Denieffe, O’Gorman, & Pajnkihar, 2016). One way to achieve
this is to analyze factors leading up to near misses and minor injuries rather than seeking out a
culprit for punishment. A lack of feedback may also be a deterrent to employee reporting
because the effort it takes to submit a report is not met with any activity. When employees are
kept out of the loop as to how reports are being used and actions taken for improvement,
reporting is not reinforced and will eventually extinguish (Ludwig & Laske, in press; Vrbnjak,
Denieffe, O’Gorman, Pajnkihar, 2016). Therefore, publicized management action following up
on reporting through mitigation of hazards, changing work processes, and providing better tools
encourages employees to participate in reporting. When employees are actively engaged in
reporting leading indicators such as near misses and minor injuries and managers are taking
action on the information provided, this is indicative of a safety culture conducive to active
monitoring and mitigation of safety issues (Compagnone & Young, 2020).
Safety Culture
Safety Culture is the set of shared beliefs, norms, attitudes, roles, and social and technical
practices concerned with minimizing harm to people in the workplace (Mearns & Flin, 1999).
Organizations with a strong safety culture have higher engagement in safe behaviors and tend to
have fewer injuries (Hahn & Murphy, 2008). Persistent motivation to be aware of dangers in the
workplace is important to the safety culture (Schaaf, 2013).When a visible effort is made by
managers to improve the safety environment, employees have higher levels of motivation and
commitment, leading to higher safety performance (European Agency for Safety and Health at
Work, 2007).

Running head: Validating the Safety Measurement Culture Survey
8
According to OSHA, worker participation in creating safety and health programs results in
better design, higher reporting, and more successful implementation (Occupational Safety and
Health Administration, 2016). Involving all levels of employees gives the entire community a
feeling of ownership over the safety program. Sharing results will drive further improvement in
the resulting safety culture (OSHA, 2016). Discussing safety in all these forms has been shown
to build shared norms necessary for strong safety culture (Ludwig, 2018).
Safety Measurement Culture
Safety measurement culture is “the extent to which employees and management are
willing to provide valid accounts of what is happening in the workplace by completing
inspection forms, conducting observations, or reporting close-call incidents.” (Compagnone,
2020, p. 20). Measurement culture is an important subfactor of safety culture because the rate of
incident reporting, the core of measurement culture, assesses “the frequency of reporting
incidents and near misses” (Frazier, Ludwig, Whitaker, Roberts, 2013, p. 25). The cultivation of
a good measurement culture plays a vital role in the overall efficacy of the safety culture of an
organization (Compagnone, Young, Laske, Foreman, & Ludwig, 2020). Having an effective
safety measurement culture is beneficial to any organization as it increases the efficacy of
evidence-based decision making. In order to receive accurate analytical outcomes necessary for
measurement culture, the data collection process must be of high quality. Organizations would
benefit from being able to measure their safety measurement culture, however, the existing
measure needs evidence to demonstrate criterion-related validity.
We propose that organizations can improve data quality and analytical outcomes by
improving safety measurement culture through reinforcing participation, removing barriers that
may punish participation, engage in discussions about how reporting data is being used and what

Running head: Validating the Safety Measurement Culture Survey
9
it shows, and follow up improvements directed by reporting (Compagnone et al., 2020; Foreman
et al., 2020). An organization with a strong measurement culture will have more collaboration,
increased data collection and better analytical output which direct safety interventions to better
reduce injuries (Foreman et al., 2020). For that reason, a survey that assesses the safety
measurement culture through perceptions and behaviors among employees is proposed.
Dysfunctional safety measurement culture practices such as those mentioned above are
thought to be the product of personal and organizational barriers. Personal barriers include a)
fear of vilification and conflicts, b) lack of technological confidence and knowledge, c) time and
d) a perceived low degree of severity of the incident (Prang & Jelsness-Jørgensen, 2014).
Organizational barriers may include a) lack of support, b) unclear outcomes and c) unclear
routines (Prang & Jelsness-Jørgensen, 2014). Organizational barriers draw attention to
management involvement in the active maintenance of a safety culture. As we seek to develop an
assessment of safety measurement culture, perceptions of these personal and organizational
barriers offer insights into how a culture may influence employee reporting.
Engaging in discussions about reporting and why employees may not be reporting can be
a critical component to improving safety measurement culture. Reasons an employee may not
report data include a lack of a no-blame safety culture, fear of reprisal, and excusing the near
miss/incident (Rutledge DN, Retrosi, T, Ostrowski, G. 2018). One cultural practice that results
in inaccurate data is pencil whipping when a worker completes a report or checklists without
performing the necessary observations, inspections or other safety tasks (Ludwig, 2014).
Unfortunately, pencil whipping and other cultural practices that result in non-reporting can leave
the perception that there is not a safety problem, so interventions are directed elsewhere. Many
possible reasons a safety culture may promote pencil whipping or record inaccurate data
Running head: Validating the Safety Measurement Culture Survey
10
practices exist. For example, employees may report 100% safe wanting to make themselves and
their coworkers look good (Ludwig, 2014).
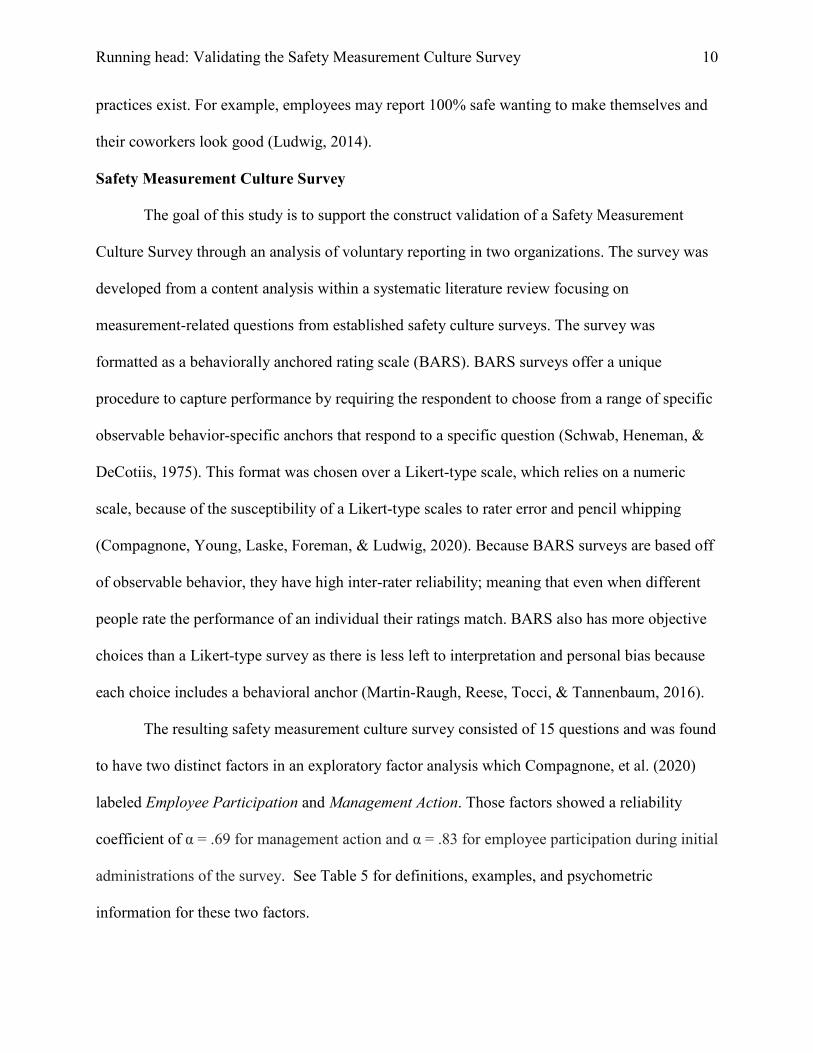
Safety Measurement Culture Survey
The goal of this study is to support the construct validation of a Safety Measurement
Culture Survey through an analysis of voluntary reporting in two organizations. The survey was
developed from a content analysis within a systematic literature review focusing on
measurement-related questions from established safety culture surveys. The survey was
formatted as a behaviorally anchored rating scale (BARS). BARS surveys offer a unique
procedure to capture performance by requiring the respondent to choose from a range of specific
observable behavior-specific anchors that respond to a specific question (Schwab, Heneman, &
DeCotiis, 1975). This format was chosen over a Likert-type scale, which relies on a numeric
scale, because of the susceptibility of a Likert-type scales to rater error and pencil whipping
(Compagnone, Young, Laske, Foreman, & Ludwig, 2020). Because BARS surveys are based off
of observable behavior, they have high inter-rater reliability; meaning that even when different
people rate the performance of an individual their ratings match. BARS also has more objective
choices than a Likert-type survey as there is less left to interpretation and personal bias because
each choice includes a behavioral anchor (Martin-Raugh, Reese, Tocci, & Tannenbaum, 2016).
The resulting safety measurement culture survey consisted of 15 questions and was found
to have two distinct factors in an exploratory factor analysis which Compagnone, et al. (2020)
labeled Employee Participation and Management Action. Those factors showed a reliability
coefficient of α = .69 for management action and α = .83 for employee participation during initial
administrations of the survey. See Table 5 for definitions, examples, and psychometric
information for these two factors.

Running head: Validating the Safety Measurement Culture Survey
11
Intent of this study
Based on the suggestions of Frazier et al. (2012), this study will examine the criterion-
related validity of the Safety Measurement Culture Survey. In order to accomplish this, we will
use archives of recent near misses and minor injuries to concurrently assess the criterion validity
of our survey (Laerd, 2012). Specifically, we will seek to determine whether our assessment of
safety measurement culture can make accurate predictions about actual safety outcomes such as
near misses and injuries in an organization. A high average score on the questions in the Safety
Measurement Culture Survey should be related to higher frequency of near misses and minor
injuries reported because a better measurement culture would lead to more reporting. Therefore,
I hypothesize a significant positive correlation between the mean safety measurement culture
survey response and an aggregate of near miss, first aid injuries, and hazards divided by number
of employees. I also hypothesize that average Safety Measurement Culture Survey response will
be negatively correlated with number of incidents because if there are more near-miss, first aids,
and hazards being reported there are more chances for supervisor to fix safety issues before they
become injuries resulting in fewer injuries.
Methods
Participants
Participants of this study included employees from two companies. Company A is a global
specialty chemical company employing approximately 15,000 people worldwide. At Company A
surveys were completed by frontline workers across two divisions and eight departments. From
company A, surveys were completed by 660 frontline workers across eight departments. These
departments were selected because they represent the departments that completed more than
fifteen surveys or had more than 50% participation from their department. Company B is a parent

Running head: Validating the Safety Measurement Culture Survey
12
company of five distinct textile companies with 37 facilities employing over 15,000 people
(Compagnone, 2020). From Company B, surveys were completed by 436 frontline workers across
eleven plants. These plants were chosen as they were the continental US plants from this company.
Departments were chosen based on whether they completed more than ten surveys or had more
than 50% participation from their department. Appalachian State University’s Institutional Review
Board approved this research (IRB # 19-0072).
Safety Measurement Culture Survey
The Safety Measurement Culture Survey (Compagnone, et al., 2020) was administered
within departments at Company A & Company B assessing two distinct factors related to
measurement culture. Questions assessing the factor of Employee Participation included (a)
employee openness to reporting and (b) quality of minor injuries and near miss reports.
Questions relating to this factor measure voluntary involvement and commitment to accuracy of
reporting among employees. These questions also measure how often employees engage in
“pencil whipping” (Ludwig, 2014). Items on the culture survey used to assess employee
participation include:
My supervisor responds quickly to solve problems when safety issues are reported
Supervisors have us report safety-related issues to keep people safe, instead of using them solely as a performance measure I report all minor injuries
I report all near misses
I find the forms used to report safety information easy to use
Questions assessing the factor management action on our survey focus on (a)
managements encouragement in participation of safety reporting, (b) their ability to resolve
Running head: Validating the Safety Measurement Culture Survey
13
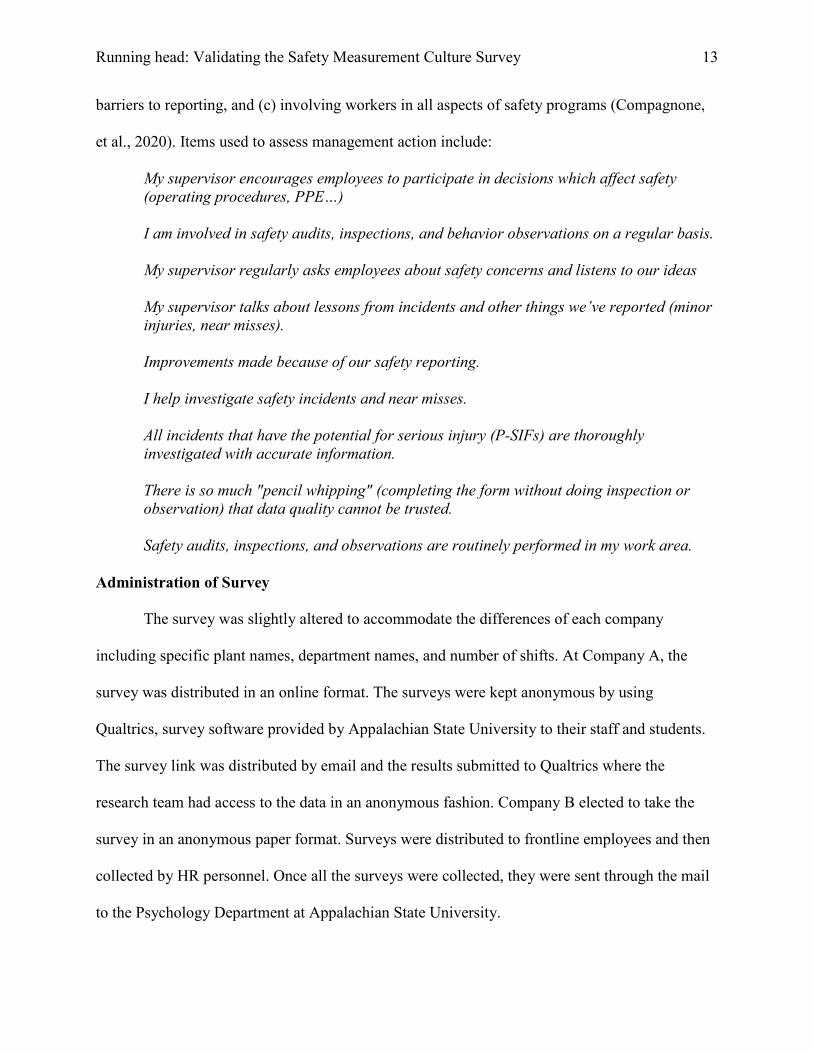
barriers to reporting, and (c) involving workers in all aspects of safety programs (Compagnone,
et al., 2020). Items used to assess management action include:
My supervisor encourages employees to participate in decisions which affect safety (operating procedures, PPE…) I am involved in safety audits, inspections, and behavior observations on a regular basis.
My supervisor regularly asks employees about safety concerns and listens to our ideas
My supervisor talks about lessons from incidents and other things we’ve reported (minor injuries, near misses). Improvements made because of our safety reporting.
I help investigate safety incidents and near misses.
All incidents that have the potential for serious injury (P-SIFs) are thoroughly investigated with accurate information. There is so much "pencil whipping" (completing the form without doing inspection or observation) that data quality cannot be trusted. Safety audits, inspections, and observations are routinely performed in my work area.
Administration of Survey
The survey was slightly altered to accommodate the differences of each company
including specific plant names, department names, and number of shifts. At Company A, the
survey was distributed in an online format. The surveys were kept anonymous by using
Qualtrics, survey software provided by Appalachian State University to their staff and students.
The survey link was distributed by email and the results submitted to Qualtrics where the
research team had access to the data in an anonymous fashion. Company B elected to take the
survey in an anonymous paper format. Surveys were distributed to frontline employees and then
collected by HR personnel. Once all the surveys were collected, they were sent through the mail
to the Psychology Department at Appalachian State University.

Running head: Validating the Safety Measurement Culture Survey
14
Archival Near Miss and Minor Injury
In order to validate the Safety Measurement Culture Survey, the results of the survey
were compared to Near Miss and Minor Injury reports archived from Company A and Company
B. At Company A near miss and minor injuries are reported electronically and stored in a master
database. Company A gave Appalachian State University log in information to their master
database which allowed access to their Near Miss and Minor Injury data, all personal identifiers
were removed. At Company B near misses and minor injuries are reported to supervisors by
frontline workers in a paper format. These reports then travel up the chain of command reaching
the safety coordinators who record the data electronically. Near Miss and Minor Injury Data was
shared on a mutual Dropbox where all personal identifiers were removed.
Results
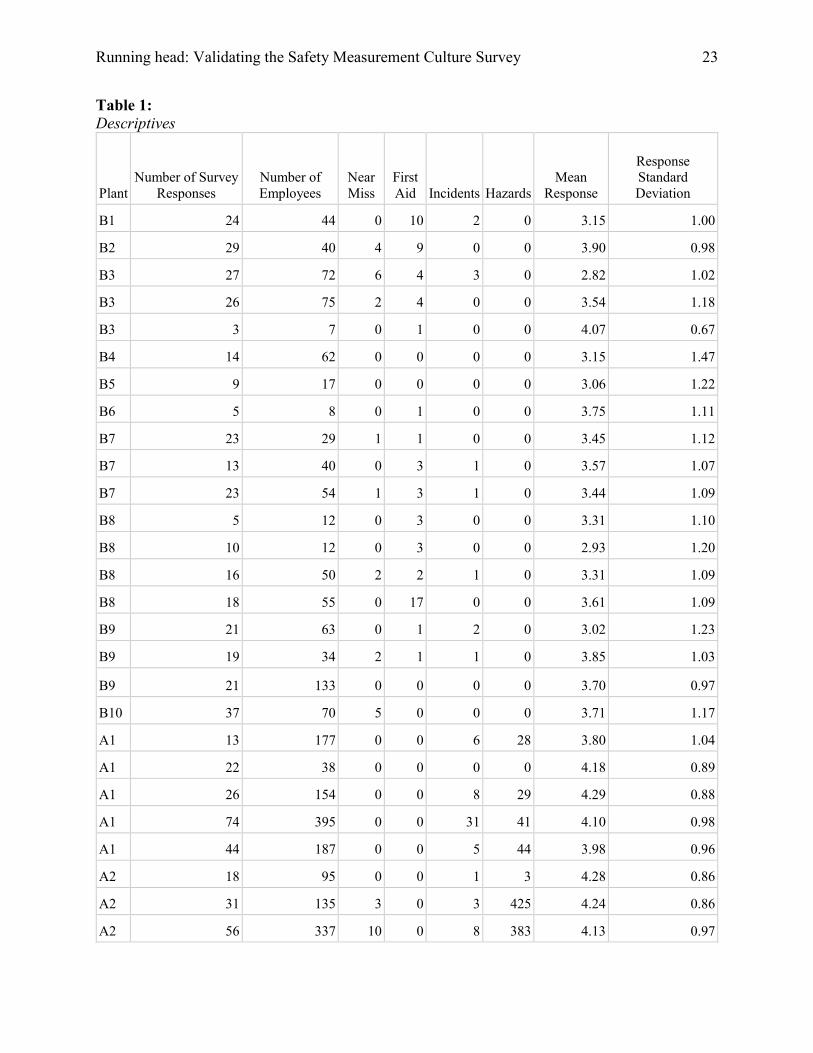
Description of the sample
Data collected from company A included 660 survey responses across two divisions
which consisted of nine departments. Data collected from company B included 436 survey
responses across eleven plants which consisted of 39 departments. A department was included in
the final dataset if more than 15 surveys were completed or there was more than 50%
participation from the department. Data from companies A and B also included the number of
employees per department, number of near misses, first aids, and hazards recorded in the 2020
calendar year (see Table 1).
In the final dataset, there were a total of 627 survey responses subject to analysis. These
surveys came from 2 companies consisting of 12 plants and 27 departments. The survey did not
collect employee characteristics or demographics. Table 1 contains the mean survey response
and standard deviation by department.

Running head: Validating the Safety Measurement Culture Survey
15
Descriptive statistics
A final dataset sample size consisted of 27 departments. Survey response mean and
standard deviation for each department can be found in Table 1. In order to account for the small
sample size, it was determined that a correlation of 0.30 would be large enough to be deemed as
a relationship and that an alpha of 0.10 was large enough to rule out a type one error. After
running descriptive statistics, we found Company A contained two departments with outliers in
their hazard identifications. These departments recorded more than 300 hazard identifications
each. This is more than 9 times the number of hazard identifications recorded by the next highest
reported number of hazard identifications and skewed our data.
When these outliers were removed, we discovered there was a positive correlation
between the average response on the Safety Measurement Culture Survey and the number of
incidents (see Graph 1). This means that as the average survey response increased, the number of
incidents also increased, and the survey does not have good criterion-related validity. The
correlation was 0.426, with a p-value of 0.027 (see Figure 1 and Table 3).
Hypothesis Testing
In order to create our criterion variable, we aggregated near misses, first aids, and
hazards. To have a normalized value, this variable was divided by the number of employees in
each department. Because of the small sample size, the data was skewed.
After running a Spearman’s Rho correlation, we saw Questions 6, 11, and 15 had
correlations over .30 and p-value less than 0.10 when correlated with an aggregate of recorded
near misses, first aids, and hazards (see Table 2, Figures 2-4). This means that questions 6 (My
supervisor encourages employees to participate in decisions that affect safety), 11 (I help
investigate safety incidents and near misses) and 15 (When we report safety issues it helps

Running head: Validating the Safety Measurement Culture Survey
16
prevent potentially serious injuries), may represent the most valid questions within the Safety
Measurement Culture of an organization due to their relationship with actual counts of reporting
across our participating departments. It does suggest that removing the twelve questions on the
survey that did not have a strong correlation should be considered as they are not predictive of
safety measurement culture.
Discussion
The aim of this study was to determine whether or not the Safety Measurement Culture
Survey has construct validity in that it shows a relationship with the variables it attempts to
predict (i.e., safety reporting). Our findings marginally support our first hypothesis that there
would be a significant positive correlation between the mean measurement culture survey
response and an aggregate of near-miss, first aid injuries, and hazards divided by employees as
three of the fifteen questions have a strong correlation and twelve of the questions did not have a
strong correlation.
The particular questions that had a statistically significant correlation seem to involve
critical path that produce safety reporting. These involved the prompting of safety reporting by
supervisors (question 6), employee participation in following up on near misses and incidents
(question 11), and the perception that reporting reduces injuries as an outcome (question 15).
These questions also show a working relationship between management and employees in using
reporting to improve safety.
Question six asks whether supervisors are encouraging employees to participate in safety
decisions. When employees are encouraged to participate in safety decisions it increases their
ownership of safety interventions (Occupational Safety and Health Administration, 2020).
Question eleven asked if employees help investigate incidents and near misses. In order to help

Running head: Validating the Safety Measurement Culture Survey
17
investigate an employee must have an understanding of factors that lead to an incident or near
miss. When combined with question six employee’s unique perspective of the causes of incidents
and near misses more appropriate action can result from the collaboration between supervisors
and employees. Finally, question fifteen suggests a perceived link between reporting safety
issues and the prevention of serious injuries. If employees believe reporting helps prevent injury,
they are more likely to participate in safety reporting. It also indicates that employees trust
management to take their reports seriously and values their input.
Our second hypothesis, testing the content validity of the survey, was that higher average
survey response would be negatively correlated with the number of incidents. However, this
hypothesis was not supported (See Figure 1). This hypothesis was based on the idea that a higher
average response on the Safety Measurement Culture Survey would indicate a strong safety
measurement culture, thus a decreased number of incidents. However, a strong safety
measurement culture could lead to increased reporting of incidents even when they are minor.
This would result in a positive correlation between average Safety Measurement Culture Survey
response and number of incidents as we saw in our study.
Limitations
This study did encounter some potential limitations, most notably the low sample size (n
= 27) of our participating departments. This can lead to range restriction and skewed data, which
required increasing our p-value to 0.10. Further, the base rates of injuries, thankfully, are quite
low and represent further range restriction in our injury analysis. This study enlisted
participation from departments across two companies which different work processes and safety
reporting practices. This resulted in a somewhat bi-modal distribution across companies and led
to the outliers we had to discard. In the future, obtaining a larger sample size would lead to more

Running head: Validating the Safety Measurement Culture Survey
18
reliable results. These samples may be gathered from one, very large organization. However,
this may not be feasible as even large organizations have variation in work processes and safety
reporting practices. Therefore, future studies should engage more companies in hopes of
attaining a full range of variables.
Another potential limitation is the self-selection bias. Each employee was given the
opportunity to fill out the Safety Measurement Culture Survey at both company A and company
B. However, they were not required. The employees who filled out the survey may be more
likely to report safety observations and not represent the true population, skewing the data.
Future Research
Decreasing incidents in the workplace can be difficult, the use of observations and data
collection as a part of big data analytics can be useful in the creation of safety decisions and
interventions. However, in order for the data collected (such as near misses, first aids, and hazard
identifications) to be used to create interventions in a manner that will authentically reduce
incident rates, the data must be true to life. Analytics and graphics generated from inaccurate
data will be flawed. As a result, decisions based on flawed analytics will be unreliable.
Effectively creating a strong safety culture, especially when battling against a poor safety
measurement culture, can feel like an uphill battle. However, if done properly, the results can
decrease the number of incidents, improve productivity, decrease time and money lost due to
injury, and much more. Questions 6, 11, and 15 from the Safety Measurement Culture Survey
can help companies determine the status of their Safety Measurement Culture and lead to
discussion and decisions that will lead to decreased increased safety.

Running head: Validating the Safety Measurement Culture Survey
19
References
Compagnone, M. (2020). DART: a data analytics readiness assessment tool for use in occupational safety. [Unpublished Master’s Thesis]. Appalachian State University.
Compagnone, M. E., & Young, A. M. (2020). Textile Production company DART Report.
Unpublished manuscript, Department of Psychology, Appalachian State University.
Compagnone, M. E., Young, A. M., Laske, M. M., Foreman, A. M., & Ludwig, T. D. (2020). Safety Measurement Culture: A Survey to Assess Employee and Manager Engagement in Safety Reporting. Journal of Safety Research. Under review
Dudovskiy, J. (2018). Validity - Research-Methodology. Retrieved November, 2020, from https://research-methodology.net/research-methodology/reliability-validity-and-repeatability/research-validity/
European Agency for Safety and Health at Work. (2007). The business benefits of good occupational safety and health. Retrieved from https://osha.europa.eu/en/publications/factsheet-77-business-benefits-good-occupational-safety-and-health
Foreman, A., Wirth, O., Friedel, J., Bergman, S., & Ludwig, T. (2020) Establishment-level
safety analytics: Challenges and opportunities. Manuscript in preparation. Frazier CB, Ludwig TD, Whitaker B, Roberts DS. A hierarchical factor analysis of a safety
culture survey. J Safety Res. 2013 Jun;45:15-28. doi: 10.1016/j.jsr.2012.10.015. Epub 2012 Dec 11. PMID: 23708472.
Frazier, C. B., Ludwig, T. D., Whitaker, B., & Roberts, D. S. (2012). A hierarchical factor analysis of a safety culture survey. Journal of Safety Research, 45, 15-28. doi: 10.1016/j.jsr.2012.10.015
Hahn, S. E., & Murphy, L. R. (2008). A short scale for measuring safety climate. Safety Science, 46(7), 1047–1066. https://doi.org/10.1016/j.ssci.2007.06.002
Heinrich, H. W. (1941). Industrial accident prevention: A scientific approach. New York and
London: McGraw-Hill Book Company, Inc.
Heinrich, H. W. (1969). Industrial accident prevention: A scientific approach. New York: McGraw-Hill.
Hinze, J., Thurman, S., & Wehle, A. (2013). Leading indicators of construction safety performance. Safety Science, 51(1), 23-28. doi: https://doi.org/10.1016/j.ssci.2012.05.016

Running head: Validating the Safety Measurement Culture Survey
20
Hopkins, 2009. A. Hopkins. Thinking about process safety indicators Saf. Sci., 47 (2009), pp. 460-465
Julius Shiskin & Geoffrey H. Moore, 1968. "Composite Indexes of Leading, Coinciding, and
Lagging Indicators, 1948–67," NBER Chapters, in: Supplement to NBER Report One, pages 1-8, National Bureau of Economic Research, Inc.
Laerd. (2012). Criterion validity (concurrent and predictive validity): Lærd Dissertation. Retrieved January 04, 2021, from https://dissertation.laerd.com/criterion-validity-concurrent-and-predictive-validity-p2.php
Lebbon, A., Sigurdsson, S. O., & Austin, J. (2012). Behavioral Safety in the Food Services Industry: Challenges and Outcomes. Journal of Organizational and Behavior Management, 32(1), 44-57. doi: https://doi-org.proxy006.nclive.org/10.1080/01608061.2011.592792
Ludwig, T. (2014). The anatomy of pencil whipping. Professional Safety, 59(02), 47–50. Ludwig, T.D. (2018). Dysfunctional Practices that Kill your Safety Culture. Calloway
Publishing, Blowing Rock, NC.
Marsden, E. (2020, August 10). The Heinrich/Bird safety pyramid Pioneering research has become a safety myth. Retrieved November, 2020, from https://risk-engineering.org/concept/Heinrich-Bird-accident-pyramid
Martin-Raugh, M., Reese, C., Tocci, C. M., & Tannenbaum, R. J. (2016). Behaviorally anchored rating scales: An application for evaluating teaching practice. Teaching and Teacher Education, 59, 414-419. doi:https://doi.org/10.1016/j.tate.2016.07.026
McKinnon, R. C. (2012). Safety management near miss identification, recognition, and investigation. CRC Press. Retrieved from https://www.google.com/books/edition/Safety_Management/AlnNBQAAQBAJ?hl=en&gbpv=1&dq=near+miss+safety&printsec=frontcover
Mearns, K. J., & Flin, R. (1999). Assessing the state of organizational safety—Culture or climate? Current Psychology: A Journal for Diverse Perspectives on Diverse Psychological Issues, 18(1), 5–17. https://doi-org.proxy006.nclive.org/10.1007/s12144-999-1013-3
National Safety Council (2020). Work Safety Introduction. Retrieved November 01, 2020, from https://injuryfacts.nsc.org/work/work-overview/work-safety-introduction
Occupational Safety and Health Administration. (2001). Occupational Injury and Illness Recording and Reporting Requirements. Retrieved December 12, 2020, from https://www.osha.gov/pls/oshaweb/owadisp.show_document?p_id=16312

Running head: Validating the Safety Measurement Culture Survey
21
Occupational Safety and Health Administration. (2016, October). Recommended Practices for Safety and Health Programs. Retrieved November, 2020, from https://www.osha.gov/Publications/OSHA3885.pdf
Occupational Safety and Health Administration. (2019). Using Leading Indicators to Improve Safety and Health Outcomes. Retrieved 2020, from https://www.osha.gov/leadingindicators/docs/OSHA_Leading_Indicators.pdf
Occupational Safety and Health Administration. (2020). Recommended Practices for Safety and Health Programs: Worker Participation. Retrieved May, 2021, from https://www.osha.gov/safety-management
Occupational Safety and Health Administration. (n.d.). OSHA Injury and Illness Recordkeeping and Reporting Requirements. Retrieved November, 2020, from https://www.osha.gov/recordkeeping/
Prang, I. W., & Jelsness-Jørgensen, L. (2014). Should I report? A qualitative study of barriers to incident reporting among nurses working in nursing homes. Geriatric Nursing, 35(6), 441-447. doi:10.1016/j.gerinurse.2014.07.003
Rutledge, DN, Retrosi, T, Ostrowski, G. Barriers to medication error reporting among hospital nurses. J Clin Nurs. 2018; 27: 1941– 1949. https://doi-org.proxy006.nclive.org/10.1111/jocn.14335
Schwab, D. P., Heneman, H., & DeCotiis, T. A. (1975). Behaviorally Anchored Rating Scales: A review of the literature. Academy of Management Proceedings, 1975, 222-224. doi:10.5465/ambpp.1975.4982613
Shea, T., Cieri, H. D., Donohue, R., Cooper, B., & Sheehan, C. (2016). Leading indicators of occupational health and safety: An employee and workplace level validation study. Safety Science, 85, 293-304. doi: 10.1016/j.ssci.2016.01.015
Sheehan, C., Donohue, R., Shea, T., Cooper, B., & Cieri, H. D. (2016). Leading and lagging indicators of occupational health and safety: The moderating role of safety leadership. Accident Analysis & Prevention, 92, 130-138. doi: 10.1016/j.aap.2016.03.018
Sinelnikov, S., Inouye, J., & Kerper, S. (2015). Using leading indicators to measure occupational health and safety performance. Safety Science, 72, 240-248. doi: https://doi.org/10.1016/j.ssci.2014.09.010
Toellner, J. (2001). Improving safety & health performance: Identifying & measuring leading indicators. Professional Safety, 46(9), 42-47. Retrieved from https://login.proxy006.nclive.org/login?url=https://www.proquest.com/scholarly-journals/improving-safety-amp-health-performance/docview/200432163/se-2?accountid=8337

Running head: Validating the Safety Measurement Culture Survey
22
Van der Schaaf, T. W. (2013). Near Miss Reporting as a Safety Tool [Introduction]. In Near Miss Reporting as a Safety Tool (pp. 1-8). Butterworth-Heinemann. Retrieved from https://books.google.com/books?id=a-ogBQAAQBAJ&pg=PA1&dq=near+miss+safety&lr=&source=gbs_toc_r&cad=4#v=onepage&q=near%20miss%20safety&f=false
Vrbnjak, D., Denieffe, S., O’Gorman, C., & Pajnkihar, M. (2016). Barriers to reporting medication errors and near misses among nurses: A systematic review. International Journal of Nursing Studies, 63, 162-178. doi:10.1016/j.ijnurstu.2016.08.019
Running head: Validating the Safety Measurement Culture Survey
23
Table 1: Descriptives
Plant Number of Survey
Responses Number of Employees
Near Miss
First Aid Incidents Hazards
Mean Response
Response Standard Deviation
B1 24 44 0 10 2 0 3.15 1.00
B2 29 40 4 9 0 0 3.90 0.98
B3 27 72 6 4 3 0 2.82 1.02
B3 26 75 2 4 0 0 3.54 1.18
B3 3 7 0 1 0 0 4.07 0.67
B4 14 62 0 0 0 0 3.15 1.47
B5 9 17 0 0 0 0 3.06 1.22
B6 5 8 0 1 0 0 3.75 1.11
B7 23 29 1 1 0 0 3.45 1.12
B7 13 40 0 3 1 0 3.57 1.07
B7 23 54 1 3 1 0 3.44 1.09
B8 5 12 0 3 0 0 3.31 1.10
B8 10 12 0 3 0 0 2.93 1.20
B8 16 50 2 2 1 0 3.31 1.09
B8 18 55 0 17 0 0 3.61 1.09
B9 21 63 0 1 2 0 3.02 1.23
B9 19 34 2 1 1 0 3.85 1.03
B9 21 133 0 0 0 0 3.70 0.97
B10 37 70 5 0 0 0 3.71 1.17
A1 13 177 0 0 6 28 3.80 1.04
A1 22 38 0 0 0 0 4.18 0.89
A1 26 154 0 0 8 29 4.29 0.88
A1 74 395 0 0 31 41 4.10 0.98
A1 44 187 0 0 5 44 3.98 0.96
A2 18 95 0 0 1 3 4.28 0.86
A2 31 135 3 0 3 425 4.24 0.86
A2 56 337 10 0 8 383 4.13 0.97

Running head: Validating the Safety Measurement Culture Survey
24
Table 2 Correlation matrix between employee reporting (i.e., near miss, first aid, and hazard reporting divided by number of employees) and the average survey response for each questions.
Table 3 Correlation matrix between the average survey response and number of incidents in the 2020 calendar year.
Table 4 Questions that had significant correlations to Safety Measurement Culture and their anchors
Q6: My supervisor encourages employees to participate in decisions which affect safety (operating procedures, PPE…) I’m never asked to decide anything around safety. I never get asked but my supervisor tells us about safety decisions. I get asked for my opinion but I rarely give it. My supervisors encourage my opinion but am not involved in any final decisions. Me and my work team make decisions about our own safety.
Q11: I help investigate safety incidents and near misses. I avoid being involved in investigations because I am afraid I may get in trouble or look stupid.

Running head: Validating the Safety Measurement Culture Survey
25
I don’t consider this part of my job. I cooperate with investigations when required. I voluntarily participate in investigations when I think I can help. I encourage my peers to also get involved in investigations of safety incidents.
Q15: When we report safety issues it helps prevent potentially serious injuries. There are serious close calls happening in my department and I have not seen a reduction. It is not something we talk about so I have no idea. I don’t think reporting issues is helping one way or the other. In my team meetings, we get told that by reporting issues we have reduced potential serious injuries. My supervisor shows my team information on how our reporting is directly reducing injuries.
Table 5 Definitions, examples, and psychometric information for employee participation and management action.
Factor Definition Examples # of
questions in survey
Reliability
Employee Participation
The extent to which employees participate in the process and reporting of safety matters
Reporting of all minor injuries and near misses
5 α = .84
Management Action
Support and encourage employees to participate, includes transparency about the purpose of reporting
Improvements are made because of safety reporting
9
α = .69
(Compagnone, Young, Laske, Foreman, & Ludwig, 2020)

Running head: Validating the Safety Measurement Culture Survey
26
Figure 1: Scatterplot showing the relationship between number of incidents recorded in the 2020 calendar year per employee’s average survey response on the Safety Measurement Culture Survey in the 27 departments of companies A and B.

Running head: Validating the Safety Measurement Culture Survey
27
Figure 2: Scatterplot showing employee reporting (i.e., near miss, first aid, and hazard reporting divided by number of employees) and the average response score for question 6 (i.e., supervisors encourage employees to participate in safety decisions).

Running head: Validating the Safety Measurement Culture Survey
28
Figure 3: Scatterplot showing employee reporting (i.e., near miss, first aid, and hazard reporting divided by number of employees) and the average response score for question 11 (i.e., I help investigate safety incidents and near misses).

Running head: Validating the Safety Measurement Culture Survey
29
Figure 4: Scatterplot showing employee reporting (i.e., near miss, first aid, and hazard reporting divided by number of employees) and the average response score for question 15 (i.e., When we report safety issues it helps prevent potentially serious injuries).