Embed Size (px)
Citation preview
Department for Environment, Food and Rural Affairs Validating an Activity-Pressure Matrix Report R.2435 June 2015

Page intentionally left blank
2
Department for Environment, Food and Rural Affairs Validating an Activity-Pressure Matrix Date: June 2015 Project Ref: R/4292/01 Report No: R.2435 © ABP Marine Environmental Research Ltd
Version Details of Change Date 1 Draft 31.03.2015 2 Final 30.06.2015
Document Authorisation Signature Date
Project Manager: N J Frost
30.06.2015
Quality Manager: C E Brown
30.06.2015
Project Director: S C Hull
30.06.2015
ABP Marine Environmental Research Ltd Quayside Suite, Medina Chambers, Town Quay, Southampton, Hampshire SO14 2AQ Tel: +44 (0) 23 8071 1840 Fax: +44 (0) 23 8071 1841 Web: www.abpmer.co.uk Email: [email protected]
ABPmer is certified by:
All images copyright ABPmer apart from front cover (wave, anemone, bird) www.oceansedgephotography.co.uk 3
Validating an Activity-Pressure Matrix
Disclaimer:
▪ Any 'Draft' issue of this report, and any information contained therein, may be subject to updates and clarifications on the basis of any review comments before 'Final' issue. All content should therefore be considered provisional, and should not be disclosed to third parties without seeking prior clarification from ABP Marine Environmental Research Ltd ("ABPmer") of the suitability of the information for the intended disclosure and should not be relied upon by the addressee or any other person.
▪ Unless previously agreed between the addressee and ABPmer, in writing, the 'Final' issue of this report can be
relied on by the addressee only. ABPmer accepts no liability for the use by or reliance on this report or any of the results or methods presented in this report by any party that is not the addressee of the report. In the event the addressee discloses the report to any third party, the addressee shall make such third party aware that ABPmer shall not be liable to such third party in relation to the contents of the report and shall indemnify ABPmer in the event that ABPmer suffers any loss or damage as a result of the addressee failing to make such third party so aware.
▪ Sections of this report rely on data supplied by or drawn from third party sources. Unless previously agreed
between the addressee and ABPmer, in writing, ABPmer accepts no liability for loss or damage suffered by the addressee or any third party as a result of any reliance on third party data contained in the report or on any conclusions drawn by ABPmer which are based on such third party data.
R/4292/01 4 R.2435
Validating an Activity-Pressure Matrix
Summary Coastal and marine ecosystems are subject to a number of human-induced pressures associated with a variety of marine activities. It is important that the links between human activities and pressures are understood to provide an evidence base that will underpin the development of suitable indicators to assess habitat condition and seafloor integrity both within the UK and internationally. A clear understanding of the linkages will also support the management and monitoring of Marine Protected Areas (MPAs). In 2013 the Joint Nature Conservation Committee (JNCC) compiled an activities-pressures matrix which identified 39 human use activity categories and 34 human pressure types. Defra commissioned ABP Marine Environmental Research Ltd. (ABPmer), supported by Centre for Environment, Fisheries and Aquaculture Science (Cefas), to develop the evidence base for understanding the relationships between these human activities and pressures within the marine environment. The aims of the project can be summarised as follows: ▪ To increase the transparency of the identified activity-pressure links through the provision of
scientifically robust evidence; and ▪ To describe the confidence in the pressure-activity links based on the quantity and quality of
the evidence found. To achieve these aims the project was divided into a number of inter-linked tasks as outlined below: ▪ To define the characteristics and properties of the human activities listed within the matrix; ▪ To identify the mechanisms through which each activity contributes towards the identified
pressures; ▪ To review the level of contribution (in terms of extent and intensity) of each activity to a given
pressure and whether they meet a pre-defined benchmark; ▪ To assign a degree of confidence to the available evidence based on the type, amount, quality
and consistency of the evidence found; ▪ To identify whether there are any key pressure-activity associations that may warrant special
attention; and ▪ To identify any data gaps that requires further investigation. This report provides a summary of the outputs of these tasks including the associated rationale, assumptions and limitations. The report is accompanied by two spreadsheets which contain the evidence base for each of the activity-pressure linkages along with the associated confidence scores. It is intended that these will be translated into a database prior to wider dissemination. This would have the advantage of being readily searchable and accessible to a range of audiences. It would also be possible to continue to update the evidence base as new information becomes available. In addition the greater volumes of data would help to improve the confidence in the available evidence base. The frequency with which this is undertaken would be very much dependent on the availability of new information sources.
R/4292/01 5 R.2435
Validating an Activity-Pressure Matrix
The work has been constrained by the list of human activities and pressures that were contained within the original matrix. Similarly the definitions of the benchmarks resulted in a number of limitations for determining the potential for a particular sub-activity to result in a pressure that exceeds the benchmark. Despite these limitations the evidence base provides a valuable resource of information that can be used to manage and monitor the marine environment. A degree of expert judgment is, however, required when interpreting the evidence base for the management of potential impacts arising from human activities. In this context the underlying evidence remains valid even where new benchmarks are created or existing ones are updated. The evidence base could be further improved through greater consideration of the potential sensitivity of a range of ecological features. This would mean tailoring the evidence base (and review against the benchmarks) for groups of habitats and species. While this was beyond the scope of the existing project it is recommended that the outputs of the literature review (as documented within the matrix) are used to inform future developments in this field. It is recognised, however, that this would be subject to further interpretation and expert judgement. When interpreting the evidence base it is important to recognise that the sub-activity relationships (particularly in relation to the benchmarks) do not take into consideration the frequency with which a particular pressure might arise. This can be highly variable, for example, at different times of the day, or throughout the year, and can be continuous or occasional. It will also be highly variable between activities and sub-activities where, for example, the laying of a cable within a particular location would be a relatively rare event, as compared to benthic trawling which could be continuous throughout the year. The matrix in its current form does not consider the likely persistence of a pressure (the length of time a pressure takes to dissipate i.e. cease to cause an impact after cessation of an activity). Similarly the evidence in its current format does not take in to consideration the range of spatial scales or footprint (regional, national, global) over which the pressure might be exerted. This will be very dependent on the specific project or activity that is being considered and will include consideration of natural variability. The sub-activity pressure relationships may also be influenced by wider physical, chemical and biological changes associated with climate change. A degree of expert judgment is therefore required when interpreting the evidence base for the management of potential impacts arising from human activities. It is recommended that the evidence base is further developed to incorporate these wider considerations.
In summary the matrix, once disseminated, has the potential to provide a standardised set of information that can be used to inform the management and monitoring of the marine environment. In addition this will serve to improve the auditability of the decision making process across all marine sectors.
R/4292/01 6 R.2435
Validating an Activity-Pressure Matrix
Acknowledgements The project team would like to thank the Project Steering Group for their valuable contributions in the delivery of this work. This included members from: ▪ Department for Environment, Food and Rural Affairs; ▪ Environment Agency; ▪ Joint Nature Conservation Committee; ▪ Marine Scotland; ▪ Marine Management Organisation; and ▪ Natural England.
R/4292/01 7 R.2435
Validating an Activity-Pressure Matrix
Abbreviations ABPmer ABP Marine Environmental Research Ltd Cefas Centre for Environment, Fisheries and Aquaculture Science Defra Department for Environment, Food and Rural Affairs EIA Environmental Impact Assessment EMF Electromagnetic Field EMS European Marine Site FEAST Feature Activity Sensitivity Tool HRA Habitats Regulations Appraisal HBDSEG Healthy and Biologically Diverse Seas Evidence Group ICG-CE Intersessional Correspondence Group on Cumulative Effects ICG-COBAM Intersessional Correspondence Group on the Coordination of Biodiversity Assessment
and Monitoring IFCAs Association of Inshore Fisheries and Conservation Authorities IPCC Intergovernmental Panel on Climate Change JNCC Joint Nature Conservation Committee MALSF Marine Aggregate Levy Sustainability Fund MARG Marine Assessment and Reporting Group MCCIP Marine Climate Change Impacts Partnership MDE Marine Data Exchange MMO Marine Management Organisation MPA Marine Protected Area NFFO National Federation of Fishermen's Organisations NIS Non Indigenous Species ODEMM Options for Delivering Ecosystem-Based Marine Management SNCB Statutory Nature Conservation Bodies UK United Kingdom UKMMAS UK Marine Monitoring and Assessment Strategy WFD Water Framework Directive Cardinal points/directions are used unless otherwise stated. SI units are used unless otherwise stated.
R/4292/01 8 R.2435
Validating an Activity-Pressure Matrix
Validating an Activity-Pressure Matrix
Contents Page
Summary ................................................................................................................................................. 5
Acknowledgements.................................................................................................................................. 7
Abbreviations ........................................................................................................................................... 8
1. Introduction ............................................................................................................................... 11
2. Activity-Pressure Matrix ............................................................................................................ 12
2.1 Characterisation of Human Activities ........................................................................... 14 2.2 Pressures .................................................................................................................... 18 2.3 Development of the Evidence Base ............................................................................. 18
2.3.1 Evidence of Sub-activity-Pressure Relationship ......................................................... 19 2.3.2 Level of Contribution of Each Activity to a Given Pressure ........................................ 22 2.3.3 Confidence Assessment ............................................................................................ 28
3. Activity-Pressure Associations That May Warrant Special Attention ........................................ 29
3.1 No Evidence ................................................................................................................ 29 3.2 No Evidence In Relation to the Benchmark ................................................................. 30 3.3 High Pressure Significance .......................................................................................... 31 3.4 Screened Out .............................................................................................................. 31 3.5 Prioritisation ................................................................................................................. 32
4. Summary and Recommendations ............................................................................................ 33
5. References ............................................................................................................................... 34
Appendices A. Activities-Pressure Matrix B. Pressure and Benchmark Definitions C. Confidence Assessment
R/4292/01 9 R.2435
Validating an Activity-Pressure Matrix
Tables 1. Standardised list of sub-activities per human activity ................................................................ 15 2. Format of the sub-activity matrix ............................................................................................... 15 3. Limitations and assumptions associated with the definitions of human activities ..................... 16 4. Format of the spreadsheet used to capture the evidence base ................................................ 19 5. Pressures – limitations and assumptions .................................................................................. 21 6. Benchmarks – limitations and assumptions .............................................................................. 24 7. Confidence score methodology ................................................................................................ 29 Figure 1. Illustration of the approach used to obtain evidence ................................................................. 13
R/4292/01 10 R.2435
Validating an Activity-Pressure Matrix
1. Introduction Coastal and marine ecosystems are subject to a number of human-induced pressures associated with a variety of marine activities. It is important that the links between human activities and pressures are understood to provide an evidence base that will underpin the development of suitable indicators to assess habitat condition and seafloor integrity both within the UK and internationally. A clear understanding of the linkages will also support the management and monitoring of Marine Protected Areas (MPAs). In 2013 the Joint Nature Conservation Committee (JNCC) compiled an activities-pressures matrix1 which has since been endorsed by the Healthy and Biologically Diverse Seas Evidence Group (HBDSEG) and the UK Marine Monitoring and Assessment Strategy (UKMMAS) pressures sub group. The matrix identified 39 human use activity categories and 34 human pressure types (Appendix A). The links within this matrix are, however, largely based on expert judgement. Defra therefore commissioned ABP Marine Environmental Research Ltd. (ABPmer), supported by Centre for Environment, Fisheries and Aquaculture Science (Cefas), to develop the evidence base for understanding the relationships between human activities and pressures within the marine environment. The aims of the project can be summarised as follows: ▪ To increase the transparency of the identified activity-pressure links through the
provision of scientifically robust evidence, thereby validating the use of the matrix for the management and monitoring of UK seas; and
▪ To describe the confidence in the activity-pressure links based on the quantity and quality of the evidence found.
To achieve these aims the project was divided into a number of inter-linked tasks as outlined below: ▪ To define the characteristics and properties of the human activities listed within the
matrix; ▪ To identify the pressures which result from each of the human activities; ▪ To review the level of contribution (in terms of extent and intensity) of each activity to a
given pressure and whether they meet a pre-defined benchmark; ▪ To assign a degree of confidence to the available evidence based on the type, amount,
quality and consistency of the evidence found; ▪ To identify whether there are any key pressure-activity associations that may warrant
special attention; and ▪ To identify any data gaps that require further investigation.
1 http://jncc.defra.gov.uk/pdf/Final_HBDSEG_P-A_Matrix_Paper_28b_Website_edit%5b1%5d.pdf
R/4292/01 11 R.2435
Validating an Activity-Pressure Matrix
This report provides a summary of the outputs of these tasks including the associated rationale, assumptions and limitations. The report is accompanied by two spreadsheets which contain the evidence base for each of the activity-pressure linkages along with the associated confidence scores. It should be noted that this project forms part of an ongoing process to continue to develop the evidence base in support of the activities-pressure matrix. It is further anticipated that the spreadsheets provided as deliverables within this project will be translated into a database at a later date. The report is structured according to the following key headings: ▪ Section 1 – Introduction – provides the context to the project; ▪ Section 2 – Defines how the evidence for the activity-pressure matrix has been
compiled, including the assumptions and limitations that have been identified; ▪ Section 3 – Identifies those activity-pressure associations that require special attention;
and ▪ Section 4 – Provides a summary of the conclusions drawn from this project along with
recommendations for future work.
2. Activity-Pressure Matrix For the purposes of this project the following definitions have been assumed (Tillin et al., 2010): ▪ Activity - Human social or economic action or endeavours that may create pressures
on the marine environment. ▪ Pressure - The mechanism through which an activity has an effect on any part of the
ecosystem’. The nature of the pressure is determined by activity type, intensity and distribution.
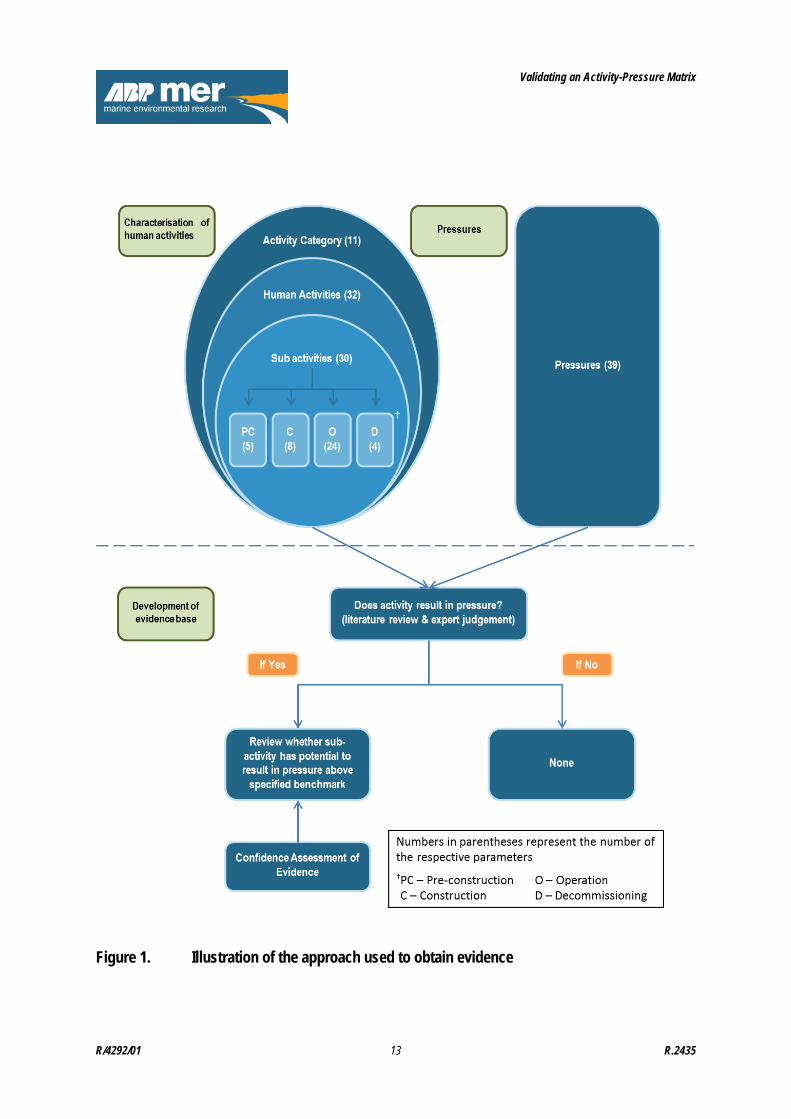
The evidence to underpin the activities–pressure matrix has been compiled through a number of tasks each of which is described in the subsequent sections. The over-arching framework which has been applied to the completion of this exercise is presented in Figure 1.
R/4292/01 12 R.2435
Validating an Activity-Pressure Matrix
Figure 1. Illustration of the approach used to obtain evidence
R/4292/01 13 R.2435
Validating an Activity-Pressure Matrix
2.1 Characterisation of Human Activities
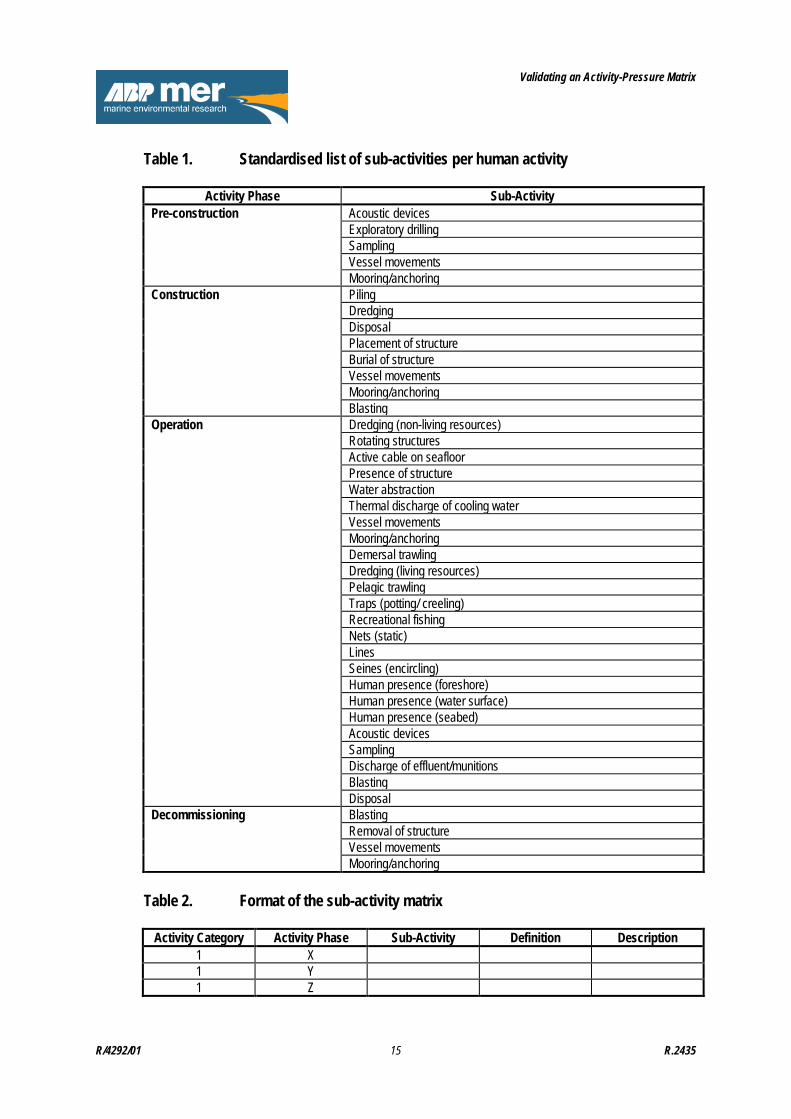
During the development of the 2013 JNCC standardised UK pressure-activities matrix, it was considered that a standard list of human activities for inclusion needed to be agreed. In an attempt to identify the most appropriate human activities list to take forward, multiple lists of human activities compiled from a variety of sources were compared. The resulting list of human activities used within the matrix was a modified version of the Boteler et al. (2013) analytical framework. This list has since been signed off by three groups who work through the UK Marine Monitoring and Assessment Strategy: the Marine Assessment and Reporting Group (MARG), the HBDSEG and the Steering Group on spatial data collation on human activities and pressures. Human activities in the marine environment may comprise a number of components for which the nature, intensity and duration of resulting pressures will vary considerably. For example, development projects may have a number of sub-activities associated with different stages of the project life cycle each of which may give rise to different pressures that range in intensity and duration. The first step in this project therefore identified all of the sub-activities associated with each of the 39 main human activities identified in the activity-pressure matrix. This was structured according to project stage namely pre-construction, construction, operational and decommissioning. To ensure consistency a standardised list of sub-activities was agreed at the outset of this task (see Table 1). A spreadsheet, which forms a key deliverable of this project, was set up to capture a definition of each sub-activity. The format of the spreadsheet is illustrated in Table 2. The list of definitions used for each of the sub-activities was again standardised, as far as possible, with further detail/ rationale specifically relevant to the particular activity captured in an additional column (“Description”). Where the sub-activity was not relevant to the respective human activity a value of “N/A” was entered into the cell. The information required to fully characterise each of the human activities has been obtained from a number of sources including previous Environmental Impact Assessments (EIAs) and Habitats Regulations Appraisals (HRAs) (for development projects) and sectoral reviews of activities and impacts (e.g. Marine Aggregate Levy Sustainability Fund (MALSF) reviews of environmental impacts of aggregates, Renewables UK/ Natural Environment Research Council (NERC) reviews of impacts of wave and tidal devices and the Green Blue database for marine recreational activity impacts). The outputs of a number of related studies have also been consulted including the development of Natural England advice for designated sites, the Defra led MB0102 (MPAs - gathering/developing and accessing the data for the planning of a network of Marine Conservation Zones), the Marine Institute Tools for Appropriate Assessment of Fishing and Aquaculture Activities in Marine and Coastal Natura 2000 Sites in Ireland, Options for Delivering Ecosystem-Based Marine Management (ODEMM - https://www.liv.ac.uk/odemm/), the Feature Activity Sensitivity Tool (FEAST - http://www.marine.scotland.gov.uk/FEAST/) and the Marine Climate Change Impacts Partnership (MCCIP). This was combined with the ABPmer/ Cefas project team experience of working for a wide range of marine sectors and with wider reference material. Individual references that apply to a particular human activity or sub-activity are cited within the respective spreadsheet.
R/4292/01 14 R.2435
Validating an Activity-Pressure Matrix
Table 1. Standardised list of sub-activities per human activity
Activity Phase Sub-Activity Pre-construction
Acoustic devices Exploratory drilling Sampling Vessel movements Mooring/anchoring
Construction Piling Dredging Disposal Placement of structure Burial of structure Vessel movements Mooring/anchoring Blasting
Operation Dredging (non-living resources) Rotating structures Active cable on seafloor Presence of structure Water abstraction Thermal discharge of cooling water Vessel movements Mooring/anchoring Demersal trawling Dredging (living resources) Pelagic trawling Traps (potting/ creeling) Recreational fishing Nets (static) Lines Seines (encircling) Human presence (foreshore) Human presence (water surface) Human presence (seabed) Acoustic devices Sampling Discharge of effluent/munitions Blasting Disposal
Decommissioning Blasting Removal of structure Vessel movements Mooring/anchoring
Table 2. Format of the sub-activity matrix
Activity Category Activity Phase Sub-Activity Definition Description 1 X 1 Y 1 Z
R/4292/01 15 R.2435
Validating an Activity-Pressure Matrix
The sub-division of human activities was constrained by the pre-defined list of human activities as per the JNCC activities-pressures matrix. The completion of the literature review (as documented in the accompanying spreadsheet) also required the application of a number of assumptions, these along with the key limitations identified during this task have been summarised in Table 3. Many of these assumptions had further implications for how the activities-pressures matrix evidence review was completed (i.e. how the associated pressure relationships were defined) (see Section 2.3 for further detail). The key limitation related to the potential replication/ overlap of sub-activities between the different human activity categories. There was a degree of overlap, for example, between the recreation and leisure and the other man-made structures activity categories. This specifically related to the construction of infrastructure required to provide coastal tourism sites and the introduction of artificial reefs and cultural heritage sites/ structures (e.g. wrecks). In this particular example it has been assumed that both human activities could result in the introduction of these types of structures. Similarly it has been necessary to make a number of assumptions as to how activities should be defined. A specific example included waste gas emissions where it was assumed that this principally related to emissions from industry. In this respect emissions from vessels were captured under the vessel movements sub-activity of the respective human activities. A further example included gas storage operations (carbon capture and natural gas storage) which has been assumed to include pipelines and shipping. The definitions of the human activities also have further implications for the collection of evidence with respect to the relationship between the activities and pressures. Combining submarine cable and pipeline operations, for example, does not allow for a distinction to be made for the different pressures that can result from these activities (e.g. Electromagnetic fields (EMF) can be associated with power cables but not telecommunication cables or pipelines). Similarly no distinction is made between tidal stream energy generation devices as compared to tidal lagoons or barrages. In these instances a distinction has been made within the subsequent evidence base between these activity types (see Section 2.3). Where specific gaps relating to the evidence base have been identified these have been documented in Section 3. Table 3. Limitations and assumptions associated with the definitions of human
activities
Activity Category Human Activity Limitation(s) Assumption Waste management activities
Waste gas emissions Assumed to be things such as industrial/ transport.
This activity was assumed not to have a significant influence on the marine environment. It was assumed to principally include emissions from industry. Emissions from vessels have been captured under the vessel movements sub-activity.
R/4292/01 16 R.2435
Validating an Activity-Pressure Matrix
Activity Category Human Activity Limitation(s) Assumption
Waste management activities
Industrial and agricultural liquid discharges
Potential overlap with the oil and gas industry (e.g. produced water).
Produced water has been considered under “marine hydrocarbon extraction” (included within the energy generation activity category).
Energy generation Renewable energy – tidal (not including cables)
There are large differences between the pressures that arise from tidal stream as opposed to tidal lagoon/barrage structures.
A distinction has been made within the evidence base between these activity types. This has greater implications for the subsequent tasks as detailed in Section 2.2.1.
Recreation and leisure Coastal tourist sites and Recreational activities (e.g. boating, yachting, diving, etc.)
There is potential overlap with the extraction of living resources – recreational fishing.
The pressure “removal of target species” has been captured for both of these activities.
Recreation and leisure Recreational activities (e.g. boating, yachting, diving, etc.)
Clarity on definition and what this activity encompasses.
It has been assumed that this only relates to undertaking the activity and not the associated infrastructure.
Other man-made structures
Submarine cable and pipeline operations
There are differences in pressures that arise from telecommunication cables and pipelines and operational power cables e.g. EMF.
A distinction has been made within the evidence base between these activity types. This has greater implications for the subsequent tasks as detailed in Section 2.2.1.
Other man-made structures
Artificial reefs and other environmental structures
There is a degree of overlap with the “coastal tourist sites” activity.
The pressures associated with the placement of artificial reefs and other environmental structures has been considered to be a component part of both of these human activities. However, the use of such structures for recreational purposes has only been included within the recreation and leisure activity categories.
Other man-made structures
Cultural and heritage sites/structures (e.g. wrecks, sculptures, foundations etc.)
There is a degree of overlap with the “coastal tourist sites” activity.
The pressures associated with the placement of Cultural and heritage sites/structures has been considered to be a component part of both of these human activities. However, the use of such structures for recreational purposes has only been included within the recreation and leisure activity categories.
Other man-made structures
Gas storage operations (carbon capture and natural gas storage)
Uncertainty over the definition of this activity.
This has been assumed to include pipelines and shipping as both methods could potentially be used to transport CO2 to storage sites.
R/4292/01 17 R.2435
Validating an Activity-Pressure Matrix
2.2 Pressures A fixed list of pressures has been derived within OSPAR to ensure consistency in the way pressures are assessed and their impact on biodiversity evaluated, in order to set the scope of work through Intersessional Correspondence Group on the Coordination of Biodiversity Assessment and Monitoring (ICG-COBAM) and Intersessional Correspondence Group on Cumulative Effects (ICG-CE). Additionally, the list was designed to support the identification of a priority set of pressure categories, according to their degree of relevance (impact) to biodiversity in order to prioritise the development of associated pressure maps. The full list of ICG-C pressures and accompanying definitions can be found in Appendix B.
2.3 Development of the Evidence Base
The provision of a scientifically robust evidence base which demonstrates the links between the activities and pressures has been undertaken via three tasks which have been run in parallel:
1) The identification and capturing of evidence that a particular sub-activity results in a
pressure; 2) A review of the evidence, more specifically, with respect to potential exceedance of a
previously defined benchmark; and 3) The assignment of a confidence score to the overall evidence relating to the activity-
pressure relationship.
A spreadsheet has been set up to record the outputs of the detailed literature review which essentially forms the key output of these tasks. The format of the spreadsheet is illustrated in Table 4. Within the spreadsheet a separate tab has been included for each of the human activities (as defined in the original activity-pressure matrix). Within each tab the x- axis contains the list of pressures and the y-axis contains the standardised list of sub-activities (as derived from the task described in Section 2.1). The evidence has been captured according to the following categories:
N/A – where sub-activity does not apply to the human activity as defined when characterising the human activities (see Section 2.1). This was required to ensure a consistent list of sub-activities was used across all of the activity tabs. This will facilitate the development of a database in a subsequent project. None (cell coloured green) – sub-activity does not result in pressure. Cell coloured blue - sub-activity results in pressure but no benchmark set. The associated evidence is captured within the respective cell in text format. Cell coloured grey - sub-activity results in pressure but no evidence available. Cell coloured purple - sub-activity results in pressure but no evidence available with respect to the specified benchmark. The associated evidence is captured within the respective cell in text format.
R/4292/01 18 R.2435
Validating an Activity-Pressure Matrix
Cell coloured yellow - sub-activity results in pressure below the benchmark. The associated evidence is captured within the respective cell in text format. Cell coloured orange - sub-activity has the potential to result in pressure at or above the benchmark. The associated evidence is captured within the respective cell in text format. Further detail on how the evidence has been captured for each of these tasks is provided in Sections 2.3.1 to 2.3.3. This includes details of any assumptions and limitations that have been encountered when compiling the evidence base. Table 4. Format of the spreadsheet used to capture the evidence base
Activity Phase Sub-Activity Pressure A Pressure B Pressure C Pressure D Pre-construction 1 Pre-construction 2 Construction 1 Construction 2 Operation 1 Operation 2 Decommissioning 1 Decommissioning 2 Note: A separate tab has been produced for each human activity. It should be noted that each of the fishing activities are also
effectively sub-activities of the operational phase of fishing and as such all of the evidence has been captured within the respective sub-activities cells of an over-arching fisheries tab.
2.3.1 Evidence of Sub-activity-Pressure Relationship
A detailed literature review was undertaken to identify evidence as to whether a particular sub-activity (per activity) has the potential to result in each of the 34 pressure types. This included searching for scientific and grey literature using ScienceDirect and Google Scholar as well as reviewing project experience and internal reference material within Cefas and ABPmer. Evidence associated with the impacts of human activities in the marine environment as documented within environmental statements and impact verification monitoring reports was also captured. In addition, the information sources (including sectoral reviews, ongoing research initiatives and the development of MPA site management advice) outlined in Section 2.1 above were also consulted. Individual references that apply to a particular sub-activity-pressure relationship have been cited within the respective tabs of the accompanying spreadsheet.
A number of general principles were applied to the identification of evidence for a particular sub-activity-pressure relationship. The definition of each pressure was provided by JNCC (Section 2.2 and Appendix B). The pressures that were considered to arise from a particular sub-activity were those that arise within the immediate vicinity of the respective sub-activity. This therefore included those pressures that are a direct result of the sub-activity being undertaken (i.e. not indirect effects). The decommissioning phase was assumed to include the cessation of all sub-activities associated with the operational phase and the reverse of the construction phase (including the removal of structures).
R/4292/01 19 R.2435
Validating an Activity-Pressure Matrix
The potential range in the level of pressure that could be exerted by a particular sub-activity was documented where such evidence was available. For example, source noise levels associated with further sub-divisions of the sub-activities have been documented where possible. This includes, for example, the source noise levels associated with different piling techniques that might fall under a single sub-activity. Similarly it was possible to make a distinction between the pressures that could result from the use of different vessel types and sizes (and by inference which sub-activities these were most applicable to).
As identified in Section 2.1 a number of the definitions of human activities are such that it has been necessary to make a distinction between the different pressures that can result from a particular sub-activity. Electromagnetic changes, for example, can be associated with operational power cables but not telecommunication cables or pipelines. Similarly a distinction has been made between the pressures that can potentially arise from tidal stream energy generation devices compared to tidal lagoons or barrages.
In a number of instances parts of the evidence base were transferable between different project phases as well as across the over-arching activity types. Evidence gathered for vessel movements and anchoring, for example, was relevant to pre-construction, construction and operational project phases as well as between human activity types. This is because effectively the same pressure can result from a number of different sub-activities. In such instances standardised text has been used throughout the respective human activity tabs of the associated spreadsheet.
Where the sub-activity was not relevant to the human activity (as defined when characterising the human activities, see Section 2.1) a value of ‘N/A’ was entered in to the respective cell within the spreadsheet. Where the sub-activity was not considered to result in a particular pressure the cell was coloured green. This allocation of categories was based on a combination of the outputs of the literature review and expert judgement. No evidence was available for a number of the sub-activity-pressure relationships (see Section 3 for further detail). In these instances the respective cells within the spreadsheet have been coloured grey.
The review of evidence with respect to each of the sub-activity-pressure relationships, required the application of a number of assumptions (Table 5). These included assumptions with respect to the project phase within which a particular pressure is exerted. In the case of the “physical change (to another seabed type)” pressure, for example, it was assumed that this would potentially occur within the construction phase and persist through the operational phase of a project.
The agreed ICG-CE definitions of some of the pressures do not take in to account the full range of sub-activities that could result in that pressure. The “Barrier to species movement” pressure, for example, is defined in terms of physical obstructions (through the placement of structures etc.) whereas in reality these could also be caused by noise or changes in water quality. A number of the ICG-CE pressure categories are effectively combinations of individual pressures that also occur within the matrix (e.g. surface and subsurface abrasion are included as individual pressures along with an overall abrasion pressure). In such instances the evidence from the worst case of the individual pressure components was predominantly used to inform the likely overall pressure relationship.
R/4292/01 20 R.2435
Validating an Activity-Pressure Matrix
Further issues related to the ability to directly attribute evidence that a sub-activity specifically resulted in a particular pressure. Marine litter, for example, is often difficult to attribute to a source and as such it was difficult to determine which sub activities result in this pressure. Similarly, there is considerable evidence to suggest that non-native species can survive being transferred in ballast water, however, there was less direct evidence that this has actually resulted in the introduction of non-indigenous species.
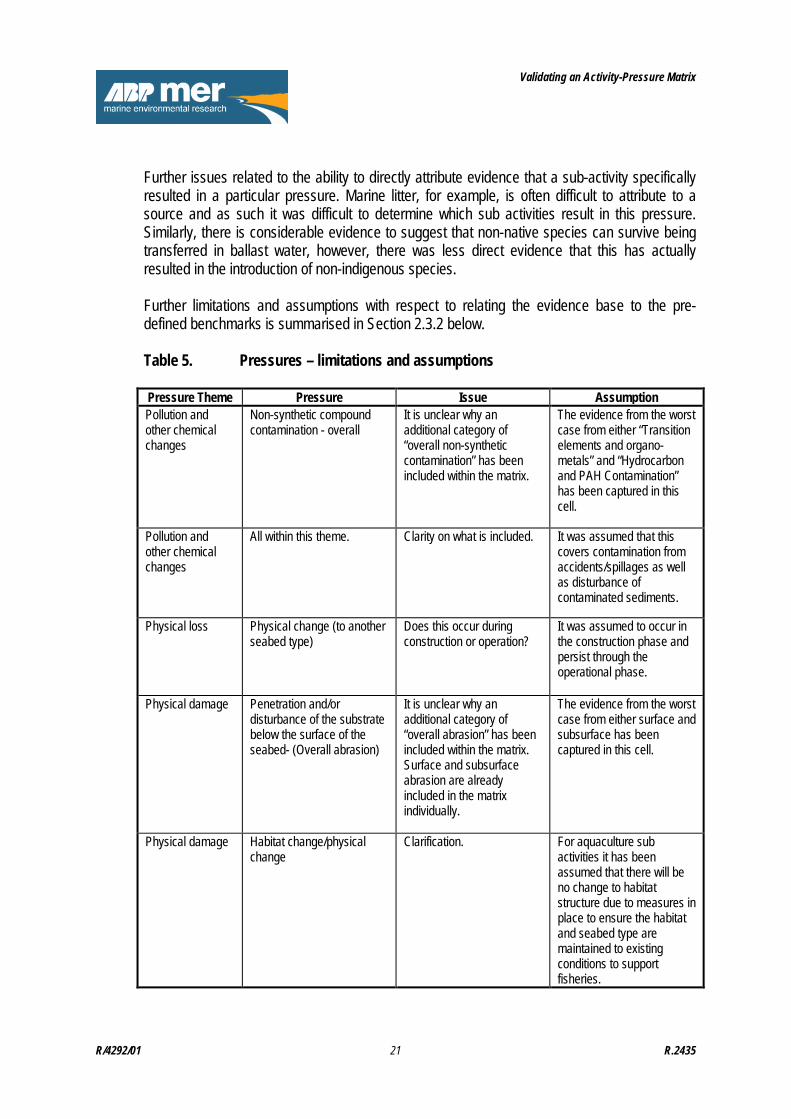
Further limitations and assumptions with respect to relating the evidence base to the pre-defined benchmarks is summarised in Section 2.3.2 below.
Table 5. Pressures – limitations and assumptions Pressure Theme Pressure Issue Assumption Pollution and other chemical changes
Non-synthetic compound contamination - overall
It is unclear why an additional category of “overall non-synthetic contamination” has been included within the matrix.
The evidence from the worst case from either “Transition elements and organo-metals” and “Hydrocarbon and PAH Contamination” has been captured in this cell.
Pollution and other chemical changes
All within this theme. Clarity on what is included. It was assumed that this covers contamination from accidents/spillages as well as disturbance of contaminated sediments.
Physical loss Physical change (to another seabed type)
Does this occur during construction or operation?
It was assumed to occur in the construction phase and persist through the operational phase.
Physical damage Penetration and/or disturbance of the substrate below the surface of the seabed- (Overall abrasion)
It is unclear why an additional category of “overall abrasion” has been included within the matrix. Surface and subsurface abrasion are already included in the matrix individually.
The evidence from the worst case from either surface and subsurface has been captured in this cell.
Physical damage Habitat change/physical change
Clarification. For aquaculture sub activities it has been assumed that there will be no change to habitat structure due to measures in place to ensure the habitat and seabed type are maintained to existing conditions to support fisheries.
R/4292/01 21 R.2435
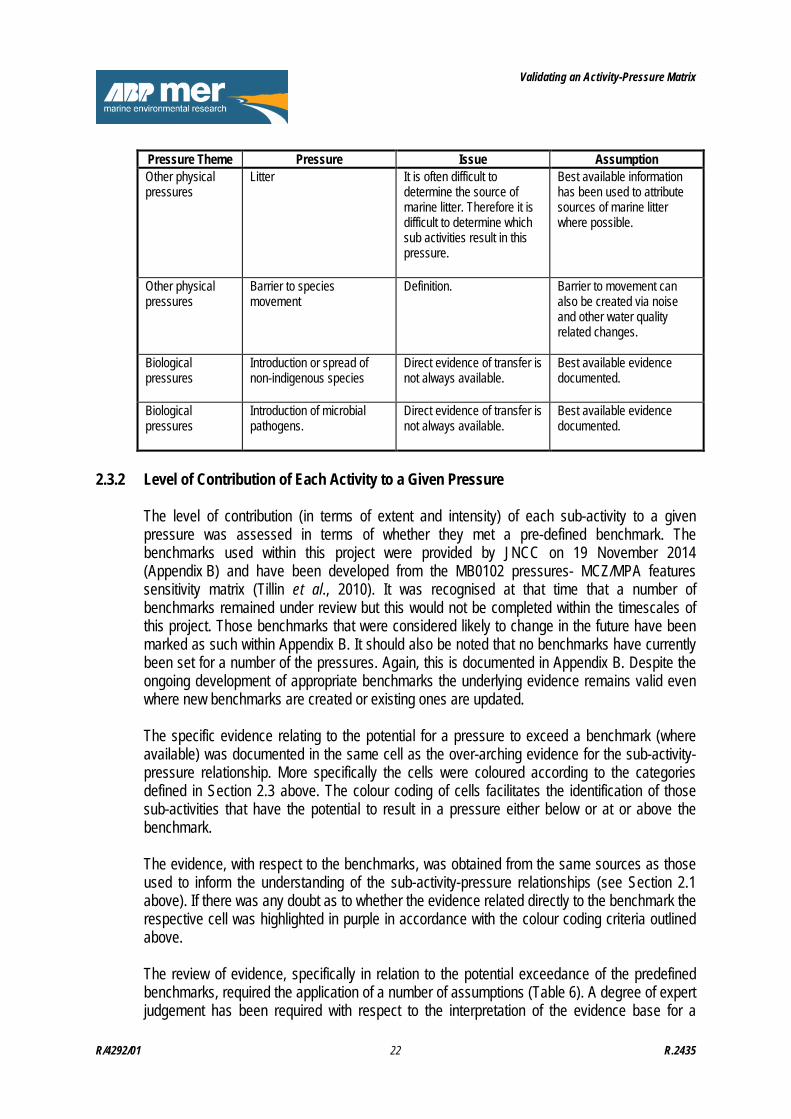
Validating an Activity-Pressure Matrix
Pressure Theme Pressure Issue Assumption Other physical pressures
Litter It is often difficult to determine the source of marine litter. Therefore it is difficult to determine which sub activities result in this pressure.
Best available information has been used to attribute sources of marine litter where possible.
Other physical pressures
Barrier to species movement
Definition. Barrier to movement can also be created via noise and other water quality related changes.
Biological pressures
Introduction or spread of non-indigenous species
Direct evidence of transfer is not always available.
Best available evidence documented.
Biological pressures
Introduction of microbial pathogens.
Direct evidence of transfer is not always available.
Best available evidence documented.
2.3.2 Level of Contribution of Each Activity to a Given Pressure
The level of contribution (in terms of extent and intensity) of each sub-activity to a given pressure was assessed in terms of whether they met a pre-defined benchmark. The benchmarks used within this project were provided by JNCC on 19 November 2014 (Appendix B) and have been developed from the MB0102 pressures- MCZ/MPA features sensitivity matrix (Tillin et al., 2010). It was recognised at that time that a number of benchmarks remained under review but this would not be completed within the timescales of this project. Those benchmarks that were considered likely to change in the future have been marked as such within Appendix B. It should also be noted that no benchmarks have currently been set for a number of the pressures. Again, this is documented in Appendix B. Despite the ongoing development of appropriate benchmarks the underlying evidence remains valid even where new benchmarks are created or existing ones are updated. The specific evidence relating to the potential for a pressure to exceed a benchmark (where available) was documented in the same cell as the over-arching evidence for the sub-activity-pressure relationship. More specifically the cells were coloured according to the categories defined in Section 2.3 above. The colour coding of cells facilitates the identification of those sub-activities that have the potential to result in a pressure either below or at or above the benchmark. The evidence, with respect to the benchmarks, was obtained from the same sources as those used to inform the understanding of the sub-activity-pressure relationships (see Section 2.1 above). If there was any doubt as to whether the evidence related directly to the benchmark the respective cell was highlighted in purple in accordance with the colour coding criteria outlined above. The review of evidence, specifically in relation to the potential exceedance of the predefined benchmarks, required the application of a number of assumptions (Table 6). A degree of expert judgement has been required with respect to the interpretation of the evidence base for a
R/4292/01 22 R.2435
Validating an Activity-Pressure Matrix
number of the benchmarks. This has occurred in instances where, for example, the evidence was not expressed in the same units as those stated within the benchmark (e.g. Radionuclide contamination and Organic Enrichment). Similarly for the pressure ‘Physical Loss (to another sea bed type)’ the benchmark is expressed as a change in one Folk class for two years. The available evidence for this sub-activity-pressure relationship was rarely expressed in these units, however, the introduction of a man-made structure was assumed to have the potential to exceed this benchmark. The application of a number of the benchmarks requires an understanding of the baseline environment in which the project is being undertaken. This particularly relates to understanding the levels of pressures that could arise with respect to hydrological changes and pollution and other chemical changes. Similarly it was typically difficult to relate evidence to those benchmarks that referenced WFD criteria as these require a degree of water body specific knowledge. In these instances the evidence has typically not been presented in the direct context of the benchmark. In instances where the benchmarks have a spatial or temporal element it was again difficult to obtain evidence that was directly related to the benchmark. The benchmark for water flow changes, for example, states a change in peak mean spring bed flow velocity of between 0.1m/s to 0.2m/s for more than one year. The benchmark for ‘wave flow (tidal current)-local’ relates to a change in near shore significant wave height >3% but <5% but does not state the time-period over which it applies. An annual average significant wave height has therefore been assumed. Where there was a range specified within a particular benchmark (e.g. Siltation rate changes, including smothering (depth of vertical sediment overburden) of both up to 5cm and 30cm of fine material added to the seabed in a single event) a precautionary approach has been adopted. The same principle has been applied when considering benchmarks that state compliance with a range of standards across a number of contaminants. In these instances if a single substance has the potential to fail the respective standard as a result of the sub-activity this has been assumed to have the potential to be above the benchmark.
The current definitions of a number of the benchmarks do not capture all of the potential elements of a pressure associated with a particular sub-activity. The benchmark for death or injury by collision, for example, is expressed in terms of tidal volume and as such does not incorporate the potential for above sea-surface collision e.g. with wind turbines. Similarly the benchmark for the introduction or spread of non-indigenous species is only expressed in terms of the introduction of one or more species. It therefore does not include the potential for species to spread as a result of a structure providing a suitable habitat for colonisation. A further example is the removal of target species where the benchmark is only phrased in relation to species recognised within environmental designations, whereas in reality other fish species are being overfished (i.e. are subject to a high intensity of pressure). The terminology used in a number of the benchmarks also had a direct influence on whether a sub-activity had the potential to result in a pressure intensity that exceeds the respective benchmark. For example, the benchmarks associated with the abrasion pressure categories
R/4292/01 23 R.2435
Validating an Activity-Pressure Matrix
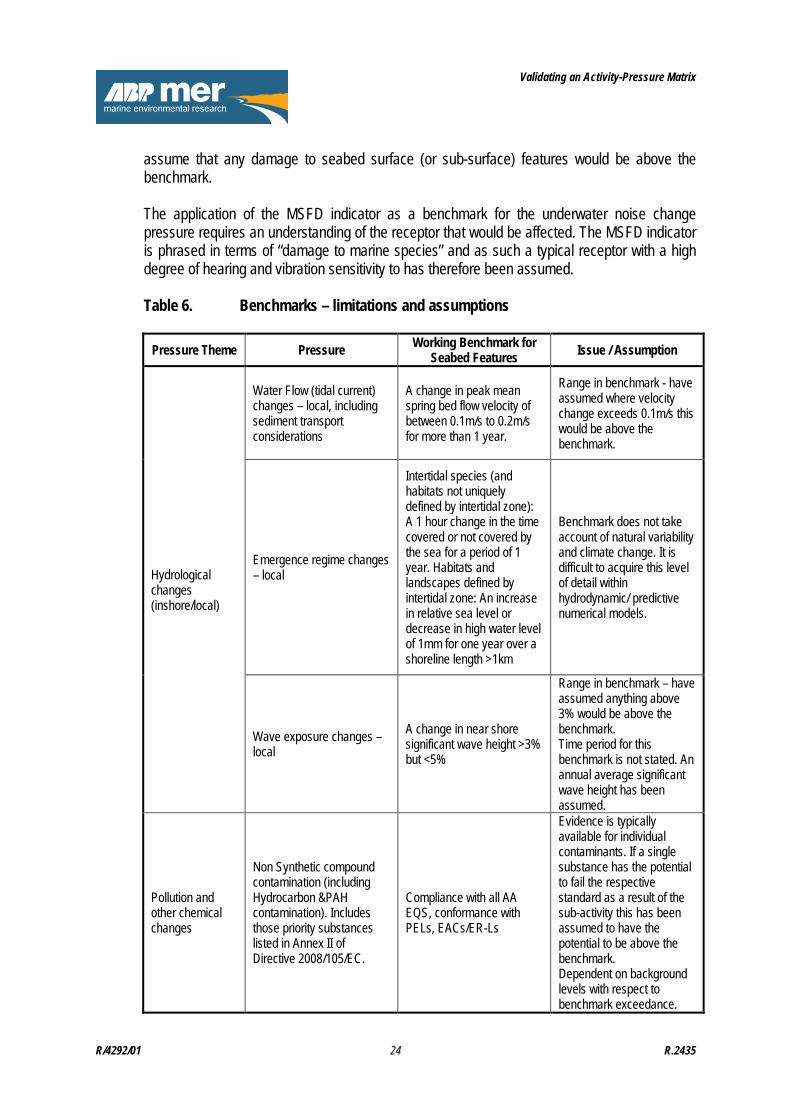
assume that any damage to seabed surface (or sub-surface) features would be above the benchmark. The application of the MSFD indicator as a benchmark for the underwater noise change pressure requires an understanding of the receptor that would be affected. The MSFD indicator is phrased in terms of “damage to marine species” and as such a typical receptor with a high degree of hearing and vibration sensitivity to has therefore been assumed. Table 6. Benchmarks – limitations and assumptions
Pressure Theme Pressure Working Benchmark for Seabed Features Issue / Assumption
Hydrological changes (inshore/local)
Water Flow (tidal current) changes – local, including sediment transport considerations
A change in peak mean spring bed flow velocity of between 0.1m/s to 0.2m/s for more than 1 year.
Range in benchmark - have assumed where velocity change exceeds 0.1m/s this would be above the benchmark.
Emergence regime changes – local
Intertidal species (and habitats not uniquely defined by intertidal zone): A 1 hour change in the time covered or not covered by the sea for a period of 1 year. Habitats and landscapes defined by intertidal zone: An increase in relative sea level or decrease in high water level of 1mm for one year over a shoreline length >1km
Benchmark does not take account of natural variability and climate change. It is difficult to acquire this level of detail within hydrodynamic/ predictive numerical models.
Wave exposure changes – local
A change in near shore significant wave height >3% but <5%
Range in benchmark – have assumed anything above 3% would be above the benchmark. Time period for this benchmark is not stated. An annual average significant wave height has been assumed.
Pollution and other chemical changes
Non Synthetic compound contamination (including Hydrocarbon &PAH contamination). Includes those priority substances listed in Annex II of Directive 2008/105/EC.
Compliance with all AA EQS, conformance with PELs, EACs/ER-Ls
Evidence is typically available for individual contaminants. If a single substance has the potential to fail the respective standard as a result of the sub-activity this has been assumed to have the potential to be above the benchmark. Dependent on background levels with respect to benchmark exceedance.
R/4292/01 24 R.2435
Validating an Activity-Pressure Matrix
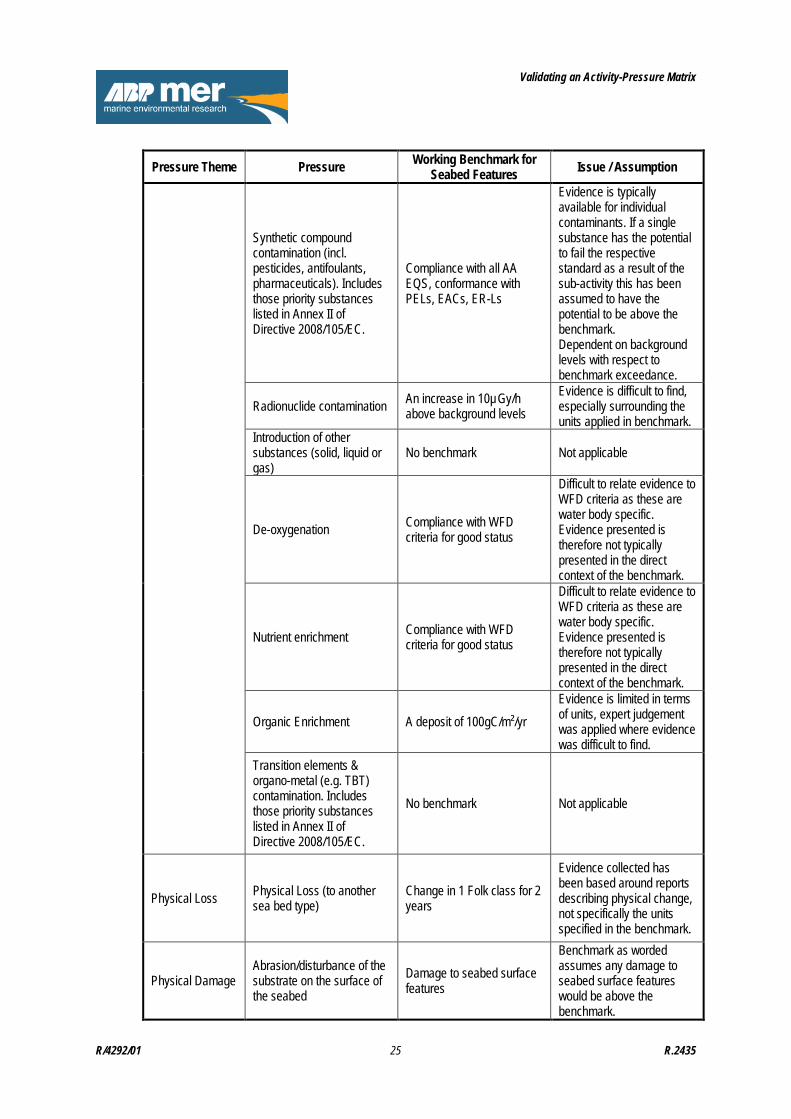
Pressure Theme Pressure Working Benchmark for Seabed Features Issue / Assumption
Synthetic compound contamination (incl. pesticides, antifoulants, pharmaceuticals). Includes those priority substances listed in Annex II of Directive 2008/105/EC.
Compliance with all AA EQS, conformance with PELs, EACs, ER-Ls
Evidence is typically available for individual contaminants. If a single substance has the potential to fail the respective standard as a result of the sub-activity this has been assumed to have the potential to be above the benchmark. Dependent on background levels with respect to benchmark exceedance.
Radionuclide contamination An increase in 10µGy/h above background levels
Evidence is difficult to find, especially surrounding the units applied in benchmark.
Introduction of other substances (solid, liquid or gas)
No benchmark Not applicable
De-oxygenation Compliance with WFD criteria for good status
Difficult to relate evidence to WFD criteria as these are water body specific. Evidence presented is therefore not typically presented in the direct context of the benchmark.
Nutrient enrichment Compliance with WFD criteria for good status
Difficult to relate evidence to WFD criteria as these are water body specific. Evidence presented is therefore not typically presented in the direct context of the benchmark.
Organic Enrichment A deposit of 100gC/m²/yr Evidence is limited in terms of units, expert judgement was applied where evidence was difficult to find.
Transition elements & organo-metal (e.g. TBT) contamination. Includes those priority substances listed in Annex II of Directive 2008/105/EC.
No benchmark Not applicable
Physical Loss Physical Loss (to another sea bed type)
Change in 1 Folk class for 2 years
Evidence collected has been based around reports describing physical change, not specifically the units specified in the benchmark.
Physical Damage Abrasion/disturbance of the substrate on the surface of the seabed
Damage to seabed surface features
Benchmark as worded assumes any damage to seabed surface features would be above the benchmark.
R/4292/01 25 R.2435
Validating an Activity-Pressure Matrix
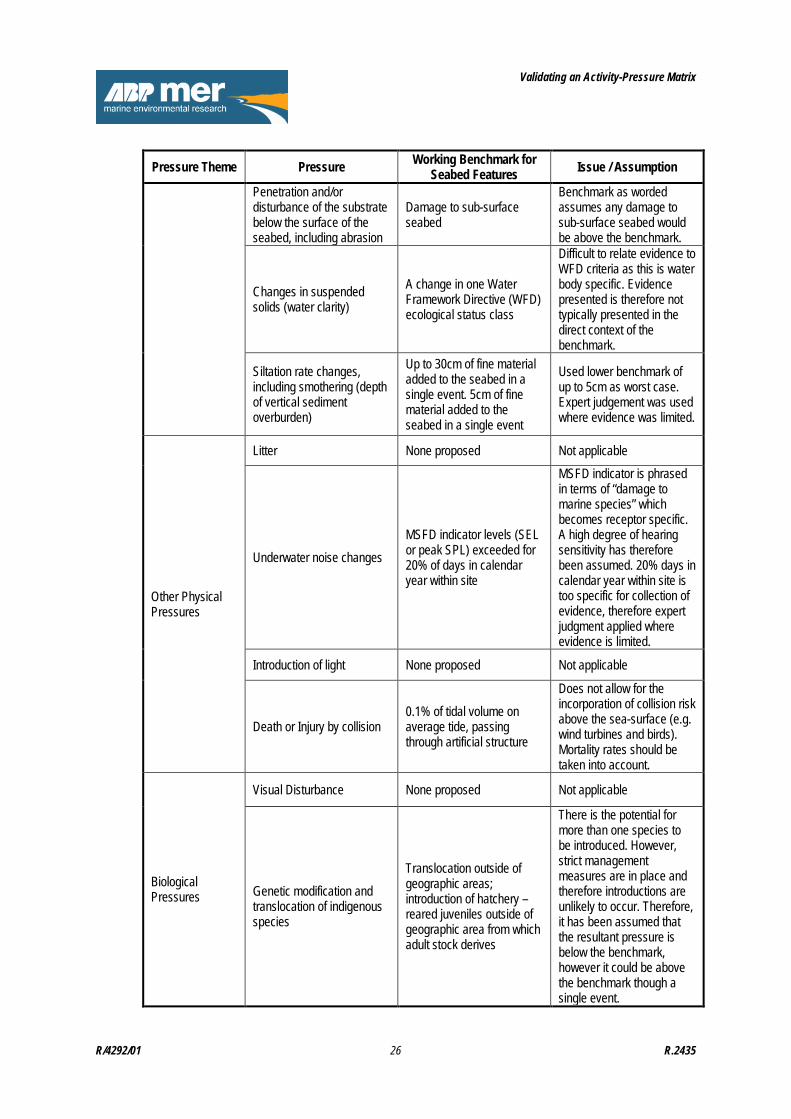
Pressure Theme Pressure Working Benchmark for Seabed Features Issue / Assumption
Penetration and/or disturbance of the substrate below the surface of the seabed, including abrasion
Damage to sub-surface seabed
Benchmark as worded assumes any damage to sub-surface seabed would be above the benchmark.
Changes in suspended solids (water clarity)
A change in one Water Framework Directive (WFD) ecological status class
Difficult to relate evidence to WFD criteria as this is water body specific. Evidence presented is therefore not typically presented in the direct context of the benchmark.
Siltation rate changes, including smothering (depth of vertical sediment overburden)
Up to 30cm of fine material added to the seabed in a single event. 5cm of fine material added to the seabed in a single event
Used lower benchmark of up to 5cm as worst case. Expert judgement was used where evidence was limited.
Other Physical Pressures
Litter None proposed Not applicable
Underwater noise changes MSFD indicator levels (SEL or peak SPL) exceeded for 20% of days in calendar year within site
MSFD indicator is phrased in terms of “damage to marine species” which becomes receptor specific. A high degree of hearing sensitivity has therefore been assumed. 20% days in calendar year within site is too specific for collection of evidence, therefore expert judgment applied where evidence is limited.
Introduction of light None proposed Not applicable
Death or Injury by collision 0.1% of tidal volume on average tide, passing through artificial structure
Does not allow for the incorporation of collision risk above the sea-surface (e.g. wind turbines and birds). Mortality rates should be taken into account.
Biological Pressures
Visual Disturbance None proposed Not applicable
Genetic modification and translocation of indigenous species
Translocation outside of geographic areas; introduction of hatchery –reared juveniles outside of geographic area from which adult stock derives
There is the potential for more than one species to be introduced. However, strict management measures are in place and therefore introductions are unlikely to occur. Therefore, it has been assumed that the resultant pressure is below the benchmark, however it could be above the benchmark though a single event.
R/4292/01 26 R.2435
Validating an Activity-Pressure Matrix
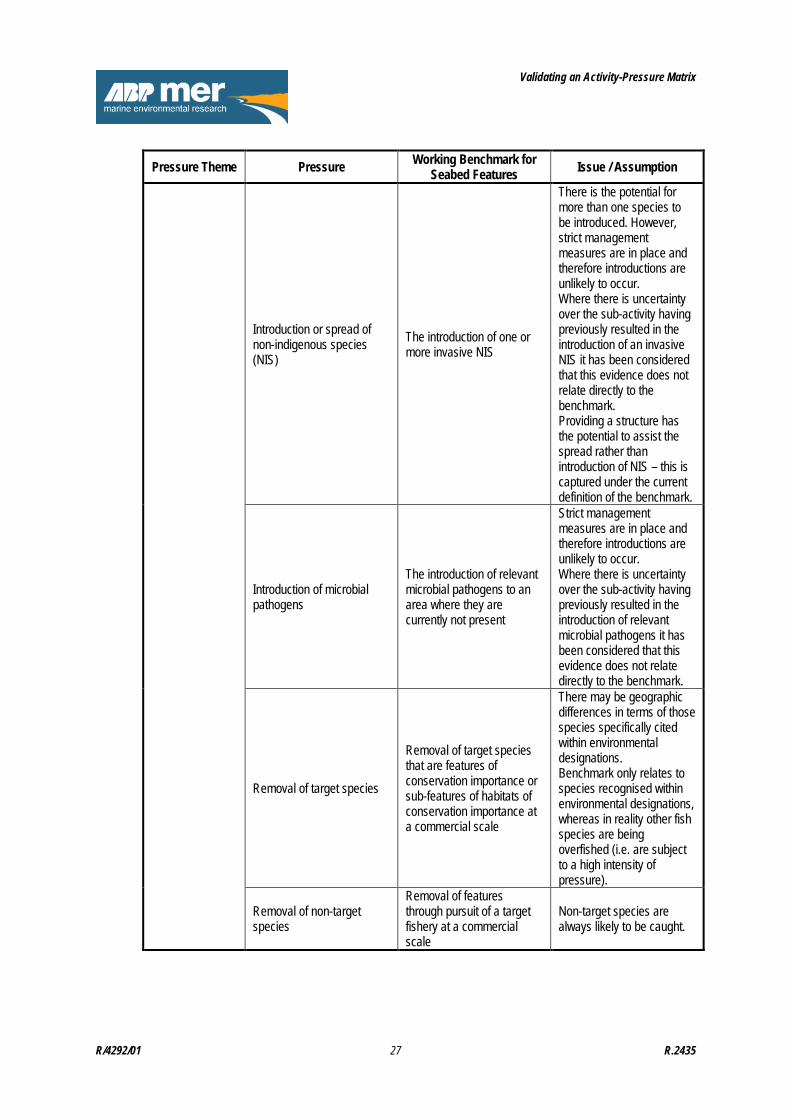
Pressure Theme Pressure Working Benchmark for Seabed Features Issue / Assumption
Introduction or spread of non-indigenous species (NIS)
The introduction of one or more invasive NIS
There is the potential for more than one species to be introduced. However, strict management measures are in place and therefore introductions are unlikely to occur. Where there is uncertainty over the sub-activity having previously resulted in the introduction of an invasive NIS it has been considered that this evidence does not relate directly to the benchmark. Providing a structure has the potential to assist the spread rather than introduction of NIS – this is captured under the current definition of the benchmark.
Introduction of microbial pathogens
The introduction of relevant microbial pathogens to an area where they are currently not present
Strict management measures are in place and therefore introductions are unlikely to occur. Where there is uncertainty over the sub-activity having previously resulted in the introduction of relevant microbial pathogens it has been considered that this evidence does not relate directly to the benchmark.
Removal of target species
Removal of target species that are features of conservation importance or sub-features of habitats of conservation importance at a commercial scale
There may be geographic differences in terms of those species specifically cited within environmental designations. Benchmark only relates to species recognised within environmental designations, whereas in reality other fish species are being overfished (i.e. are subject to a high intensity of pressure).
Removal of non-target species
Removal of features through pursuit of a target fishery at a commercial scale
Non-target species are always likely to be caught.
R/4292/01 27 R.2435
Validating an Activity-Pressure Matrix
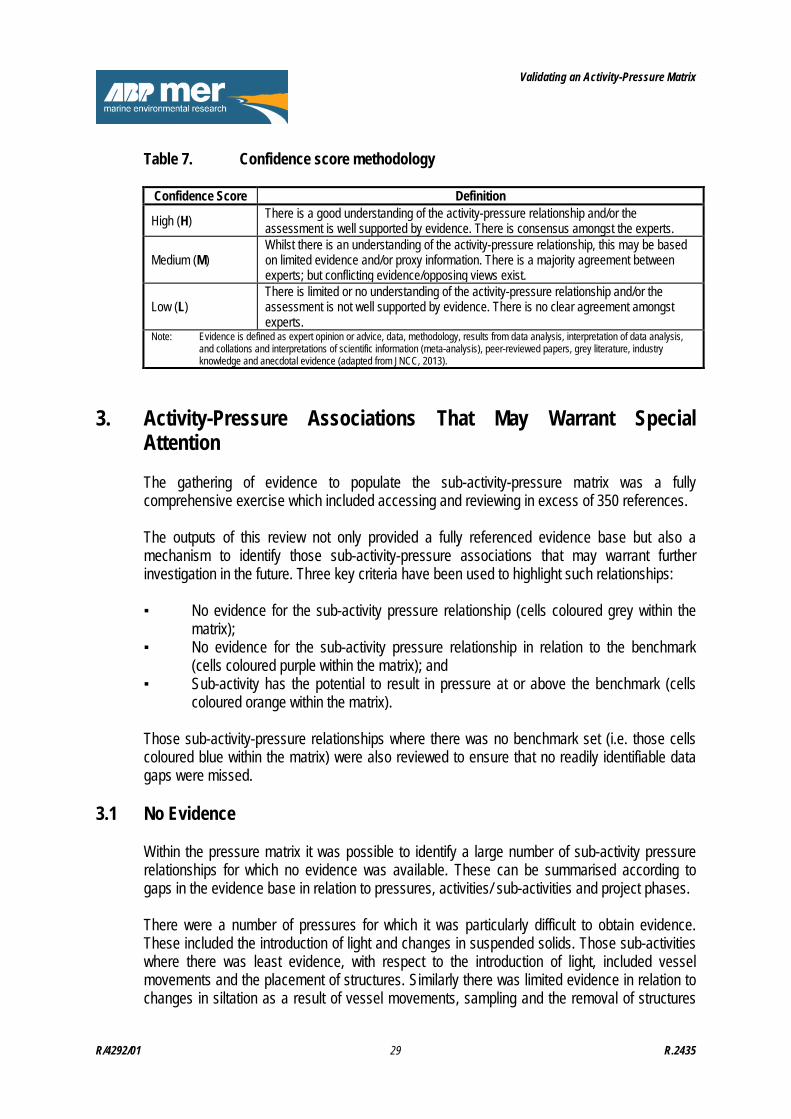
2.3.3 Confidence Assessment A review of confidence assessment methodologies has been undertaken in order to develop a method that could be applied to assessing the evidence supporting the linkages of the combined activities-pressures matrix. The confidence assessment method was required to be appropriate for assessing the type, amount, quality and consistency of the evidence supporting each activity-pressure linkage. A total of four confidence classification systems were reviewed: 1. The confidence assessment approach developed as part of the MB0102 pressures-
MCZ/MPA features sensitivity matrix (Tillin et al., 2010); 2. The assessment described in the ‘Guidance Note for Lead Authors of the IPCC Fifth
Assessment Report on Consistent Treatment of Uncertainties’ (Mastrandrea et al., 2010);
3. Two methods that have been developed by the Environment Agency:
a. Part of a risk assessment to determine the likelihood of river, transitional (estuaries) and coastal waters failing to achieve the WFD objective of Good status post 2015 due to designated chemicals (Environment Agency, 2014); and
b. A technical assessment of the first pressures and impacts analyses required by Article 5 of the WFD (Environment Agency, undated).
The full details of the review can be found in Appendix C. In summary, the review of the available methods resulted in the confidence assessment method outlined in Table 7. The method was selected as it was sufficiently generic to reflect the underlying evidence types gathered as part of this project, without being so general that it loses substantive meaning. Consideration of the type, amount, quality and consistency of the evidence is an integral part of the assessment, as is the likelihood that a particular activity will result in a given pressure. For example, a high confidence score may be assigned where there is a combination of high quality robust evidence and a high level of agreement (i.e. likely to occur). By contrast, a low confidence score may be assigned where evidence is limited and the level of agreement is low (unlikely to occur). Where it is known that an activity may result in a pressure but there is little information about this relationship, a high level of agreement can increase confidence, whilst a low level of agreement can undermine confidence (i.e. reduce the score). In addition the method offers repeatability and could be readily applied to the large number of sub-activity pressure relationships that have been assessed as part of this project. The confidence score (assigned according to the evidence relating to the activity-pressure relationship (not the benchmark) is captured within the respective cell (within the accompanying spreadsheet) according to the criteria outlined in Table 7. The confidence score has been recorded as high (H), medium (M) or low (L).
R/4292/01 28 R.2435
Validating an Activity-Pressure Matrix
Table 7. Confidence score methodology
Confidence Score Definition
High (H) There is a good understanding of the activity-pressure relationship and/or the assessment is well supported by evidence. There is consensus amongst the experts.
Medium (M) Whilst there is an understanding of the activity-pressure relationship, this may be based on limited evidence and/or proxy information. There is a majority agreement between experts; but conflicting evidence/opposing views exist.
Low (L) There is limited or no understanding of the activity-pressure relationship and/or the assessment is not well supported by evidence. There is no clear agreement amongst experts.
Note: Evidence is defined as expert opinion or advice, data, methodology, results from data analysis, interpretation of data analysis, and collations and interpretations of scientific information (meta-analysis), peer-reviewed papers, grey literature, industry knowledge and anecdotal evidence (adapted from JNCC, 2013).
3. Activity-Pressure Associations That May Warrant Special Attention
The gathering of evidence to populate the sub-activity-pressure matrix was a fully comprehensive exercise which included accessing and reviewing in excess of 350 references. The outputs of this review not only provided a fully referenced evidence base but also a mechanism to identify those sub-activity-pressure associations that may warrant further investigation in the future. Three key criteria have been used to highlight such relationships: ▪ No evidence for the sub-activity pressure relationship (cells coloured grey within the
matrix); ▪ No evidence for the sub-activity pressure relationship in relation to the benchmark
(cells coloured purple within the matrix); and ▪ Sub-activity has the potential to result in pressure at or above the benchmark (cells
coloured orange within the matrix). Those sub-activity-pressure relationships where there was no benchmark set (i.e. those cells coloured blue within the matrix) were also reviewed to ensure that no readily identifiable data gaps were missed.
3.1 No Evidence Within the pressure matrix it was possible to identify a large number of sub-activity pressure relationships for which no evidence was available. These can be summarised according to gaps in the evidence base in relation to pressures, activities/ sub-activities and project phases. There were a number of pressures for which it was particularly difficult to obtain evidence. These included the introduction of light and changes in suspended solids. Those sub-activities where there was least evidence, with respect to the introduction of light, included vessel movements and the placement of structures. Similarly there was limited evidence in relation to changes in siltation as a result of vessel movements, sampling and the removal of structures
R/4292/01 29 R.2435
Validating an Activity-Pressure Matrix
during decommissioning. These sub-activities were common to a number of human activities and as such these gaps were apparent throughout the matrix. The amount of evidence that was available across the different human activities was again variable. An example human activity for which there was a less well established evidence base included military activities. This reflects the large degree of confidentiality that surrounds this human activity category. Further sub-activities where evidence was typically limited included seaweed harvesting (extraction of living resources) which rarely occurs in UK waters, blasting where the majority of the information related to terrestrial quarrying, and waste gas and discharges where there is generally very little evidence with respect to the pathways by which these enter the marine environment. There was also limited evidence for newly emerging technologies such as carbon capture storage. There was a distinct lack of evidence with respect to the decommissioning phases of human activities. While it is possible to infer that the pressures associated with this phase will be similar to the construction phase of a human activity (or the reverse where a structure is removed) very little evidence was available to substantiate this relationship. It is also acknowledged that the pressures arising during these project phases could be different depending on the techniques used. Similarly it is recognised that the partial decommissioning of a project, or the removal of a structure, could result in more damage than leaving it in place. The lack of evidence for the decommissioning phase reflects the relatively small amount of predictive work or monitoring results that is typically associated with this aspect of proposed projects. The degree of confidence that could be assigned to the available evidence base was variable throughout the matrix. Throughout the development of the evidence base there was also a greater reliance on predictive modelling for a number of the sub-activity pressure relationships as opposed to post consent monitoring results. This was particularly true for the ‘other physical pressures’ and ‘hydrological changes’ pressure groups.
3.2 No Evidence In Relation to the Benchmark There were a number of sub-activity-pressure associations for which there was no available evidence in relation to the benchmark level of pressure. In a number of instances it was possible to attribute these apparent evidence gaps to the definitions of the benchmark. As described in Section 2.3.2 there were a number of instances, for example, where the evidence was not expressed in the same units as the benchmark. Where it was not appropriate to apply expert judgement to such evidence (e.g. where it was not in a format that was broadly equivalent) it could not be directly compared to the benchmark. In addition it was not possible to identify evidence for those benchmarks which are expressed in such a way that they require an understanding of the baseline environment (e.g. changes in WFD classification status) or have a receptor specific element. It was also difficult to determine cause and effect for a number of sub-activity-pressure relationships (e.g. the introduction of NIS and marine litter, see Section 2.2.1). In such instances it was equally difficult to relate the evidence to the respective benchmark.
R/4292/01 30 R.2435
Validating an Activity-Pressure Matrix
The gaps that have been identified within the evidence base for individual sub-activity-pressure relationships (see Section 3.1) equally reflect the presence of evidence gaps with respect to the benchmarks. Of those sub-activity pressure relationships where no benchmark has been set it does not necessarily translate that no evidence was available to underpin the understanding of the respective relationship. There is, for example, evidence with respect to visual disturbance from vessel movements and Non-synthetic compound contamination - Transition elements & organo-metals associated with the placement of structures and vessel movements. In this respect no particular evidence gaps have been identified where no benchmarks have been set.
3.3 High Pressure Significance The review of evidence in relation to the potential exceedance of a pre-defined benchmark has been consistently undertaken on a precautionary basis. As described in Section 2.3.2 the terminology used to define the benchmarks has resulted in a number of limitations and assumptions with respect to reviewing the available evidence for each sub-activity-pressure relationship in this context. For example, the definition of a number of the benchmarks implies that they will be exceeded as soon as the sub-activity-pressure relationship has been identified. A key example includes abrasion where the respective benchmarks are phrased in terms of any damage to seabed surface (or sub-surface) features. In this instance the potential exists to exceed the benchmark in every instance where there is an association between the sub-activity and this pressure. Additional pressures that were identified as having the potential to exceed the benchmark include underwater noise (e.g. through blasting, drilling, piling and acoustic devices), physical changes to another seabed type (e.g. through the placement of structures) and hydrological changes (particularly associated with renewable energy devices), removal of target species (e.g. via bait digging through recreational activities and extraction of living resources) and the potential introduction of contaminants/ pathogens (via sewage disposal). It is also noteworthy that the definitions of the benchmarks do not capture all of the pressures that are associated with a particular sub-activity. The potential significance of a sub-activity-pressure relationship is therefore potentially misrepresented by classifying it against the benchmark. Examples include the potential spread (as opposed to introduction) of NIS, the removal of target species (that are not specifically protected via environmental designations) through fishing; and the collision risk associated with above sea-surface structure such as wind turbines.
3.4 Screened Out When populating the sub-activity-pressure matrix it was possible to identify those sub-activity-pressure relationships that do not result in each of the pressures. This has been done at two levels, firstly where the sub-activity was not relevant to a particular activity and secondly where there was no potential for a pressure to result from a sub-activity (per human activity). This inevitably required an element of expert judgement based on the project team’s experience of working across multiple marine sectors. It was also possible to draw such conclusions based
R/4292/01 31 R.2435
Validating an Activity-Pressure Matrix
on a review of the available evidence associated with each type of human activity. In this respect the outputs of environmental assessments and sectoral reviews provided valuable sources of information. Those sub-activities that were not considered relevant to a particular activity were marked as ‘N/A’ and those sub-activities that did not result in a particular pressure were coloured green.
3.5 Prioritisation A review of the evidence gathered within the current project cannot be readily used to identify those sub-activity-pressure associations that may warrant further investigation. This is largely attributable to the way the benchmarks have been defined in that they do not fully reflect the magnitude and intensity of the pressures that could arise from a particular sub-activity. In addition there is a lack of equivalence between the different benchmarks that could usefully be standardised. An element of expert judgement has therefore been applied to suggest a number of sub-activity-pressure relationships where further research could add most to the evidence base. This has included consideration of those activities that at a high level are known to have the greatest potential to result in significant adverse effects (i.e. sub-activities that frequently require mitigation/ monitoring to manage potential environmental effects). In addition this has also considered where the frequency of occurrence of a particular sub-activity is likely to increase in the future or where technologies are still emerging. Those sub-activity pressure relationships which warrant particular attention therefore include: ▪ Mechanisms by which NIS are introduced and spread – where there are difficulties in
assigning a specific route of transfer and the risks of subsequent environmental effects are potentially large;
▪ Sources of underwater and aerial collision risk – where there is currently relatively limited data and the frequency of occurrence could be expected to increase; and
▪ Sources of underwater noise - where there is currently relatively limited data and the frequency of occurrence could be expected to increase.
These recommended areas for further work are in addition to the generic evidence gaps that were identified in Section 3.1 (no evidence). This project has not considered the potential sensitivity of the receiving environment to the pressures that arise from the respective sub-activities. However, it is generally acknowledged that the potential impacts associated with a number of human activities are not well understood. The potential impacts associated with abrasion from activities such as fishing, for example, are not well understood. This is reflected in a number of recent and ongoing research projects exploring this issue (e.g. eftec and ABPmer, 2014; MMO Project 1088 – Analysis of existing data to study the effects of towed fishing gears on mobile sediments against a background of natural variability; the National Federation of Fishermen's Organisations (NFFO) risk based assessments for fisheries in MPAs and the Association of Inshore Fisheries and Conservation Authorities (IFCAs) and MMO assessment of the impacts of fisheries on all designated features and habitats within European Marine Sites (EMSs) in England). The requirement for further research should therefore also be identified based on where there are
R/4292/01 32 R.2435
Validating an Activity-Pressure Matrix
gaps in the understanding of environmental effects from the point of sub-activity to the resulting pressures and the sensitivity of the receiving environment.
4. Summary and Recommendations This project has gathered a large volume of evidence to substantiate the JNCC activity-pressures matrix. This has included consideration of all of the sub-activities associated with each human activity that is defined within the matrix. The pressures that could potentially arise from each of the sub-activities have been documented along with any supporting evidence. Similarly the available evidence has been reviewed in the context of the level of contribution (in terms of extent and intensity) of each sub-activity to a given pressure and whether they meet a pre-defined benchmark. The degree of confidence in the available evidence based on the type, amount, quality and consistency of the evidence found has also been recorded. The work has been constrained by the list of human activities and pressures that were contained within the original matrix. Similarly the definitions of the benchmarks resulted in a number of limitations for determining the potential for a particular sub-activity to result in a pressure that exceeds the benchmark. These were retained within this project for consistency with ongoing project work being undertaken by the Statutory Nature Conservation Bodies (SNCBs). It is therefore recommended that the limitations that have been observed throughout this project are reviewed by the SNCBs in the further development of the activities-pressures work streams. Despite these limitations the evidence base provides a valuable resource of information that can be used to manage and monitor the marine environment. In this context the underlying evidence remains valid even where new benchmarks are created or existing ones are updated. When interpreting the evidence base it is important to recognise that the sub-activity relationships (particularly in relation to the benchmarks) do not take into consideration the frequency with which a particular pressure might arise. This can be highly variable, for example, at different times of the day, or throughout the year, and can be continuous or occasional. It will also be highly variable between activities and sub-activities where, for example, the laying of a cable within a particular location would be a relatively rare event, as compared to benthic trawling which could be continuous throughout the year. The matrix in its current form does not consider the likely persistence of a pressure (the length of time a pressure takes to dissipate i.e. cease to cause an impact after cessation of an activity). Similarly the evidence in its current format does not take in to consideration the range of spatial scales or footprint (regional, national, global) over which the pressure might be exerted. This will be very dependent on the specific project or activity that is being considered and will include consideration of natural variability. The sub-activity pressure relationships may also be influenced by wider physical, chemical and biological changes associated with climate change. A degree of expert judgment is therefore required when interpreting the evidence base for the management of potential impacts arising from human activities. It is recommended that the evidence base is further developed to incorporate these wider considerations. The outputs of the project could also be further improved through greater consideration of the potential sensitivity of a range of ecological features. This would mean tailoring the evidence
R/4292/01 33 R.2435
Validating an Activity-Pressure Matrix
base (and review against the benchmarks) for groups of habitats and species. While this was beyond the scope of the existing project it is recommended that the outputs of the literature review (as documented within the matrix) are used to inform future developments in this field. It is recognised, however, that this would be subject to further interpretation and expert judgement. More generally the evidence base has been recorded within two main spreadsheets. These have been completed according to a standardised set of headings which lend themselves to converting the matrix into a database. This would have the advantage of being readily searchable and accessible to a range of audiences. It would also be possible to continue to update the evidence base as new information becomes available. The frequency with which this is undertaken would be very much dependent on the availability of new information sources. A number of initiatives are already ongoing to ensure that impact verification or post consent monitoring data are made publically available (e.g. The Crown Estate’s online Marine Data Exchange (MDE), which provides access to survey data and reports collated during the planning, building and operating of offshore renewable energy and reports such as those commissioned by Renewables UK (2011) and the MMO (2014)). Whilst it is recognised that there are resource requirements associated with the collation of such data, including the dissemination of any lessons learnt, these provide a valuable resource to further define such an evidence base. The greater volumes of data also help to improve the confidence in the available evidence base. It is recommended that that the evidence base that has been collated as part of this project is maintained. The matrix, once translated into a database and disseminated, has the potential to provide a standardised set of information that can be used to inform the management and monitoring of the marine environment. In addition this will serve to improve the auditability of the decision making process across all marine sectors.
5. References Boteler, B., Lago, M., Piet, G.J. & Van Der Wal, J.T. (2013). EEA activity: Task 1.5.2.c Maritime activities, ETC/ICM task Milestone 2: Development of analytical framework of maritime sectors. [Paper is subject to ongoing review]. Eftec and ABPmer. (2014). ABValuing the UK Marine Environment – an Exploratory Study of Benthic Ecosystem Services. Report for Defra. Environment Agency. (2014). Risk Assessment Method: Risk assessment to determine the likelihood of river, transitional (estuaries) and coastal waters failing to achieve the Water Framework Directive objective of Good status post 2015 due to designated chemicals. JNCC. (2013). Evidence Quality Assurance Policy. http://jncc.defra.gov.uk/pdf/comm13P15.pdf
R/4292/01 34 R.2435
Validating an Activity-Pressure Matrix
Mastrandrea, M.D., C.B. Field, T.F. Stocker, O. Edenhofer, K.L. Ebi, D.J. Frame, H. Held, E. Kriegler, K.J. Mach, P.R. Matschoss, G.-K. Plattner, G.W. Yohe, and F.W. Zwiers. (2010). Guidance Note for Lead Authors of the IPCC Fifth Assessment Report on Consistent Treatment of Uncertainties. Intergovernmental Panel on Climate Change (IPCC). Available at http://www.ipcc.ch/pdf/supporting-material/uncertainty-guidance-note.pdf MARINE MANAGEMENT ORGANISATION. (2014) Review of environmental data associated with post consent monitoring of licence conditions of offshore wind farms. MMO Project No: 1031. RENEWABLEUK. (2011). Consenting Lessons Learned. An offshore wind industry review of past concerns, lessons learned and future challenges. Tillin, H.M., Hull, S.C., Tyler-Walters, H. (2010). Development of a Sensitivity Matrix (pressures-MCZ/MPA features). Report to the Department of Environment, Food and Rural Affairs from ABP Marine Environmental Research Ltd, Southampton and the Marine Life Information Network (MarLIN) Plymouth: Marine Biological Association of the UK. .Defra Contract No. MB0102 Task 3A, Report No. 22. http://randd.defra.gov.uk/Document.aspx?Document=MB0102_9721_TRP.pdf
R/4292/01 35 R.2435
Appendices
Appendix A Activities-Pressure Matrix
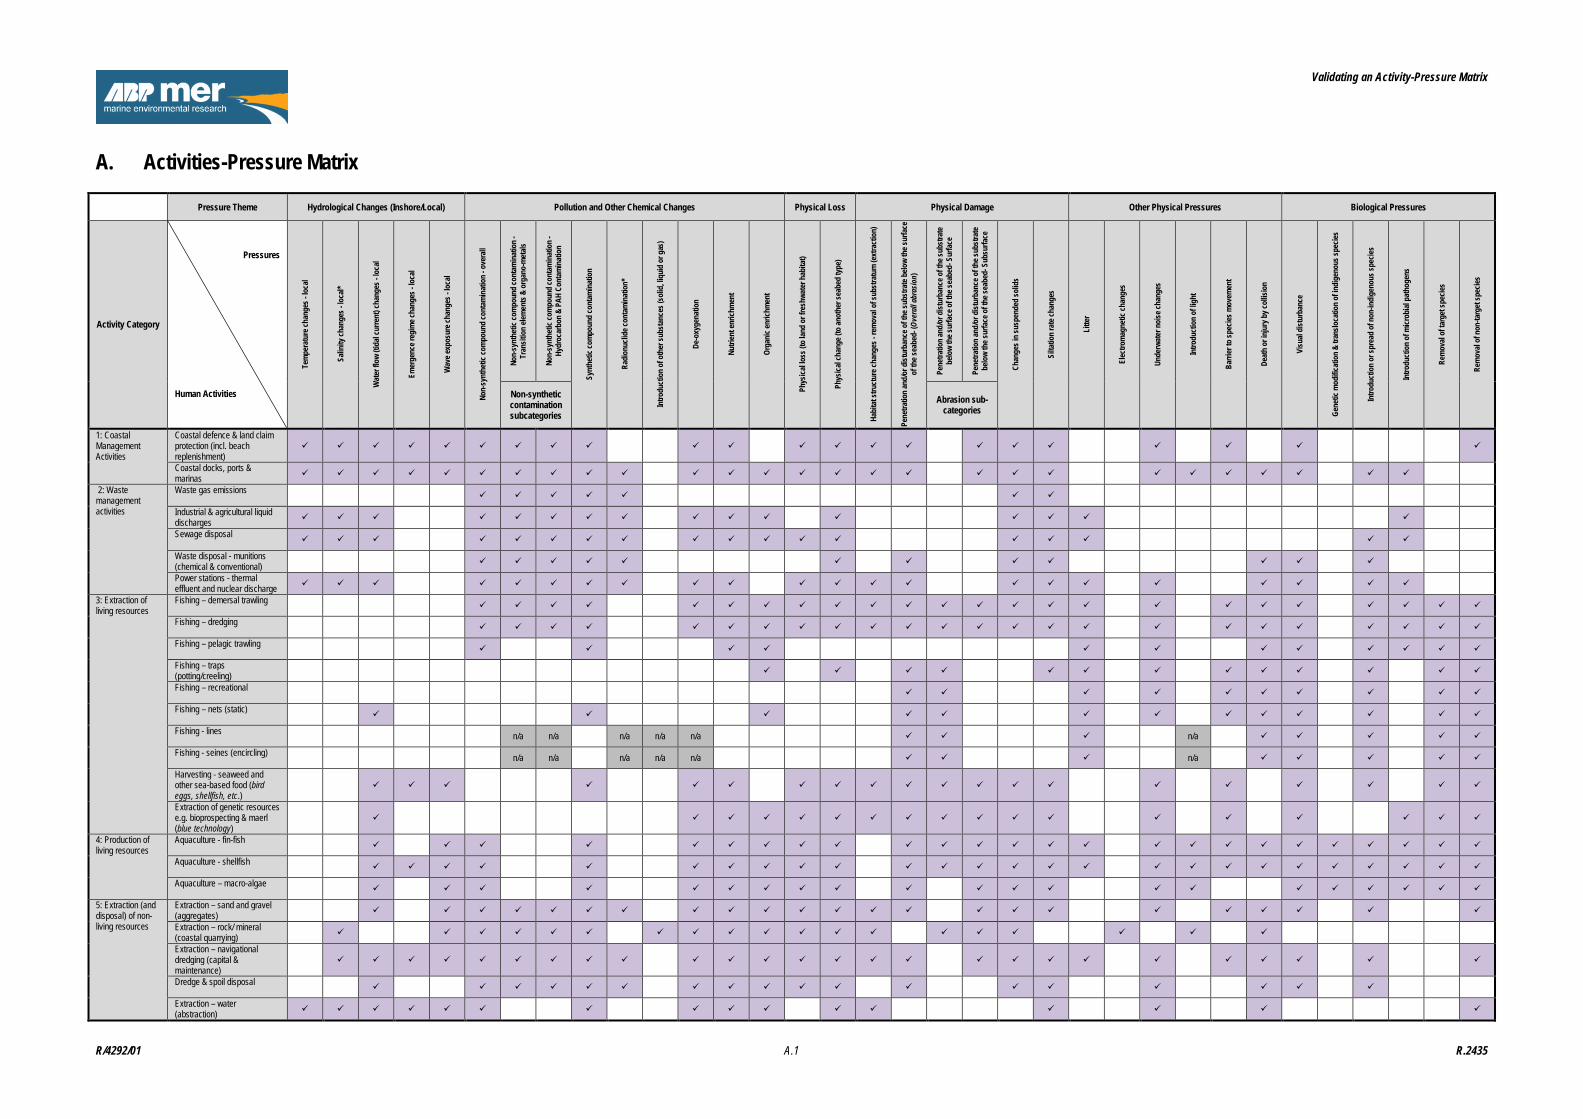
Validating an Activity-Pressure Matrix
A. Activities-Pressure Matrix
Pressure Theme Hydrological Changes (Inshore/Local) Pollution and Other Chemical Changes Physical Loss Physical Damage Other Physical Pressures Biological Pressures
Activity Category
Pressures
Human Activities
Tem
pera
ture
chan
ges -
loca
l
Salin
ity ch
ange
s - lo
cal*
Wat
er fl
ow (t
idal
curre
nt) c
hang
es -
loca
l
Emer
genc
e reg
ime c
hang
es -
loca
l
Wav
e exp
osur
e cha
nges
- lo
cal
Non-
synt
hetic
com
poun
d co
ntam
inat
ion
- ove
rall
Non-
synt
hetic
com
poun
d co
ntam
inat
ion
- Tr
ansit
ion
elem
ents
& o
rgan
o-m
etals
Non-
synt
hetic
com
poun
d co
ntam
inat
ion
- Hy
droc
arbo
n &
PAH
Cont
amin
atio
n
Synt
hetic
com
poun
d co
ntam
inat
ion
Radi
onuc
lide c
onta
min
atio
n*
Intro
duct
ion
of o
ther
subs
tanc
es (s
olid
, liqu
id o
r gas
)
De-o
xyge
natio
n
Nutri
ent e
nrich
men
t
Orga
nic e
nrich
men
t
Phys
ical lo
ss (t
o lan
d or
fres
hwat
er h
abita
t)
Phys
ical c
hang
e (to
anot
her s
eabe
d ty
pe)
Habi
tat s
truct
ure c
hang
es -
rem
oval
of su
bstra
tum
(ext
ract
ion)
Pene
tratio
n an
d/or
dist
urba
nce o
f the
subs
trate
belo
w th
e sur
face
of
the s
eabe
d- (O
vera
ll abr
asio
n)
Pene
tratio
n an
d/or
dist
urba
nce o
f the
subs
trate
be
low
the s
urfa
ce o
f the
seab
ed- S
urfa
ce
Pene
tratio
n an
d/or
dist
urba
nce o
f the
subs
trate
be
low
the s
urfa
ce o
f the
seab
ed- S
ubsu
rface
Chan
ges i
n su
spen
ded
solid
s
Silta
tion
rate
chan
ges
Litte
r
Elec
trom
agne
tic ch
ange
s
Unde
rwat
er n
oise
chan
ges
Intro
duct
ion
of lig
ht
Barri
er to
spec
ies m
ovem
ent
Deat
h or
inju
ry b
y col
lisio
n
Visu
al di
stur
banc
e
Gene
tic m
odifi
catio
n &
trans
loca
tion
of in
dige
nous
spec
ies
Intro
duct
ion
or sp
read
of n
on-in
dige
nous
spec
ies
Intro
duct
ion
of m
icrob
ial p
atho
gens
Rem
oval
of ta
rget
spec
ies
Rem
oval
of n
on-ta
rget
spec
ies
Non-synthetic contamination subcategories
Abrasion sub-categories
1: Coastal Management Activities
Coastal defence & land claim protection (incl. beach replenishment)
Coastal docks, ports & marinas
2: Waste management activities
Waste gas emissions
Industrial & agricultural liquid discharges Sewage disposal
Waste disposal - munitions (chemical & conventional) Power stations - thermal effluent and nuclear discharge
3: Extraction of living resources
Fishing – demersal trawling
Fishing – dredging
Fishing – pelagic trawling
Fishing – traps (potting/creeling)
Fishing – recreational
Fishing – nets (static)
Fishing - lines n/a n/a n/a n/a n/a n/a
Fishing - seines (encircling) n/a n/a n/a n/a n/a n/a
Harvesting - seaweed and other sea-based food (bird eggs, shellfish, etc.)
Extraction of genetic resources e.g. bioprospecting & maerl (blue technology)
4: Production of living resources
Aquaculture - fin-fish
Aquaculture - shellfish
Aquaculture – macro-algae
5: Extraction (and disposal) of non-living resources
Extraction – sand and gravel (aggregates)
Extraction – rock/ mineral (coastal quarrying) Extraction – navigational dredging (capital & maintenance)
Dredge & spoil disposal
Extraction – water (abstraction)
R/4292/01 A.1 R.2435
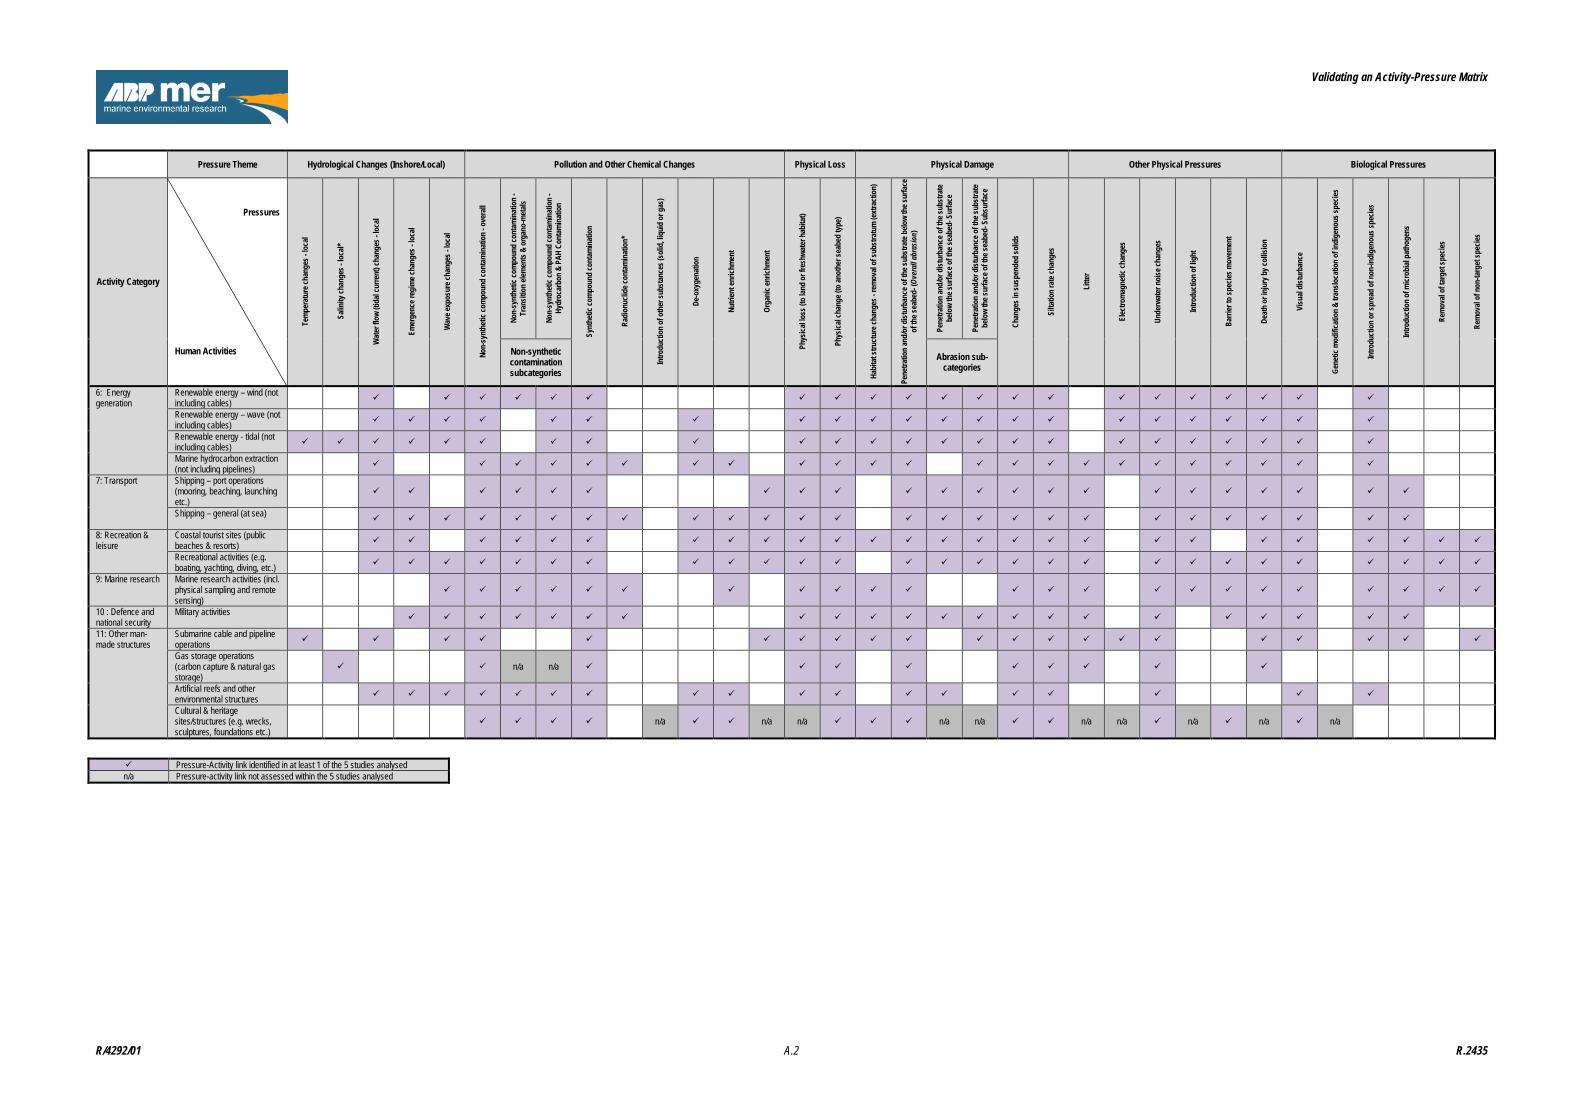
Validating an Activity-Pressure Matrix
Pressure Theme Hydrological Changes (Inshore/Local) Pollution and Other Chemical Changes Physical Loss Physical Damage Other Physical Pressures Biological Pressures
Activity Category
Pressures
Human Activities
Tem
pera
ture
chan
ges -
loca
l
Salin
ity ch
ange
s - lo
cal*
Wat
er fl
ow (t
idal
curre
nt) c
hang
es -
loca
l
Emer
genc
e reg
ime c
hang
es -
loca
l
Wav
e exp
osur
e cha
nges
- lo
cal
Non-
synt
hetic
com
poun
d co
ntam
inat
ion
- ove
rall
Non-
synt
hetic
com
poun
d co
ntam
inat
ion
- Tr
ansit
ion
elem
ents
& o
rgan
o-m
etals
Non-
synt
hetic
com
poun
d co
ntam
inat
ion
- Hy
droc
arbo
n &
PAH
Cont
amin
atio
n
Synt
hetic
com
poun
d co
ntam
inat
ion
Radi
onuc
lide c
onta
min
atio
n*
Intro
duct
ion
of o
ther
subs
tanc
es (s
olid
, liqu
id o
r gas
)
De-o
xyge
natio
n
Nutri
ent e
nrich
men
t
Orga
nic e
nrich
men
t
Phys
ical lo
ss (t
o lan
d or
fres
hwat
er h
abita
t)
Phys
ical c
hang
e (to
anot
her s
eabe
d ty
pe)
Habi
tat s
truct
ure c
hang
es -
rem
oval
of su
bstra
tum
(ext
ract
ion)
Pene
tratio
n an
d/or
dist
urba
nce o
f the
subs
trate
belo
w th
e sur
face
of
the s
eabe
d- (O
vera
ll abr
asio
n)
Pene
tratio
n an
d/or
dist
urba
nce o
f the
subs
trate
be
low
the s
urfa
ce o
f the
seab
ed- S
urfa
ce
Pene
tratio
n an
d/or
dist
urba
nce o
f the
subs
trate
be
low
the s
urfa
ce o
f the
seab
ed- S
ubsu
rface
Chan
ges i
n su
spen
ded
solid
s
Silta
tion
rate
chan
ges
Litte
r
Elec
trom
agne
tic ch
ange
s
Unde
rwat
er n
oise
chan
ges
Intro
duct
ion
of lig
ht
Barri
er to
spec
ies m
ovem
ent
Deat
h or
inju
ry b
y col
lisio
n
Visu
al di
stur
banc
e
Gene
tic m
odifi
catio
n &
trans
loca
tion
of in
dige
nous
spec
ies
Intro
duct
ion
or sp
read
of n
on-in
dige
nous
spec
ies
Intro
duct
ion
of m
icrob
ial p
atho
gens
Rem
oval
of ta
rget
spec
ies
Rem
oval
of n
on-ta
rget
spec
ies
Non-synthetic contamination subcategories
Abrasion sub-categories
6: Energy generation
Renewable energy – wind (not including cables) Renewable energy – wave (not including cables) Renewable energy - tidal (not including cables) Marine hydrocarbon extraction (not including pipelines)
7: Transport Shipping – port operations (mooring, beaching, launching etc.)
Shipping – general (at sea)
8: Recreation & leisure
Coastal tourist sites (public beaches & resorts)
Recreational activities (e.g. boating, yachting, diving, etc.)
9: Marine research Marine research activities (incl. physical sampling and remote sensing)
10 : Defence and national security
Military activities
11: Other man-made structures
Submarine cable and pipeline operations
Gas storage operations (carbon capture & natural gas storage) n/a n/a
Artificial reefs and other environmental structures Cultural & heritage sites/structures (e.g. wrecks, sculptures, foundations etc.) n/a n/a n/a n/a n/a n/a n/a n/a n/a n/a
Pressure-Activity link identified in at least 1 of the 5 studies analysed n/a Pressure-activity link not assessed within the 5 studies analysed
R/4292/01 A.2 R.2435
Appendix B Pressure and Benchmark Definitions
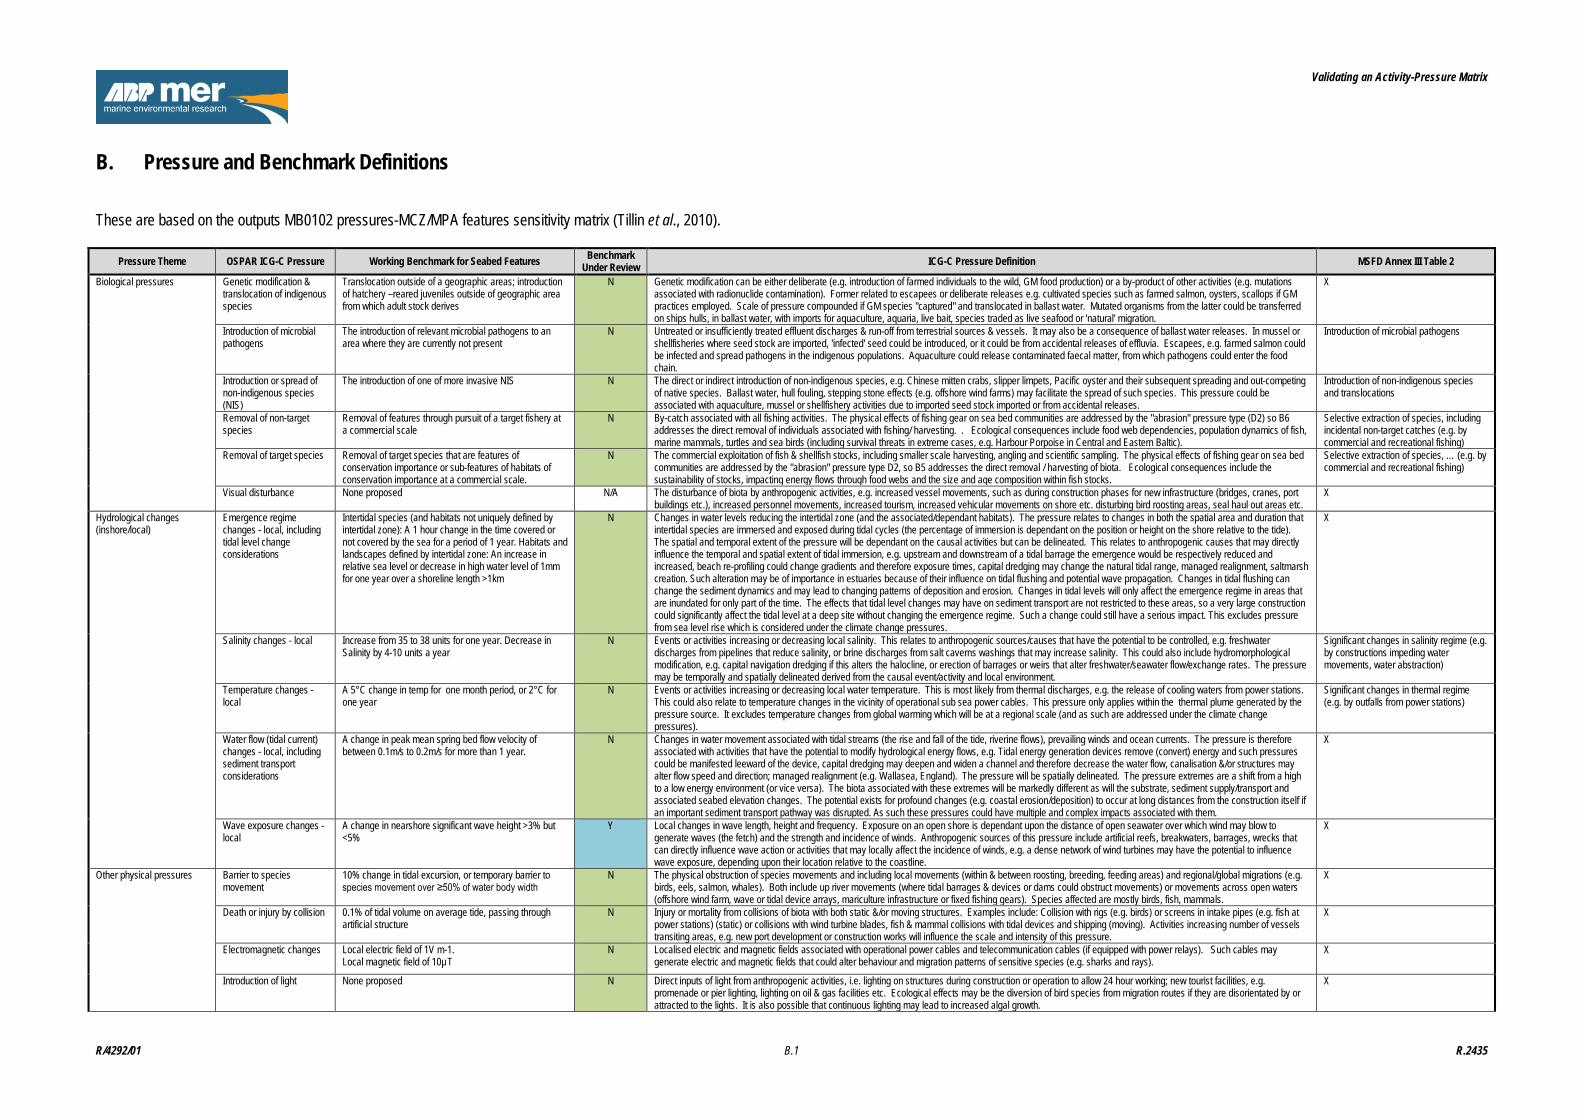
Validating an Activity-Pressure Matrix
B. Pressure and Benchmark Definitions These are based on the outputs MB0102 pressures-MCZ/MPA features sensitivity matrix (Tillin et al., 2010).
Pressure Theme OSPAR ICG-C Pressure Working Benchmark for Seabed Features Benchmark Under Review ICG-C Pressure Definition MSFD Annex III Table 2
Biological pressures Genetic modification & translocation of indigenous species
Translocation outside of a geographic areas; introduction of hatchery –reared juveniles outside of geographic area from which adult stock derives
N Genetic modification can be either deliberate (e.g. introduction of farmed individuals to the wild, GM food production) or a by-product of other activities (e.g. mutations associated with radionuclide contamination). Former related to escapees or deliberate releases e.g. cultivated species such as farmed salmon, oysters, scallops if GM practices employed. Scale of pressure compounded if GM species "captured" and translocated in ballast water. Mutated organisms from the latter could be transferred on ships hulls, in ballast water, with imports for aquaculture, aquaria, live bait, species traded as live seafood or 'natural' migration.
X
Introduction of microbial pathogens
The introduction of relevant microbial pathogens to an area where they are currently not present
N Untreated or insufficiently treated effluent discharges & run-off from terrestrial sources & vessels. It may also be a consequence of ballast water releases. In mussel or shellfisheries where seed stock are imported, 'infected' seed could be introduced, or it could be from accidental releases of effluvia. Escapees, e.g. farmed salmon could be infected and spread pathogens in the indigenous populations. Aquaculture could release contaminated faecal matter, from which pathogens could enter the food chain.
Introduction of microbial pathogens
Introduction or spread of non-indigenous species (NIS)
The introduction of one of more invasive NIS N The direct or indirect introduction of non-indigenous species, e.g. Chinese mitten crabs, slipper limpets, Pacific oyster and their subsequent spreading and out-competing of native species. Ballast water, hull fouling, stepping stone effects (e.g. offshore wind farms) may facilitate the spread of such species. This pressure could be associated with aquaculture, mussel or shellfishery activities due to imported seed stock imported or from accidental releases.
Introduction of non-indigenous species and translocations
Removal of non-target species
Removal of features through pursuit of a target fishery at a commercial scale
N By-catch associated with all fishing activities. The physical effects of fishing gear on sea bed communities are addressed by the "abrasion" pressure type (D2) so B6 addresses the direct removal of individuals associated with fishing/ harvesting. . Ecological consequences include food web dependencies, population dynamics of fish, marine mammals, turtles and sea birds (including survival threats in extreme cases, e.g. Harbour Porpoise in Central and Eastern Baltic).
Selective extraction of species, including incidental non-target catches (e.g. by commercial and recreational fishing)
Removal of target species Removal of target species that are features of conservation importance or sub-features of habitats of conservation importance at a commercial scale.
N The commercial exploitation of fish & shellfish stocks, including smaller scale harvesting, angling and scientific sampling. The physical effects of fishing gear on sea bed communities are addressed by the "abrasion" pressure type D2, so B5 addresses the direct removal / harvesting of biota. Ecological consequences include the sustainability of stocks, impacting energy flows through food webs and the size and age composition within fish stocks.
Selective extraction of species, … (e.g. by commercial and recreational fishing)
Visual disturbance None proposed N/A The disturbance of biota by anthropogenic activities, e.g. increased vessel movements, such as during construction phases for new infrastructure (bridges, cranes, port buildings etc.), increased personnel movements, increased tourism, increased vehicular movements on shore etc. disturbing bird roosting areas, seal haul out areas etc.
X
Hydrological changes (inshore/local)
Emergence regime changes - local, including tidal level change considerations
Intertidal species (and habitats not uniquely defined by intertidal zone): A 1 hour change in the time covered or not covered by the sea for a period of 1 year. Habitats and landscapes defined by intertidal zone: An increase in relative sea level or decrease in high water level of 1mm for one year over a shoreline length >1km
N Changes in water levels reducing the intertidal zone (and the associated/dependant habitats). The pressure relates to changes in both the spatial area and duration that intertidal species are immersed and exposed during tidal cycles (the percentage of immersion is dependant on the position or height on the shore relative to the tide). The spatial and temporal extent of the pressure will be dependant on the causal activities but can be delineated. This relates to anthropogenic causes that may directly influence the temporal and spatial extent of tidal immersion, e.g. upstream and downstream of a tidal barrage the emergence would be respectively reduced and increased, beach re-profiling could change gradients and therefore exposure times, capital dredging may change the natural tidal range, managed realignment, saltmarsh creation. Such alteration may be of importance in estuaries because of their influence on tidal flushing and potential wave propagation. Changes in tidal flushing can change the sediment dynamics and may lead to changing patterns of deposition and erosion. Changes in tidal levels will only affect the emergence regime in areas that are inundated for only part of the time. The effects that tidal level changes may have on sediment transport are not restricted to these areas, so a very large construction could significantly affect the tidal level at a deep site without changing the emergence regime. Such a change could still have a serious impact. This excludes pressure from sea level rise which is considered under the climate change pressures.
X
Salinity changes - local Increase from 35 to 38 units for one year. Decrease in Salinity by 4-10 units a year
N Events or activities increasing or decreasing local salinity. This relates to anthropogenic sources/causes that have the potential to be controlled, e.g. freshwater discharges from pipelines that reduce salinity, or brine discharges from salt caverns washings that may increase salinity. This could also include hydromorphological modification, e.g. capital navigation dredging if this alters the halocline, or erection of barrages or weirs that alter freshwater/seawater flow/exchange rates. The pressure may be temporally and spatially delineated derived from the causal event/activity and local environment.
Significant changes in salinity regime (e.g. by constructions impeding water movements, water abstraction)
Temperature changes - local
A 5°C change in temp for one month period, or 2°C for one year
N Events or activities increasing or decreasing local water temperature. This is most likely from thermal discharges, e.g. the release of cooling waters from power stations. This could also relate to temperature changes in the vicinity of operational sub sea power cables. This pressure only applies within the thermal plume generated by the pressure source. It excludes temperature changes from global warming which will be at a regional scale (and as such are addressed under the climate change pressures).
Significant changes in thermal regime (e.g. by outfalls from power stations)
Water flow (tidal current) changes - local, including sediment transport considerations
A change in peak mean spring bed flow velocity of between 0.1m/s to 0.2m/s for more than 1 year.
N Changes in water movement associated with tidal streams (the rise and fall of the tide, riverine flows), prevailing winds and ocean currents. The pressure is therefore associated with activities that have the potential to modify hydrological energy flows, e.g. Tidal energy generation devices remove (convert) energy and such pressures could be manifested leeward of the device, capital dredging may deepen and widen a channel and therefore decrease the water flow, canalisation &/or structures may alter flow speed and direction; managed realignment (e.g. Wallasea, England). The pressure will be spatially delineated. The pressure extremes are a shift from a high to a low energy environment (or vice versa). The biota associated with these extremes will be markedly different as will the substrate, sediment supply/transport and associated seabed elevation changes. The potential exists for profound changes (e.g. coastal erosion/deposition) to occur at long distances from the construction itself if an important sediment transport pathway was disrupted. As such these pressures could have multiple and complex impacts associated with them.
X
Wave exposure changes - local
A change in nearshore significant wave height >3% but <5%
Y Local changes in wave length, height and frequency. Exposure on an open shore is dependant upon the distance of open seawater over which wind may blow to generate waves (the fetch) and the strength and incidence of winds. Anthropogenic sources of this pressure include artificial reefs, breakwaters, barrages, wrecks that can directly influence wave action or activities that may locally affect the incidence of winds, e.g. a dense network of wind turbines may have the potential to influence wave exposure, depending upon their location relative to the coastline.
X
Other physical pressures Barrier to species movement
10% change in tidal excursion, or temporary barrier to species movement over ≥50% of water body width
N The physical obstruction of species movements and including local movements (within & between roosting, breeding, feeding areas) and regional/global migrations (e.g. birds, eels, salmon, whales). Both include up river movements (where tidal barrages & devices or dams could obstruct movements) or movements across open waters (offshore wind farm, wave or tidal device arrays, mariculture infrastructure or fixed fishing gears). Species affected are mostly birds, fish, mammals.
X
Death or injury by collision 0.1% of tidal volume on average tide, passing through artificial structure
N Injury or mortality from collisions of biota with both static &/or moving structures. Examples include: Collision with rigs (e.g. birds) or screens in intake pipes (e.g. fish at power stations) (static) or collisions with wind turbine blades, fish & mammal collisions with tidal devices and shipping (moving). Activities increasing number of vessels transiting areas, e.g. new port development or construction works will influence the scale and intensity of this pressure.
X
Electromagnetic changes Local electric field of 1V m-1. Local magnetic field of 10µT
N Localised electric and magnetic fields associated with operational power cables and telecommunication cables (if equipped with power relays). Such cables may generate electric and magnetic fields that could alter behaviour and migration patterns of sensitive species (e.g. sharks and rays).
X
Introduction of light None proposed N Direct inputs of light from anthropogenic activities, i.e. lighting on structures during construction or operation to allow 24 hour working; new tourist facilities, e.g. promenade or pier lighting, lighting on oil & gas facilities etc. Ecological effects may be the diversion of bird species from migration routes if they are disorientated by or attracted to the lights. It is also possible that continuous lighting may lead to increased algal growth.
X
R/4292/01 B.1 R.2435
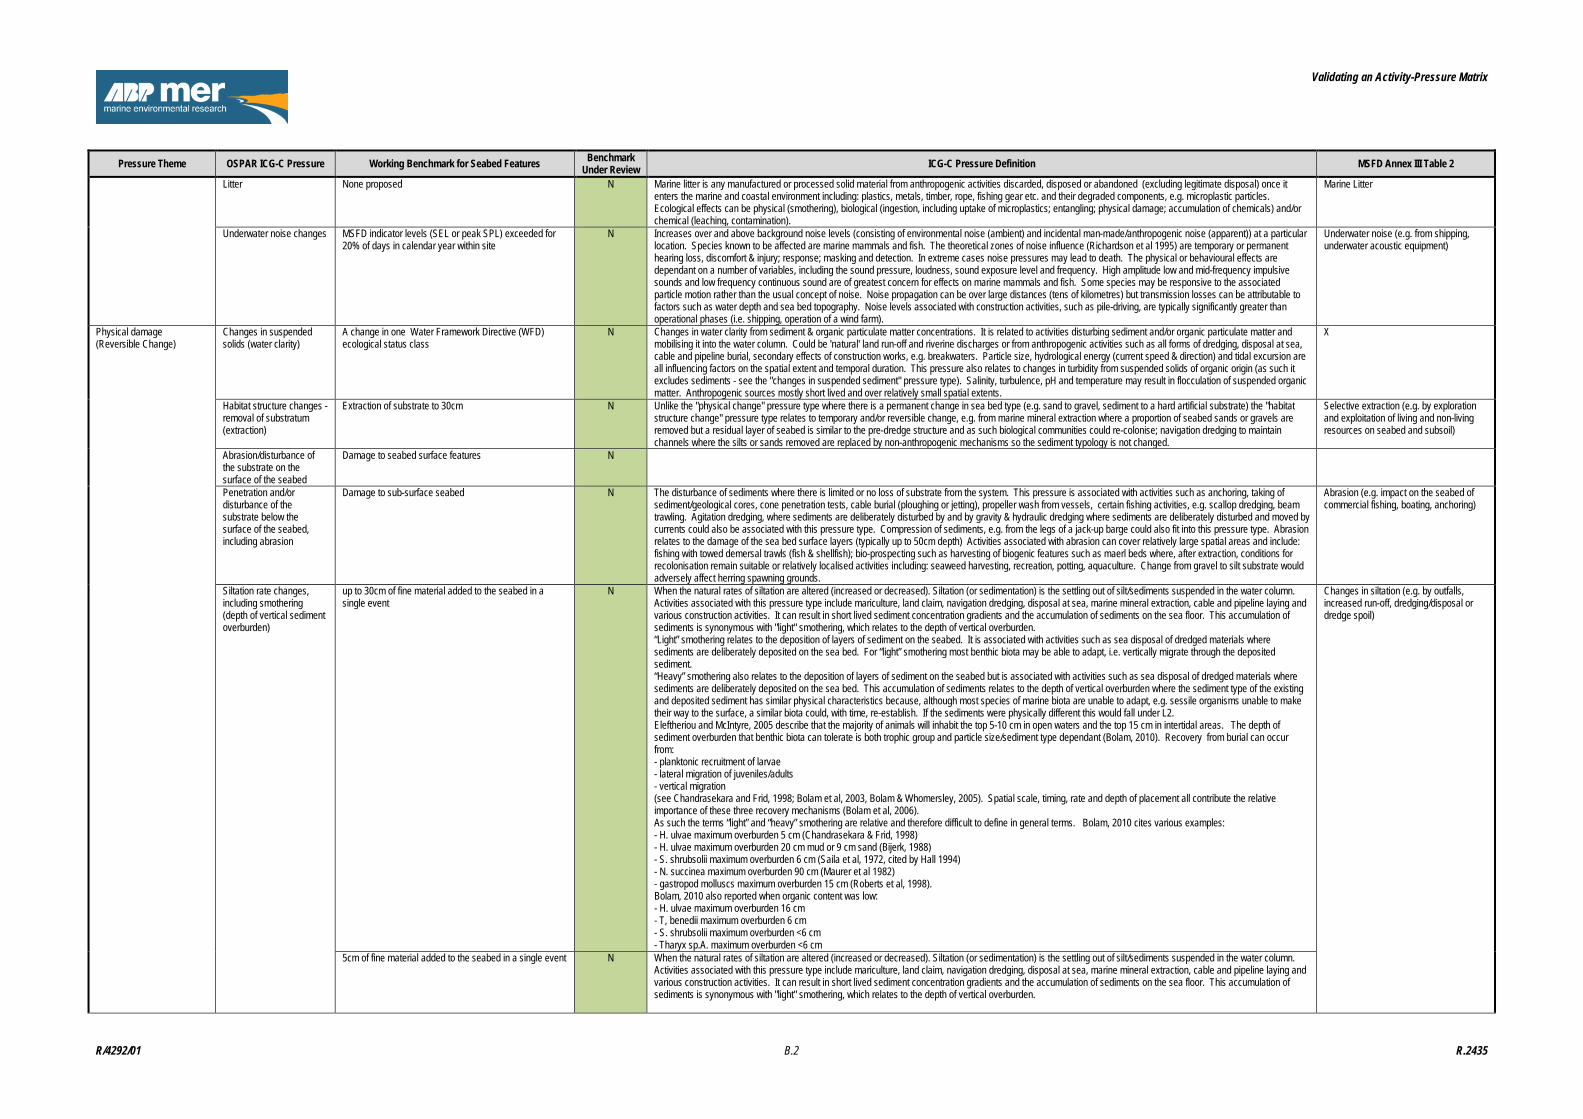
Validating an Activity-Pressure Matrix
Pressure Theme OSPAR ICG-C Pressure Working Benchmark for Seabed Features Benchmark Under Review ICG-C Pressure Definition MSFD Annex III Table 2
Litter None proposed N Marine litter is any manufactured or processed solid material from anthropogenic activities discarded, disposed or abandoned (excluding legitimate disposal) once it enters the marine and coastal environment including: plastics, metals, timber, rope, fishing gear etc. and their degraded components, e.g. microplastic particles. Ecological effects can be physical (smothering), biological (ingestion, including uptake of microplastics; entangling; physical damage; accumulation of chemicals) and/or chemical (leaching, contamination).
Marine Litter
Underwater noise changes MSFD indicator levels (SEL or peak SPL) exceeded for 20% of days in calendar year within site
N Increases over and above background noise levels (consisting of environmental noise (ambient) and incidental man-made/anthropogenic noise (apparent)) at a particular location. Species known to be affected are marine mammals and fish. The theoretical zones of noise influence (Richardson et al 1995) are temporary or permanent hearing loss, discomfort & injury; response; masking and detection. In extreme cases noise pressures may lead to death. The physical or behavioural effects are dependant on a number of variables, including the sound pressure, loudness, sound exposure level and frequency. High amplitude low and mid-frequency impulsive sounds and low frequency continuous sound are of greatest concern for effects on marine mammals and fish. Some species may be responsive to the associated particle motion rather than the usual concept of noise. Noise propagation can be over large distances (tens of kilometres) but transmission losses can be attributable to factors such as water depth and sea bed topography. Noise levels associated with construction activities, such as pile-driving, are typically significantly greater than operational phases (i.e. shipping, operation of a wind farm).
Underwater noise (e.g. from shipping, underwater acoustic equipment)
Physical damage (Reversible Change)
Changes in suspended solids (water clarity)
A change in one Water Framework Directive (WFD) ecological status class
N Changes in water clarity from sediment & organic particulate matter concentrations. It is related to activities disturbing sediment and/or organic particulate matter and mobilising it into the water column. Could be 'natural' land run-off and riverine discharges or from anthropogenic activities such as all forms of dredging, disposal at sea, cable and pipeline burial, secondary effects of construction works, e.g. breakwaters. Particle size, hydrological energy (current speed & direction) and tidal excursion are all influencing factors on the spatial extent and temporal duration. This pressure also relates to changes in turbidity from suspended solids of organic origin (as such it excludes sediments - see the "changes in suspended sediment" pressure type). Salinity, turbulence, pH and temperature may result in flocculation of suspended organic matter. Anthropogenic sources mostly short lived and over relatively small spatial extents.
X
Habitat structure changes - removal of substratum (extraction)
Extraction of substrate to 30cm N Unlike the "physical change" pressure type where there is a permanent change in sea bed type (e.g. sand to gravel, sediment to a hard artificial substrate) the "habitat structure change" pressure type relates to temporary and/or reversible change, e.g. from marine mineral extraction where a proportion of seabed sands or gravels are removed but a residual layer of seabed is similar to the pre-dredge structure and as such biological communities could re-colonise; navigation dredging to maintain channels where the silts or sands removed are replaced by non-anthropogenic mechanisms so the sediment typology is not changed.
Selective extraction (e.g. by exploration and exploitation of living and non-living resources on seabed and subsoil)
Abrasion/disturbance of the substrate on the surface of the seabed
Damage to seabed surface features N
Penetration and/or disturbance of the substrate below the surface of the seabed, including abrasion
Damage to sub-surface seabed N The disturbance of sediments where there is limited or no loss of substrate from the system. This pressure is associated with activities such as anchoring, taking of sediment/geological cores, cone penetration tests, cable burial (ploughing or jetting), propeller wash from vessels, certain fishing activities, e.g. scallop dredging, beam trawling. Agitation dredging, where sediments are deliberately disturbed by and by gravity & hydraulic dredging where sediments are deliberately disturbed and moved by currents could also be associated with this pressure type. Compression of sediments, e.g. from the legs of a jack-up barge could also fit into this pressure type. Abrasion relates to the damage of the sea bed surface layers (typically up to 50cm depth) Activities associated with abrasion can cover relatively large spatial areas and include: fishing with towed demersal trawls (fish & shellfish); bio-prospecting such as harvesting of biogenic features such as maerl beds where, after extraction, conditions for recolonisation remain suitable or relatively localised activities including: seaweed harvesting, recreation, potting, aquaculture. Change from gravel to silt substrate would adversely affect herring spawning grounds.
Abrasion (e.g. impact on the seabed of commercial fishing, boating, anchoring)
Siltation rate changes, including smothering (depth of vertical sediment overburden)
up to 30cm of fine material added to the seabed in a single event
N When the natural rates of siltation are altered (increased or decreased). Siltation (or sedimentation) is the settling out of silt/sediments suspended in the water column. Activities associated with this pressure type include mariculture, land claim, navigation dredging, disposal at sea, marine mineral extraction, cable and pipeline laying and various construction activities. It can result in short lived sediment concentration gradients and the accumulation of sediments on the sea floor. This accumulation of sediments is synonymous with "light" smothering, which relates to the depth of vertical overburden. “Light” smothering relates to the deposition of layers of sediment on the seabed. It is associated with activities such as sea disposal of dredged materials where sediments are deliberately deposited on the sea bed. For “light” smothering most benthic biota may be able to adapt, i.e. vertically migrate through the deposited sediment. “Heavy” smothering also relates to the deposition of layers of sediment on the seabed but is associated with activities such as sea disposal of dredged materials where sediments are deliberately deposited on the sea bed. This accumulation of sediments relates to the depth of vertical overburden where the sediment type of the existing and deposited sediment has similar physical characteristics because, although most species of marine biota are unable to adapt, e.g. sessile organisms unable to make their way to the surface, a similar biota could, with time, re-establish. If the sediments were physically different this would fall under L2. Eleftheriou and McIntyre, 2005 describe that the majority of animals will inhabit the top 5-10 cm in open waters and the top 15 cm in intertidal areas. The depth of sediment overburden that benthic biota can tolerate is both trophic group and particle size/sediment type dependant (Bolam, 2010). Recovery from burial can occur from: - planktonic recruitment of larvae - lateral migration of juveniles/adults - vertical migration (see Chandrasekara and Frid, 1998; Bolam et al, 2003, Bolam & Whomersley, 2005). Spatial scale, timing, rate and depth of placement all contribute the relative importance of these three recovery mechanisms (Bolam et al, 2006). As such the terms “light” and “heavy” smothering are relative and therefore difficult to define in general terms. Bolam, 2010 cites various examples: - H. ulvae maximum overburden 5 cm (Chandrasekara & Frid, 1998) - H. ulvae maximum overburden 20 cm mud or 9 cm sand (Bijerk, 1988) - S. shrubsolii maximum overburden 6 cm (Saila et al, 1972, cited by Hall 1994) - N. succinea maximum overburden 90 cm (Maurer et al 1982) - gastropod molluscs maximum overburden 15 cm (Roberts et al, 1998). Bolam, 2010 also reported when organic content was low: - H. ulvae maximum overburden 16 cm - T, benedii maximum overburden 6 cm - S. shrubsolii maximum overburden <6 cm - Tharyx sp.A. maximum overburden <6 cm
Changes in siltation (e.g. by outfalls, increased run-off, dredging/disposal or dredge spoil)
5cm of fine material added to the seabed in a single event N When the natural rates of siltation are altered (increased or decreased). Siltation (or sedimentation) is the settling out of silt/sediments suspended in the water column. Activities associated with this pressure type include mariculture, land claim, navigation dredging, disposal at sea, marine mineral extraction, cable and pipeline laying and various construction activities. It can result in short lived sediment concentration gradients and the accumulation of sediments on the sea floor. This accumulation of sediments is synonymous with "light" smothering, which relates to the depth of vertical overburden.
R/4292/01 B.2 R.2435
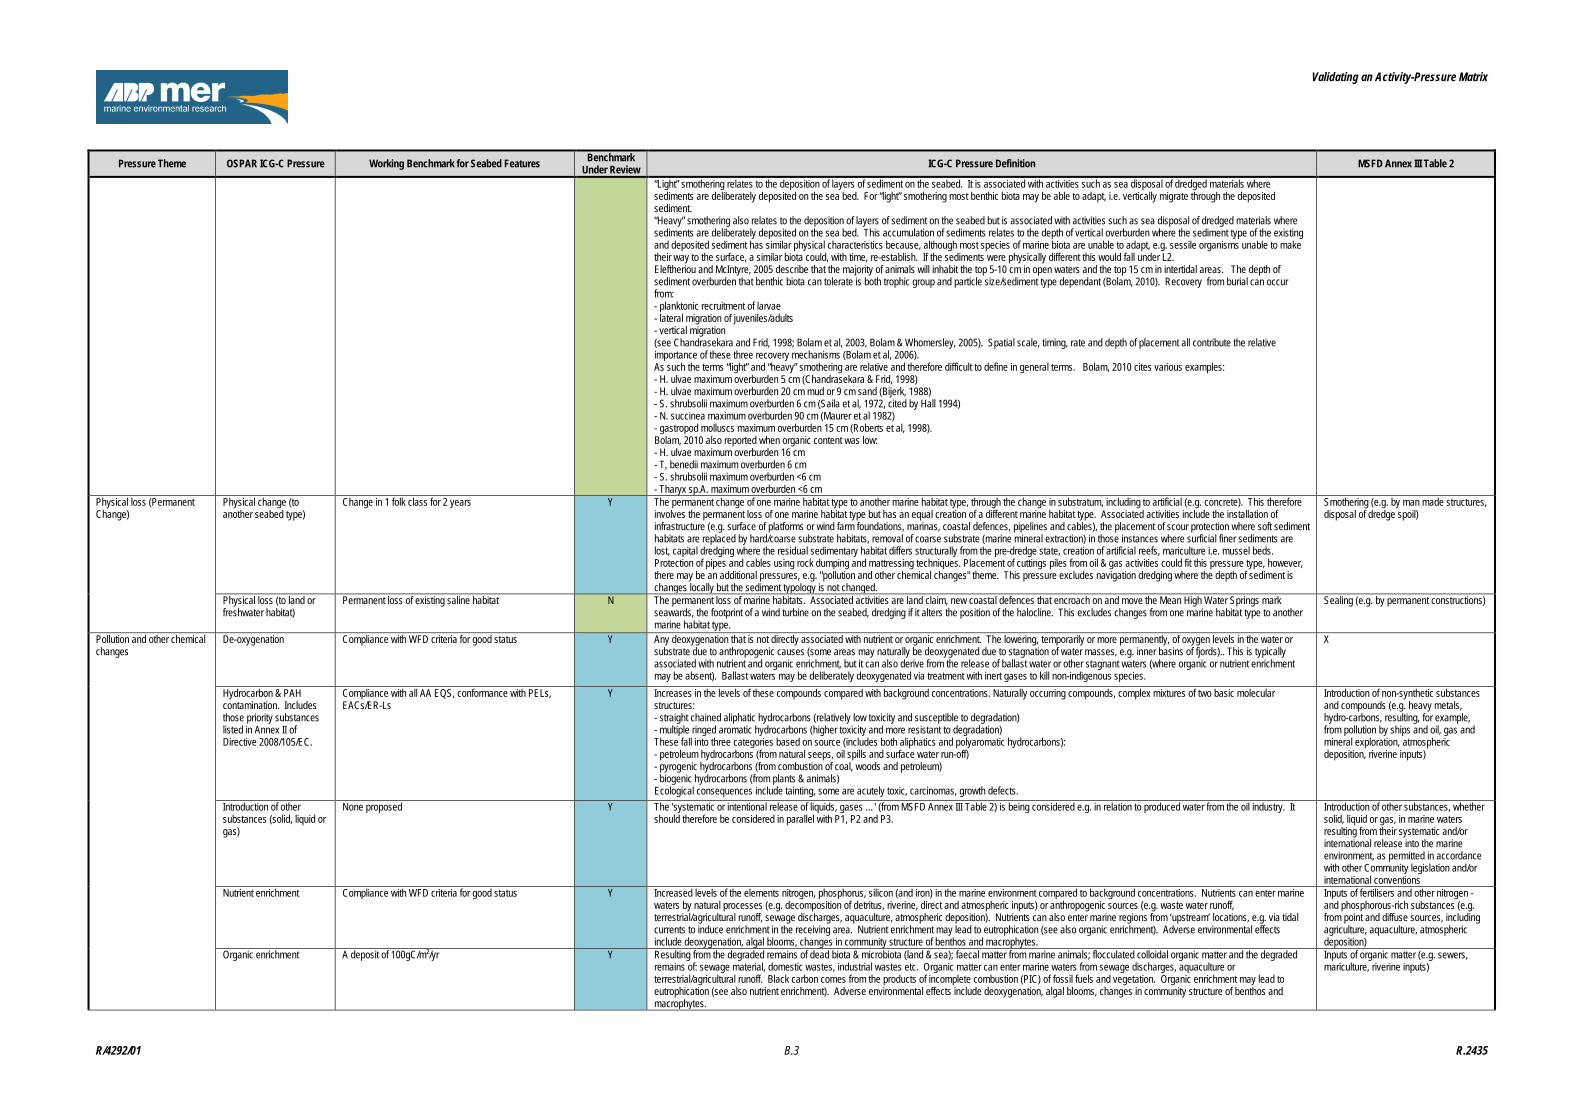
Validating an Activity-Pressure Matrix
Pressure Theme OSPAR ICG-C Pressure Working Benchmark for Seabed Features Benchmark Under Review ICG-C Pressure Definition MSFD Annex III Table 2
“Light” smothering relates to the deposition of layers of sediment on the seabed. It is associated with activities such as sea disposal of dredged materials where sediments are deliberately deposited on the sea bed. For “light” smothering most benthic biota may be able to adapt, i.e. vertically migrate through the deposited sediment. “Heavy” smothering also relates to the deposition of layers of sediment on the seabed but is associated with activities such as sea disposal of dredged materials where sediments are deliberately deposited on the sea bed. This accumulation of sediments relates to the depth of vertical overburden where the sediment type of the existing and deposited sediment has similar physical characteristics because, although most species of marine biota are unable to adapt, e.g. sessile organisms unable to make their way to the surface, a similar biota could, with time, re-establish. If the sediments were physically different this would fall under L2. Eleftheriou and McIntyre, 2005 describe that the majority of animals will inhabit the top 5-10 cm in open waters and the top 15 cm in intertidal areas. The depth of sediment overburden that benthic biota can tolerate is both trophic group and particle size/sediment type dependant (Bolam, 2010). Recovery from burial can occur from: - planktonic recruitment of larvae - lateral migration of juveniles/adults - vertical migration (see Chandrasekara and Frid, 1998; Bolam et al, 2003, Bolam & Whomersley, 2005). Spatial scale, timing, rate and depth of placement all contribute the relative importance of these three recovery mechanisms (Bolam et al, 2006). As such the terms “light” and “heavy” smothering are relative and therefore difficult to define in general terms. Bolam, 2010 cites various examples: - H. ulvae maximum overburden 5 cm (Chandrasekara & Frid, 1998) - H. ulvae maximum overburden 20 cm mud or 9 cm sand (Bijerk, 1988) - S. shrubsolii maximum overburden 6 cm (Saila et al, 1972, cited by Hall 1994) - N. succinea maximum overburden 90 cm (Maurer et al 1982) - gastropod molluscs maximum overburden 15 cm (Roberts et al, 1998). Bolam, 2010 also reported when organic content was low: - H. ulvae maximum overburden 16 cm - T, benedii maximum overburden 6 cm - S. shrubsolii maximum overburden <6 cm - Tharyx sp.A. maximum overburden <6 cm
Physical loss (Permanent Change)
Physical change (to another seabed type)
Change in 1 folk class for 2 years Y The permanent change of one marine habitat type to another marine habitat type, through the change in substratum, including to artificial (e.g. concrete). This therefore involves the permanent loss of one marine habitat type but has an equal creation of a different marine habitat type. Associated activities include the installation of infrastructure (e.g. surface of platforms or wind farm foundations, marinas, coastal defences, pipelines and cables), the placement of scour protection where soft sediment habitats are replaced by hard/coarse substrate habitats, removal of coarse substrate (marine mineral extraction) in those instances where surficial finer sediments are lost, capital dredging where the residual sedimentary habitat differs structurally from the pre-dredge state, creation of artificial reefs, mariculture i.e. mussel beds. Protection of pipes and cables using rock dumping and mattressing techniques. Placement of cuttings piles from oil & gas activities could fit this pressure type, however, there may be an additional pressures, e.g. "pollution and other chemical changes" theme. This pressure excludes navigation dredging where the depth of sediment is changes locally but the sediment typology is not changed.
Smothering (e.g. by man made structures, disposal of dredge spoil)
Physical loss (to land or freshwater habitat)
Permanent loss of existing saline habitat N The permanent loss of marine habitats. Associated activities are land claim, new coastal defences that encroach on and move the Mean High Water Springs mark seawards, the footprint of a wind turbine on the seabed, dredging if it alters the position of the halocline. This excludes changes from one marine habitat type to another marine habitat type.
Sealing (e.g. by permanent constructions)
Pollution and other chemical changes
De-oxygenation Compliance with WFD criteria for good status Y Any deoxygenation that is not directly associated with nutrient or organic enrichment. The lowering, temporarily or more permanently, of oxygen levels in the water or substrate due to anthropogenic causes (some areas may naturally be deoxygenated due to stagnation of water masses, e.g. inner basins of fjords).. This is typically associated with nutrient and organic enrichment, but it can also derive from the release of ballast water or other stagnant waters (where organic or nutrient enrichment may be absent). Ballast waters may be deliberately deoxygenated via treatment with inert gases to kill non-indigenous species.
X
Hydrocarbon & PAH contamination. Includes those priority substances listed in Annex II of Directive 2008/105/EC.
Compliance with all AA EQS, conformance with PELs, EACs/ER-Ls
Y Increases in the levels of these compounds compared with background concentrations. Naturally occurring compounds, complex mixtures of two basic molecular structures: - straight chained aliphatic hydrocarbons (relatively low toxicity and susceptible to degradation) - multiple ringed aromatic hydrocarbons (higher toxicity and more resistant to degradation) These fall into three categories based on source (includes both aliphatics and polyaromatic hydrocarbons): - petroleum hydrocarbons (from natural seeps, oil spills and surface water run-off) - pyrogenic hydrocarbons (from combustion of coal, woods and petroleum) - biogenic hydrocarbons (from plants & animals) Ecological consequences include tainting, some are acutely toxic, carcinomas, growth defects.
Introduction of non-synthetic substances and compounds (e.g. heavy metals, hydro-carbons, resulting, for example, from pollution by ships and oil, gas and mineral exploration, atmospheric deposition, riverine inputs)
Introduction of other substances (solid, liquid or gas)
None proposed Y The 'systematic or intentional release of liquids, gases …' (from MSFD Annex III Table 2) is being considered e.g. in relation to produced water from the oil industry. It should therefore be considered in parallel with P1, P2 and P3.
Introduction of other substances, whether solid, liquid or gas, in marine waters resulting from their systematic and/or international release into the marine environment, as permitted in accordance with other Community legislation and/or international conventions
Nutrient enrichment Compliance with WFD criteria for good status Y Increased levels of the elements nitrogen, phosphorus, silicon (and iron) in the marine environment compared to background concentrations. Nutrients can enter marine waters by natural processes (e.g. decomposition of detritus, riverine, direct and atmospheric inputs) or anthropogenic sources (e.g. waste water runoff, terrestrial/agricultural runoff, sewage discharges, aquaculture, atmospheric deposition). Nutrients can also enter marine regions from ‘upstream’ locations, e.g. via tidal currents to induce enrichment in the receiving area. Nutrient enrichment may lead to eutrophication (see also organic enrichment). Adverse environmental effects include deoxygenation, algal blooms, changes in community structure of benthos and macrophytes.
Inputs of fertilisers and other nitrogen - and phosphorous-rich substances (e.g. from point and diffuse sources, including agriculture, aquaculture, atmospheric deposition)
Organic enrichment A deposit of 100gC/m²/yr Y Resulting from the degraded remains of dead biota & microbiota (land & sea); faecal matter from marine animals; flocculated colloidal organic matter and the degraded remains of: sewage material, domestic wastes, industrial wastes etc. Organic matter can enter marine waters from sewage discharges, aquaculture or terrestrial/agricultural runoff. Black carbon comes from the products of incomplete combustion (PIC) of fossil fuels and vegetation. Organic enrichment may lead to eutrophication (see also nutrient enrichment). Adverse environmental effects include deoxygenation, algal blooms, changes in community structure of benthos and macrophytes.
Inputs of organic matter (e.g. sewers, mariculture, riverine inputs)
R/4292/01 B.3 R.2435
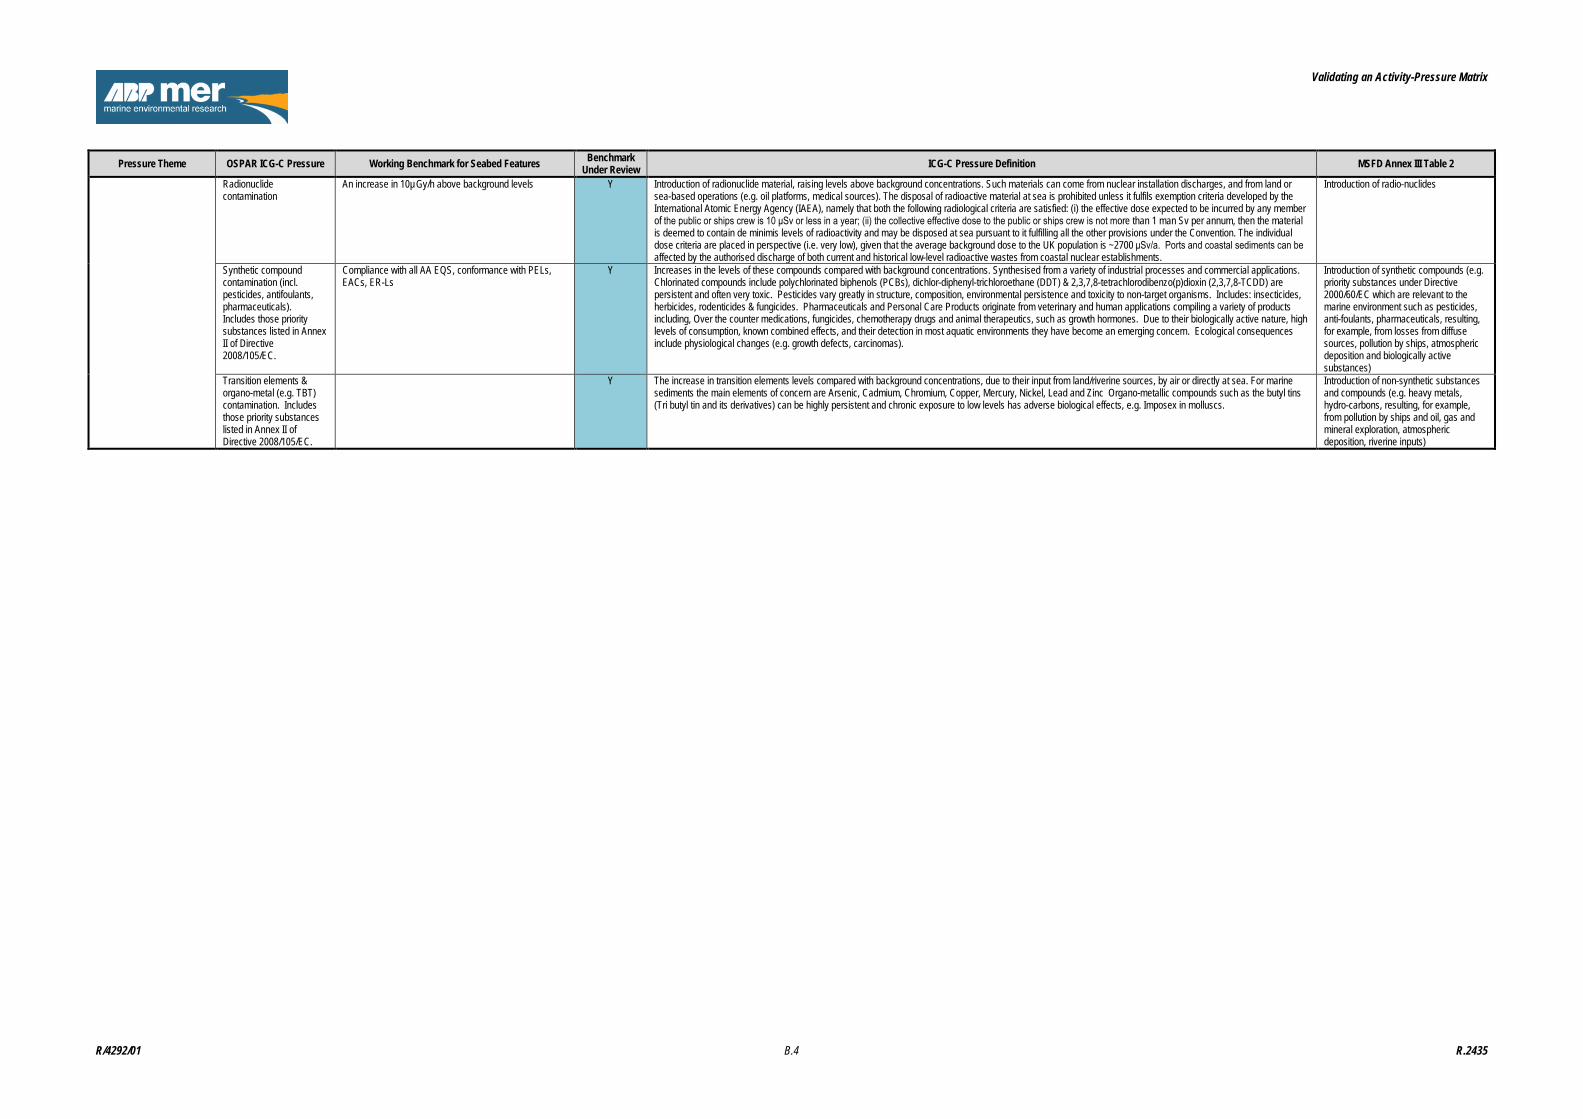
Validating an Activity-Pressure Matrix
Pressure Theme OSPAR ICG-C Pressure Working Benchmark for Seabed Features Benchmark Under Review ICG-C Pressure Definition MSFD Annex III Table 2
Radionuclide contamination
An increase in 10µGy/h above background levels Y Introduction of radionuclide material, raising levels above background concentrations. Such materials can come from nuclear installation discharges, and from land or sea-based operations (e.g. oil platforms, medical sources). The disposal of radioactive material at sea is prohibited unless it fulfils exemption criteria developed by the International Atomic Energy Agency (IAEA), namely that both the following radiological criteria are satisfied: (i) the effective dose expected to be incurred by any member of the public or ships crew is 10 μSv or less in a year; (ii) the collective effective dose to the public or ships crew is not more than 1 man Sv per annum, then the material is deemed to contain de minimis levels of radioactivity and may be disposed at sea pursuant to it fulfilling all the other provisions under the Convention. The individual dose criteria are placed in perspective (i.e. very low), given that the average background dose to the UK population is ~2700 μSv/a. Ports and coastal sediments can be affected by the authorised discharge of both current and historical low-level radioactive wastes from coastal nuclear establishments.
Introduction of radio-nuclides
Synthetic compound contamination (incl. pesticides, antifoulants, pharmaceuticals). Includes those priority substances listed in Annex II of Directive 2008/105/EC.
Compliance with all AA EQS, conformance with PELs, EACs, ER-Ls
Y Increases in the levels of these compounds compared with background concentrations. Synthesised from a variety of industrial processes and commercial applications. Chlorinated compounds include polychlorinated biphenols (PCBs), dichlor-diphenyl-trichloroethane (DDT) & 2,3,7,8-tetrachlorodibenzo(p)dioxin (2,3,7,8-TCDD) are persistent and often very toxic. Pesticides vary greatly in structure, composition, environmental persistence and toxicity to non-target organisms. Includes: insecticides, herbicides, rodenticides & fungicides. Pharmaceuticals and Personal Care Products originate from veterinary and human applications compiling a variety of products including, Over the counter medications, fungicides, chemotherapy drugs and animal therapeutics, such as growth hormones. Due to their biologically active nature, high levels of consumption, known combined effects, and their detection in most aquatic environments they have become an emerging concern. Ecological consequences include physiological changes (e.g. growth defects, carcinomas).
Introduction of synthetic compounds (e.g. priority substances under Directive 2000/60/EC which are relevant to the marine environment such as pesticides, anti-foulants, pharmaceuticals, resulting, for example, from losses from diffuse sources, pollution by ships, atmospheric deposition and biologically active substances)
Transition elements & organo-metal (e.g. TBT) contamination. Includes those priority substances listed in Annex II of Directive 2008/105/EC.
Y The increase in transition elements levels compared with background concentrations, due to their input from land/riverine sources, by air or directly at sea. For marine sediments the main elements of concern are Arsenic, Cadmium, Chromium, Copper, Mercury, Nickel, Lead and Zinc Organo-metallic compounds such as the butyl tins (Tri butyl tin and its derivatives) can be highly persistent and chronic exposure to low levels has adverse biological effects, e.g. Imposex in molluscs.
Introduction of non-synthetic substances and compounds (e.g. heavy metals, hydro-carbons, resulting, for example, from pollution by ships and oil, gas and mineral exploration, atmospheric deposition, riverine inputs)
R/4292/01 B.4 R.2435
Appendix C Confidence Assessment
Cefas contract report C6521
Validating an activity-pressure matrix
(Task 3.2 Confidence Classification System)
Authors: Tammy Stamford & Freya Goodsir
Issue date: March 2015

Confidence Classification System Page i
Cefas Document Control
Title: Validating an activity-pressure matrix
(Task 3.2 Confidence Classification System)
Submitted to: Natalie Frost, ABPmer
Date submitted: 20/03/2015
Project Manager: Freya Goodsir
Report compiled by: Tammy Stamford & Freya Goodsir
Quality control by: Koen Vanstaen
Approved by &
date: Koen Vanstaen 20/03/2015
Version: V2
Version Control History
Author Date Comment Version
Tammy Stamford 17/12/2014 Draft V0.1
Tammy Stamford 18/12/2014 Final draft V1.0
Freya Goodsir 18/03/2015 Final draft after
comments
V2

Confidence Classification System Page ii
Confidence Classification System Page iii
Validating an activity-pressure matrix
(Task 3.2 Confidence Classification System)
Authors: Tammy Stamford & Freya Goodsir
Issue date: March 2015
Head office
Centre for Environment, Fisheries & Aquaculture Science
Pakefield Road, Lowestoft, Suffolk NR33 0HT, UK
Tel +44 (0) 1502 56 2244 Fax +44 (0) 1502 51 3865
www.cefas.defra.gov.uk
Cefas is an executive agency of Defra

Confidence Classification System Page iv
Confidence Classification System Page v
Table of contents
1 Introduction ................................................................................................................................... 1
2 Confidence Assessment Reviews ............................................................................................... 3
2.1 MB0102 JNCC Confidence Assessment ................................................................................... 3
2.1.1 Method............................................................................................................................ 3
2.1.2 Advantages ...................................................................................................................... 4
2.1.3 Limitations ....................................................................................................................... 4
2.2 IPCC Assessment ..................................................................................................................... 5
2.2.1 Method............................................................................................................................ 5
2.2.2 Advantages ...................................................................................................................... 7
2.2.3 Limitations ....................................................................................................................... 8
2.3 EA approaches......................................................................................................................... 8
2.3.1 Approach 1 ...................................................................................................................... 9
2.3.1.1 Advantages ................................................................................................................ 10
2.3.1.2 Limitations ................................................................................................................. 10
2.3.2 EA Approach 2 ............................................................................................................... 11
2.3.2.1 Advantages ................................................................................................................ 11
2.3.2.2 Limitations ................................................................................................................. 11
2.4 MCCIP Confidence Assessment............................................................................................. 11
3 Recommendations ...................................................................................................................... 12
3.1 OPTION A: EVIDENCE ............................................................................................................ 13
3.2 OPTION B: EVIDENCE + AGREEMENT .................................................................................... 14
3.3 Concluding Remarks .............................................................................................................. 16
4 References ................................................................................................................................... 17
Confidence Classification System Page 1 of 18
1 Introduction
This document aims to review and make recommendations on the potential suitability of four
confidence classification systems that could be applied to the evidence supporting the
linkages of the combined activities-pressures matrix. The confidence classification system
should, in particular, be appropriate for assessing the type, amount, quality and consistency
of the evidence supporting each activity-pressure linkage.
The following confidence classification systems have been reviewed:
1. The confidence assessment used by the Joint Nature Conservation Committee (JNCC)
as part of the development of a pressures-MCZ/MPA features sensitivity matrix,
hereafter referred to as the ‘MB0102 JNCC assessment’ (Tillin et al. 2010) and
available at http://randd.defra.gov.uk/Document.aspx?Document=MB0102_9721_TRP.pdf;
2. The assessment described in the ‘Guidance Note for Lead Authors of the IPCC Fifth
Assessment Report on Consistent Treatment of Uncertainties’ (Mastrandrea et al.
2010), hereafter referred to as the ‘IPCC assessment’ and available at
http://www.ipcc.ch/pdf/supporting-material/uncertainty-guidance-note.pdf;
3. Two methods used by the Environment Agency (EA):
a. One that forms part of a risk assessment to determine the likelihood of river,
transitional (estuaries) and coastal waters failing to achieve the Water
Framework Directive (WFD) objective of Good status post 2015 due to
designated chemicals (EA, 2014), hereafter named ‘EA Approach 1’; and
b. Another used in a technical assessment of the first pressures and impacts
analyses required by Article 5 of the WFD (EA, undated), hereafter named ‘EA
Approach 2’.
A number of other EA documents were also considered, but not comprehensively
reviewed, as part of this task. These documents are listed in the reference list (section
4). The majority describe risk assessments undertaken to assess the risk of
deterioration of a particular water body or they assess the likelihood of a particular
water body (or water bodies) achieving or failing WFD objectives. In each case it is
stated that confidence scores have been applied to the risk assessment outputs.
However, these documents were not included in this review for the following reasons:
Confidence Classification System Page 2 of 18
The description of the confidence assessment methodology was
limited/lacking detail;
Contextual/background information provided in support of the assessment
was not readily available;
The methods used (e.g. way in which confidence scores were applied to the
variables) were not thought to be necessarily appropriate for the task of
assigning confidence scores to the activities-pressures matrix.
The characteristics, advantages and limitations of each of classification systems 1, 2, 3a and
3b (above) have been discussed and a recommendation(s) has been made as to which
approach(es) may be suitable for use in Task 3.3 of this project. Task 3.3 aims to assign
confidence scores to all the activity-pressure links identified within the finalised matrix, using
the agreed methodology or output of review. In Task 3.3, the confidence levels will be
captured within the overall activity-pressure matrix with any relevant supporting rationale
also documented within the project report.
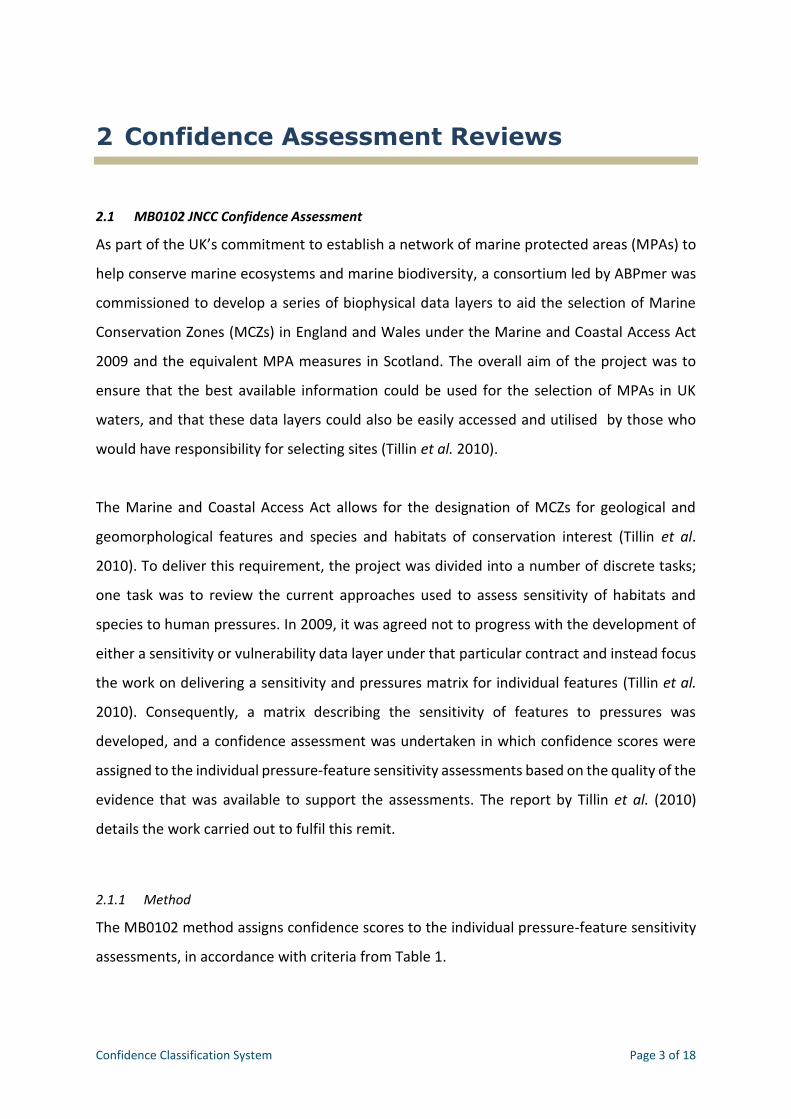
Confidence Classification System Page 3 of 18
2 Confidence Assessment Reviews
2.1 MB0102 JNCC Confidence Assessment
As part of the UK’s commitment to establish a network of marine protected areas (MPAs) to
help conserve marine ecosystems and marine biodiversity, a consortium led by ABPmer was
commissioned to develop a series of biophysical data layers to aid the selection of Marine
Conservation Zones (MCZs) in England and Wales under the Marine and Coastal Access Act
2009 and the equivalent MPA measures in Scotland. The overall aim of the project was to
ensure that the best available information could be used for the selection of MPAs in UK
waters, and that these data layers could also be easily accessed and utilised by those who
would have responsibility for selecting sites (Tillin et al. 2010).
The Marine and Coastal Access Act allows for the designation of MCZs for geological and
geomorphological features and species and habitats of conservation interest (Tillin et al.
2010). To deliver this requirement, the project was divided into a number of discrete tasks;
one task was to review the current approaches used to assess sensitivity of habitats and
species to human pressures. In 2009, it was agreed not to progress with the development of
either a sensitivity or vulnerability data layer under that particular contract and instead focus
the work on delivering a sensitivity and pressures matrix for individual features (Tillin et al.
2010). Consequently, a matrix describing the sensitivity of features to pressures was
developed, and a confidence assessment was undertaken in which confidence scores were
assigned to the individual pressure-feature sensitivity assessments based on the quality of the
evidence that was available to support the assessments. The report by Tillin et al. (2010)
details the work carried out to fulfil this remit.
2.1.1 Method
The MB0102 method assigns confidence scores to the individual pressure-feature sensitivity
assessments, in accordance with criteria from Table 1.
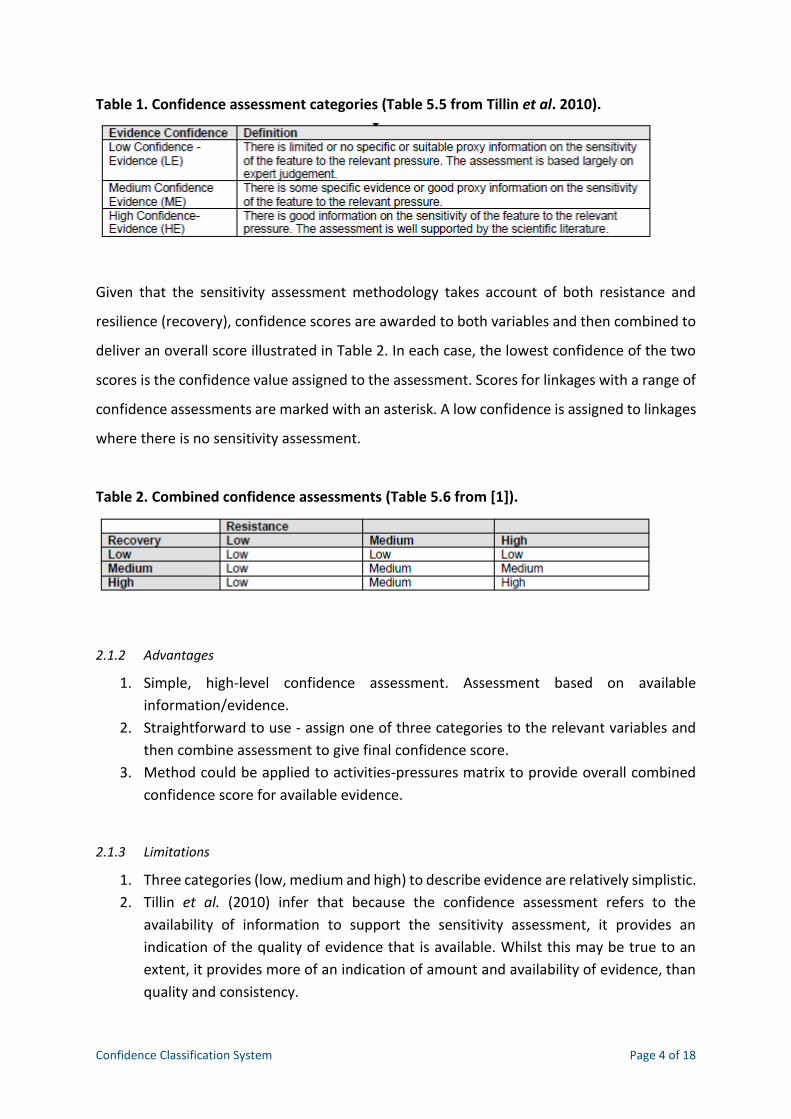
Confidence Classification System Page 4 of 18
Table 1. Confidence assessment categories (Table 5.5 from Tillin et al. 2010).
Given that the sensitivity assessment methodology takes account of both resistance and
resilience (recovery), confidence scores are awarded to both variables and then combined to
deliver an overall score illustrated in Table 2. In each case, the lowest confidence of the two
scores is the confidence value assigned to the assessment. Scores for linkages with a range of
confidence assessments are marked with an asterisk. A low confidence is assigned to linkages
where there is no sensitivity assessment.
Table 2. Combined confidence assessments (Table 5.6 from [1]).
2.1.2 Advantages
1. Simple, high-level confidence assessment. Assessment based on available
information/evidence.
2. Straightforward to use - assign one of three categories to the relevant variables and
then combine assessment to give final confidence score.
3. Method could be applied to activities-pressures matrix to provide overall combined
confidence score for available evidence.
2.1.3 Limitations
1. Three categories (low, medium and high) to describe evidence are relatively simplistic.
2. Tillin et al. (2010) infer that because the confidence assessment refers to the
availability of information to support the sensitivity assessment, it provides an
indication of the quality of evidence that is available. Whilst this may be true to an
extent, it provides more of an indication of amount and availability of evidence, than
quality and consistency.
Confidence Classification System Page 5 of 18
3. Level of resolution with regard to type, amount, quality and consistency not present
unless described qualitatively or unless further scoring is integrated into the process.
4. Degree of agreement is not considered as part of the confidence assessment process.
The method, therefore, does not recognise where there may be disagreement in
expert opinion and evidence on the relationship between the two variables.
2.2 IPCC Assessment
The IPCC Guidance Note stipulates a language and process to be used to evaluate and
communicate uncertainty in findings. The authors present two metrics for communicating
uncertainty in assessments:
1. The level of confidence in a finding based on type, amount, quality and consistency
of evidence, together with the degree of agreement – these are expressed
qualitatively;
2. Quantified measures of uncertainty, expressed probabilistically. An example would
include model results.
2.2.1 Method
First, the type, amount, quality and consistency of evidence is assessed and described as
‘limited’, ‘medium’ or ‘robust’. Next, the degree of agreement is assessed and described using
the terms ‘low’, ‘medium’ or ‘high’ (Figure 1). Descriptive text is included in support of the
evaluation. Finally, the level of confidence is expressed using the terms ‘very low’, ‘low’,
‘medium’, ‘high’ or ‘very high’.
Figure 1 illustrates the relationship between evidence and the level of agreement and how
that relates to confidence. Confidence increases toward the top right hand corner. A high
confidence score may be assigned where there is a combination of high quality robust
evidence and a high level of agreement. By contrast, a low confidence score may be assigned
where evidence is limited and the level of agreement is low.
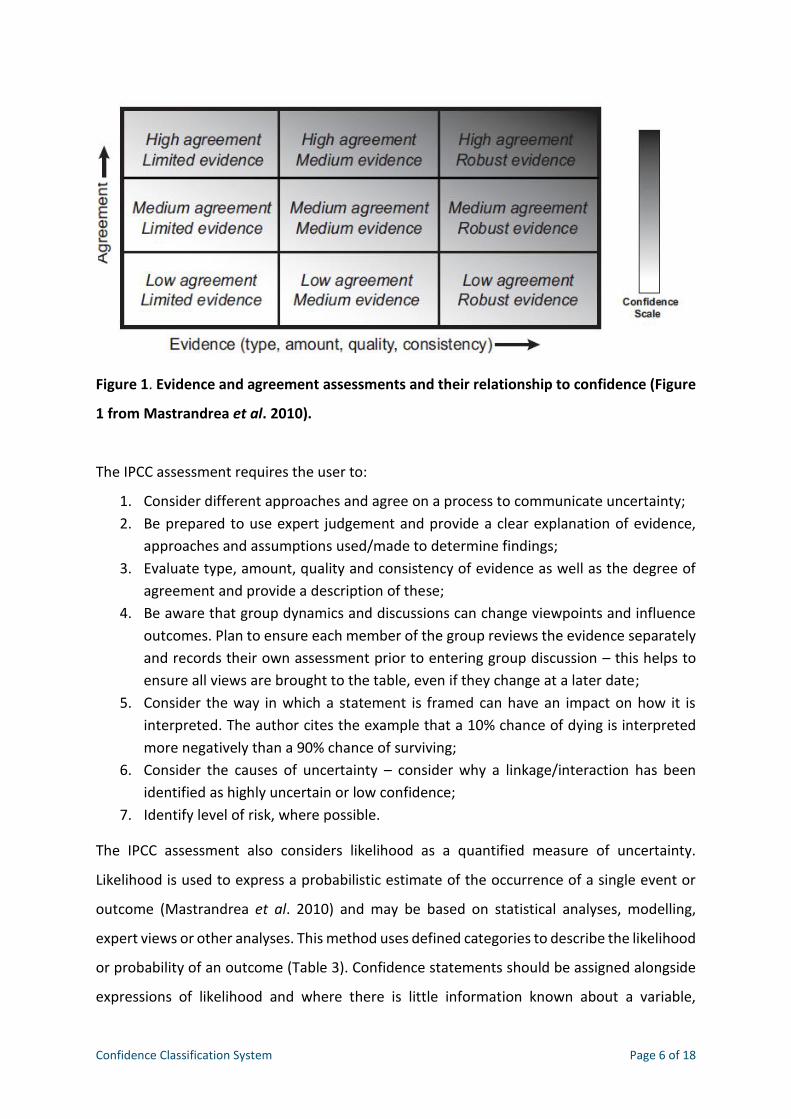
Confidence Classification System Page 6 of 18
Figure 1. Evidence and agreement assessments and their relationship to confidence (Figure
1 from Mastrandrea et al. 2010).
The IPCC assessment requires the user to:
1. Consider different approaches and agree on a process to communicate uncertainty;
2. Be prepared to use expert judgement and provide a clear explanation of evidence,
approaches and assumptions used/made to determine findings;
3. Evaluate type, amount, quality and consistency of evidence as well as the degree of
agreement and provide a description of these;
4. Be aware that group dynamics and discussions can change viewpoints and influence
outcomes. Plan to ensure each member of the group reviews the evidence separately
and records their own assessment prior to entering group discussion – this helps to
ensure all views are brought to the table, even if they change at a later date;
5. Consider the way in which a statement is framed can have an impact on how it is
interpreted. The author cites the example that a 10% chance of dying is interpreted
more negatively than a 90% chance of surviving;
6. Consider the causes of uncertainty – consider why a linkage/interaction has been
identified as highly uncertain or low confidence;
7. Identify level of risk, where possible.
The IPCC assessment also considers likelihood as a quantified measure of uncertainty.
Likelihood is used to express a probabilistic estimate of the occurrence of a single event or
outcome (Mastrandrea et al. 2010) and may be based on statistical analyses, modelling,
expert views or other analyses. This method uses defined categories to describe the likelihood
or probability of an outcome (Table 3). Confidence statements should be assigned alongside
expressions of likelihood and where there is little information known about a variable,
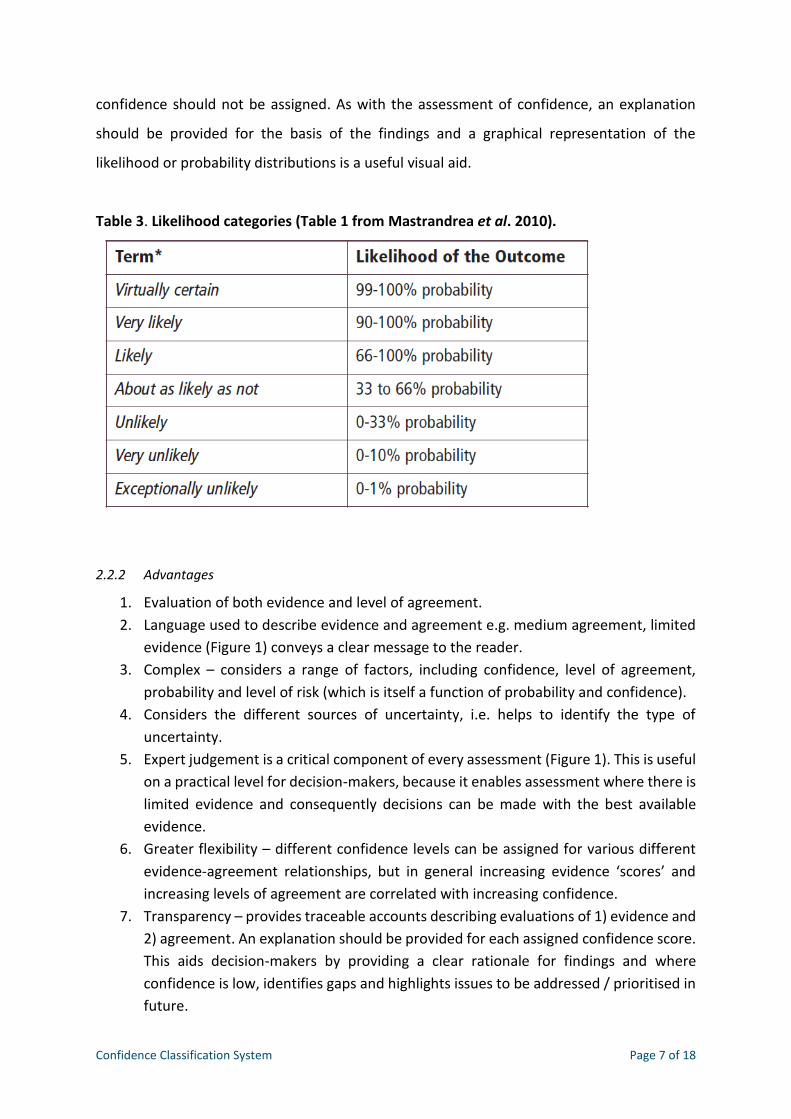
Confidence Classification System Page 7 of 18
confidence should not be assigned. As with the assessment of confidence, an explanation
should be provided for the basis of the findings and a graphical representation of the
likelihood or probability distributions is a useful visual aid.
Table 3. Likelihood categories (Table 1 from Mastrandrea et al. 2010).
2.2.2 Advantages
1. Evaluation of both evidence and level of agreement.
2. Language used to describe evidence and agreement e.g. medium agreement, limited
evidence (Figure 1) conveys a clear message to the reader.
3. Complex – considers a range of factors, including confidence, level of agreement,
probability and level of risk (which is itself a function of probability and confidence).
4. Considers the different sources of uncertainty, i.e. helps to identify the type of
uncertainty.
5. Expert judgement is a critical component of every assessment (Figure 1). This is useful
on a practical level for decision-makers, because it enables assessment where there is
limited evidence and consequently decisions can be made with the best available
evidence.
6. Greater flexibility – different confidence levels can be assigned for various different
evidence-agreement relationships, but in general increasing evidence ‘scores’ and
increasing levels of agreement are correlated with increasing confidence.
7. Transparency – provides traceable accounts describing evaluations of 1) evidence and
2) agreement. An explanation should be provided for each assigned confidence score.
This aids decision-makers by providing a clear rationale for findings and where
confidence is low, identifies gaps and highlights issues to be addressed / prioritised in
future.
Confidence Classification System Page 8 of 18
8. Where practicable, an assessment of likelihood can be used to compliment the
confidence assessment.
9. Assessment of likelihood could be usefully applied to the method used to assign
confidence in the activity-pressure matrix as part of Task 3.3; likelihood of occurrence
of an activity resulting in a pressure should form an inherent (formal or informal) part
of the confidence assessment process.
2.2.3 Limitations
1. Description of confidence is qualitative rather than quantitative (although the method
could be adapted to provide a numeric score).
2. Time consuming – explanatory text should be provided for each assessment (i.e. each
interaction).
3. Assessment of likelihood provides a more quantitative approach, but determination
of the boundaries between categories can be subjective or arbitrary. In addition,
modelled estimates may be subject to certain assumptions that introduce other types
of uncertainty into the process.
4. Mastrandrea et al. (2010) infer that users can adjust their interpretation of the
language used to describe likelihood according to the magnitude of perceived
potential consequences. This may introduce further subjectivity / bias into the
process.
2.3 EA approaches
Article 5 and Annex II of the Water Framework Directive require Member states to carry out
the following, as part of the UK’s commitment to review impacts of human activity on the
status of UK waters:
(a) Collect and maintain information on the type and magnitude of the significant
pressures to which surface water and groundwater bodies in each River Basin District
are liable to be subject; and
(b) Carry out an assessment of the risk that these bodies will fail to meet the
Directive’s environmental objectives (EA, 2004).
As part of this commitment, a series of guidance documents have been produced by the UK
Technical Advisory Group on the Water Framework Directive (UKTAG). The aim of these
guidance documents was to promote consistent approaches to the pressure and impacts
analysis across UK and Ireland. Guidance documents have been produced for the main
Confidence Classification System Page 9 of 18
pressures which affect UK water bodies, these are as follows: point source discharge, diffuse
source discharges, abstraction and engineering works (EA, 2004). These documents highlight
the main differences in methods, and data availability for the UK. They also present an
approach to attempt to capture as many risks as possible, towards the achievement of the
directive. The documents further assign a confidence level as high, medium or low to the data,
in terms of quality, quantity and the difference in quality of information available. The
identification of significant pressures will continue in the next phase of the river basin
planning process, bridging the gap of greatest uncertainty and providing information towards
an effective programme of measures.
2.3.1 Approach 1
This confidence assessment forms part of the EA risk assessment to determine the likelihood
of river, transitional (estuaries) and coastal waters failing to achieve the Water Framework
Directive (WFD) objective of Good status post 2015 due to designated chemicals. Since the
outcome of the risk assessment relies on the quantity and quality of data for each chemical,
a confidence score is assigned to data available for each chemical. Modelled data are assigned
scores of ‘good’, ‘poor’ or ‘uncertain’ for each of three characteristics: accuracy of model
predictions, spatial distribution and data density (Table 4). Where no data are available, a
confidence rating of ‘uncertain’ is assigned.
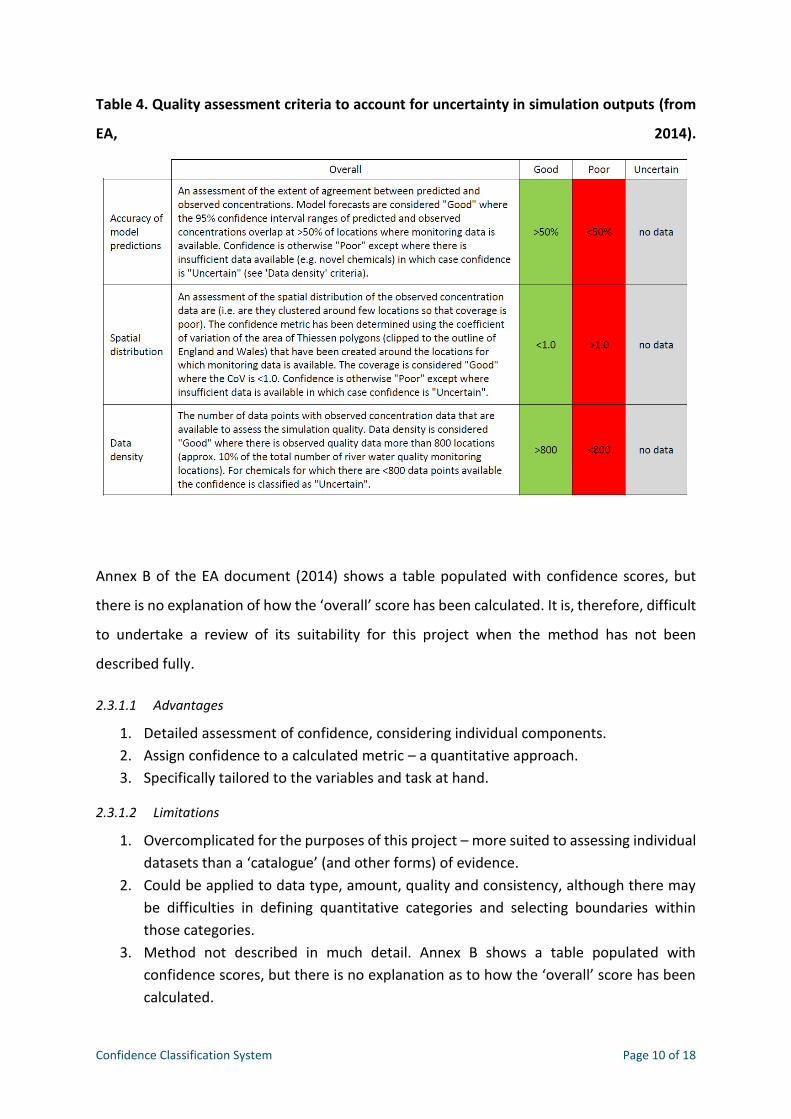
Confidence Classification System Page 10 of 18
Table 4. Quality assessment criteria to account for uncertainty in simulation outputs (from
EA, 2014).
Annex B of the EA document (2014) shows a table populated with confidence scores, but
there is no explanation of how the ‘overall’ score has been calculated. It is, therefore, difficult
to undertake a review of its suitability for this project when the method has not been
described fully.
2.3.1.1 Advantages
1. Detailed assessment of confidence, considering individual components.
2. Assign confidence to a calculated metric – a quantitative approach.
3. Specifically tailored to the variables and task at hand.
2.3.1.2 Limitations
1. Overcomplicated for the purposes of this project – more suited to assessing individual
datasets than a ‘catalogue’ (and other forms) of evidence.
2. Could be applied to data type, amount, quality and consistency, although there may
be difficulties in defining quantitative categories and selecting boundaries within
those categories.
3. Method not described in much detail. Annex B shows a table populated with
confidence scores, but there is no explanation as to how the ‘overall’ score has been
calculated.

Confidence Classification System Page 11 of 18
2.3.2 EA Approach 2
The second confidence assessment undertaken by the EA as part of the river basin pressures
and impacts analyses technical assessment assigns confidence scores to source-pressure,
exposure-pressure and pressure-impact interactions. For each parameter, confidence is
assessed as 2 (high), 1 (moderate) or 0 (low) based on an expert review of the data provided.
The confidence scores for each waterbody are then summed and an overall confidence class
is assigned based on the sum total: high (6-8), moderate (3-5) and low (0-2). By summing the
individual confidence scores, it is possible to account for the availability of data; where data
were not available, the components did not contribute anything to the scores. Waterbodies
with data missing, therefore, achieve lower scores overall and consequently fall in to the low
confidence category.
2.3.2.1 Advantages
1. Straightforward scoring system (similar to the MB0102 JNCC assessment).
2. Scoring system and method of summing takes into account availability of data.
2.3.2.2 Limitations
1. Encompasses expert review but does not account for level of agreement.
2. Lacks traceable accounting and descriptions of evaluations.
2.4 MCCIP Confidence Assessment
In 2013, the Marine Climate Change Impacts Partnership (MCCIP) undertook a review to
identify key knowledge gaps within their topic area. A confidence assessment was undertaken
as part of this review and their reporting process can be viewed at
http://www.mccip.org.uk/annual-report-card/2013/confidence-assessments.aspx. Although
their confidence assessment methodology has not been reviewed in detail as part of this task,
their method of reporting has been considered and has helped to inform the final
recommendations. It is a simplified version of the IPCC assessment and is based on a
combination of the amount of evidence and the level of agreement / consensus.
Confidence Classification System Page 12 of 18
3 Recommendations
A number of confidence assessment approaches have been reviewed. These methods have
been briefly outlined and their advantages and limitations discussed. It has been concluded -
for the purposes of this task - that the MB0102 JNCC assessment and the IPCC assessment
(Assessments 1 and 2) are the most suited to assigning confidence scores to the evidence
supporting the linkages between activity-pressure interactions. EA Approach 1 and EA
Approach 2 were used to inform the recommended assessment method, but none of their
characteristics were specifically adopted. This is because the EA methods were specifically
tailored to the input variables and they were designed to assess confidence in datasets, rather
than the range of different types of evidence (as would be required by any assessment for
this matrix).
Use of a numeric scoring system is not recommended because it assumes an equal weighting
of each component. Since it may not be appropriate to assume an equal weighting exists
between agreement and evidence or, more specifically that an equal weighting can be applied
to the type, amount, quality and consistency of evidence, it is proposed that a method which
scores and sums those scores is not necessarily appropriate in this case. Furthermore deciding
on which score to assign to each piece of evidence would be a time consuming task.
Two potential methods of assessing confidence have been proposed; the first option (A) is
wholly derived from the MB0102 JNCC assessment and the second option (B) is a hybrid
version of the MB0102 JNCC assessment and the IPCC assessment. It is, however,
recommended that a hybrid option, which comprises characteristics of both the MB0102
JNCC assessment and the IPCC assessment (Option B), is adopted.
For the purposes of this assessment:
“Evidence” is defined as expert opinion or advice, data, methodology, results from
data analysis, interpretation of data analysis, and collations and interpretations of
scientific information (meta-analysis), peer-reviewed papers, grey literature,
industry knowledge and anecdotal evidence (adapted from JNCC, 2013).
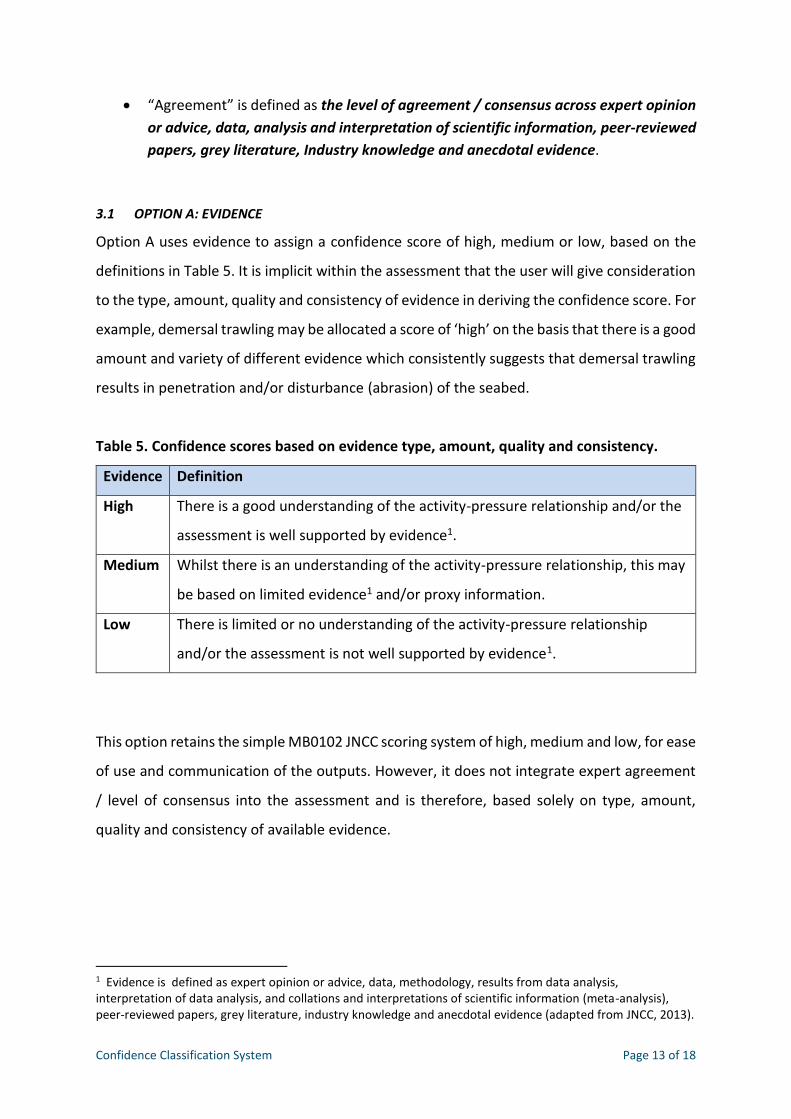
Confidence Classification System Page 13 of 18
“Agreement” is defined as the level of agreement / consensus across expert opinion
or advice, data, analysis and interpretation of scientific information, peer-reviewed
papers, grey literature, Industry knowledge and anecdotal evidence.
3.1 OPTION A: EVIDENCE
Option A uses evidence to assign a confidence score of high, medium or low, based on the
definitions in Table 5. It is implicit within the assessment that the user will give consideration
to the type, amount, quality and consistency of evidence in deriving the confidence score. For
example, demersal trawling may be allocated a score of ‘high’ on the basis that there is a good
amount and variety of different evidence which consistently suggests that demersal trawling
results in penetration and/or disturbance (abrasion) of the seabed.
Table 5. Confidence scores based on evidence type, amount, quality and consistency.
Evidence Definition
High There is a good understanding of the activity-pressure relationship and/or the
assessment is well supported by evidence1.
Medium Whilst there is an understanding of the activity-pressure relationship, this may
be based on limited evidence1 and/or proxy information.
Low There is limited or no understanding of the activity-pressure relationship
and/or the assessment is not well supported by evidence1.
This option retains the simple MB0102 JNCC scoring system of high, medium and low, for ease
of use and communication of the outputs. However, it does not integrate expert agreement
/ level of consensus into the assessment and is therefore, based solely on type, amount,
quality and consistency of available evidence.
1 Evidence is defined as expert opinion or advice, data, methodology, results from data analysis, interpretation of data analysis, and collations and interpretations of scientific information (meta-analysis), peer-reviewed papers, grey literature, industry knowledge and anecdotal evidence (adapted from JNCC, 2013).
Confidence Classification System Page 14 of 18
3.2 OPTION B: EVIDENCE + AGREEMENT
Option B adopts the most suitable characteristics of the MB0102 JNCC and IPCC assessments,
to form a hybrid. Like that of the MB0102 JNCC assessment, three categories of high, medium
and low are retained to describe both the evidence available, and the level of agreement or
consensus.
Throughout the assessment, it is important to record the rationale for assigning a specific
score. This helps to make the process transparent, auditable and defensible, and also retains
the information for use at a later date.
Implicit within the assessment is consideration of the type, amount, quality and consistency
of evidence in deriving the evidence confidence score. Also implicit within the assessment
should be a consideration of the likelihood that a specific activity will result in a specific
pressure; likelihood forms a component of the confidence score. N.B. it is not proposed that
the determination of likelihood will be included as a separate step in the recommended
method, however, it will be considered when assigning a confidence score, particularly where
documented evidence of an activity-pressure interaction is limited.
The evidence is assigned a confidence score of high, medium or low, based on the definitions
in Table 6.
Example: Demersal trawling may be allocated a score of ‘high’ on the basis that there is a
good amount and variety of different evidence and a high level of agreement across the
scientific community and industry, which consistently suggests that demersal trawling results
in penetration and/or disturbance (abrasion) of the seabed.
Table 6. Confidence scores based on evidence type, amount, quality and consistency and
level of agreement / consensus.
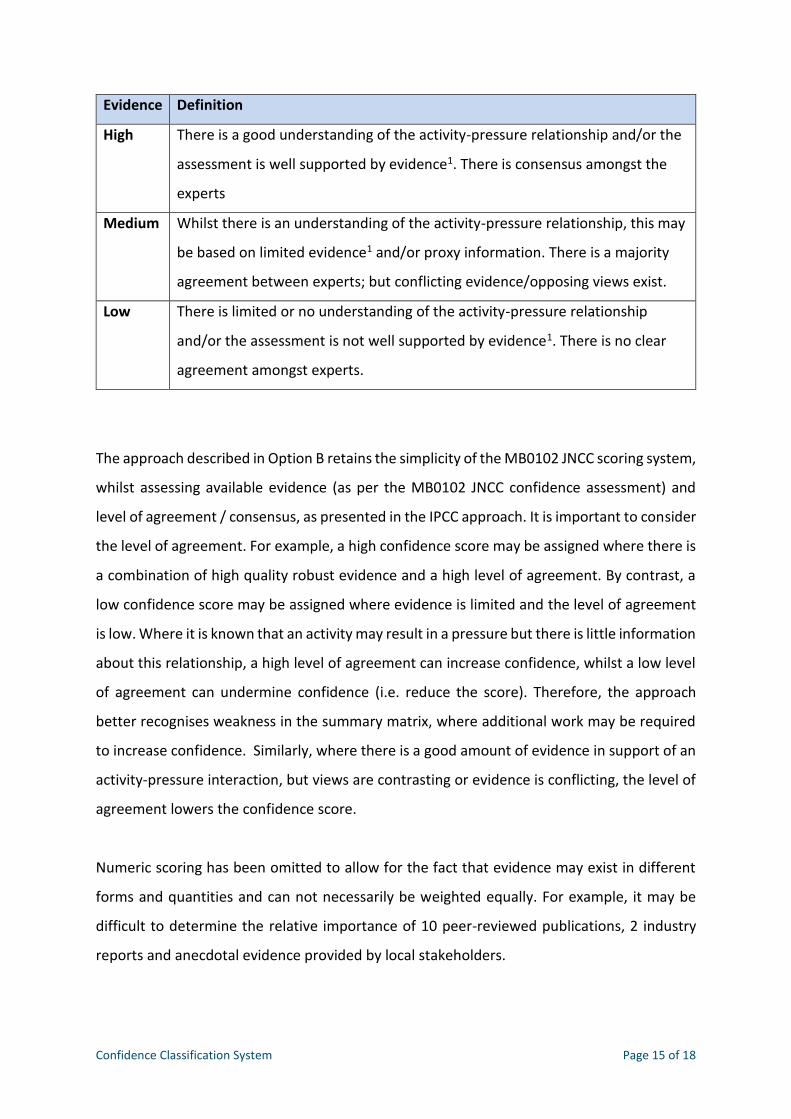
Confidence Classification System Page 15 of 18
Evidence Definition
High There is a good understanding of the activity-pressure relationship and/or the
assessment is well supported by evidence1. There is consensus amongst the
experts
Medium Whilst there is an understanding of the activity-pressure relationship, this may
be based on limited evidence1 and/or proxy information. There is a majority
agreement between experts; but conflicting evidence/opposing views exist.
Low There is limited or no understanding of the activity-pressure relationship
and/or the assessment is not well supported by evidence1. There is no clear
agreement amongst experts.
The approach described in Option B retains the simplicity of the MB0102 JNCC scoring system,
whilst assessing available evidence (as per the MB0102 JNCC confidence assessment) and
level of agreement / consensus, as presented in the IPCC approach. It is important to consider
the level of agreement. For example, a high confidence score may be assigned where there is
a combination of high quality robust evidence and a high level of agreement. By contrast, a
low confidence score may be assigned where evidence is limited and the level of agreement
is low. Where it is known that an activity may result in a pressure but there is little information
about this relationship, a high level of agreement can increase confidence, whilst a low level
of agreement can undermine confidence (i.e. reduce the score). Therefore, the approach
better recognises weakness in the summary matrix, where additional work may be required
to increase confidence. Similarly, where there is a good amount of evidence in support of an
activity-pressure interaction, but views are contrasting or evidence is conflicting, the level of
agreement lowers the confidence score.
Numeric scoring has been omitted to allow for the fact that evidence may exist in different
forms and quantities and can not necessarily be weighted equally. For example, it may be
difficult to determine the relative importance of 10 peer-reviewed publications, 2 industry
reports and anecdotal evidence provided by local stakeholders.
Confidence Classification System Page 16 of 18
3.3 Concluding Remarks
Although two options have been presented, Option B is the recommended method of
confidence assessment for the activities-pressures matrix because it is generic enough to
reflect the underlying evidence, without being so general that it loses substantive meaning.
It also incorporates an assessment of the level of agreement in addition to an assessment of
the available evidence. Consideration of type, amount, quality and consistency is an integral
part of the assessment, as is the likelihood that a particular activity will result in a given
pressure. Finally, the method offers repeatability and can be readily applied to the large
number of sub-activity pressure relationships that will be assessed as part of this project.
Confidence Classification System Page 17 of 18
4 References
1. Environment Agency, 2004. Guidance on general principles for pressures & impacts
analysis (Final). UK Technical Advisory Group on the Water Framework Directive.
2. Environment Agency, undated. Technical Assessment Method, Water Framework
Directive Programme. River Basin Characterisation Project.
3. Environment Agency, 2014. Risk Assessment Method: Risk assessment to determine
the likelihood of river, transitional (estuaries) and coastal waters failing to achieve the
Water Framework Directive objective of Good status post 2015 due to designated
chemicals.
4. Environment Agency, undated. Risk of deterioration from current status, due to
invasive non-native species for rivers, lakes, estuaries and coastal water bodies.
5. Environment Agency, undated. Summary Assessment Method. Water Category - Transitional Waters. Significant Pressure – Nutrient Nitrogen.
6. Environment Agency, undated. Risk Assessment Method. Abstraction and Flow regulation in rivers, lakes and transitional water bodies: risk of not achieving status objectives and risk of deterioration from current status.
7. Environment Agency, undated. Summary Assessment Method. Water Category – Coastal Waters. Significant Pressure – Nutrient Nitrogen. Reference Code C1.2. River Basin Characterisation Project.
8. Environment Agency, undated. Technical Assessment Method. Water Category - Transitional Waters. Significant Pressure – Industrial Abstractions.
9. Environment Agency, undated. Risk Assessment Method for Abstraction and Other Artificial Flow Pressures. WFD Category: Transitional Water Bodies. Water Framework Directive Programme.
10. Environment Agency, undated. Technical Assessment Method. Water Category – Transitional and Coastal Waters. Significant Pressure – Morphology.
11. Environment Agency, undated. Technical Assessment Method. Water Category – Transitional and Coastal Waters. Significant Pressure – Organic Enrichment. Water Framework Directive Programme.
Confidence Classification System Page 18 of 18
12. JNCC, 2013. Evidence Quality Assurance Policy.
http://jncc.defra.gov.uk/pdf/comm13P15.pdf
13. Mastrandrea, M.D., C.B. Field, T.F. Stocker, O. Edenhofer, K.L. Ebi, D.J. Frame, H. Held,
E. Kriegler, K.J. Mach, P.R. Matschoss, G.-K. Plattner, G.W. Yohe, and F.W. Zwiers,
2010: Guidance Note for Lead Authors of the IPCC Fifth Assessment Report on
Consistent Treatment of Uncertainties. Intergovernmental Panel on Climate Change
(IPCC). Available at <http://www.ipcc.ch>.http://www.ipcc.ch/pdf/supporting-
material/uncertainty-guidance-note.pdf
14. Tillin, H.M., Hull, S.C., Tyler-Walters, H., 2010. Development of a Sensitivity Matrix
(pressures-MCZ/MPA features). Report to the Department of Environment, Food and
Rural Affairs from ABPMer, Southampton and the Marine Life Information Network
(MarLIN) Plymouth: Marine Biological Association of the UK. .Defra Contract No.
MB0102 Task 3A, Report No. 22.
http://randd.defra.gov.uk/Document.aspx?Document=MB0102_9721_TRP.pdf

© Crown copyright 2015
About us Cefas is a multi-disciplinary scientific research and
consultancy centre providing a comprehensive range
of services in fisheries management, environmental
monitoring and assessment, and aquaculture to a large
number of clients worldwide.
We have more than 500 staff based in 2 laboratories,
our own ocean-going research vessel, and over 100 years
of fisheries experience.
We have a long and successful track record in
delivering high-quality services to clients in a confidential
and impartial manner.
(www.cefas.defra.gov.uk)
Cefas Technology Limited (CTL) is a wholly owned
subsidiary of Cefas specialising in the application of Cefas
technology to specific customer needs in a cost-effective
and focussed manner.
CTL systems and services are developed by teams that
are experienced in fisheries, environmental management
and aquaculture, and in working closely with clients to
ensure that their needs are fully met.
(www.cefastechnology.co.uk)
Customer focus With our unique facilities and our breadth of expertise in
environmental and fisheries management, we can rapidly put
together a multi-disciplinary team of experienced specialists,
fully supported by our comprehensive in-house resources.
Our existing customers are drawn from a broad spectrum
with wide ranging interests. Clients include:
international and UK government departments
the European Commission
the World Bank
Food and Agriculture Organisation of the United Nations
(FAO)
oil, water, chemical, pharmaceutical, agro-chemical,
aggregate and marine industries
non-governmental and environmental organisations
regulators and enforcement agencies
local authorities and other public bodies
We also work successfully in partnership with other
organisations, operate in international consortia and have
several joint ventures commercialising our intellectual
property
Head office
Centre for Environment, Fisheries & Aquaculture Science Centre for Environment, Fisheries & Aquaculture Science
Pakefield Road, Lowestoft, Barrack Road, The Nothe
Suffolk NR33 0HT UK Weymouth, DT4 8UB
Tel +44 (0) 1502 56 2244 Tel +44 (0) 1305 206600
Fax +44 (0) 1502 51 3865 Fax +44 (0) 1305 206601
Web www.cefas.defra.gov.uk
printed on paper made from a minimum 75% de-inked