Embed Size (px)
Citation preview
Biomarker Insights 2010:5 119–127
doi: 10.4137/BMI.S6051
This article is available from http://www.la-press.com.
© the author(s), publisher and licensee Libertas Academica Ltd.
This is an open access article. Unrestricted non-commercial use is permitted provided the original work is properly cited.
Open AccessFull open access to this and thousands of other papers at
http://www.la-press.com.
Biomarker Insights
O r I g I n A L r e S e A r c h
Biomarker Insights 2010:5 119
Validated Sandwich ELISA for the Quantification of von Willebrand Factor in Rabbit plasma
Brendon W. Smith1,2, Jana Strakova1,2, Jennifer L. King2, John W. erdman Jr1,3 and William D. O’Brien Jr1,2,4
1Division of nutritional Sciences, 2Bioacoustics research Laboratory, 3Department of Food Science and human nutrition,4Department of electrical and computer engineering, University of Illinois at Urbana-champaign, 405 n Mathews Ave, Urbana, IL 61801. corresponding author email: [email protected]
Abstract: von Willebrand Factor (vWF) is a multimeric plasma protein important for platelet plug formation. As part of its haemostatic role, it is released from endothelial cells during vascular stress or injury and is considered an excellent biomarker of endothelial function. Currently, there are no validated kits available to measure vWF in rabbits. We developed a sensitive and reproducible sandwich enzyme-linked immunosorbent assay (ELISA) for detection of vWF in rabbit plasma using commercially available antibodies and reagents. Purified human vWF was used as a calibrator standard with a dynamic range of 1.56–100 ng/mL. The Minimum Required Dilution for rabbit plasma was 1:100. When plasma was spiked with 3.76 or 10 ng/mL vWF, recovery was 108 ± 2% and 93 ± 2%, respectively. Intra- and inter-assay precision for 8 rabbit plasma samples were 3% and 4%, respectively. The Minimum Detectable Concentration was 254 pg/mL for purified human vWF and 1:10,700 dilution of cholesterol-fed rabbit plasma, and the Reliable Detection Limits were 457 pg/mL and 1:5940. Three freeze-thaw cycles significantly decreased vWF concentrations for purified human vWF and 2 of 3 plasma samples assayed. This ELISA provides sensitive and reproducible measurements of rabbit plasma vWF, which is an important biomarker for cardiovascular research.
Keywords: von Willebrand Factor, enzyme-linked immunosorbent assay, atherosclerosis, biomarkers, endothelium, rabbits
Smith et al
120 Biomarker Insights 2010:5
IntroductionAtherosclerosis is a pathological process underlying the majority of clinical cardiovascular events1 in which chronic inflammatory mechanisms are culpable in initiation and progression.2 Vascular endothe-lial cells express adhesion molecules that promote the progression of atherosclerosis,3 and there is a great deal of interest in discovering biomarkers of endothelial status or inflammation that reflect the activity of the various mechanisms at work. These biomarkers can assist clinicians and researchers in monitoring the progression of atherosclerosis or pre-dicting disease outcomes in research animals and human patients.
One such biomarker is the multimeric plasma protein von Willebrand Factor (vWF). In addition to its well-established haemostatic role,4 vWF is currently considered the best circulating biomarker of endothelial function.5 A growing body of experimental, clinical and epidemiological evidence points to high plasma vWF levels as indicative of systemic vascular dysfunction6 and predictive of acute cardiovascular events.7
Our laboratory is interested in evaluating the biological effects of ultrasound, when used with ultrasound contrast agents to image the aorta. We developed a cholesterol-fed rabbit model8 for this purpose. The vWF biomarker would be a useful circulating indicator of endothelial status, but there is currently no validated assay kit available to determine vWF levels in rabbit plasma. To facilitate accurate and precise measurement of this biomarker in pre-clinical studies, we have developed a sandwich enzyme-linked immunosorbent assay (ELISA) technique to measure rabbit plasma vWF using commercially available antibodies and reagents. The assay was validated by measuring parallelism, spike recovery, intra- and inter-assay precision, specificity, sensitivity, and freeze-thaw stability of plasma vWF.
Materials and MethodsMaterialsThe microplate reader (ELx800) was obtained from BioTek (Winooski, VT). Nunc Immulon 4HBX Flat Bottom 96-well microplates and adhesive plate seals were obtained from Fisher Scientific (Pittsburgh, PA). Tween-20, Thimerosal, Phosphate Buffered Saline (PBS), Na2CO3 and NaHCO3 were
obtained from Sigma-Aldrich (St. Louis, MO). The vWF protein standard (Purified vWF from cit-rated human plasma, V2650) was obtained from US Biological (Swampscott, MA). Affinity puri-fied goat anti-human vWF (GAVWF-AP), bioti-nylated affinity purified goat anti-human vWF (GAVWF-APBIO), and vWF- deficient plasma (VWF-DP) were obtained from Affinity Biologicals (Ancaster, Ontario, Canada). Streptavidin-Horseradish Peroxidase (HRP) (016-030-084) and Bovine Serum Albumin (BSA) (001-000-162) were obtained from Jackson ImmunoResearch (West Grove, PA). 3,3′,5,5′- Tetramethylbenzidine (TMB) substrate solution (52-00-03) and TMB Stop Solution (50-85-05) were obtained from KPL (Gaithersburg, MD).
ReagentsCarbonate Buffer—20 mM Na2CO3 and 40 mM NaHCO3, pH 9.6, stored at 4 °C.
Blocking Buffer—1% w/v BSA in PBS containing 11.9 mM Phosphates (Na2HPO4, KH2PO4), 137 mM NaCl, and 2.7 mM KCl, pH 7.4, stored at −20 °C.
PBST-BSA—0.1% v/v Tween 20, 1% w/v BSA in PBS containing 11.9 mM Phosphates, 137 mM NaCl, and 2.7 mM KCl, pH 7.4, stored at −20 °C.
Wash Buffer—0.05% v/v Tween 20 in PBS containing 11.9 mM Phosphates, 137 mM NaCl, and 2.7 mM KCl, pH 7.4, stored at 4 °C.
All buffers were preserved with 1 mg/L Thimerosal.
Rabbit plasma and protein standardFour-month-old male New Zealand White rabbits were acquired from Myrtle’s Rabbitry (Thompson’s Station, TN). Animals were housed individually in standard caging with stainless steel mesh bottom in a 20 °C temperature-controlled room with 12 hour light/dark cycles, and fed either a standard chow diet containing 2% fat, 0% cholesterol and 0.4% magnesium (Harlan Teklad, Indianapolis, IN) or an atherogenic diet containing 10% fat, 1% cholesterol, and 0.11% magnesium (TestDiet, Richmond, IN). Blood samples were collected in heparinized tubes via the lateral saphenous vein while under restraint, centrifuged at 1380 × g for 10 minutes and plasma was aliquotted and frozen at −70 °C. The Institu-tional Animal Care and Use Committee at the Uni-versity of Illinois at Urbana-Champaign approved all procedures.
von Willebrand Factor eLISA
Biomarker Insights 2010:5 121
The vWF protein standard was purified from citrated human plasma negative for HIV1, HIV2 and HBsAg. The protein was supplied at a concentration of 0.2 mg/mL in buffer containing 25 mM Na Citrate, 100 mM NaCl, 100 mM glycine, pH 6.8, and determined by the manufacturer to be $95% pure as judged by SDS-PAGE under reducing conditions. Upon receipt, the solution was aliquotted and stored at −70 °C according to the manufacturer’s instructions.
Antibody selection and OptimizationSeveral commercially available antibodies were evaluated (Table 1). Affinity purified goat anti-human vWF and biotinylated affinity purified goat anti-human vWF were selected as capture and sandwich antibodies, respectively. Streptavidin-HRP was cho-sen as the detection reagent. Antibody dilutions were optimized using checkerboard titration procedures, and the dilutions which returned the strongest signal to noise ratio were selected.
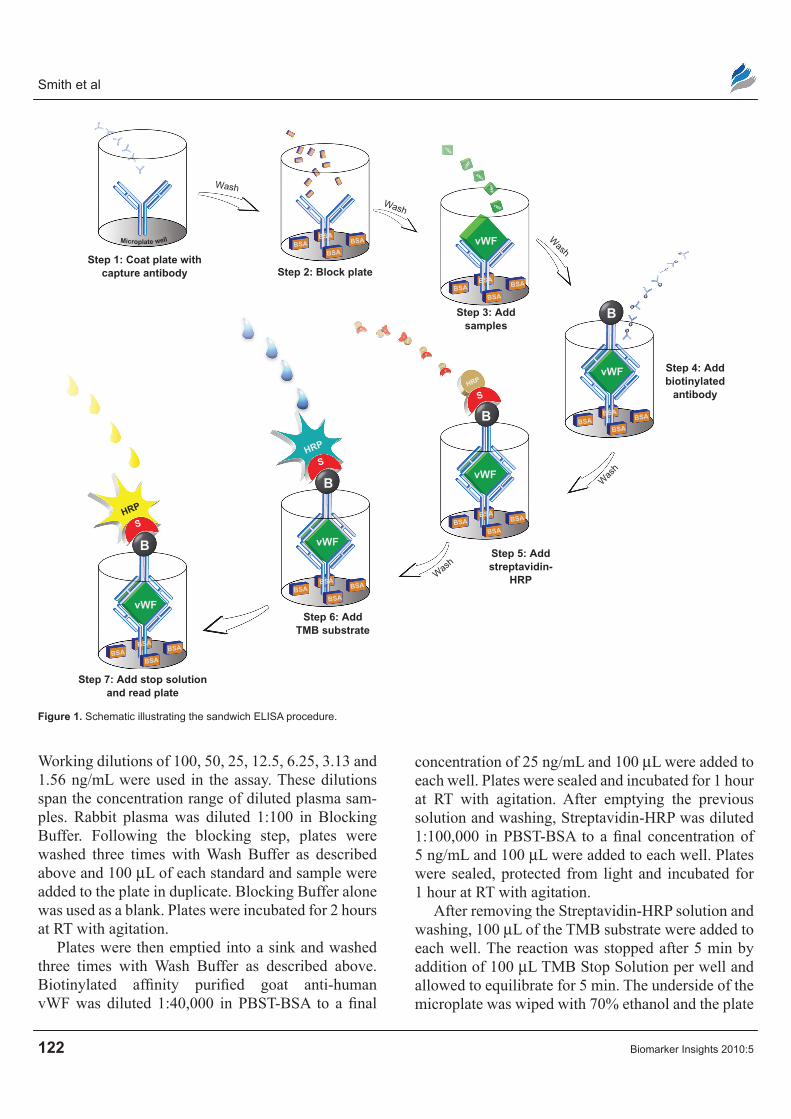
procedureA schematic of the assay procedure can be found in Figure 1. Microplate wells were coated with 100 µL of affinity purified goat anti-human vWF capture antibody diluted 1:5000 in carbonate buffer for a final concentration of 1 µg/mL. Plates were covered with adhesive sealing film, placed in a plastic bag with wet paper towels, and incubated overnight ($16h) at 4 °C. Reagents were allowed to equilibrate to room temperature (RT) overnight.
The next day, plates were washed three times with 300 µL of Wash Buffer per well on an orbital shaker with gentle agitation for 5 min. The buffer was removed by emptying into a sink and blotting on paper towels. Blocking Buffer (300 µL) was then added to each well and plates were sealed and blocked for 2 hours at RT with agitation.
During this time, rabbit plasma samples and the vWF standard were prepared for addition to the plate. A standard curve was generated by serially diluting the 0.2 mg/mL vWF stock in Blocking Buffer.
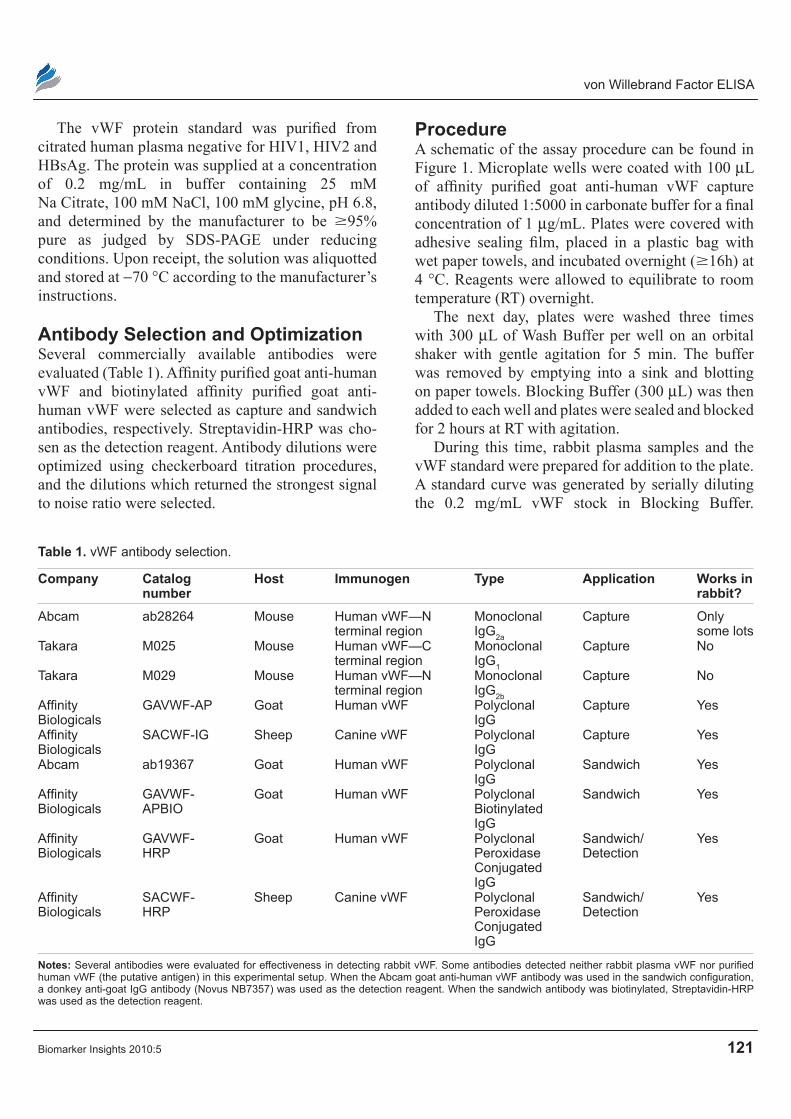
Table 1. vWF antibody selection.
company catalog number
Host Immunogen Type Application Works in rabbit?
Abcam ab28264 Mouse human vWF—n terminal region
Monoclonal Igg2a
capture Only some lots
Takara M025 Mouse human vWF—c terminal region
Monoclonal Igg1
capture no
Takara M029 Mouse human vWF—n terminal region
Monoclonal Igg2b
capture no
Affinity Biologicals
gAVWF-AP goat human vWF Polyclonal Igg
capture Yes
Affinity Biologicals
SAcWF-Ig Sheep canine vWF Polyclonal Igg
capture Yes
Abcam ab19367 goat human vWF Polyclonal Igg
Sandwich Yes
Affinity Biologicals
gAVWF- APBIO
goat human vWF Polyclonal Biotinylated Igg
Sandwich Yes
Affinity Biologicals
gAVWF- hrP
goat human vWF Polyclonal Peroxidase conjugated Igg
Sandwich/ Detection
Yes
Affinity Biologicals
SAcWF- hrP
Sheep canine vWF Polyclonal Peroxidase conjugated Igg
Sandwich/ Detection
Yes
notes: Several antibodies were evaluated for effectiveness in detecting rabbit vWF. Some antibodies detected neither rabbit plasma vWF nor purified human vWF (the putative antigen) in this experimental setup. When the Abcam goat anti-human vWF antibody was used in the sandwich configuration, a donkey anti-goat Igg antibody (novus nB7357) was used as the detection reagent. When the sandwich antibody was biotinylated, Streptavidin-hrP was used as the detection reagent.
Smith et al
122 Biomarker Insights 2010:5
Working dilutions of 100, 50, 25, 12.5, 6.25, 3.13 and 1.56 ng/mL were used in the assay. These dilutions span the concentration range of diluted plasma sam-ples. Rabbit plasma was diluted 1:100 in Blocking Buffer. Following the blocking step, plates were washed three times with Wash Buffer as described above and 100 µL of each standard and sample were added to the plate in duplicate. Blocking Buffer alone was used as a blank. Plates were incubated for 2 hours at RT with agitation.
Plates were then emptied into a sink and washed three times with Wash Buffer as described above. Biotinylated affinity purified goat anti-human vWF was diluted 1:40,000 in PBST-BSA to a final
concentration of 25 ng/mL and 100 µL were added to each well. Plates were sealed and incubated for 1 hour at RT with agitation. After emptying the previous solution and washing, Streptavidin-HRP was diluted 1:100,000 in PBST-BSA to a final concentration of 5 ng/mL and 100 µL were added to each well. Plates were sealed, protected from light and incubated for 1 hour at RT with agitation.
After removing the Streptavidin-HRP solution and washing, 100 µL of the TMB substrate were added to each well. The reaction was stopped after 5 min by addition of 100 µL TMB Stop Solution per well and allowed to equilibrate for 5 min. The underside of the microplate was wiped with 70% ethanol and the plate
Step 1: Coat plate withcapture antibody Step 2: Block plate
Step 3: Addsamples
Step 4: Addbiotinylated
antibody
Step 5: Addstreptavidin-
HRP
Step 6: AddTMB substrate
Step 7: Add stop solutionand read plate
B
B
B
B
vWF
vWF
vWF
vWF
vWF
vWF
vWF
vWF
vWF
vWF
BSA
BSA
BSA
BSABSA
BSA
BSABSABSA
BSA
BSA
BSA
BSA
BSA
BSA
BSA
BSA
BSA
BSABSA
BSABSA
BSA
BSA
SHRP
SHRP
SHRP
SHRP
SHRP
S HR
PS
HR
P
SHRP
BS
A
BSA
BSA
BSA
BSA
BS
A
BSA
BSA
BSA
BS
A
Wash
Wash
Wash
Was
h
Wash
Microplate well
Figure 1. Schematic illustrating the sandwich eLISA procedure.
von Willebrand Factor eLISA
Biomarker Insights 2010:5 123
was read immediately at 450 nm with wavelength correction at 550 nm using a microplate reader.
A linear standard curve was generated using the duplicate blanked readings from the serially diluted protein standard. Samples were interpolated into the standard curve to obtain concentration values. The dynamic range of the standard curve utilized in this assay is 1.56–100 ng/mL. The TMB incubation time was optimized to provide a reading of 1.5 absorbance units for the most concentrated standard.
SpecificityTo test for non-specific signal, control wells containing either Blocking Buffer or human plasma rendered immunodeficient for vWF were incorporated into each assay. In other experiments, wells were also included where rabbit plasma samples were assayed in the absence of either the capture or sandwich antibody.
Minimum Required DilutionMinimum Required Dilution (MRD) is identified when establishing parallelism and is defined as the minimum sample dilution providing optimal accuracy and precision.9 Plasma from six cholesterol-fed rabbits was pooled, subjected to dilutions between 1:6.25 and 1:200 and assayed in quadruplicate. Parallelism was defined as dilution-corrected analyte concentrations varying #20% between dilutions.10 The minimum dilution achieving parallelism was chosen as the MRD.
spike RecoveryCholesterol-fed rabbit plasma was spiked with purified vWF at concentrations of 3.76 ng/mL (Low Spike) and 10 ng/mL (High Spike). Plasma, spikes, and spiked plasma were each assayed in quadruplicate on the same plate. Recovery was calculated using vWF concentration values with the equation: (([Sample+Spike]−[Sample])/[Spike])*100. Brackets denote a concentration value in ng/mL. Standard deviation (SD) was obtained from the two sets of duplicate values. The measured concentration of the spiked sample should be within 20% of the expected value.9
precisionEight plasma samples from cholesterol-fed rabbits were selected. Each sample was diluted 1:100 in
Blocking Buffer and 10 replicates were plated to determine intra-assay precision. This experiment was repeated over three different days with parallel aliquots to evaluate inter-assay precision. We previously assayed parallel aliquots of the samples for plasma total cholesterol (Table 4) using an enzymatic colori-metric kit (Wako Chemicals, Richmond, VA).
sensitivityEighteen serial dilutions of purified vWF were prepared beginning with 400 ng/mL and assayed in quadruplicate, along with 24 replicates of the zero concentration buffer blank. A similar procedure was followed for rabbit plasma. Plasma from six cholesterol-fed rabbits was pooled and subjected to serial dilutions from 1:6.25 to 1:102,000.
Freeze-Thaw stability of samplesFreeze-thaw stability was determined over three freeze-thaw cycles. Three rabbit plasma samples were selected. Separate aliquots of each sample were thawed between 1–3 times by removal from the −70 °C freezer and thawing on ice for #2 hours. They were then returned to the freezer and stored as before. All samples and aliquots were diluted 1:100 and assayed on the same plate, with 6 replicates per aliquot, along with 6 replicates of purified vWF at 100 ng/mL. Any significant changes in assay response were deter-mined using repeated-measures ANOVA followed by Bonferroni adjustment for multiple comparisons.
calculations and AnalysisData are presented as means ± SD. All standards and samples were run in duplicate unless otherwise noted. Data were analyzed using SigmaPlot 10.0 and PASW Statistics 18.0 for Windows, and mean differences were considered statistically significant at the P , 0.05 level.
Results and DiscussionELISA is the most widely used method of screening mammalian plasma for vWF, replacing the Laurell techniques previously used.11 Several publica-tions have utilized the vWF marker specifically in rabbits. De Meyer and coworkers12 utilized immu-nohistochemistry to qualitatively observe deposition of vWF in the vascular intima. The group reported lack of an available measurement method for rabbit
Smith et al
124 Biomarker Insights 2010:5
plasma vWF. An earlier publication by Benson et al13 reported adaptation of an ELISA for measurement of plasma vWF in rabbit and other species, but neither demonstrated quantitative data for rabbits nor used commercially available antibodies. Benson et al did, however, highlight the important ability to construct a vWF assay without species-specific antibodies.
Two subsequent publications attempted to quantify rabbit plasma vWF by sandwich ELISA. The first14 merely reported optical density values obtained in each assay, which is not useful to other researchers. It is commonly known that optical density values vary between assays due to many factors such as activity of the peroxidase conjugate, binding of antigen to antibodies, or temperature conditions, and thus it is critical to include a standard curve in each assay using purified analyte. A second publication15 quantified rab-bit plasma vWF, and found that the marker correlated well with development of atherosclerosis, but pro-vided inadequate detail about the ELISA method utilized. Neither of these two assays was validated. Furthermore, cholesterol feeding elevates blood cho-lesterol to extremely high levels, a potential source of interference in an immunoassay. We developed and validated an ELISA to improve upon previous work.
An assay that appears precise but measures the wrong analyte would not be valid. We confirmed the specificity of the antibodies used by including positive (the purified vWF standard) and negative (vWF defi-cient plasma) controls. Antibodies demonstrated strong affinity for purified vWF. Omission of either the capture or sandwich antibody did not result in any signal above that of the buffer blank. Additionally, when vWF-deficient human plasma was assayed, no signal above blank was seen (data not shown).
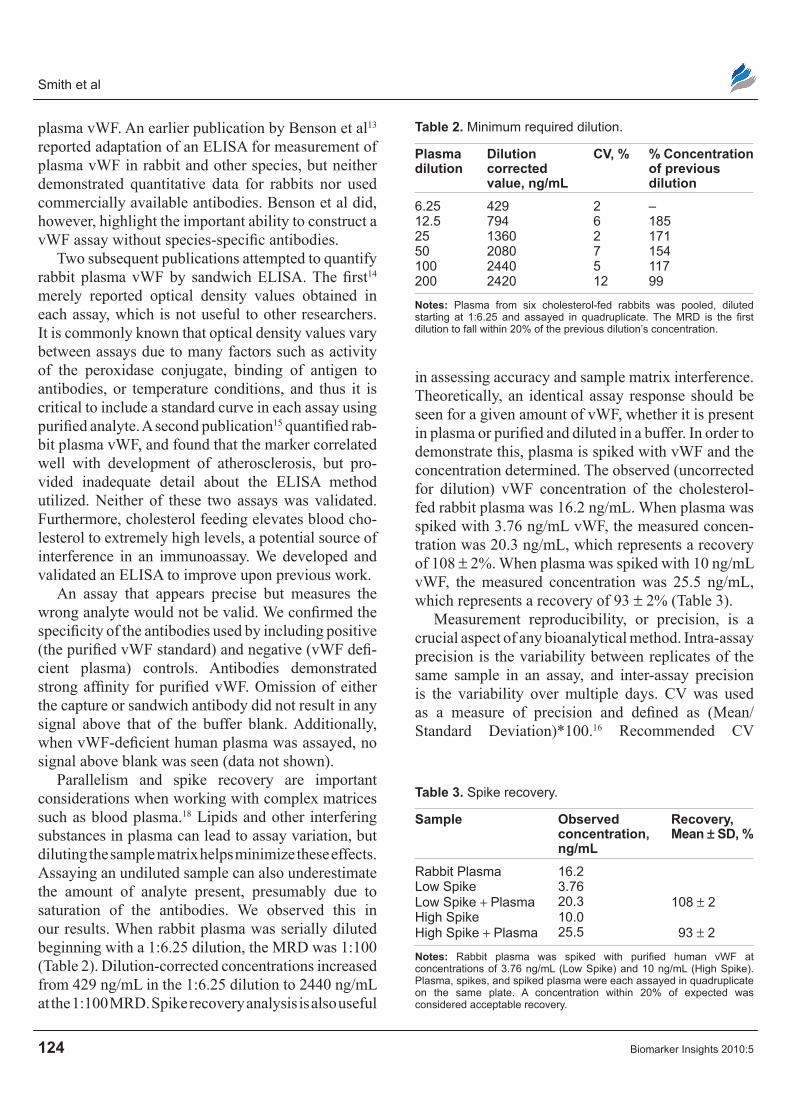
Parallelism and spike recovery are important considerations when working with complex matrices such as blood plasma.18 Lipids and other interfering substances in plasma can lead to assay variation, but diluting the sample matrix helps minimize these effects. Assaying an undiluted sample can also underestimate the amount of analyte present, presumably due to saturation of the antibodies. We observed this in our results. When rabbit plasma was serially diluted beginning with a 1:6.25 dilution, the MRD was 1:100 (Table 2). Dilution-corrected concentrations increased from 429 ng/mL in the 1:6.25 dilution to 2440 ng/mL at the 1:100 MRD. Spike recovery analysis is also useful
in assessing accuracy and sample matrix interference. Theoretically, an identical assay response should be seen for a given amount of vWF, whether it is present in plasma or purified and diluted in a buffer. In order to demonstrate this, plasma is spiked with vWF and the concentration determined. The observed (uncorrected for dilution) vWF concentration of the cholesterol-fed rabbit plasma was 16.2 ng/mL. When plasma was spiked with 3.76 ng/mL vWF, the measured concen-tration was 20.3 ng/mL, which represents a recovery of 108 ± 2%. When plasma was spiked with 10 ng/mL vWF, the measured concentration was 25.5 ng/mL, which represents a recovery of 93 ± 2% (Table 3).
Measurement reproducibility, or precision, is a crucial aspect of any bioanalytical method. Intra-assay precision is the variability between replicates of the same sample in an assay, and inter-assay precision is the variability over multiple days. CV was used as a measure of precision and defined as (Mean/Standard Deviation)*100.16 Recommended CV
Table 2. Minimum required dilution.
plasma dilution
Dilution corrected value, ng/mL
cV, % % concentration of previous dilution
6.25 429 2 –12.5 794 6 18525 1360 2 17150 2080 7 154100 2440 5 117200 2420 12 99
notes: Plasma from six cholesterol-fed rabbits was pooled, diluted starting at 1:6.25 and assayed in quadruplicate. The MRD is the first dilution to fall within 20% of the previous dilution’s concentration.
Table 3. Spike recovery.
sample Observed concentration, ng/mL
Recovery, Mean ± sD, %
rabbit Plasma 16.2Low Spike 3.76Low Spike + Plasma 20.3 108 ± 2high Spike 10.0high Spike + Plasma 25.5 93 ± 2
notes: Rabbit plasma was spiked with purified human vWF at concentrations of 3.76 ng/mL (Low Spike) and 10 ng/mL (high Spike). Plasma, spikes, and spiked plasma were each assayed in quadruplicate on the same plate. A concentration within 20% of expected was considered acceptable recovery.
von Willebrand Factor eLISA
Biomarker Insights 2010:5 125
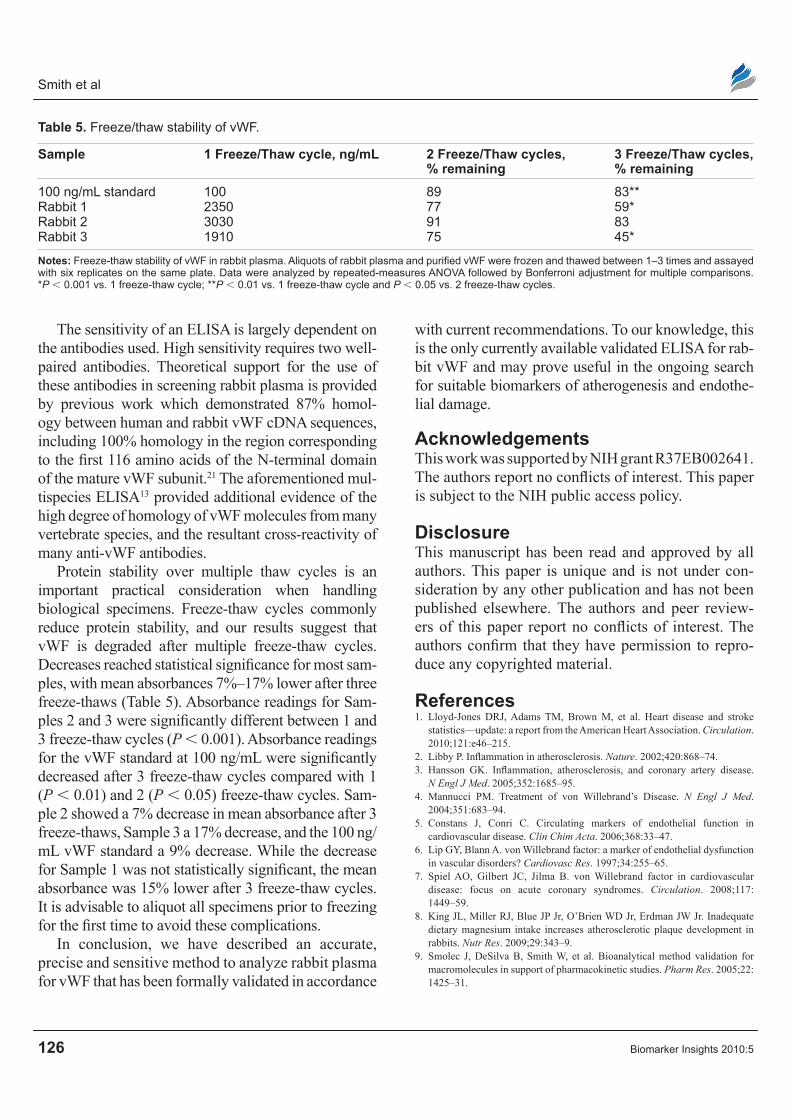
Table 4. Precision.
sample plasma total cholesterol, mg/dL
Mean vWF, ng/mL
Inter- assay sD, ng/mL
Intra- assay cV, %
Inter- assay cV, %
rabbit 1 1100 1730 42 3 2rabbit 2 868 2430 66 4 3rabbit 3 897 3240 153 3 5rabbit 4 950 2290 153 3 7rabbit 5 906 3280 127 2 4rabbit 6 691 2600 68 2 3rabbit 7 1000 2200 130 2 6rabbit 8 1070 2720 77 4 3Average 935 2560 102 3 4
notes: eight plasma samples from cholesterol-fed rabbits were selected. each sample was diluted 1:100 in Blocking Buffer and run with 10 replicates. The experiment was repeated over three different days with parallel aliquots to determine inter-assay precision. Intra-assay cV and vWF values represent means of the three experiments.
for immunoassays is #20% (17, 18). Our average intra-assay CV of 3% is well within this guide-line (Table 4). Measurement of the same 8 plasma samples on three different days yielded an inter-assay CV = 4% (Table 4). Thus, this assay provides precise and reproducible measurements of plasma vWF.
These data also illustrate the excellent selectivity of the assay. Selectivity is commonly defined as the ability of the antibodies to bind consistent amounts of protein in the presence of other interfering agents, such as lipids and plasma matrix components. The antibodies bind both purified human vWF and rabbit vWF in plasma with equally high precision, despite potential interference from an average total cholesterol level of 935 mg/dL in the 8 rabbit plasma samples used (Table 4). It is recommended to estab-lish and confirm selectivity of an immunoassay in dis-ease states,18 however this is rarely done. Our assay is effective in atherosclerotic, hyperlipidemic animals.
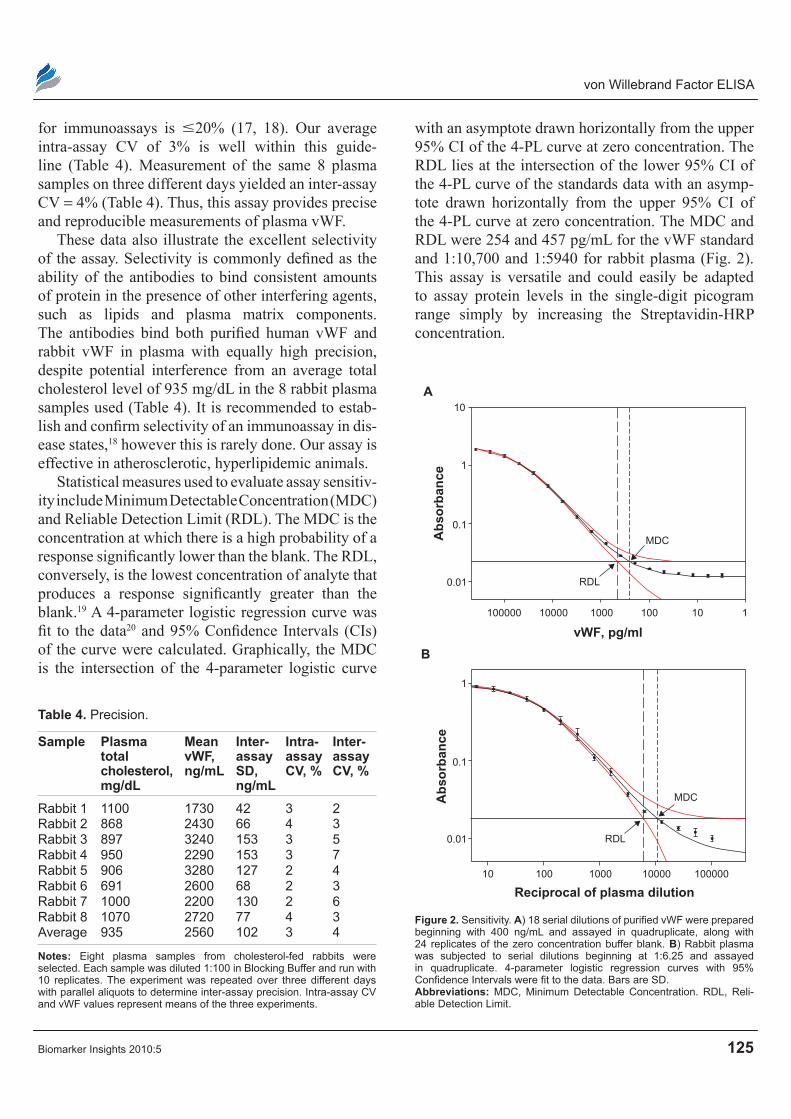
Statistical measures used to evaluate assay sensitiv-ity include Minimum Detectable Concentration (MDC) and Reliable Detection Limit (RDL). The MDC is the concentration at which there is a high probability of a response significantly lower than the blank. The RDL, conversely, is the lowest concentration of analyte that produces a response significantly greater than the blank.19 A 4-parameter logistic regression curve was fit to the data20 and 95% Confidence Intervals (CIs) of the curve were calculated. Graphically, the MDC is the intersection of the 4- parameter logistic curve
A
Ab
sorb
ance
vWF, pg/ml
10
1
0.1
0.01
100000 10000 1000 100 10 1
RDL
MDC
B
Ab
sorb
ance
Reciprocal of plasma dilution
1
0.1
0.01
10 100 1000 10000 100000
RDL
MDC
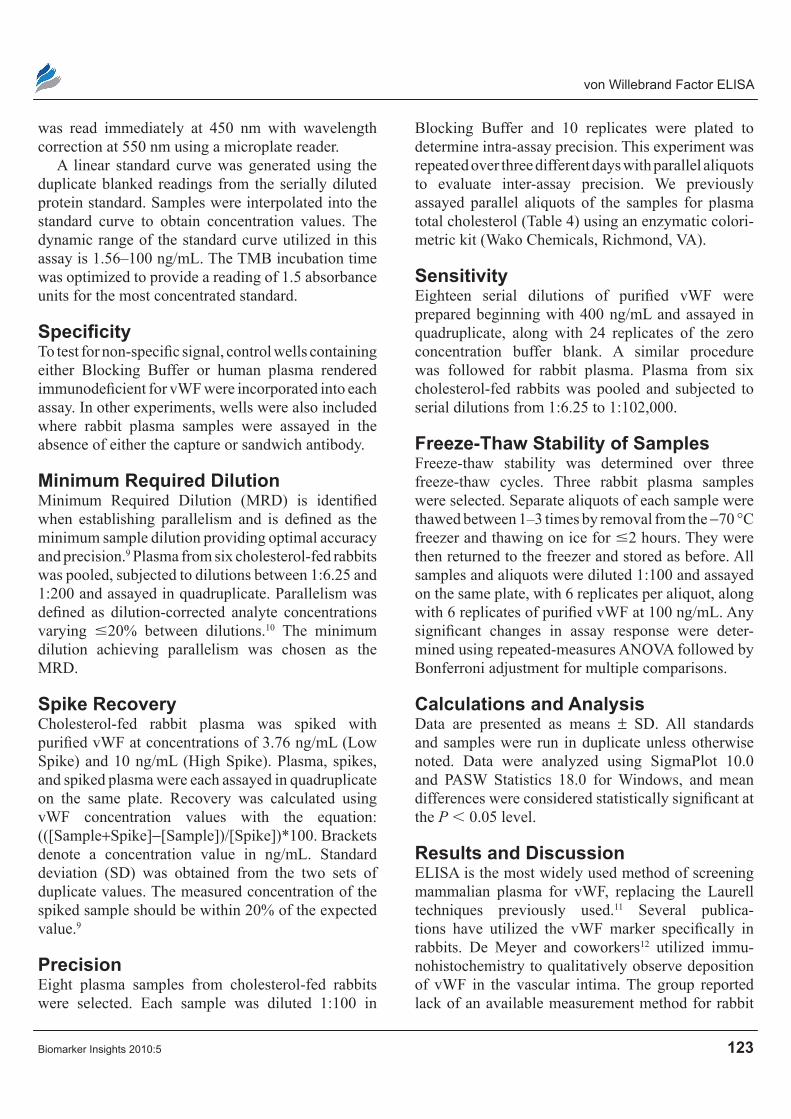
Figure 2. Sensitivity. A) 18 serial dilutions of purified vWF were prepared beginning with 400 ng/mL and assayed in quadruplicate, along with 24 replicates of the zero concentration buffer blank. B) rabbit plasma was subjected to serial dilutions beginning at 1:6.25 and assayed in quadruplicate. 4-parameter logistic regression curves with 95% Confidence Intervals were fit to the data. Bars are SD. Abbreviations: MDc, Minimum Detectable concentration. rDL, reli-able Detection Limit.
with an asymptote drawn horizontally from the upper 95% CI of the 4-PL curve at zero concentration. The RDL lies at the intersection of the lower 95% CI of the 4-PL curve of the standards data with an asymp-tote drawn horizontally from the upper 95% CI of the 4-PL curve at zero concentration. The MDC and RDL were 254 and 457 pg/mL for the vWF standard and 1:10,700 and 1:5940 for rabbit plasma (Fig. 2). This assay is versatile and could easily be adapted to assay protein levels in the single-digit picogram range simply by increasing the Streptavidin-HRP concentration.
Smith et al
126 Biomarker Insights 2010:5
The sensitivity of an ELISA is largely dependent on the antibodies used. High sensitivity requires two well-paired antibodies. Theoretical support for the use of these antibodies in screening rabbit plasma is provided by previous work which demonstrated 87% homol-ogy between human and rabbit vWF cDNA sequences, including 100% homology in the region corresponding to the first 116 amino acids of the N-terminal domain of the mature vWF subunit.21 The aforementioned mul-tispecies ELISA13 provided additional evidence of the high degree of homology of vWF molecules from many vertebrate species, and the resultant cross-reactivity of many anti-vWF antibodies.
Protein stability over multiple thaw cycles is an important practical consideration when handling biological specimens. Freeze-thaw cycles commonly reduce protein stability, and our results suggest that vWF is degraded after multiple freeze-thaw cycles. Decreases reached statistical significance for most sam-ples, with mean absorbances 7%–17% lower after three freeze-thaws (Table 5). Absorbance readings for Sam-ples 2 and 3 were significantly different between 1 and 3 freeze-thaw cycles (P , 0.001). Absorbance readings for the vWF standard at 100 ng/mL were significantly decreased after 3 freeze-thaw cycles compared with 1 (P , 0.01) and 2 (P , 0.05) freeze-thaw cycles. Sam-ple 2 showed a 7% decrease in mean absorbance after 3 freeze-thaws, Sample 3 a 17% decrease, and the 100 ng/mL vWF standard a 9% decrease. While the decrease for Sample 1 was not statistically significant, the mean absorbance was 15% lower after 3 freeze-thaw cycles. It is advisable to aliquot all specimens prior to freezing for the first time to avoid these complications.
In conclusion, we have described an accurate, precise and sensitive method to analyze rabbit plasma for vWF that has been formally validated in accordance
with current recommendations. To our knowledge, this is the only currently available validated ELISA for rab-bit vWF and may prove useful in the ongoing search for suitable biomarkers of atherogenesis and endothe-lial damage.
AcknowledgementsThis work was supported by NIH grant R37EB002641. The authors report no conflicts of interest. This paper is subject to the NIH public access policy.
DisclosureThis manuscript has been read and approved by all authors. This paper is unique and is not under con-sideration by any other publication and has not been published elsewhere. The authors and peer review-ers of this paper report no conflicts of interest. The authors confirm that they have permission to repro-duce any copyrighted material.
References1. Lloyd-Jones DRJ, Adams TM, Brown M, et al. Heart disease and stroke
statistics—update: a report from the American Heart Association. Circulation. 2010;121:e46–215.
2. Libby P. Inflammation in atherosclerosis. Nature. 2002;420:868–74.3. Hansson GK. Inflammation, atherosclerosis, and coronary artery disease.
N Engl J Med. 2005;352:1685–95.4. Mannucci PM. Treatment of von Willebrand’s Disease. N Engl J Med.
2004;351:683–94.5. Constans J, Conri C. Circulating markers of endothelial function in
cardiovascular disease. Clin Chim Acta. 2006;368:33–47.6. Lip GY, Blann A. von Willebrand factor: a marker of endothelial dysfunction
in vascular disorders? Cardiovasc Res. 1997;34:255–65.7. Spiel AO, Gilbert JC, Jilma B. von Willebrand factor in cardiovascular
disease: focus on acute coronary syndromes. Circulation. 2008;117: 1449–59.
8. King JL, Miller RJ, Blue JP Jr, O’Brien WD Jr, Erdman JW Jr. Inadequate dietary magnesium intake increases atherosclerotic plaque development in rabbits. Nutr Res. 2009;29:343–9.
9. Smolec J, DeSilva B, Smith W, et al. Bioanalytical method validation for macromolecules in support of pharmacokinetic studies. Pharm Res. 2005;22: 1425–31.
Table 5. Freeze/thaw stability of vWF.
sample 1 Freeze/Thaw cycle, ng/mL 2 Freeze/Thaw cycles, % remaining
3 Freeze/Thaw cycles, % remaining
100 ng/mL standard 100 89 83**rabbit 1 2350 77 59*rabbit 2 3030 91 83rabbit 3 1910 75 45*
notes: Freeze-thaw stability of vWF in rabbit plasma. Aliquots of rabbit plasma and purified vWF were frozen and thawed between 1–3 times and assayed with six replicates on the same plate. Data were analyzed by repeated-measures AnOVA followed by Bonferroni adjustment for multiple comparisons. *P , 0.001 vs. 1 freeze-thaw cycle; **P , 0.01 vs. 1 freeze-thaw cycle and P , 0.05 vs. 2 freeze-thaw cycles.
publish with Libertas Academica and every scientist working in your field can
read your article
“I would like to say that this is the most author-friendly editing process I have experienced in over 150
publications. Thank you most sincerely.”
“The communication between your staff and me has been terrific. Whenever progress is made with the manuscript, I receive notice. Quite honestly, I’ve never had such complete communication with a
journal.”
“LA is different, and hopefully represents a kind of scientific publication machinery that removes the
hurdles from free flow of scientific thought.”
Your paper will be:• Available to your entire community
free of charge• Fairly and quickly peer reviewed• Yours! You retain copyright
http://www.la-press.com
von Willebrand Factor eLISA
Biomarker Insights 2010:5 127
10. Findlay JW, Smith WC, Lee JW, et al. Validation of immunoassays for bioanalysis: a pharmaceutical industry perspective. J Pharm Biomed Anal. 2000;21:1249–73.
11. Bartlett A, Dormandy KM, Hawkey CM, Stableforth P, Voller A. Factor-VIII-related antigen: measurement by enzyme immunoassay. Br Med J. 1976;1:994–6.
12. de Meyer GR, Hoylaerts MF, Kockx MM, Yamamoto H, Herman AG, Bult H. Intimal deposition of functional von Willebrand factor in atherogen-esis. Arterioscler Thromb Vasc Biol. 1999;19:2524–34.
13. Benson RE, Catalfamo JL, Dodds WJ. A multispecies enzyme-linked immunosorbent assay for von Willebrand’s factor. J Lab Clin Med. 1992; 119:420–7.
14. Ghayour-Mobarhan M, Lamb DJ, Tavallaie S, Ferns GA. Relationship between plasma cholesterol, von Willebrand factor concentrations, extent of atherosclerosis and antibody titres to heat shock proteins-60, -65 and -70 in cholesterol-fed rabbits. Int J Exp Pathol. 2007;88:249–55.
15. Haghjooyjavanmard S, Nematbakhsh M, Monajemi A, Soleimani M. von Willebrand factor, C-reactive protein, nitric oxide, and vascular endothelial growth factor in a dietary reversal model of hypercholesterolemia in rabbit. Biomed Pap Med Fac Univ Palacky Olomouc Czech Repub. 2008; 152:91–5.
16. Reed GF, Lynn F, Meade BD. Use of coefficient of variation in assessing variability of quantitative assays. Clin Diagn Lab Immunol. 2002;9: 1235–9.
17. FDA. Guidance for Industry: Bioanalytical Method Validation. 2001. 18. DeSilva B, Smith W, Weiner R, et al. Recommendations for the bioanalytical
method validation of ligand-binding assays to support pharmacokinetic assessments of macromolecules. Pharm Res. 2003;20:1885–900.
19. O’Connell MA, Belanger BA, Haaland PD. Calibration and assay development using the four-parameter logistic model. Chemom Intell Lab Syst. 1993;20:97–114.
20. Findlay JW, Dillard RF. Appropriate calibration curve fitting in ligand binding assays. AAPS J. 2007;9:E260–7.
21. Lavergne JM, Piao YC, Ferreira V, Kerbiriou-Nabias D, Bahnak BR, Meyer D. Primary structure of the factor VIII binding domain of human, porcine and rabbit von Willebrand factor. Biochem Biophys Res Commun. 1993;194:1019–24.