Embed Size (px)
Citation preview
HAL Id: hal-02417284https://hal.archives-ouvertes.fr/hal-02417284
Submitted on 18 Dec 2019
HAL is a multi-disciplinary open accessarchive for the deposit and dissemination of sci-entific research documents, whether they are pub-lished or not. The documents may come fromteaching and research institutions in France orabroad, or from public or private research centers.
L’archive ouverte pluridisciplinaire HAL, estdestinée au dépôt et à la diffusion de documentsscientifiques de niveau recherche, publiés ou non,émanant des établissements d’enseignement et derecherche français ou étrangers, des laboratoirespublics ou privés.
Validated analytical method to determine new salivarylipid peroxidation compounds as potential
neurodegenerative biomarkersCarmen Peña-Bautista, Paula Carrascosa-Marco, Camille Oger, Claire Vigor,
Jean-Marie Galano, Thierry Durand, Miguel Baquero, MarinaLópez-Nogueroles, Máximo Vento, Ana García-Blanco, et al.
To cite this version:Carmen Peña-Bautista, Paula Carrascosa-Marco, Camille Oger, Claire Vigor, Jean-Marie Galano, etal.. Validated analytical method to determine new salivary lipid peroxidation compounds as potentialneurodegenerative biomarkers. Journal of Pharmaceutical and Biomedical Analysis, Elsevier, 2019,164, pp.742-749. �10.1016/j.jpba.2018.11.043�. �hal-02417284�

KLsILM
1
apb[isctp
A
m
Validated analytical method to determine new salivary lipid peroxidation compounds as potential neurodegenerative biomarkersCarmen Pe na-Bautista a, Paula Carrascosa-Marco a, Camille Oger b, Claire Vigor b,Jean-Marie Galano b, Thierry Durand b, Miguel Baquero c, Marina López-Nogueroles d,Máximo Vento a, Ana García-Blanco a,∗, Consuelo Cháfer-Pericás a,∗a Neonatal Research Unit, Health Research Institute La Fe, Valencia, Spainb Institut des Biomolécules Max Mousseron (IBMM), UMR 5247 - CNRS - University of Montpellier - ENSCM, Faculty of Pharmacy, Montpellier, Francec Neurology Unit, University and Polytechnic Hospital La Fe, Valencia, Spaind Analytical Unit Platform, Health Research Institute La Fe, Valencia, Spain
eywords:iquid-liquid microextractionaliva
a b s t r a c t
Lipid peroxidation is closely related to neurodegenerative diseases since brain shows high lipid com-position and oxygen consumption. The determination of lipid peroxidation compounds in non-invasive biological samples would help to monitor the patients’ oxidative stress status. A new analytical method based on ultrasound-assisted liquid-liquid semi-microextraction (UA-LLsME) followed by Ultra Perfor-mance Liquid Chromatography coupled to tandem Mass Spectrometry was developed to determine 18 lipid peroxidation biomarkers in saliva samples. The variables affecting the UA-LLsME efficiency were systematically studied. Under the optimum conditions, the methodology was validated and showed high-throughput, high sensitivity (limits of detection 0.02-2 nmol L−1), and satisfactory precision (coef-ficients of variation 2–11% (intra-day) and 5–12% (inter-day)). The reliability of the described method was assessed analysing spiked saliva samples, and the recoveries were between 80% and 120% for most of the analytes. Then, the method suitability was demonstrated by analysing saliva samples (n = 30) from elderly people with neurodegenerative diseases. To conclude, the new developed analytical method is a useful tool to determine salivary lipid peroxidation compounds as potential biomarkers in further clinical studies in which oxidative stress plays an important role.
soprostanesipid peroxidationass spectrometry
. Introduction
Oxidative stress is a physiological process that increases withging and under some pathological conditions [1]. Specifically, lipideroxidation is closely related to neurodegenerative diseases sincerain shows high oxygen consumption and high lipid composition2,3]. Although blood is considered the best biofluid to evaluatet at systemic level, the employment of non-invasively obtainedamples would help to monitor the oxidation status [4]. So saliva isonsidered a promising matrix in clinical studies [5]. In this sense,
he validation of an analytical method to determine some lipideroxidation biomarkers in saliva samples is required.∗ Corresponding authors at: Health Research Institute La Fe, Avda de Fernando bril Martorell, 106, 46026 Valencia, Spain.
E-mail addresses: [email protected] (A. García-Blanco),[email protected] (C. Cháfer-Pericás).
Recent studies have used saliva sample to determine oxidativestress biomarkers related to some systemic diseases [6,7]. The clin-ical relevancy of saliva is based on the fact that its components canbe found in plasma [8,9]. However, salivary compounds levels maybe altered by circadian rhythm and oral conditions [10,11], and fewcorrelation studies between blood and saliva levels can be found inliterature [12,13].
Some analytical methods have been developed to study sali-vary oxidative stress biomarkers (glutathione peroxidase, catalase,protein carbonyls, 8-hydroxy-2’-deoxyguanosine), but few of themdetermined lipid peroxidation compounds, such as malondialde-hyde (MDA) [14–16], and prostanoids (e.g. 15-F2t-IsoP) [10]. Ingeneral, these methods are based on colorimetric assays andimmunoassays [4,17–19], but also liquid chromatography (LC) cou-pled to mass spectrometry (MS) [10,20], or fluorescence detection
methods [18] are used. Nevertheless, they have not been validated,so there is a lack of reliable analytical methods.Suitable saliva sample treatment is crucial in order to obtainan analytical method with satisfactory sensitivity and selectiv-

Table 1Demographic and clinical characteristics of the studied population (n = 30).
Age (years) 69 ± 6
Gender (female, n (%)) 18 (53 %)
Studies level (n (%))
Basic 11 (32%)Primary 8 (24%)Secondary 6 (18%)Academic 9 (26%)
Alcohol consumption (Yes, n (%)) 5 (15 %)
Smoking status (n (%))Yes 7 (21%)Former smoker (more than 10 years) 5 (15%)
Medications (n, (%))
Antiaggregants 1 (3%)Corticoids 1 (3%)Acetyl cholinesterase inhibitors 4 (12%)Two or more 10 (29%)Psychotropic drugs 2 (6%)Others 7 (21%)None 9 (26%)
Depression (Yes, n (%)) 4 (12%)
Comorbidity (n (%))
None 7 (205%)Dyslipidaemia 4 (12%)Arterial hypertension 7 (205%)Heart disease 1 (3%)Two or more 10 (20%)Others 5 (15%)
Leukocytes (x103 cells mm−3) 7.08 ± 2.29Lymphocytes (x103 cells mm−3) 2.49 ± 1.26
DC
i(wptd[tewb
toacmvp
2
2
eAvpat(i
(stf
previous work with new-borns’ saliva samples [31]. First, 150 �L of
ata are expressed as mean ± standard deviation, or number of cases (percentages).SF: cerebrospinal fluid sample.
ty. Among potential techniques, the liquid–liquid microextractionLLME) allows simultaneous pre-concentration and clean-up steps,ith the advantages of low solvent volume consumption, sim-
licity, and low cost. Nevertheless, few works have applied thisechnique to saliva samples [21]. The main LLME modes are single-rop microextraction [21], hollow-fiber liquid microextraction22], and dispersive liquid-liquid microextraction [23]. However,heir disadvantages are drop instability, solvents toxicity and non-xhaustive extractions. Recent efforts to solve these drawbacksere based on ultrasound, vortex or salt assisted extraction [24,25],
ut they have not been applied to saliva samples.In this work, we have developed a reliable analytical method
o determine a new set of salivary compounds reflecting lipid per-xidation. For this, a new sample treatment based on ultrasound-ssisted liquid-liquid semimicroextraction (UA-LLsME) and theonditions for ultra-performance liquid chromatography-tandemass spectrometry (UPLC-MS/MS) were optimized. Therefore, this
alidated analytical method would constitute a useful tool for lipideroxidation evaluation in further clinical studies.
. Materials and methods
.1. Samples collection, and storage
Saliva samples from participants diagnosed with neurodegen-rative diseases (frontotemporal dementia, vascular dementia,lzheimer’s disease) (n = 30) were taken at the Neurology Unit (Uni-ersity and Polytechnic Hospital La Fe, Valencia (Spain)) [26]. Thearticipants were between 50 and 75 years old. The study protocolnd informed consent from all the participants were approved byhe Ethics Committee (CEIC) at the Health Research Institute La FeValencia). Table 1 shows the demographic and clinical character-stics of participants.
Saliva samples were collected by spitting into sterile bottlesbetween 10 and 12 a.m.). Participants rinsed their mouth before
aliva collection. Then, the samples were aliquoted into 1.5 mLubes, and those with visible blood contamination were excludedrom the study. Finally, samples were stored at -80 ◦C until analysis.2.2. Reagents
Some compounds were acquired from Cayman ChemicalCompany (Ann Arbor, Michigan, USA) (PGE2, PGF2�, 1a,1b-dihomo-PGF2�, 5-F2t-IsoP, 15-E2t-IsoP, 15-F2t-IsoP, 15-keto-15-E2t-IsoP,15-keto-15-F2t-IsoP, 15(R)-15-F2t-IsoP, 2,3-dinor-15-epi-15-F2t-IsoP, PGF2�-D4) and used as analytes, as in a previous study[27]. Other compounds nor available commercially were synthe-sized ((4(RS)-F4t-NeuroP, 7(RS)-ST-�8-11-dihomo-IsoF, Ent-7(RS)-7-F2t-dihomo-IsoP, 10-epi-10-F4t-NeuroP, 14(RS)-14-F4t-NeuroP,17-epi-17-F2t-dihomo-IsoP, 17-F2t-dihomo-IsoP, 17(RS)-10-epi-SC-�15-11-dihomo-IsoF, D4-10-epi-10-F4t-NeuroP) [28], and theywere used as analytes, as in previous studies [29,30].
Methanol (CH3OH, HPLC grade), acetonitrile (CH3CN, HPLCgrade), and glacial acetic acid were from J.T. Baker (Avantor Perfor-mance Materials B.V., The Netherlands). Ethyl acetate (analyticalgrade) was from Panreac (Barcelona, Spain). Protein assay kit(Pierce
TMBCA) was purchased from Thermo Scientific (Rockford,
USA).
2.3. Solutions
Stock standard solutions of each compound were prepared at1 mmol L−1 in H2O (CH3COOH 0.01%, v/v):CH3OH (85:15 v/v).A mix working solution was prepared in H2O (CH3COOH 0.01%,v/v):CH3OH (85:15 v/v) (2.5 �mol L−1 each analyte). The calibrationcurves were prepared in H2O (CH3COOH 0.01%, v/v):CH3OH (85:15v/v) (0.004 nmol l-1 - 300 nmol L−1, each analyte) as described in aprevious work [29].
2.4. Materials
The ultrasonic bath (Sonorex Digitec) was from Bandelin (Berlin,Germany), the centrifuge (multiSPIN) from Cleaver Scientific Ltd.(Warwickshire, United Kingdom), and the vortex mixer from VelpScientifica (Usmate, Italy). The thermomixer HLC was from Ditabis(Pforzheim, Germany), the speed vacuum concentrator (mi Vac)from Genevac LTD (Ipswich, United Kingdom), and the spectropho-tometer (Halo LED 96) from Dynamica Scientific Ltd. (London,United Kingdom).
2.5. UPLC-MS/MS chromatographic system
The chromatographic system used consisted of an Acquity UPLCsystem coupled to a Xevo TQ-S mass spectrometer (MS) (Waters,UK). The MS detector consisted of an electrospray ionization sourceworking in the negative mode (ESI-) and multiple reaction mon-itoring (MRM) mode. The UPLC-MS/MS system conditions weredescribed in a previous work [30]. Briefly, the LC conditions werean Acquity UPLC BEH C18 column, H2O and CH3CN with 0.01% v/vCH3COOH as mobile phases, 55 ◦C and 4 ◦C as column and autosam-pler temperatures, 8 �L as injection volume, and 0.45 mL min−1
as flow rate; and the detection conditions were 2.0 kV as capillaryvoltage, 150 ◦C and 395 ◦C as source and desolvation temperatures,150 L h−1and 800 L h-1 as nitrogen cone and desolvation gas flows,and 10 ms as dwell time.
2.6. Saliva sample treatment
Saliva samples were thawed on ice, homogenized and cen-trifuged at 3500 g (10 min, 4 ◦C) in order to determine analytes insupernatant. The saliva sample treatment was optimized from a
saliva sample were diluted with 450 �L of H2O (0.01% (v/v) aceticacid), and 5 �L of internal standard (IS) solution (PGF2�-D4 2 �molL−1 and D4-10-epi-10-F4t-NeroP 1.2 �mol L−1) were added to each
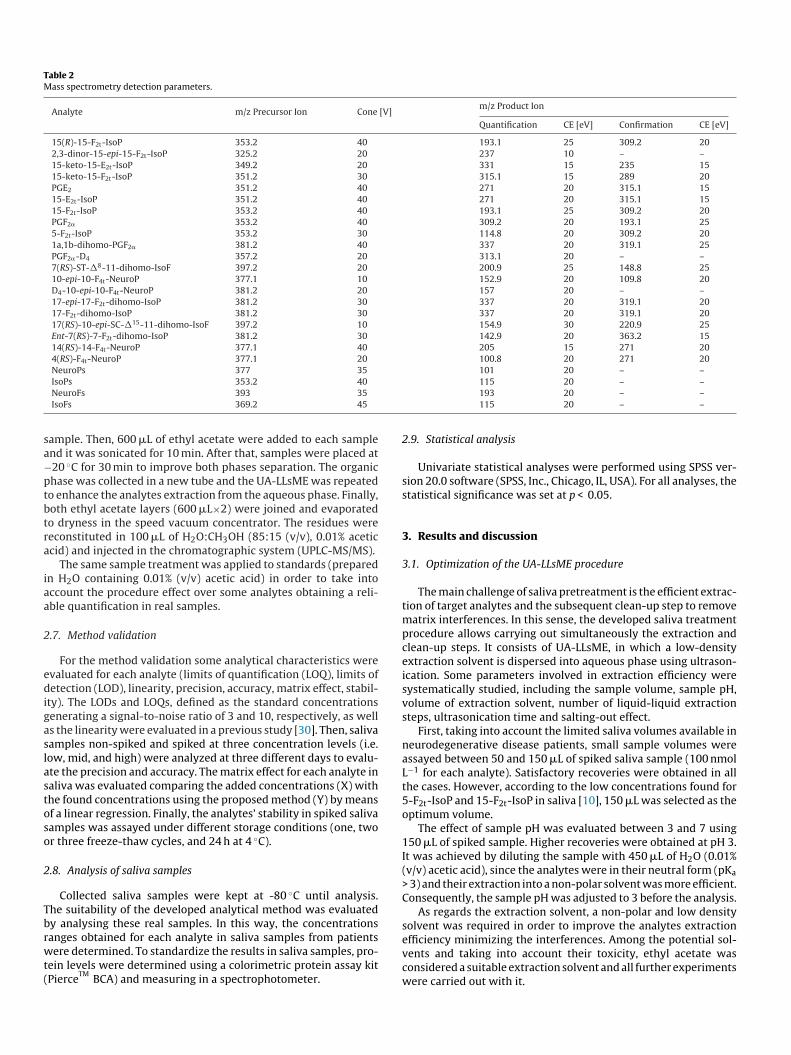
Table 2Mass spectrometry detection parameters.
Analyte m/z Precursor Ion Cone [V]m/z Product Ion
Quantification CE [eV] Confirmation CE [eV]
15(R)-15-F2t-IsoP 353.2 40 193.1 25 309.2 202,3-dinor-15-epi-15-F2t-IsoP 325.2 20 237 10 – –15-keto-15-E2t-IsoP 349.2 20 331 15 235 1515-keto-15-F2t-IsoP 351.2 30 315.1 15 289 20PGE2 351.2 40 271 20 315.1 1515-E2t-IsoP 351.2 40 271 20 315.1 1515-F2t-IsoP 353.2 40 193.1 25 309.2 20PGF2� 353.2 40 309.2 20 193.1 255-F2t-IsoP 353.2 30 114.8 20 309.2 201a,1b-dihomo-PGF2� 381.2 40 337 20 319.1 25PGF2�-D4 357.2 20 313.1 20 – –7(RS)-ST-�8-11-dihomo-IsoF 397.2 20 200.9 25 148.8 2510-epi-10-F4t-NeuroP 377.1 10 152.9 20 109.8 20D4-10-epi-10-F4t-NeuroP 381.2 20 157 20 – –17-epi-17-F2t-dihomo-IsoP 381.2 30 337 20 319.1 2017-F2t-dihomo-IsoP 381.2 30 337 20 319.1 2017(RS)-10-epi-SC-�15-11-dihomo-IsoF 397.2 10 154.9 30 220.9 25Ent-7(RS)-7-F2t-dihomo-IsoP 381.2 30 142.9 20 363.2 1514(RS)-14-F4t-NeuroP 377.1 40 205 15 271 204(RS)-F4t-NeuroP 377.1 20 100.8 20 271 20NeuroPs 377 35 101 20 – –
sa−ptbtra
iaa
2
edigaslastoso
2
Tbrwt(
IsoPs 353.2 40NeuroFs 393 35IsoFs 369.2 45
ample. Then, 600 �L of ethyl acetate were added to each samplend it was sonicated for 10 min. After that, samples were placed at20 ◦C for 30 min to improve both phases separation. The organichase was collected in a new tube and the UA-LLsME was repeatedo enhance the analytes extraction from the aqueous phase. Finally,oth ethyl acetate layers (600 �L×2) were joined and evaporatedo dryness in the speed vacuum concentrator. The residues wereeconstituted in 100 �L of H2O:CH3OH (85:15 (v/v), 0.01% aceticcid) and injected in the chromatographic system (UPLC-MS/MS).
The same sample treatment was applied to standards (preparedn H2O containing 0.01% (v/v) acetic acid) in order to take intoccount the procedure effect over some analytes obtaining a reli-ble quantification in real samples.
.7. Method validation
For the method validation some analytical characteristics werevaluated for each analyte (limits of quantification (LOQ), limits ofetection (LOD), linearity, precision, accuracy, matrix effect, stabil-
ty). The LODs and LOQs, defined as the standard concentrationsenerating a signal-to-noise ratio of 3 and 10, respectively, as wells the linearity were evaluated in a previous study [30]. Then, salivaamples non-spiked and spiked at three concentration levels (i.e.ow, mid, and high) were analyzed at three different days to evalu-te the precision and accuracy. The matrix effect for each analyte inaliva was evaluated comparing the added concentrations (X) withhe found concentrations using the proposed method (Y) by meansf a linear regression. Finally, the analytes’ stability in spiked salivaamples was assayed under different storage conditions (one, twor three freeze-thaw cycles, and 24 h at 4 ◦C).
.8. Analysis of saliva samples
Collected saliva samples were kept at -80 ◦C until analysis.he suitability of the developed analytical method was evaluatedy analysing these real samples. In this way, the concentrations
anges obtained for each analyte in saliva samples from patientsere determined. To standardize the results in saliva samples, pro-ein levels were determined using a colorimetric protein assay kitPierce
TMBCA) and measuring in a spectrophotometer.
115 20 – –193 20 – –115 20 – –
2.9. Statistical analysis
Univariate statistical analyses were performed using SPSS ver-sion 20.0 software (SPSS, Inc., Chicago, IL, USA). For all analyses, thestatistical significance was set at p < 0.05.
3. Results and discussion
3.1. Optimization of the UA-LLsME procedure
The main challenge of saliva pretreatment is the efficient extrac-tion of target analytes and the subsequent clean-up step to removematrix interferences. In this sense, the developed saliva treatmentprocedure allows carrying out simultaneously the extraction andclean-up steps. It consists of UA-LLsME, in which a low-densityextraction solvent is dispersed into aqueous phase using ultrason-ication. Some parameters involved in extraction efficiency weresystematically studied, including the sample volume, sample pH,volume of extraction solvent, number of liquid-liquid extractionsteps, ultrasonication time and salting-out effect.
First, taking into account the limited saliva volumes available inneurodegenerative disease patients, small sample volumes wereassayed between 50 and 150 �L of spiked saliva sample (100 nmolL−1 for each analyte). Satisfactory recoveries were obtained in allthe cases. However, according to the low concentrations found for5-F2t-IsoP and 15-F2t-IsoP in saliva [10], 150 �L was selected as theoptimum volume.
The effect of sample pH was evaluated between 3 and 7 using150 �L of spiked sample. Higher recoveries were obtained at pH 3.It was achieved by diluting the sample with 450 �L of H2O (0.01%(v/v) acetic acid), since the analytes were in their neutral form (pKa
> 3) and their extraction into a non-polar solvent was more efficient.Consequently, the sample pH was adjusted to 3 before the analysis.
As regards the extraction solvent, a non-polar and low densitysolvent was required in order to improve the analytes extraction
efficiency minimizing the interferences. Among the potential sol-vents and taking into account their toxicity, ethyl acetate wasconsidered a suitable extraction solvent and all further experimentswere carried out with it.
e UPL
((s1f(s
uiuTe
ctrs
1
Fig. 1. Chromatograms (MRM transition used for quantification) obtained by th
After that, the influence of the extraction solvent volume600–1200 �L) and the number of liquid-liquid extraction steps1–2) were evaluated simultaneously. For this, 150 �L of spikedaliva (100 nmol L−1 of each compound), adjusted to pH 3, and0 min of sonication were used. Recoveries were close to 100%or most of the analytes by means of two LLE steps and 1200 �L2 × 600 �L) of ethyl acetate, therefore these conditions wereelected as optimum.
Different sonication times in the 1–15 min interval were testednder the previous selected conditions. In general, all the analytes
ncreased their analytical signal by extending the sonication timep to 10 min, little improvement was observed for longer times.herefore, a sonication time of 10 min was set for each liquid-liquidxtraction step.
Finally, the salting out effect was assayed by adding a sodiumhloride solution (2 mol L−1) to the aqueous phase to improvehe analytes extraction into the organic phase [32]. Nevertheless,
ecoveries were similar to those obtained without the salt addition,o it was not added in further experimental work.In summary, the optimum saliva treatment conditions were50 �L of sample volume, adjusted at pH 3, a two-step liquid-
C-MS/MS method for a mix standard solution of 100 nmol L−1 of each analyte.
liquid extraction with 2 × 600 �L of ethyl acetate as extractionsolvent total volume, and 10 min of sonication time. Under opti-mized conditions, the extraction yield was considered quantitativefor most of the analytes, with recoveries ranging from 80 to120%.
As regards the sample treatment effect over analytes instandards prepared in H2O (0.01% (v/v) acetic acid), a signifi-cant signal increase was observed for 17-epi-17-F2t-dihomo-IsoP,17-F2t-dihomo-IsoP, 17(RS)-10-epi-SC-�15-11-dihomo-IsoF and1a,1b-dihomo-PGF2�. Probably, these analytes which are charac-terized by higher m/z parent ion could experiment a significantenhancement of ionization under the higher concentration ofacetate ions provided by sample treatment [33]. Therefore, theconcentrations of these analytes in saliva samples were quantifiedusing the calibration equations obtained with standard solutionssubjected to the same sample treatment.
3.2. Optimization of the UPLC-MS/MS conditions
Transitions, cone voltages, and collision energies for thedetection were automatically tuned for each analyte using the

Table 3Analytical characteristics of the UPLC-MS/MS developed method.
AnalyteLinearity LODc
(nmol L−1)LOQc
(nmol L−1)Retention timea
(min)Linear interval(nmol L−1)
Calibration equationb y = a+bx
2,3-dinor-15-epi-15-F2t-IsoP 3.093 ± 0.004 0.07-150 a ± sa = 1.04 ± 0.8; b ± sb = 1.41 ± 0.01R2 = 0.999 (n = 10)
0.02 0.07
15-keto-15-F2t-IsoP 4.631 ± 0.003 0.14-150 a ± sa= -12.469 ± 9.613; b ± sb = 2.247 ± 0.149R2 = 0.990 (n = 8)
0.05 0.14
15(R)-15-F2t-IsoP 4.263 ± 0.004 0.07-150 a ± sa = 0.284 ± 0.334; b ± sb = 0.913 ± 0.005R2 = 0.999 (n = 10)
0.02 0.07
15-keto-15-E2t-IsoP 5.254 ± 0.005 0.28-150 a ± sa = 0.075 ± 0.185; b ± sb = 1.205 ± 0.003R2 = 0.999 (n = 8)
0.1 0.3
PGE2 4.957 ± 0.004 0.28-150 a ± sa= -0.912 ± 0.570; b ± sb = 1.442 ± 0.009R2 = 0.999 (n = 8)
0.1 0.3
15-E2t-IsoP 4.876 ± 0.003 0.28-150 a ± sa= -0.643 ± 0.4; b ± sb = 1.794 ± 0.005R2 = 0.999 (n = 8)
0.1 0.3
15-F2t-IsoP 4.34 ± 0.01 0.07-150 a ± sa = 167.37 ± 38.68; b ± sb = 18.56 ± 0.33R2 = 0.998 (n = 10)
0.02 0.07
PGF2� 4.816 ± 0.004 0.07-150 a ± sa = 6.5 ± 2.911; b ± sb = 3.06 ± 0.025R2 = 0.999 (n = 10)
0.02 0.07
7(RS)-ST-�8-11-dihomo-IsoF 5.491 ± 0.003 0.12-135 a ± sa= -0.826 ± 0.549; b ± sb = 0.540 ± 0.009R2 = 0.999 (n = 8)
0.04 0.12
5-F2t-IsoP 4.616 ± 0.004 0.07-150 a ± sa = 2.042 ± 0.642; b ± sb = 0.754 ± 0.005R2 = 0.999 (n = 9)
0.02 0.07
10-epi-10-F4t-NeuroP 4.71 ± 0.01 0.1-142 a ± sa= -7.667 ± 2.525; b ± sb = 2.615 ± 0.023R2 = 0.999 (n = 9)
0.03 0.1
17-epi-17-F2t-dihomo-IsoP 5.47 ± 0.01 0.13-140 a ± sa= -0.123 ± 0.939; b ± sb = 2.855 ± 0.008R2 = 0.999 (n = 10)
0.04 0.13
17-F2t-dihomo-IsoP 5.549 ± 0.003 0.13-140 a ± sa= -0.308 ± 1.029; b ± sb = 1.763 ± 0.009R2 = 0.999 (n = 7)
0.04 0.13
17(RS)-10-epi-SC-�15-11-dihomo-IsoF 6.117 ± 0.04 2-135 a ± sa= -1.213 ± 0.457; b ± sb = 0.861 ± 0.004R2 = 0.999 (n = 9)
0.7 2
Ent-7(RS)-7-F2t-dihomo-IsoP 5.536 ± 0.004 0.07-140 a ± sa= -1.639 ± 1.083; b ± sb = 1.097 ± 0.018R2 = 0.999 (n = 8)
0.02 0.07
14(RS)-14-F4t-NeuroP 4.86 ± 0.03 8-142 a ± sa = 0.178 ± 0.334; b ± sb = 0.139 ± 0.003R2 = 0.997 (n = 9)
2 8
1a,1b-dihomo-IsoP 6.03 ± 0.01 0.28-150 a ± sa= -7.786 ± 2.388; b ± sb = 1.094 ± 0.02R2 = 0.998 (n = 9)
0.1 0.28
a ± sR2 =
Qdw
c(iwtmwlsl
cl
3
LsRLwt[
4(RS)-F4t-NeuroP 5.296 ± 0.005 8-142
uanoptimizer software (Waters) and individual 0.5 �g mL−1 stan-ard solutions (Table 2). The data station operating software usedas MassLynx 4.1 (Waters).
Regarding chromatographic optimization the mobile phaseomposition was firstly studied. The modifier acetic acid at 0.01%v/v) was used in the mobile phase in order to improve the analytesonization in the MS detector. Moreover, acetonitrile and methanol
ere tested as organic modifiers obtaining better results with ace-onitrile. Different combinations of flow rates (from 0.3 to 0.5 mL
in−1), column temperatures (from 40 ◦C to 60 ◦C) and gradientsere tested in order to obtain a satisfactory chromatographic reso-
ution in a run-time as short as possible. The injection volume wastudied at two levels (4 and 8 �L) and better sensitivity withoutoss in resolution was obtained when injecting 8 �L.
Under the optimum conditions, described in Section 2.5, a goodhromatographic separation was achieved for the 18 analytes iness than 8 min, as can be seen in Fig. 1.
.3. Analytical performance data
Standards with concentrations between 0.03 and 300 mmol−1 were used to evaluate the analytical method performance. Ashown in Table 3, all compounds showed adequate linearity with2 between 0.990 and 0.999, as well as suitable LODs (0.02–2 nmol
−1) and LOQs (0.07–8 nmol L−1) [30]. In general, our results matchith those from works in literature [12], allowing the quantifica-ion of these analytes at levels normally found in saliva samples10].
a= -4.11 ± 1.355; b ± sb = 0.56 ± 0.0120.997 (n = 8)
2 8
Regarding precision, it was satisfactory for standard solutions(Table 4), and the analysis of spiked saliva samples provided coeffi-cients of variation between 2.5 and 18% for most of the analytes,higher values corresponded to the inter-day analysis (Table 4).These values were satisfactory (<20%) taking into account theseveral steps required in the sample treatment procedure. Theaccuracy of the method was evaluated by analyzing saliva samplesspiked at three concentration levels (low, medium, and high). Theywere quantified using external calibration equations and satisfac-tory recoveries were obtained for all the analytes (Table 4), withthe exception of 17-epi-17-F2t-dihomo-IsoP, 17-F2t-dihomo-IsoP,17(RS)-10-epi-SC-�15-11-dihomo-IsoF and 1a,1b-dihomo-PGF2�.As a possible cause, sample treatment effect was evaluated and sig-nificant signals increase was observed for these analytes. Therefore,the use of calibration equations constructed from standard solu-tions subjected to UA-LLsME sample treatment to quantify theseanalytes, provided satisfactory recoveries (Table 4). Then, matrixeffect was evaluated for each analyte. In all the cases, the slopescorresponding to the linear regressions of added concentrations(X) vs found concentrations (Y) were statistically comparable to 1(at a confidence level of 95%), so the matrix effect was considerednegligible.
In addition, four total parameters were determined as relativecontents of salivary isoprostanes (IsoPs), isofurans (IsoFs), neuro-prostanes (NeuroPs) and neurofurans (NeuroFs), they included the
sum of isomers from each fatty acid oxidation family. Similarly,these parameters were determined in previous studies carried outin plasma [27] and urine samples [29].
Table 4Accuracy and precision of the analytical method for standard solutions and saliva samples spiked at different concentration levels.
Standard Solutions Spiked saliva samplesa
AnalytesStandard concentration(nmol L−1)
[Recovery ± s (%)] Sample added concentration(nmol L−1)
[Recovery ± s (%)]
Intra-day(n = 3) Inter-day(n = 3) Intra-day(n = 3) Inter-day(n = 3)
2,3-dinor-15-epi-15-F2t-IsoP
18.7 84 ± 2 110 ± 6 10 72 ± 2 80 ± 675 99 ± 2 104 ± 6 50 104 ± 2 90 ± 9150 93 ± 2 104 ± 2 100 78 ± 3 85 ± 4
15-keto-15-F2t-IsoP18.7 89 ± 3 92 ± 8 10 92 ± 9 90 ± 1075 108 ± 7 83 ± 6 50 111 ± 9 107 ± 9150 96 ± 6 115 ± 10 100 100 ± 10 107 ± 8
15-keto-15-E2t-IsoP18.7 80 ± 2 117 ± 10 10 114 ± 9 81 ± 975 84 ± 3 83 ± 5 50 97 ± 9 80 ± 10150 116 ± 3 108 ± 8 100 120 ± 10 104 ± 9
15(R)-15-F2t-IsoP18.7 107 ± 8 106 ± 5 10 79 ± 7 105 ± 1775 110 ± 4 94 ± 7 50 101 ± 12 105 ± 19150 104 ± 3 92 ± 5 100 92 ± 10 85 ± 8
PGE2
18.7 85 ± 5 112 ± 10 10 102 ± 9 93 ± 675 105 ± 5 90 ± 7 50 112 ± 3 98 ± 7150 106 ± 3 100 ± 8 100 105 ± 5 104 ± 17
15-E2t-IsoP18.7 81 ± 4 100 ± 10 10 89 ± 5 95 ± 1075 94 ± 7 100 ± 9 50 87 ± 4 94 ± 8150 99 ± 6 111 ± 7 100 101 ± 6 72 ± 9
5-F2t-IsoP18.7 100 ± 5 110 ± 5 10 84 ± 5 87 ± 975 105 ± 5 92 ± 5 50 102 ± 10 100 ± 7150 97 ± 5 90 ± 9 100 86 ± 8 93 ± 3
15-F2t-IsoP18.7 110 ± 6 84 ± 9 10 98 ± 10 100 ± 2075 113 ± 7 96 ± 9 50 120 ± 10 99 ± 19150 94 ± 4 120 ± 6 100 95 ± 8 92 ± 8
PGF2�
18.7 100 ± 10 111 ± 11 10 98 ± 10 99 ± 1775 112 ± 6 96 ± 5 50 110 ± 5 112 ± 14150 96 ± 4 101 ± 7 100 104 ± 7 105 ± 16
1a,1b-dihomo-PGF2�b
18.7 81 ± 8 80 ± 15 10 94 ± 13 78 ± 1375 83 ± 9 93 ± 11 50 95 ± 7 72 ± 9150 120 ± 7 120 ± 7 100 120 ± 9 109 ± 9
7(RS)-ST-�8-11-dihomo-IsoF
16.9 102 ± 4 84 ± 10 8.6 88 ± 14 107 ± 1567.5 94 ± 9 101 ± 10 45 104 ± 20 90 ± 20135 110 ± 6 96 ± 11 90 105 ± 5 112 ± 10
10-epi-10-F4t-NeuroP17.7 91 ± 8 97 ± 8 9 120 ± 3 90 ± 1070.8 98 ± 3 96 ± 10 47.2 81 ± 3 94 ± 8142 102 ± 9 102 ± 7 94.4 93 ± 12 102 ± 9
4(RS)-F4t-NeuroP17.7 89 ± 8 102 ± 10 9 104 ± 14 84 ± 1570.8 99 ± 4 94 ± 7 47.2 95 ± 10 80 ± 11142 112 ± 6 99 ± 8 94.4 95 ± 6 80 ± 9
17-epi-17-F2t-dihomo-IsoP
17.5 107 ± 6 80 ± 6 8.9 116 ± 6 81 ± 870.2 87 ± 6 87 ± 7 46.8 80 ± 10 88 ± 6140 105 ± 8 105 ± 9 93.6 113 ± 10 116 ± 7
17-F2t-dihomo-IsoPb17.5 75 ± 8 111 ± 10 8.9 70 ± 9 95 ± 770.0 98 ± 10 98 ± 12 46.6 106 ± 16 106 ± 19140 109 ± 6 108 ± 10 93.2 108 ± 16 108 ± 19
17(RS)-10-epi-SC-�15-11-dihomo-IsoFb
17 82 ± 10 84 ± 11 8.6 105 ± 15 80 ± 2067.5 81 ± 2 84 ± 8 45 100 ± 9 81 ± 12135 114 ± 5 92 ± 3 90 114 ± 12 106 ± 15
Ent-7(RS)-7-F2t-dihomo-IsoP
17.5 107 ± 2 118 ± 15 8.9 117 ± 12 107 ± 1070.2 107 ± 3 106 ± 6 46.8 90 ± 8 109 ± 20140 114 ± 9 119 ± 10 93.6 118 ± 4 100 ± 10
14(RS)-14-F4t-NeuroP17.7 90 ± 10 80 ± 10 9 97 ± 9 100 ± 2070.8 100 ± 4 105 ± 6 47.2 120 ± 9 108 ± 19142 100 ± 9 110 ± 9 94.4 94 ± 10 93 ± 18
a
3
mtscsTr
Saliva samples subjected to UA-LLsME as sample treatment.b Quantification in saliva samples using standards subjected to UA-LLsME.
.4. Analyte stability study
The analytes’ stability assessment in saliva samples spiked atedium concentration level was carried out after several freeze-
haw cycles (long-term stability), and after 24 h at 4 ◦C (short-termtability). These samples were analyzed by triplicate, and the foundoncentrations were compared with results from freshly prepared
olutions. In general, the recoveries were between 80 and 125%.herefore, the analytes did not suffer from any significant deterio-ation.3.5. Application to samples
The applicability of the new developed analytical method wasassayed analyzing 30 saliva samples from elderly people withneurodegenerative diseases. Some analytes (5-F2t-IsoP, 15-keto-15-F2t-IsoP, 15-keto-15-E2t-IsoP, PGE2, 15-E2t-IsoP, PGF2�, 4(RS)-F4t-NeuroP, 7(RS)-ST-�8-11-dihomo-IsoF, 10-epi-10-F4t-NeuroP
and 14(RS)-14-F4t-NeuroP) were detected in all the saliva samples(Table 5), indicating the suitable analytical method sensitivity. Inaddition, signals from total parameters (IsoPs, NeuroPs, IsoFs, Neu-roFs) were detected in saliva samples. These results are expressed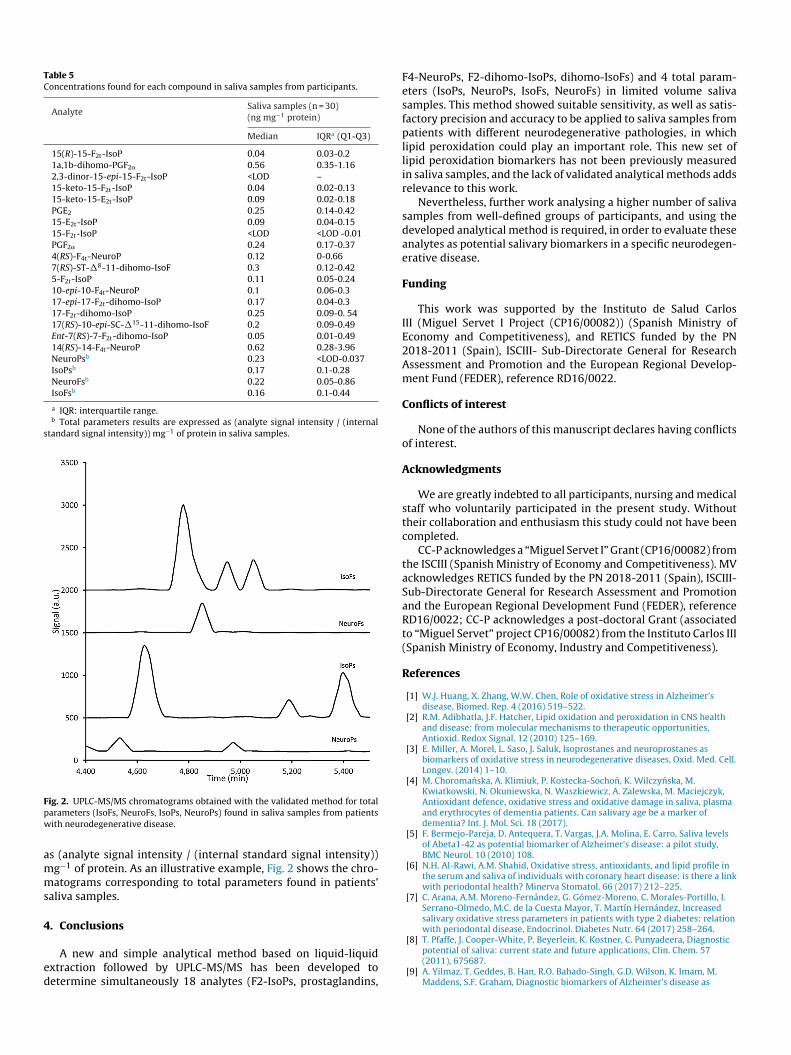
Table 5Concentrations found for each compound in saliva samples from participants.
AnalyteSaliva samples (n = 30)(ng mg−1 protein)
Median IQRa (Q1-Q3)
15(R)-15-F2t-IsoP 0.04 0.03-0.21a,1b-dihomo-PGF2� 0.56 0.35-1.162,3-dinor-15-epi-15-F2t-IsoP <LOD –15-keto-15-F2t-IsoP 0.04 0.02-0.1315-keto-15-E2t-IsoP 0.09 0.02-0.18PGE2 0.25 0.14-0.4215-E2t-IsoP 0.09 0.04-0.1515-F2t-IsoP <LOD <LOD -0.01PGF2� 0.24 0.17-0.374(RS)-F4t-NeuroP 0.12 0-0.667(RS)-ST-�8-11-dihomo-IsoF 0.3 0.12-0.425-F2t-IsoP 0.11 0.05-0.2410-epi-10-F4t-NeuroP 0.1 0.06-0.317-epi-17-F2t-dihomo-IsoP 0.17 0.04-0.317-F2t-dihomo-IsoP 0.25 0.09-0. 5417(RS)-10-epi-SC-�15-11-dihomo-IsoF 0.2 0.09-0.49Ent-7(RS)-7-F2t-dihomo-IsoP 0.05 0.01-0.4914(RS)-14-F4t-NeuroP 0.62 0.28-3.96NeuroPsb 0.23 <LOD-0.037IsoPsb 0.17 0.1-0.28NeuroFsb 0.22 0.05-0.86IsoFsb 0.16 0.1-0.44
a IQR: interquartile range.b Total parameters results are expressed as (analyte signal intensity / (internal
standard signal intensity)) mg−1 of protein in saliva samples.
Fpw
amms
4
ed
ig. 2. UPLC-MS/MS chromatograms obtained with the validated method for totalarameters (IsoFs, NeuroFs, IsoPs, NeuroPs) found in saliva samples from patientsith neurodegenerative disease.
s (analyte signal intensity / (internal standard signal intensity))g−1 of protein. As an illustrative example, Fig. 2 shows the chro-atograms corresponding to total parameters found in patients’
aliva samples.
. Conclusions
A new and simple analytical method based on liquid-liquidxtraction followed by UPLC-MS/MS has been developed toetermine simultaneously 18 analytes (F2-IsoPs, prostaglandins,
F4-NeuroPs, F2-dihomo-IsoPs, dihomo-IsoFs) and 4 total param-eters (IsoPs, NeuroPs, IsoFs, NeuroFs) in limited volume salivasamples. This method showed suitable sensitivity, as well as satis-factory precision and accuracy to be applied to saliva samples frompatients with different neurodegenerative pathologies, in whichlipid peroxidation could play an important role. This new set oflipid peroxidation biomarkers has not been previously measuredin saliva samples, and the lack of validated analytical methods addsrelevance to this work.
Nevertheless, further work analysing a higher number of salivasamples from well-defined groups of participants, and using thedeveloped analytical method is required, in order to evaluate theseanalytes as potential salivary biomarkers in a specific neurodegen-erative disease.
Funding
This work was supported by the Instituto de Salud CarlosIII (Miguel Servet I Project (CP16/00082)) (Spanish Ministry ofEconomy and Competitiveness), and RETICS funded by the PN2018-2011 (Spain), ISCIII- Sub-Directorate General for ResearchAssessment and Promotion and the European Regional Develop-ment Fund (FEDER), reference RD16/0022.
Conflicts of interest
None of the authors of this manuscript declares having conflictsof interest.
Acknowledgments
We are greatly indebted to all participants, nursing and medicalstaff who voluntarily participated in the present study. Withouttheir collaboration and enthusiasm this study could not have beencompleted.
CC-P acknowledges a “Miguel Servet I” Grant (CP16/00082) fromthe ISCIII (Spanish Ministry of Economy and Competitiveness). MVacknowledges RETICS funded by the PN 2018-2011 (Spain), ISCIII-Sub-Directorate General for Research Assessment and Promotionand the European Regional Development Fund (FEDER), referenceRD16/0022; CC-P acknowledges a post-doctoral Grant (associatedto “Miguel Servet” project CP16/00082) from the Instituto Carlos III(Spanish Ministry of Economy, Industry and Competitiveness).
References
[1] W.J. Huang, X. Zhang, W.W. Chen, Role of oxidative stress in Alzheimer’sdisease, Biomed. Rep. 4 (2016) 519–522.
[2] R.M. Adibhatla, J.F. Hatcher, Lipid oxidation and peroxidation in CNS healthand disease: from molecular mechanisms to therapeutic opportunities,Antioxid. Redox Signal. 12 (2010) 125–169.
[3] E. Miller, A. Morel, L. Saso, J. Saluk, Isoprostanes and neuroprostanes asbiomarkers of oxidative stress in neurodegenerative diseases, Oxid. Med. Cell.Longev. (2014) 1–10.
[4] M. Choromanska, A. Klimiuk, P. Kostecka-Sochon, K. Wilczynska, M.Kwiatkowski, N. Okuniewska, N. Waszkiewicz, A. Zalewska, M. Maciejczyk,Antioxidant defence, oxidative stress and oxidative damage in saliva, plasmaand erythrocytes of dementia patients. Can salivary age be a marker ofdementia? Int. J. Mol. Sci. 18 (2017).
[5] F. Bermejo-Pareja, D. Antequera, T. Vargas, J.A. Molina, E. Carro, Saliva levelsof Abeta1-42 as potential biomarker of Alzheimer’s disease: a pilot study,BMC Neurol. 10 (2010) 108.
[6] N.H. Al-Rawi, A.M. Shahid, Oxidative stress, antioxidants, and lipid profile inthe serum and saliva of individuals with coronary heart disease: is there a linkwith periodontal health? Minerva Stomatol. 66 (2017) 212–225.
[7] C. Arana, A.M. Moreno-Fernández, G. Gómez-Moreno, C. Morales-Portillo, I.Serrano-Olmedo, M.C. de la Cuesta Mayor, T. Martín Hernández, Increasedsalivary oxidative stress parameters in patients with type 2 diabetes: relationwith periodontal disease, Endocrinol. Diabetes Nutr. 64 (2017) 258–264.
[8] T. Pfaffe, J. Cooper-White, P. Beyerlein, K. Kostner, C. Punyadeera, Diagnosticpotential of saliva: current state and future applications, Clin. Chem. 57(2011), 675687.
[9] A. Yilmaz, T. Geddes, B. Han, R.O. Bahado-Singh, G.D. Wilson, K. Imam, M.Maddens, S.F. Graham, Diagnostic biomarkers of Alzheimer’s disease as
[
[
[
[
[
[
[
[
[
[
[
[
[
[
[
[
[
[
[
[
[
[
[
Temozolomide from biological samples, J. Chromatogr. B Analyt. Technol.Biomed. Life Sci. 970 (2014) 86–94.
identified in saliva using 1H NMR-Based metabolomics, J. Alzheimers Dis. 58(2017) 355–359.
10] Y. Huang, M. Zhu, Z. Li, R. Sa, Q. Chu, Q. Zhang, H. Zhang, W. Tang, M. Zhang, H.Yin, Mass spectrometry-based metabolomics profiling identifies alterations insalivary redox status and fatty acid metabolism in response to inflammationand oxidative stress in periodontal disease, Free Rad. Biol. Med. 70 (2014)223–232.
11] A. Mansourian, F. Agha-Hosseini, H.H. Kazemi, N. Mortazavi, M.S. Moosavi, J.Beytollahi, I. Mirzaii-Dizgah, Salivary oxidative stress in oral lichen planustreated with triamcinolone mouthrinse, Dent. Res. J. 14 (2017) 104–110.
12] Y.H. Lee, D.T. Wong, Saliva: an emerging biofluid for early detection ofdiseases, Am. J. Dent. 22 (2009) 241–248.
13] Y.C. Hsu, B.G. Chen, S.C. Yang, Y.S. Wang, S.P. Huang, M.H. Huang, T.J. Chen, H.C.Liu, D.L. Lin, R.H. Liu, A.W. Jones, Methadone concentrations in blood, plasma,and oral fluid determined by isotope-dilution gas chromatography-massspectrometry, Anal. Bioanal. Chem. 405 (2013) 3921–3928.
14] R. Metgud, S. Bajaj, Evaluation of salivary and serum lipid peroxidation, andglutathione in oral leukoplakia and oral squamous cell carcinoma, J. Oral Sci.56 (2014) 135–142.
15] E. Baltacıoglu, P. Yuva, G. Aydın, A. Alver, C. Kahraman, E. Karabulut, F.A.Akalın, Lipid peroxidation levels and total oxidant/antioxidant status inserum and saliva from patients with chronic and aggressive periodontitis.Oxidative stress index: a new biomarker for periodontal disease? J.Periodontol. 85 (2014) 1432–1441.
16] T.T. Nguyen, L.Q. Ngo, A. Promsudthi, R. Surarit, Salivary lipid peroxidation inpatients with generalized chronic periodontitis and acute coronarysyndrome, J. Periodontol. 87 (2016) 134–141.
17] D. Darczuk, W. Krzysciak, P. Vyhouskaya, B. Kesek, D. Galecka-Wanatowicz,W. Lipska, T. Kaczmarzyk, M. Gluch-Lutwin, B. Mordyl, M.Chomyszyn-Gajewska, Salivary oxidative status in patients with oral lichenplanus, Physiol. Pharmacol. 67 (2016) 885–894.
18] T.T. Nguyen, L.Q. Ngo, A. Promsudthi, R. Surarit, Salivary oxidative stressbiomarkers in chronic periodontitis and acute coronary syndrome, Clin. OralInvestig. 21 (2017) 2345–2353.
19] H. Su, M. Gornitsky, G. Geng, A.M. Velly, H. Chertkow, H.M. Schipper, Diurnalvariations in salivary protein carbonyl levels in normal and cognitivelyimpaired human subjects, Age (Dordr) 30 (2018) 1–9.
20] J.A. Oh, H.S. Shin, Simple and sensitive determination of malondialdehyde inhuman urine and saliva using UHPLC-MS/MS after derivatization with3,4-diaminobenzophenone, J. Sep. Sci. 40 (2017) 3958–3968.
21] A. Bulatov, K. Medinskaia, D. Aseeva, S. Garmonov, L. Moskvin, Determinationof antipyrine in saliva using the dispersive liquid–liquid microextraction
based on a stepwise injection system, Talanta 133 (2015) 66–70.22] I. Timofeeva, K. Medinskaia, L. Nikolaeva, D. Kirsanov, A. Bulatov, Stepwiseinjection potentiometric determination of caffeine in saliva using single-dropmicroextraction combined with solvent exchange, Talanta 150 (2016)655–660.
[
23] A. Esrafili, Y. Yamini, M. Ghambarian, B. Ebrahimpour, Automatedpreconcentration and analysis of organic compounds by on-line hollow fiberliquid-phase microextraction–high performance liquid chromatography, J.Chromatogr. A 1262 (2012) 27–33.
24] L.K. Xue, W.W. Ma, D.X. Zhang, X.Z. Du, Ultrasound assisted liquid-liquidmicroextraction based on an ionic liquid for preconcentration anddetermination of UV filters in environmental water samples, Anal. Methods 5(2013) 4213–4219.
25] Y. Jiao, J. Yu, Y. Yang, Vortex-assisted liquid-liquid microextraction combinedwith spectrophotometry for the determination of trace nitrite in watersamples, Water Sci. Technol. 17 (2017) 1225–1231.
26] M.S. Albert, S.T. DeKosky, D. Dickson, B. Dubois, H.H. Feldman, N.C. Fox, A.Gamst, D.M. Holtzman, W.J. Jagust, R.C. Petersen, P.J. Snyder, M.C. Carrillo, B.Thies, C.H. Phelps, The diagnosis of mild cognitive impairment due toAlzheimer’s disease: recommendations from the National Institute onAging-Alzheimer’s Association workgroups on diagnostic guidelines forAlzheimer’s disease, Alzheimers Dement. 7 (2011) 270–279.
27] C. Cháfer-Pericás, I. Torres-Cuevas, A. Sanchez-Illana, J. Escobar, J. Kuligowski,R. Solberg, H.T. Garberg, M.U. Huun, O.D. Saugstad, M. Vento, Development ofa reliable analytical method to determine lipid peroxidation biomarkers innewborn plasma samples, Talanta 153 (2016) 152–157.
28] A. de la Torre, Y.Y. Lee, A. Mazzoni, A. Guy, V. Bultel-Poncé, T. Durand, C. Oger,J.C. Lee, J.M. Galano, Total syntheses and in vivo quantitation of novelneurofuran and dihomo-isofuran derived from docosahexaenoic acid andadrenic acid, Chemistry 21 (2015) 2442–2446.
29] A. García-Blanco, C. Pena-Bautista, C. Oger, C. Vigor, J.M. Galano, T. Durand, N.Martín-Ibánez, M. Baquero, M. Vento, C. Cháfer-Pericás, Reliabledetermination of new lipid peroxidation compounds as potential earlyAlzheimer Disease biomarkers, Talanta 184 (2018) 193–201.
30] C. Pena-Bautista, C. Vigor, J.M. Galano, C. Oger, T. Durand, I. Ferrer, A. Cuevas,R. López-Cuevas, M. Baquero, M. López-Nogueroles, M. Vento, D. Hervás, A.García-Blanco, C. Cháfer-Pericás, Plasma lipid peroxidation biomarkers forearly and non-invasive Alzheimer Disease detection, Free Rad. Biol. Med. 124(2018) 388–394.
31] A. García-Blanco, M. Vento, V. Diago, C. Cháfer-Pericás, Reference ranges forcortisol and �-amylase in mother and newborn saliva samples at differentperinatal and postnatal periods, J. Chromatogr. B Analyt. Technol. Biomed. LifeSci. 1022 (2016) 249–255.
32] D. Jain, R. Athawale, A. Bajaj, S. Shrikhande, Double- salting out assistedliquid-liquid extraction (SALLE) HPLC method for estimation of
33] Z. Wu, W. Gao, M.A. Phelps, D. Wu, D.D. Miller, J.T. Dalton, Favorable effects ofweak acids on negative-ion electrospray ionization mass spectrometry, Anal.Chem. 76 (2004) 839–847.