Embed Size (px)
Citation preview

VALIC Company ISummary Prospectus, October 1, 2016
S A V I N G : I N V E S T I N G : P L A N N I N G
VALIC Company I (“VC I”) is a mutual fund complex made up of 34 separate funds (each, a “Fund”, and collectively, the “Funds”). Each of the Funds has itsown investment objective. Each Fund is explained in more detail in their respective Fund Summaries contained herein.
Ticker Symbol:
Asset Allocation Fund VCAAXBlue Chip Growth Fund VCBCXBroad Cap Value Income Fund VBCVXCapital Conservation Fund VCCCXCore Equity Fund VCCEXDividend Value Fund VCIGXDynamic Allocation Fund VDAFXEmerging Economies Fund VCGEXForeign Value Fund VCFVXGlobal Real Estate Fund VGREXGlobal Social Awareness Fund VCSOXGlobal Strategy Fund VGLSXGovernment Money Market I Fund
(formerly, Money Market I Fund) VCIXXGovernment Securities Fund VCGSXGrowth Fund VCULXGrowth & Income Fund VCGAXHealth Sciences Fund VCHSXInflation Protected Fund VCTPXInternational Equities Index Fund VCIEXInternational Government Bond Fund VCIFXInternational Growth Fund VCINXLarge Cap Core Fund VLCCXLarge Capital Growth Fund VLCGXMid Cap Index Fund VMIDXMid Cap Strategic Growth Fund VMSGXNasdaq-100® Index Fund VCNIXScience & Technology Fund VCSTXSmall Cap Aggressive Growth Fund VSAGXSmall Cap Fund VCSMXSmall Cap Index Fund VCSLXSmall Cap Special Values Fund VSSVXSmall-Mid Growth Fund VSSGXStock Index Fund VSTIXValue Fund VAVAX
The Funds’ Statutory Prospectus and Statement of Additional Information dated October 1, 2016, and the most recent shareholder reports are incorporatedinto and made part of each Summary Prospectus by reference. The Funds are offered only to registered and unregistered separate accounts of The VariableAnnuity Life Insurance Company and its affiliates and to qualifying retirement plans and IRAs and are not intended for use by other investors.
Before you invest, you may want to review each Fund’s Statutory Prospectus, which contains more information about the Funds and their risks. You canfind each Fund’s Statutory Prospectus and the above-incorporated information online at https://www.valic.com/prospectus-and-reports/annuities. You canalso get this information at no cost by calling 800-448-2542 or by sending an e-mail request to [email protected].
The Securities and Exchange Commission (the “SEC”) has not approved or disapproved these securities, nor has it determined that this Prospectus isaccurate or complete. It is a criminal offense to state otherwise.

TABLE OF CONTENTS
Topic Page
Fund Summaries . . . . . . . . . . . . . . . . . . . . . . . . . . . . . . . . . . . . . . . . . . . . . . . . . . . . . . . . . . . . . . . 1Asset Allocation Fund . . . . . . . . . . . . . . . . . . . . . . . . . . . . . . . . . . . . . . . . . . . . . . . . . . . . . . 1Blue Chip Growth Fund . . . . . . . . . . . . . . . . . . . . . . . . . . . . . . . . . . . . . . . . . . . . . . . . . . . . 4Broad Cap Value Income Fund . . . . . . . . . . . . . . . . . . . . . . . . . . . . . . . . . . . . . . . . . . . . . . 6Capital Conservation Fund . . . . . . . . . . . . . . . . . . . . . . . . . . . . . . . . . . . . . . . . . . . . . . . . . 9Core Equity Fund . . . . . . . . . . . . . . . . . . . . . . . . . . . . . . . . . . . . . . . . . . . . . . . . . . . . . . . . . 12Dividend Value Fund . . . . . . . . . . . . . . . . . . . . . . . . . . . . . . . . . . . . . . . . . . . . . . . . . . . . . . 15Dynamic Allocation Fund . . . . . . . . . . . . . . . . . . . . . . . . . . . . . . . . . . . . . . . . . . . . . . . . . . . 18Emerging Economies Fund . . . . . . . . . . . . . . . . . . . . . . . . . . . . . . . . . . . . . . . . . . . . . . . . . 24Foreign Value Fund . . . . . . . . . . . . . . . . . . . . . . . . . . . . . . . . . . . . . . . . . . . . . . . . . . . . . . . 27Global Real Estate Fund . . . . . . . . . . . . . . . . . . . . . . . . . . . . . . . . . . . . . . . . . . . . . . . . . . . 30Global Social Awareness Fund . . . . . . . . . . . . . . . . . . . . . . . . . . . . . . . . . . . . . . . . . . . . . . 33Global Strategy Fund . . . . . . . . . . . . . . . . . . . . . . . . . . . . . . . . . . . . . . . . . . . . . . . . . . . . . . 36Government Money Market I Fund . . . . . . . . . . . . . . . . . . . . . . . . . . . . . . . . . . . . . . . . . . . 40Government Securities Fund . . . . . . . . . . . . . . . . . . . . . . . . . . . . . . . . . . . . . . . . . . . . . . . . 42Growth Fund . . . . . . . . . . . . . . . . . . . . . . . . . . . . . . . . . . . . . . . . . . . . . . . . . . . . . . . . . . . . . 45Growth & Income Fund . . . . . . . . . . . . . . . . . . . . . . . . . . . . . . . . . . . . . . . . . . . . . . . . . . . . 49Health Sciences Fund . . . . . . . . . . . . . . . . . . . . . . . . . . . . . . . . . . . . . . . . . . . . . . . . . . . . . 52Inflation Protected Fund . . . . . . . . . . . . . . . . . . . . . . . . . . . . . . . . . . . . . . . . . . . . . . . . . . . . 55International Equities Index Fund . . . . . . . . . . . . . . . . . . . . . . . . . . . . . . . . . . . . . . . . . . . . 58International Government Bond Fund . . . . . . . . . . . . . . . . . . . . . . . . . . . . . . . . . . . . . . . . . 61International Growth Fund . . . . . . . . . . . . . . . . . . . . . . . . . . . . . . . . . . . . . . . . . . . . . . . . . . 64Large Cap Core Fund . . . . . . . . . . . . . . . . . . . . . . . . . . . . . . . . . . . . . . . . . . . . . . . . . . . . . . 68Large Capital Growth Fund . . . . . . . . . . . . . . . . . . . . . . . . . . . . . . . . . . . . . . . . . . . . . . . . . 71Mid Cap Index Fund . . . . . . . . . . . . . . . . . . . . . . . . . . . . . . . . . . . . . . . . . . . . . . . . . . . . . . . 73Mid Cap Strategic Growth Fund . . . . . . . . . . . . . . . . . . . . . . . . . . . . . . . . . . . . . . . . . . . . . 75Nasdaq-100® Index Fund . . . . . . . . . . . . . . . . . . . . . . . . . . . . . . . . . . . . . . . . . . . . . . . . . . 78Science & Technology Fund . . . . . . . . . . . . . . . . . . . . . . . . . . . . . . . . . . . . . . . . . . . . . . . . 81Small Cap Aggressive Growth Fund . . . . . . . . . . . . . . . . . . . . . . . . . . . . . . . . . . . . . . . . . . 84Small Cap Fund . . . . . . . . . . . . . . . . . . . . . . . . . . . . . . . . . . . . . . . . . . . . . . . . . . . . . . . . . . 87Small Cap Index Fund . . . . . . . . . . . . . . . . . . . . . . . . . . . . . . . . . . . . . . . . . . . . . . . . . . . . . 90Small Cap Special Values Fund . . . . . . . . . . . . . . . . . . . . . . . . . . . . . . . . . . . . . . . . . . . . . 92Small-Mid Growth Fund . . . . . . . . . . . . . . . . . . . . . . . . . . . . . . . . . . . . . . . . . . . . . . . . . . . . 94Stock Index Fund . . . . . . . . . . . . . . . . . . . . . . . . . . . . . . . . . . . . . . . . . . . . . . . . . . . . . . . . . 96Value Fund . . . . . . . . . . . . . . . . . . . . . . . . . . . . . . . . . . . . . . . . . . . . . . . . . . . . . . . . . . . . . . 98
Important Additional Information . . . . . . . . . . . . . . . . . . . . . . . . . . . . . . . . . . . . . . . . . . . . . . . . . . . 101
- i -

FUND SUMMARY: ASSET ALLOCATION FUND
Investment Objective
The Fund seeks maximum aggregate rate of return over thelong-term through controlled investment risk by adjusting itsinvestment mix among stocks, long-term debt securities andshort-term money market securities.
Fees and Expenses of the Fund
This table describes the fees and expenses that you maypay if you buy and hold shares of the Fund. The Fund’sannual operating expenses do not reflect the separateaccount fees charged in the variable annuity or variable lifeinsurance policy (“Variable Contracts”) in which the Fund isoffered. If a separate account’s fees were shown, theFund’s annual operating expenses would be higher. Pleasesee your Variable Contract prospectus for more details onthe separate account fees.
Annual Fund Operating Expenses (expenses that youpay each year as a percentage of the value of yourinvestment)
Management Fees 0.50%Other Expenses 0.21%Total Annual Fund Operating Expenses(1) 0.71%
(1) The Total Annual Fund Operating Expenses for the Fund do notcorrelate to the ratio of net expenses to average net assetsprovided in the Financial Highlights table of the Fund’s annualreport, which reflects the net operating expenses of the Fund(0.70%) and does not include Acquired Fund Fees andExpenses. “Acquired Fund Fees and Expenses” include fees andexpenses incurred indirectly by the Fund as a result ofinvestments in shares of one or more mutual funds, hedge funds,private equity funds or other pooled investment vehicles.
Expense Example
This Example is intended to help you compare the cost ofinvesting in the Fund with the cost of investing in othermutual funds. The Example assumes that you invest$10,000 in the Fund for the time periods indicated and thenredeem all of your shares at the end of those periods. TheExample also assumes that your investment has a 5%return each year and that the Fund’s operating expensesremain the same. The Example does not reflect chargesimposed by the Variable Contract. If the Variable Contractfees were reflected then the expenses would be higher. Seethe Variable Contract prospectus for information on suchcharges. Although your actual costs may be higher or lower,based on these assumptions and the net expenses shownin the fee table, your costs would be:
1 Year 3 Years 5 Years 10 Years
$73 $227 $395 $883
Portfolio Turnover
The Fund pays transaction costs, such as commissions,when it buys and sells securities (or “turns over” itsportfolio). These costs, which are not reflected in annual
fund operating expenses or in the example, affect theFund’s performance. During the most recent fiscal year, theFund’s portfolio turnover rate was 102% of the averagevalue of its portfolio.
Principal Investment Strategies of the Fund
The Fund is an asset allocation fund that attempts tomaximize returns with a mix of stocks, bonds and moneymarket securities. The sub-adviser buys and sells securitiesfor the Fund by changing its investment mix amongcommon stocks, intermediate- and long-term bonds (fixedincome securities) and money market securities. As a result,the Fund’s investments may change often. The Fund caninvest 100% of its assets in just one of these asset classes.The sub-adviser may engage in frequent and active tradingof portfolio securities to achieve the Fund’s investmentobjective.
Unlike an index fund, which tries to increase the money youinvest by matching a specific index’s performance, the Fundtries to perform better than a blend of three market sectorsmeasured by:
Š the S&P 500® Index;Š the Barclays U.S. Aggregate Bond Index; andŠ Treasury-Bill 3 Month Index.
An asset allocation model is used to help the sub-adviserdecide how to allocate the Fund’s assets. The modelanalyzes many factors that affect the performance ofsecurities that comprise certain indexes.
Based on the model, the sub-adviser will normally allocatethe Fund’s assets approximately according to the followingasset classes:
Š Common stocks and equity securities 55%Š Intermediate- and long-term bonds 35%Š High quality money market securities 10%
The Fund’s equity assets generally consist of large-capcommon stocks. The Fund’s fixed income assets generallyconsist of investment grade corporate debt securities andU.S. Government securities. A significant portion of theFund’s U.S. Government securities may be issued orguaranteed by the Federal National Mortgage Association(“FNMA”) or the Federal Home Loan Mortgage Corporation(“FHLMC”).
The allocation among the three asset classes may differfrom the percentages referenced above at the solediscretion of the sub-adviser.
In order to generate additional income, the Fund may lendportfolio securities to broker-dealers and other financialinstitutions provided that the value of the loaned securitiesdoes not exceed 30% of the Fund’s total assets. Theseloans earn income for the Fund and are collateralized bycash, securities issued or guaranteed by the U.S.Government or its agencies or instrumentalities, and such
- 1 -
FUND SUMMARY: ASSET ALLOCATION FUND
other securities as the Fund and the securities lendingagent may agree upon.
Principal Risks of Investing in the Fund
There can be no assurance that the Fund’s investmentobjective will be met or that the net return on an investmentin the Fund will exceed what could have been obtainedthrough other investment or savings vehicles. Shares of theFund are not bank deposits and are not guaranteed orinsured by any bank, government entity or the FederalDeposit Insurance Corporation. As with any mutual fund,there is no guarantee that the Fund will be able to achieveits investment objective. If the value of the assets of theFund goes down, you could lose money.
The following is a summary of the principal risks of investingin the Fund.
Model Risk: The Fund’s asset allocation model may fail toproduce the optimal portfolio allocation.
Management Risk: The investment style or strategy usedby the sub-adviser may fail to produce the intended result.The sub-adviser’s assessment of a particular security orcompany may prove incorrect, resulting in losses orunderperformance.
Equity Securities Risk: The Fund’s investments in equitysecurities are subject to the risk that stock prices will fall andmay underperform other asset classes. Individual stockprices fluctuate from day-to-day and may declinesignificantly. The prices of individual stocks may benegatively affected by poor company results or other factorsaffecting individual prices, as well as industry and/oreconomic trends and developments affecting industries orthe securities market as a whole.
Credit Risk: The Fund may suffer losses if the issuer of afixed income security owned by the Fund is unable to makeinterest or principal payments.
Interest Rate Risk: The value of fixed income securitiesmay decline when interest rates go up or increase wheninterest rates go down. The interest earned on fixed incomesecurities may decline when interest rates go down orincrease when interest rates go up. Longer-term and lowercoupon bonds tend to be more sensitive to changes ininterest rates. The Fund may be subject to a greater risk ofrising interest rates due to the current period of historicallylow rates and the effect of potential government fiscal policyinitiatives and resulting market reaction to these initiatives.
Call or Prepayment Risk: During periods of falling interestrates, a bond issuer may “call” a bond to repay it before itsmaturity date. The Fund may only be able to invest thebond’s proceeds at lower interest rates, resulting in adecline in the Fund’s income.
Large-Cap Company Risk: Investing primarily in large-capcompanies carries the risk that due to current market
conditions these companies may be out of favor withinvestors. Large-cap companies may be unable to respondquickly to new competitive challenges or attain the highgrowth rate of successful smaller companies.
Market Risk: The Fund’s share price can fall because ofweakness in the broad market, a particular industry, orspecific holdings or due to adverse political or economicdevelopments here or abroad, changes in investorpsychology, or heavy institutional selling. The price ofindividual securities may fluctuate, sometimes dramatically,from day-to-day. The prices of stocks and other equitysecurities tend to be more volatile than those of fixedincome securities.
Liquidity Risk: If the active trading market for certainsecurities becomes limited or non-existent, it can becomemore difficult to sell the securities at or near their perceivedvalue. This may cause the value of such securities and theFund’s share price to fall dramatically.
U.S. Government Obligations Risk: U.S Treasuryobligations are backed by the “full faith and credit” of theU.S. Government and are generally considered to have lowcredit risk. Unlike U.S. Treasury obligations, securitiesissued or guaranteed by federal agencies or authorities andU.S. Government-sponsored instrumentalities orenterprises, including FNMA and FHLMC, may or may notbe backed by the full faith and credit of the U.S.Government and are therefore subject to greater credit riskthan securities issued or guaranteed by the U.S. Treasury.
Active Trading Risk: High portfolio turnover rates that areassociated with active trading may result in highertransaction costs, which can adversely affect the Fund’sperformance. Active trading tends to be more pronouncedduring periods of increased market volatility.
Risks of Investing in Money Market Securities: Aninvestment in the Fund is subject to the risk that the value ofits investments in high-quality short-term obligations(“money market securities”) may be subject to changes ininterest rates, changes in the rating of any money marketsecurity and in the ability of an issuer to make payments ofinterest and principal.
Securities Lending Risk: Engaging in securities lendingcould increase the market and credit risk for Fundinvestments. The Fund may lose money if it does not recoverborrowed securities, the value of the collateral falls, or thevalue of investments made with cash collateral declines. Ifthe value of either the cash collateral or the Fund’sinvestments of the cash collateral falls below the amountowed to a borrower, the Fund also may incur losses thatexceed the amount it earned on lending the security.Securities lending also involves the risks of delay in receivingadditional collateral or possible loss of rights in the collateral ifthe borrower fails. Another risk of securities lending is the riskthat the loaned portfolio securities may not be available to theFund on a timely basis and the Fund may therefore lose theopportunity to sell the securities at a desirable price.
- 2 -

FUND SUMMARY: ASSET ALLOCATION FUND
Performance Information
The following Risk/Return Bar Chart and Table illustrate therisks of investing in the Fund by showing changes in theFund’s performance from calendar year to calendar yearand comparing the Fund’s average annual returns to thoseof the S&P 500® Index, a blended index and each of itscomponents. The Blended Index is comprised of the S&P500® Index (55%), the Barclays U.S. Aggregate Bond Index(35%) and the Citi Treasury Bill 3 Month Index (10%). Feesand expenses incurred at the contract level are not reflectedin the bar chart or table. If these amounts were reflected,returns would be less than those shown. Of course, pastperformance is not necessarily an indication of how theFund will perform in the future.
2006 2007 2008 2009 2010 2011 2012 2013 20152014
-22.10%
11.76%
6.30%
23.61%
14.56%
0.92%
13.33%15.96%
5.36%
-0.45%
-30%
-25%
-20%
-15%
-10%
-5%
0%
5%
10%
15%
20%
25%
30%
During the periods shown in the bar chart, the highest returnfor a quarter was 13.14% (quarter ending September 30,2009) and the lowest return for a quarter was -10.95%(quarter ending December 31, 2008). For the year-to-datethrough June 30, 2016, the Fund’s return was 1.19%.
Average Annual Total Returns (For the periods endedDecember 31, 2015)
1Year
5Years
10Years
Fund -0.45% 6.82% 6.19%S&P 500® Index 1.38% 12.57% 7.31%Barclays U.S. Aggregate Bond
Index 0.55% 3.25% 4.51%Citi Treasury Bill 3 Month Index 0.03% 0.05% 1.17%Blended Index 1.19% 8.14% 6.00%
Investment Adviser
The Fund’s investment adviser is The Variable Annuity LifeInsurance Company. The Fund is sub-advised byPineBridge Investments LLC.
Portfolio Managers
Name
PortfolioManager ofthe Fund
Since Title
Michael Kelly, CFA 2002 Managing Director,Global Head ofMulti-Asset
Jose R. Aragon 2008 Senior Vice Presidentand PortfolioManager, Global-Multi Asset
Robert VandenAssem, CFA
2002 Managing Director,Head of InvestmentGrade Fixed Income
Kate Faraday 2012 Sr. Vice Presidentand PortfolioManager/ Trader,Quantitative Equities
Agam Sharma 2016 Senior Vice Presidentand PortfolioManager, GlobalMulti-Asset
For important information about purchase and sales of Fundshares, taxes and payments made to broker-dealers andother financial intermediaries, please turn to the section“Important Additional Information” on page 101.
- 3 -

FUND SUMMARY: BLUE CHIP GROWTH FUND
Investment Objective
The Fund seeks long-term capital growth. Income is asecondary objective.
Fees and Expenses of the Fund
This table describes the fees and expenses that you maypay if you buy and hold shares of the Fund. The Fund’sannual operating expenses do not reflect the separateaccount fees charged in the variable annuity or variable lifeinsurance policy (“Variable Contracts”) in which the Fund isoffered. If a separate account’s fees were shown, theFund’s annual operating expenses would be higher. Pleasesee your Variable Contract prospectus for more details onthe separate account fees.
Annual Fund Operating Expenses (expenses that youpay each year as a percentage of the value of yourinvestment)
Management Fees 0.73%Other Expenses 0.11%Total Annual Fund Operating Expenses 0.84%
Expense Example
This Example is intended to help you compare the cost ofinvesting in the Fund with the cost of investing in othermutual funds. The Example assumes that you invest$10,000 in the Fund for the time periods indicated and thenredeem all of your shares at the end of those periods. TheExample also assumes that your investment has a 5%return each year and that the Fund’s operating expensesremain the same. The Example does not reflect chargesimposed by the Variable Contract. If the Variable Contractfees were reflected then the expenses would be higher. Seethe Variable Contract prospectus for information on suchcharges. Although your actual costs may be higher or lower,based on these assumptions and the net expenses shownin the fee table, your costs would be:
1 Year 3 Years 5 Years 10 Years
$86 $268 $466 $1,037
Portfolio Turnover
The Fund pays transaction costs, such as commissions,when it buys and sells securities (or “turns over” itsportfolio). These costs, which are not reflected in annualfund operating expenses or in the example, affect theFund’s performance. During the most recent fiscal year, theFund’s portfolio turnover rate was 30% of the average valueof its portfolio.
Principal Investment Strategies of the Fund
The Fund pursues long-term capital appreciation byinvesting, under normal circumstances, at least 80% of netassets in the common stocks of large- and mid-cap blue
chip growth companies. Generally, large- and mid-capstocks will include companies whose market capitalizations,at the time of purchase, are greater than or equal to thesmallest company included in the Russell Midcap® Index.As of May 27, 2016, the market capitalization range of thecompanies in the Russell Midcap® Index was approximately$1.9 billion to $26.2 billion.
Blue chip growth companies are firms that, in the sub-adviser’s view, are well-established in their industries andhave the potential for above-average earnings growth,which may include companies in the technology sector.
In order to generate additional income, the Fund may lendportfolio securities to broker-dealers and other financialinstitutions provided that the value of the loaned securitiesdoes not exceed 30% of the Fund’s total assets. Theseloans earn income for the Fund and are collateralized bycash, securities issued or guaranteed by the U.S.Government or its agencies or instrumentalities, and suchother securities as the Fund and the securities lendingagent may agree upon. Investors will be given at least60 days’ written notice in advance of any change to theFund’s 80% investment policy set forth above.
Principal Risks of Investing in the Fund
There can be no assurance that the Fund’s investmentobjective will be met or that the net return on an investmentin the Fund will exceed what could have been obtainedthrough other investment or savings vehicles. Shares of theFund are not bank deposits and are not guaranteed orinsured by any bank, government entity or the FederalDeposit Insurance Corporation. As with any mutual fund,there is no guarantee that the Fund will be able to achieveits investment objective. If the value of the assets of theFund goes down, you could lose money.
The following is a summary of the principal risks of investingin the Fund.
Management Risk: The investment style or strategy usedby the sub-adviser may fail to produce the intended result.The sub-adviser’s assessment of a particular security orcompany may prove incorrect, resulting in losses orunderperformance.
Equity Securities Risk: The Fund invests principally inequity securities and is therefore subject to the risk thatstock prices will fall and may underperform other assetclasses. Individual stock prices fluctuate from day-to-dayand may decline significantly. The prices of individual stocksmay be negatively affected by poor company results orother factors affecting individual prices, as well as industryand/or economic trends and developments affectingindustries or the securities market as a whole.
Growth Style Risk: Generally, “growth” stocks are stocksof companies that the sub-adviser believes have anticipatedearnings ranging from steady to accelerated growth. Manyinvestors buy growth stocks because of anticipated superior
- 4 -

FUND SUMMARY: BLUE CHIP GROWTH FUND
earnings growth, but earnings disappointments often resultin sharp price declines. Growth companies usually invest ahigh portion of earnings in their own businesses so theirstocks may lack the dividends that can cushion share pricesin a down market. In addition, the value of growth stocksmay be more sensitive to changes in current or expectedearnings than the value of other stocks, because growthstocks trade at higher prices relative to current earnings.
Large- and Mid-Cap Company Risk: Investing primarily inlarge- and mid-cap companies carries the risk that due tocurrent market conditions these companies may be out offavor with investors. Large-cap companies may be unableto respond quickly to new competitive challenges or attainthe high growth rate of successful smaller companies.Stocks of mid-cap companies may be more volatile thanthose of larger companies due to, among other reasons,narrower product lines, more limited financial resources andfewer experienced managers.
Market Risk: The Fund’s share price can fall because ofweakness in the broad market, a particular industry, orspecific holdings or due to adverse political or economicdevelopments here or abroad, changes in investorpsychology, or heavy institutional selling. The price ofindividual securities may fluctuate, sometimes dramatically,from day-to-day. The prices of stocks and other equitysecurities tend to be more volatile than those of fixedincome securities.
Securities Lending Risk: Engaging in securities lendingcould increase the market and credit risk for Fundinvestments. The Fund may lose money if it does notrecover borrowed securities, the value of the collateral falls,or the value of investments made with cash collateraldeclines. If the value of either the cash collateral or theFund’s investments of the cash collateral falls below theamount owed to a borrower, the Fund also may incur lossesthat exceed the amount it earned on lending the security.Securities lending also involves the risks of delay inreceiving additional collateral or possible loss of rights in thecollateral if the borrower fails. Another risk of securitieslending is the risk that the loaned portfolio securities maynot be available to the Fund on a timely basis and the Fundmay therefore lose the opportunity to sell the securities at adesirable price.
Technology Sector Risk: Technology stocks historicallyhave experienced unusually wide price swings, causing awide variation in performance. Earnings disappointmentsand intense competition for market share can result in sharpdeclines in the prices of technology stocks.
Performance Information
The following Risk/Return Bar Chart and Table illustrate therisks of investing in the Fund by showing changes in theFund’s performance from calendar year to calendar yearand comparing the Fund’s average annual returns to thoseof the S&P 500® Index. Fees and expenses incurred at thecontract level are not reflected in the bar chart or table. If
these amounts were reflected, returns would be less thanthose shown. Of course, past performance is notnecessarily an indication of how the Fund will perform in thefuture.
2006 2007 2008 2009 2010 2011 2012 2013 2014
9.45%13.09%
-42.90%
43.12%
16.21%9.14%
1.46%
18.13%
41.19%
2015
11.04%
-50%
-40%
-30%
-20%
-10%
0%
10%
20%
30%
40%
50%
During the periods shown in the bar chart, the highest returnfor a quarter was 18.54% (quarter ending March 31, 2012)and the lowest return for a quarter was -25.29% (quarterending December 31, 2008). For the year-to-date throughJune 30, 2016, the Fund’s return was -5.83%.
Average Annual Total Returns (For the periods endedDecember 31, 2015)
1Year
5Years
10Years
Fund 11.04% 15.45% 9.20%S&P 500® Index 1.38% 12.57% 7.31%
Investment Adviser
The Fund’s investment adviser is The Variable Annuity LifeInsurance Company. The Fund is sub-advised by T. RowePrice Associates, Inc.
Portfolio Manager
Name
PortfolioManager of
the FundSince Title
Larry J. Puglia, CFA 2000 VicePresident
For important information about purchase and sales of Fundshares, taxes and payments made to broker-dealers andother financial intermediaries, please turn to the section“Important Additional Information” on page 101.
- 5 -
FUND SUMMARY: BROAD CAP VALUE INCOME FUND
Investment Objective
The Fund seeks total return through capital appreciationwith income as a secondary objective.
Fees and Expenses of the Fund
This table describes the fees and expenses that you maypay if you buy and hold shares of the Fund. The Fund’sannual operating expenses do not reflect the separateaccount fees charged in the variable annuity or variable lifeinsurance policy (“Variable Contracts”) in which the Fund isoffered. If a separate account’s fees were shown, theFund’s annual operating expenses would be higher. Pleasesee your Variable Contract prospectus for more details onthe separate account fees.
Annual Fund Operating Expenses (expenses that youpay each year as a percentage of the value of yourinvestment)
Management Fees 0.70%Other Expenses 0.22%Total Annual Fund Operating Expenses 0.92%Expense Reimbursement(1) 0.07%Total Annual Fund Operating Expenses After
Expense Reimbursement0.85%
(1) The Fund’s investment adviser, The Variable Annuity LifeInsurance Company, has contractually agreed to reimburse theexpenses of the Fund through September 30, 2017, so that theFund’s Total Annual Fund Operating Expenses After ExpenseReimbursement do not exceed 0.85%. For purposes of theExpense Limitation Agreement, “Total Annual Fund OperatingExpenses” shall not include extraordinary expenses (i.e.expenses that are unusual in nature and/or infrequent inoccurrence, such as litigation), or acquired fund fees andexpenses, brokerage commissions and other transactionalexpenses relating to the purchase and sale of portfolio securities,interest, taxes and governmental fees, and other expenses notincurred in the ordinary course of the Fund’s business. ThisExpense Limitation Agreement will continue in effect from year toyear thereafter unless terminated by the Board of Directors priorto any such renewal.
Expense Example
This Example is intended to help you compare the cost ofinvesting in the Fund with the cost of investing in othermutual funds. The Example assumes that you invest$10,000 in the Fund for the time periods indicated and thenredeem all of your shares at the end of those periods. TheExample also assumes that your investment has a 5%return each year and that the Fund’s operating expensesinclude expense reimbursements for year one. TheExample does not reflect charges imposed by the VariableContract. If the Variable Contract fees were reflected thenthe expenses would be higher. See the Variable Contractprospectus for information on such charges. Although youractual costs may be higher or lower, based on these
assumptions and the net expenses shown in the fee table,your costs would be:
1 Year 3 Years 5 Years 10 Years
$87 $286 $502 $1,125
Portfolio Turnover
The Fund pays transaction costs, such as commissions,when it buys and sells securities (or “turns over” itsportfolio). These costs, which are not reflected in annualfund operating expenses or in the example, affect theFund’s performance. During the most recent fiscal year, theFund’s portfolio turnover rate was 26% of the average valueof its portfolio.
Principal Investment Strategies of the Fund
Under normal circumstances, the Fund invests primarily inequity securities of U.S. large- and mid-cap companies thatthe sub-adviser believes are undervalued. Generally, thesecompanies will have a market capitalization of at least$1 billion, though the Fund may invest to a limited extent insmall-cap companies.
Under normal circumstances, at least 80% of the Fund’s netassets will be invested in common stocks, but it may alsoinvest in other equity securities that the sub-adviser believesprovide opportunities for total return. In addition, the Fundmay invest up to 20% of its net assets in foreign securities,including depositary receipts.
In order to generate additional income, the Fund may lendportfolio securities to broker-dealers and other financialinstitutions provided that the value of the loaned securitiesdoes not exceed 30% of the Fund’s total assets. Theseloans earn income for the Fund and are collateralized bycash, securities issued or guaranteed by the U.S.Government or its agencies or instrumentalities, and suchother securities as the Fund and the securities lendingagent may agree upon. Investors will be given at least60 days’ written notice in advance of any change to theFund’s 80% investment policy set forth above.
Principal Risks of Investing in the Fund
There can be no assurance that the Fund’s investmentobjective will be met or that the net return on an investmentin the Fund will exceed what could have been obtainedthrough other investment or savings vehicles. Shares of theFund are not bank deposits and are not guaranteed orinsured by any bank, government entity or the FederalDeposit Insurance Corporation. As with any mutual fund,there is no guarantee that the Fund will be able to achieveits investment objective. If the value of the assets of theFund goes down, you could lose money.
The following is a summary of the principal risks of investingin the Fund.
Management Risk: The investment style or strategy usedby the sub-adviser may fail to produce the intended result.The sub-adviser’s assessment of a particular security or
- 6 -
FUND SUMMARY: BROAD CAP VALUE INCOME FUND
company may prove incorrect, resulting in losses orunderperformance.
Currency Risk: Because the Fund’s foreign investmentsare generally held in foreign currencies, the Fund couldexperience gains or losses based solely on changes in theexchange rate between foreign currencies and the U.S.dollar. Such gains or losses may be substantial.
Equity Securities Risk: The Fund invests principally inequity securities and is therefore subject to the risk thatstock prices will fall and may underperform other assetclasses. Individual stock prices fluctuate from day-to-dayand may decline significantly. The prices of individual stocksmay be negatively affected by poor company results orother factors affecting individual prices, as well as industryand/or economic trends and developments affectingindustries or the securities market as a whole.
Depositary Receipts Risk: Depositary receipts aregenerally subject to the same risks as the foreign securitiesthat they evidence or into which they may be converted.Depositary receipts may or may not be jointly sponsored bythe underlying issuer. The issuers of unsponsoreddepositary receipts are not obligated to disclose informationthat is considered material in the United States. Therefore,there may be less information available regarding theissuers and there may not be a correlation between suchinformation and the market value of the depositary receipts.Certain depositary receipts are not listed on an exchangeand therefore may be considered to be illiquid securities.
Foreign Investment Risk: Investment in foreign securitiesinvolves risks due to several factors, such as illiquidity, thelack of public information, changes in the exchange ratesbetween foreign currencies and the U.S. dollar, unfavorablepolitical, social and legal developments, or economic andfinancial instability. Foreign companies are not subject tothe U.S. accounting and financial reporting standards andmay have riskier settlement procedures. U.S. investmentsthat are denominated in foreign currencies or that are tradedin foreign markets, or securities of U.S. companies thathave significant foreign operations may be subject to foreigninvestment risk.
Large- and Mid-Cap Company Risk: Investing primarily inlarge- and mid-cap companies carries the risk that due tocurrent market conditions these companies may be out offavor with investors. Large-cap companies may be unableto respond quickly to new competitive challenges or attainthe high growth rate of successful smaller companies.Stocks of mid-cap companies may be more volatile thanthose of larger companies due to, among other reasons,narrower product lines, more limited financial resources andfewer experienced managers.
Market Risk: The Fund’s share price can fall because ofweakness in the broad market, a particular industry, orspecific holdings or due to adverse political or economicdevelopments here or abroad, changes in investorpsychology, or heavy institutional selling. The price of
individual securities may fluctuate, sometimes dramatically,from day-to-day. The prices of stocks and other equitysecurities tend to be more volatile than those of fixedincome securities.
Value Style Risk: Generally, “value” stocks are stocks ofcompanies that the sub-adviser believes are currentlyundervalued in the marketplace. The sub-adviser’sjudgment that a particular security is undervalued in relationto the company’s fundamental economic value may proveincorrect and the price of the company’s stock may fall ormay not approach the value the sub-adviser has placedon it.
Small-Cap Company Risk: Investing in small-capcompanies carries the risk that due to current marketconditions these companies may be out of favor withinvestors. Small companies often are in the early stages ofdevelopment with limited product lines, markets, or financialresources and managements lacking depth and experience,which may cause their stock prices to be more volatile thanthose of larger companies. Small company stocks may beless liquid yet subject to abrupt or erratic price movements.It may take a substantial period of time before the Fundrealizes a gain on an investment in a small-cap company, ifit realizes any gain at all.
Sector Risk: Companies with similar characteristics may begrouped together in broad categories called sectors. Sectorrisk is the risk that securities of companies within specificsectors of the economy can perform differently than theoverall market. This may be due to changes in such thingsas the regulatory or competitive environment or to changesin investor perceptions regarding a sector. Because theFund may allocate relatively more assets to certain sectorsthan others, the Fund’s performance may be moresusceptible to any developments which affect those sectorsemphasized by the Fund.
Securities Lending Risk: Engaging in securities lendingcould increase the market and credit risk for Fundinvestments. The Fund may lose money if it does notrecover borrowed securities, the value of the collateral falls,or the value of investments made with cash collateraldeclines. If the value of either the cash collateral or theFund’s investments of the cash collateral falls below theamount owed to a borrower, the Fund also may incur lossesthat exceed the amount it earned on lending the security.Securities lending also involves the risks of delay inreceiving additional collateral or possible loss of rights in thecollateral if the borrower fails. Another risk of securitieslending is the risk that the loaned portfolio securities maynot be available to the Fund on a timely basis and the Fundmay therefore lose the opportunity to sell the securities at adesirable price.
Performance Information
The following Risk/Return Bar Chart and Table illustrate therisks of investing in the Fund by showing changes in theFund’s performance from calendar year to calendar year
- 7 -
FUND SUMMARY: BROAD CAP VALUE INCOME FUND
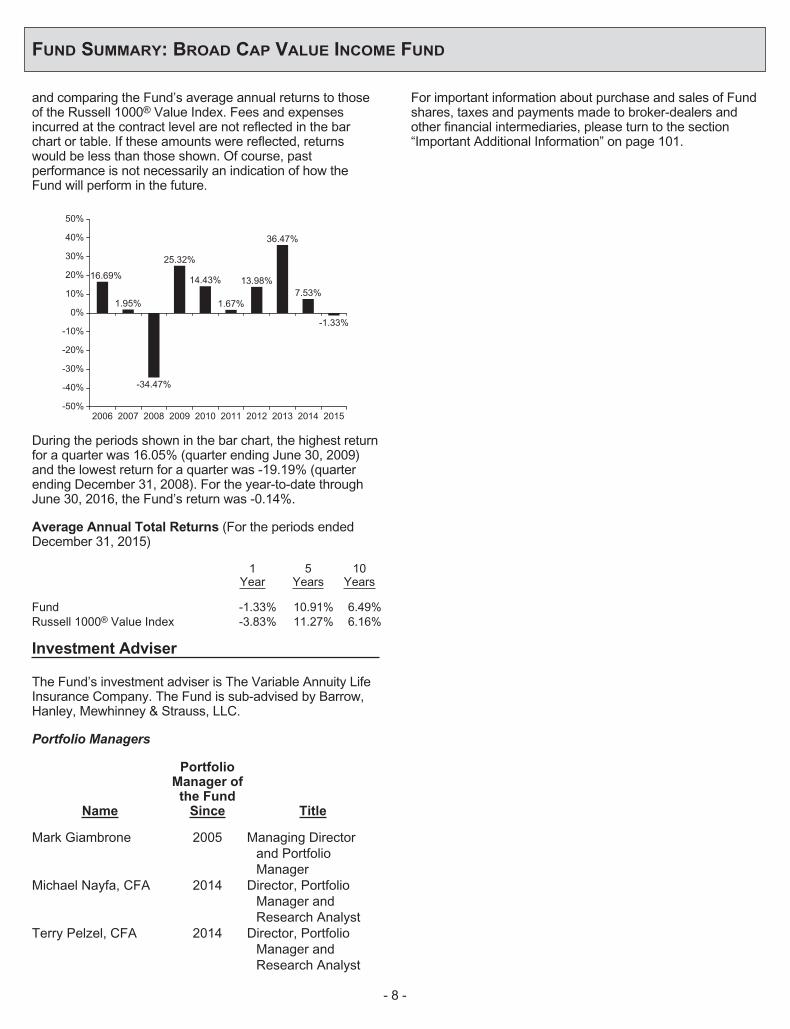
and comparing the Fund’s average annual returns to thoseof the Russell 1000® Value Index. Fees and expensesincurred at the contract level are not reflected in the barchart or table. If these amounts were reflected, returnswould be less than those shown. Of course, pastperformance is not necessarily an indication of how theFund will perform in the future.
2006 2007 2008 2009 2010 2011 2012 2013 2014
16.69%
1.95%
-34.47%
25.32%
14.43%7.53%
1.67%
13.98%
36.47%
-50%
-40%
-30%
-20%
-10%
0%
10%
20%
30%
40%
50%
-1.33%
2015
During the periods shown in the bar chart, the highest returnfor a quarter was 16.05% (quarter ending June 30, 2009)and the lowest return for a quarter was -19.19% (quarterending December 31, 2008). For the year-to-date throughJune 30, 2016, the Fund’s return was -0.14%.
Average Annual Total Returns (For the periods endedDecember 31, 2015)
1Year
5Years
10Years
Fund -1.33% 10.91% 6.49%Russell 1000® Value Index -3.83% 11.27% 6.16%
Investment Adviser
The Fund’s investment adviser is The Variable Annuity LifeInsurance Company. The Fund is sub-advised by Barrow,Hanley, Mewhinney & Strauss, LLC.
Portfolio Managers
Name
PortfolioManager ofthe Fund
Since Title
Mark Giambrone 2005 Managing Directorand PortfolioManager
Michael Nayfa, CFA 2014 Director, PortfolioManager andResearch Analyst
Terry Pelzel, CFA 2014 Director, PortfolioManager andResearch Analyst
For important information about purchase and sales of Fundshares, taxes and payments made to broker-dealers andother financial intermediaries, please turn to the section“Important Additional Information” on page 101.
- 8 -

FUND SUMMARY: CAPITAL CONSERVATION FUND
Investment Objective
The Fund seeks the highest possible total return consistentwith preservation of capital through current income andcapital gains on investments in intermediate and long-termdebt instruments and other income producing securities.
Fees and Expenses of the Fund
This table describes the fees and expenses that you maypay if you buy and hold shares of the Fund. The Fund’sannual operating expenses do not reflect the separateaccount fees charged in the variable annuity or variable lifeinsurance policy (“Variable Contracts”) in which the Fund isoffered. If a separate account’s fees were shown, theFund’s annual operating expenses would be higher. Pleasesee your Variable Contract prospectus for more details onthe separate account fees.
Annual Fund Operating Expenses (expenses that youpay each year as a percentage of the value of yourinvestment)
Management Fees 0.50%Other Expenses 0.14%Total Annual Fund Operating Expenses 0.64%
Expense Example
This Example is intended to help you compare the cost ofinvesting in the Fund with the cost of investing in othermutual funds. The Example assumes that you invest$10,000 in the Fund for the time periods indicated and thenredeem all of your shares at the end of those periods. TheExample also assumes that your investment has a 5%return each year and that the Fund’s operating expensesremain the same. The Example does not reflect chargesimposed by the Variable Contract. If the Variable Contractfees were reflected then the expenses would be higher. Seethe Variable Contract prospectus for information on suchcharges. Although your actual costs may be higher or lower,based on these assumptions and the net expenses shownin the fee table, your costs would be:
1 Year 3 Years 5 Years 10 Years
$65 $205 $357 $798
Portfolio Turnover
The Fund pays transaction costs, such as commissions,when it buys and sells securities (or “turns over” itsportfolio). These costs, which are not reflected in annualfund operating expenses or in the example, affect theFund’s performance. During the most recent fiscal year, theFund’s portfolio turnover rate was 71% of the average valueof its portfolio.
Principal Investment Strategies of the Fund
The Fund invests in investment grade bonds to seek toprovide you with the highest possible total return from
current income and capital gains while preserving yourinvestment. The sub-adviser may engage in frequent andactive trading of portfolio securities to achieve the Fund’sinvestment objective.
The Fund invests at least 75% of the Fund’s total assets atthe time of purchase in investment-grade, intermediate- andlong-term corporate bonds, including dollar denominatedforeign corporate bonds, securities issued or guaranteed bythe U.S. Government, mortgage- backed securities, asset-backed securities, securities issued by the Federal NationalMortgage Association (“FNMA”) or the Federal Home LoanMortgage Corporation (“FHLMC”), collateralized mortgageobligations (“CMOs”), and high quality money marketsecurities.
In order to generate additional income, the Fund may lendportfolio securities to broker-dealers and other financialinstitutions provided that the value of the loaned securitiesdoes not exceed 30% of the Fund’s total assets. Theseloans earn income for the Fund and are collateralized bycash, securities issued or guaranteed by the U.S.Government or its agencies or instrumentalities, and suchother securities as the Fund and the securities lendingagent may agree upon.
Principal Risks of Investing in the Fund
There can be no assurance that the Fund’s investmentobjective will be met or that the net return on an investmentin the Fund will exceed what could have been obtainedthrough other investment or savings vehicles. Shares of theFund are not bank deposits and are not guaranteed orinsured by any bank, government entity or the FederalDeposit Insurance Corporation. As with any mutual fund,there is no guarantee that the Fund will be able to achieveits investment objective. If the value of the assets of theFund goes down, you could lose money.
The following is a summary of the principal risks of investingin the Fund.
Management Risk: The investment style or strategy usedby the sub-adviser may fail to produce the intended result.The sub-adviser’s assessment of a particular security orcompany may prove incorrect, resulting in losses orunderperformance.
Call or Prepayment Risk: During periods of falling interestrates, a bond issuer may “call” a bond to repay it before itsmaturity date. The Fund may only be able to invest thebond’s proceeds at lower interest rates, resulting in adecline in the Fund’s income.
Credit Risk: The Fund may suffer losses if the issuer of afixed income security owned by the Fund is unable to makeinterest or principal payments.
Currency Risk: Because the Fund’s foreign investmentsare generally held in foreign currencies, the Fund couldexperience gains or losses based solely on changes in the
- 9 -
FUND SUMMARY: CAPITAL CONSERVATION FUND
exchange rate between foreign currencies and the U.S.dollar. Such gains or losses may be substantial.
Interest Rate Risk: The value of fixed income securitiesmay decline when interest rates go up or increase wheninterest rates go down. The interest earned on fixed incomesecurities may decline when interest rates go down orincrease when interest rates go up. Longer-term and lowercoupon bonds tend to be more sensitive to changes ininterest rates. The Fund may be subject to a greater risk ofrising interest rates due to the current period of historicallylow rates and the effect of potential government fiscal policyinitiatives and resulting market reaction to these initiatives.
Foreign Investment Risk: Investment in foreign securitiesinvolves risks due to several factors, such as illiquidity, thelack of public information, changes in the exchange ratesbetween foreign currencies and the U.S. dollar, unfavorablepolitical, social and legal developments, or economic andfinancial instability. Foreign companies are not subject tothe U.S. accounting and financial reporting standards andmay have riskier settlement procedures. U.S. investmentsthat are denominated in foreign currencies or that are tradedin foreign markets, or securities of U.S. companies thathave significant foreign operations may be subject to foreigninvestment risk.
Market Risk: The Fund’s share price can fall because ofweakness in the broad market, a particular industry, orspecific holdings or due to adverse political or economicdevelopments here or abroad, changes in investorpsychology, or heavy institutional selling. The price ofindividual securities may fluctuate, sometimes dramatically,from day-to-day.
Mortgage-Backed Securities Risk: Mortgage-backedsecurities are similar to other debt securities in that they aresubject to credit risk and interest rate risk. Mortgage-backedsecurities may be issued or guaranteed by the U.S.Government, its agencies or instrumentalities or may benon-guaranteed securities issued by private issuers. CMOs,which are a type of mortgage-backed security, may be lessliquid and may exhibit greater price volatility than othertypes of mortgage- and asset-backed securities.
Asset-Backed Securities Risk: Certain asset-backedsecurities are issued by private parties rather than the U.S.Government or its agencies or government-sponsoredentities. If a private issuer fails to pay interest or repayprincipal, the assets backing these securities may beinsufficient to support the payments on the securities.
Risks of Investing in Money Market Securities: Aninvestment in the Fund is subject to the risk that the value ofits investments in high-quality short-term obligations(“money market securities”) may be subject to changes ininterest rates, changes in the rating of any money marketsecurity and in the ability of an issuer to make payments ofinterest and principal.
Active Trading Risk: High portfolio turnover rates that areassociated with active trading may result in highertransaction costs, which can adversely affect the Fund’s
performance. Active trading tends to be more pronouncedduring periods of increased market volatility.
Securities Lending Risk: Engaging in securities lendingcould increase the market and credit risk for Fundinvestments. The Fund may lose money if it does notrecover borrowed securities, the value of the collateral falls,or the value of investments made with cash collateraldeclines. If the value of either the cash collateral or theFund’s investments of the cash collateral falls below theamount owed to a borrower, the Fund also may incur lossesthat exceed the amount it earned on lending the security.Securities lending also involves the risks of delay inreceiving additional collateral or possible loss of rights in thecollateral if the borrower fails. Another risk of securitieslending is the risk that the loaned portfolio securities maynot be available to the Fund on a timely basis and the Fundmay therefore lose the opportunity to sell the securities at adesirable price.
U.S. Government Obligations Risk: U.S Treasuryobligations are backed by the “full faith and credit” of theU.S. Government and are generally considered to have lowcredit risk. Unlike U.S. Treasury obligations, securitiesissued or guaranteed by federal agencies or authorities andU.S. Government-sponsored instrumentalities orenterprises, including FNMA and FHLMC, may or may notbe backed by the full faith and credit of the U.S.Government and are therefore subject to greater credit riskthan securities issued or guaranteed by the U.S. Treasury.
Performance Information
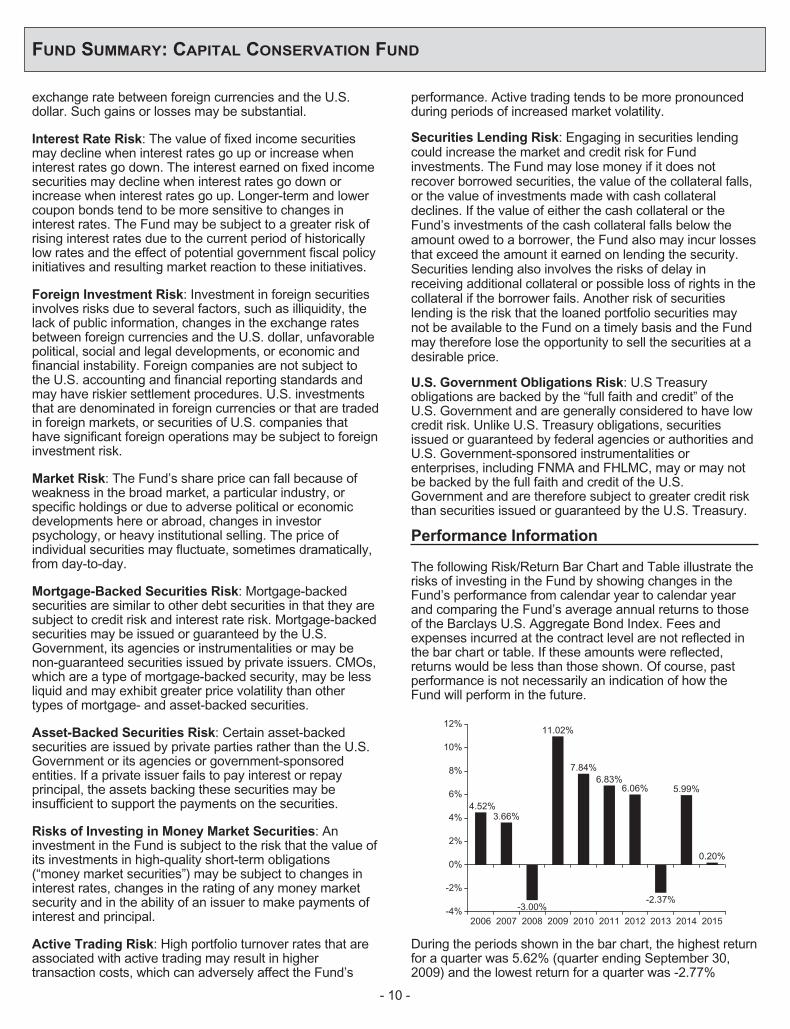
The following Risk/Return Bar Chart and Table illustrate therisks of investing in the Fund by showing changes in theFund’s performance from calendar year to calendar yearand comparing the Fund’s average annual returns to thoseof the Barclays U.S. Aggregate Bond Index. Fees andexpenses incurred at the contract level are not reflected inthe bar chart or table. If these amounts were reflected,returns would be less than those shown. Of course, pastperformance is not necessarily an indication of how theFund will perform in the future.
2006 2007 2008 2009 2010 2011 2012 2013 2014
4.52%3.66%
-3.00%
11.02%
7.84%
5.99%6.83%
6.06%
-2.37%
2015
0.20%
-4%
-2%
0%
2%
4%
6%
8%
10%
12%
During the periods shown in the bar chart, the highest returnfor a quarter was 5.62% (quarter ending September 30,2009) and the lowest return for a quarter was -2.77%
- 10 -

FUND SUMMARY: CAPITAL CONSERVATION FUND
(quarter ending June 30, 2013). For the year-to-datethrough June 30, 2016, the Fund’s return was 4.97%.
Average Annual Total Returns (For the periods endedDecember 31, 2015)
1Year
5Years
10Years
Fund 0.20% 3.27% 3.99%Barclays U.S. Aggregate Bond
Index 0.55% 3.25% 4.51%
Investment Adviser
The Fund’s investment adviser is The Variable Annuity LifeInsurance Company. The Fund is sub-advised byPineBridge Investments LLC.
Portfolio Managers
Name
PortfolioManager ofthe Fund
Since Title
Dana G. Burns 2008 Managing Directorand Senior PortfolioManager,Investment GradeFixed Income
Robert VandenAssem, CFA
2002 Managing Directorand Head ofInvestment GradeFixed Income
For important information about purchase and sales of Fundshares, taxes and payments made to broker-dealers andother financial intermediaries, please turn to the section“Important Additional Information” on page 101.
- 11 -

FUND SUMMARY: CORE EQUITY FUND
Investment Objective
The Fund seeks to provide long-term growth of capitalthrough investment primarily in equity securities.
Fees and Expenses of the Fund
This table describes the fees and expenses that you maypay if you buy and hold shares of the Fund. The Fund’sannual operating expenses do not reflect the separateaccount fees charged in the variable annuity or variable lifeinsurance policy (“Variable Contracts”) in which the Fund isoffered. If a separate account’s fees were shown, theFund’s annual operating expenses would be higher. Pleasesee your Variable Contract prospectus for more details onthe separate account fees.
Annual Fund Operating Expenses (expenses that youpay each year as a percentage of the value of yourinvestment)
Management Fees 0.80%Other Expenses 0.12%Total Annual Fund Operating Expenses 0.92%Expense Reimbursement(1) 0.12%Total Annual Fund Operating Expenses After
Expense Reimbursement0.80%
(1) The Fund’s investment adviser, The Variable Annuity LifeInsurance Company, has contractually agreed to reimburse theexpenses of the Fund through September 30, 2017, so that theFund’s Total Annual Fund Operating Expenses After ExpenseReimbursement do not exceed 0.80%. For purposes of theExpense Limitation Agreement, “Total Annual Fund OperatingExpenses” shall not include extraordinary expenses (i.e.expenses that are unusual in nature and/or infrequent inoccurrence, such as litigation), or acquired fund fees andexpenses, brokerage commissions and other transactionalexpenses relating to the purchase and sale of portfolio securities,interest, taxes and governmental fees, and other expenses notincurred in the ordinary course of the Fund’s business. ThisExpense Limitation Agreement will continue in effect from year toyear thereafter unless terminated by the Board of Directors priorto any such renewal.
Expense Example
This Example is intended to help you compare the cost ofinvesting in the Fund with the cost of investing in othermutual funds. The Example assumes that you invest$10,000 in the Fund for the time periods indicated and thenredeem all of your shares at the end of those periods. TheExample also assumes that your investment has a 5%return each year and that the Fund’s operating expensesinclude expense reimbursements for year one. TheExample does not reflect charges imposed by the VariableContract. If the Variable Contract fees were reflected thenthe expenses would be higher. See the Variable Contractprospectus for information on such charges. Although youractual costs may be higher or lower, based on these
assumptions and the net expenses shown in the fee table,your costs would be:
1 Year 3 Years 5 Years 10 Years
$82 $281 $498 $1,120
Portfolio Turnover
The Fund pays transaction costs, such as commissions,when it buys and sells securities (or “turns over” itsportfolio). These costs, which are not reflected in annualfund operating expenses or in the example, affect theFund’s performance. During the most recent fiscal year, theFund’s portfolio turnover rate was 41% of the average valueof its portfolio.
Principal Investment Strategies of the Fund
The Fund invests primarily in quality large-cap companieswith long-term growth potential. Important characteristics ofsuch companies include: a strong management team, aleadership position within an industry, a globally competitivefocus, a strong balance sheet and a high return on equity.The Fund invests, under normal circumstances, at least 80%of net assets, at the time of purchase, in equity securities,consisting primarily of common stocks. The sub-adviser mayengage in frequent and active trading of portfolio securitiesto achieve the Fund’s investment objective.
In order to generate additional income, the Fund may lendportfolio securities to broker-dealers and other financialinstitutions provided that the value of the loaned securitiesdoes not exceed 30% of the Fund’s total assets. Theseloans earn income for the Fund and are collateralized bycash, securities issued or guaranteed by the U.S.Government or its agencies or instrumentalities, and suchother securities as the Fund and the securities lendingagent may agree upon. Investors will be given at least60 days’ written notice in advance of any change to theFund’s 80% investment policy set forth above.
Principal Risks of Investing in the Fund
There can be no assurance that the Fund’s investmentobjective will be met or that the net return on an investmentin the Fund will exceed what could have been obtainedthrough other investment or savings vehicles. Shares of theFund are not bank deposits and are not guaranteed orinsured by any bank, government entity or the FederalDeposit Insurance Corporation. As with any mutual fund,there is no guarantee that the Fund will be able to achieveits investment objective. If the value of the assets of theFund goes down, you could lose money.
The following is a summary of the principal risks of investingin the Fund.
Management Risk: The investment style or strategy usedby the sub-adviser may fail to produce the intended result.The sub-adviser’s assessment of a particular security orcompany may prove incorrect, resulting in losses orunderperformance.
- 12 -

FUND SUMMARY: CORE EQUITY FUND
Growth Style Risk: Generally, “growth” stocks are stocksof companies that the sub-adviser believes have anticipatedearnings ranging from steady to accelerated growth. Manyinvestors buy growth stocks because of anticipated superiorearnings growth, but earnings disappointments often resultin sharp price declines. Growth companies usually invest ahigh portion of earnings in their own businesses so theirstocks may lack the dividends that can cushion share pricesin a down market. In addition, the value of fast growthstocks may be more sensitive to changes in current orexpected earnings than the values of other stocks, becausegrowth stocks trade at higher prices relative to currentearnings.
Equity Securities Risk: The Fund invests primarily inequity securities and is therefore subject to the risk thatstock prices will fall and may underperform other assetclasses. Individual stock prices fluctuate from day-to-dayand may decline significantly. The prices of individual stocksmay be negatively affected by poor company results orother factors affecting individual prices, as well as industryand/or economic trends and developments affectingindustries or the securities market as a whole.
Large-Cap Company Risk: Investing primarily in large-capcompanies carries the risk that due to current marketconditions these companies may be out of favor withinvestors. Large-cap companies may be unable to respondquickly to new competitive challenges or attain the highgrowth rate of successful smaller companies.
Market Risk: The Fund’s share price can fall because ofweakness in the broad market, a particular industry, orspecific holdings or due to adverse political or economicdevelopments here or abroad, changes in investorpsychology, or heavy institutional selling. The price ofindividual securities may fluctuate, sometimes dramatically,from day-to-day. The prices of stocks and other equitysecurities tend to be more volatile than those of fixedincome securities.
Securities Lending Risk: Engaging in securities lendingcould increase the market and credit risk for Fundinvestments. The Fund may lose money if it does notrecover borrowed securities, the value of the collateral falls,or the value of investments made with cash collateraldeclines. If the value of either the cash collateral or theFund’s investments of the cash collateral falls below theamount owed to a borrower, the Fund also may incur lossesthat exceed the amount it earned on lending the security.Securities lending also involves the risks of delay inreceiving additional collateral or possible loss of rights in thecollateral if the borrower fails. Another risk of securitieslending is the risk that the loaned portfolio securities maynot be available to the Fund on a timely basis and the Fundmay therefore lose the opportunity to sell the securities at adesirable price.
Performance Information
The following Risk/Return Bar Chart and Table illustrate therisks of investing in the Fund by showing changes in theFund’s performance from calendar year to calendar yearand comparing the Fund’s average annual returns to thoseof the Russell 1000® Index. Fees and expenses incurred atthe contract level are not reflected in the bar chart or table.If these amounts were reflected, returns would be less thanthose shown. Of course, past performance is notnecessarily an indication of how the Fund will perform in thefuture.
Wellington Management Company LLP served as a sub-adviser from September 1, 1999 to March 5, 2007 and EdgeAsset Management, Inc. (formerly, WM Advisors, Inc.)served as a co-sub-adviser from January 1, 2002 toMarch 5, 2007. BlackRock Investment Management, LLC(“BlackRock”) assumed sub-advisory duties of the Fund onMarch 5, 2007.
2006 2007 2008 2009 2010 2011 2012 2013 2014
11.73%
2.98%
-37.07%
23.35%
12.82% 11.52%
-0.48%
14.20%
34.87%
-50%
-40%
-30%
-20%
-10%
0%
10%
20%
30%
40%
-1.85%
2015
During the periods shown in the bar chart, the highest returnfor a quarter was 14.49% (quarter ending September 30,2009) and the lowest return for a quarter was -20.75%(quarter ending December 31, 2008). For the year-to-datethrough June 30, 2016, the Fund’s return was 0.21%.
Average Annual Total Returns (For the periods endedDecember 31, 2015)
1Year
5Years
10Years
Fund -1.85% 10.90% 5.39%Russell 1000® Index 0.92% 12.44% 7.40%
Investment Adviser
The Fund’s investment adviser is The Variable Annuity LifeInsurance Company. The Fund is sub-advised byBlackRock.
- 13 -
FUND SUMMARY: CORE EQUITY FUND
Portfolio Managers
Name
PortfolioManager ofthe Fund
Since Title
Peter Stournaras, CFA 2012 Managing DirectorBartlett Geer, CFA 2012 Managing DirectorCarrie King 2013 Managing Director
For important information about purchase and sales of Fundshares, taxes and payments made to broker-dealers andother financial intermediaries, please turn to the section“Important Additional Information” on page 101.
- 14 -

FUND SUMMARY: DIVIDEND VALUE FUND
Investment Objective
The Fund seeks capital growth by investing in commonstocks. Income is a secondary objective.
Fees and Expenses of the Fund
This table describes the fees and expenses that you maypay if you buy and hold shares of the Fund. The Fund’sannual operating expenses do not reflect the separateaccount fees charged in the variable annuity or variable lifeinsurance policy (“Variable Contracts”) in which the Fund isoffered. If a separate account’s fees were shown, theFund’s annual operating expenses would be higher. Pleasesee your Variable Contract prospectus for more details onthe separate account fees.
Annual Fund Operating Expenses (expenses that youpay each year as a percentage of the value of yourinvestment)
Management Fees 0.73%Other Expenses 0.10%Total Annual Fund Operating Expenses 0.83%Expense Reimbursement(1) 0.01%Total Annual Fund Operating Expenses After
Expense Reimbursement0.82%
(1) The Fund’s investment adviser, The Variable Annuity LifeInsurance Company, has contractually agreed to reimburse theexpenses of the Fund through September 30, 2017, so that theFund’s Total Annual Fund Operating Expenses After ExpenseReimbursement do not exceed 0.82%. For purposes of theExpense Limitation Agreement, “Total Annual Fund OperatingExpenses” shall not include extraordinary expenses (i.e.expenses that are unusual in nature and/or infrequent inoccurrence, such as litigation), or acquired fund fees andexpenses, brokerage commissions and other transactionalexpenses relating to the purchase and sale of portfolio securities,interest, taxes and governmental fees, and other expenses notincurred in the ordinary course of the Fund’s business. ThisExpense Limitation Agreement will continue in effect from year toyear thereafter unless terminated by the Board of Directors priorto any such renewal.
Expense Example
This Example is intended to help you compare the cost ofinvesting in the Fund with the cost of investing in othermutual funds. The Example assumes that you invest$10,000 in the Fund for the time periods indicated and thenredeem all of your shares at the end of those periods. TheExample also assumes that your investment has a 5%return each year and that the Fund’s operating expensesinclude expense reimbursement for one year. The Exampledoes not reflect charges imposed by the Variable Contract.If the Variable Contract fees were reflected then theexpenses would be higher. See the Variable Contractprospectus for information on such charges. Although youractual costs may be higher or lower, based on theseassumptions and the net expenses shown in the fee table,your costs would be:
1 Year 3 Years 5 Years 10 Years
$84 $264 $460 $1,024
Portfolio Turnover
The Fund pays transaction costs, such as commissions,when it buys and sells securities (or “turns over” its portfolio).These costs, which are not reflected in annual fund operatingexpenses or in the example, affect the Fund’s performance.During the most recent fiscal year, the Fund’s portfolioturnover rate was 45% of the average value of its portfolio.
Principal Investment Strategies of the Fund
The Fund seeks to achieve its objective by investingprimarily in a diversified portfolio of equity securitiesincluding common stock, preferred stock and convertiblesecurities. Under normal circumstances, the Fund will investat least 80% of its net assets in dividend paying equitysecurities. The Fund may invest in securities of companieswith any market capitalization, but will generally focus onlarge cap securities. In selecting portfolio securities, one ofthe sub-advisers will generally employ a value-orientedanalysis, but may purchase equity securities based on agrowth-oriented analysis when such securities paydividends or the sub-adviser believes such securities haveparticularly good prospects for capital appreciation. Theother sub-adviser uses rules-based strategies to selectportfolio securities and will select up to thirty high dividendyielding common stocks, which will be evaluated andadjusted at the discretion of the portfolio manager on anannual basis.
The Fund may also invest in convertible securities and non-convertible preferred stock.
In order to generate additional income, the Fund may lendportfolio securities to broker-dealers and other financialinstitutions provided that the value of the loaned securitiesdoes not exceed 30% of the Fund’s total assets. Theseloans earn income for the Fund and are collateralized bycash, securities issued or guaranteed by the U.S.Government or its agencies or instrumentalities, and suchother securities as the Fund and the securities lendingagent may agree upon. Investors will be given at least60 days’ written notice in advance of any change to theFund’s 80% investment policy set forth above.
Principal Risks of Investing in the Fund
There can be no assurance that the Fund’s investmentobjective will be met or that the net return on an investmentin the Fund will exceed what could have been obtainedthrough other investment or savings vehicles. Shares of theFund are not bank deposits and are not guaranteed orinsured by any bank, government entity or the FederalDeposit Insurance Corporation. As with any mutual fund,there is no guarantee that the Fund will be able to achieveits investment objective. If the value of the assets of theFund goes down, you could lose money.
- 15 -

FUND SUMMARY: DIVIDEND VALUE FUND
The following is a summary of the principal risks of investingin the Fund.
Management Risk: The investment style or strategy usedby the sub-advisers may fail to produce the intended result.The sub-adviser’s assessment of a particular security orcompany may prove incorrect, resulting in losses orunderperformance.
Equity Securities Risk: The Fund invests principally inequity securities and is therefore subject to the risk thatstock prices will fall and may underperform other assetclasses. Individual stock prices fluctuate from day-to-dayand may decline significantly. The prices of individual stocksmay be negatively affected by poor company results orother factors affecting individual prices, as well as industryand/or economic trends and developments affectingindustries or the securities market as a whole.
Value Style Risk: Generally, “value” stocks are stocks ofcompanies that the sub-adviser believes are currentlyundervalued in the marketplace. The sub-adviser’sjudgment that a particular security is undervalued in relationto the company’s fundamental economic value may proveincorrect and the price of the company’s stock may fall ormay not approach the value the sub-adviser has placedon it.
Growth Style Risk: Generally, “growth” stocks are stocksof companies that the sub-adviser believes have anticipatedearnings ranging from steady to accelerated growth. Manyinvestors buy growth stocks because of anticipated superiorearnings growth, but earnings disappointments often resultin sharp price declines. Growth companies usually invest ahigh portion of earnings in their own businesses so theirstocks may lack the dividends that can cushion share pricesin a down market. In addition, the value of fast growthstocks may be more sensitive to changes in current orexpected earnings than the values of other stocks, becausegrowth stocks trade at higher prices relative to currentearnings.
Convertible Securities Risk: Convertible security valuesmay be affected by market interest rates, issuer defaultsand underlying common stock values; security values mayfall if market interest rates rise and rise if market interestrates fall. Additionally, an issuer may have the right to buyback the securities at a time unfavorable to the Fund.
Preferred Stock Risk: Unlike common stock, preferredstock generally pays a fixed dividend from a company’searnings and may have a preference over common stock onthe distribution of a company’s assets in the event ofbankruptcy or liquidation. Preferred stockholders’ liquidationrights are subordinate to the company’s debt holders andcreditors. If interest rates rise, the fixed dividend onpreferred stocks may be less attractive and the price ofpreferred stocks may decline. Preferred stockholderstypically do not have voting rights.
Income Producing Stock Availability Risk: Incomeproducing common stock meeting the Fund’s investment
criteria may not be widely available and/or may be highlyconcentrated in only a few market sectors, thus limiting theability of the Fund to produce current income whileremaining fully diversified.
Large-Cap Company Risk: Investing primarily in large-capcompanies carries the risk that due to current marketconditions these companies may be out of favor withinvestors. Large-cap companies may be unable to respondquickly to new competitive challenges or attain the highgrowth rate of successful smaller companies.
Market Risk: The Fund’s share price can fall because ofweakness in the broad market, a particular industry, orspecific holdings or due to adverse political or economicdevelopments here or abroad, changes in investorpsychology, or heavy institutional selling. The price ofindividual securities may fluctuate, sometimes dramatically,from day-to-day. The prices of stocks and other equitysecurities tend to be more volatile than those of fixedincome securities.
Mid-Cap Company Risk: Investing primarily in mid-capcompanies carries the risk that due to current marketconditions these companies may be out of favor withinvestors. Stocks of mid-cap companies may be morevolatile than those of larger companies due to, among otherreasons, narrower product lines, more limited financialresources and fewer experienced managers.
Small-Cap Company Risk: Investing primarily in small-capcompanies carries the risk that due to current marketconditions these companies may be out of favor withinvestors. Small companies often are in the early stages ofdevelopment with limited product lines, markets, or financialresources and managements lacking depth and experience,which may cause their stock prices to be more volatile thanthose of larger companies. Small company stocks may beless liquid yet subject to abrupt or erratic price movements.It may take a substantial period of time before the Fundrealizes a gain on an investment in a small-cap company, ifit realizes any gain at all.
Securities Lending Risk: Engaging in securities lendingcould increase the market and credit risk for Fundinvestments. The Fund may lose money if it does notrecover borrowed securities, the value of the collateral falls,or the value of investments made with cash collateraldeclines. If the value of either the cash collateral or theFund’s investments of the cash collateral falls below theamount owed to a borrower, the Fund also may incur lossesthat exceed the amount it earned on lending the security.Securities lending also involves the risks of delay inreceiving additional collateral or possible loss of rights in thecollateral if the borrower fails. Another risk of securitieslending is the risk that the loaned portfolio securities maynot be available to the Fund on a timely basis and the Fundmay therefore lose the opportunity to sell the securities at adesirable price.
- 16 -

FUND SUMMARY: DIVIDEND VALUE FUND
Performance Information
The following Risk/Return Bar Chart and Table illustrate therisks of investing in the Fund by showing changes in theFund’s performance from calendar year to calendar yearand comparing the Fund’s average annual returns to thoseof the Russell 1000® Value Index. Fees and expensesincurred at the contract level are not reflected in the barchart or table. If these amounts were reflected, returnswould be less than those shown. Of course, pastperformance is not necessarily an indication of how theFund will perform in the future.
Effective June 7, 2010, the Fund’s investment strategychanged from investing predominantly in large-capcompanies with a value style to investing at least 80% of itsassets in dividend paying equity securities, which mayinclude both value- and growth-oriented styles.
Prior to June 7, 2010, the Fund was sub-advised byAmerican Century Investment Management, Inc. BlackRockInvestment Management, LLC (“BlackRock”) andSunAmerica Asset Management, LLC (“SAAMCo”)assumed co-sub-advisory duties for the Fund on June 7,2010.
As of June 30, 2016, BlackRock managed approximately60% of the Fund’s assets and SAAMCo managedapproximately 40% of the Fund’s assets. The percentage ofthe Fund’s assets that each sub-adviser manages may, atthe adviser’s discretion, change from time to time.
2006 2007 2008 2009 2010 2011 2012 2013 2015-40%
-30%
-20%
-10%
0%
10%
20%
30%
40%
17.14%
-0.45%
-35.23%
18.99%14.04%
30.07%
8.17%12.57%
-0.66%
2014
9.22%
During the periods shown in the bar chart, the highest returnfor a quarter was 15.59% (quarter ending June 30, 2009)and the lowest return for a quarter was -20.47% (quarterending December 31, 2008). For the year-to-date throughJune 30, 2016, the Fund’s return was 6.60%.
Average Annual Total Returns (For the periods endedDecember 31, 2015)
1Year
5Years
10Years
Fund -0.66% 11.44% 5.83%Russell 1000® Value Index -3.83% 11.27% 6.16%
Investment Adviser
The Fund’s investment adviser is The Variable Annuity LifeInsurance Company. The Fund is sub-advised byBlackRock and SAAMCo.
Portfolio Managers
Name
PortfolioManager ofthe Fund
Since Title
BlackRockRobert M. Shearer,
CFA2010 Managing Director
and PortfolioManager
David J. Cassese,CFA
2011 Director andPortfolio Manager
Tony DeSpirito 2014 Managing Directorand PortfolioManager
SAAMCoTimothy Pettee 2013 Lead Portfolio
Manager andChief InvestmentOfficer
Andrew Sheridan 2013 Co-PortfolioManager andVice President
Timothy Campion 2013 Co-PortfolioManager andVice President
For important information about purchase and sales of Fundshares, taxes and payments made to broker-dealers andother financial intermediaries, please turn to the section“Important Additional Information” on page 101.
- 17 -
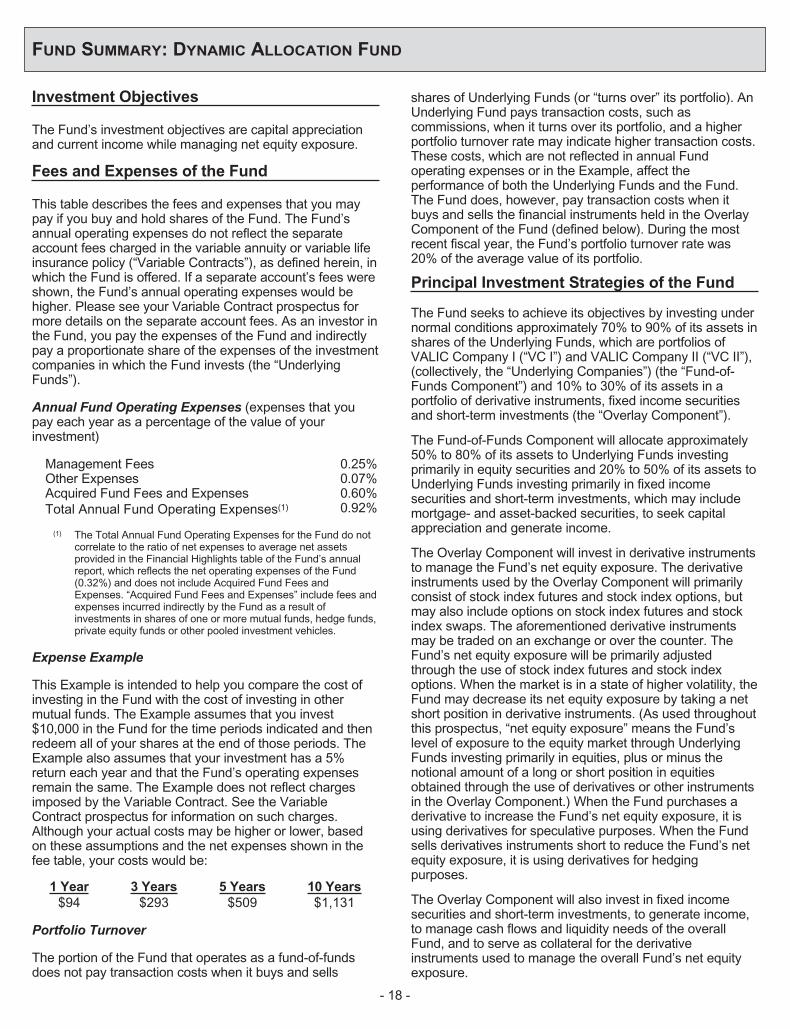
FUND SUMMARY: DYNAMIC ALLOCATION FUND
Investment Objectives
The Fund’s investment objectives are capital appreciationand current income while managing net equity exposure.
Fees and Expenses of the Fund
This table describes the fees and expenses that you maypay if you buy and hold shares of the Fund. The Fund’sannual operating expenses do not reflect the separateaccount fees charged in the variable annuity or variable lifeinsurance policy (“Variable Contracts”), as defined herein, inwhich the Fund is offered. If a separate account’s fees wereshown, the Fund’s annual operating expenses would behigher. Please see your Variable Contract prospectus formore details on the separate account fees. As an investor inthe Fund, you pay the expenses of the Fund and indirectlypay a proportionate share of the expenses of the investmentcompanies in which the Fund invests (the “UnderlyingFunds”).
Annual Fund Operating Expenses (expenses that youpay each year as a percentage of the value of yourinvestment)
Management Fees 0.25%Other Expenses 0.07%Acquired Fund Fees and Expenses 0.60%Total Annual Fund Operating Expenses(1) 0.92%
(1) The Total Annual Fund Operating Expenses for the Fund do notcorrelate to the ratio of net expenses to average net assetsprovided in the Financial Highlights table of the Fund’s annualreport, which reflects the net operating expenses of the Fund(0.32%) and does not include Acquired Fund Fees andExpenses. “Acquired Fund Fees and Expenses” include fees andexpenses incurred indirectly by the Fund as a result ofinvestments in shares of one or more mutual funds, hedge funds,private equity funds or other pooled investment vehicles.
Expense Example
This Example is intended to help you compare the cost ofinvesting in the Fund with the cost of investing in othermutual funds. The Example assumes that you invest$10,000 in the Fund for the time periods indicated and thenredeem all of your shares at the end of those periods. TheExample also assumes that your investment has a 5%return each year and that the Fund’s operating expensesremain the same. The Example does not reflect chargesimposed by the Variable Contract. See the VariableContract prospectus for information on such charges.Although your actual costs may be higher or lower, basedon these assumptions and the net expenses shown in thefee table, your costs would be:
1 Year 3 Years 5 Years 10 Years
$94 $293 $509 $1,131
Portfolio Turnover
The portion of the Fund that operates as a fund-of-fundsdoes not pay transaction costs when it buys and sells
shares of Underlying Funds (or “turns over” its portfolio). AnUnderlying Fund pays transaction costs, such ascommissions, when it turns over its portfolio, and a higherportfolio turnover rate may indicate higher transaction costs.These costs, which are not reflected in annual Fundoperating expenses or in the Example, affect theperformance of both the Underlying Funds and the Fund.The Fund does, however, pay transaction costs when itbuys and sells the financial instruments held in the OverlayComponent of the Fund (defined below). During the mostrecent fiscal year, the Fund’s portfolio turnover rate was20% of the average value of its portfolio.
Principal Investment Strategies of the Fund
The Fund seeks to achieve its objectives by investing undernormal conditions approximately 70% to 90% of its assets inshares of the Underlying Funds, which are portfolios ofVALIC Company I (“VC I”) and VALIC Company II (“VC II”),(collectively, the “Underlying Companies”) (the “Fund-of-Funds Component”) and 10% to 30% of its assets in aportfolio of derivative instruments, fixed income securitiesand short-term investments (the “Overlay Component”).
The Fund-of-Funds Component will allocate approximately50% to 80% of its assets to Underlying Funds investingprimarily in equity securities and 20% to 50% of its assets toUnderlying Funds investing primarily in fixed incomesecurities and short-term investments, which may includemortgage- and asset-backed securities, to seek capitalappreciation and generate income.
The Overlay Component will invest in derivative instrumentsto manage the Fund’s net equity exposure. The derivativeinstruments used by the Overlay Component will primarilyconsist of stock index futures and stock index options, butmay also include options on stock index futures and stockindex swaps. The aforementioned derivative instrumentsmay be traded on an exchange or over the counter. TheFund’s net equity exposure will be primarily adjustedthrough the use of stock index futures and stock indexoptions. When the market is in a state of higher volatility, theFund may decrease its net equity exposure by taking a netshort position in derivative instruments. (As used throughoutthis prospectus, “net equity exposure” means the Fund’slevel of exposure to the equity market through UnderlyingFunds investing primarily in equities, plus or minus thenotional amount of a long or short position in equitiesobtained through the use of derivatives or other instrumentsin the Overlay Component.) When the Fund purchases aderivative to increase the Fund’s net equity exposure, it isusing derivatives for speculative purposes. When the Fundsells derivatives instruments short to reduce the Fund’s netequity exposure, it is using derivatives for hedgingpurposes.
The Overlay Component will also invest in fixed incomesecurities and short-term investments, to generate income,to manage cash flows and liquidity needs of the overallFund, and to serve as collateral for the derivativeinstruments used to manage the overall Fund’s net equityexposure.
- 18 -

FUND SUMMARY: DYNAMIC ALLOCATION FUND
VALIC is the Fund’s investment adviser (the “Adviser”). TheFund is sub-advised by SunAmerica Asset Management,LLC (“SAAMCo”) and AllianceBernstein L.P.(“AllianceBernstein”). The Adviser will determine theallocation between the Fund-of-Funds Component and theOverlay Component. SAAMCo is also responsible formanaging the Fund-of-Funds Component’s investment inUnderlying Funds, so it will determine the target allocationbetween Underlying Funds that invest primarily in equitysecurities and Underlying Funds that invest primarily in fixedincome securities. SAAMCo performs an investmentanalysis of possible investments for the Fund and selectsthe universe of permitted Underlying Funds as well as theallocation to each Underlying Fund. SAAMCo utilizes manyfactors, including research provided by an independentconsultant. The consultant provides statistical analysis andfund modeling to SAAMCo with respect to the Fund’sinvestment allocation among the Underlying Funds, butdoes not have any advisory or fund transaction authoritywith regard to the Fund. SAAMCo, not the Fund, pays theconsultant. The Adviser may change the Fund’s assetallocation between the Fund-of-Funds Component and theOverlay Component from time to time without prior notice.SAAMCo may also change the Fund-of-Funds Component’sallocation among the Underlying Funds, and may invest inother funds not currently among the Underlying Funds, fromtime to time without prior notice to investors.
The Fund-of-Funds Component seeks to achieve capitalappreciation primarily through its investments in UnderlyingFunds that invest in equity securities of both U.S. and non-U.S. companies of all market capitalizations, but expects toinvest to a lesser extent in Underlying Funds that investprimarily in small- and mid-cap U.S. companies and foreigncompanies. The Fund normally does not expect to havemore than 25% of its total assets allocated to UnderlyingFunds investing primarily in foreign securities, and no morethan 5% of its total assets to Underlying Funds investingprimarily in emerging markets. The Fund-of-FundsComponent seeks to achieve current income through itsinvestments in Underlying Funds that primarily invest infixed income securities, including both U.S. and foreigninvestment grade securities, but the Fund normally does notexpect to have more than 5% of total assets allocated toUnderlying Funds investing primarily in high-yield, high-riskbonds (commonly known as “junk bonds”), which areconsidered speculative. Fund cash flows are expected to beused to maintain or move Underlying Fund exposure closeto target allocations, but sales and purchases of UnderlyingFunds may also be used to change or remain near targetallocations.
The Overlay Component comprises the remaining 10% -30% of the Fund’s total assets. AllianceBernstein isresponsible for managing the Overlay Component, whichincludes management of the derivative instruments, fixedincome securities and short-term investments.
AllianceBernstein may invest the Overlay Component inderivative instruments to increase or decrease the Fund’soverall net equity exposure and, therefore, its volatility and
return potential. Volatility is a statistical measurement of themagnitude of up and down fluctuations in the value of afinancial instrument or index over time. High levels ofvolatility may result from rapid and dramatic price swings.Through its use of derivative instruments, AllianceBernsteinmay adjust the Fund’s net equity exposure down to aminimum of 25% or up to a maximum of 100%, although theoperation of the formula (as described below) is expected toresult in an average net equity exposure over long termperiods of approximately 60%-65%. The Fund’s net equityexposure is primarily adjusted through the use of derivativeinstruments, such as stock index futures and stock indexoptions as the allocation among Underlying Funds in theFund-of-Funds Component is expected to remain fairlystable. For example, when the market is in a state of highervolatility, AllianceBernstein may decrease the Fund’s netequity exposure by taking a short position in derivativeinstruments. A short sale involves the sale by the Fund of asecurity or instrument it does not own with the expectationof purchasing the same security or instrument at a later dateat a lower price. The operation of the Overlay Componentmay therefore expose the Fund to leverage. Becausederivative instruments may be purchased with a fraction ofthe assets that would be needed to purchase the equitysecurities directly, the remainder of the assets in theOverlay Component will be invested in a variety of fixedincome securities.
AllianceBernstein will manage the Fund’s net equityexposure pursuant to a formula provided by the Adviser anddeveloped by affiliated insurance companies of the Adviser.The formula is based on equity market measures of S&P500® Index volatility, and is intended to provide guidance toAllianceBernstein with respect to the allocation of theOverlay Component’s assets among general categories.AllianceBernstein is responsible for determining in whichsecurities or derivative instruments to invest and for makingthe Overlay Component investments for the Fund. Asestimated equity market volatility decreases or increases,AllianceBernstein will adjust the Fund’s net equity exposureup or down in an effort to maintain a relatively stableexposure to equity market volatility over time, subject to theminimum and maximum net equity exposure ranges listedabove. No assurance can be made that such adjustmentwill have the intended effect. The formula used byAllianceBernstein may change over time based onproposals by the affiliated insurance companies. Anychanges to the formula proposed by the affiliated insurancecompanies will be implemented only if they are approved bythe Adviser and the Fund’s Board of Directors (the “Board”),including a majority of the Independent Directors.
The Fund’s performance may be lower than similar Fundsthat do not seek to manage their equity exposure. IfAllianceBernstein increases the Fund’s net equity exposureand equity markets decline, the Fund may underperformtraditional or static allocation funds. Likewise, ifAllianceBernstein reduces the Fund’s net equity exposureand equity markets rise, the Fund may also underperformtraditional or static allocation funds.
- 19 -
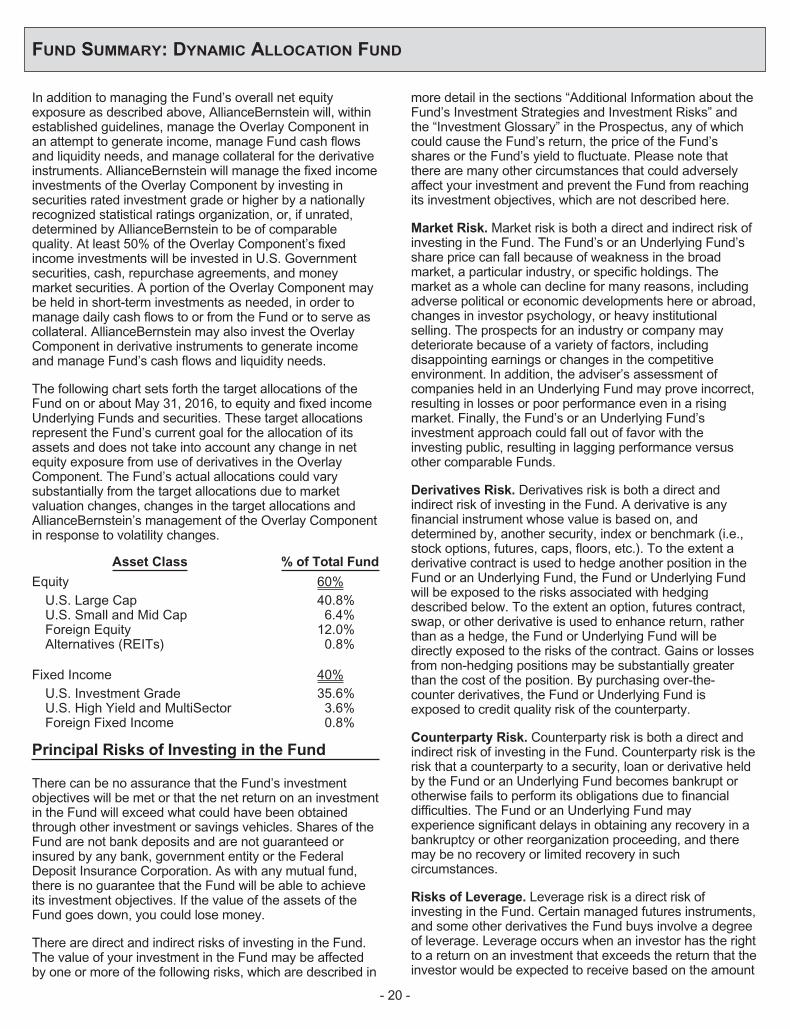
FUND SUMMARY: DYNAMIC ALLOCATION FUND
In addition to managing the Fund’s overall net equityexposure as described above, AllianceBernstein will, withinestablished guidelines, manage the Overlay Component inan attempt to generate income, manage Fund cash flowsand liquidity needs, and manage collateral for the derivativeinstruments. AllianceBernstein will manage the fixed incomeinvestments of the Overlay Component by investing insecurities rated investment grade or higher by a nationallyrecognized statistical ratings organization, or, if unrated,determined by AllianceBernstein to be of comparablequality. At least 50% of the Overlay Component’s fixedincome investments will be invested in U.S. Governmentsecurities, cash, repurchase agreements, and moneymarket securities. A portion of the Overlay Component maybe held in short-term investments as needed, in order tomanage daily cash flows to or from the Fund or to serve ascollateral. AllianceBernstein may also invest the OverlayComponent in derivative instruments to generate incomeand manage Fund’s cash flows and liquidity needs.
The following chart sets forth the target allocations of theFund on or about May 31, 2016, to equity and fixed incomeUnderlying Funds and securities. These target allocationsrepresent the Fund’s current goal for the allocation of itsassets and does not take into account any change in netequity exposure from use of derivatives in the OverlayComponent. The Fund’s actual allocations could varysubstantially from the target allocations due to marketvaluation changes, changes in the target allocations andAllianceBernstein’s management of the Overlay Componentin response to volatility changes.
Asset Class % of Total Fund
Equity 60%U.S. Large Cap 40.8%U.S. Small and Mid Cap 6.4%Foreign Equity 12.0%Alternatives (REITs) 0.8%
Fixed Income 40%U.S. Investment Grade 35.6%U.S. High Yield and MultiSector 3.6%Foreign Fixed Income 0.8%
Principal Risks of Investing in the Fund
There can be no assurance that the Fund’s investmentobjectives will be met or that the net return on an investmentin the Fund will exceed what could have been obtainedthrough other investment or savings vehicles. Shares of theFund are not bank deposits and are not guaranteed orinsured by any bank, government entity or the FederalDeposit Insurance Corporation. As with any mutual fund,there is no guarantee that the Fund will be able to achieveits investment objectives. If the value of the assets of theFund goes down, you could lose money.
There are direct and indirect risks of investing in the Fund.The value of your investment in the Fund may be affectedby one or more of the following risks, which are described in
more detail in the sections “Additional Information about theFund’s Investment Strategies and Investment Risks” andthe “Investment Glossary” in the Prospectus, any of whichcould cause the Fund’s return, the price of the Fund’sshares or the Fund’s yield to fluctuate. Please note thatthere are many other circumstances that could adverselyaffect your investment and prevent the Fund from reachingits investment objectives, which are not described here.
Market Risk. Market risk is both a direct and indirect risk ofinvesting in the Fund. The Fund’s or an Underlying Fund’sshare price can fall because of weakness in the broadmarket, a particular industry, or specific holdings. Themarket as a whole can decline for many reasons, includingadverse political or economic developments here or abroad,changes in investor psychology, or heavy institutionalselling. The prospects for an industry or company maydeteriorate because of a variety of factors, includingdisappointing earnings or changes in the competitiveenvironment. In addition, the adviser’s assessment ofcompanies held in an Underlying Fund may prove incorrect,resulting in losses or poor performance even in a risingmarket. Finally, the Fund’s or an Underlying Fund’sinvestment approach could fall out of favor with theinvesting public, resulting in lagging performance versusother comparable Funds.
Derivatives Risk. Derivatives risk is both a direct andindirect risk of investing in the Fund. A derivative is anyfinancial instrument whose value is based on, anddetermined by, another security, index or benchmark (i.e.,stock options, futures, caps, floors, etc.). To the extent aderivative contract is used to hedge another position in theFund or an Underlying Fund, the Fund or Underlying Fundwill be exposed to the risks associated with hedgingdescribed below. To the extent an option, futures contract,swap, or other derivative is used to enhance return, ratherthan as a hedge, the Fund or Underlying Fund will bedirectly exposed to the risks of the contract. Gains or lossesfrom non-hedging positions may be substantially greaterthan the cost of the position. By purchasing over-the-counter derivatives, the Fund or Underlying Fund isexposed to credit quality risk of the counterparty.
Counterparty Risk. Counterparty risk is both a direct andindirect risk of investing in the Fund. Counterparty risk is therisk that a counterparty to a security, loan or derivative heldby the Fund or an Underlying Fund becomes bankrupt orotherwise fails to perform its obligations due to financialdifficulties. The Fund or an Underlying Fund mayexperience significant delays in obtaining any recovery in abankruptcy or other reorganization proceeding, and theremay be no recovery or limited recovery in suchcircumstances.
Risks of Leverage. Leverage risk is a direct risk ofinvesting in the Fund. Certain managed futures instruments,and some other derivatives the Fund buys involve a degreeof leverage. Leverage occurs when an investor has the rightto a return on an investment that exceeds the return that theinvestor would be expected to receive based on the amount
- 20 -

FUND SUMMARY: DYNAMIC ALLOCATION FUND
contributed to the investment. The Fund’s use of certaineconomically leveraged futures and other derivatives canresult in a loss substantially greater than the amountinvested in the futures or other derivative itself. Certainfutures and other derivatives have the potential for unlimitedloss, regardless of the size of the initial investment. Whenthe Fund uses futures and other derivatives for leverage, ashareholder’s investment in the Fund will tend to be morevolatile, resulting in larger gains or losses in response to thefluctuating prices of the Fund’s investments.
Risk of Investing in Bonds. This is both a direct andindirect risk of investing in the Fund. As with any fund thatinvests significantly in bonds, the value of an investment inthe Fund or an Underlying Fund may go up or down inresponse to changes in interest rates or defaults (or eventhe potential for future defaults) by bond issuers.
Interest Rate Fluctuations Risk. Interest rate risk is both adirect and indirect risk of investing in the Fund. Fixedincome securities may be subject to volatility due tochanges in interest rates. The market value of bonds andother fixed income securities usually tends to vary inverselywith the level of interest rates; as interest rates rise thevalue of such securities typically falls, and as interest ratesfall, the value of such securities typically rises. Longer-termand lower coupon bonds tend to be more sensitive tochanges in interest rates. In periods of very low short-terminterest rates, the Fund’s or an Underlying Fund’s yield maybecome negative, which may result in a decline in the valueof your investment. Interest rates have been historically low,so the Fund and the Underlying Funds face a heightenedrisk that interest rates may rise.
Credit Risk. Credit risk is both a direct and indirect risk ofinvesting in the Fund. Credit risk applies to most debtsecurities, but is generally not a factor for obligationsbacked by the “full faith and credit” of the U.S. Government.The Fund or an Underlying Fund could lose money if theissuer of a debt security is unable or perceived to be unableto pay interest or repay principal when it becomes due.Various factors could affect the issuer’s actual or perceivedwillingness or ability to make timely interest or principalpayments, including changes in the issuer’s financialcondition or in general economic conditions.
Hedging Risk. Hedging risk is both a direct and indirect riskof investing in this Fund. A hedge is an investment made inorder to reduce the risk of adverse price movements in acurrency or other investment, by taking an offsetting position(often through a derivative, such as an option or forward).While hedging strategies can be very useful andinexpensive ways of reducing risk, they are sometimesineffective due to unexpected changes in the market.Hedging also involves the risk that changes in the value ofthe related security will not match those of the instrumentsbeing hedged as expected, in which case any losses on theinstruments being hedged may not be reduced. For grosscurrency hedges by Underlying Funds, there is an additionalrisk, to the extent that these transactions create exposure tocurrencies in which an Underlying Fund’s securities are notdenominated.
Short Sales Risk. Short sale risk is both a direct andindirect risk of investing in the Fund. Short sales by theFund or an Underlying Fund involve certain risks andspecial considerations. Possible losses from short salesdiffer from losses that could be incurred from a purchase ofa security, because losses from short sales are potentiallyunlimited, whereas losses from purchases can be nogreater than the total amount invested.
U.S. Government Obligations Risk. This is both a directand indirect risk of investing in the Fund. U.S. Treasuryobligations are backed by the “full faith and credit” of theU.S. Government and are generally considered to haveminimal credit risk. Securities issued or guaranteed byfederal agencies or authorities and U.S. Government-sponsored instrumentalities or enterprises may or may notbe backed by the full faith and credit of theU.S. Government. For example, securities issued by theFederal Home Loan Mortgage Corporation, the FederalNational Mortgage Association and the Federal Home LoanBanks are neither insured nor guaranteed by theU.S. Government; the securities may be supported only bythe ability to borrow from the U.S. Treasury or by the creditof the issuing agency, authority, instrumentality or enterpriseand, as a result, are subject to greater credit risk thansecurities issued or guaranteed by the U.S. Treasury.
Risk of Investing in Money Market Securities. This isboth a direct and indirect risk of investing in the Fund. Aninvestment in the Fund is subject to the risk that the value ofits investments in high-quality short-term obligations(“money market securities”) may be subject to changes ininterest rates, changes in the rating of any money marketsecurity and in the ability of an issuer to make payments ofinterest and principal.
Issuer Risk. The value of a security may decline for anumber of reasons directly related to the issuer, such asmanagement performance, financial leverage and reduceddemand for the issuer’s goods and services.
Other principal direct risks of investing in the Fund include:
Dynamic Allocation Risk. The Fund’s risks will directlycorrespond to the risks of the Underlying Funds and otherdirect investments in which it invests. The Fund is subject tothe risk that the investment process that will determine theselection of the Underlying Funds and the volatility formulathat will be used to determine the allocation and reallocationof the Fund’s assets among the various asset classes andinstruments may not produce the desired result. The Fundis also subject to the risk that AllianceBernstein may beprevented from trading certain derivatives effectively or in atimely manner.
Risk of Conflict with Insurance Company Interests.Managing the Fund’s net equity exposure may serve toreduce the risk from equity market volatility to the affiliatedinsurance companies and facilitate their ability to provideguaranteed benefits associated with certain VariableContracts. While the interests of Fund shareholders and the
- 21 -
FUND SUMMARY: DYNAMIC ALLOCATION FUND
affiliated insurance companies providing guaranteedbenefits associated with the Variable Contracts aregenerally aligned, the affiliated insurance companies (andthe Adviser by virtue of its affiliation with the insurancecompanies) may face potential conflicts of interest. Inparticular, certain aspects of the Fund’s management havethe effect of mitigating the financial risks to which theaffiliated insurance companies are subjected by providingthose guaranteed benefits. In addition, the Fund’sperformance may be lower than similar Funds that do notseek to manage their equity exposure.
Investment Company Risk. The risks of the Fund owningother investment companies, including the Underlying Funds,generally reflect the risks of owning the underlying securitiesthey are designed to track, although lack of liquidity in theseinvestments could result in it being more volatile than theunderlying Fund of securities. Disruptions in the markets forthe securities held by other investment company companies,including the Underlying Funds purchased or sold by theFund could result in losses on the Fund’s investment in suchsecurities. The other investment company companies,including Underlying Funds also have fees that increase theircosts versus owning the underlying securities directly.
Affiliated Fund Risk. In managing the portion of the Fundthat invests in Underlying Funds, SAAMCo will have theauthority to select and substitute the Underlying Funds.SAAMCo may be subject to potential conflicts of interest inallocating the Fund’s assets among the various UnderlyingFunds because the fees payable to it by the Adviser forsome of the Underlying Funds are higher than the feespayable by other Underlying Funds and because SAAMCoalso is responsible for managing and administering certainof the Underlying Funds.
Other indirect principal risks of investing in the Fund (directrisks of investing in the Underlying Funds) include:
Large-Cap Companies Risk. Large-cap companies tend tobe less volatile than companies with smaller marketcapitalizations. In exchange for this potentially lower risk, anUnderlying Fund’s value may not rise as much as the valueof Funds that emphasize smaller companies.
“Passively Managed” Strategy Risk. An Underlying Fundfollowing a passively managed strategy will not deviate fromits investment strategy. In most cases, it will involve apassively managed strategy utilized to achieve investmentresults that correspond to a particular market index. Such aFund will not sell securities in its portfolio and buy differentsecurities for other reasons, even if there are adversedevelopments concerning a particular security, company orindustry. There can be no assurance that the strategy willbe successful.
Small and Medium Sized Companies Risk. Securities ofsmall and medium sized companies are usually morevolatile and entail greater risks than securities of largecompanies.
Growth Stock Risk. Growth stocks are historically volatile,which will affect certain Underlying Funds.
Value Investing Risk. The investment adviser’s judgmentsthat a particular security is undervalued in relation to thecompany’s fundamental economic value may proveincorrect, which will affect certain Underlying Funds.
Foreign Investment Risk. Investments in foreign countriesare subject to a number of risks. A principal risk is thatfluctuations in the exchange rates between the U.S. dollarand foreign currencies may negatively affect the value of aninvestment. In addition, there may be less publicly availableinformation about a foreign company and it may not besubject to the same uniform accounting, auditing andfinancial reporting standards as U.S. companies. Foreigngovernments may not regulate securities markets andcompanies to the same degree as the U.S. government.Foreign investments will also be affected by local political oreconomic developments and governmental actions by theUnited States or other governments. Consequently, foreignsecurities may be less liquid, more volatile and more difficultto price than U.S. securities. These risks are heightenedwhen an issuer is in an emerging market. Historically, themarkets of emerging market countries have been morevolatile than more developed markets; however, suchmarkets can provide higher rates of return to investors.
Credit Quality Risk. The creditworthiness of an issuer isalways a factor in analyzing fixed income securities. Anissuer with a lower credit rating will be more likely than ahigher rated issuer to default or otherwise become unable tohonor its financial obligations. Issuers with low credit ratingstypically issue junk bonds, which are consideredspeculative. In addition to the risk of default, junk bondsmay be more volatile, less liquid, more difficult to value andmore susceptible to adverse economic conditions orinvestor perceptions than investment grade bonds.
Mortgage- and Asset-Backed Securities Risk. Mortgage-and asset-backed securities represent interests in “pools” ofmortgages or other assets, including consumer loans orreceivables held in trust. The characteristics of thesemortgage-backed and asset-backed securities differ fromtraditional fixed income securities. Mortgage-backedsecurities are subject to “prepayment risk” and “extensionrisk.” Prepayment risk is the risk that, when interest ratesfall, certain types of obligations will be paid off by the obligormore quickly than originally anticipated and an UnderlyingFund may have to invest the proceeds in securities withlower yields. Extension risk is the risk that, when interestrates rise, certain obligations will be paid off by the obligormore slowly than anticipated causing the value of thesesecurities to fall. Small movements in interest rates (bothincreases and decreases) may quickly and significantlyreduce the value of certain mortgage-backed securities.These securities also are subject to risk of default on theunderlying mortgage, particularly during periods ofeconomic downturn.
- 22 -

FUND SUMMARY: DYNAMIC ALLOCATION FUND
Performance Information
The following Risk/Return Bar Chart and Table illustrate therisks of investing in the Fund by showing changes in theFund’s performance from calendar year to calendar yearand comparing the Fund’s average annual returns to thoseof the S&P 500® Index, the Barclays U.S. Aggregate BondIndex, and a Blended Index. The blended index iscomprised of the S&P 500® Index (60%) and the BarclaysU.S. Aggregate Bond Index (40%). Fees and expensesincurred at the contract level are not reflected in the barchart or table. If these amounts were reflected, returnswould be less than those shown. Of course, pastperformance is not necessarily an indication of how theFund will perform in the future.
As of June 30, 2016, SAAMCo and AllianceBernsteinmanaged approximately 81% and 19% of the Fund’sassets, respectively. The percentage of the Fund’s assetsthat each sub-adviser manages may, at the adviser’sdiscretion, change from time to time.
2013 2014-4.57%
17.51%
4.24%
2015-6%
-3%
0%
3%
6%
9%
12%
15%
18%
During the period shown in the bar chart, the highest returnfor a quarter was 6.51% (quarter ending March 31, 2013)and the lowest return for a quarter was -5.86% (quarterending September 30, 2015). For the year-to-date throughJune 30, 2016, the Fund’s return was 1.72%.
Average Annual Total Returns (For the periods endedDecember 31, 2015)
1Year
Since Inception(12/19/2012)
Fund -4.57% 5.21%S&P 500 Index 1.38% 14.44%Barclays U.S. Aggregate Index 0.55% 1.57%Blended Index 1.28% 9.27%
Investment Adviser
The Fund’s investment adviser is VALIC. The Fund-of-Funds Component is sub-advised by SAAMCo. The OverlayComponent of the Fund is sub-advised byAllianceBernstein.
Portfolio Managers
Name
PortfolioManager ofthe Fund-of-
FundsComponentof the Fund
Since Title
Douglas A.Loeffler
2015 Vice President andPortfolio Manager
Name
PortfolioManagers ofthe OverlayComponentof the Fund
Since Title
Joshua Lisser 2012 Chief Investment Officer– Index Strategies
Ben Sklar 2012 Portfolio Manager –Index Strategies
For important information about purchase and sales of Fundshares, taxes and payments made to broker-dealers andother financial intermediaries, please turn to the section“Important Additional Information” on page 101.
- 23 -
FUND SUMMARY: EMERGING ECONOMIES FUND
Investment Objective
The Fund seeks capital appreciation.
Fees and Expenses of the Fund
This table describes the fees and expenses that you maypay if you buy and hold shares of the Fund. The Fund’sannual operating expenses do not reflect the separateaccount fees charged in the variable annuity or variable lifeinsurance policy (“Variable Contracts”) in which the Fund isoffered. If a separate account’s fees were shown, theFund’s annual operating expenses would be higher. Pleasesee your Variable Contract prospectus for more details onthe separate account fees.
Annual Fund Operating Expenses (expenses that youpay each year as a percentage of the value of yourinvestment)
Management Fees 0.78%Other Expenses 0.19%Total Annual Fund Operating Expenses 0.97%
Expense Example
This Example is intended to help you compare the cost ofinvesting in the Fund with the cost of investing in othermutual funds. The Example assumes that you invest$10,000 in the Fund for the time periods indicated and thenredeem all of your shares at the end of those periods. TheExample also assumes that your investment has a 5%return each year and that the Fund’s operating expensesremain the same. The Example does not reflect chargesimposed by the Variable Contract. If the Variable Contractfees were reflected then the expenses would be higher. Seethe Variable Contract prospectus for information on suchcharges. Although your actual costs may be higher or lower,based on these assumptions and the net expenses shownin the fee table, your costs would be:
1 Year 3 Years 5 Years 10 Years
$99 $309 $536 $1,190
Portfolio Turnover
The Fund pays transaction costs, such as commissions,when it buys and sells securities (or “turns over” itsportfolio). These costs, which are not reflected in annualfund operating expenses or in the example, affect theFund’s performance. During the most recent fiscal year, theFund’s portfolio turnover rate was 64% of the average valueof its portfolio.
Principal Investment Strategies of the Fund
Under normal circumstances, the Fund invests at least 80%of value of its net assets in equity securities of emergingmarket companies and other investments that are tiedeconomically to emerging markets. Emerging marketsinclude most countries in the world except Australia,
Canada, Japan, New Zealand, the United Kingdom, theUnited States, and most of the countries of WesternEurope. An emerging market company is one that isorganized under the laws of, or has a principal place ofbusiness in an emerging market; where the principalsecurities market is in an emerging market; that derives atleast 50% of its total revenues or profits from goods that areproduced or sold, investments made, or services performedin an emerging market; or at least 50% of the assets ofwhich are located in an emerging market. The Fund is notrequired to allocate its investments in any set percentagesto any particular countries. The Fund is not constrained bycompany size or style limits and will invest across sectors.The Fund will invest in securities issued by companies ofany size, although the Fund may invest a significant portionof its assets in companies of a particular marketcapitalization size at the discretion of the sub-adviser.
The Fund may overweight or underweight countries relativeto its benchmark, the MSCI Emerging Markets Index. TheFund emphasizes securities that are ranked asundervalued, while underweighting or avoiding securitiesthat appear overvalued. The Fund, from time to time, mayinvest a significant portion of its assets in one or morecountries or regions.
The Fund may invest in securities denominated in U.S.dollars, other major reserve currencies, such as the euro,yen and pound sterling, and currencies of other countries inwhich it can invest. The Fund typically maintains fullcurrency exposure to those markets in which it invests.However, the Fund may from time to time hedge a portion ofits foreign currency exposure into the U.S. dollar. The Fund’sequity securities generally consist of common and preferredstock. The Fund may also invest in depositary receipts.
In order to generate additional income, the Fund may lendportfolio securities to broker-dealers and other financialinstitutions provided that the value of the loaned securitiesdoes not exceed 30% of the Fund’s total assets. Theseloans earn income for the Fund and are collateralized bycash, securities issued or guaranteed by the U.S.Government or its agencies or instrumentalities, and suchother securities as the Fund and the securities lending agentmay agree upon. Investors will be given at least 60 days’written notice in advance of any change to the Fund’s 80%investment policy set forth above.
Principal Risks of Investing in the Fund
There can be no assurance that the Fund’s investmentobjective will be met or that the net return on an investmentin the Fund will exceed what could have been obtainedthrough other investment or savings vehicles. Shares of theFund are not bank deposits and are not guaranteed orinsured by any bank, government entity or the FederalDeposit Insurance Corporation. As with any mutual fund,there is no guarantee that the Fund will be able to achieveits investment objective. If the value of the assets of theFund goes down, you could lose money.
- 24 -
FUND SUMMARY: EMERGING ECONOMIES FUND
The following is a summary of the principal risks of investingin the Fund.
Management Risk: The investment style or strategy usedby the sub-adviser may fail to produce the intended result.The sub-adviser’s assessment of a particular security orcompany may prove incorrect, resulting in losses orunderperformance.
Foreign Investment Risk: Investment in foreign securitiesinvolves risks due to several factors, such as illiquidity, thelack of public information, changes in the exchange ratesbetween foreign currencies and the U.S. dollar, unfavorablepolitical, social and legal developments, or economic andfinancial instability. Foreign companies are not subject tothe U.S. accounting and financial reporting standards andmay have riskier settlement procedures. U.S. investmentsthat are denominated in foreign currencies or that are tradedin foreign markets, or securities of U.S. companies thathave significant foreign operations may be subject to foreigninvestment risk.
Emerging Markets Risk: In addition to the risks associatedwith investments in foreign securities, emerging marketsecurities are subject to additional risks, which cause thesesecurities generally to be more volatile than securities ofissuers located in developed countries.
Currency Risk: Because the Fund’s foreign investmentsare generally held in foreign currencies, the Fund couldexperience gains or losses based solely on changes in theexchange rate between foreign currencies and the U.S.dollar. Such gains or losses may be substantial.
Geographic Risk: If the Fund invests a significant portion ofits assets in issuers located in a single country, a limitednumber of countries, or a particular geographic region, itassumes the risk that economic, political and socialconditions in those countries or regions may have asignificant impact on the Fund’s investment performance.
Equity Securities Risk: The Fund invests principally inequity securities and is the subject to the risk that stockprices will fall and may underperform other asset classes.Individual stock prices fluctuate from day-to-day and maydecline significantly. The prices of individual stocks may benegatively affected by poor company results or other factorsaffecting individual prices, as well as industry and/oreconomic trends and developments affecting industries orthe securities market as a whole.
Preferred Stock Risk: Unlike common stock, preferredstock generally pays a fixed dividend from a company’searnings and may have a preference over common stock onthe distribution of a company’s assets in the event ofbankruptcy or liquidation. Preferred stockholders’ liquidationrights are subordinate to the company’s debt holders andcreditors. If interest rates rise, the fixed dividend onpreferred stocks may be less attractive and the price ofpreferred stocks may decline. Preferred stockholderstypically do not have voting rights.
Depositary Receipts Risk: Depositary receipts aregenerally subject to the same risks as the foreign securitiesthat they evidence or into which they may be converted.Depositary receipts may or may not be jointly sponsored bythe underlying issuer. The issuers of unsponsoreddepositary receipts are not obligated to disclose informationthat is considered material in the United States. Therefore,there may be less information available regarding theissuers and there may not be a correlation between suchinformation and the market value of the depositary receipts.Certain depositary receipts are not listed on an exchangeand therefore may be considered to be illiquid securities.
Large-Cap Company Risk: Large-cap companies tend togo in and out of favor based on market and economicconditions and tend to be less volatile than companies withsmaller market capitalizations. In exchange for thispotentially lower risk, the Fund’s value may not rise as muchas the value of funds that emphasize smaller capitalizationcompanies. Larger, more established companies may beunable to respond quickly to new competitive challenges,such as changes in technology and consumer tastes.Larger companies also may not be able to attain the highgrowth rate of successful smaller companies, particularlyduring extended periods of economic expansion.
Mid-Cap Company Risk: Investing primarily in mid-capcompanies carries the risk that due to current marketconditions these companies may be out of favor withinvestors. Stocks of mid-cap companies may be morevolatile than those of larger companies due to, among otherreasons, narrower product lines, more limited financialresources and fewer experienced managers.
Small-Cap Company Risk: Investing primarily in small-capcompanies carries the risk that due to current marketconditions these companies may be out of favor withinvestors. Small companies often are in the early stages ofdevelopment with limited product lines, markets, or financialresources and managements lacking depth and experience,which may cause their stock prices to be more volatile thanthose of larger companies. Small company stocks may beless liquid yet subject to abrupt or erratic price movements.It may take a substantial period of time before the Fundrealizes a gain on an investment in a small-cap company, ifit realizes any gain at all.
Derivatives Risk: The prices of derivatives may move inunexpected ways due to the use of leverage and otherfactors and may result in increased volatility or losses. TheFund may not be able to terminate or sell derivativepositions, and a liquid secondary market may not alwaysexist for derivative positions.
Hedging Risk: A hedge is an investment made in order toreduce the risk of adverse price movements in a currency orother investment by taking an offsetting position (oftenthrough a derivative instrument, such as an option orforward contract). While hedging strategies can be veryuseful and inexpensive ways of reducing risk, they aresometimes ineffective due to unexpected changes in the
- 25 -

FUND SUMMARY: EMERGING ECONOMIES FUND
market. Hedging also involves the risk that changes in thevalue of the related security will not match those of theinstruments being hedged as expected, in which case anylosses on the instruments being hedged may not bereduced.
Market Risk: The Fund’s share price can fall because ofweakness in the broad market, a particular industry, orspecific holdings or due to adverse political or economicdevelopments here or abroad, changes in investorpsychology, or heavy institutional selling. The price ofindividual securities may fluctuate, sometimes dramatically,from day-to-day. The prices of stocks and other equitysecurities tend to be more volatile than those of fixedincome securities.
Value Style Risk: Generally, “value” stocks are stocks ofcompanies that the sub-adviser believes are currentlyundervalued in the marketplace. The sub-adviser’sjudgment that a particular security is undervalued in relationto the company’s fundamental economic value may proveincorrect and the price of the company’s stock may fall ormay not approach the value the sub-adviser has placed onit.
Securities Lending Risk: Engaging in securities lendingcould increase the market and credit risk for Fundinvestments. The Fund may lose money if it does notrecover borrowed securities, the value of the collateral falls,or the value of investments made with cash collateraldeclines. If the value of either the cash collateral or theFund’s investments of the cash collateral falls below theamount owed to a borrower, the Fund also may incur lossesthat exceed the amount it earned on lending the security.Securities lending also involves the risks of delay inreceiving additional collateral or possible loss of rights in thecollateral if the borrower fails. Another risk of securitieslending is the risk that the loaned portfolio securities maynot be available to the Fund on a timely basis and the Fundmay therefore lose the opportunity to sell the securities at adesirable price.
Performance Information
The following Risk/Return Bar Chart and Table illustrate therisks of investing in the Fund by showing changes in theFund’s performance from calendar year to calendar yearand comparing the Fund’s average annual returns to thoseof the MSCI Emerging Markets Index (net). Fees andexpenses incurred at the contract level are not reflected inthe bar chart or table. If these amounts were reflected,returns would be less than those shown. Of course, pastperformance is not necessarily an indication of how thePortfolio will perform in the future.
Effective October 1, 2011, J.P. Morgan InvestmentManagement Inc. (“JPMIM”) assumed sub-advisoryresponsibilities for the Fund. From September 11, 2009through September 30, 2011, BlackRock FinancialManagement, Inc. sub-advised the Fund. From inception
through September 11, 2009, Putnam InvestmentManagement, LLC was sub-adviser to the Fund.
2006 2007 2008 2009 2010 2011 2012 2013 20152014-60%
-50%
-40%
-30%
-20%
-10%
0%
10%
20%
30%
40%
22.63%
9.07%
-46.09%
29.60%
11.22%
-2.76%
-14.54%-13.01%
18.89%
-5.57%
During the periods shown in the bar chart, the highest returnfor a quarter was 22.29% (quarter ending June 30, 2009)and the lowest return for a quarter was -24.29% (quarterending December 31, 2008). For the year-to-date throughJune 30, 2016, the Fund’s return was 5.56%.
Average Annual Total Returns (For the periods endedDecember 31, 2015)
1Year
5Years
10Years
Fund -14.54% -4.09% -1.69%MSCI Emerging Markets Index (net) -14.92% -4.81% 3.61%
Investment Adviser
The Fund’s investment adviser is The Variable Annuity LifeInsurance Company. The Fund is sub-advised by JPMIM.
Portfolio Managers
Name
PortfolioManager of the
Fund Since Title
Anuj Arora 2011 Managing DirectorGeorge Iwanicki 2011 Managing Director
For important information about purchase and sales of Fundshares, taxes and payments made to broker-dealers andother financial intermediaries, please turn to the section“Important Additional Information” on page 101.
- 26 -

FUND SUMMARY: FOREIGN VALUE FUND
Investment Objective
The Fund seeks long-term growth of capital.
Fees and Expenses of the Fund
This table describes the fees and expenses that you maypay if you buy and hold shares of the Fund. The Fund’sannual operating expenses do not reflect the separateaccount fees charged in the variable annuity or variable lifeinsurance policy (“Variable Contracts”) in which the Fund isoffered. If a separate account’s fees were shown, theFund’s annual operating expenses would be higher. Pleasesee your Variable Contract prospectus for more details onthe separate account fees.
Annual Fund Operating Expenses (expenses that youpay each year as a percentage of the value of yourinvestment)
Management Fees 0.67%Other Expenses 0.12%Total Annual Fund Operating Expenses 0.79%
Expense Example
This Example is intended to help you compare the cost ofinvesting in the Fund with the cost of investing in othermutual funds. The Example assumes that you invest$10,000 in the Fund for the time periods indicated and thenredeem all of your shares at the end of those periods. TheExample also assumes that your investment has a 5%return each year and that the Fund’s operating expensesremain the same. The Example does not reflect chargesimposed by the Variable Contract. If the Variable Contractfees were reflected then the expenses would be higher. Seethe Variable Contract prospectus for information on suchcharges. Although your actual costs may be higher or lower,based on these assumptions and the net expenses shownin the fee table, your costs would be:
1 Year 3 Years 5 Years 10 Years
$81 $252 $439 $978
Portfolio Turnover
The Fund pays transaction costs, such as commissions,when it buys and sells securities (or “turns over” itsportfolio). These costs, which are not reflected in annualfund operating expenses or in the example, affect theFund’s performance. During the most recent fiscal year, theFund’s portfolio turnover rate was 21% of the average valueof its portfolio.
Principal Investment Strategies of the Fund
Under normal market conditions, the Fund investspredominantly in equity securities of companies locatedoutside the U.S., including in emerging markets. The equitysecurities in which the Fund invests are primarily common
stocks. Typically, the Fund will invest at least 80% of its netassets in “foreign securities,” as defined below, which mayinclude emerging markets and depositary receipts.
Although the investment manager will search forinvestments across a large number of countries andsectors, from time to time, based on economic conditions,the Fund may have significant positions in particularcountries or sectors.
When choosing equity investments for the Fund, the sub-adviser applies a “bottom-up,” value-oriented, long-termapproach, focusing on the market price of a company’ssecurities relative to the sub-adviser’s evaluation of thecompany’s long-term earnings, asset value and cash flowpotential. The sub-adviser also considers a company’sprice/earnings ratio, price/cash flow ratio, profit margins andliquidation value.
In order to generate additional income, the Fund may lendportfolio securities to broker-dealers and other financialinstitutions provided that the value of the loaned securitiesdoes not exceed 30% of the Fund’s total assets. Theseloans earn income for the Fund and are collateralized bycash, securities issued or guaranteed by the U.S.Government or its agencies or instrumentalities, and suchother securities as the Fund and the securities lendingagent may agree upon. Investors will be given at least60 days’ written notice in advance of any change to theFund’s 80% investment policy set forth above.
Principal Risks of Investing in the Fund
There can be no assurance that the Fund’s investmentobjective will be met or that the net return on an investmentin the Fund will exceed what could have been obtainedthrough other investment or savings vehicles. Shares of theFund are not bank deposits and are not guaranteed orinsured by any bank, government entity or the FederalDeposit Insurance Corporation. As with any mutual fund,there is no guarantee that the Fund will be able to achieveits investment objective. If the value of the assets of theFund goes down, you could lose money.
The following is a summary of the principal risks of investingin the Fund.
Management Risk: The investment style or strategy usedby the sub-adviser may fail to produce the intended result.The sub-adviser’s assessment of a particular security orcompany may prove incorrect, resulting in losses orunderperformance.
Equity Securities Risk: The Fund invests predominantly inequity securities and is therefore subject to the risk thatstock prices will fall and may underperform other assetclasses. Individual stock prices fluctuate from day-to-dayand may decline significantly. The prices of individual stocksmay be negatively affected by poor company results orother factors affecting individual prices, as well as industryand/or economic trends and developments affectingindustries or the securities market as a whole.
- 27 -
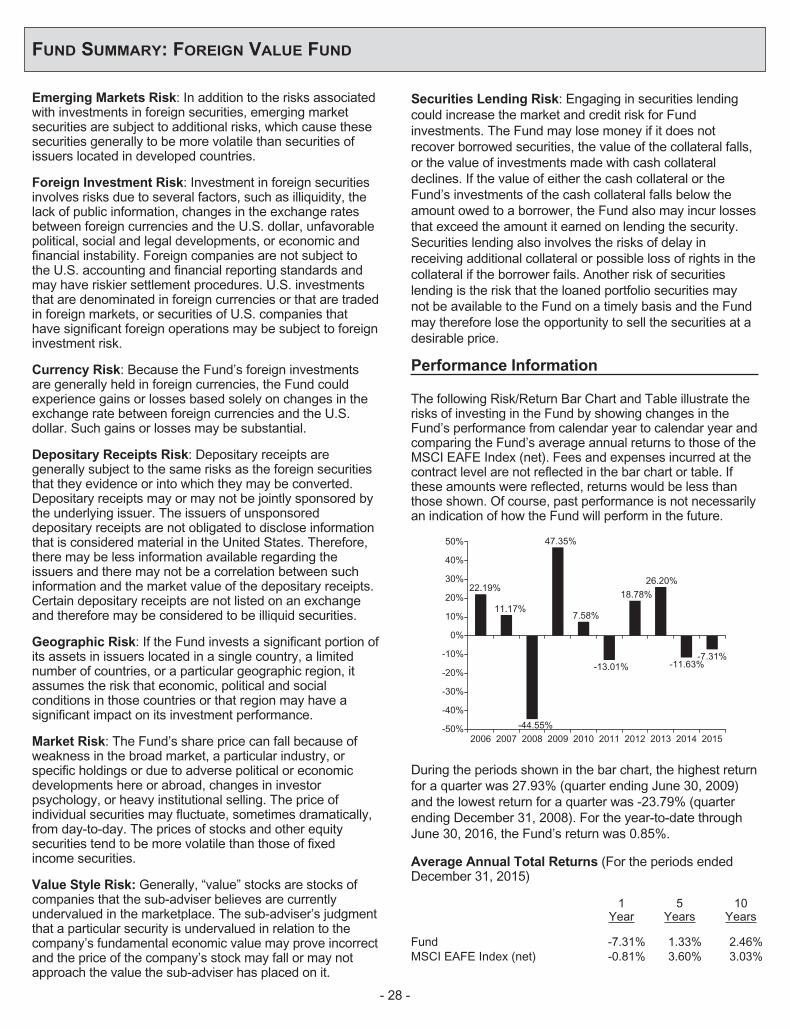
FUND SUMMARY: FOREIGN VALUE FUND
Emerging Markets Risk: In addition to the risks associatedwith investments in foreign securities, emerging marketsecurities are subject to additional risks, which cause thesesecurities generally to be more volatile than securities ofissuers located in developed countries.
Foreign Investment Risk: Investment in foreign securitiesinvolves risks due to several factors, such as illiquidity, thelack of public information, changes in the exchange ratesbetween foreign currencies and the U.S. dollar, unfavorablepolitical, social and legal developments, or economic andfinancial instability. Foreign companies are not subject tothe U.S. accounting and financial reporting standards andmay have riskier settlement procedures. U.S. investmentsthat are denominated in foreign currencies or that are tradedin foreign markets, or securities of U.S. companies thathave significant foreign operations may be subject to foreigninvestment risk.
Currency Risk: Because the Fund’s foreign investmentsare generally held in foreign currencies, the Fund couldexperience gains or losses based solely on changes in theexchange rate between foreign currencies and the U.S.dollar. Such gains or losses may be substantial.
Depositary Receipts Risk: Depositary receipts aregenerally subject to the same risks as the foreign securitiesthat they evidence or into which they may be converted.Depositary receipts may or may not be jointly sponsored bythe underlying issuer. The issuers of unsponsoreddepositary receipts are not obligated to disclose informationthat is considered material in the United States. Therefore,there may be less information available regarding theissuers and there may not be a correlation between suchinformation and the market value of the depositary receipts.Certain depositary receipts are not listed on an exchangeand therefore may be considered to be illiquid securities.
Geographic Risk: If the Fund invests a significant portion ofits assets in issuers located in a single country, a limitednumber of countries, or a particular geographic region, itassumes the risk that economic, political and socialconditions in those countries or that region may have asignificant impact on its investment performance.
Market Risk: The Fund’s share price can fall because ofweakness in the broad market, a particular industry, orspecific holdings or due to adverse political or economicdevelopments here or abroad, changes in investorpsychology, or heavy institutional selling. The price ofindividual securities may fluctuate, sometimes dramatically,from day-to-day. The prices of stocks and other equitysecurities tend to be more volatile than those of fixedincome securities.
Value Style Risk: Generally, “value” stocks are stocks ofcompanies that the sub-adviser believes are currentlyundervalued in the marketplace. The sub-adviser’s judgmentthat a particular security is undervalued in relation to thecompany’s fundamental economic value may prove incorrectand the price of the company’s stock may fall or may notapproach the value the sub-adviser has placed on it.
Securities Lending Risk: Engaging in securities lendingcould increase the market and credit risk for Fundinvestments. The Fund may lose money if it does notrecover borrowed securities, the value of the collateral falls,or the value of investments made with cash collateraldeclines. If the value of either the cash collateral or theFund’s investments of the cash collateral falls below theamount owed to a borrower, the Fund also may incur lossesthat exceed the amount it earned on lending the security.Securities lending also involves the risks of delay inreceiving additional collateral or possible loss of rights in thecollateral if the borrower fails. Another risk of securitieslending is the risk that the loaned portfolio securities maynot be available to the Fund on a timely basis and the Fundmay therefore lose the opportunity to sell the securities at adesirable price.
Performance Information
The following Risk/Return Bar Chart and Table illustrate therisks of investing in the Fund by showing changes in theFund’s performance from calendar year to calendar year andcomparing the Fund’s average annual returns to those of theMSCI EAFE Index (net). Fees and expenses incurred at thecontract level are not reflected in the bar chart or table. Ifthese amounts were reflected, returns would be less thanthose shown. Of course, past performance is not necessarilyan indication of how the Fund will perform in the future.
2006 2007 2008 2009 2010 2011 2012 2013 20152014-50%
-40%
-30%
-20%
-10%
0%
10%
20%
30%
40%
50%
22.19%
11.17%
-44.55%
47.35%
7.58%
-11.63%-13.01%
18.78%26.20%
-7.31%
During the periods shown in the bar chart, the highest returnfor a quarter was 27.93% (quarter ending June 30, 2009)and the lowest return for a quarter was -23.79% (quarterending December 31, 2008). For the year-to-date throughJune 30, 2016, the Fund’s return was 0.85%.
Average Annual Total Returns (For the periods endedDecember 31, 2015)
1Year
5Years
10Years
Fund -7.31% 1.33% 2.46%MSCI EAFE Index (net) -0.81% 3.60% 3.03%
- 28 -

FUND SUMMARY: FOREIGN VALUE FUND
Investment Adviser
The Fund’s investment adviser is The Variable Annuity LifeInsurance Company. The Fund is sub-advised byTempleton Global Advisors Limited.
Portfolio Managers
Name
PortfolioManager ofthe Fund
Since Title
Tucker Scott, CFA 2008 Executive VicePresident,PortfolioManager andResearch Analyst
Norman Boersma,CFA
2011 Chief InvestmentOfficer, Presidentand PortfolioManager
Heather Arnold, CFA 2015 Executive VicePresident, Directorof Research,Portfolio Managerand ResearchAnalyst
For important information about purchase and sales of Fundshares, taxes and payments made to broker-dealers andother financial intermediaries, please turn to the section“Important Additional Information” on page 101.
- 29 -

FUND SUMMARY: GLOBAL REAL ESTATE FUND
Investment Objective
The Fund seeks high total return through long-term growthof capital and current income.
Fees and Expenses of the Fund
This table describes the fees and expenses that you maypay if you buy and hold shares of the Fund. The Fund’sannual operating expenses do not reflect the separateaccount fees charged in the variable annuity or variable lifeinsurance policy (“Variable Contracts”) in which the Fund isoffered. If a separate account’s fees were shown, theFund’s annual operating expenses would be higher. Pleasesee your Variable Contract prospectus for more details onthe separate account fees.
Annual Fund Operating Expenses (expenses that youpay each year as a percentage of the value of yourinvestment)
Management Fees 0.72%Other Expenses 0.13%Total Annual Fund Operating Expenses 0.85%
Expense Example
This Example is intended to help you compare the cost ofinvesting in the Fund with the cost of investing in othermutual funds. The Example assumes that you invest$10,000 in the Fund for the time periods indicated and thenredeem all of your shares at the end of those periods. TheExample also assumes that your investment has a 5%return each year and that the Fund’s operating expensesremain the same. The Example does not reflect chargesimposed by the Variable Contract. If the Variable Contractfees were reflected then the expenses would be higher. Seethe Variable Contract prospectus for information on suchcharges. Although your actual costs may be higher or lower,based on these assumptions and the net expenses shownin the fee table, your costs would be:
1 Year 3 Years 5 Years 10 Years
$87 $271 $471 $1,049
Portfolio Turnover
The Fund pays transaction costs, such as commissions,when it buys and sells securities (or “turns over” itsportfolio). These costs, which are not reflected in annualfund operating expenses or in the example, affect theFund’s performance. During the most recent fiscal year, theFund’s portfolio turnover rate was 71% of the average valueof its portfolio.
Principal Investment Strategies of the Fund
The Fund invests, under normal circumstances, at least80% of its net assets in a diversified portfolio of equityinvestments in real estate and real estate-related
companies. A company is considered a “real estatecompany” or “real estate-related company” if at least 50% ofits net assets, gross income or net profits are attributable toownership, development, construction, financing,management or sale of commercial, industrial or residentialreal estate or interests therein. The principal type ofsecurities purchased by the Fund is common stock. TheFund’s investments in real estate and real estate-relatedcompanies may include real estate investment trusts(“REITs”), REIT-like structures, or real estate operatingcompanies whose businesses and services are related tothe real estate industry.
In complying with the 80% investment requirement, theFund may include synthetic securities that have economiccharacteristics similar to the Fund’s direct investments thatare counted toward the 80% investment requirement.
The Fund may invest up to 75% of its total assets in foreignsecurities, including securities of issuers in emergingmarkets. The Fund expects to invest a substantial portion ofits assets in the securities of issuers economically tied toJapan, the United Kingdom, Australia, Hong Kong,Singapore, China, Canada and Continental Europe. TheFund considers an investment tied economically to acountry if the investment is exposed to the economic risksand returns of such country. From time to time, the Fund’sinvestments with respect to a particular country may exceed25% of its investment portfolio.
In order to generate additional income, the Fund may lendportfolio securities to broker-dealers and other financialinstitutions provided that the value of the loaned securitiesdoes not exceed 30% of the Fund’s total assets. Theseloans earn income for the Fund and are collateralized bycash, securities issued or guaranteed by the U.S.Government or its agencies or instrumentalities, and suchother securities as the Fund and the securities lendingagent may agree upon. Investors will be given at least60 days’ written notice in advance of any change to theFund’s 80% investment policy set forth above.
Principal Risks of Investing in the Fund
There can be no assurance that the Fund’s investmentobjective will be met or that the net return on an investmentin the Fund will exceed what could have been obtainedthrough other investment or savings vehicles. Shares of theFund are not bank deposits and are not guaranteed orinsured by any bank, government entity or the FederalDeposit Insurance Corporation. As with any mutual fund,there is no guarantee that the Fund will be able to achieveits investment objective. If the value of the assets of theFund goes down, you could lose money.
The following is a summary of the principal risks of investingin the Fund.
Management Risk: The investment style or strategy usedby the sub-advisers may fail to produce the intended result.
- 30 -

FUND SUMMARY: GLOBAL REAL ESTATE FUND
The sub-advisers’ assessment of a particular security orcompany may prove incorrect, resulting in losses orunderperformance.
Real Estate Investments Risk: Securities of companies inthe real estate industry are sensitive to several factors, suchas changes in real estate values, interest rates, cash flow,occupancy rates, and greater company liabilities.Substantial investments in a particular industry or sectormake the Fund’s performance more susceptible to anysingle economic, market, political or regulatory occurrenceaffecting that particular industry, group of industries, orsector than a fund that invests more broadly.
REITs Risk: The performance of a REIT depends oncurrent economic conditions and the types of real propertyin which it invests and how well the property is managed. Ifa REIT concentrates its investments in a geographic regionor property type, changes in underlying real estate valuesmay have an exaggerated effect on the value of the REIT.
Equity Securities Risk: The Fund invests primarily inequity securities and is therefore subject to the risk thatstock prices will fall and may underperform other assetclasses. Individual stock prices fluctuate from day-to-dayand may decline significantly. The prices of individual stocksmay be negatively affected by poor company results orother factors affecting individual prices, as well as industryand/or economic trends and developments affectingindustries or the securities market as a whole.
Currency Risk: Because the Fund’s foreign investmentsare generally held in foreign currencies, the Fund couldexperience gains or losses based solely on changes in theexchange rate between foreign currencies and the U.S.dollar. Such gains or losses may be substantial.
Emerging Markets Risk: In addition to the risks associatedwith investments in foreign securities, emerging marketsecurities are subject to additional risks, which cause thesesecurities generally to be more volatile than securities ofissuers located in developed countries.
Foreign Investment Risk: Investment in foreign securitiesinvolves risks due to several factors, such as illiquidity, thelack of public information, changes in the exchange ratesbetween foreign currencies and the U.S. dollar, unfavorablepolitical, social and legal developments, or economic andfinancial instability. Foreign companies are not subject to theU.S. accounting and financial reporting standards and mayhave riskier settlement procedures. U.S. investments that aredenominated in foreign currencies or that are traded in foreignmarkets, or securities of U.S. companies that have significantforeign operations may be subject to foreign investment risk.
Geographic Risk: If the Fund invests a significant portion ofits assets in issuers located in a single country, a limitednumber of countries, or a particular geographic region, itassumes the risk that economic, political and socialconditions in those countries or that region may have asignificant impact on its investment performance.
Market Risk: The Fund’s share price can fall because ofweakness in the broad market, a particular industry, orspecific holdings or due to adverse political or economicdevelopments here or abroad, changes in investorpsychology, or heavy institutional selling. The price ofindividual securities may fluctuate, sometimes dramatically,from day-to-day. The prices of stocks and other equitysecurities tend to be more volatile than those of fixedincome securities.
Mid-Cap Company Risk: Investing primarily in mid-capcompanies carries the risk that due to current marketconditions these companies may be out of favor withinvestors. Stocks of mid-cap companies may be morevolatile than those of larger companies due to, among otherreasons, narrower product lines, more limited financialresources and fewer experienced managers.
Small-Cap Company Risk: Investing primarily in small-capcompanies carries the risk that due to current marketconditions these companies may be out of favor withinvestors. Small companies often are in the early stages ofdevelopment with limited product lines, markets, or financialresources and managements lacking depth and experience,which may cause their stock prices to be more volatile thanthose of larger companies. Small company stocks may beless liquid yet subject to abrupt or erratic price movements.It may take a substantial period of time before the Fundrealizes a gain on an investment in a small-cap company, ifit realizes any gain at all.
Synthetic Securities Risk: Fluctuations in the values ofsynthetic securities may not correlate perfectly with theinstruments they are designed to replicate and may bevolatile. Synthetic securities may be subject to interest ratechanges, market price fluctuations, counterparty risk andliquidity risk.
Securities Lending Risk: Engaging in securities lendingcould increase the market and credit risk for Fundinvestments. The Fund may lose money if it does notrecover borrowed securities, the value of the collateral falls,or the value of investments made with cash collateraldeclines. If the value of either the cash collateral or theFund’s investments of the cash collateral falls below theamount owed to a borrower, the Fund also may incur lossesthat exceed the amount it earned on lending the security.Securities lending also involves the risks of delay inreceiving additional collateral or possible loss of rights in thecollateral if the borrower fails. Another risk of securitieslending is the risk that the loaned portfolio securities maynot be available to the Fund on a timely basis and the Fundmay therefore lose the opportunity to sell the securities at adesirable price.
Performance Information
The following Risk/Return Bar Chart and Table illustrate therisks of investing in the Fund by showing changes in theFund’s performance from calendar year to calendar yearand comparing the Fund’s average annual returns to those
- 31 -

FUND SUMMARY: GLOBAL REAL ESTATE FUND
of the Financial Times Stock Exchange European PublicReal Estate Association / National Association of RealEstate Investment Trusts (“FTSE EPRA/NAREIT”)Developed Index. Fees and expenses incurred at thecontract level are not reflected in the bar chart or table. Ifthese amounts were reflected, returns would be less thanthose shown. Of course, past performance is notnecessarily an indication of how the Fund will perform in thefuture.
Invesco Advisers, Inc. (“Invesco”) is generally responsiblefor investing the portion of the Fund’s assets invested indomestic real estate securities. Goldman Sachs AssetManagement, L.P. (“GSAM”) is generally responsible forinvesting the portion of the Fund’s assets invested ininternational real estate securities. As of June 30, 2016,GSAM managed approximately 51% of the Fund’s assetsand Invesco managed approximately 49% of the Fund’sassets. The percentage of the Fund’s assets that each sub-adviser manages may, at the adviser’s discretion, changefrom time to time.
2009 2010 2011 2012 2013 2015-10%
-5%
0%
5%
10%
15%
20%
25%
30%
35%31.89%
18.22%
-8.00%
31.01%
4.55%
0.01%
2014
12.06%
During the periods shown in the bar chart, the highest returnfor a quarter was 27.35% (quarter ending June 30, 2009)and the lowest return for a quarter was -21.47% (quarterending March 31, 2009). For the year-to-date throughJune 30, 2016, the Fund’s return was 6.29%.
Average Annual Total Returns (For the periods endedDecember 31, 2015)
1Year
5Years
SinceInception
(3/10/2008)
Fund 0.01% 7.15% 4.65%FTSE EPRA/ NAREIT
Developed Index 0.05% 7.96% 4.82%
Investment Adviser
The Fund’s investment adviser is The Variable Annuity LifeInsurance Company. The Fund is sub-advised by GSAMand Invesco.
Portfolio Managers
Name
PortfolioManager ofthe Fund
Since Title
GSAMFrankie Chun Wah
Lee2011 Vice President and
Portfolio Manager
InvescoJoe Rodriguez, Jr. 2008 Managing Director,
Head of GlobalSecurities andLead PortfolioManager
Mark Blackburn, CFA 2008 Managing Director,Portfolio Manager
Paul Curbo, CFA 2008 Managing Director,Portfolio Manager
Ping-Ying Wang,PhD, CFA
2008 Managing Director,Portfolio Manager
Darin Turner 2009 Managing Director,Portfolio Manager
James Cowen 2015 Managing Director,Portfolio Manager
For important information about purchase and sales of Fundshares, taxes and payments made to broker-dealers andother financial intermediaries, please turn to the section“Important Additional Information” on page 101.
- 32 -
FUND SUMMARY: GLOBAL SOCIAL AWARENESS FUND
Investment Objective
The Fund seeks to obtain growth of capital throughinvestment, primarily in equity securities of companieswhich meet the social criteria established for the Fund.
Fees and Expenses of the Fund
This table describes the fees and expenses that you maypay if you buy and hold shares of the Fund. The Fund’sannual operating expenses do not reflect the separateaccount fees charged in the variable annuity or variable lifeinsurance policy (“Variable Contracts”) in which the Fund isoffered. If a separate account’s fees were shown, theFund’s annual operating expenses would be higher. Pleasesee your Variable Contract prospectus for more details onthe separate account fees.
Annual Fund Operating Expenses (expenses that youpay each year as a percentage of the value of yourinvestment)
Management Fees 0.50%Other Expenses 0.13%Total Annual Fund Operating Expenses 0.63%
Expense Example
This Example is intended to help you compare the cost ofinvesting in the Fund with the cost of investing in othermutual funds. The Example assumes that you invest$10,000 in the Fund for the time periods indicated and thenredeem all of your shares at the end of those periods. TheExample also assumes that your investment has a 5%return each year and that the Fund’s operating expensesremain the same. The Example does not reflect chargesimposed by the Variable Contract. If the Variable Contractfees were reflected then the expenses would be higher. Seethe Variable Contract prospectus for information on suchcharges. Although your actual costs may be higher or lower,based on these assumptions and the net expenses shownin the fee table, your costs would be:
1 Year 3 Years 5 Years 10 Years
$64 $202 $351 $786
Portfolio Turnover
The Fund pays transaction costs, such as commissions,when it buys and sells securities (or “turns over” itsportfolio). These costs, which are not reflected in annualfund operating expenses or in the example, affect theFund’s performance. During the most recent fiscal year, theFund’s portfolio turnover rate was 0% of the average valueof its portfolio.
Principal Investment Strategies of the Fund
The Fund invests in domestic and foreign companies thatmeet the Fund’s social criteria of avoiding companies that
are significantly engaged in the areas listed below. TheFund will generally invest in the equity securities of large-and mid- cap companies domiciled in the U.S., Europe,Japan and other developed markets. The Fund does notinvest in companies that are significantly engaged in:
Š the manufacture or distribution of civilian firearms,military weapons or weapons delivery systems;
Š the manufacture or distribution of alcoholicbeverages or tobacco products;
Š the operation of gambling-related businesses; andŠ the production of nuclear energy
The Fund also does not invest in companies that:
Š have a history of poor labor-management relations;Š engage in businesses or have products that have a
severely negative impact on the environment;Š have significant business operations in countries
whose governments pose human rights concerns;operate businesses that have a significantlyadverse impact on the communities in which theyare located;
Š engage in businesses or have products that have aseverely negative impact on their customers, whichmay include companies that have products thatpose safety or health concerns, engage in practicesthat are anti-competitive or have marketing that isinappropriate or misleading; and
Š have a history of poor business ethics, which mayinclude companies that have incidents of bribery orfraud, or poor governance structures.
Under normal circumstances, the Fund will invest at least80% of net assets in the equity securities of companies thatmeet the Fund’s social criteria located in at least threedifferent countries, with at least 40% of net assets in foreignsecurities, or if conditions are unfavorable, at least 30% ofnet assets in foreign securities. The sub-adviser maychange the allocation between U.S. and foreign securitiesprovided that the Fund’s investments in foreign securities donot exceed 75% of net assets.
In addition, the Fund may invest up to 20% of net assets inother securities of companies that meet the Fund’s socialcriteria, including preferred stock, convertible securities, andhigh quality money market securities and warrants. Socialcriteria may cause active or frequent trading of portfoliosecurities.
In order to generate additional income, the Fund may lendportfolio securities to broker-dealers and other financialinstitutions provided that the value of the loaned securitiesdoes not exceed 30% of the Fund’s total assets. Theseloans earn income for the Fund and are collateralized bycash, securities issued or guaranteed by the U.S.Government or its agencies or instrumentalities, and suchother securities as the Fund and the securities lendingagent may agree upon. Investors will be given at least60 days’ written notice in advance of any change to theFund’s 80% investment policy set forth above.
- 33 -

FUND SUMMARY: GLOBAL SOCIAL AWARENESS FUND
Principal Risks of Investing in the Fund
There can be no assurance that the Fund’s investmentobjective will be met or that the net return on an investmentin the Fund will exceed what could have been obtainedthrough other investment or savings vehicles. Shares of theFund are not bank deposits and are not guaranteed orinsured by any bank, government entity or the FederalDeposit Insurance Corporation. As with any mutual fund,there is no guarantee that the Fund will be able to achieveits investment objective. If the value of the assets of theFund goes down, you could lose money.
The following is a summary of the principal risks of investingin the Fund.
Active Trading Risk: High portfolio turnover rates that areassociated with active trading may result in highertransaction costs, which can adversely affect the Fund’sperformance. Active trading tends to be more pronouncedduring periods of increased market volatility.
Equity Securities Risk: The Fund invests primarily inequity securities and is therefore subject to the risk thatstock prices will fall and may underperform other assetclasses. Individual stock prices fluctuate from day-to-dayand may decline significantly. The prices of individual stocksmay be negatively affected by poor company results orother factors affecting individual prices, as well as industryand/or economic trends and developments affectingindustries or the securities market as a whole.
Social Criteria Risk: Social criteria screening limits theavailability of investment opportunities for the Fund. If theFund changes its social criteria or a company stops meetingthe Fund’s social criteria, the Fund will sell the affectedinvestments even if this means the Fund loses money.
Foreign Investment Risk: Investment in foreign securitiesinvolves risks due to several factors, such as illiquidity, thelack of public information, changes in the exchange ratesbetween foreign currencies and the U.S. dollar, unfavorablepolitical, social and legal developments, or economic andfinancial instability. Foreign companies are not subject tothe U.S. accounting and financial reporting standards andmay have riskier settlement procedures. U.S. investmentsthat are denominated in foreign currencies or that are tradedin foreign markets, or securities of U.S. companies thathave significant foreign operations may be subject to foreigninvestment risk.
Large- and Mid-Cap Company Risk: Investing primarily inlarge-cap and mid-cap companies carries the risk that dueto current market conditions these companies may be out offavor with investors. Large-cap companies may be unableto respond quickly to new competitive challenges or attainthe high growth rate of successful smaller companies.Stocks of mid-cap companies may be more volatile thanthose of larger companies due to, among other reasons,narrower product lines, more limited financial resources andfewer experienced managers.
Geographic Risk: If the Fund invests a significant portion ofits assets in issuers located in a single country, a limitednumber of countries, or a particular geographic region, itassumes the risk that economic, political and socialconditions in those countries or that region may have asignificant impact on its investment performance.
Currency Risk: Because the Fund’s foreign investmentsare generally held in foreign currencies, the Fund couldexperience gains or losses based solely on changes in theexchange rate between foreign currencies and the U.S.dollar. Such gains or losses may be substantial.
Market Risk: The Fund’s share price can fall because ofweakness in the broad market, a particular industry, orspecific holdings or due to adverse political or economicdevelopments here or abroad, changes in investorpsychology, or heavy institutional selling. The price ofindividual securities may fluctuate, sometimes dramatically,from day-to-day. The prices of stocks and other equitysecurities tend to be more volatile than those of fixedincome securities.
Securities Lending Risk: Engaging in securities lendingcould increase the market and credit risk for Fundinvestments. The Fund may lose money if it does notrecover borrowed securities, the value of the collateral falls,or the value of investments made with cash collateraldeclines. If the value of either the cash collateral or theFund’s investments of the cash collateral falls below theamount owed to a borrower, the Fund also may incur lossesthat exceed the amount it earned on lending the security.Securities lending also involves the risks of delay inreceiving additional collateral or possible loss of rights in thecollateral if the borrower fails. Another risk of securitieslending is the risk that the loaned portfolio securities maynot be available to the Fund on a timely basis and the Fundmay therefore lose the opportunity to sell the securities at adesirable price.
Convertible Securities Risk: Convertible security valuesmay be affected by market interest rates, issuer defaultsand underlying common stock values; security values mayfall if market interest rates rise and rise if market interestrates fall. Additionally, an issuer may have the right to buyback the securities at a time unfavorable to the Fund.
Preferred Stock Risk: Unlike common stock, preferredstock generally pays a fixed dividend from a company’searnings and may have a preference over common stock onthe distribution of a company’s assets in the event ofbankruptcy or liquidation. Preferred stockholders’ liquidationrights are subordinate to the company’s debt holders andcreditors. If interest rates rise, the fixed dividend onpreferred stocks may be less attractive and the price ofpreferred stocks may decline. Preferred stockholderstypically do not have voting rights.
Risks of Investing in Money Market Securities: Aninvestment in the Fund is subject to the risk that the value ofits investments in high-quality short-term obligations
- 34 -

FUND SUMMARY: GLOBAL SOCIAL AWARENESS FUND
(“money market securities”) may be subject to changes ininterest rates, changes in the rating of any money marketsecurity and in the ability of an issuer to make payments ofinterest and principal.
Warrant Risk: A warrant entitles the holder to purchase aspecified amount of securities at a pre-determined price.Warrants may not track the value of the securities the holderis entitled to purchase and may expire worthless if themarket price of the securities is below the exercise price ofthe warrant.
Performance Information
The following Risk/Return Bar Chart and Table illustrate therisks of investing in the Fund by showing changes in theFund’s performance from calendar year to calendar yearand comparing the Fund’s average annual returns to thoseof the MSCI World Index (net). Fees and expenses incurredat the contract level are not reflected in the bar chart ortable. If these amounts were reflected, returns would be lessthan those shown. Of course, past performance is notnecessarily an indication of how the Fund will perform in thefuture.
SunAmerica Asset Management, LLC (“SAAMCo”)assumed sub-advisory responsibilities on June 16, 2014.Prior to this time, the Fund was sub-advised by PineBridgeInvestments LLC.
2006 2007 2008 2009 2010 2011 2012 2013 2014-50%
-40%
-30%
-20%
-10%
0%
10%
20%
30%
40%
15.52%
4.40%
-39.98%
31.56%
12.23%
-6.18%
17.30%
28.87%
7.97%
-0.33%
2015
During the periods shown in the bar chart, the highest returnfor a quarter was 21.35% (quarter ending June 30, 2009)and the lowest return for a quarter was -23.46% (quarterending December 31, 2008). For the year-to-date throughJune 30, 2016, the Fund’s return was 1.62%.
Average Annual Total Returns (For the periods endedDecember 31, 2015)
1Year
5Years
10Years
Fund -0.33% 8.83% 5.02%MSCI World Index (net) -0.87% 7.59% 4.98%
Investment Adviser
The Fund’s investment adviser is The Variable Annuity LifeInsurance Company. The Fund is sub-advised by SAAMCo.
Portfolio Managers
Name
PortfolioManager ofthe Fund
Since Title
Timothy Campion 2014 Senior Vice Presidentand Lead PortfolioManager
Kara Murphy 2014 Senior VicePresident, ChiefInvestment Officerand Co-PortfolioManager
Jane Bayar 2015 Co-Portfolio Manager
For important information about purchase and sales of Fundshares, taxes and payments made to broker-dealers andother financial intermediaries, please turn to the section“Important Additional Information” on page 101.
- 35 -

FUND SUMMARY: GLOBAL STRATEGY FUND
Investment Objective
The Fund seeks high total return.
Fees and Expenses of the Fund
This table describes the fees and expenses that you maypay if you buy and hold shares of the Fund. The Fund’sannual operating expenses do not reflect the separateaccount fees charged in the variable annuity or variable lifeinsurance policy (“Variable Contracts”) in which the Fund isoffered. If a separate account’s fees were shown, theFund’s annual operating expenses would be higher. Pleasesee your Variable Contract prospectus for more details onthe separate account fees.
Annual Fund Operating Expenses (expenses that youpay each year as a percentage of the value of yourinvestment)
Management Fees 0.50%Other Expenses 0.14%Total Annual Fund Operating Expenses 0.64%
Expense Example
This Example is intended to help you compare the cost ofinvesting in the Fund with the cost of investing in othermutual funds. The Example assumes that you invest$10,000 in the Fund for the time periods indicated and thenredeem all of your shares at the end of those periods. TheExample also assumes that your investment has a 5%return each year and that the Fund’s operating expensesremain the same. The Example does not reflect chargesimposed by the Variable Contract. If the Variable Contractfees were reflected then the expenses would be higher. Seethe Variable Contract prospectus for information on suchcharges. Although your actual costs may be higher or lower,based on these assumptions and the net expenses shownin the fee table, your costs would be:
1 Year 3 Years 5 Years 10 Years
$65 $205 $357 $798
Portfolio Turnover
The Fund pays transaction costs, such as commissions,when it buys and sells securities (or “turns over” itsportfolio). These costs, which are not reflected in annualfund operating expenses or in the example, affect theFund’s performance. During the most recent fiscal year, theFund’s portfolio turnover rate was 26% of the average valueof its portfolio.
Principal Investment Strategies of the Fund
Under normal market conditions, the Fund invests in equitysecurities of companies in any country, fixed income (debt)securities of companies and governments of any country,and in money market securities. The equity securities in
which the Fund invests are primarily common stock. TheFund may invest in debt obligations of any maturity, such asbonds, notes, bills and debentures. The mix of investmentswill be adjusted in an effort to capitalize on the total returnpotential produced by changing economic conditionsthroughout the world. Although the Fund seeks investmentsacross a number of countries and sectors, from time to time,based on economic conditions, the Fund may havesignificant positions in particular countries or sectors.
There are no minimum or maximum percentage targets foreach asset class, though under normal market conditionsthe Fund invests 50% to 80% of its assets in equitysecurities. Although the Fund may buy bonds rated in anycategory, including bonds that are rated below investmentgrade, it generally focuses on “investment grade” bonds.
In addition, under normal market conditions, the Fundexpects to invest at least 40% of its net assets in foreignsecurities, including foreign equity securities and foreignsovereign debt securities. Although the Fund generallyinvests in securities of issuers located in developedcountries, the Fund may invest up to 50% of its total assetsin securities of issuers located in emerging markets.
The Fund regularly uses various currency relatedtransactions involving derivative instruments, includingcurrency and cross currency forwards and currency andcurrency index futures contracts. The Fund may maintainsignificant positions in currency related derivativeinstruments as a hedging technique or to implement acurrency investment strategy, which could expose a largeamount of the Fund’s assets to obligations under theseinstruments. The Fund may also enter into various othertransactions involving derivatives, including financial futurescontracts (such as interest rate or bond futures) and swapagreements (which may include interest rate and creditdefault swaps). The use of these derivative transactionsmay allow the Fund to obtain net long or net negative (short)exposure to selected currencies.
In order to generate additional income, the Fund may lendportfolio securities to broker-dealers and other financialinstitutions provided that the value of the loaned securitiesdoes not exceed 30% of the Fund’s total assets. Theseloans earn income for the Fund and are collateralized bycash, securities issued or guaranteed by the U.S.Government or its agencies or instrumentalities, and suchother securities as the Fund and the securities lendingagent may agree upon.
Principal Risks of Investing in the Fund
There can be no assurance that the Fund’s investmentobjective will be met or that the net return on an investmentin the Fund will exceed what could have been obtainedthrough other investment or savings vehicles. Shares of theFund are not bank deposits and are not guaranteed orinsured by any bank, government entity or the FederalDeposit Insurance Corporation. As with any mutual fund,there is no guarantee that the Fund will be able to achieve
- 36 -

FUND SUMMARY: GLOBAL STRATEGY FUND
its investment objective. If the value of the assets of theFund goes down, you could lose money.
The following is a summary of the principal risks of investingin the Fund.
Management Risk: The investment style or strategy usedby the sub-advisers may fail to produce the intended result.The sub-adviser’s assessment of a particular security orcompany may prove incorrect, resulting in losses orunderperformance.
Emerging Markets Risk: In addition to the risks associatedwith investments in foreign securities, emerging marketsecurities are subject to additional risks, which cause thesesecurities generally to be more volatile than securities ofissuers located in developed countries.
Foreign Investment Risk: Investment in foreign securitiesinvolves risks due to several factors, such as illiquidity, thelack of public information, changes in the exchange ratesbetween foreign currencies and the U.S. dollar, unfavorablepolitical and legal developments, or economic and financialinstability. Foreign companies are not subject to the U.S.accounting and financial reporting standards and may haveriskier settlement procedures. U.S. investments that aredenominated in foreign currencies or that are traded inforeign markets, or securities of U.S. companies that havesignificant foreign operations may be subject to foreigninvestment risk.
Geographic Risk: If the Fund invests a significant portion ofits assets in issuers located in a single country, a limitednumber of countries, or a particular geographic region, itassumes the risk that economic, political and socialconditions in those countries or regions may have asignificant impact on the Fund’s investment performance.
Equity Securities Risk: The Fund’s investments in equitysecurities are subject to the risk that stock prices will fall andmay underperform other asset classes. Individual stockprices fluctuate from day-to-day and may declinesignificantly. The prices of individual stocks may benegatively affected by poor company results or other factorsaffecting individual prices, as well as industry and/oreconomic trends and developments affecting industries orthe securities market as a whole.
Credit Risk: The issuer of a fixed income security owned bythe Fund may be unable to make interest or principalpayments.
Interest Rate Risk: The value of fixed income securitiesmay decline when interest rates go up or increase wheninterest rates go down. The interest earned on fixed incomesecurities may decline when interest rates go down orincrease when interest rates go up. Longer-term and lowercoupon bonds tend to be more sensitive to changes ininterest rates.
Currency Risk: Because the Fund’s foreign investmentsare generally held in foreign currencies, the Fund couldexperience gains or losses based solely on changes in theexchange rate between foreign currencies and the U.S.dollar. Such gains or losses may be substantial.
Derivatives Risk: The prices of derivatives may move inunexpected ways due to the use of leverage and otherfactors and may result in increased volatility or losses. TheFund may not be able to terminate or sell derivativepositions, and a liquid secondary market may not alwaysexist for derivative positions. When currency forwards areused by the Fund for hedging purposes, there is a risk thatdue to imperfect correlations, the currency forwards will notfully hedge against adverse changes in foreign currencyvalues or, under extreme market conditions, will not provideany hedging benefit. The successful use of currencyforwards for non-hedging purposes usually depends on theportfolio managers’ ability to forecast movements in foreigncurrency values and may be speculative. Should thesevalues move in unexpected ways, the Fund may notachieve the anticipated benefit from using currencyforwards, and it may realize losses, which could besignificant.
Credit Default Swap Risk: Credit default swaps increasecounterparty risk for the Fund as the buyer. The absence ofa central exchange or market for swap transactions maylead to difficulties in trading and valuation, especially in theevent of market disruptions. Recent legislation requiresmost swaps to be executed through a centralized exchangeor regulated facility and be cleared through a regulatedclearinghouse. The swap market could be disrupted orlimited as a result of this legislation, which could adverselyaffect the Fund. Moreover, the establishment of acentralized exchange or market for swap transactions maynot result in swaps being easier to trade or value.
Junk Bond Risk: High yielding, high risk fixed incomesecurities (“junk bonds”), may involve significantly greatercredit risk, market risk and interest rate risk compared tohigher rated fixed income securities. Issuers of junk bondsare less secure financially and their securities are moresensitive to downturns in the economy. The market for junkbonds may not be as liquid as that for more highly ratedsecurities.
Income Risk: Because the Fund can only distribute what itearns, the Fund’s distributions to shareholders may declinewhen prevailing interest rates fall or when the Fundexperiences defaults on debt securities it holds.
Counterparty Risk: Counterparty risk is the risk that acounterparty to a security, loan or derivative held by theFund becomes bankrupt or otherwise fails to perform itsobligations due to financial difficulties. The Fund mayexperience significant delays in obtaining any recovery in abankruptcy or other reorganization proceeding, and theremay be no recovery or limited recovery in suchcircumstances.
- 37 -

FUND SUMMARY: GLOBAL STRATEGY FUND
Foreign Sovereign Debt Risk: Foreign sovereign debtsecurities are subject to the risk that a governmental entitymay delay or refuse to pay interest or repay principal on itssovereign debt, due, for example, to cash flow problems,insufficient foreign currency reserves, political, social andeconomic considerations, the relative size of thegovernmental entity’s debt position in relation to theeconomy or the failure to put in place economic reformsrequired by the International Monetary Fund or othermultilateral agencies. If a governmental entity defaults, itmay ask for more time in which to pay or for further loans.
Market Risk: The Fund’s share price can fall because ofweakness in the broad market, a particular industry, orspecific holdings or due to adverse political or economicdevelopments here or abroad, changes in investorpsychology, or heavy institutional selling. The price ofindividual securities may fluctuate, sometimes dramatically,from day-to-day. The prices of stocks and other equitysecurities tend to be more volatile than those of fixedincome securities.
Risks of Investing in Money Market Securities: Aninvestment in the Fund is subject to the risk that the value ofits investments in high-quality short-term obligations(“money market securities”) may be subject to changes ininterest rates, changes in the rating of any money marketsecurity and in the ability of an issuer to make payments ofinterest and principal.
Securities Lending Risk: Engaging in securities lendingcould increase the market and credit risk for Fundinvestments. The Fund may lose money if it does notrecover borrowed securities, the value of the collateral falls,or the value of investments made with cash collateraldeclines. If the value of either the cash collateral or theFund’s investments of the cash collateral falls below theamount owed to a borrower, the Fund also may incur lossesthat exceed the amount it earned on lending the security.Securities lending also involves the risks of delay inreceiving additional collateral or possible loss of rights in thecollateral if the borrower fails. Another risk of securitieslending is the risk that the loaned portfolio securities maynot be available to the Fund on a timely basis and the Fundmay therefore lose the opportunity to sell the securities at adesirable price.
Value Style Risk: Generally, “value” stocks are stocks ofcompanies that the sub-adviser believes are currentlyundervalued in the marketplace. The sub-advisers’judgment that a particular security is undervalued in relationto the company’s fundamental economic value may proveincorrect and the price of the company’s stock may fall ormay not approach the value a sub-adviser has placed on it.
Performance Information
The following Risk/Return Bar Chart and Table illustrate therisks of investing in the Fund by showing changes in theFund’s performance from calendar year to calendar yearand comparing the Fund’s average annual returns to those
of the MSCI ACWI Index (net) and a blended index, which iscomposed of the J.P. Morgan GBI Global (unhedged)(40%) and the MSCI ACWI Index (60%). Fees andexpenses incurred at the contract level are not reflected inthe bar chart or table. If these amounts were reflected,returns would be less than those shown. Of course, pastperformance is not necessarily an indication of how theFund will perform in the future.
Franklin Advisers, Inc. (“Franklin Advisers”) manages thefixed income assets of the Fund. Templeton InvestmentCounsel, LLC (“Templeton Investment”) manages the equityassets of the Fund. As of June 30, 2016, Franklin Advisersmanaged approximately 40% of the Fund’s assets andTempleton Investment managed approximately 60% of theFund’s assets. The percentage of the Fund’s assets thateach sub-adviser manages may change, at the adviser’sdiscretion, from time to time.
2006 2007 2008 2009 2010 2011 2012 2013 20152014-25%
25%
-20%
-15%
-10%
-5%
0%
5%
10%
15%
20%21.12%
10.08%
-20.79%
24.03%
11.68%
-2.22%-4.76%
19.55%18.79%
1.84%
During the periods shown in the bar chart, the highest returnfor a quarter was 14.42% (quarter ending June 30, 2009)and the lowest return for a quarter was -13.53% (quarterending September 30, 2011). For the year-to-date throughJune 30, 2016, the Fund’s return was -2.63%.
Average Annual Total Returns (For the periods endedDecember 31, 2015)
1Year
5Years
10Years
Fund -4.76% 6.14% 7.02%MSCI ACWI (net) -2.36% 6.09% 4.75%JPM GBI Global (unhedged) -2.61% 0.34% 3.79%Blended Index -2.22% 3.97% 4.73%
Investment Adviser
The Fund’s investment adviser is The Variable Annuity LifeInsurance Company. The Fund is sub-advised by FranklinAdvisers and Templeton Investment.
- 38 -
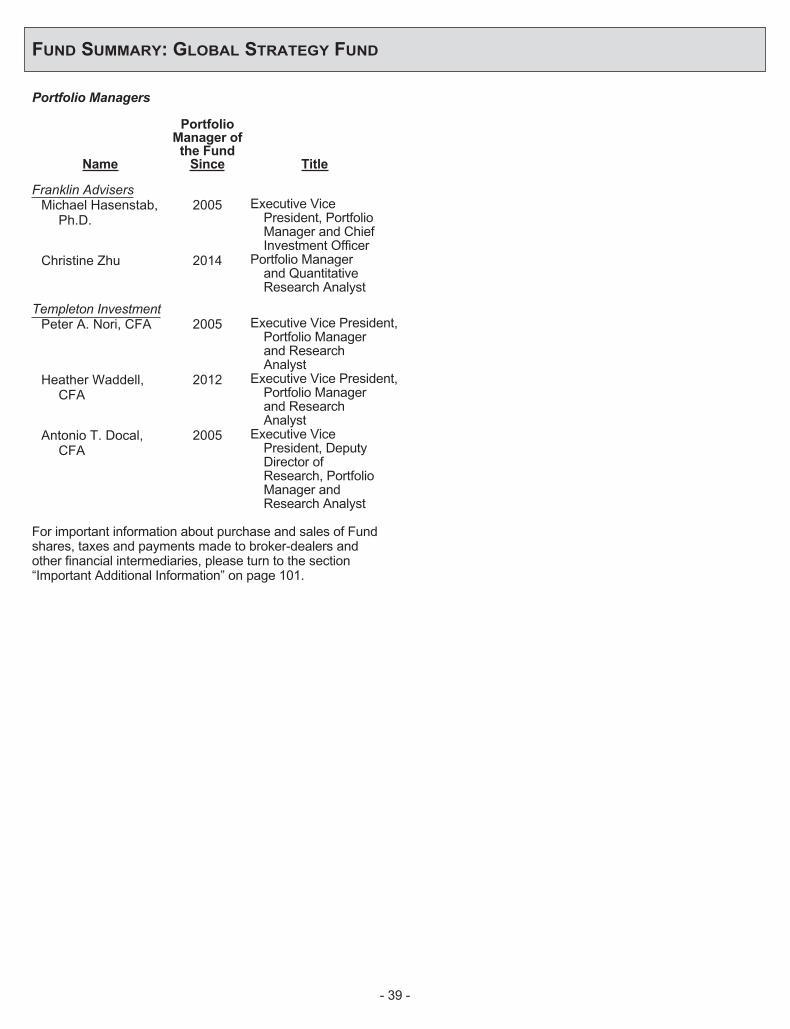
FUND SUMMARY: GLOBAL STRATEGY FUND
Portfolio Managers
Name
PortfolioManager ofthe Fund
Since Title
Franklin AdvisersMichael Hasenstab,
Ph.D.2005 Executive Vice
President, PortfolioManager and ChiefInvestment Officer
Christine Zhu 2014 Portfolio Managerand QuantitativeResearch Analyst
Templeton InvestmentPeter A. Nori, CFA 2005 Executive Vice President,
Portfolio Managerand ResearchAnalyst
Heather Waddell,CFA
2012 Executive Vice President,Portfolio Managerand ResearchAnalyst
Antonio T. Docal,CFA
2005 Executive VicePresident, DeputyDirector ofResearch, PortfolioManager andResearch Analyst
For important information about purchase and sales of Fundshares, taxes and payments made to broker-dealers andother financial intermediaries, please turn to the section“Important Additional Information” on page 101.
- 39 -

FUND SUMMARY: GOVERNMENT MONEY MARKET I FUND (FORMERLY, MONEY MARKET I FUND)
Investment Objective
The Fund seeks liquidity, protection of capital and currentincome through investments in short-term money marketinstruments.
Fees and Expenses of the Fund
This table describes the fees and expenses that you maypay if you buy and hold shares of the Fund. The Fund’sannual operating expenses do not reflect the separateaccount fees charged in the variable annuity or variable lifeinsurance policy (“Variable Contracts”) in which the Fundis offered. If a separate account’s fees were shown, theFund’s annual operating expenses would be higher.Please see your Variable Contract prospectus for moredetails on the separate account fees.
Annual Fund Operating Expenses (expenses that youpay each year as a percentage of the value of yourinvestment)
Management Fees 0.40%Other Expenses 0.11%Total Annual Fund Operating Expenses 0.51%
Expense Example
This Example is intended to help you compare the cost ofinvesting in the Fund with the cost of investing in othermutual funds. The Example assumes that you invest$10,000 in the Fund for the time periods indicated andthen redeem all of your shares at the end of those periods.The Example also assumes that your investment has a 5%return each year and that the Fund’s operating expensesremain the same. The Example does not reflect chargesimposed by the Variable Contract. If the Variable Contractfees were reflected then the expenses would be higher.See the Variable Contract prospectus for information onsuch charges. Although your actual costs may be higher orlower, based on these assumptions and the net expensesshown in the fee table, your costs would be:
1 Year 3 Years 5 Years 10 Years
$52 $164 $285 $640
Principal Investment Strategies of the Fund
The Fund invests at least 99.5% of its total assets in cash,U.S. Government securities, and/or repurchase agreementsthat are collateralized by cash and/or U.S. Governmentsecurities. In addition, under normal circumstances, theFund invests at least 80% of its net assets in U.S.Government securities and/or repurchase agreements thatare collateralized by U.S. Government securities. A“government money market fund” under Rule 2a-7, such asthe Fund, may, but is not required to, impose liquidity feesand redemption gates. The Fund’s Board of Directors hasdetermined that the Fund will not be subject to the liquidityfee and redemption gate provisions of Rule 2a-7, although
the Board may elect to impose liquidity fees or redemptiongates in the future.
The Fund is a money market fund and seeks to maintain astable share price of $1.00. In order to do this, the Fundmust follow rules of the Securities and ExchangeCommission (“SEC”) as to the liquidity, diversification andmaturity of its investments.
Investors will be given at least 60 days’ written notice inadvance of any change to the Fund’s 80% investment policyset forth above.
Principal Risks of Investing in the Fund
You could lose money by investing in the Fund. Althoughthe Fund seeks to preserve the value of your investment at$1.00 per share, it cannot guarantee it will do so. Aninvestment in the Fund is not insured or guaranteed by theFederal Deposit Insurance Corporation or any othergovernment agency. The Fund’s sponsor has no legalobligation to provide financial support to the Fund, and youshould not expect that the sponsor will provide financialsupport to the Fund at any time.
The following is a summary of the principal risks of investingin the Fund.
Credit Risk: The Fund may suffer losses if the issuer of afixed income security owned by the Fund is unable to makeinterest or principal payments. Credit risk is expected to below for the Government Money Market I Fund because of itsinvestment in U.S. Government securities.
Interest Rate Risk: While the Fund will invest primarily inshort-term securities, you should be aware that the value ofthe Fund’s investments may be subject to changes ininterest rates. A decline in interest rates will generally affectthe Fund’s yield as these securities mature or are sold andthe Fund purchases new short-term securities with loweryields. Generally, an increase in interest rates causes thevalue of a debt instrument to decrease. The change in valuefor shorter-term securities is usually smaller than forsecurities with longer maturities. Because the Fund investsin securities with short maturities and seeks to maintain astable net asset value (“NAV”) of $1.00 per share, it ispossible, though unlikely, that an increase or decrease ininterest rates would change the value of your investment inthe Fund. In addition, when interest rates are very low, theFund’s expenses could absorb all or a significant portion ofthe Fund’s income, and, if the Fund’s expenses exceed theFund’s income, the Fund may be unable to maintain its$1.00 share price. The Fund may be subject to a greaterrisk of rising interest rates due to the current period ofhistorically low rates and the effect of potential governmentfiscal policy initiatives and resulting market reaction to theseinitiatives.
Repurchase Agreements Risk: Repurchase agreementsare agreements in which the seller of a security to the Fundagrees to repurchase that security from the Fund at a
- 40 -
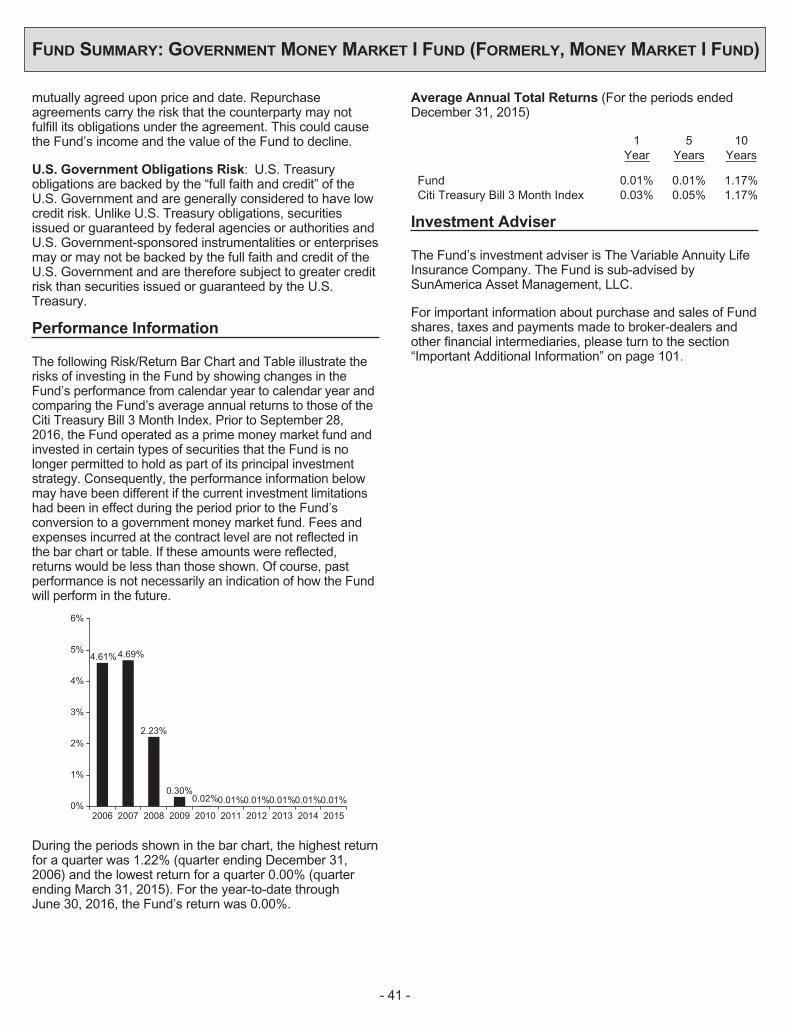
FUND SUMMARY: GOVERNMENT MONEY MARKET I FUND (FORMERLY, MONEY MARKET I FUND)
mutually agreed upon price and date. Repurchaseagreements carry the risk that the counterparty may notfulfill its obligations under the agreement. This could causethe Fund’s income and the value of the Fund to decline.
U.S. Government Obligations Risk: U.S. Treasuryobligations are backed by the “full faith and credit” of theU.S. Government and are generally considered to have lowcredit risk. Unlike U.S. Treasury obligations, securitiesissued or guaranteed by federal agencies or authorities andU.S. Government-sponsored instrumentalities or enterprisesmay or may not be backed by the full faith and credit of theU.S. Government and are therefore subject to greater creditrisk than securities issued or guaranteed by the U.S.Treasury.
Performance Information
The following Risk/Return Bar Chart and Table illustrate therisks of investing in the Fund by showing changes in theFund’s performance from calendar year to calendar year andcomparing the Fund’s average annual returns to those of theCiti Treasury Bill 3 Month Index. Prior to September 28,2016, the Fund operated as a prime money market fund andinvested in certain types of securities that the Fund is nolonger permitted to hold as part of its principal investmentstrategy. Consequently, the performance information belowmay have been different if the current investment limitationshad been in effect during the period prior to the Fund’sconversion to a government money market fund. Fees andexpenses incurred at the contract level are not reflected inthe bar chart or table. If these amounts were reflected,returns would be less than those shown. Of course, pastperformance is not necessarily an indication of how the Fundwill perform in the future.
2006 2007 2008 2009 2010 2011 2012 2013 201520140%
1%
2%
3%
4%
5%
6%
4.61%4.69%
2.23%
0.30%0.02% 0.01%0.01%0.01% 0.01%0.01%
During the periods shown in the bar chart, the highest returnfor a quarter was 1.22% (quarter ending December 31,2006) and the lowest return for a quarter 0.00% (quarterending March 31, 2015). For the year-to-date throughJune 30, 2016, the Fund’s return was 0.00%.
Average Annual Total Returns (For the periods endedDecember 31, 2015)
1Year
5Years
10Years
Fund 0.01% 0.01% 1.17%Citi Treasury Bill 3 Month Index 0.03% 0.05% 1.17%
Investment Adviser
The Fund’s investment adviser is The Variable Annuity LifeInsurance Company. The Fund is sub-advised bySunAmerica Asset Management, LLC.
For important information about purchase and sales of Fundshares, taxes and payments made to broker-dealers andother financial intermediaries, please turn to the section“Important Additional Information” on page 101.
- 41 -

FUND SUMMARY: GOVERNMENT SECURITIES FUND
Investment Objective
The Fund seeks high current income and protection ofcapital through investments in intermediate and long-termU.S. Government debt securities.
Fees and Expenses of the Fund
This table describes the fees and expenses that you maypay if you buy and hold shares of the Fund. The Fund’sannual operating expenses do not reflect the separateaccount fees charged in the variable annuity or variable lifeinsurance policy (“Variable Contracts”) in which the Fund isoffered. If a separate account’s fees were shown, theFund’s annual operating expenses would be higher. Pleasesee your Variable Contract prospectus for more details onthe separate account fees.
Annual Fund Operating Expenses (expenses that youpay each year as a percentage of the value of yourinvestment)
Management Fees 0.50%Other Expenses 0.14%Total Annual Fund Operating Expenses 0.64%
Expense Example
This Example is intended to help you compare the cost ofinvesting in the Fund with the cost of investing in othermutual funds. The Example assumes that you invest$10,000 in the Fund for the time periods indicated and thenredeem all of your shares at the end of those periods. TheExample also assumes that your investment has a 5%return each year and that the Fund’s operating expensesremain the same. The Example does not reflect chargesimposed by the Variable Contract. If the Variable Contractfees were reflected then the expenses would be higher. Seethe Variable Contract prospectus for information on suchcharges. Although your actual costs may be higher or lower,based on these assumptions and the net expenses shownin the fee table, your costs would be:
1 Year 3 Years 5 Years 10 Years
$65 $205 $357 $798
Portfolio Turnover
The Fund pays transaction costs, such as commissions,when it buys and sells securities (or “turns over” itsportfolio). These costs, which are not reflected in annualfund operating expenses or in the example, affect theFund’s performance. During the most recent fiscal year, theFund’s portfolio turnover rate was 17% of the average valueof its portfolio.
Principal Investment Strategies of the Fund
The Fund invests at least 80% of net assets in intermediate-and long-term U.S. Government and government-sponsored debt securities.
The Fund may also invest in mortgage-backed securities,asset-backed securities, repurchase agreements, highquality corporate debt securities and high quality domesticmoney market securities. In addition, the Fund may investup to 20% of its net assets in high quality foreigninvestments payable in U.S. dollars.
In order to generate additional income, the Fund may lendportfolio securities to broker-dealers and other financialinstitutions provided that the value of the loaned securitiesdoes not exceed 30% of the Fund’s total assets. Theseloans earn income for the Fund and are collateralized bycash, securities issued or guaranteed by the U.S.Government or its agencies or instrumentalities, and suchother securities as the Fund and the securities lendingagent may agree upon. Investors will be given at least60 days’ written notice in advance of any change to theFund’s 80% investment policy set forth above.
Principal Risks of Investing in the Fund
There can be no assurance that the Fund’s investmentobjective will be met or that the net return on an investmentin the Fund will exceed what could have been obtainedthrough other investment or savings vehicles. Shares of theFund are not bank deposits and are not guaranteed orinsured by any bank, government entity or the FederalDeposit Insurance Corporation. As with any mutual fund,there is no guarantee that the Fund will be able to achieveits investment objective. If the value of the assets of theFund goes down, you could lose money.
The following is a summary of the principal risks of investingin the Fund.
U.S. Government Obligations Risk: U.S. Treasuryobligations are backed by the “full faith and credit” of theU.S. Government and are generally considered to have lowcredit risk. Unlike U.S. Treasury obligations, securitiesissued or guaranteed by federal agencies or authorities andU.S. Government-sponsored instrumentalities or enterprisesmay or may not be backed by the full faith and credit of theU.S. Government and are therefore subject to greater creditrisk than securities issued or guaranteed by the U.S.Treasury.
Credit Risk: The Fund may suffer losses if the issuer of afixed income security owned by the Fund is unable to makeinterest or principal payments.
Interest Rate Risk: The value of fixed income securitiesmay decline when interest rates go up or increase wheninterest rates go down. The interest earned on fixed incomesecurities may decline when interest rates go down orincrease when interest rates go up. Longer-term and lowercoupon bonds tend to be more sensitive to changes ininterest rates. The Fund may be subject to a greater risk ofrising interest rates due to the current period of historicallylow rates and the effect of potential government fiscal policyinitiatives and resulting market reaction to these initiatives.
- 42 -

FUND SUMMARY: GOVERNMENT SECURITIES FUND
Call or Prepayment Risk: During periods of falling interestrates, a bond issuer may “call” a bond to repay it before itsmaturity date. The Fund may only be able to invest thebond’s proceeds at lower interest rates, resulting in adecline in the Fund’s income.
Currency Risk: Because the Fund’s foreign investmentsare generally held in foreign currencies, the Fund couldexperience gains or losses based solely on changes in theexchange rate between foreign currencies and the U.S.dollar. Such gains or losses may be substantial.
Foreign Investment Risk: Investment in foreign securitiesinvolves risks due to several factors, such as illiquidity, thelack of public information, changes in the exchange ratesbetween foreign currencies and the U.S. dollar, unfavorablepolitical, social and legal developments, or economic andfinancial instability. Foreign companies are not subject tothe U.S. accounting and financial reporting standards andmay have riskier settlement procedures. U.S. investmentsthat are denominated in foreign currencies or that are tradedin foreign markets, or securities of U.S. companies thathave significant foreign operations may be subject to foreigninvestment risk.
Market Risk: The Fund’s share price can fall because ofweakness in the broad market, a particular industry, orspecific holdings or due to adverse political or economicdevelopments here or abroad, changes in investorpsychology, or heavy institutional selling. The price ofindividual securities may fluctuate, sometimes dramatically,from day-to-day. The prices of stocks and other equitysecurities tend to be more volatile than those of fixedincome securities.
Mortgage-Backed Securities Risk: Mortgage-backedsecurities are similar to other debt securities in that they aresubject to credit risk and interest rate risk. Mortgage-backedsecurities may be issued or guaranteed by the U.S.Government, its agencies or instrumentalities or may benon-guaranteed securities issued by private issuers.
Asset-Backed Securities Risk: Certain asset-backedsecurities are issued by private parties rather than the U.S.Government or its agencies or government-sponsoredentities. If a private issuer fails to pay interest or repayprincipal, the assets backing these securities may beinsufficient to support the payments on the securities.
Securities Lending Risk: Engaging in securities lendingcould increase the market and credit risk for Fundinvestments. The Fund may lose money if it does notrecover borrowed securities, the value of the collateral falls,or the value of investments made with cash collateraldeclines. If the value of either the cash collateral or theFund’s investments of the cash collateral falls below theamount owed to a borrower, the Fund also may incur lossesthat exceed the amount it earned on lending the security.Securities lending also involves the risks of delay inreceiving additional collateral or possible loss of rights in thecollateral if the borrower fails. Another risk of securities
lending is the risk that the loaned portfolio securities maynot be available to the Fund on a timely basis and the Fundmay therefore lose the opportunity to sell the securities at adesirable price.
Risks of Investing in Money Market Securities: Aninvestment in the Fund is subject to the risk that the value ofits investments in high-quality short-term obligations(“money market securities”) may be subject to changes ininterest rates, changes in the rating of any money marketsecurity and in the ability of an issuer to make payments ofinterest and principal.
Repurchase Agreements Risk: Repurchase agreementsare agreements in which the seller of a security to the Fundagrees to repurchase that security from the Fund at amutually agreed upon price and date. Repurchaseagreements carry the risk that the counterparty may notfulfill its obligations under the agreement. This could causethe Fund’s income and the value of the Fund to decline.
Performance Information
The following Risk/Return Bar Chart and Table illustrate therisks of investing in the Fund by showing changes in theFund’s performance from calendar year to calendar yearand comparing the Fund’s average annual returns to thoseof the Barclays U.S. Government Bond Index. Fees andexpenses incurred at the contract level are not reflected inthe bar chart or table. If these amounts were reflected,returns would be less than those shown. Of course, pastperformance is not necessarily an indication of how theFund will perform in the future.
Effective, August 5, 2013, J.P. Morgan InvestmentManagement Inc. (“JPMIM”) assumed management of theFund. Prior to this time, the Fund was co-sub-advised byJPMIM and SunAmerica Asset Management, LLC(“SAAMCo”).
2006 2007 2008 2009 2010 2011 2012 2013 2015-6%
12%
3.03%
7.67%
9.76%
-3.78%
3.96%
9.78%
3.71%
-4.22%
0.81%
2014
5.52%
-4%
-2%
0%
2%
4%
6%
8%
10%
During the periods shown in the bar chart, the highest returnfor a quarter was 6.87% (quarter ending December 31,2008) and the lowest return for a quarter was -3.36%(quarter ending December 31, 2010). For the year-to-datethrough June 30, 2016, the Fund’s return was 4.82%.
- 43 -

FUND SUMMARY: GOVERNMENT SECURITIES FUND
Average Annual Total Returns (For the periods endedDecember 31, 2015)
1Year
5Years
10Years
Fund 0.81% 3.01% 3.52%Barclays U.S. Government Bond
Index 0.86% 2.77% 4.10%
Investment Adviser
The Fund’s investment adviser is The Variable Annuity LifeInsurance Company. The Fund is sub-advised by JPMIM.
Portfolio Managers
Name
PortfolioManager ofthe Fund
Since Title
Michael Sais 2011 Managing Directorand PortfolioManager
Robert Manning 2011 Executive Directorand PortfolioManager
For important information about purchase and sales of Fundshares, taxes and payments made to broker-dealers andother financial intermediaries, please turn to the section“Important Additional Information” on page 101.
- 44 -

FUND SUMMARY: GROWTH FUND
Investment Objective
The Fund seeks long-term capital growth.
Fees and Expenses of the Fund
This table describes the fees and expenses that you maypay if you buy and hold shares of the Fund. The Fund’sannual operating expenses do not reflect the separateaccount fees charged in the variable annuity or variable lifeinsurance policy (“Variable Contracts”) in which the Fund isoffered. If a separate account’s fees were shown, theFund’s annual operating expenses would be higher. Pleasesee your Variable Contract prospectus for more details onthe separate account fees.
Annual Fund Operating Expenses (expenses that youpay each year as a percentage of the value of yourinvestment)
Management Fees 0.70%Other Expenses 0.11%Total Annual Fund Operating Expenses 0.81%Fee Waiver and/or Expense
Reimbursement(1)(2)0.05%
Total Annual Fund Operating Expenses AfterFee Waiver and/or ExpenseReimbursement(1)(2)
0.76%
(1) The Fund’s investment adviser, The Variable Annuity LifeInsurance Company (“VALIC”), has contractually agreed to waiveits advisory fee through September 30, 2017, so that the advisoryfee payable by the Fund to VALIC equals 0.68% of the first$500 million of the Fund’s average daily net assets, 0.62% of thenext $500 million of the Fund’s average daily net assets, 0.59%of the next $500 million of the Fund’s average daily net assetsand 0.56% of the Fund’s average daily net assets thereafter. ThisAdvisory Fee Waiver Agreement will continue in effect from yearto year thereafter provided such continuance is agreed to byVALIC and approved by the Fund’s Board of Directors, includinga majority of the Board’s Independent Directors.
(2) The expense table above has been restated to reflect a completefiscal year of the contractual Advisory Fee Waiver Agreementthat was instituted on February 1, 2016.
Expense Example
This Example is intended to help you compare the cost ofinvesting in the Fund with the cost of investing in other mutualfunds. The Example assumes that you invest $10,000 in theFund for the time periods indicated and then redeem all ofyour shares at the end of those periods. The Example alsoassumes that your investment has a 5% return each yearand that the Fund’s operating expenses includes fee waiversfor year one. The Example does not reflect charges imposedby the Variable Contract. If the Variable Contract fees werereflected then the expenses would be higher. See theVariable Contract prospectus for information on suchcharges. Although your actual costs may be higher or lower,
based on these assumptions and the net expenses shown inthe fee table, your costs would be:
1 Year 3 Years 5 Years 10 Years
$78 $254 $445 $997
Portfolio Turnover
The Fund pays transaction costs, such as commissions,when it buys and sells securities (or “turns over” itsportfolio). These costs, which are not reflected in annualfund operating expenses or in the example, affect theFund’s performance. During the most recent fiscal year, theFund’s portfolio turnover rate was 102% of the averagevalue of its portfolio.
Principal Investment Strategies of the Fund
The Fund attempts to achieve its investment objective byallocating its assets among four investment strategies: agrowth strategy, a U.S. premier large cap growth strategy, adisciplined growth strategy and an international growthstrategy. The sub-adviser employs both strategic andtactical approaches when allocating the Fund’s assetsamong the four strategies, and seeks to strategicallydiversify the Fund’s assets while maintaining the flexibility totactically allocate its investments among the four strategiesin response to market conditions and other factors.
The following chart shows the sub-adviser’s projectedstrategic and tactical allocation targets or ranges for eachstrategy (as a percentage of the Fund’s assets). Thesepercentages reflect approximations of the projected assetallocations under normal market conditions and may berebalanced from time to time, at the discretion of the sub-adviser.
GrowthStrategy
U.S.Premier
Large CapGrowthStrategy
DisciplinedGrowthStrategy
InternationalGrowthStrategy
Strategicallocationtargets 35% 35% 20% 10%
Tacticalallocationranges 15-55% 15-55% 0-45% 0-20%
With respect to the growth strategy, under normal marketconditions, the sub-adviser invests primarily in large-cap,U.S. companies that the sub-adviser believes aredemonstrating business improvements, such asaccelerating earnings or revenue growth rates, increasingcash flows, or other indications of the relative strength of acompany’s business.
With respect to the U.S. premier large cap growth strategy,the sub-adviser invests primarily in large- cap, U.S.companies. Under normal market conditions, the sub-adviser seeks securities of companies whose earnings or
- 45 -
FUND SUMMARY: GROWTH FUND
revenues are not only growing but growing at anaccelerated pace. This includes companies whose growthrates, although still negative, are less negative than priorperiods, and companies whose growth rates are expectedto accelerate. In addition to accelerating growth and othersigns of business improvement, the sub-adviser considerscompanies demonstrating price strength relative to theirpeers.
With respect to the disciplined growth strategy, the sub-adviser invests primarily in large-cap, publicly traded U.S.companies with a market capitalization greater than$2 billion, using quantitative management techniques in atwo-step process. This process first employs an objectiveset of measures, including valuation, quality, growth andsentiment, to rank stocks, and then uses a quantitativemodel to build a portfolio of stocks from the ranking in orderto provide what the sub-adviser believes represents theoptimal balance between risk and expected return.
With respect to the international growth strategy, the sub-adviser invests primarily in equity securities of issuerslocated in developed countries world-wide (excluding theUnited States). Under normal market conditions, the sub-adviser seeks securities of companies whose earnings,revenues or key business fundamentals are not onlygrowing, but growing at an accelerating pace. The sub-adviser believes that it is important to diversify the Fund’sholdings across different countries and geographical regionsin an effort to manage the risks of an international portfolio.For this reason, the sub-adviser also considers theprospects for relative economic growth among countries orregions, economic and political conditions, expectedinflation rates, currency exchange fluctuations and taxconsiderations when making investments.
While the growth, U.S. premier large cap growth anddisciplined growth strategies invest primarily in U.S.companies, they may also invest in securities of foreigncompanies, including companies located in emergingmarkets. In addition, the Fund may invest up to 20% of itsnet assets in foreign securities, including emerging marketsecurities.
In order to generate additional income, the Fund may lendportfolio securities to broker-dealers and other financialinstitutions provided that the value of the loaned securitiesdoes not exceed 30% of the Fund’s total assets. Theseloans earn income for the Fund and are collateralized bycash, securities issued or guaranteed by the U.S.Government or its agencies or instrumentalities, and suchother securities as the Fund and the securities lendingagent may agree upon.
Principal Risks of Investing in the Fund
There can be no assurance that the Fund’s investmentobjective will be met or that the net return on an investmentin the Fund will exceed what could have been obtainedthrough other investment or savings vehicles. Shares of theFund are not bank deposits and are not guaranteed or
insured by any bank, government entity or the FederalDeposit Insurance Corporation. As with any mutual fund,there is no guarantee that the Fund will be able to achieveits investment objective. If the value of the assets of theFund goes down, you could lose money.
The following is a summary of the principal risks of investingin the Fund.
Asset Allocation Risk: The Fund’s ability to achieve itsinvestment objective depends in part on the sub-adviser’sskill in determining the Fund’s investment strategyallocations. Although allocation among different investmentstrategies generally reduces risk and exposure to any onestrategy, the risk remains that the sub-adviser may favor aninvestment strategy that performs poorly relative to otherinvestment strategies.
Management Risk: The investment style or strategy usedby the sub-adviser may fail to produce the intended result.The sub-adviser’s assessment of a particular security orcompany may prove incorrect, resulting in losses orunderperformance.
Equity Securities Risk: The Fund’s investments in equitysecurities are subject to the risk that stock prices will fall andmay underperform other asset classes. Individual stockprices fluctuate from day-to-day and may declinesignificantly. The prices of individual stocks may benegatively affected by poor company results or other factorsaffecting individual prices, as well as industry and/oreconomic trends and developments affecting industries orthe securities market as a whole.
Currency Risk: Because the Fund’s foreign investmentsare generally held in foreign currencies, the Fund couldexperience gains or losses based solely on changes in theexchange rate between foreign currencies and the U.S.dollar. Such gains or losses may be substantial.
Foreign Investment Risk: Investment in foreign securitiesinvolves risks due to several factors, such as illiquidity, thelack of public information, changes in the exchange ratesbetween foreign currencies and the U.S. dollar, unfavorablepolitical, social and legal developments, or economic andfinancial instability. Foreign companies are not subject tothe U.S. accounting and financial reporting standards andmay have riskier settlement procedures. U.S. investmentsthat are denominated in foreign currencies or that are tradedin foreign markets, or securities of U.S. companies thathave significant foreign operations may be subject to foreigninvestment risk.
Emerging Markets Risk: Investments in emerging marketsare subject to all of the risks of investments in foreignsecurities, generally to a greater extent than in developedmarkets, and additional risks as well. Generally, theeconomic, social, legal, and political structures in emergingmarket countries are less diverse, mature and stable thanthose in developed countries. As a result, investments inemerging market securities tend to be more volatile than
- 46 -

FUND SUMMARY: GROWTH FUND
investments in developed countries. Unlike most developedcountries, emerging market countries may imposerestrictions on foreign investment. These countries may alsoimpose confiscatory taxes on investment proceeds orotherwise restrict the ability of foreign investors to withdrawtheir money at will.
Growth Style Risk: Generally, “growth” stocks are stocksof companies that the sub-adviser believes have anticipatedearnings ranging from steady to accelerated growth. Manyinvestors buy growth stocks because of anticipated superiorearnings growth, but earnings disappointments often resultin sharp price declines. Growth companies usually invest ahigh portion of earnings in their own businesses so theirstocks may lack the dividends that can cushion share pricesin a down market. In addition, the value of fast growthstocks may be more sensitive to changes in current orexpected earnings than the values of other stocks, becausegrowth stocks trade at higher prices relative to currentearnings.
Information Risk: When the quantitative models (“Models”)and information and data (“Data”) used in managing theFund prove to be incorrect or incomplete, any investmentdecisions made in reliance on the Models and Data may notproduce the desired results and the Fund may realizelosses. In addition, any hedging based on faulty Models andData may prove to be unsuccessful. Furthermore, thesuccess of Models that are predictive in nature is dependentlargely on the accuracy and reliability of the supplieshistorical data. All models are susceptible to input errorsthat may cause the resulting information to be incorrect.
Large-Cap Company Risk: Investing primarily in large-capcompanies carries the risk that due to current marketconditions these companies may be out of favor withinvestors. Large-cap companies may be unable to respondquickly to new competitive challenges or attain the highgrowth rate of successful smaller companies.
Market Risk: The Fund’s share price can fall because ofweakness in the broad market, a particular industry, orspecific holdings or due to adverse political or economicdevelopments here or abroad, changes in investorpsychology, or heavy institutional selling. The price ofindividual securities may fluctuate, sometimes dramatically,from day-to-day. The prices of stocks and other equitysecurities tend to be more volatile than those of fixedincome securities.
Price Volatility Risk: The Fund’s investment strategy maysubject the Fund’s portfolio to increased volatility. Volatilitymay cause the value of the Fund’s portfolio to fluctuatesignificantly in the short term.
Securities Lending Risk: Engaging in securities lendingcould increase the market and credit risk for Fundinvestments. The Fund may lose money if it does notrecover borrowed securities, the value of the collateral falls,or the value of investments made with cash collateraldeclines. If the value of either the cash collateral or the
Fund’s investments of the cash collateral falls below theamount owed to a borrower, the Fund also may incur lossesthat exceed the amount it earned on lending the security.Securities lending also involves the risks of delay inreceiving additional collateral or possible loss of rights in thecollateral if the borrower fails. Another risk of securitieslending is the risk that the loaned portfolio securities maynot be available to the Fund on a timely basis and the Fundmay therefore lose the opportunity to sell the securities at adesirable price.
Performance Information
The following Risk/Return Bar Chart and Table illustrate therisks of investing in the Fund by showing changes in theFund’s performance from calendar year to calendar yearand comparing the Fund’s average annual returns to thoseof the Russell 1000® Growth Index. Fees and expensesincurred at the contract level are not reflected in the barchart or table. If these amounts were reflected, returnswould be less than those shown. Of course, pastperformance is not necessarily an indication of how theFund will perform in the future.
-3.36%
21.04%
-39.64%
36.53%
18.24%
-0.62%
14.92%
31.10%
3.08%
-50%
-40%
-30%
-20%
-10%
0%
10%
20%
30%
40%
2006 2007 2008 2009 2010 2011 2012 2013 2015
10.73%
2014
During the periods shown in the bar chart, the highest returnfor a quarter was 16.27% (quarter ending June 30, 2009)and the lowest return for a quarter was -23.80% (quarterending December 31, 2008). For the year-to-date throughJune 30, 2016, the Fund’s return was -0.89%.
Average Annual Total Returns (For the periods endedDecember 31, 2015)
1Year
5Years
10Years
Fund 3.08% 11.31% 6.90%Russell 1000® Growth Index 5.67% 13.53% 8.53%
Investment Adviser
The Fund’s investment adviser is The Variable Annuity LifeInsurance Company. The Fund is sub-advised by AmericanCentury Investment Management, Inc.
- 47 -
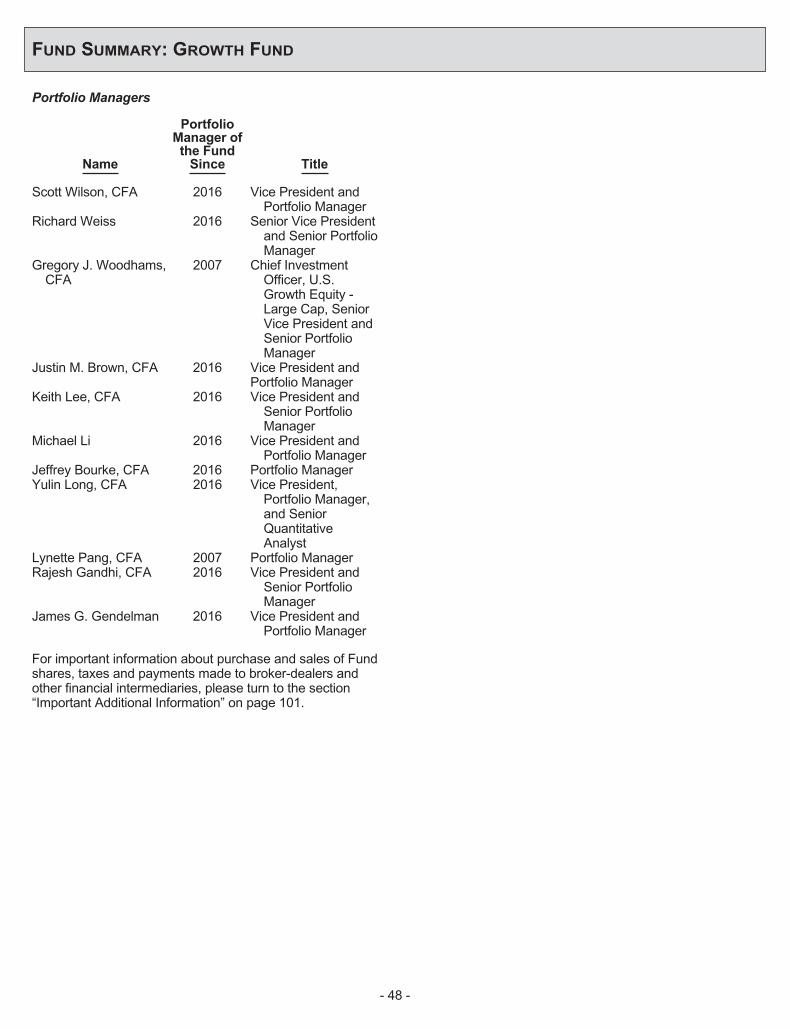
FUND SUMMARY: GROWTH FUND
Portfolio Managers
Name
PortfolioManager ofthe Fund
Since Title
Scott Wilson, CFA 2016 Vice President andPortfolio Manager
Richard Weiss 2016 Senior Vice Presidentand Senior PortfolioManager
Gregory J. Woodhams,CFA
2007 Chief InvestmentOfficer, U.S.Growth Equity -Large Cap, SeniorVice President andSenior PortfolioManager
Justin M. Brown, CFA 2016 Vice President andPortfolio Manager
Keith Lee, CFA 2016 Vice President andSenior PortfolioManager
Michael Li 2016 Vice President andPortfolio Manager
Jeffrey Bourke, CFA 2016 Portfolio ManagerYulin Long, CFA 2016 Vice President,
Portfolio Manager,and SeniorQuantitativeAnalyst
Lynette Pang, CFA 2007 Portfolio ManagerRajesh Gandhi, CFA 2016 Vice President and
Senior PortfolioManager
James G. Gendelman 2016 Vice President andPortfolio Manager
For important information about purchase and sales of Fundshares, taxes and payments made to broker-dealers andother financial intermediaries, please turn to the section“Important Additional Information” on page 101.
- 48 -
FUND SUMMARY: GROWTH & INCOME FUND
Investment Objective
The Fund seeks to provide long-term growth of capital and,secondarily, current income through investment in commonstocks and equity-related securities.
Fees and Expenses of the Fund
This table describes the fees and expenses that you maypay if you buy and hold shares of the Fund. The Fund’sannual operating expenses do not reflect the separateaccount fees charged in the variable annuity or variable lifeinsurance policy (“Variable Contracts”) in which the Fund isoffered. If a separate account’s fees were shown, theFund’s annual operating expenses would be higher. Pleasesee your Variable Contract prospectus for more details onthe separate account fees.
Annual Fund Operating Expenses (expenses that youpay each year as a percentage of the value of yourinvestment)
Management Fees 0.75%Other Expenses 0.16%Total Annual Fund Operating Expenses 0.91%Expense Reimbursement(1) 0.06%Total Annual Fund Operating Expenses After
Expense Reimbursement0.85%
(1) The Fund’s investment adviser, The Variable Annuity LifeInsurance Company, has contractually agreed to reimburse theexpenses of the Fund through September 30, 2017, so that theFund’s Total Annual Fund Operating Expenses After ExpenseReimbursement do not exceed 0.85%. For purposes of theExpense Limitation Agreement, “Total Annual Fund OperatingExpenses” shall not include extraordinary expenses (i.e.expenses that are unusual in nature and/or infrequent inoccurrence, such as litigation), or acquired fund fees andexpenses, brokerage commissions and other transactionalexpenses relating to the purchase and sale of portfolio securities,interest, taxes and governmental fees, and other expenses notincurred in the ordinary course of the Fund’s business. ThisExpense Limitation Agreement will continue in effect from year toyear thereafter unless terminated by the Board of Directors priorto any such renewal.
Expense Example
This Example is intended to help you compare the cost ofinvesting in the Fund with the cost of investing in othermutual funds. The Example assumes that you invest$10,000 in the Fund for the time periods indicated and thenredeem all of your shares at the end of those periods. TheExample also assumes that your investment has a 5%return each year and that the Fund’s operating expensesinclude expense reimbursements for year one. TheExample does not reflect charges imposed by the VariableContract. If the Variable Contract fees were reflected thenthe expenses would be higher. See the Variable Contractprospectus for information on such charges. Although youractual costs may be higher or lower, based on these
assumptions and the net expenses shown in the fee table,your costs would be:
1 Year 3 Years 5 Years 10 Years
$87 $284 $498 $1,114
Portfolio Turnover
The Fund pays transaction costs, such as commissions,when it buys and sells securities (or “turns over” itsportfolio). These costs, which are not reflected in annualfund operating expenses or in the example, affect theFund’s performance. During the most recent fiscal year, theFund’s portfolio turnover rate was 33% of the average valueof its portfolio.
Principal Investment Strategies of the Fund
The Fund invests in stocks that provide long-term growthpotential. As a secondary goal, the Fund invests in stocksthat will provide current income. The sub-adviser uses abottom-up, disciplined investment process. The sub-adviserseeks to achieve the Fund’s investment objective throughstock selection grounded in proprietary fundamentalresearch and disciplined portfolio construction. Individualsecurities are ranked within industry sectors based on theattractiveness of their valuations. The sub-adviser believesthis approach may reduce the market timing, sector andstyle risks typically associated with active portfoliomanagement while maintaining risk characteristics similar tothe Fund’s benchmark.
The Fund generally invests 90% to 95% of total assets, atthe time of purchase, in common stocks and equity-relatedsecurities. The Fund principally invests in large-capcompanies.
In order to generate additional income, the Fund may lendportfolio securities to broker-dealers and other financialinstitutions provided that the value of the loaned securitiesdoes not exceed 30% of the Fund’s total assets. Theseloans earn income for the Fund and are collateralized bycash, securities issued or guaranteed by the U.S.Government or its agencies or instrumentalities, and suchother securities as the Fund and the securities lendingagent may agree upon.
Principal Risks of Investing in the Fund
There can be no assurance that the Fund’s investmentobjective will be met or that the net return on an investmentin the Fund will exceed what could have been obtainedthrough other investment or savings vehicles. Shares of theFund are not bank deposits and are not guaranteed orinsured by any bank, government entity or the FederalDeposit Insurance Corporation. As with any mutual fund,there is no guarantee that the Fund will be able to achieveits investment objective. If the value of the assets of theFund goes down, you could lose money.
- 49 -

FUND SUMMARY: GROWTH & INCOME FUND
The following is a summary of the principal risks of investingin the Fund.
Management Risk: The investment style or strategy usedby the sub-adviser may fail to produce the intended result.The sub-adviser’s assessment of a particular security orcompany may prove incorrect, resulting in losses orunderperformance.
Equity Securities Risk: The Fund invests primarily inequity securities and is therefore subject to the risk thatstock prices will fall and may underperform other assetclasses. Individual stock prices fluctuate from day-to-dayand may decline significantly. The prices of individual stocksmay be negatively affected by poor company results orother factors affecting individual prices, as well as industryand/or economic trends and developments affectingindustries or the securities market as a whole.
Large-Cap Company Risk: Investing primarily in large-capcompanies carries the risk that due to current marketconditions these companies may be out of favor withinvestors. Large-cap companies may be unable to respondquickly to new competitive challenges or attain the highgrowth rate of successful smaller companies.
Growth Style Risk: Generally, “growth” stocks are stocksof companies that the sub-adviser believes have anticipatedearnings ranging from steady to accelerated growth. Manyinvestors buy growth stocks because of anticipated superiorearnings growth, but earnings disappointments often resultin sharp price declines. Growth companies usually invest ahigh portion of earnings in their own businesses so theirstocks may lack the dividends that can cushion share pricesin a down market. In addition, the value of fast growthstocks may be more sensitive to changes in current orexpected earnings than the values of other stocks, becausegrowth stocks trade at higher prices relative to currentearnings.
Value Style Risk: Generally, “value” stocks are stocks ofcompanies that the sub-adviser believes are currentlyundervalued in the marketplace. The sub-advisers’judgment that a particular security is undervalued in relationto the company’s fundamental economic value may proveincorrect and the price of the company’s stock may fall ormay not approach the value a sub-adviser has placed on it.
Market Risk: The Fund’s share price can fall because ofweakness in the broad market, a particular industry, orspecific holdings or due to adverse political or economicdevelopments here or abroad, changes in investorpsychology, or heavy institutional selling. The price ofindividual securities may fluctuate, sometimes dramatically,from day-to-day. The prices of stocks and other equitysecurities tend to be more volatile than those of fixedincome securities.
Securities Lending Risk: Engaging in securities lendingcould increase the market and credit risk for Fundinvestments. The Fund may lose money if it does notrecover borrowed securities, the value of the collateral falls,
or the value of investments made with cash collateraldeclines. If the value of either the cash collateral or theFund’s investments of the cash collateral falls below theamount owed to a borrower, the Fund also may incur lossesthat exceed the amount it earned on lending the security.Securities lending also involves the risks of delay inreceiving additional collateral or possible loss of rights in thecollateral if the borrower fails. Another risk of securitieslending is the risk that the loaned portfolio securities maynot be available to the Fund on a timely basis and the Fundmay therefore lose the opportunity to sell the securities at adesirable price.
Performance Information
The following Risk/Return Bar Chart and Table illustrate therisks of investing in the Fund by showing changes in theFund’s performance from calendar year to calendar yearand comparing the Fund’s average annual returns to thoseof the S&P 500® Index. Fees and expenses incurred at thecontract level are not reflected in the bar chart or table. Ifthese amounts were reflected, returns would be less thanthose shown. Of course, past performance is notnecessarily an indication of how the Fund will perform in thefuture.
J.P. Morgan Investment Management, Inc. (“JPMIM”)assumed sub-advisory responsibility on September 16,2013. Prior to such time, the Fund was sub-advised bySunAmerica Asset Management, LLC (“SAAMCo”).
2006 2007 2008 2009 2010 2011 2012 2013 2015-50%
0%
40%
-40%
-30%
-20%
-10%
10%
20%
30%
15.35%
7.05%
-36.75%
21.82%
12.26%
-4.35%
13.36%
32.66%
-0.09%
2014
14.13%
During the periods shown in the bar chart, the highest returnfor a quarter was 15.82% (quarter ending June 30, 2009)and the lowest return for a quarter was -23.06% (quarterending December 31, 2008). For the year-to-date throughJune 30, 2016, the Fund’s return was 2.50%.
Average Annual Total Returns (For the periods endedDecember 31, 2015)
1Year
5Years
10Years
Fund -0.09% 10.40% 5.77%S&P 500® Index 1.38% 12.57% 7.31%
- 50 -

FUND SUMMARY: GROWTH & INCOME FUND
Investment Adviser
The Fund’s investment adviser is The Variable Annuity LifeInsurance Company. The Fund is sub-advised by JPMIM.
Portfolio Managers
Name
PortfolioManager ofthe Fund
Since Title
Raffaele Zingone 2013 Managing DirectorTim Snyder 2013 Executive Director
For important information about purchase and sales of Fundshares, taxes and payments made to broker-dealers andother financial intermediaries, please turn to the section“Important Additional Information” on page 101.
- 51 -

FUND SUMMARY: HEALTH SCIENCES FUND
Investment Objective
The Fund seeks long-term capital growth.
Fees and Expenses of the Fund
This table describes the fees and expenses that you maypay if you buy and hold shares of the Fund. The Fund’sannual operating expenses do not reflect the separateaccount fees charged in the variable annuity or variable lifeinsurance policy (“Variable Contracts”) in which the Fund isoffered. If a separate account’s fees were shown, theFund’s annual operating expenses would be higher. Pleasesee your Variable Contract prospectus for more details onthe separate account fees.
Annual Fund Operating Expenses (expenses that youpay each year as a percentage of the value of yourinvestment)
Management Fees 0.98%Other Expenses 0.11%Total Annual Fund Operating Expenses 1.09%Fee Waiver and/or Expense
Reimbursement(1)(2) 0.04%Total Annual Fund Operating Expenses After
Fee Waiver and/or ExpenseReimbursement(1)(2) 1.05%
(1) The Fund’s investment adviser, The Variable Annuity LifeInsurance Company (“VALIC”), has contractually agreed to waiveits advisory fee through September 30, 2017, so that the advisoryfee payable by the Fund to VALIC equals 0.97% of the Fund’saverage daily net assets when the Fund’s assets are between$700 million and $750 million and equals 0.94% of the Fund’saverage daily net assets when the Fund’s assets exceed $750million. This Fee Waiver Agreement will continue in effect fromyear to year thereafter provided such continuance is agreed to byVALIC and approved by the Fund’s Board of Directors, includinga majority of the Board’s Independent Directors.
(2) The expense table above has been restated to reflect a completefiscal year of the contractual Fee Waiver Agreement that wasinstituted on August 17, 2015
Expense Example
This Example is intended to help you compare the cost ofinvesting in the Fund with the cost of investing in other mutualfunds. The Example assumes that you invest $10,000 in theFund for the time periods indicated and then redeem all ofyour shares at the end of those periods. The Example alsoassumes that your investment has a 5% return each yearand that the Fund’s operating expenses include fee waiversfor year one. The Example does not reflect charges imposedby the Variable Contract. If the Variable Contract fees werereflected then the expenses would be higher. See theVariable Contract prospectus for information on suchcharges. Although your actual costs may be higher or lower,based on these assumptions and the net expenses shown inthe fee table, your costs would be:
1 Year 3 Years 5 Years 10 Years
$107 $343 $597 $1,325
Portfolio Turnover
The Fund pays transaction costs, such as commissions,when it buys and sells securities (or “turns over” itsportfolio). These costs, which are not reflected in annualfund operating expenses or in the example, affect theFund’s performance. During the most recent fiscal year, theFund’s portfolio turnover rate was 31% of the average valueof its portfolio.
Principal Investment Strategies of the Fund
The Fund pursues long-term capital appreciation byinvesting, under normal circumstances, at least 80% of itsnet assets in the common stocks of companies engaged inthe research, development, production, or distribution ofproducts or services related to health care, medicine, or thelife sciences (collectively termed “health sciences”). Whilethe Fund can invest in companies of any size, the majorityof Fund assets are expected to be invested in large- andmid-cap companies.
The Fund’s sub-adviser divides the health sciences sectorinto four main areas: pharmaceuticals, health care servicescompanies, medical products and devices providers, andbiotechnology firms. The allocation among these four areaswill vary depending on the relative potential the sub-advisersees within each area and the outlook for the overall healthsciences sector.
While most assets will be invested in U.S. common stocks,the Fund may invest in foreign stocks, consistent with theFund’s objective. The Fund may invest up to 35% of its totalassets in foreign stocks, which include non-dollardenominated securities traded outside the U.S.
In addition, the Fund writes call and put options primarily asa means of generating additional income. Normally, theFund will own the securities on which it writes these options.The premium income received by writing covered calls canhelp reduce but not eliminate portfolio volatility. The Fundalso uses options to hedge against losses and to lock-ingains when stocks appreciate.
In pursuing its investment objective, the sub-adviser has thediscretion to deviate from its normal investment criteria, asdescribed in this Fund Summary, when it perceives anopportunity for substantial appreciation. These situationsmight arise when the sub-adviser believes a security couldincrease in value for a variety of reasons, including achange in management, an extraordinary corporate event, anew product introduction or innovation, a favorablecompetitive development or a change in management. TheFund may sell securities for a variety of reasons, such as tosecure gains, limit losses, or redeploy assets into morepromising opportunities.
In order to generate additional income, the Fund may lendportfolio securities to broker-dealers and other financialinstitutions provided that the value of the loaned securitiesdoes not exceed 30% of the Fund’s total assets. These
- 52 -

FUND SUMMARY: HEALTH SCIENCES FUND
loans earn income for the Fund and are collateralized bycash, securities issued or guaranteed by the U.S.Government or its agencies or instrumentalities, and suchother securities as the Fund and the securities lendingagent may agree upon. Investors will be given at least60 days’ written notice in advance of any change to theFund’s 80% investment policy set forth above.
Principal Risks of Investing in the Fund
There can be no assurance that the Fund’s investmentobjective will be met or that the net return on an investmentin the Fund will exceed what could have been obtainedthrough other investment or savings vehicles. Shares of theFund are not bank deposits and are not guaranteed orinsured by any bank, government entity or the FederalDeposit Insurance Corporation. As with any mutual fund,there is no guarantee that the Fund will be able to achieveits investment objective. If the value of the assets of theFund goes down, you could lose money.
The following is a summary of the principal risks of investingin the Fund.
Health Sector Risk: Since the Fund is concentrated in thehealth sciences industry, the Fund is less diversified thanfunds investing in a broader range of industries and couldexperience significant volatility. The Fund may invest aconsiderable portion of assets in companies in the samebusiness, such as pharmaceuticals, or in related businessessuch as hospital management and managed care.Developments that could adversely affect the Fund include:increased competition within the health care industry,changes in legislation or government regulations, reductionsin government funding or price controls imposed by agovernment, product liability or other litigation and theobsolescence of popular products. The implementation ofthe Affordable Care Act and other reforms could materiallyand adversely affect the manner in which health carecompanies conduct business and their results of operations,financial position and cash flows.
Management Risk: The investment style or strategy usedby the sub-adviser may fail to produce the intended result.The sub-adviser’s assessment of a particular security orcompany may prove incorrect, resulting in losses orunderperformance.
Currency Risk: Because the Fund’s foreign investmentsare generally held in foreign currencies, the Fund couldexperience gains or losses based solely on changes in theexchange rate between foreign currencies and the U.S.dollar. Such gains or losses may be substantial.
Equity Securities Risk: The Fund invests principally inequity securities and is therefore subject to the risk thatstock prices will fall and may underperform other assetclasses. Individual stock prices fluctuate from day-to-dayand may decline significantly. The prices of individual stocksmay be negatively affected by poor company results or
other factors affecting individual prices, as well as industryand/or economic trends and developments affectingindustries or the securities market as a whole.
Derivatives Risk: The prices of derivatives may move inunexpected ways due to the use of leverage and otherfactors and may result in increased volatility or losses. TheFund may not be able to terminate or sell derivativepositions, and a liquid secondary market may not alwaysexist for derivative positions. Writing options exposes theFund to the risk that the underlying security may not movein the direction anticipated by the portfolio manager,requiring the fund to buy or sell the security at a price that isdisadvantageous to the Fund.
Hedging Risk: A hedge is an investment made in order toreduce the risk of adverse price movements in a currency orother investment by taking an offsetting position (oftenthrough a derivative instrument, such as an option or forwardcontract). While hedging strategies can be very useful andinexpensive ways of reducing risk, they are sometimesineffective due to unexpected changes in the market.Hedging also involves the risk that changes in the value ofthe related security will not match those of the instrumentsbeing hedged as expected, in which case any losses on theinstruments being hedged may not be reduced.
Foreign Investment Risk: Investment in foreign securitiesinvolves risks due to several factors, such as illiquidity, thelack of public information, changes in the exchange ratesbetween foreign currencies and the U.S. dollar, unfavorablepolitical, social and legal developments, or economic andfinancial instability. Foreign companies are not subject tothe U.S. accounting and financial reporting standards andmay have riskier settlement procedures. U.S. investmentsthat are denominated in foreign currencies or that are tradedin foreign markets, or securities of U.S. companies thathave significant foreign operations may be subject to foreigninvestment risk.
Large- and Mid-Cap Company Risk: Investing primarily inlarge-cap and mid-cap companies carries the risk that dueto current market conditions these companies may be out offavor with investors. Large-cap companies may be unableto respond quickly to new competitive challenges or attainthe high growth rate of successful smaller companies.Stocks of mid-cap companies may be more volatile thanthose of larger companies due to, among other reasons,narrower product lines, more limited financial resources andfewer experienced managers.
Market Risk: The Fund’s share price can fall because ofweakness in the broad market, a particular industry, orspecific holdings or due to adverse political or economicdevelopments here or abroad, changes in investorpsychology, or heavy institutional selling. The price ofindividual securities may fluctuate, sometimes dramatically,from day-to-day. The prices of stocks and other equitysecurities tend to be more volatile than those of fixedincome securities.
- 53 -
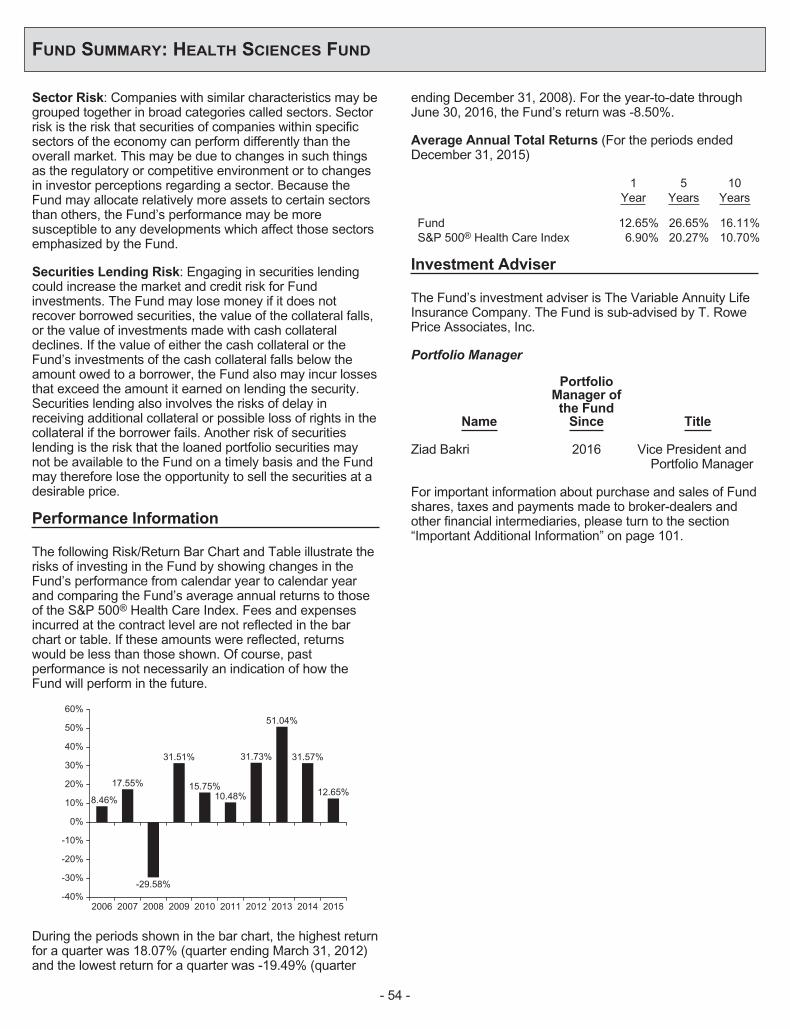
FUND SUMMARY: HEALTH SCIENCES FUND
Sector Risk: Companies with similar characteristics may begrouped together in broad categories called sectors. Sectorrisk is the risk that securities of companies within specificsectors of the economy can perform differently than theoverall market. This may be due to changes in such thingsas the regulatory or competitive environment or to changesin investor perceptions regarding a sector. Because theFund may allocate relatively more assets to certain sectorsthan others, the Fund’s performance may be moresusceptible to any developments which affect those sectorsemphasized by the Fund.
Securities Lending Risk: Engaging in securities lendingcould increase the market and credit risk for Fundinvestments. The Fund may lose money if it does notrecover borrowed securities, the value of the collateral falls,or the value of investments made with cash collateraldeclines. If the value of either the cash collateral or theFund’s investments of the cash collateral falls below theamount owed to a borrower, the Fund also may incur lossesthat exceed the amount it earned on lending the security.Securities lending also involves the risks of delay inreceiving additional collateral or possible loss of rights in thecollateral if the borrower fails. Another risk of securitieslending is the risk that the loaned portfolio securities maynot be available to the Fund on a timely basis and the Fundmay therefore lose the opportunity to sell the securities at adesirable price.
Performance Information
The following Risk/Return Bar Chart and Table illustrate therisks of investing in the Fund by showing changes in theFund’s performance from calendar year to calendar yearand comparing the Fund’s average annual returns to thoseof the S&P 500® Health Care Index. Fees and expensesincurred at the contract level are not reflected in the barchart or table. If these amounts were reflected, returnswould be less than those shown. Of course, pastperformance is not necessarily an indication of how theFund will perform in the future.
2006 2007 2008 2009 2010 2011 2012 2013 2014 2015-40%
60%
-30%
-20%
-10%
0%
10%
20%
30%
40%
50%
8.46%
17.55%
-29.58%
31.51%
15.75%10.48%
31.73%
51.04%
12.65%
31.57%
During the periods shown in the bar chart, the highest returnfor a quarter was 18.07% (quarter ending March 31, 2012)and the lowest return for a quarter was -19.49% (quarter
ending December 31, 2008). For the year-to-date throughJune 30, 2016, the Fund’s return was -8.50%.
Average Annual Total Returns (For the periods endedDecember 31, 2015)
1Year
5Years
10Years
Fund 12.65% 26.65% 16.11%S&P 500® Health Care Index 6.90% 20.27% 10.70%
Investment Adviser
The Fund’s investment adviser is The Variable Annuity LifeInsurance Company. The Fund is sub-advised by T. RowePrice Associates, Inc.
Portfolio Manager
Name
PortfolioManager ofthe Fund
Since Title
Ziad Bakri 2016 Vice President andPortfolio Manager
For important information about purchase and sales of Fundshares, taxes and payments made to broker-dealers andother financial intermediaries, please turn to the section“Important Additional Information” on page 101.
- 54 -
FUND SUMMARY: INFLATION PROTECTED FUND
Investment Objective
The Fund seeks maximum real return, consistent withappreciation of capital and prudent investmentmanagement.
Fees and Expenses of the Fund
This table describes the fees and expenses that you maypay if you buy and hold shares of the Fund. The Fund’sannual operating expenses do not reflect the separateaccount fees charged in the variable annuity or variable lifeinsurance policy (“Variable Contracts”) in which the Fund isoffered. If a separate account’s fees were shown, theFund’s annual operating expenses would be higher. Pleasesee your Variable Contract prospectus for more details onthe separate account fees.
Annual Fund Operating Expenses (expenses that youpay each year as a percentage of the value of yourinvestment)
Management Fees 0.48%Other Expenses 0.11%Total Annual Fund Operating Expenses 0.59%
Expense Example
This Example is intended to help you compare the cost ofinvesting in the Fund with the cost of investing in othermutual funds. The Example assumes that you invest$10,000 in the Fund for the time periods indicated and thenredeem all of your shares at the end of those periods. TheExample also assumes that your investment has a 5%return each year and that the Fund’s operating expensesremain the same. The Example does not reflect chargesimposed by the Variable Contract. If the Variable Contractfees were reflected then the expenses would be higher. Seethe Variable Contract prospectus for information on suchcharges. Although your actual costs may be higher or lower,based on these assumptions and the net expenses shownin the fee table, your costs would be:
1 Year 3 Years 5 Years 10 Years
$60 $189 $329 $738
Portfolio Turnover
The Fund pays transaction costs, such as commissions,when it buys and sells securities (or “turns over” itsportfolio). These costs, which are not reflected in annualfund operating expenses or in the example, affect theFund’s performance. During the most recent fiscal year, theFund’s portfolio turnover rate was 33% of the average valueof its portfolio.
Principal Investment Strategies of the Fund
The Fund seeks to achieve its investment objective byinvesting, under normal circumstances, at least 80% of itsnet assets in inflation-indexed fixed income securities
issued by domestic and foreign governments (includingthose in emerging market countries), their agencies orinstrumentalities, and corporations.
Inflation-indexed fixed income securities are structured toprovide protection against the negative effects of inflation.The value of a fixed income security’s principal or theinterest income paid on the fixed income security is adjustedto track changes in an official inflation measure, usually theConsumer Price Index for Urban Consumers (“CPI-U”) withrespect to domestic issuers.
The Fund invests primarily in investment grade securitiesrated Baa3 or higher by Moody’s Investors Service, Inc. orBBB– or higher by Standard & Poor’s Ratings Services. TheFund also may invest up to 30% of its total assets insecurities denominated in foreign currencies, and mayinvest beyond this limit in U.S. dollar denominated securitiesof foreign and emerging market issuers.
In order to generate additional income, the Fund may lendportfolio securities to broker-dealers and other financialinstitutions provided that the value of the loaned securitiesdoes not exceed 30% of the Fund’s total assets. Theseloans earn income for the Fund and are collateralized bycash, securities issued or guaranteed by the U.S.Government or its agencies or instrumentalities, and suchother securities as the Fund and the securities lendingagent may agree upon. Investors will be given at least60 days’ written notice in advance of any change to theFund’s 80% investment policy set forth above.
Principal Risks of Investing in the Fund
There can be no assurance that the Fund’s investmentobjective will be met or that the net return on an investmentin the Fund will exceed what could have been obtainedthrough other investment or savings vehicles. Shares of theFund are not bank deposits and are not guaranteed orinsured by any bank, government entity or the FederalDeposit Insurance Corporation. As with any mutual fund,there is no guarantee that the Fund will be able to achieveits investment objective. If the value of the assets of theFund goes down, you could lose money.
The following is a summary of the principal risks of investingin the Fund.
Risks of Investing in Inflation-Indexed Securities: If theinterest rate rises for reasons other than inflation, the valueof inflation-indexed securities can be negatively impacted. Incertain interest rate environments, such instruments mayexperience greater losses than other fixed income securitieswith similar durations.
Risks of Inflation Indexing Methodology: An inflationindex may not accurately measure the real rate of inflationin the prices of goods and services, whether for the U.S. ora foreign country. Market perceptions of adjustment times ora lag between the time a security is adjusted for inflationand the time interest is paid can each adversely affect an
- 55 -

FUND SUMMARY: INFLATION PROTECTED FUND
inflation-indexed security, particularly during periods ofsignificant, rapid changes in inflation.
Interest Rate Risk: The value of fixed income securitiesmay decline when interest rates go up or increase wheninterest rates go down. The interest earned on fixed incomesecurities may decline when interest rates go down orincrease when interest rates go up. Longer-term and lowercoupon bonds tend to be more sensitive to changes ininterest rates. The Fund may be subject to a greater risk ofrising interest rates due to the current period of historicallylow rates and the effect of potential government fiscal policyinitiatives and resulting market reaction to these initiatives.
Call or Prepayment Risk: During periods of falling interestrates, a bond issuer may “call” a bond to repay it before itsmaturity date. The Fund may only be able to invest thebond’s proceeds at lower interest rates, resulting in adecline in the Fund’s income.
Credit Risk: The Fund may suffer losses if the issuer of afixed income security owned by the Fund is unable to makeinterest or principal payments.
Foreign Investment Risk: Investment in foreign securitiesinvolves risks due to several factors, such as illiquidity, thelack of public information, changes in the exchange ratesbetween foreign currencies and the U.S. dollar, unfavorablepolitical, social and legal developments, or economic andfinancial instability. Foreign companies are not subject tothe U.S. accounting and financial reporting standards andmay have riskier settlement procedures. U.S. investmentsthat are denominated in foreign currencies or that are tradedin foreign markets, or securities of U.S. companies thathave significant foreign operations may be subject to foreigninvestment risk.
Emerging Markets Risk: Investments in emerging marketsare subject to all of the risks of investments in foreignsecurities, generally to a greater extent than in developedmarkets, and additional risks as well. Generally, theeconomic, social, legal, and political structures in emergingmarket countries are less diverse, mature and stable thanthose in developed countries. As a result, investments inemerging market securities tend to be more volatile thaninvestments in developed countries. Unlike most developedcountries, emerging market countries may imposerestrictions on foreign investment. These countries may alsoimpose confiscatory taxes on investment proceeds orotherwise restrict the ability of foreign investors to withdrawtheir money at will.
Currency Risk: Because the Fund’s foreign investmentsmay be denominated in foreign currencies, the Fund couldexperience gains or losses based solely on changes in theexchange rate between foreign currencies and the U.S.dollar. Such gains or losses may be substantial.
Market Risk: The Fund’s share price can fall because ofweakness in the broad market, a particular industry, orspecific holdings or due to adverse political or economic
developments here or abroad, changes in investorpsychology, or heavy institutional selling. The price ofindividual securities may fluctuate, sometimes dramatically,from day-to-day. The prices of stocks and other equitysecurities tend to be more volatile than those of fixedincome securities.
U.S. Government Obligations Risk: U.S. Treasuryobligations are backed by the “full faith and credit” of theU.S. Government and are generally considered to have lowcredit risk. Unlike U.S. Treasury obligations, securitiesissued or guaranteed by federal agencies or authorities andU.S. Government-sponsored instrumentalities or enterprisesmay or may not be backed by the full faith and credit of theU.S. Government and are therefore subject to greater creditrisk than securities issued or guaranteed by the U.S.Treasury.
Foreign Sovereign Debt Risk: Foreign sovereign debtsecurities are subject to the risk that a governmental entitymay delay or refuse to pay interest or repay principal on itssovereign debt, due, for example, to cash flow problems,insufficient foreign currency reserves, political, social andeconomic considerations, the relative size of thegovernmental entity’s debt position in relation to theeconomy or the failure to put in place economic reformsrequired by the International Monetary Fund or othermultilateral agencies. If a governmental entity defaults, itmay ask for more time in which to pay or for further loans.
Securities Lending Risk: Engaging in securities lendingcould increase the market and credit risk for Fundinvestments. The Fund may lose money if it does notrecover borrowed securities, the value of the collateral falls,or the value of investments made with cash collateraldeclines. If the value of either the cash collateral or theFund’s investments of the cash collateral falls below theamount owed to a borrower, the Fund also may incur lossesthat exceed the amount it earned on lending the security.Securities lending also involves the risks of delay inreceiving additional collateral or possible loss of rights in thecollateral if the borrower fails. Another risk of securitieslending is the risk that the loaned portfolio securities maynot be available to the Fund on a timely basis and the Fundmay therefore lose the opportunity to sell the securities at adesirable price.
Performance Information
The following Risk/Return Bar Chart and Table illustrate therisks of investing in the Fund by showing changes in theFund’s performance from calendar year to calendar yearand comparing the Fund’s average annual returns to thoseof the Barclays U.S. Treasury Inflation-Protected Securities(“TIPS”) Index. Fees and expenses incurred at the contractlevel are not reflected in the bar chart or table. If theseamounts were reflected, returns would be less than thoseshown. Of course, past performance is not necessarily anindication of how the Fund will perform in the future.
- 56 -

FUND SUMMARY: INFLATION PROTECTED FUND
2006 2007 2008 2009 2010 2011 2012 2013 20152014-8%
-6%
-4%
-2%
0%
2%
4%
6%
8%
10%
12%
0.41%
7.82%
-5.32%
9.58%9.13%
-6.97%
10.11%
8.03%
2.97%
-3.01%
During the periods shown in the bar chart, the highest returnfor a quarter was 4.00% (quarter ending December 31,2007) and the lowest return for a quarter was -5.98%(quarter ending June 30, 2013). For the year-to-datethrough June 30, 2016, the Fund’s return was 4.95%.
Average Annual Total Returns (For the periods endedDecember 31, 2015)
1Year
5Years
10Years
Fund -3.01% 2.02% 3.08%Barclays U.S. TIPS Index -1.44% 2.55% 3.93%
Investment Adviser
The Fund’s investment adviser is The Variable Annuity LifeInsurance Company. The Fund is sub-advised byPineBridge Investments LLC.
Portfolio Managers
Name
PortfolioManager ofthe Fund
Since Title
Robert VandenAssem, CFA
2004 Managing Director and Headof Investment Grade FixedIncome
Amit Agrawal 2010 Managing Director andSenior Portfolio Manager,Investment Grade FixedIncome
For important information about purchase and sales of Fundshares, taxes and payments made to broker-dealers andother financial intermediaries, please turn to the section“Important Additional Information” on page 101.
- 57 -
FUND SUMMARY: INTERNATIONAL EQUITIES INDEX FUND
Investment Objective
The Fund seeks long-term capital growth through investmentsin equity securities that, as a group, are expected to provideinvestment results closely corresponding to the performanceof the MSCI EAFE Index (the “Index”).
Fees and Expenses of the Fund
This table describes the fees and expenses that you maypay if you buy and hold shares of the Fund. The Fund’sannual operating expenses do not reflect the separateaccount fees charged in the variable annuity or variable lifeinsurance policy (“Variable Contracts”) in which the Fund isoffered. If a separate account’s fees were shown, theFund’s annual operating expenses would be higher. Pleasesee your Variable Contract prospectus for more details onthe separate account fees.
Annual Fund Operating Expenses (expenses that youpay each year as a percentage of the value of yourinvestment)
Management Fees 0.30%Other Expenses 0.14%Total Annual Fund Operating Expenses(1) 0.44%
(1) The Total Annual Fund Operating Expenses for the Fund do notcorrelate to the ratio of net expenses to average net assetsprovided in the Financial Highlights table of the Fund’s annualreport, which reflects the net operating expenses of the Fund(0.43%) and does not include Acquired Fund Fees andExpenses. “Acquired Fund Fees and Expenses” include fees andexpenses incurred indirectly by the Fund as a result ofinvestments in shares of one or more mutual funds, hedge funds,private equity funds or other pooled investment vehicles.
Expense Example
This Example is intended to help you compare the cost ofinvesting in the Fund with the cost of investing in othermutual funds. The Example assumes that you invest$10,000 in the Fund for the time periods indicated and thenredeem all of your shares at the end of those periods. TheExample also assumes that your investment has a 5%return each year and that the Fund’s operating expensesremain the same. The Example does not reflect chargesimposed by the Variable Contract. If the Variable Contractfees were reflected then the expenses would be higher. Seethe Variable Contract prospectus for information on suchcharges. Although your actual costs may be higher or lower,based on these assumptions and the net expenses shownin the fee table, your costs would be:
1 Year 3 Years 5 Years 10 Years
$45 $141 $246 $555
Portfolio Turnover
The Fund pays transaction costs, such as commissions,when it buys and sells securities (or “turns over” itsportfolio). These costs, which are not reflected in annual
fund operating expenses or in the example, affect theFund’s performance. During the most recent fiscal year, theFund’s portfolio turnover rate was 4% of the average valueof its portfolio.
Principal Investment Strategies of the Fund
The Fund is managed to seek to track the performance ofthe Index, which measures the stock performance of large-and mid-cap companies in developed countries outside theU.S. The sub-adviser may endeavor to track the Index bypurchasing every stock included in the Index, in the sameproportions; or, in the alternative, the sub-adviser mayinvest in a sampling of Index stocks by utilizing a statisticaltechnique known as “optimization.” The goal of optimizationis to select stocks which ensure that various industryweightings, market capitalizations, and fundamentalcharacteristics, (e.g., price-to-book, price-to-earnings, debt-to-asset ratios and dividend yields) closely approximatethose of the Index.
The Fund invests, under normal circumstances, at least80% of net assets in stocks that are in the Index. Althoughthe Fund seeks to track the performance of the Index, theperformance of the Fund will not match that of the Indexexactly because, among other reasons, the Fund incursoperating expenses and other investment overhead as partof its normal operations.
In order to generate additional income, the Fund may lendportfolio securities to broker-dealers and other financialinstitutions provided that the value of the loaned securitiesdoes not exceed 30% of the Fund’s total assets. Theseloans earn income for the Fund and are collateralized bycash, securities issued or guaranteed by the U.S.Government or its agencies or instrumentalities, and suchother securities as the Fund and the securities lending agentmay agree upon. Investors will be given at least 60 days’written notice in advance of any change to the Fund’s 80%investment policy set forth above.
Principal Risks of Investing in the Fund
There can be no assurance that the Fund’s investmentobjective will be met or that the net return on an investmentin the Fund will exceed what could have been obtainedthrough other investment or savings vehicles. Shares of theFund are not bank deposits and are not guaranteed orinsured by any bank, government entity or the FederalDeposit Insurance Corporation. As with any mutual fund,there is no guarantee that the Fund will be able to achieveits investment objective. If the value of the assets of theFund goes down, you could lose money.
The following is a summary of the principal risks of investingin the Fund.
Equity Securities Risk: The Fund invests principally inequity securities and is therefore subject to the risk thatstock prices will fall and may underperform other asset
- 58 -

FUND SUMMARY: INTERNATIONAL EQUITIES INDEX FUND
classes. Individual stock prices fluctuate from day-to-dayand may decline significantly. The prices of individual stocksmay be negatively affected by poor company results orother factors affecting individual prices, as well as industryand/or economic trends and developments affectingindustries or the securities market as a whole.
Index Risk: In attempting to track the performance of theIndex, the Fund may be more susceptible to adversedevelopments concerning a particular security, company orindustry because the Fund generally will not use anydefensive strategies to mitigate its risk exposure.
Foreign Investment Risk: Investment in foreign securitiesinvolves risks due to several factors, such as illiquidity, thelack of public information, changes in the exchange ratesbetween foreign currencies and the U.S. dollar, unfavorablepolitical, social and legal developments, or economic andfinancial instability. Foreign companies are not subject tothe U.S. accounting and financial reporting standards andmay have riskier settlement procedures. U.S. investmentsthat are denominated in foreign currencies or that are tradedin foreign markets, or securities of U.S. companies thathave significant foreign operations may be subject to foreigninvestment risk.
Currency Risk: Because the Fund’s foreign investmentsare generally held in foreign currencies, the Fund couldexperience gains or losses based solely on changes in theexchange rate between foreign currencies and the U.S.dollar. Such gains or losses may be substantial.
Geographic Risk: If the Fund invests a significant portion ofits assets in issuers located in a single country, a limitednumber of countries, or a particular geographic region, itassumes the risk that economic, political and socialconditions in those countries or that region may have asignificant impact on its investment performance.
Large- and Mid-Cap Company Risk: Investing primarily inlarge-cap and mid-cap companies carries the risk that dueto current market conditions these companies may be out offavor with investors. Large-cap companies may be unableto respond quickly to new competitive challenges or attainthe high growth rate of successful smaller companies.Stocks of mid-cap companies may be more volatile thanthose of larger companies due to, among other reasons,narrower product lines, more limited financial resources andfewer experienced managers.
Market Risk: The Fund’s share price can fall because ofweakness in the broad market, a particular industry, orspecific holdings or due to adverse political or economicdevelopments here or abroad, changes in investorpsychology, or heavy institutional selling. The price ofindividual securities may fluctuate, sometimes dramatically,from day-to-day. The prices of stocks and other equitysecurities tend to be more volatile than those of fixedincome securities.
Securities Lending Risk: Engaging in securities lendingcould increase the market and credit risk for Fund
investments. The Fund may lose money if it does notrecover borrowed securities, the value of the collateral falls,or the value of investments made with cash collateraldeclines. If the value of either the cash collateral or theFund’s investments of the cash collateral falls below theamount owed to a borrower, the Fund also may incur lossesthat exceed the amount it earned on lending the security.Securities lending also involves the risks of delay inreceiving additional collateral or possible loss of rights in thecollateral if the borrower fails. Another risk of securitieslending is the risk that the loaned portfolio securities maynot be available to the Fund on a timely basis and the Fundmay therefore lose the opportunity to sell the securities at adesirable price.
Performance Information
The following Risk/Return Bar Chart and Table illustrate therisks of investing in the Fund by showing changes in theFund’s performance from calendar year to calendar yearand comparing the Fund’s average annual returns to thoseof the MSCI EAFE Index (net). Fees and expenses incurredat the contract level are not reflected in the bar chart ortable. If these amounts were reflected, returns would be lessthan those shown. Of course, past performance is notnecessarily an indication of how the Fund will perform in thefuture.
SunAmerica Asset Management, LLC (“SAAMCo”)assumed sub-advisory responsibilities on June 16, 2014.Prior to this time, the Fund was sub-advised by PineBridgeInvestments LLC.
2006 2007 2008 2009 2010 2011 2012 2013 20152014
23.06%
8.77%
-43.40%
29.60%
8.46%
-13.10%
-5.45%
17.03%18.99%
-1.00%
-50%
-40%
-30%
-20%
-10%
0%
10%
20%
30%
40%
During the periods shown in the bar chart, the highest returnfor a quarter was 25.37% (quarter ending June 30, 2009)and the lowest return for a quarter was -20.95% (quarterending December 31, 2008). For the year-to-date throughJune 30, 2016, the Fund’s return -3.22%.
Average Annual Total Returns (For the periods endedDecember 31, 2015)
1Year
5Years
10Years
Fund -1.00% 2.52% 1.89%MSCI EAFE Index (net) -0.81% 3.60% 3.03%
- 59 -
FUND SUMMARY: INTERNATIONAL EQUITIES INDEX FUND
Investment Adviser
The Fund’s investment adviser is The Variable Annuity LifeInsurance Company. The Fund is sub-advised by SAAMCo.
Portfolio Managers
Name
PortfolioManager ofthe Fund
Since Title
TimothyCampion
2014 Senior Vice President andLead Portfolio Manager
AndrewSheridan
2014 Senior Vice President and Co-Portfolio Manager
Jane Bayar 2015 Co-Portfolio Manager
For important information about purchase and sales of Fundshares, taxes and payments made to broker-dealers andother financial intermediaries, please turn to the section“Important Additional Information” on page 101.
- 60 -
FUND SUMMARY: INTERNATIONAL GOVERNMENT BOND FUND
Investment Objective
The Fund seeks high current income through investmentsprimarily in investment grade debt securities issued orguaranteed by foreign governments.
Fees and Expenses of the Fund
This table describes the fees and expenses that you maypay if you buy and hold shares of the Fund. The Fund’sannual operating expenses do not reflect the separateaccount fees charged in the variable annuity or variable lifeinsurance policy (“Variable Contracts”) in which the Fund isoffered. If a separate account’s fees were shown, theFund’s annual operating expenses would be higher. Pleasesee your Variable Contract prospectus for more details onthe separate account fees.
Annual Fund Operating Expenses (expenses that youpay each year as a percentage of the value of yourinvestment)
Management Fees 0.50%Other Expenses 0.14%Total Annual Fund Operating Expenses 0.64%
Expense Example
This Example is intended to help you compare the cost ofinvesting in the Fund with the cost of investing in othermutual funds. The Example assumes that you invest$10,000 in the Fund for the time periods indicated and thenredeem all of your shares at the end of those periods. TheExample also assumes that your investment has a 5%return each year and that the Fund’s operating expensesremain the same. The Example does not reflect chargesimposed by the Variable Contract. If the Variable Contractfees were reflected then the expenses would be higher. Seethe Variable Contract prospectus for information on suchcharges. Although your actual costs may be higher or lower,based on these assumptions and the net expenses shownin the fee table, your costs would be:
1 Year 3 Years 5 Years 10 Years
$65 $205 $357 $798
Portfolio Turnover
The Fund pays transaction costs, such as commissions,when it buys and sells securities (or “turns over” itsportfolio). These costs, which are not reflected in annualfund operating expenses or in the example, affect theFund’s performance. During the most recent fiscal year, theFund’s portfolio turnover rate was 95% of the average valueof its portfolio.
Principal Investment Strategies of the Fund
The Fund aims to give you foreign investment opportunitiesprimarily in investment grade government and government
sponsored debt securities. Also, the Fund attempts to haveall of its investments payable in foreign currencies. TheFund may also convert its cash to foreign currency.
Under normal circumstances, at least 80% of net assets ofthe Fund must be government issued, sponsored, orguaranteed. The Fund invests at least 65% of total assets ininvestment grade debt securities. The Fund may invest upto 35% of total assets in below investment grade securities(“junk bonds”). Examples of Fund investments includeforeign debt and foreign money market securities, highquality domestic money market securities and debtobligations issued or guaranteed by the U.S. Government,and foreign currency exchange transactions.
Additionally, the sub-adviser may attempt to hedge currencyexposure, and may invest up to 50% of total assets infutures and options (derivatives), for currency hedgingpurposes. The Fund may invest significantly in governmentsecurities of emerging market countries.
The Fund is a non-diversified fund, which means that it mayinvest in a smaller number of issuers than a diversified fund.
In order to generate additional income, the Fund may lendportfolio securities to broker-dealers and other financialinstitutions provided that the value of the loaned securitiesdoes not exceed 30% of the Fund’s total assets. Theseloans earn income for the Fund and are collateralized bycash, securities issued or guaranteed by the U.S.Government or its agencies or instrumentalities, and suchother securities as the Fund and the securities lending agentmay agree upon. Investors will be given at least 60 days’written notice in advance of any change to the Fund’s 80%investment policy set forth above.
Principal Risks of Investing in the Fund
There can be no assurance that the Fund’s investmentobjective will be met or that the net return on an investmentin the Fund will exceed what could have been obtainedthrough other investment or savings vehicles. Shares of theFund are not bank deposits and are not guaranteed orinsured by any bank, government entity or the FederalDeposit Insurance Corporation. As with any mutual fund,there is no guarantee that the Fund will be able to achieveits investment objective. If the value of the assets of theFund goes down, you could lose money.
The following is a summary of the principal risks of investingin the Fund.
Call or Prepayment Risk: During periods of falling interestrates, a bond issuer may “call” a bond to repay it before itsmaturity date. The Fund may only be able to invest thebond’s proceeds at lower interest rates, resulting in adecline in the Fund’s income.
Credit Risk: The Fund may suffer losses if the issuer of afixed income security owned by the Fund is unable to makeinterest or principal payments.
- 61 -
FUND SUMMARY: INTERNATIONAL GOVERNMENT BOND FUND
Currency Risk: Because the Fund’s foreign investmentsare generally held in foreign currencies, the Fund couldexperience gains or losses based solely on changes in theexchange rate between foreign currencies and the U.S.dollar. Such gains or losses may be substantial.
Derivatives Risk: The prices of derivatives may move inunexpected ways due to the use of leverage and otherfactors and may result in increased volatility or losses. TheFund may not be able to terminate or sell derivativepositions, and a liquid secondary market may not alwaysexist for derivative positions.
Hedging Risk: A hedge is an investment made in order toreduce the risk of adverse price movements in a security, bytaking an offsetting position (often through a derivativeinstrument, such as an option or a short sale). Whilehedging strategies can be very useful and inexpensive waysof reducing risk, they are sometimes ineffective due tounexpected changes in the market. Hedging also involvesthe risk that changes in the value of the related security willnot match those of the instruments being hedged asexpected, in which case any losses on the instrumentsbeing hedged may not be reduced.
Foreign Investment Risk: Investment in foreign securitiesinvolves risks due to several factors, such as illiquidity, thelack of public information, changes in the exchange ratesbetween foreign currencies and the U.S. dollar, unfavorablepolitical, social and legal developments, or economic andfinancial instability. Foreign companies are not subject tothe U.S. accounting and financial reporting standards andmay have riskier settlement procedures. U.S. investmentsthat are denominated in foreign currencies or that are tradedin foreign markets, or securities of U.S. companies thathave significant foreign operations may be subject to foreigninvestment risk. Economies and financial markets arebecoming more connected, which increases the likelihoodthat conditions in one country or region can adverselyimpact issuers in different countries and regions.
Emerging Markets Risk: In addition to the risks associatedwith investments in foreign securities, emerging marketsecurities are subject to additional risks, which cause thesesecurities generally to be more volatile than securities ofissuers located in developed countries.
Foreign Sovereign Debt Risk: Foreign sovereign debtsecurities are subject to the risk that a governmental entitymay delay or refuse to pay interest or repay principal on itssovereign debt, due, for example, to cash flow problems,insufficient foreign currency reserves, political, social andeconomic considerations, the relative size of thegovernmental entity’s debt position in relation to theeconomy or the failure to put in place economic reformsrequired by the International Monetary Fund or othermultilateral agencies. If a governmental entity defaults, itmay ask for more time in which to pay or for further loans.
Interest Rate Risk: The value of fixed income securitiesmay decline when interest rates go up or increase when
interest rates go down. The interest earned on fixed incomesecurities may decline when interest rates go down orincrease when interest rates go up. Longer-term and lowercoupon bonds tend to be more sensitive to changes ininterest rates. The Fund may be subject to a greater risk ofrising interest rates due to the current period of historicallylow rates and the effect of potential government fiscal policyinitiatives and resulting market reaction to these initiatives.
Junk Bond Risk: High yielding, high risk fixed incomesecurities (“junk bonds”), may involve significantly greatercredit risk, market risk and interest rate risk compared tohigher rated fixed income securities. Issuers of junk bondsare less secure financially and their securities are moresensitive to downturns in the economy. The market for junkbonds may not be as liquid as that for more highly ratedsecurities.
Market Risk: The Fund’s share price can fall because ofweakness in the broad market, a particular industry, orspecific holdings or due to adverse political or economicdevelopments here or abroad, changes in investorpsychology, or heavy institutional selling. The price ofindividual securities may fluctuate, sometimes dramatically,from day-to-day. The prices of stocks and other equitysecurities tend to be more volatile than those of fixedincome securities.
Non-Diversification Risk: Because the Fund may invest ina smaller number of issuers, its value may be affected to agreater extent by the performance of any one of thoseissuers or by any single economic, political, market orregulatory event affecting any one of those issues than afund that invests in a larger number of issuers.
Risks of Investing in Money Market Securities: Aninvestment in the Fund is subject to the risk that the value ofits investments in high-quality short-term obligations(“money market securities”) may be subject to changes ininterest rates, changes in the rating of any money marketsecurity and in the ability of an issuer to make payments ofinterest and principal.
U.S. Government Obligations Risk: U.S. Treasuryobligations are backed by the “full faith and credit” of theU.S. Government and are generally considered to have lowcredit risk. Unlike U.S. Treasury obligations, securitiesissued or guaranteed by federal agencies or authorities andU.S. Government-sponsored instrumentalities or enterprisesmay or may not be backed by the full faith and credit of theU.S. Government and are therefore subject to greater creditrisk than securities issued or guaranteed by the U.S.Treasury.
Securities Lending Risk: Engaging in securities lendingcould increase the market and credit risk for Fundinvestments. The Fund may lose money if it does notrecover borrowed securities, the value of the collateral falls,or the value of investments made with cash collateraldeclines. If the value of either the cash collateral or theFund’s investments of the cash collateral falls below the
- 62 -
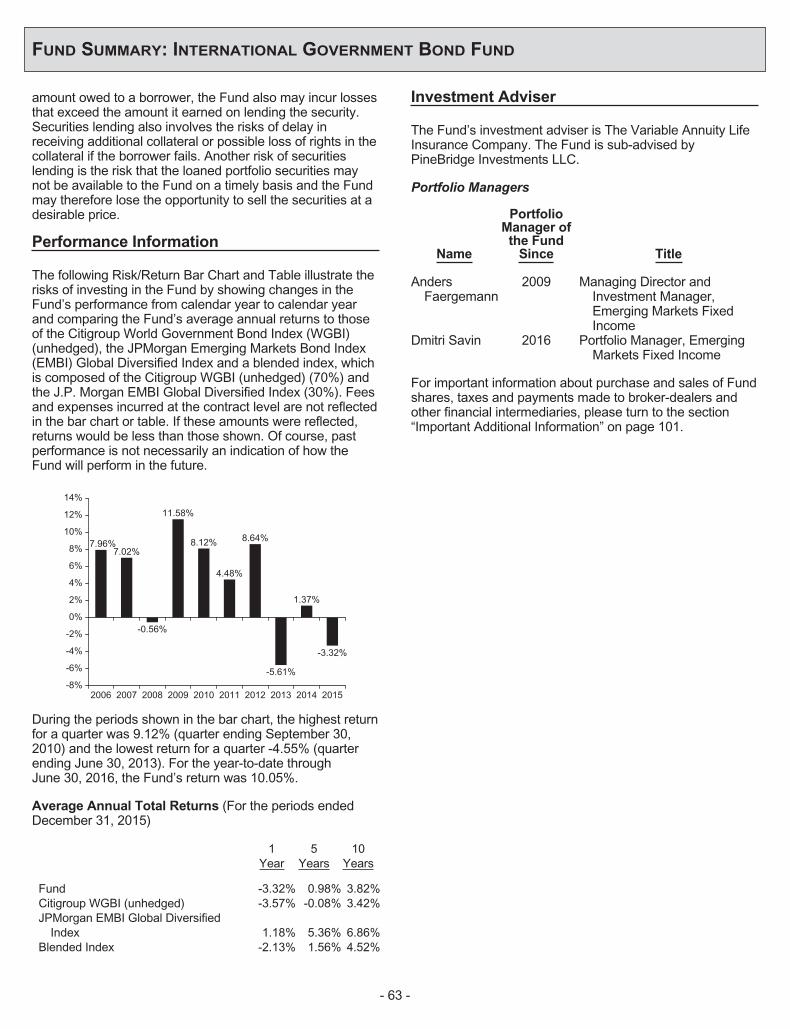
FUND SUMMARY: INTERNATIONAL GOVERNMENT BOND FUND
amount owed to a borrower, the Fund also may incur lossesthat exceed the amount it earned on lending the security.Securities lending also involves the risks of delay inreceiving additional collateral or possible loss of rights in thecollateral if the borrower fails. Another risk of securitieslending is the risk that the loaned portfolio securities maynot be available to the Fund on a timely basis and the Fundmay therefore lose the opportunity to sell the securities at adesirable price.
Performance Information
The following Risk/Return Bar Chart and Table illustrate therisks of investing in the Fund by showing changes in theFund’s performance from calendar year to calendar yearand comparing the Fund’s average annual returns to thoseof the Citigroup World Government Bond Index (WGBI)(unhedged), the JPMorgan Emerging Markets Bond Index(EMBI) Global Diversified Index and a blended index, whichis composed of the Citigroup WGBI (unhedged) (70%) andthe J.P. Morgan EMBI Global Diversified Index (30%). Feesand expenses incurred at the contract level are not reflectedin the bar chart or table. If these amounts were reflected,returns would be less than those shown. Of course, pastperformance is not necessarily an indication of how theFund will perform in the future.
2006 2007 2008 2009 2010 2011 2012 2013 20152014-8%
-6%
-4%
-2%
0%
2%
4%
6%
8%
10%
14%
12%
7.96%7.02%
-0.56%
11.58%
8.12%
-5.61%
4.48%
8.64%
1.37%
-3.32%
During the periods shown in the bar chart, the highest returnfor a quarter was 9.12% (quarter ending September 30,2010) and the lowest return for a quarter -4.55% (quarterending June 30, 2013). For the year-to-date throughJune 30, 2016, the Fund’s return was 10.05%.
Average Annual Total Returns (For the periods endedDecember 31, 2015)
1Year
5Years
10Years
Fund -3.32% 0.98% 3.82%Citigroup WGBI (unhedged) -3.57% -0.08% 3.42%JPMorgan EMBI Global Diversified
Index 1.18% 5.36% 6.86%Blended Index -2.13% 1.56% 4.52%
Investment Adviser
The Fund’s investment adviser is The Variable Annuity LifeInsurance Company. The Fund is sub-advised byPineBridge Investments LLC.
Portfolio Managers
Name
PortfolioManager ofthe Fund
Since Title
AndersFaergemann
2009 Managing Director andInvestment Manager,Emerging Markets FixedIncome
Dmitri Savin 2016 Portfolio Manager, EmergingMarkets Fixed Income
For important information about purchase and sales of Fundshares, taxes and payments made to broker-dealers andother financial intermediaries, please turn to the section“Important Additional Information” on page 101.
- 63 -

FUND SUMMARY: INTERNATIONAL GROWTH FUND
Investment Objective
The Fund seeks capital growth through investmentsprimarily in equity securities of issuers in developed foreigncountries.
Fees and Expenses of the Fund
This table describes the fees and expenses that you maypay if you buy and hold shares of the Fund. The Fund’sannual operating expenses do not reflect the separateaccount fees charged in the variable annuity or variable lifeinsurance policy (“Variable Contracts”) in which the Fund isoffered. If a separate account’s fees were shown, theFund’s annual operating expenses would be higher. Pleasesee your Variable Contract prospectus for more details onthe separate account fees.
Annual Fund Operating Expenses (expenses that youpay each year as a percentage of the value of yourinvestment)
Management Fees 0.92%Other Expenses 0.14%Total Annual Fund Operating Expenses 1.06%Fee Waiver and/or Expense
Reimbursement(1)(2) 0.06%Total Annual Fund Operating Expenses After
Fee Waiver and/or ExpenseReimbursement(1)(2)
1.00%
(1) Pursuant to an Amended and Restated Advisory Fee WaiverAgreement effective September 1, 2016, through September 30,2017, the investment adviser, The Variable Annuity LifeInsurance Company (“VALIC”), is contractually obligated to waiveits advisory fee so that the advisory fee payable by the Fund toVALIC equals 0.89% of average monthly assets on the first$250 million, 0.84% on the next $250 million, 0.79% on the next$500 million and 0.74% thereafter. This agreement may bemodified or discontinued prior to such time only with the approvalof the Board of Directors of the Fund, including a majority of thedirectors who are not “interested persons” of the Fund as definedin the Investment Company Act of 1940, as amended.
(2) The expense table above has been restated to reflect a completefiscal year of the fee waiver agreement that was instituted onSeptember 1, 2016.
Expense Example
This Example is intended to help you compare the cost ofinvesting in the Fund with the cost of investing in othermutual funds. The Example assumes that you invest$10,000 in the Fund for the time periods indicated and thenredeem all of your shares at the end of those periods. TheExample also assumes that your investment has a 5%return each year and that the Fund’s operating expensesinclude fee waivers for year one. The Example does notreflect charges imposed by the Variable Contract. If theVariable Contract fees were reflected then the expenseswould be higher. See the Variable Contract prospectus forinformation on such charges. Although your actual costs
may be higher or lower, based on these assumptionsand the net expenses shown in the fee table, your costswould be:
1 Year 3 Years 5 Years 10 Years
$102 $331 $579 $1,289
Portfolio Turnover
The Fund pays transaction costs, such as commissions,when it buys and sells securities (or “turns over” itsportfolio). These costs, which are not reflected in annualfund operating expenses or in the example, affect theFund’s performance. During the most recent fiscal year, theFund’s portfolio turnover rate was 36% of the average valueof its portfolio.
Principal Investment Strategies of the Fund
Each of the Fund’s sub-advisers uses a proprietaryinvestment strategy to invest in stocks of companies thatthey believe will increase in value over time. Each sub-adviser’s investment strategy uses a bottom-up approach tostock selection. This means that the sub-advisers maketheir investment decisions based primarily on their analysisof individual companies, rather than on broad economicforecasts. The Fund will usually purchase equity securitiesof foreign companies. The Fund’s equity securities willgenerally consist of common stock, depositary receipts andpreferred stock.
The Fund may also invest a portion of its assets in forwardcurrency exchange contracts, non-leveraged futures andoption contracts, notes, bonds and other debt securities ofcompanies, and obligations of foreign governments andtheir agencies, or other similar securities.
The Fund invests primarily in securities of large-cap issuers;however, the Fund may invest a significant amount of its netassets in the securities of mid-cap issuers.
The Fund may invest a relatively large percentage of itsassets in securities of issuers in a single country, a smallnumber of countries, or a particular geographic region. Inaddition, the Fund may invest up to 20% of its net assets inthe securities of emerging market (non-developed)countries.
In order to generate additional income, the Fund may lendportfolio securities to broker-dealers and other financialinstitutions provided that the value of the loaned securitiesdoes not exceed 30% of the Fund’s total assets. Theseloans earn income for the Fund and are collateralized bycash, securities issued or guaranteed by the U.S.Government or its agencies or instrumentalities, and suchother securities as the Fund and the securities lendingagent may agree upon.
- 64 -

FUND SUMMARY: INTERNATIONAL GROWTH FUND
Principal Risks of Investing in the Fund
There can be no assurance that the Fund’s investmentobjective will be met or that the net return on an investmentin the Fund will exceed what could have been obtainedthrough other investment or savings vehicles. Shares of theFund are not bank deposits and are not guaranteed orinsured by any bank, government entity or the FederalDeposit Insurance Corporation. As with any mutual fund,there is no guarantee that the Fund will be able to achieveits investment objective. If the value of the assets of theFund goes down, you could lose money.
The following is a summary of the principal risks of investingin the Fund.
Management Risk: The investment style or strategy usedby the sub-adviser may fail to produce the intended result.The sub-adviser’s assessment of a particular security orcompany may prove incorrect, resulting in losses orunderperformance.
Foreign Investment Risk: Investment in foreign securitiesinvolves risks due to several factors, such as illiquidity, thelack of public information, changes in the exchange ratesbetween foreign currencies and the U.S. dollar, unfavorablepolitical, social and legal developments, or economic andfinancial instability. Foreign companies are not subject tothe U.S. accounting and financial reporting standards andmay have riskier settlement procedures. U.S. investmentsthat are denominated in foreign currencies or that are tradedin foreign markets, or securities of U.S. companies thathave significant foreign operations may be subject to foreigninvestment risk. Economies and financial markets arebecoming more connected, which increases the likelihoodthat conditions in one country or region can adverselyimpact issuers in different countries and regions.
Foreign Sovereign Debt Risk: Foreign sovereign debtsecurities are subject to the risk that a governmental entitymay delay or refuse to pay interest or repay principal on itssovereign debt, due, for example, to cash flow problems,insufficient foreign currency reserves, political, social andeconomic considerations, the relative size of thegovernmental entity’s debt position in relation to theeconomy or the failure to put in place economic reformsrequired by the International Monetary Fund or othermultilateral agencies. If a governmental entity defaults, itmay ask for more time in which to pay or for further loans.
Credit Risk: The Fund may suffer losses if the issuer of afixed income security owned by the Fund is unable to makeinterest or principal payments.
Currency Risk: Because the Fund’s foreign investmentsare generally held in foreign currencies, the Fund couldexperience gains or losses based solely on changes in theexchange rate between foreign currencies and the U.S.dollar. Such gains or losses may be substantial.
Depositary Receipts Risk: Depositary receipts aregenerally subject to the same risks as the foreign securitiesthat they evidence or into which they may be converted.Depositary receipts may or may not be jointly sponsored bythe underlying issuer. The issuers of unsponsoreddepositary receipts are not obligated to disclose informationthat is considered material in the United States. Therefore,there may be less information available regarding theissuers and there may not be a correlation between suchinformation and the market value of the depositary receipts.Certain depositary receipts are not listed on an exchangeand therefore may be considered to be illiquid securities.
Derivatives Risk: The prices of derivatives may move inunexpected ways due to the use of leverage and otherfactors and may result in increased volatility or losses. TheFund may not be able to terminate or sell derivativepositions, and a liquid secondary market may not alwaysexist for derivative positions.
Emerging Markets Risk: In addition to the risks associatedwith investments in foreign securities, emerging marketsecurities are subject to additional risks, which cause thesesecurities generally to be more volatile than securities ofissuers located in developed countries.
Equity Securities Risk: The Fund invests primarily inequity securities and is therefore subject to the risk thatstock prices will fall and may underperform other assetclasses. Individual stock prices fluctuate from day-to-dayand may decline significantly. The prices of individual stocksmay be negatively affected by poor company results orother factors affecting individual prices, as well as industryand/or economic trends and developments affectingindustries or the securities market as a whole.
Interest Rate Risk: The value of fixed income securitiesmay decline when interest rates go up or increase wheninterest rates go down. The interest earned on fixed incomesecurities may decline when interest rates go down orincrease when interest rates go up. Longer-term and lowercoupon bonds tend to be more sensitive to changes ininterest rates. The Fund may be subject to a greater risk ofrising interest rates due to the current period of historicallylow rates and the effect of potential government fiscal policyinitiatives and resulting market reaction to these initiatives.
U.S. Government Obligations Risk: U.S. Treasuryobligations are backed by the “full faith and credit” of theU.S. Government and are generally considered to have lowcredit risk. Unlike U.S. Treasury obligations, securitiesissued or guaranteed by federal agencies or authorities andU.S. Government-sponsored instrumentalities or enterprisesmay or may not be backed by the full faith and credit of theU.S. Government and are therefore subject to greater creditrisk than securities issued or guaranteed by the U.S.Treasury.
Geographic Risk: If the Fund invests a significant portion ofits assets in issuers located in a single country, a limitednumber of countries, or a particular geographic region, it
- 65 -

FUND SUMMARY: INTERNATIONAL GROWTH FUND
assumes the risk that economic, political and socialconditions in those countries or that region may have asignificant impact on its investment performance.
Growth Style Risk: Generally, “growth” stocks are stocksof companies that the sub-adviser believes have anticipatedearnings ranging from steady to accelerated growth. Manyinvestors buy growth stocks because of anticipated superiorearnings growth, but earnings disappointments often resultin sharp price declines. Growth companies usually invest ahigh portion of earnings in their own businesses so theirstocks may lack the dividends that can cushion share pricesin a down market. In addition, the value of fast growthstocks may be more sensitive to changes in current orexpected earnings than the values of other stocks, becausegrowth stocks trade at higher prices relative to currentearnings.
Market Risk: The Fund’s share price can fall because ofweakness in the broad market, a particular industry, orspecific holdings or due to adverse political or economicdevelopments here or abroad, changes in investorpsychology, or heavy institutional selling. The price ofindividual securities may fluctuate, sometimes dramatically,from day-to-day. The prices of stocks and other equitysecurities tend to be more volatile than those of fixedincome securities.
Price Volatility Risk: The Fund’s investment strategy maysubject the Fund’s portfolio to increased volatility. Volatilitymay cause the value of the Fund’s portfolio to fluctuatesignificantly in the short term.
Large-Cap Company Risk: Investing primarily in large-capcompanies carries the risk that due to current marketconditions these companies may be out of favor withinvestors. Large-cap companies may be unable to respondquickly to new competitive challenges or attain the highgrowth rate of successful smaller companies.
Mid-Cap Company Risk: Investing primarily in mid-capcompanies carries the risk that due to current marketconditions these companies may be out of favor withinvestors. Stocks of mid-cap companies may be morevolatile than those of larger companies due to, among otherreasons, narrower product lines, more limited financialresources and fewer experienced managers.
Preferred Stock Risk: Unlike common stock, preferredstock generally pays a fixed dividend from a company’searnings and may have a preference over common stock onthe distribution of a company’s assets in the event ofbankruptcy or liquidation. Preferred stockholders’ liquidationrights are subordinate to the company’s debt holders andcreditors. If interest rates rise, the fixed dividend onpreferred stocks may be less attractive and the price ofpreferred stocks may decline. Preferred stockholderstypically do not have voting rights.
Securities Lending Risk: Engaging in securities lendingcould increase the market and credit risk for Fundinvestments. The Fund may lose money if it does not
recover borrowed securities, the value of the collateral falls,or the value of investments made with cash collateraldeclines. If the value of either the cash collateral or theFund’s investments of the cash collateral falls below theamount owed to a borrower, the Fund also may incur lossesthat exceed the amount it earned on lending the security.Securities lending also involves the risks of delay inreceiving additional collateral or possible loss of rights in thecollateral if the borrower fails. Another risk of securitieslending is the risk that the loaned portfolio securities maynot be available to the Fund on a timely basis and the Fundmay therefore lose the opportunity to sell the securities at adesirable price.
Performance Information
The following Risk/Return Bar Chart and Table illustrate therisks of investing in the Fund by showing changes in theFund’s performance from calendar year to calendar yearand comparing the Fund’s average annual returns to thoseof the MSCI EAFE Index (net). Fees and expenses incurredat the contract level are not reflected in the bar chart ortable. If these amounts were reflected, returns would be lessthan those shown. Of course, past performance is notnecessarily an indication of how the Fund will perform in thefuture.
American Century Investment Management, Inc. (“AmericanCentury”) has served as sub-adviserof the Fund since its inception. Invesco Advisers, Inc.(“Invesco”) and Massachusetts Financial Services Company(“MFS”) have served as co-sub-advisers since June 20,2005. As of June 30, 2016, American Century managedapproximately 47% of the Fund’s assets, Invesco managedapproximately 28% of the Fund’s assets and MFS managedapproximately 25% of the Fund’s assets. The percentage ofthe Fund’s assets that each sub-adviser manages may, atthe adviser’s discretion, change from time to time.
2006 2007 2008 2009 2010 2011 2012 2013 20152014-50%
-40%
-30%
-20%
-10%
10%
0%
20%
30%
40%
26.37%
14.68%
-41.99%
35.36%
12.59%
-9.81%
20.19%20.75%
-3.46%-0.49%
During the periods shown in the bar chart, the highest returnfor a quarter was 21.24% (quarter ending June 30, 2009)the lowest return for a quarter -20.83% (quarter endingDecember 31, 2008). For the year-to-date through June 30,2016, the Fund’s return was -4.03%.
- 66 -

FUND SUMMARY: INTERNATIONAL GROWTH FUND
Average Annual Total Returns (For the periods endedDecember 31, 2015)
1Year
5Years
10Years
Fund -0.49% 4.69% 4.89%MSCI EAFE Index (net) -0.81% 3.60% 3.03%
Investment Adviser
The Fund’s investment adviser is The Variable Annuity LifeInsurance Company. The Fund is sub-advised by AmericanCentury, Invesco and MFS.
Portfolio Managers
Name
PortfolioManager ofthe Fund
Since Title
American CenturyRajesh Gandhi, CFA 2008 Vice President and
Senior PortfolioManager
James G.Gendelman, CFA
2015 Vice President andPortfolio Manager
InvescoClas Olsson 2005 Managing Director,
CIO of Invesco’sInternationalGrowth and GlobalGrowth InvestmentManagement Unitand SeniorPortfolio Manager
Mark Jason, CFA 2011 Senior PortfolioManager
Brent Bates, CFA 2013 Senior PortfolioManager
Richard Nield, CFA 2013 Senior PortfolioManager
Matthew Dennis,CFA
2005 Senior PortfolioManager
MFSMarcus L. Smith* 2005 Investment Officer
and PortfolioManager
Daniel Ling, CFA 2009 Investment Officerand PortfolioManager
Filipe M.G. Benzinho 2016 Investment Officerand PortfolioManager
* As of April 1, 2017, Marcus L. Smith will no longer be a portfoliomanager of the Fund.
For important information about purchase and sales of Fundshares, taxes and payments made to broker-dealers andother financial intermediaries, please turn to the section“Important Additional Information” on page 101.
- 67 -

FUND SUMMARY: LARGE CAP CORE FUND
Investment Objective
The Fund seeks capital growth with the potential for currentincome.
Fees and Expenses of the Fund
This table describes the fees and expenses that you maypay if you buy and hold shares of the Fund. The Fund’sannual operating expenses do not reflect the separateaccount fees charged in the variable annuity or variable lifeinsurance policy (“Variable Contracts”) in which the Fund isoffered. If a separate account’s fees were shown, theFund’s annual operating expenses would be higher. Pleasesee your Variable Contract prospectus for more details onthe separate account fees.
Annual Fund Operating Expenses (expenses that youpay each year as a percentage of the value of yourinvestment)
Management Fees 0.70%Other Expenses 0.13%Total Annual Fund Operating Expenses 0.83%
Expense Example
This Example is intended to help you compare the cost ofinvesting in the Fund with the cost of investing in othermutual funds. The Example assumes that you invest$10,000 in the Fund for the time periods indicated and thenredeem all of your shares at the end of those periods. TheExample also assumes that your investment has a 5%return each year and that the Fund’s operating expensesremain the same. The Example does not reflect chargesimposed by the Variable Contract. If the Variable Contractfees were reflected then the expenses would be higher. Seethe Variable Contract prospectus for information on suchcharges. Although your actual costs may be higher or lower,based on these assumptions and the net expenses shownin the fee table, your costs would be:
1 Year 3 Years 5 Years 10 Years
$85 $265 $460 $1,025
Portfolio Turnover
The Fund pays transaction costs, such as commissions,when it buys and sells securities (or “turns over” itsportfolio). These costs, which are not reflected in annualfund operating expenses or in the example, affect theFund’s performance. During the most recent fiscal year, theFund’s portfolio turnover rate was 53% of the average valueof its portfolio.
Principal Investment Strategies of the Fund
The Fund invests, under normal circumstances, at least80% of its net assets in the common stocks of large-capU.S. companies. The Fund invests in equity securities of
U.S. companies that have large market capitalization(generally over $2 billion) that the sub-adviser believes areundervalued and have the potential for long-term growthand current income.
In addition, the Fund may invest up to 20% of its net assetsin foreign securities, including depositary receipts.Depositary receipts are issued by a bank or trust companyreflecting ownership of underlying securities issued byforeign governments.
In order to generate additional income, the Fund may lendportfolio securities to broker-dealers and other financialinstitutions provided that the value of the loaned securitiesdoes not exceed 30% of the Fund’s total assets. Theseloans earn income for the Fund and are collateralized bycash, securities issued or guaranteed by the U.S.Government or its agencies or instrumentalities, and suchother securities as the Fund and the securities lendingagent may agree upon. Investors will be given at least60 days’ written notice in advance of any change to theFund’s 80% investment policy set forth above.
Principal Risks of Investing in the Fund
There can be no assurance that the Fund’s investmentobjective will be met or that the net return on an investmentin the Fund will exceed what could have been obtainedthrough other investment or savings vehicles. Shares of theFund are not bank deposits and are not guaranteed orinsured by any bank, government entity or the FederalDeposit Insurance Corporation. As with any mutual fund,there is no guarantee that the Fund will be able to achieveits investment objective. If the value of the assets of theFund goes down, you could lose money.
The following is a summary of the principal risks of investingin the Fund.
Depositary Receipts Risk: Depositary receipts aregenerally subject to the same risks as the foreign securitiesthat they evidence or into which they may be converted.Depositary receipts may or may not be jointly sponsored bythe underlying issuer. The issuers of unsponsoreddepositary receipts are not obligated to disclose informationthat is considered material in the United States. Therefore,there may be less information available regarding theissuers and there may not be a correlation between suchinformation and the market value of the depositary receipts.Certain depositary receipts are not listed on an exchangeand therefore may be considered to be illiquid securities.
Management Risk: The investment style or strategy usedby the sub-adviser may fail to produce the intended result.The sub-adviser’s assessment of a particular security orcompany may prove incorrect, resulting in losses orunderperformance.
Equity Securities Risk: The Fund generally invests inequity securities and is therefore subject to the risk thatstock prices will fall and may underperform other asset
- 68 -

FUND SUMMARY: LARGE CAP CORE FUND
classes. Individual stock prices fluctuate from day-to-dayand may decline significantly. The prices of individual stocksmay be negatively affected by poor company results orother factors affecting individual prices, as well as industryand/or economic trends and developments affectingindustries or the securities market as a whole.
Large-Cap Company Risk: Investing primarily in large-capcompanies carries the risk that due to current marketconditions these companies may be out of favor withinvestors. Large-cap companies may be unable to respondquickly to new competitive challenges or attain the highgrowth rate of successful smaller companies.
Currency Risk: Because the Fund’s foreign investmentsare generally held in foreign currencies, the Fund couldexperience gains or losses based solely on changes in theexchange rate between foreign currencies and the U.S.dollar. Such gains or losses may be substantial.
Foreign Investment Risk: Investment in foreign securitiesinvolves risks due to several factors, such as illiquidity, thelack of public information, changes in the exchange ratesbetween foreign currencies and the U.S. dollar, unfavorablepolitical, social and legal developments, or economic andfinancial instability. Foreign companies are not subject tothe U.S. accounting and financial reporting standards andmay have riskier settlement procedures. U.S. investmentsthat are denominated in foreign currencies or that are tradedin foreign markets, or securities of U.S. companies thathave significant foreign operations may be subject to foreigninvestment risk.
Growth Style Risk: Growth stocks can be volatile forseveral reasons. Since the issuers usually reinvest a highportion of earnings in their own business, growth stocksmay lack the comfortable dividend yield associated withvalue stocks that can cushion total return in a bear market.Also, growth stocks normally carry a higher price/earningsratio than many other stocks. Consequently, if earningsexpectations are not met, the market price of growth stockswill often go down more than other stocks. However, themarket frequently rewards growth stocks with priceincreases when expectations are met or exceeded.
Market Risk: The Fund’s share price can fall because ofweakness in the broad market, a particular industry, orspecific holdings or due to adverse political or economicdevelopments here or abroad, changes in investorpsychology, or heavy institutional selling. The price ofindividual securities may fluctuate, sometimes dramatically,from day-to-day. The prices of stocks and other equitysecurities tend to be more volatile than those of fixedincome securities.
Securities Lending Risk: Engaging in securities lendingcould increase the market and credit risk for Fundinvestments. The Fund may lose money if it does notrecover borrowed securities, the value of the collateral falls,or the value of investments made with cash collateraldeclines. If the value of either the cash collateral or theFund’s investments of the cash collateral falls below theamount owed to a borrower, the Fund also may incur losses
that exceed the amount it earned on lending the security.Securities lending also involves the risks of delay inreceiving additional collateral or possible loss of rights in thecollateral if the borrower fails. Another risk of securitieslending is the risk that the loaned portfolio securities maynot be available to the Fund on a timely basis and the Fundmay therefore lose the opportunity to sell the securities at adesirable price.
Value Style Risk: Value securities are securities ofcompanies that may have experienced, for example,adverse business, industry or other developments or maybe subject to special risks that have caused the securities tobe out of favor and, in turn, potentially undervalued. Themarket value of a portfolio security may not meet the Sub-adviser’s future value assessment of that security, or maydecline. There is also a risk that it may take longer thanexpected for the value of these investments to rise to thebelieved value. In addition, value securities, at times, maynot perform as well as growth securities or the stock marketin general, and may be out of favor with investors forvarying periods of time.
Performance Information
The following Risk/Return Bar Chart and Table illustrate therisks of investing in the Fund by showing changes in theFund’s performance from calendar year to calendar yearand comparing the Fund’s average annual returns to thoseof the Russell 1000® Index. Fees and expenses incurred atthe contract level are not reflected in the bar chart or table.If these amounts were reflected, returns would be less thanthose shown. Of course, past performance is notnecessarily an indication of how the Fund will perform in thefuture.
Prior to November 14, 2011, the Fund was sub-advised byWells Capital Management Incorporated. ColumbiaManagement Investment Advisers, LLC (“Columbia”)assumed sub-advisory duties effective November 14, 2011.
2006 2007 2008 2009 2010 2011 2012 2013 20152014-40%
-30%
-20%
0%
-10%
10%
20%
30%
40%
50%
12.50%8.04%
-32.48%
38.30%
16.74%
-1.04%
18.67%
36.04%
13.27%
3.05%
During the periods shown in the bar chart, the highest returnfor a quarter was 18.89% (quarter ending June 30, 2009)and the lowest return for a quarter -21.87% (quarter endingDecember 31, 2008). For the year-to-date through June 30,2016, the Fund’s return was 2.27%.
- 69 -

FUND SUMMARY: LARGE CAP CORE FUND
Average Annual Total Returns (For the periods endedDecember 31, 2015)
1Year
5Years
10Years
Fund 3.05% 13.27% 9.47%Russell 1000® Index 0.92% 12.44% 7.40%
Investment Adviser
The Fund’s investment adviser is The Variable Annuity LifeInsurance Company. The Fund is sub-advised by Columbia.
Portfolio Manager
Name
PortfolioManager ofthe Fund
Since Title
Guy W. Pope, CFA 2011 Senior PortfolioManager and Headof Contrarian CoreStrategy
For important information about purchase and sales of Fundshares, taxes and payments made to broker-dealers andother financial intermediaries, please turn to the section“Important Additional Information” on page 101.
- 70 -

FUND SUMMARY: LARGE CAPITAL GROWTH FUND
Investment Objective
The Fund seeks to provide long-term growth of capital.
Fees and Expenses of the Fund
This table describes the fees and expenses that you maypay if you buy and hold shares of the Fund. The Fund’sannual operating expenses do not reflect the separateaccount fees charged in the variable annuity or variable lifeinsurance policy (“Variable Contracts”) in which the Fund isoffered. If a separate account’s fees were shown, theFund’s annual operating expenses would be higher. Pleasesee your Variable Contract prospectus for more details onthe separate account fees.
Annual Fund Operating Expenses (expenses that you payeach year as a percentage of the value of your investment)
Management Fees 0.64%Other Expenses 0.11%Total Annual Fund Operating Expenses 0.75%
Expense Example
This Example is intended to help you compare the cost ofinvesting in the Fund with the cost of investing in othermutual funds. The Example assumes that you invest$10,000 in the Fund for the time periods indicated and thenredeem all of your shares at the end of those periods. TheExample also assumes that your investment has a 5%return each year and that the Fund’s operating expensesremain the same. The Example does not reflect chargesimposed by the Variable Contract. If the Variable Contractfees were reflected then the expenses would be higher. Seethe Variable Contract prospectus for information on suchcharges. Although your actual costs may be higher or lower,based on these assumptions and the net expenses shownin the fee table, your costs would be:
1 Year 3 Years 5 Years 10 Years
$77 $240 $417 $930
Portfolio Turnover
The Fund pays transaction costs, such as commissions,when it buys and sells securities (or “turns over” its portfolio).These costs, which are not reflected in annual fund operatingexpenses or in the example, affect the Fund’s performance.During the most recent fiscal year, the Fund’s portfolioturnover rate was 24% of the average value of its portfolio.
Principal Investment Strategies of the Fund
The Fund seeks to meet its objective by investing, normally,at least 80% of its net assets in securities of large-capcompanies. In complying with this 80% investmentrequirement, the Fund will invest primarily in common stocks.
Generally, large-cap companies will include companieswhose market capitalizations, at the time of purchase, areequal to or greater than the market capitalization of thesmallest company in the Russell 1000® Index during the mostrecent 12-month period. As of May 27, 2016, the marketcapitalization range of the companies in the Russell 1000®
Index was approximately $1.9 billion to $549.6 billion.
The Fund’s sub-adviser focuses on investing the Fund’sassets in the stocks of companies it believes to have aboveaverage earnings growth potential compared to othercompanies. Growth companies tend to have stock pricesthat are high relative to their earnings, dividends, bookvalue, or other financial measures.
The Fund’s sub-adviser uses a bottom-up investmentapproach to buying and selling investments for the Fund.Investments are selected primarily based on fundamentalanalysis of individual issuers. Quantitative models thatsystematically evaluate issuers may also be considered.
The Fund may invest up to 25% of its total assets in foreignsecurities.
In order to generate additional income, the Fund may lendportfolio securities to broker-dealers and other financialinstitutions provided that the value of the loaned securitiesdoes not exceed 30% of the Fund’s total assets. Theseloans earn income for the Fund and are collateralized bycash, securities issued or guaranteed by the U.S.Government or its agencies or instrumentalities, and suchother securities as the Fund and the securities lendingagent may agree upon. Investors will be given at least60 days’ written notice in advance of any change to theFund’s 80% investment policy set forth above.
Principal Risks of Investing in the Fund
There can be no assurance that the Fund’s investmentobjective will be met or that the net return on an investmentin the Fund will exceed what could have been obtainedthrough other investment or savings vehicles. Shares of theFund are not bank deposits and are not guaranteed orinsured by any bank, government entity or the FederalDeposit Insurance Corporation. As with any mutual fund,there is no guarantee that the Fund will be able to achieveits investment objective. If the value of the assets of theFund goes down, you could lose money.
The following is a summary of the principal risks of investingin the Fund.
Management Risk: The investment style or strategy usedby the sub-adviser may fail to produce the intended result.The sub-adviser’s assessment of a particular security orcompany may prove incorrect, resulting in losses orunderperformance.
Equity Securities Risk: The Fund invests primarily inequity securities and is therefore subject to the risk thatstock prices will fall and may underperform other assetclasses. Individual stock prices fluctuate from day-to-dayand may decline significantly. The prices of individual stocksmay be negatively affected by poor company results orother factors affecting individual prices, as well as industryand/or economic trends and developments affectingindustries or the securities market as a whole.
Currency Risk: Because the Fund’s foreign investmentsare generally held in foreign currencies, the Fund couldexperience gains or losses based solely on changes in theexchange rate between foreign currencies and the U.S.dollar. Such gains or losses may be substantial.
- 71 -
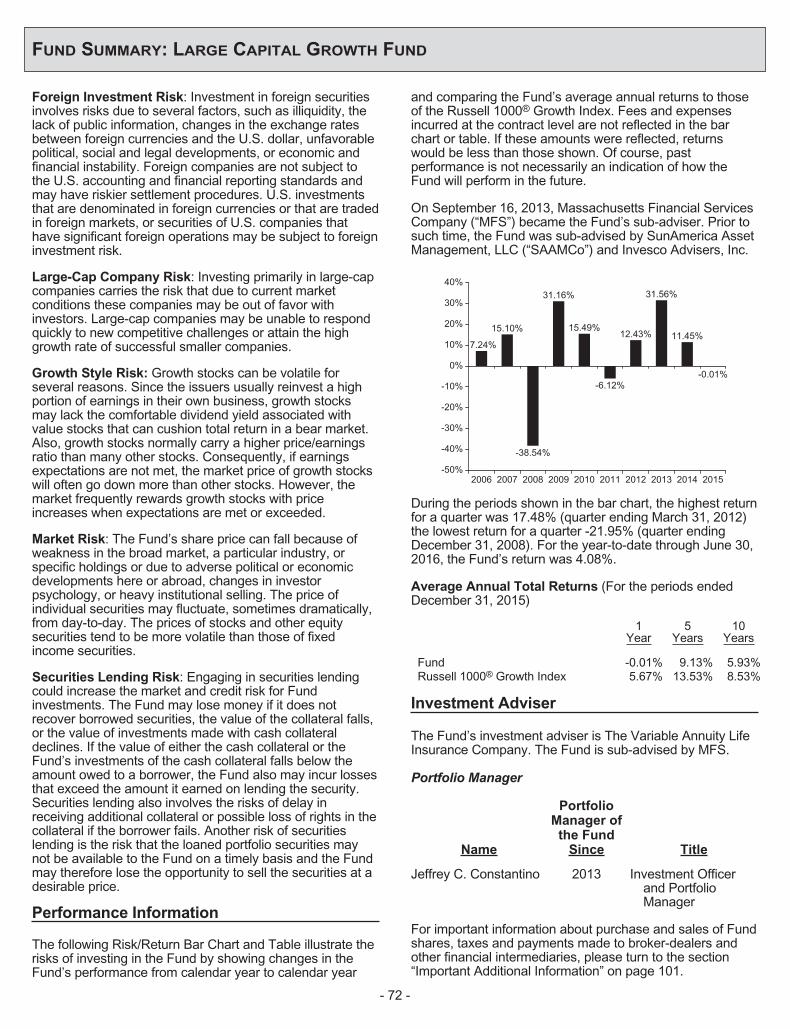
FUND SUMMARY: LARGE CAPITAL GROWTH FUND
Foreign Investment Risk: Investment in foreign securitiesinvolves risks due to several factors, such as illiquidity, thelack of public information, changes in the exchange ratesbetween foreign currencies and the U.S. dollar, unfavorablepolitical, social and legal developments, or economic andfinancial instability. Foreign companies are not subject tothe U.S. accounting and financial reporting standards andmay have riskier settlement procedures. U.S. investmentsthat are denominated in foreign currencies or that are tradedin foreign markets, or securities of U.S. companies thathave significant foreign operations may be subject to foreigninvestment risk.
Large-Cap Company Risk: Investing primarily in large-capcompanies carries the risk that due to current marketconditions these companies may be out of favor withinvestors. Large-cap companies may be unable to respondquickly to new competitive challenges or attain the highgrowth rate of successful smaller companies.
Growth Style Risk: Growth stocks can be volatile forseveral reasons. Since the issuers usually reinvest a highportion of earnings in their own business, growth stocksmay lack the comfortable dividend yield associated withvalue stocks that can cushion total return in a bear market.Also, growth stocks normally carry a higher price/earningsratio than many other stocks. Consequently, if earningsexpectations are not met, the market price of growth stockswill often go down more than other stocks. However, themarket frequently rewards growth stocks with priceincreases when expectations are met or exceeded.
Market Risk: The Fund’s share price can fall because ofweakness in the broad market, a particular industry, orspecific holdings or due to adverse political or economicdevelopments here or abroad, changes in investorpsychology, or heavy institutional selling. The price ofindividual securities may fluctuate, sometimes dramatically,from day-to-day. The prices of stocks and other equitysecurities tend to be more volatile than those of fixedincome securities.
Securities Lending Risk: Engaging in securities lendingcould increase the market and credit risk for Fundinvestments. The Fund may lose money if it does notrecover borrowed securities, the value of the collateral falls,or the value of investments made with cash collateraldeclines. If the value of either the cash collateral or theFund’s investments of the cash collateral falls below theamount owed to a borrower, the Fund also may incur lossesthat exceed the amount it earned on lending the security.Securities lending also involves the risks of delay inreceiving additional collateral or possible loss of rights in thecollateral if the borrower fails. Another risk of securitieslending is the risk that the loaned portfolio securities maynot be available to the Fund on a timely basis and the Fundmay therefore lose the opportunity to sell the securities at adesirable price.
Performance Information
The following Risk/Return Bar Chart and Table illustrate therisks of investing in the Fund by showing changes in theFund’s performance from calendar year to calendar year
and comparing the Fund’s average annual returns to thoseof the Russell 1000® Growth Index. Fees and expensesincurred at the contract level are not reflected in the barchart or table. If these amounts were reflected, returnswould be less than those shown. Of course, pastperformance is not necessarily an indication of how theFund will perform in the future.
On September 16, 2013, Massachusetts Financial ServicesCompany (“MFS”) became the Fund’s sub-adviser. Prior tosuch time, the Fund was sub-advised by SunAmerica AssetManagement, LLC (“SAAMCo”) and Invesco Advisers, Inc.
2006 2007 2008 2009 2010 2011 2012 2013 20152014-50%
-40%
-30%
-20%
-10%
10%
0%
20%
30%
40%
7.24%
15.10%
-38.54%
31.16%
15.49%
-6.12%
12.43%
31.56%
11.45%
-0.01%
During the periods shown in the bar chart, the highest returnfor a quarter was 17.48% (quarter ending March 31, 2012)the lowest return for a quarter -21.95% (quarter endingDecember 31, 2008). For the year-to-date through June 30,2016, the Fund’s return was 4.08%.
Average Annual Total Returns (For the periods endedDecember 31, 2015)
1Year
5Years
10Years
Fund -0.01% 9.13% 5.93%Russell 1000® Growth Index 5.67% 13.53% 8.53%
Investment Adviser
The Fund’s investment adviser is The Variable Annuity LifeInsurance Company. The Fund is sub-advised by MFS.
Portfolio Manager
Name
PortfolioManager ofthe Fund
Since Title
Jeffrey C. Constantino 2013 Investment Officerand PortfolioManager
For important information about purchase and sales of Fundshares, taxes and payments made to broker-dealers andother financial intermediaries, please turn to the section“Important Additional Information” on page 101.
- 72 -

FUND SUMMARY: MID CAP INDEX FUND
Investment Objective
The Fund seeks to provide growth of capital throughinvestments primarily in a diversified portfolio of commonstocks that, as a group, are expected to provide investmentresults closely corresponding to the performance of the S&PMidCap 400® Index (the “Index”).
Fees and Expenses of the Fund
This table describes the fees and expenses that you maypay if you buy and hold shares of the Fund. The Fund’sannual operating expenses do not reflect the separateaccount fees charged in the variable annuity or variable lifeinsurance policy (“Variable Contracts”) in which the Fund isoffered. If a separate account’s fees were shown, theFund’s annual operating expenses would be higher. Pleasesee your Variable Contract prospectus for more details onthe separate account fees.
Annual Fund Operating Expenses (expenses that youpay each year as a percentage of the value of yourinvestment)
Management Fees 0.27%Other Expenses 0.09%Total Annual Fund Operating Expenses 0.36%
Expense Example
This Example is intended to help you compare the cost ofinvesting in the Fund with the cost of investing in othermutual funds. The Example assumes that you invest$10,000 in the Fund for the time periods indicated and thenredeem all of your shares at the end of those periods. TheExample also assumes that your investment has a 5%return each year and that the Fund’s operating expensesremain the same. The Example does not reflect chargesimposed by the Variable Contract. If the Variable Contractfees were reflected then the expenses would be higher. Seethe Variable Contract prospectus for information on suchcharges. Although your actual costs may be higher or lower,based on these assumptions and the net expenses shownin the fee table, your costs would be:
1 Year 3 Years 5 Years 10 Years
$37 $116 $202 $456
Portfolio Turnover
The Fund pays transaction costs, such as commissions,when it buys and sells securities (or “turns over” itsportfolio). These costs, which are not reflected in annualfund operating expenses or in the example, affect theFund’s performance. During the most recent fiscal year, theFund’s portfolio turnover rate was 15% of the average valueof its portfolio.
Principal Investment Strategies of the Fund
The Fund is managed to seek to track the performance ofthe Index, which measures the performance of the mid-capitalization sector of the U.S. equity market. The sub-adviser may endeavor to track the Index by purchasingevery stock included in the Index, in the same proportions;or, in the alternative, the sub-adviser may invest in asampling of Index stocks by utilizing a statistical techniqueknown as “optimization.” The goal of optimization is to selectstocks which ensure that various industry weightings,market capitalizations, and fundamental characteristics,(e.g., price-to-book, price-to-earnings, debt-to-asset ratiosand dividend yields) closely approximate those of the Index.
Under normal circumstances, at least 80% of the Fund’s netassets are invested in stocks that are in the Index. Althoughthe Fund seeks to track the performance of the Index, theperformance of the Fund will not match that of the Indexexactly because, among other reasons, the Fund incursoperating expenses and other investment overhead as partof its normal operations.
In order to generate additional income, the Fund may lendportfolio securities to broker-dealers and other financialinstitutions provided that the value of the loaned securitiesdoes not exceed 30% of the Fund’s total assets. Theseloans earn income for the Fund and are collateralized bycash, securities issued or guaranteed by the U.S.Government or its agencies or instrumentalities, and suchother securities as the Fund and the securities lendingagent may agree upon. Investors will be given at least60 days’ written notice in advance of any change to theFund’s 80% investment policy set forth above.
Principal Risks of Investing in the Fund
There can be no assurance that the Fund’s investmentobjective will be met or that the net return on an investmentin the Fund will exceed what could have been obtainedthrough other investment or savings vehicles. Shares of theFund are not bank deposits and are not guaranteed orinsured by any bank, government entity or the FederalDeposit Insurance Corporation. As with any mutual fund,there is no guarantee that the Fund will be able to achieveits investment objective. If the value of the assets of theFund goes down, you could lose money.
The following is a summary of the principal risks of investingin the Fund.
Index Risk: In attempting to track the performance of theIndex, the Fund may be more susceptible to adversedevelopments concerning a particular security, company orindustry because the Fund generally will not use anydefensive strategies to mitigate its risk exposure.
Equity Securities Risk: The Fund invests principally inequity securities and is therefore subject to the risk thatstock prices will fall and may underperform other asset
- 73 -

FUND SUMMARY: MID CAP INDEX FUND
classes. Individual stock prices fluctuate from day-to-dayand may decline significantly. The prices of individual stocksmay be negatively affected by poor company results orother factors affecting individual prices, as well as industryand/or economic trends and developments affectingindustries or the securities market as a whole.
Market Risk: The Fund’s share price can fall because ofweakness in the broad market, a particular industry, orspecific holdings or due to adverse political or economicdevelopments here or abroad, changes in investorpsychology, or heavy institutional selling. The price ofindividual securities may fluctuate, sometimes dramatically,from day-to-day. The prices of stocks and other equitysecurities tend to be more volatile than those of fixedincome securities.
Mid-Cap Company Risk: Investing primarily in mid-capcompanies carries the risk that due to current marketconditions these companies may be out of favor withinvestors. Stocks of mid-cap companies may be morevolatile than those of larger companies due to, among otherreasons, narrower product lines, more limited financialresources and fewer experienced managers.
Securities Lending Risk: Engaging in securities lendingcould increase the market and credit risk for Fundinvestments. The Fund may lose money if it does notrecover borrowed securities, the value of the collateral falls,or the value of investments made with cash collateraldeclines. If the value of either the cash collateral or theFund’s investments of the cash collateral falls below theamount owed to a borrower, the Fund also may incur lossesthat exceed the amount it earned on lending the security.Securities lending also involves the risks of delay inreceiving additional collateral or possible loss of rights in thecollateral if the borrower fails. Another risk of securitieslending is the risk that the loaned portfolio securities maynot be available to the Fund on a timely basis and the Fundmay therefore lose the opportunity to sell the securities at adesirable price.
Performance Information
The following Risk/Return Bar Chart and Table illustrate therisks of investing in the Fund by showing changes in theFund’s performance from calendar year to calendar yearand comparing the Fund’s average annual returns to thoseof the S&P MidCap 400® Index. Fees and expensesincurred at the contract level are not reflected in the barchart or table. If these amounts were reflected, returnswould be less than those shown. Of course, pastperformance is not necessarily an indication of how theFund will perform in the future.
Effective December 1, 2009, SunAmerica AssetManagement, LLC (“SAAMCo”) replaced PineBridgeInvestments LLC as sub-adviser of the Fund.
2006 2007 2008 2009 2010 2011 2012 2013 20152014-50%
-40%
-30%
-20%
-10%
10%
0%
20%
30%
50%
40%
9.97%7.64%
-36.89%
38.28%
26.25%
-2.01%
17.52%
33.11%
9.41%
-2.50%
During the periods shown in the bar chart, the highest returnfor a quarter was 20.19% (quarter ending September 30,2009) and the lowest return for a quarter was -26.30%(quarter ending December 31, 2008). For the year-to-datethrough June 30, 2016, the Fund’s return was 7.93%.
Average Annual Total Returns (For the periods endedDecember 31, 2015)
1Year
5Years
10Years
Fund -2.50% 10.34% 7.87%S&P MidCap 400® Index -2.18% 10.68% 8.18%
Investment Adviser
The Fund’s investment adviser is The Variable Annuity LifeInsurance Company. The Fund is sub-advised by SAAMCo.
Portfolio Manager
Name
PortfolioManager ofthe Fund
Since Title
Timothy Campion 2012 Lead PortfolioManager
Andrew Sheridan 2013 Co-Portfolio ManagerJane Bayar 2015 Co-Portfolio Manager
For important information about purchase and sales of Fundshares, taxes and payments made to broker-dealers andother financial intermediaries, please turn to the section“Important Additional Information” on page 101.
- 74 -
FUND SUMMARY: MID CAP STRATEGIC GROWTH FUND
Investment Objective
The Fund seeks long-term capital growth.
Fees and Expenses of the Fund
This table describes the fees and expenses that you maypay if you buy and hold shares of the Fund. The Fund’sannual operating expenses do not reflect the separateaccount fees charged in the variable annuity or variable lifeinsurance policy (“Variable Contracts”) in which the Fund isoffered. If a separate account’s fees were shown, theFund’s annual operating expenses would be higher. Pleasesee your Variable Contract prospectus for more details onthe separate account fees.
Annual Fund Operating Expenses (expenses that youpay each year as a percentage of the value of yourinvestment)
Management Fees 0.70%Other Expenses 0.13%Total Annual Fund Operating Expenses 0.83%
Expense Example
This Example is intended to help you compare the cost ofinvesting in the Fund with the cost of investing in othermutual funds. The Example assumes that you invest$10,000 in the Fund for the time periods indicated and thenredeem all of your shares at the end of those periods. TheExample also assumes that your investment has a 5%return each year and that the Fund’s operating expensesremain the same. The Example does not reflect chargesimposed by the Variable Contract. If the Variable Contractfees were reflected then the expenses would be higher. Seethe Variable Contract prospectus for information on suchcharges. Although your actual costs may be higher or lower,based on these assumptions and the net expenses shownin the fee table, your costs would be:
1 Year 3 Years 5 Years 10 Years
$85 $265 $460 $1,025
Portfolio Turnover
The Fund pays transaction costs, such as commissions,when it buys and sells securities (or “turns over” itsportfolio). These costs, which are not reflected in annualfund operating expenses or in the example, affect theFund’s performance. During the most recent fiscal year, theFund’s portfolio turnover rate was 95% of the average valueof its portfolio.
Principal Investment Strategies of the Fund
The sub-advisers seek long-term capital growth by investingprimarily in growth-oriented equity securities of domesticand foreign mid-cap companies.
Under normal circumstances, at least 80% of the Fund’s netassets will be invested in common stocks of mid-capcompanies. Generally, mid-cap companies will includecompanies whose market capitalizations, at the time ofpurchase, range from the market capitalization of thesmallest company included in the Russell Midcap® GrowthIndex to the market capitalization of the largest company inthe Russell Midcap® Growth Index during the most recent12-month period. As of June 30, 2016, the marketcapitalization range of the companies in the RussellMidcap® Growth Index was approximately $1.1 billion to$28.6 billion.
The Fund may invest up to 25% of its net assets insecurities of foreign issuers, which may include emergingmarket securities. The securities in which the Fund mayinvest may be denominated in U.S. dollars or in currenciesother than U.S. dollars. The Fund may also invest in privateplacements.
In order to generate additional income, the Fund may lendportfolio securities to broker-dealers and other financialinstitutions provided that the value of the loaned securitiesdoes not exceed 30% of the Fund’s total assets. Theseloans earn income for the Fund and are collateralized bycash, securities issued or guaranteed by the U.S.Government or its agencies or instrumentalities, and suchother securities as the Fund and the securities lendingagent may agree upon. Investors will be given at least60 days’ written notice in advance of any change to theFund’s 80% investment policy set forth above.
Principal Risks of Investing in the Fund
There can be no assurance that the Fund’s investmentobjective will be met or that the net return on an investmentin the Fund will exceed what could have been obtainedthrough other investment or savings vehicles. Shares of theFund are not bank deposits and are not guaranteed orinsured by any bank, government entity or the FederalDeposit Insurance Corporation. As with any mutual fund,there is no guarantee that the Fund will be able to achieveits investment objective. If the value of the assets of theFund goes down, you could lose money.
The following is a summary of the principal risks of investingin the Fund.
Management Risk: The investment style or strategy usedby the sub-adviser may fail to produce the intended result.The sub-adviser’s assessment of a particular security orcompany may prove incorrect, resulting in losses orunderperformance.
Currency Risk: Because the Fund’s foreign investmentsare generally held in foreign currencies, the Fund couldexperience gains or losses based solely on changes in theexchange rate between foreign currencies and the U.S.dollar. Such gains or losses may be substantial.
- 75 -

FUND SUMMARY: MID CAP STRATEGIC GROWTH FUND
Equity Securities Risk: The Fund invests primarily inequity securities and is therefore subject to the risk thatstock prices will fall and may underperform other assetclasses. Individual stock prices fluctuate from day-to-dayand may decline significantly. The prices of individual stocksmay be negatively affected by poor company results orother factors affecting individual prices, as well as industryand/or economic trends and developments affectingindustries or the securities market as a whole.
Foreign Investment Risk: Investment in foreign securitiesinvolves risks due to several factors, such as illiquidity, thelack of public information, changes in the exchange ratesbetween foreign currencies and the U.S. dollar, unfavorablepolitical, social and legal developments, or economic andfinancial instability. Foreign companies are not subject tothe U.S. accounting and financial reporting standards andmay have riskier settlement procedures. U.S. investmentsthat are denominated in foreign currencies or that are tradedin foreign markets, or securities of U.S. companies thathave significant foreign operations may be subject to foreigninvestment risk.
Emerging Markets Risk: In addition to the risks associatedwith investments in foreign securities, emerging marketsecurities are subject to additional risks, which cause thesesecurities generally to be more volatile than securities ofissuers located in developed countries.
Growth Style Risk: Generally, “growth” stocks are stocksof companies that the sub-adviser believes have anticipatedearnings ranging from steady to accelerated growth. Manyinvestors buy growth stocks because of anticipated superiorearnings growth, but earnings disappointments often resultin sharp price declines. Growth companies usually invest ahigh portion of earnings in their own businesses so theirstocks may lack the dividends that can cushion share pricesin a down market. In addition, the value of fast growthstocks may be more sensitive to changes in current orexpected earnings than the values of other stocks, becausegrowth stocks trade at higher prices relative to currentearnings.
Market Risk: The Fund’s share price can fall because ofweakness in the broad market, a particular industry, orspecific holdings or due to adverse political or economicdevelopments here or abroad, changes in investorpsychology, or heavy institutional selling. The price ofindividual securities may fluctuate, sometimes dramatically,from day-to-day. The prices of stocks and other equitysecurities tend to be more volatile than those of fixedincome securities.
Mid-Cap Company Risk: Investing primarily in mid-capcompanies carries the risk that due to current marketconditions these companies may be out of favor withinvestors. Stocks of mid-cap companies may be morevolatile than those of larger companies due to, among otherreasons, narrower product lines, more limited financialresources and fewer experienced managers.
Privately Placed Securities Risk: The Fund’s investmentsmay also include privately placed securities, which aresubject to resale restrictions. These securities will have theeffect of increasing the level of Fund illiquidity to the extentthe Fund may be unable to sell or transfer these securitiesdue to restrictions on transfers or on the ability to findbuyers interested in purchasing the securities. The illiquidityof the market, as well as the lack of publicly availableinformation regarding these securities, may also adverselyaffect the ability to arrive at a fair value for certain securitiesat certain times and could make it difficult for the Fund tosell certain securities.
Securities Lending Risk: Engaging in securities lendingcould increase the market and credit risk for Fundinvestments. The Fund may lose money if it does notrecover borrowed securities, the value of the collateral falls,or the value of investments made with cash collateraldeclines. If the value of either the cash collateral or theFund’s investments of the cash collateral falls below theamount owed to a borrower, the Fund also may incur lossesthat exceed the amount it earned on lending the security.Securities lending also involves the risks of delay inreceiving additional collateral or possible loss of rights in thecollateral if the borrower fails. Another risk of securitieslending is the risk that the loaned portfolio securities maynot be available to the Fund on a timely basis and the Fundmay therefore lose the opportunity to sell the securities at adesirable price.
Performance Information
The following Risk/Return Bar Chart and Table illustrate therisks of investing in the Fund by showing changes in theFund’s performance from calendar year to calendar yearand comparing the Fund’s average annual returns to thoseof the Russell Midcap® Growth Index. Fees and expensesincurred at the contract level are not reflected in the barchart or table. If these amounts were reflected, returnswould be less than those shown. Of course, pastperformance is not necessarily an indication of how theFund will perform in the future.
Morgan Stanley Investment Management Inc. (“MorganStanley”) served as a sub-adviser from the Fund’s inceptionthrough December 7, 2015. Janus Capital ManagementLLC (“Janus”) assumed sub-advisory duties of the Fundeffective December 7, 2015. PineBridge Investments LLCserved as a sub-adviser from the Fund’s inception throughMarch 22, 2011. Allianz Global Investors U.S. LLC(“AllianzGI”) assumed sub-advisory duties of the Fundeffective March 22, 2011.
As of June 30, 2016, Janus managed approximately 61% ofthe Fund’s assets and AllianzGI managed approximately39% of the Fund’s assets. The percentage of the Fund’sassets that each sub-adviser manages may, at the adviser’sdiscretion, change from time to time.
- 76 -

FUND SUMMARY: MID CAP STRATEGIC GROWTH FUND
2006 2007 2008 2009 2010 2011 2012 2013 20152014-60%
-40%
-20%
0%
20%
40%
60%
6.09%
29.72%
47.07%
26.17%
-6.75%
9.23%
38.61%
3.22%
-48.08%
-2.63%-2.63%
During the periods shown in the bar chart, the highest returnfor a quarter was 24.25% (quarter ending June 30, 2009)the lowest return for a quarter -27.30% (quarter endingDecember 31, 2008). For the year-to-date through June 30,2016, the Fund’s return was 3.55%.
Average Annual Total Returns (For the periods endedDecember 31, 2015)
1Year
5Years
10Years
Fund -2.63% 7.25% 6.53%Russell Midcap Growth Index -0.20% 11.54% 8.16%
Investment Adviser
The Fund’s investment adviser is The Variable Annuity LifeInsurance Company. The Fund is sub-advised by Janusand AllianzGI.
Portfolio Managers
Name
PortfolioManager ofthe Fund
Since Title
JanusBrian Demain, CFA 2015 Co-Portfolio ManagerCody Wheaton, CFA 2016 Co-Portfolio Manager
AllianzGISteven Klopukh,
CFA2011 Senior Portfolio
ManagerTim M. McCarthy,
CFA2014 Director and Portfolio
Manager
For important information about purchase and sales of Fundshares, taxes and payments made to broker-dealers andother financial intermediaries, please turn to the section“Important Additional Information” on page 101.
- 77 -

FUND SUMMARY: NASDAQ-100® INDEX FUND
Investment Objective
The Fund seeks long-term capital growth throughinvestments in the stocks that are included in the Nasdaq-100® Index (the “Index”).
Fees and Expenses of the Fund
This table describes the fees and expenses that you maypay if you buy and hold shares of the Fund. The Fund’sannual operating expenses do not reflect the separateaccount fees charged in the variable annuity or variable lifeinsurance policy (“Variable Contracts”) in which the Fund isoffered. If a separate account’s fees were shown, theFund’s annual operating expenses would be higher. Pleasesee your Variable Contract prospectus for more details onthe separate account fees.
Annual Fund Operating Expenses (expenses that youpay each year as a percentage of the value of yourinvestment)
Management Fees 0.40%Other Expenses 0.16%Total Annual Fund Operating Expenses 0.56%Expense Reimbursement(1) 0.03%Total Annual Fund Operating Expenses After
Expense Reimbursement0.53%
(1) The Fund’s investment adviser, The Variable Annuity LifeInsurance Company, has contractually agreed to reimburse theexpenses of the Fund through September 30, 2017, so that theFund’s Total Annual Fund Operating Expenses After ExpenseReimbursement do not exceed 0.53%. For purposes of theExpense Limitation Agreement, “Total Annual Fund OperatingExpenses” shall not include extraordinary expenses (i.e.expenses that are unusual in nature and/or infrequent inoccurrence, such as litigation), or acquired fund fees andexpenses, brokerage commissions and other transactionalexpenses relating to the purchase and sale of portfolio securities,interest, taxes and governmental fees, and other expenses notincurred in the ordinary course of the Fund’s business. ThisExpense Limitation Agreement will continue in effect from year toyear thereafter unless terminated by the Board of Directors priorto any such renewal.
Expense Example
This Example is intended to help you compare the cost ofinvesting in the Fund with the cost of investing in othermutual funds. The Example assumes that you invest$10,000 in the Fund for the time periods indicated and thenredeem all of your shares at the end of those periods. TheExample also assumes that your investment has a 5%return each year and that the Fund’s operating expensesinclude expense reimbursements for year one. TheExample does not reflect charges imposed by the VariableContract. If the Variable Contract fees were reflected thenthe expenses would be higher. See the Variable Contractprospectus for information on such charges. Although youractual costs may be higher or lower, based on these
assumptions and the net expenses shown in the fee table,your costs would be:
1 Year 3 Years 5 Years 10 Years
$54 $176 $310 $699
Portfolio Turnover
The Fund pays transaction costs, such as commissions,when it buys and sells securities (or “turns over” itsportfolio). These costs, which are not reflected in annualfund operating expenses or in the example, affect theFund’s performance. During the most recent fiscal year, theFund’s portfolio turnover rate was 8% of the average valueof its portfolio.
Principal Investment Strategies of the Fund
The Fund invests in stocks that are included in the Index.The Index represents the largest and most active non-financial domestic and international securities listed on TheNASDAQ Stock Market, based on market value(capitalization). This includes major industry groups, suchas computer hardware and software, telecommunications,retail and wholesale trade and biotechnology.
The sub-adviser invests, under normal circumstances, atleast 80% of the Fund’s net assets in companies that arelisted in the Index. The Fund is managed to seek to trackthe performance of the Index. The sub-adviser mayendeavor to track the Index by purchasing every stockincluded in the Index, in the same proportions; or, in thealternative, the sub-adviser may invest in a sampling ofIndex stocks by utilizing a statistical technique known as“optimization.” The goal of optimization is to select stockswhich ensure that various industry weightings, marketcapitalizations, and fundamental characteristics, (e.g., price-to-book, price-to-earnings, debt-to-asset ratios and dividendyields) closely approximate those of the Index.
The Fund may also invest in some futures contracts in orderto help the Fund’s liquidity and to manage its cash position.If the market value of the futures contracts is close to theFund’s cash balance, then that helps to minimize thetracking errors, while helping to maintain liquidity. The Fundis a non-diversified fund, which means that it will invest in asmaller number of issuers than a diversified fund.
The Fund may concentrate its investments (invest morethan 25% of its total assets) in the technology sector, in theproportion consistent with the industry weightings in theIndex.
Although the Fund seeks to track the performance of theIndex, the performance of the Fund will not match that of theIndex exactly because, among other reasons, the Fundincurs operating expenses and other investment overheadas part of its normal operations.
In order to generate additional income, the Fund may lendportfolio securities to broker-dealers and other financial
- 78 -
FUND SUMMARY: NASDAQ-100® INDEX FUND
institutions provided that the value of the loaned securitiesdoes not exceed 30% of the Fund’s total assets. Theseloans earn income for the Fund and are collateralized bycash, securities issued or guaranteed by the U.S.Government or its agencies or instrumentalities, and suchother securities as the Fund and the securities lendingagent may agree upon. Investors will be given at least60 days’ written notice in advance of any change to theFund’s 80% investment policy set forth above.
Principal Risks of Investing in the Fund
There can be no assurance that the Fund’s investmentobjective will be met or that the net return on an investmentin the Fund will exceed what could have been obtainedthrough other investment or savings vehicles. Shares of theFund are not bank deposits and are not guaranteed orinsured by any bank, government entity or the FederalDeposit Insurance Corporation. As with any mutual fund,there is no guarantee that the Fund will be able to achieveits investment objective. If the value of the assets of theFund goes down, you could lose money.
The following is a summary of the principal risks of investingin the Fund.
Technology Sector Risk: Technology stocks historicallyhave experienced unusually wide price swings, causing awide variation in performance. Earnings disappointmentsand intense competition for market share can result in sharpdeclines in the prices of technology stocks.
Equity Securities Risk: The Fund invests principally inequity securities and is therefore subject to the risk thatstock prices will fall and may underperform other assetclasses. Individual stock prices fluctuate from day-to-dayand may decline significantly. The prices of individual stocksmay be negatively affected by poor company results orother factors affecting individual prices, as well as industryand/or economic trends and developments affectingindustries or the securities market as a whole.
Index Risk: In attempting to track the performance of theIndex, the Fund may be more susceptible to adversedevelopments concerning a particular security, company orindustry because the Fund generally will not use anydefensive strategies to mitigate its risk exposure.
Derivatives Risk: The prices of derivatives may move inunexpected ways due to the use of leverage and otherfactors and may result in increased volatility or losses. TheFund may not be able to terminate or sell derivativepositions, and a liquid secondary market may not alwaysexist for derivative positions.
Market Risk: The Fund’s share price can fall because ofweakness in the broad market, a particular industry, orspecific holdings or due to adverse political or economicdevelopments here or abroad, changes in investorpsychology, or heavy institutional selling. The price ofindividual securities may fluctuate, sometimes dramatically,
from day-to-day. The prices of stocks and other equitysecurities tend to be more volatile than those of fixedincome securities.
Non-Diversification Risk: Because the Fund may invest ina smaller number of issuers, its value may be affected to agreater extent by the performance of any one of thoseissuers or by any single economic, political, market orregulatory event affecting any one of those issues than afund that invests in a larger number of issuers.
Sector Risk: Companies with similar characteristics may begrouped together in broad categories called sectors. Sectorrisk is the risk that securities of companies within specificsectors of the economy can perform differently than theoverall market. This may be due to changes in such thingsas the regulatory or competitive environment or to changesin investor perceptions regarding a sector. Because theFund may allocate relatively more assets to certain sectorsthan others, the Fund’s performance may be moresusceptible to any developments which affect those sectorsemphasized by the Fund.
Securities Lending Risk: Engaging in securities lendingcould increase the market and credit risk for Fundinvestments. The Fund may lose money if it does notrecover borrowed securities, the value of the collateral falls,or the value of investments made with cash collateraldeclines. If the value of either the cash collateral or theFund’s investments of the cash collateral falls below theamount owed to a borrower, the Fund also may incur lossesthat exceed the amount it earned on lending the security.Securities lending also involves the risks of delay inreceiving additional collateral or possible loss of rights in thecollateral if the borrower fails. Another risk of securitieslending is the risk that the loaned portfolio securities maynot be available to the Fund on a timely basis and the Fundmay therefore lose the opportunity to sell the securities at adesirable price.
Performance Information
The following Risk/Return Bar Chart and Table illustrate therisks of investing in the Fund by showing changes in theFund’s performance from calendar year to calendar yearand comparing the Fund’s average annual returns to thoseof the Nasdaq-100® Index. Fees and expenses incurred atthe contract level are not reflected in the bar chart or table.If these amounts were reflected, returns would be less thanthose shown. Of course, past performance is notnecessarily an indication of how the Fund will perform in thefuture.
From January 1, 2002 through November 30, 2009,PineBridge Investments LLC (and its predecessors)(“PineBridge”) served as sub-adviser of the Fund. EffectiveDecember 1, 2009, SunAmerica Asset Management, LLC(“SAAMCo”) replaced PineBridge as sub-adviser of theFund.
- 79 -
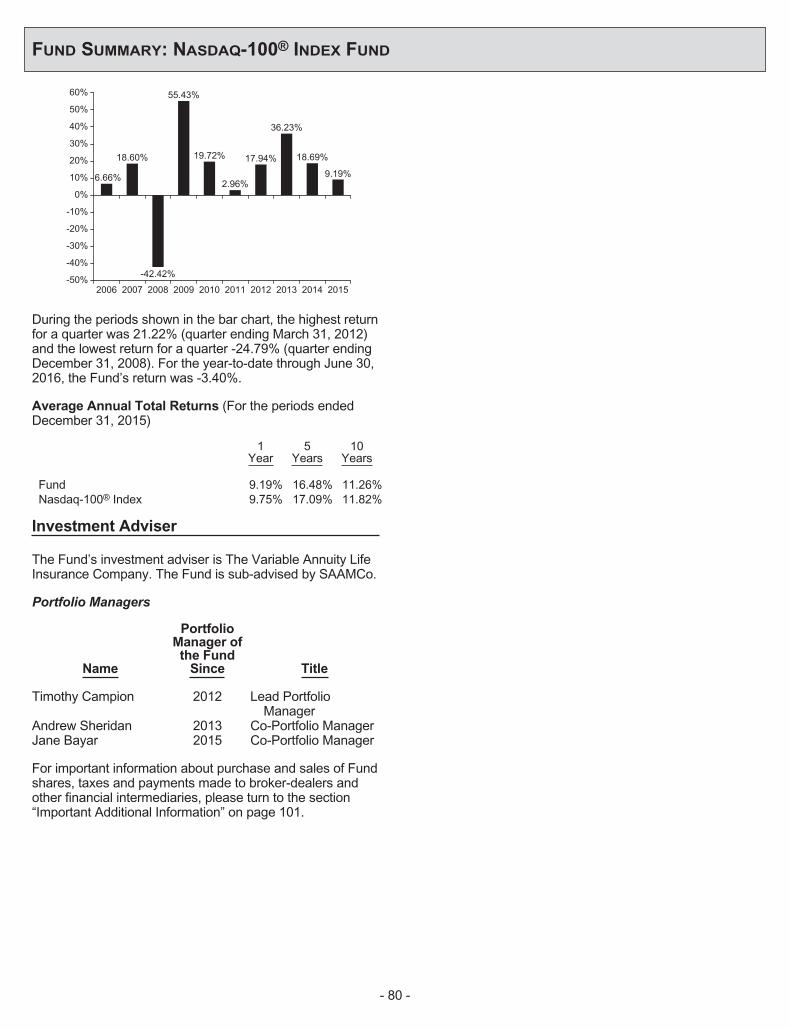
FUND SUMMARY: NASDAQ-100® INDEX FUND
2006 2007 2008 2009 2010 2011 2012 2013 20152014-50%
-40%
-30%
-20%
-10%
10%
0%
20%
30%
60%
50%
40%
6.66%
18.60%
-42.42%
55.43%
19.72%
2.96%
17.94%
36.23%
18.69%
9.19%
During the periods shown in the bar chart, the highest returnfor a quarter was 21.22% (quarter ending March 31, 2012)and the lowest return for a quarter -24.79% (quarter endingDecember 31, 2008). For the year-to-date through June 30,2016, the Fund’s return was -3.40%.
Average Annual Total Returns (For the periods endedDecember 31, 2015)
1Year
5Years
10Years
Fund 9.19% 16.48% 11.26%Nasdaq-100® Index 9.75% 17.09% 11.82%
Investment Adviser
The Fund’s investment adviser is The Variable Annuity LifeInsurance Company. The Fund is sub-advised by SAAMCo.
Portfolio Managers
Name
PortfolioManager ofthe Fund
Since Title
Timothy Campion 2012 Lead PortfolioManager
Andrew Sheridan 2013 Co-Portfolio ManagerJane Bayar 2015 Co-Portfolio Manager
For important information about purchase and sales of Fundshares, taxes and payments made to broker-dealers andother financial intermediaries, please turn to the section“Important Additional Information” on page 101.
- 80 -

FUND SUMMARY: SCIENCE & TECHNOLOGY FUND
Investment Objective
The Fund seeks long-term capital appreciation.
Fees and Expenses of the Fund
This table describes the fees and expenses that you maypay if you buy and hold shares of the Fund. The Fund’sannual operating expenses do not reflect the separateaccount fees charged in the variable annuity or variable lifeinsurance policy (“Variable Contracts”) in which the Fund isoffered. If a separate account’s fees were shown, theFund’s annual operating expenses would be higher. Pleasesee your Variable Contract prospectus for more details onthe separate account fees.
Annual Fund Operating Expenses (expenses that youpay each year as a percentage of the value of yourinvestment)
Management Fees 0.88%Other Expenses 0.11%Total Annual Fund Operating Expenses 0.99%
Expense Example
This Example is intended to help you compare the cost ofinvesting in the Fund with the cost of investing in othermutual funds. The Example assumes that you invest$10,000 in the Fund for the time periods indicated and thenredeem all of your shares at the end of those periods. TheExample also assumes that your investment has a 5%return each year and that the Fund’s operating expensesremain the same. The Example does not reflect chargesimposed by the Variable Contract. If the Variable Contractfees were reflected then the expenses would be higher. Seethe Variable Contract prospectus for information on suchcharges. Although your actual costs may be higher or lower,based on these assumptions and the net expenses shownin the fee table, your costs would be:
1 Year 3 Years 5 Years 10 Years
$101 $315 $547 $1,213
Portfolio Turnover
The Fund pays transaction costs, such as commissions,when it buys and sells securities (or “turns over” itsportfolio). These costs, which are not reflected in annualfund operating expenses or in the example, affect theFund’s performance. During the most recent fiscal year, theFund’s portfolio turnover rate was 107% of the averagevalue of its portfolio.
Principal Investment Strategies of the Fund
The Fund invests, under normal circumstances, at least80% of net assets in the common stocks of companies thatare expected to benefit from the development,advancement, and use of science and/or technology.
Investments may also include companies that shouldbenefit from technological advances even if they are notdirectly involved in research and development. The Fundmay invest in suitable technology companies through initialpublic offerings (“IPOs”), and a portion of the Fund’s returnsmay be attributable to the Fund’s investments in IPOs.There is no guarantee that as the Fund’s assets grow it willbe able to experience significant improvement inperformance by investing in IPOs.
The Fund may invest up to 50% of its total assets in foreignsecurities, which include non-dollar denominated securitiestraded outside the U.S. In addition, the Fund has the abilityto invest up to 30% of its total assets in companiesorganized or headquartered in emerging market countries,but no more than 20% of its total assets may be invested inany one emerging market country. The Fund may alsoinvest in privately placed securities.
The sub-advisers may engage in frequent and active tradingof portfolio securities to achieve the Fund’s investmentobjective.
In order to generate additional income, the Fund may lendportfolio securities to broker-dealers and other financialinstitutions provided that the value of the loaned securitiesdoes not exceed 30% of the Fund’s total assets. Theseloans earn income for the Fund and are collateralized bycash, securities issued or guaranteed by the U.S.Government or its agencies or instrumentalities, and suchother securities as the Fund and the securities lendingagent may agree upon. Investors will be given at least60 days’ written notice in advance of any change to theFund’s 80% investment policy set forth above.
Principal Risks of Investing in the Fund
There can be no assurance that the Fund’s investmentobjective will be met or that the net return on an investmentin the Fund will exceed what could have been obtainedthrough other investment or savings vehicles. Shares of theFund are not bank deposits and are not guaranteed orinsured by any bank, government entity or the FederalDeposit Insurance Corporation. As with any mutual fund,there is no guarantee that the Fund will be able to achieveits investment objective. If the value of the assets of theFund goes down, you could lose money.
The following is a summary of the principal risks of investingin the Fund.
Management Risk: The investment style or strategy usedby a sub-adviser may fail to produce the intended result. Asub-adviser’s assessment of a particular security orcompany may prove incorrect, resulting in losses orunderperformance.
Technology Sector Risk: Technology stocks historicallyhave experienced unusually wide price swings, both up anddown. The potential for wide variation in performancereflects the special risks common to companies in the
- 81 -

FUND SUMMARY: SCIENCE & TECHNOLOGY FUND
rapidly changing field of technology. For example, productsand services that at first appear promising may not prove tobe commercially successful or may become obsoletequickly. Earnings disappointments and intense competitionfor market share can result in sharp price declines.
Equity Securities Risk: The Fund invests principally inequity securities and is therefore subject to the risk thatstock prices will fall and may underperform other assetclasses. Individual stock prices fluctuate from day-to-dayand may decline significantly. The prices of individual stocksmay be negatively affected by poor company results orother factors affecting individual prices, as well as industryand/or economic trends and developments affectingindustries or the securities market as a whole.
Emerging Markets Risk: In addition to the risks associatedwith investments in foreign securities, emerging marketsecurities are subject to additional risks, which cause thesesecurities generally to be more volatile than securities ofissuers located in developed countries.
Currency Risk: Because the Fund’s foreign investmentsare generally held in foreign currencies, the Fund couldexperience gains or losses based solely on changes in theexchange rate between foreign currencies and the U.S.dollar. Such gains or losses may be substantial.
Foreign Investment Risk: Investment in foreign securitiesinvolves risks due to several factors, such as illiquidity, thelack of public information, changes in the exchange ratesbetween foreign currencies and the U.S. dollar, unfavorablepolitical, social and legal developments, or economic andfinancial instability. Foreign companies are not subject tothe U.S. accounting and financial reporting standards andmay have riskier settlement procedures. U.S. investmentsthat are denominated in foreign currencies or that are tradedin foreign markets, or securities of U.S. companies thathave significant foreign operations may be subject to foreigninvestment risk.
Geographic Risk: If the Fund invests a significant portion ofits assets in issuers located in a single country, a limitednumber of countries, or a particular geographic region, itassumes the risk that economic, political and socialconditions in those countries or that region may have asignificant impact on its investment performance.
IPO Risk: Share prices of newly-public companies mayfluctuate significantly over short periods of time.
Market Risk: The Fund’s share price can fall because ofweakness in the broad market, a particular industry, orspecific holdings or due to adverse political or economicdevelopments here or abroad, changes in investorpsychology, or heavy institutional selling. The price ofindividual securities may fluctuate, sometimes dramatically,from day-to-day. The prices of stocks and other equitysecurities tend to be more volatile than those of fixedincome securities.
Sector Risk: Companies with similar characteristics may begrouped together in broad categories called sectors. Sectorrisk is the risk that securities of companies within specificsectors of the economy can perform differently than theoverall market. This may be due to changes in such thingsas the regulatory or competitive environment or to changesin investor perceptions regarding a sector. Because theFund may allocate relatively more assets to certain sectorsthan others, the Fund’s performance may be moresusceptible to any developments which affect those sectorsemphasized by the Fund.
Securities Lending Risk: Engaging in securities lendingcould increase the market and credit risk for Fundinvestments. The Fund may lose money if it does notrecover borrowed securities, the value of the collateral falls,or the value of investments made with cash collateraldeclines. If the value of either the cash collateral or theFund’s investments of the cash collateral falls below theamount owed to a borrower, the Fund also may incur lossesthat exceed the amount it earned on lending the security.Securities lending also involves the risks of delay inreceiving additional collateral or possible loss of rights in thecollateral if the borrower fails. Another risk of securitieslending is the risk that the loaned portfolio securities maynot be available to the Fund on a timely basis and the Fundmay therefore lose the opportunity to sell the securities at adesirable price.
Privately Placed Securities Risk: The Fund’s investmentsmay also include privately placed securities, which aresubject to resale restrictions. These securities will have theeffect of increasing the level of Fund illiquidity to the extentthe Fund may be unable to sell or transfer these securitiesdue to restrictions on transfers or on the ability to findbuyers interested in purchasing the securities. The illiquidityof the market, as well as the lack of publicly availableinformation regarding these securities, may also adverselyaffect the ability to arrive at a fair value for certain securitiesat certain times and could make it difficult for the Fund tosell certain securities.
Mid-Cap Company Risk: Investing primarily in mid-capcompanies carries the risk that due to current marketconditions these companies may be out of favor withinvestors. Stocks of mid-cap companies may be morevolatile than those of larger companies due to, among otherreasons, narrower product lines, more limited financialresources and fewer experienced managers.
Small-Cap Company Risk: Investing primarily in small-capcompanies carries the risk that due to current marketconditions these companies may be out of favor withinvestors. Small companies often are in the early stages ofdevelopment with limited product lines, markets, or financialresources and managements lacking depth and experience,which may cause their stock prices to be more volatile thanthose of larger companies. Small company stocks may beless liquid yet subject to abrupt or erratic price movements.It may take a substantial period of time before the Fund
- 82 -
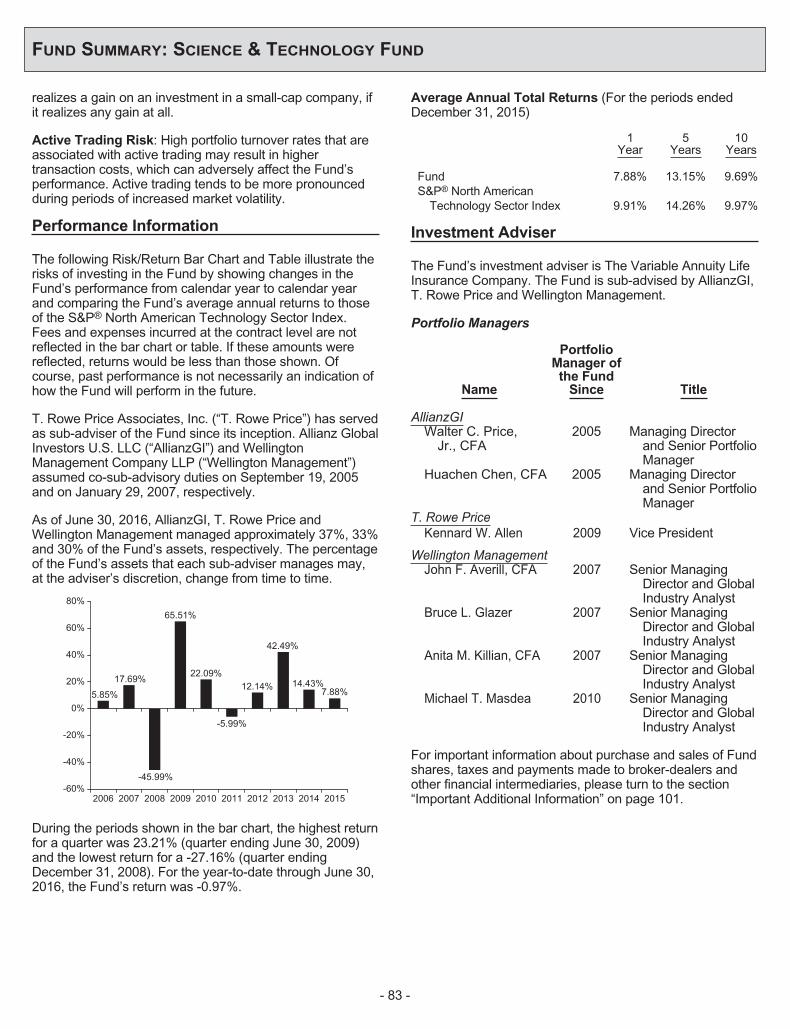
FUND SUMMARY: SCIENCE & TECHNOLOGY FUND
realizes a gain on an investment in a small-cap company, ifit realizes any gain at all.
Active Trading Risk: High portfolio turnover rates that areassociated with active trading may result in highertransaction costs, which can adversely affect the Fund’sperformance. Active trading tends to be more pronouncedduring periods of increased market volatility.
Performance Information
The following Risk/Return Bar Chart and Table illustrate therisks of investing in the Fund by showing changes in theFund’s performance from calendar year to calendar yearand comparing the Fund’s average annual returns to thoseof the S&P® North American Technology Sector Index.Fees and expenses incurred at the contract level are notreflected in the bar chart or table. If these amounts werereflected, returns would be less than those shown. Ofcourse, past performance is not necessarily an indication ofhow the Fund will perform in the future.
T. Rowe Price Associates, Inc. (“T. Rowe Price”) has servedas sub-adviser of the Fund since its inception. Allianz GlobalInvestors U.S. LLC (“AllianzGI”) and WellingtonManagement Company LLP (“Wellington Management”)assumed co-sub-advisory duties on September 19, 2005and on January 29, 2007, respectively.
As of June 30, 2016, AllianzGI, T. Rowe Price andWellington Management managed approximately 37%, 33%and 30% of the Fund’s assets, respectively. The percentageof the Fund’s assets that each sub-adviser manages may,at the adviser’s discretion, change from time to time.
2006 2007 2008 2009 2010 2011 2012 2013 2014 2015-60%
-40%
-20%
0%
20%
80%
60%
40%
5.85%
17.69%
-45.99%
65.51%
22.09%
-5.99%
12.14%
42.49%
14.43%7.88%
During the periods shown in the bar chart, the highest returnfor a quarter was 23.21% (quarter ending June 30, 2009)and the lowest return for a -27.16% (quarter endingDecember 31, 2008). For the year-to-date through June 30,2016, the Fund’s return was -0.97%.
Average Annual Total Returns (For the periods endedDecember 31, 2015)
1Year
5Years
10Years
Fund 7.88% 13.15% 9.69%S&P® North American
Technology Sector Index 9.91% 14.26% 9.97%
Investment Adviser
The Fund’s investment adviser is The Variable Annuity LifeInsurance Company. The Fund is sub-advised by AllianzGI,T. Rowe Price and Wellington Management.
Portfolio Managers
Name
PortfolioManager ofthe Fund
Since Title
AllianzGIWalter C. Price,
Jr., CFA2005 Managing Director
and Senior PortfolioManager
Huachen Chen, CFA 2005 Managing Directorand Senior PortfolioManager
T. Rowe PriceKennard W. Allen 2009 Vice President
Wellington ManagementJohn F. Averill, CFA 2007 Senior Managing
Director and GlobalIndustry Analyst
Bruce L. Glazer 2007 Senior ManagingDirector and GlobalIndustry Analyst
Anita M. Killian, CFA 2007 Senior ManagingDirector and GlobalIndustry Analyst
Michael T. Masdea 2010 Senior ManagingDirector and GlobalIndustry Analyst
For important information about purchase and sales of Fundshares, taxes and payments made to broker-dealers andother financial intermediaries, please turn to the section“Important Additional Information” on page 101.
- 83 -
FUND SUMMARY: SMALL CAP AGGRESSIVE GROWTH FUND
Investment Objective
The Fund seeks capital growth.
Fees and Expenses of the Fund
This table describes the fees and expenses that you maypay if you buy and hold shares of the Fund. The Fund’sannual operating expenses do not reflect the separateaccount fees charged in the variable annuity or variable lifeinsurance policy (“Variable Contracts”) in which the Fund isoffered. If a separate account’s fees were shown, theFund’s annual operating expenses would be higher. Pleasesee your Variable Contract prospectus for more details onthe separate account fees.
Annual Fund Operating Expenses (expenses that youpay each year as a percentage of the value of yourinvestment)
Management Fees 0.85%Other Expenses 0.16%Total Annual Fund Operating Expenses 1.01%Expense Reimbursement(1) 0.02%Total Annual Fund Operating Expenses After
Expense Reimbursement 0.99%
(1) The Fund’s investment adviser, The Variable Annuity LifeInsurance Company, has contractually agreed to reimburse theexpenses of the Fund through September 30, 2017, so that theFund’s Total Annual Fund Operating Expenses After ExpenseReimbursement do not exceed 0.99%. For purposes of theExpense Limitation Agreement, “Total Annual Fund OperatingExpenses” shall not include extraordinary expenses (i.e.expenses that are unusual in nature and/or infrequent inoccurrence, such as litigation), or acquired fund fees andexpenses, brokerage commissions and other transactionalexpenses relating to the purchase and sale of portfolio securities,interest, taxes and governmental fees, and other expenses notincurred in the ordinary course of the Fund’s business. ThisExpense Limitation Agreement will continue in effect from year toyear thereafter unless terminated by the Board of Directors priorto any such renewal.
Expense Example
This Example is intended to help you compare the cost ofinvesting in the Fund with the cost of investing in othermutual funds. The Example assumes that you invest$10,000 in the Fund for the time periods indicated and thenredeem all of your shares at the end of those periods. TheExample also assumes that your investment has a 5%return each year and that the Fund’s operating expensesinclude expense reimbursements for year one. TheExample does not reflect charges imposed by the VariableContract. If the Variable Contract fees were reflected thenthe expenses would be higher. See the Variable Contractprospectus for information on such charges. Although youractual costs may be higher or lower, based on theseassumptions and the net expenses shown in the fee table,your costs would be:
1 Year 3 Years 5 Years 10 Years
$101 $320 $556 $1,234
Portfolio Turnover
The Fund pays transaction costs, such as commissions,when it buys and sells securities (or “turns over” itsportfolio). These costs, which are not reflected in annualfund operating expenses or in the example, affect theFund’s performance. During the most recent fiscal year, theFund’s portfolio turnover rate was 101% of the averagevalue of its portfolio.
Principal Investment Strategies of the Fund
The Fund normally invests at least 80% of its net assets insmall-cap companies. The Fund considers a company to bea small-cap company if its market capitalization, at the timeof purchase, is equal to or less than the marketcapitalization of the largest company in the Russell 2000®
Index during the most recent 12-month period. As ofMay 27, 2016, the market capitalization range of thecompanies in the Russell 2000® Index was approximately$133 million to $3.8 billion. Some companies may outgrowthe definition of a small company after the Fund haspurchased their securities. These companies continue to beconsidered small for purposes of the Fund’s minimum 80%allocation to small company equities.
The Fund typically invests most of its assets in securities ofU.S. companies but may also invest a portion of its assets inforeign securities (up to 10% of net assets).
The sub-adviser may engage in active and frequent tradingof portfolio securities to achieve the Fund’s investmentobjective.
In order to generate additional income, the Fund may lendportfolio securities to broker-dealers and other financialinstitutions provided that the value of the loaned securitiesdoes not exceed 30% of the Fund’s total assets. Theseloans earn income for the Fund and are collateralized bycash, securities issued or guaranteed by the U.S.Government or its agencies or instrumentalities, and suchother securities as the Fund and the securities lendingagent may agree upon. Investors will be given at least60 days’ written notice in advance of any change to theFund’s 80% investment policy set forth above.
Principal Risks of Investing in the Fund
There can be no assurance that the Fund’s investmentobjective will be met or that the net return on an investmentin the Fund will exceed what could have been obtainedthrough other investment or savings vehicles. Shares of theFund are not bank deposits and are not guaranteed orinsured by any bank, government entity or the FederalDeposit Insurance Corporation. As with any mutual fund,there is no guarantee that the Fund will be able to achieveits investment objective. If the value of the assets of theFund goes down, you could lose money.
- 84 -

FUND SUMMARY: SMALL CAP AGGRESSIVE GROWTH FUND
The following is a summary of the principal risks of investingin the Fund.
Management Risk: The investment style or strategy usedby the sub-adviser may fail to produce the intended result.The sub-adviser’s assessment of a particular security orcompany may prove incorrect, resulting in losses orunderperformance.
Small-Cap Company Risk: Investing primarily in small-capcompanies carries the risk that due to current marketconditions these companies may be out of favor withinvestors. Small companies often are in the early stages ofdevelopment with limited product lines, markets, or financialresources and managements lacking depth and experience,which may cause their stock prices to be more volatile thanthose of larger companies. Small company stocks may beless liquid yet subject to abrupt or erratic price movements.It may take a substantial period of time before the Fundrealizes a gain on an investment in a small-cap company, ifit realizes any gain at all.
Active Trading Risk: High portfolio turnover rates that areassociated with active trading may result in highertransaction costs, which can adversely affect the Fund’sperformance. Active trading tends to be more pronouncedduring periods of increased market volatility.
Currency Risk: Because the Fund’s foreign investmentsare generally held in foreign currencies, the Fund couldexperience gains or losses based solely on changes in theexchange rate between foreign currencies and the U.S.dollar. Such gains or losses may be substantial.
Equity Securities Risk: The Fund invests principally inequity securities and is therefore subject to the risk thatstock prices will fall and may underperform other assetclasses. Individual stock prices fluctuate from day-to-dayand may decline significantly. The prices of individual stocksmay be negatively affected by poor company results orother factors affecting individual prices, as well as industryand/or economic trends and developments affectingindustries or the securities market as a whole.
Growth Style Risk: Generally, “growth” stocks are stocks ofcompanies that the sub-adviser believes have anticipatedearnings ranging from steady to accelerated growth. Manyinvestors buy growth stocks because of anticipated superiorearnings growth, but earnings disappointments often resultin sharp price declines. Growth companies usually invest ahigh portion of earnings in their own businesses so theirstocks may lack the dividends that can cushion share pricesin a down market. In addition, the value of fast growth stocksmay be more sensitive to changes in current or expectedearnings than the values of other stocks, because growthstocks trade at higher prices relative to current earnings.
Foreign Investment Risk: Investment in foreign securitiesinvolves risks due to several factors, such as illiquidity, thelack of public information, changes in the exchange ratesbetween foreign currencies and the U.S. dollar, unfavorable
political, social and legal developments, or economic andfinancial instability. Foreign companies are not subject tothe U.S. accounting and financial reporting standards andmay have riskier settlement procedures. U.S. investmentsthat are denominated in foreign currencies or that are tradedin foreign markets, or securities of U.S. companies thathave significant foreign operations may be subject to foreigninvestment risk.
Market Risk: The Fund’s share price can fall because ofweakness in the broad market, a particular industry, orspecific holdings or due to adverse political or economicdevelopments here or abroad, changes in investorpsychology, or heavy institutional selling. The price ofindividual securities may fluctuate, sometimes dramatically,from day-to-day. The prices of stocks and other equitysecurities tend to be more volatile than those of fixedincome securities.
Securities Lending Risk: Engaging in securities lendingcould increase the market and credit risk for Fundinvestments. The Fund may lose money if it does notrecover borrowed securities, the value of the collateral falls,or the value of investments made with cash collateraldeclines. If the value of either the cash collateral or theFund’s investments of the cash collateral falls below theamount owed to a borrower, the Fund also may incur lossesthat exceed the amount it earned on lending the security.Securities lending also involves the risks of delay inreceiving additional collateral or possible loss of rights in thecollateral if the borrower fails. Another risk of securitieslending is the risk that the loaned portfolio securities maynot be available to the Fund on a timely basis and the Fundmay therefore lose the opportunity to sell the securities at adesirable price.
Performance Information
The following Risk/Return Bar Chart and Table illustrate therisks of investing in the Fund by showing changes in theFund’s performance from calendar year to calendar yearand comparing the Fund’s average annual returns to thoseof the Russell 2000® Growth Index. Fees and expensesincurred at the contract level are not reflected in the barchart or table. If these amounts were reflected, returnswould be less than those shown. Of course, pastperformance is not necessarily an indication of how theFund will perform in the future.
From inception through November 6, 2006, Credit SuisseAsset Management, LLC was the sub-adviser of the Fund.From November 6, 2006 through August 19, 2011, WellsCapital Management Incorporated served as sub-adviser.RS Investment Management Co. LLC (“RS Investments”)served as sub-adviser since August 22, 2011. Upon theacquisition of RS Investments on July 29, 2016, Victory
- 85 -

FUND SUMMARY: SMALL CAP AGGRESSIVE GROWTH FUND
Capital Management Inc. (“Victory Capital”) assumedsub-advisory duties for the Fund.
2006 2007 2008 2009 2010 2011 2012 2013 20152014-50%
-40%
-30%
-20%
-10%
0%
10%
20%
30%
40%
50%
60%
4.80%
14.43%
53.10%
-40.57%
27.81%
49.73%
-10.21%
15.07%9.91%
1.50%
During the periods shown in the bar chart, the highest returnfor a quarter was 25.95% (quarter ending June 30, 2009)and the lowest return for a quarter -28.59% (quarter endingDecember 31, 2008). For the year-to-date through June 30,2016, the Fund’s return was -10.53%.
Average Annual Total Returns (For the periods endedDecember 31, 2015)
1Year
5Years
10Years
Fund 1.50% 11.53% 9.18%Russell 2000® Growth Index -1.38% 10.67% 7.95%
Investment Adviser
The Fund’s investment adviser is The Variable Annuity LifeInsurance Company. The Fund is sub-advised by VictoryCapital.
Portfolio Managers
Name
PortfolioManager ofthe Fund
Since Title
Stephen J. Bishop 2011 Portfolio ManagerMelissa Chadwick-Dunn 2011 Portfolio ManagerD. Scott Tracy, CFA 2011 Portfolio ManagerChristopher W. Clark,
CFA2014 Portfolio Manager
For important information about purchase and sales of Fundshares, taxes and payments made to broker-dealers andother financial intermediaries, please turn to the section“Important Additional Information” on page 101.
- 86 -
FUND SUMMARY: SMALL CAP FUND
Investment Objective
The Fund seeks to provide long-term capital growth byinvesting primarily in the stocks of small companies.
Fees and Expenses of the Fund
This table describes the fees and expenses that you maypay if you buy and hold shares of the Fund. The Fund’sannual operating expenses do not reflect the separateaccount fees charged in the variable annuity or variable lifeinsurance policy (“Variable Contracts”) in which the Fund isoffered. If a separate account’s fees were shown, theFund’s annual operating expenses would be higher. Pleasesee your Variable Contract prospectus for more details onthe separate account fees.
Annual Fund Operating Expenses (expenses that youpay each year as a percentage of the value of yourinvestment)
Management Fees 0.89%Other Expenses 0.12%Total Annual Fund Operating Expenses 1.01%Expense Reimbursement(1) 0.08%Total Annual Fund Operating Expenses After
Expense Reimbursement 0.93%
(1) The Fund’s investment adviser, The Variable Annuity LifeInsurance Company, has contractually agreed to reimburse theexpenses of the Fund through September 30, 2017, so that theFund’s Total Annual Fund Operating Expenses After ExpenseReimbursement do not exceed 0.93%. For purposes of theExpense Limitation Agreement, “Total Annual Fund OperatingExpenses” shall not include extraordinary expenses (i.e.expenses that are unusual in nature and/or infrequent inoccurrence, such as litigation), or acquired fund fees andexpenses, brokerage commissions and other transactionalexpenses relating to the purchase and sale of portfolio securities,interest, taxes and governmental fees, and other expenses notincurred in the ordinary course of the Fund’s business. ThisExpense Limitation Agreement will continue in effect from year toyear thereafter unless terminated by the Board of Directors priorto any such renewal.
Expense Example
This Example is intended to help you compare the cost ofinvesting in the Fund with the cost of investing in othermutual funds. The Example assumes that you invest$10,000 in the Fund for the time periods indicated and thenredeem all of your shares at the end of those periods. TheExample also assumes that your investment has a 5%return each year and that the Fund’s operating expensesinclude expense reimbursements for year one. TheExample does not reflect charges imposed by the VariableContract. If the Variable Contract fees were reflected thenthe expenses would be higher. See the Variable Contractprospectus for information on such charges. Although youractual costs may be higher or lower, based on theseassumptions and the net expenses shown in the fee table,your costs would be:
1 Year 3 Years 5 Years 10 Years
$95 $314 $550 $1,229
Portfolio Turnover
The Fund pays transaction costs, such as commissions,when it buys and sells securities (or “turns over” itsportfolio). These costs, which are not reflected in annualfund operating expenses or in the example, affect theFund’s performance. During the most recent fiscal year, theFund’s portfolio turnover rate was 29% of the average valueof its portfolio.
Principal Investment Strategies of the Fund
The Fund normally invests at least 80% of net assets instocks of small companies. A company is considered a“small” company if its total market value (capitalization), atthe time of purchase, falls (i) within or below the range ofcompanies in either the current Russell 2000® Index or theS&P SmallCap 600® Index or (ii) below the three-yearaverage maximum market cap of companies in either indexas of December 31 of the three preceding years. The Fundwill not automatically sell or cease to purchase stock of acompany it already owns just because the company’smarket capitalization grows or falls outside this range. TheRussell 2000® and S&P SmallCap 600® Indexes are widelyused benchmarks for small-cap stock performance. Themarket capitalization range and the composition of theRussell 2000® and S&P SmallCap 600® Indexes are subjectto change. If the companies in which the Fund invests aresuccessful, these companies may grow into mid- and large-cap companies.
The Fund may purchase stocks that have a marketcapitalization above the range if the companies appear tohave better prospects for capital appreciation. Stockselection may reflect a growth or a value investmentapproach or a combination of both.
In order to generate additional income, the Fund may lendportfolio securities to broker-dealers and other financialinstitutions provided that the value of the loaned securitiesdoes not exceed 30% of the Fund’s total assets. Theseloans earn income for the Fund and are collateralized bycash, securities issued or guaranteed by the U.S.Government or its agencies or instrumentalities, and suchother securities as the Fund and the securities lendingagent may agree upon. Investors will be given at least60 days’ written notice in advance of any change to theFund’s 80% investment policy set forth above.
Principal Risks of Investing in the Fund
There can be no assurance that the Fund’s investmentobjective will be met or that the net return on an investmentin the Fund will exceed what could have been obtainedthrough other investment or savings vehicles. Shares of theFund are not bank deposits and are not guaranteed orinsured by any bank, government entity or the FederalDeposit Insurance Corporation. As with any mutual fund,there is no guarantee that the Fund will be able to achieveits investment objective. If the value of the assets of theFund goes down, you could lose money.
- 87 -
FUND SUMMARY: SMALL CAP FUND
The following is a summary of the principal risks of investingin the Fund.
Management Risk: The investment style or strategy usedby a sub-adviser may fail to produce the intended result. Asub-adviser’s assessment of a particular security orcompany may prove incorrect, resulting in losses orunderperformance.
Small-Cap Company Risk: Investing primarily in small-capcompanies carries the risk that due to current marketconditions these companies may be out of favor withinvestors. Small companies often are in the early stages ofdevelopment with limited product lines, markets, or financialresources and managements lacking depth and experience,which may cause their stock prices to be more volatile thanthose of larger companies. Small company stocks may beless liquid yet subject to abrupt or erratic price movements.It may take a substantial period of time before the Fundrealizes a gain on an investment in a small-cap company, ifit realizes any gain at all.
Micro-Cap Company Risk: Micro-cap companies aregenerally subject to the same risks as small-cap companies.However, the prices of micro-cap companies are generallymore volatile. In addition, because micro-cap securities tendto have significantly lower trading volumes, the Fund mayhave difficulty selling holdings or may only be able to sellholdings at prices substantially lower than the subadviserbelieves they are worth. Therefore, the Fund may involveconsiderably more risk of loss and its returns may differsignificantly from funds investing in larger-cap companies orother asset classes. For more information about the risks ofinvesting in small-cap companies please see Small-CapCompany Risk above.
Equity Securities Risk: The Fund invests principally inequity securities and is therefore subject to the risk thatstock prices will fall and may underperform other assetclasses. Individual stock prices fluctuate from day-to-dayand may decline significantly. The prices of individual stocksmay be negatively affected by poor company results orother factors affecting individual prices, as well as industryand/or economic trends and developments affectingindustries or the securities market as a whole.
Market Risk: The Fund’s share price can fall because ofweakness in the broad market, a particular industry, orspecific holdings or due to adverse political or economicdevelopments here or abroad, changes in investorpsychology, or heavy institutional selling. The price ofindividual securities may fluctuate, sometimes dramatically,from day-to-day. The prices of stocks and other equitysecurities tend to be more volatile than those of fixedincome securities.
Securities Lending Risk: Engaging in securities lendingcould increase the market and credit risk for Fundinvestments. The Fund may lose money if it does not recoverborrowed securities, the value of the collateral falls, or thevalue of investments made with cash collateral declines. If the
value of either the cash collateral or the Fund’s investments ofthe cash collateral falls below the amount owed to a borrower,the Fund also may incur losses that exceed the amount itearned on lending the security. Securities lending alsoinvolves the risks of delay in receiving additional collateral orpossible loss of rights in the collateral if the borrower fails.Another risk of securities lending is the risk that the loanedportfolio securities may not be available to the Fund on atimely basis and the Fund may therefore lose the opportunityto sell the securities at a desirable price.
Growth Style Risk: Generally, “growth” stocks are stocksof companies that the sub-advisers believe have anticipatedearnings ranging from steady to accelerated growth. Manyinvestors buy growth stocks because of anticipated superiorearnings growth, but earnings disappointments often resultin sharp price declines. Growth companies usually invest ahigh portion of earnings in their own businesses so theirstocks may lack the dividends that can cushion share pricesin a down market. In addition, the value of fast growthstocks may be more sensitive to changes in current orexpected earnings than the values of other stocks, becausegrowth stocks trade at higher prices relative to currentearnings.
Value Style Risk: Generally, “value” stocks are stocks ofcompanies that they believe are currently undervalued inthe marketplace. A sub-adviser’s judgments that a particularsecurity is undervalued in relation to the company’sfundamental economic value may prove incorrect and theprice of the company’s stock may fall or may not approachthe value the sub-adviser has placed on it.
Performance Information
The following Risk/Return Bar Chart and Table illustrate therisks of investing in the Fund by showing changes in theFund’s performance from calendar year to calendar yearand comparing the Fund’s average annual returns to thoseof the Russell 2000® Index. Fees and expenses incurred atthe contract level are not reflected in the bar chart or table.If these amounts were reflected, returns would be less thanthose shown. Of course, past performance is notnecessarily an indication of how the Fund will perform in thefuture.
T. Rowe Price Associates, Inc. (“T. Rowe Price”) has servedas sub-adviser of the Fund since its inception. AmericanCentury Investment Management and Franklin PortfolioAssociate served as sub-advisers from June 21, 2004through March 7, 2008. Bridgeway Capital Management,Inc. (“Bridgeway”) became a sub-adviser on October 1,2006 and Invesco Advisers, Inc. (“Invesco”) became a sub-adviser on March 10, 2008.
As of June 30, 2016, Invesco, T. Rowe Price and Bridgewaymanaged approximately 59%, 31% and 11% of the Fund’sassets, respectively. The percentage of the Fund’s assetsthat each sub-adviser manages may, at the adviser’sdiscretion, change from time to time.
- 88 -

FUND SUMMARY: SMALL CAP FUND
2006 2007 2008 2009 2010 2011 2012 2013 20152014
8.41%4.00%
-6.20%
-34.25%
28.39%
40.42%
29.55%
-0.76%
15.85%
-40%
-30%
-20%
-10%
0%
10%
20%
30%
50%
40%
-4.78%
During the periods shown in the bar chart, the highest returnfor a quarter was 22.37% (quarter ending June 30, 2009)and the lowest return for a -25.47% (quarter endingDecember 31, 2008). For the year-to-date through June 30,2016, the Fund’s return was 1.96%.
Average Annual Total Returns (For the periods endedDecember 31, 2015)
1Year
5Years
10Years
Fund -4.78% 9.84% 5.92%Russell 2000® Index -4.41% 9.19% 6.80%
Investment Adviser
The Fund’s investment adviser is The Variable Annuity LifeInsurance Company. The Fund is sub-advised byBridgeway, Invesco and T. Rowe Price.
Portfolio Managers
Name
PortfolioManager ofthe Fund
Since Title
BridgewayJohn N.R.
Montgomery2006 Chief Investment
Officer, PortfolioManager
Elena Khoziaeva,CFA
2006 Portfolio Manager
Michael Whipple,CFA
2006 Portfolio Manager
Christine L. Wang,CFA
2010 Portfolio Manager
InvescoJuliet Ellis, CFA* 2008 Managing Director,
CIO of U.S. GrowthInvestmentManagement Unitand SeniorPortfolio Manager
Juan Hartsfield,CFA
2008 Portfolio Manager
Davis Paddock,CFA
2016 Portfolio Manager
T. Rowe PriceFrank M. Alonso 2016 Portfolio Manager
* Effective June 30, 2017, Juliet Ellis, the current LeadPortfolio Manager of the Fund, will transition out of herrole as portfolio manager and Juan Hartsfield will becomeLead Portfolio Manager for the portion of the FundSubadvised by Invesco.
For important information about purchase and sales of Fundshares, taxes and payments made to broker-dealers andother financial intermediaries, please turn to the section“Important Additional Information” on page 101.
- 89 -

FUND SUMMARY: SMALL CAP INDEX FUND
Investment Objective
The Fund seeks to provide growth of capital throughinvestment primarily in a diversified portfolio of commonstocks that, as a group, the sub-adviser believes mayprovide investment results closely corresponding to theperformance of the Russell 2000® Index (the “Index”).
Fees and Expenses of the Fund
This table describes the fees and expenses that you maypay if you buy and hold shares of the Fund. The Fund’sannual operating expenses do not reflect the separateaccount fees charged in the variable annuity or variable lifeinsurance policy (“Variable Contracts”) in which the Fund isoffered. If a separate account’s fees were shown, theFund’s annual operating expenses would be higher. Pleasesee your Variable Contract prospectus for more details onthe separate account fees.
Annual Fund Operating Expenses (expenses that youpay each year as a percentage of the value of yourinvestment)
Management Fees 0.30%Other Expenses 0.12%Total Annual Fund Operating Expenses 0.42%
Expense Example
This Example is intended to help you compare the cost ofinvesting in the Fund with the cost of investing in othermutual funds. The Example assumes that you invest$10,000 in the Fund for the time periods indicated and thenredeem all of your shares at the end of those periods. TheExample also assumes that your investment has a 5%return each year and that the Fund’s operating expensesremain the same. The Example does not reflect chargesimposed by the Variable Contract. If the Variable Contractfees were reflected then the expenses would be higher. Seethe Variable Contract prospectus for information on suchcharges. Although your actual costs may be higher or lower,based on these assumptions and the net expenses shownin the fee table, your costs would be:
1 Year 3 Years 5 Years 10 Years
$43 $135 $235 $530
Portfolio Turnover
The Fund pays transaction costs, such as commissions,when it buys and sells securities (or “turns over” itsportfolio). These costs, which are not reflected in annualfund operating expenses or in the example, affect theFund’s performance. During the most recent fiscal year, theFund’s portfolio turnover rate was 13% of the average valueof its portfolio.
Principal Investment Strategies of the Fund
The Fund is managed to seek to track the performance ofthe Index, which measures the performance of thoseRussell 2000 companies with higher price-to-book ratiosand higher forecasted growth values. The sub-adviser mayendeavor to track the Index by purchasing every stockincluded in the Index, in the same proportions. Or, in thealternative, the sub-adviser may invest in a sampling ofIndex stocks by utilizing a statistical technique known as“optimization.” The goal of optimization is to select stockswhich ensure that various industry weightings, marketcapitalizations, and fundamental characteristics (e.g., price-to-book, price-to-earnings, debt-to-asset ratios and dividendyields) closely approximate those of the Index.
The Fund invests, under normal circumstances, at least80% of net assets in stocks that are in the Index. Althoughthe Fund seeks to track the performance of the Index, theperformance of the Fund will not match that of the Indexexactly because, among other reasons, the Fund incursoperating expenses and other investment overhead as partof its normal operations.
In order to generate additional income, the Fund may lendportfolio securities to broker-dealers and other financialinstitutions provided that the value of the loaned securitiesdoes not exceed 30% of the Fund’s total assets. Theseloans earn income for the Fund and are collateralized bycash, securities issued or guaranteed by the U.S.Government or its agencies or instrumentalities, and suchother securities as the Fund and the securities lendingagent may agree upon. Investors will be given at least60 days’ written notice in advance of any change to theFund’s 80% investment policy set forth above.
Principal Risks of Investing in the Fund
There can be no assurance that the Fund’s investmentobjective will be met or that the net return on an investmentin the Fund will exceed what could have been obtainedthrough other investment or savings vehicles. Shares of theFund are not bank deposits and are not guaranteed orinsured by any bank, government entity or the FederalDeposit Insurance Corporation. As with any mutual fund,there is no guarantee that the Fund will be able to achieveits investment objective. If the value of the assets of theFund goes down, you could lose money.
The following is a summary of the principal risks of investingin the Fund.
Index Risk: In attempting to track the performance of theIndex, the Fund may be more susceptible to adversedevelopments concerning a particular security, company orindustry because the Fund generally will not use anydefensive strategies to mitigate its risk exposure.
Market Risk: The Fund’s share price can fall because ofweakness in the broad market, a particular industry, or
- 90 -

FUND SUMMARY: SMALL CAP INDEX FUND
specific holdings or due to adverse political or economicdevelopments here or abroad, changes in investorpsychology, or heavy institutional selling. The price ofindividual securities may fluctuate, sometimes dramatically,from day-to-day. The prices of stocks and other equitysecurities tend to be more volatile than those of fixedincome securities.
Equity Securities Risk: The Fund’s investments in equitysecurities are subject to the risk that stock prices will fall andmay underperform other asset classes. Individual stockprices fluctuate from day-to-day and may declinesignificantly. The prices of individual stocks may benegatively affected by poor company results or other factorsaffecting individual prices, as well as industry and/oreconomic trends and developments affecting industries orthe securities market as a whole.
Small-Cap Company Risk: Investing primarily in small-capcompanies carries the risk that due to current marketconditions these companies may be out of favor withinvestors. Small companies often are in the early stages ofdevelopment with limited product lines, markets, or financialresources and managements lacking depth and experience,which may cause their stock prices to be more volatile thanthose of larger companies. Small company stocks may beless liquid yet subject to abrupt or erratic price movements.It may take a substantial period of time before the Fundrealizes a gain on an investment in a small-cap company, ifit realizes any gain at all.
Securities Lending Risk: Engaging in securities lendingcould increase the market and credit risk for Fundinvestments. The Fund may lose money if it does notrecover borrowed securities, the value of the collateral falls,or the value of investments made with cash collateraldeclines. If the value of either the cash collateral or theFund’s investments of the cash collateral falls below theamount owed to a borrower, the Fund also may incur lossesthat exceed the amount it earned on lending the security.Securities lending also involves the risks of delay inreceiving additional collateral or possible loss of rights in thecollateral if the borrower fails. Another risk of securitieslending is the risk that the loaned portfolio securities maynot be available to the Fund on a timely basis and the Fundmay therefore lose the opportunity to sell the securities at adesirable price.
Performance Information
The following Risk/Return Bar Chart and Table illustrate therisks of investing in the Fund by showing changes in theFund’s performance from calendar year to calendar yearand comparing the Fund’s average annual returns to thoseof the Russell 2000® Index. Fees and expenses incurred atthe contract level are not reflected in the bar chart or table.If these amounts were reflected, returns would be less thanthose shown. Of course, past performance is notnecessarily an indication of how the Fund will perform in thefuture.
From January 1, 2002 through November 30, 2009,PineBridge Investments LLC (and its predecessors)(“PineBridge”) served as sub-adviser of the Fund. EffectiveDecember 1, 2009, SunAmerica Asset Management, LLC(“SAAMCo”) replaced PineBridge as sub-adviser of theFund.
2006 2007 2008 2009 2010 2011 2012 2013 20152014
18.06%
4.76%
-1.89%
-34.47%
28.22%
38.64%
26.55%
-4.30%
16.06%
-40%
-30%
-20%
-10%
0%
10%
20%
30%
50%
40%
-4.48%
During the periods shown in the bar chart, the highest returnfor a quarter was 21.42% (quarter ending June 30, 2009)and the lowest return for a -26.83% (quarter endingDecember 31, 2008). For the year-to-date through June 30,2016, the Fund’s return was 2.17%.
Average Annual Total Returns (For the periods endedDecember 31, 2015)
1Year
5Years
10Years
Fund -4.48% 9.03% 6.62%Russell 2000® Index -4.41% 9.19% 6.80%
Investment Adviser
The Fund’s investment adviser is The Variable Annuity LifeInsurance Company. The Fund is sub-advised by SAAMCo.
Portfolio Managers
Name
PortfolioManager of the
Fund Since Title
Timothy Campion 2012 Lead PortfolioManager
Andrew Sheridan 2013 Co-PortfolioManager
Jane Bayar 2015 Co-PortfolioManager
For important information about purchase and sales of Fundshares, taxes and payments made to broker-dealers andother financial intermediaries, please turn to the section“Important Additional Information” on page 101.
- 91 -

FUND SUMMARY: SMALL CAP SPECIAL VALUES FUND
Investment Objective
The Fund seeks to produce growth of capital by investingprimarily in common stocks.
Fees and Expenses of the Fund
This table describes the fees and expenses that you maypay if you buy and hold shares of the Fund. The Fund’sannual operating expenses do not reflect the separateaccount fees charged in the variable annuity or variable lifeinsurance policy (“Variable Contracts”) in which the Fund isoffered. If a separate account’s fees were shown, theFund’s annual operating expenses would be higher. Pleasesee your Variable Contract prospectus for more details onthe separate account fees.
Annual Fund Operating Expenses (expenses that youpay each year as a percentage of the value of yourinvestment)
Management Fees 0.75%Other Expenses 0.13%Total Annual Fund Operating Expenses 0.88%
Expense Example
This Example is intended to help you compare the cost ofinvesting in the Fund with the cost of investing in othermutual funds. The Example assumes that you invest$10,000 in the Fund for the time periods indicated and thenredeem all of your shares at the end of those periods. TheExample also assumes that your investment has a 5%return each year and that the Fund’s operating expensesremain the same. The Example does not reflect chargesimposed by the Variable Contract. If the Variable Contractfees were reflected then the expenses would be higher. Seethe Variable Contract prospectus for information on suchcharges. Although your actual costs may be higher or lower,based on these assumptions and the net expenses shownin the fee table, your costs would be:
1 Year 3 Years 5 Years 10 Years
$90 $281 $488 $1,084
Portfolio Turnover
The Fund pays transaction costs, such as commissions,when it buys and sells securities (or “turns over” itsportfolio). These costs, which are not reflected in annualfund operating expenses or in the example, affect theFund’s performance. During the most recent fiscal year, theFund’s portfolio turnover rate was 74% of the average valueof its portfolio.
Principal Investment Strategies of the Fund
Under normal market conditions, the Fund invests at least80% of its net assets in common stocks of domestic small-cap companies. Generally, small-cap companies will include
companies whose market capitalizations, at the time ofpurchase, are equal to or less than the market capitalizationof the largest company in the Russell 2000® Index duringthe most recent 12-month period. As of May 27, 2016, themarket capitalization range of the companies in theRussell 2000® Index was $133 million to $3.8 billion.
The sub-advisers look for significantly undervaluedcompanies that they believe have the potential for above-average appreciation with below-average risk.
In order to generate additional income, the Fund may lendportfolio securities to broker-dealers and other financialinstitutions provided that the value of the loaned securitiesdoes not exceed 30% of the Fund’s total assets. Theseloans earn income for the Fund and are collateralized bycash, securities issued or guaranteed by the U.S.Government or its agencies or instrumentalities, and suchother securities as the Fund and the securities lendingagent may agree upon. Investors will be given at least60 days’ written notice in advance of any change to theFund’s 80% investment policy set forth above.
Principal Risks of Investing in the Fund
There can be no assurance that the Fund’s investmentobjective will be met or that the net return on an investmentin the Fund will exceed what could have been obtainedthrough other investment or savings vehicles. Shares of theFund are not bank deposits and are not guaranteed orinsured by any bank, government entity or the FederalDeposit Insurance Corporation. As with any mutual fund,there is no guarantee that the Fund will be able to achieveits investment objective. If the value of the assets of theFund goes down, you could lose money.
The following is a summary of the principal risks of investingin the Fund.
Management Risk: The investment style or strategy usedby the sub-adviser may fail to produce the intended result.The sub-advisers’ assessment of a particular security orcompany may prove incorrect, resulting in losses orunderperformance.
Equity Securities Risk: The Fund invests principally inequity securities and is therefore subject to the risk thatstock prices will fall and may underperform other assetclasses. Individual stock prices fluctuate from day-to-dayand may decline significantly. The prices of individual stocksmay be negatively affected by poor company results orother factors affecting individual prices, as well as industryand/or economic trends and developments affectingindustries or the securities market as a whole.
Small-Cap Company Risk: Investing primarily in small-capcompanies carries the risk that due to current marketconditions these companies may be out of favor withinvestors. Small companies often are in the early stages ofdevelopment with limited product lines, markets, or financialresources and managements lacking depth and experience,
- 92 -
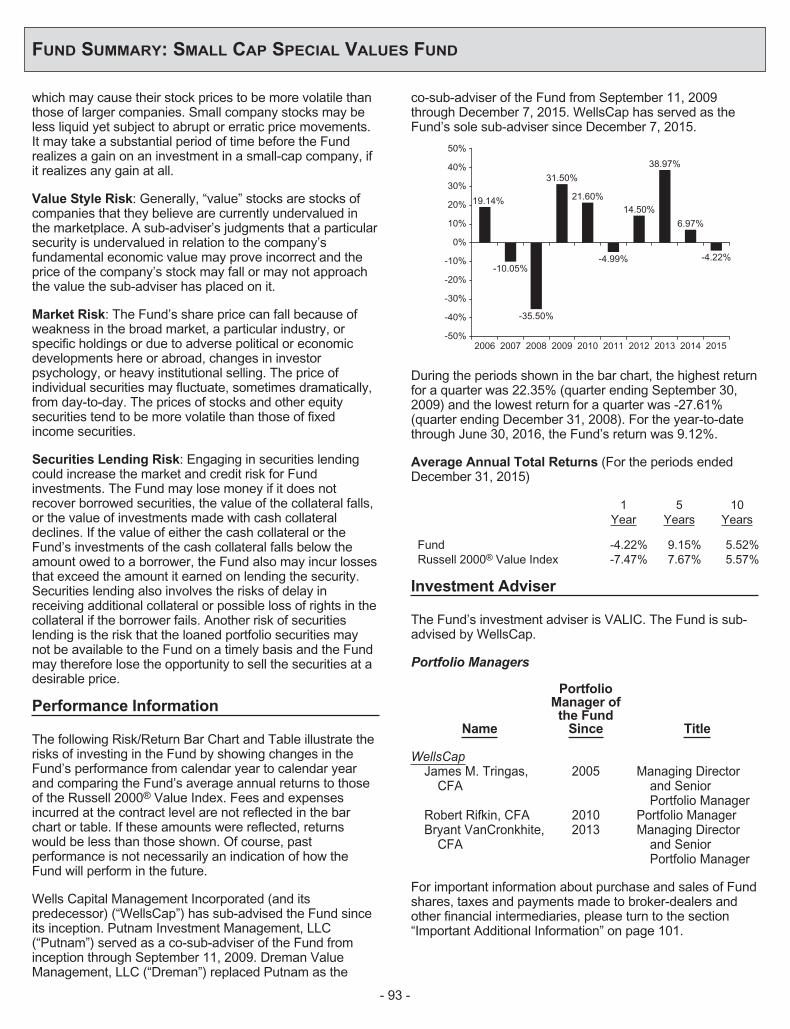
FUND SUMMARY: SMALL CAP SPECIAL VALUES FUND
which may cause their stock prices to be more volatile thanthose of larger companies. Small company stocks may beless liquid yet subject to abrupt or erratic price movements.It may take a substantial period of time before the Fundrealizes a gain on an investment in a small-cap company, ifit realizes any gain at all.
Value Style Risk: Generally, “value” stocks are stocks ofcompanies that they believe are currently undervalued inthe marketplace. A sub-adviser’s judgments that a particularsecurity is undervalued in relation to the company’sfundamental economic value may prove incorrect and theprice of the company’s stock may fall or may not approachthe value the sub-adviser has placed on it.
Market Risk: The Fund’s share price can fall because ofweakness in the broad market, a particular industry, orspecific holdings or due to adverse political or economicdevelopments here or abroad, changes in investorpsychology, or heavy institutional selling. The price ofindividual securities may fluctuate, sometimes dramatically,from day-to-day. The prices of stocks and other equitysecurities tend to be more volatile than those of fixedincome securities.
Securities Lending Risk: Engaging in securities lendingcould increase the market and credit risk for Fundinvestments. The Fund may lose money if it does notrecover borrowed securities, the value of the collateral falls,or the value of investments made with cash collateraldeclines. If the value of either the cash collateral or theFund’s investments of the cash collateral falls below theamount owed to a borrower, the Fund also may incur lossesthat exceed the amount it earned on lending the security.Securities lending also involves the risks of delay inreceiving additional collateral or possible loss of rights in thecollateral if the borrower fails. Another risk of securitieslending is the risk that the loaned portfolio securities maynot be available to the Fund on a timely basis and the Fundmay therefore lose the opportunity to sell the securities at adesirable price.
Performance Information
The following Risk/Return Bar Chart and Table illustrate therisks of investing in the Fund by showing changes in theFund’s performance from calendar year to calendar yearand comparing the Fund’s average annual returns to thoseof the Russell 2000® Value Index. Fees and expensesincurred at the contract level are not reflected in the barchart or table. If these amounts were reflected, returnswould be less than those shown. Of course, pastperformance is not necessarily an indication of how theFund will perform in the future.
Wells Capital Management Incorporated (and itspredecessor) (“WellsCap”) has sub-advised the Fund sinceits inception. Putnam Investment Management, LLC(“Putnam”) served as a co-sub-adviser of the Fund frominception through September 11, 2009. Dreman ValueManagement, LLC (“Dreman”) replaced Putnam as the
co-sub-adviser of the Fund from September 11, 2009through December 7, 2015. WellsCap has served as theFund’s sole sub-adviser since December 7, 2015.
2006 2007 2008 2009 2010 2011 2012 2013 2015-50%
-40%
-30%
-20%
-10%
0%
10%
20%
30%
40%
50%
19.14%
-10.05%
31.50%
-35.50%
21.60%
-4.99%
14.50%
38.97%
-4.22%
2014
6.97%
During the periods shown in the bar chart, the highest returnfor a quarter was 22.35% (quarter ending September 30,2009) and the lowest return for a quarter was -27.61%(quarter ending December 31, 2008). For the year-to-datethrough June 30, 2016, the Fund’s return was 9.12%.
Average Annual Total Returns (For the periods endedDecember 31, 2015)
1Year
5Years
10Years
Fund -4.22% 9.15% 5.52%Russell 2000® Value Index -7.47% 7.67% 5.57%
Investment Adviser
The Fund’s investment adviser is VALIC. The Fund is sub-advised by WellsCap.
Portfolio Managers
Name
PortfolioManager ofthe Fund
Since Title
WellsCapJames M. Tringas,
CFA2005 Managing Director
and SeniorPortfolio Manager
Robert Rifkin, CFA 2010 Portfolio ManagerBryant VanCronkhite,
CFA2013 Managing Director
and SeniorPortfolio Manager
For important information about purchase and sales of Fundshares, taxes and payments made to broker-dealers andother financial intermediaries, please turn to the section“Important Additional Information” on page 101.
- 93 -

FUND SUMMARY: SMALL-MID GROWTH FUND
Investment Objective
The Fund seeks capital growth by investing primarily incommon stocks.
Fees and Expenses of the Fund
This table describes the fees and expenses that you maypay if you buy and hold shares of the Fund. The Fund’sannual operating expenses do not reflect the separateaccount fees charged in the variable annuity or variable lifeinsurance policy (“Variable Contracts”) in which the Fund isoffered. If a separate account’s fees were shown, theFund’s annual operating expenses would be higher. Pleasesee your Variable Contract prospectus for more details onthe separate account fees.
Annual Fund Operating Expenses (expenses that youpay each year as a percentage of the value of yourinvestment)
Management Fees 0.85%Other Expenses 0.15%Total Annual Fund Operating Expenses 1.00%
Expense Example
This Example is intended to help you compare the cost ofinvesting in the Fund with the cost of investing in othermutual funds. The Example assumes that you invest$10,000 in the Fund for the time periods indicated and thenredeem all of your shares at the end of those periods. TheExample also assumes that your investment has a 5%return each year and that the Fund’s operating expensesremain the same. The Example does not reflect chargesimposed by the Variable Contract. If the Variable Contractfees were reflected then the expenses would be higher. Seethe Variable Contract prospectus for information on suchcharges. Although your actual costs may be higher or lower,based on these assumptions and the net expenses shownin the fee table, your costs would be:
1 Year 3 Years 5 Years 10 Years
$102 $318 $552 1,225
Portfolio Turnover
The Fund pays transaction costs, such as commissions,when it buys and sells securities (or “turns over” itsportfolio). These costs, which are not reflected in annualfund operating expenses or in the example, affect theFund’s performance. During the most recent fiscal year, theFund’s portfolio turnover rate was 64% of the average valueof its portfolio.
Principal Investment Strategies of the Fund
The Fund pursues its investment objective by investingprimarily in common stocks selected for their growthpotential. In pursuing that objective, under normalcircumstances, the Fund invests at least 80% of its netassets in equity securities of small- and mid-cap companieslocated in domestic (U.S.) markets.
Generally, small- and mid-cap companies includecompanies whose market capitalizations, at the time ofpurchase, are within the range of the market capitalizationsof companies constituting the Russell 2000® Growth Indexand the Russell Midcap® Growth Index. If the marketcapitalization of a company held by the Fund subsequentlymoves outside of this range, the Fund is not required to sellthe company’s securities. As of June 30, 2016, the marketcapitalization ranges of companies in the Russell 2000®
Growth Index and the Russell Midcap® Growth Index werebetween $14.5 million and $4.1 billion and $239 million and$27 billion, respectively.
In order to generate additional income, the Fund may lendportfolio securities to broker-dealers and other financialinstitutions provided that the value of the loaned securitiesdoes not exceed 30% of the Fund’s total assets. Theseloans earn income for the Fund and are collateralized bycash, securities issued or guaranteed by the U.S.Government or its agencies or instrumentalities, and suchother securities as the Fund and the securities lendingagent may agree upon. Investors will be given at least60 days’ written notice in advance of any change to theFund’s 80% investment policy set forth above.
Principal Risks of Investing in the Fund
There can be no assurance that the Fund’s investmentobjective will be met or that the net return on an investmentin the Fund will exceed what could have been obtainedthrough other investment or savings vehicles. Shares of theFund are not bank deposits and are not guaranteed orinsured by any bank, government entity or the FederalDeposit Insurance Corporation. As with any mutual fund,there is no guarantee that the Fund will be able to achieveits investment objective. If the value of the assets of theFund goes down, you could lose money.
The following is a summary of the principal risks of investingin the Fund.
Management Risk: The investment style or strategy usedby the sub-adviser may fail to produce the intended result.The sub-adviser’s assessment of a particular security orcompany may prove incorrect, resulting in losses orunderperformance.
Equity Securities Risk: The Fund invests primarily inequity securities and is therefore subject to the risk thatstock prices will fall and may underperform other assetclasses. Individual stock prices fluctuate from day-to-dayand may decline significantly. The prices of individual stocksmay be negatively affected by poor company results orother factors affecting individual prices, as well as industryand/or economic trends and developments affectingindustries or the securities market as a whole.
Growth Style Risk: Generally, “growth” stocks are stocks ofcompanies that the sub-adviser believes have anticipatedearnings ranging from steady to accelerated growth. Manyinvestors buy growth stocks because of anticipated superiorearnings growth, but earnings disappointments often result insharp price declines. Growth companies usually invest a highportion of earnings in their own businesses so their stocks
- 94 -
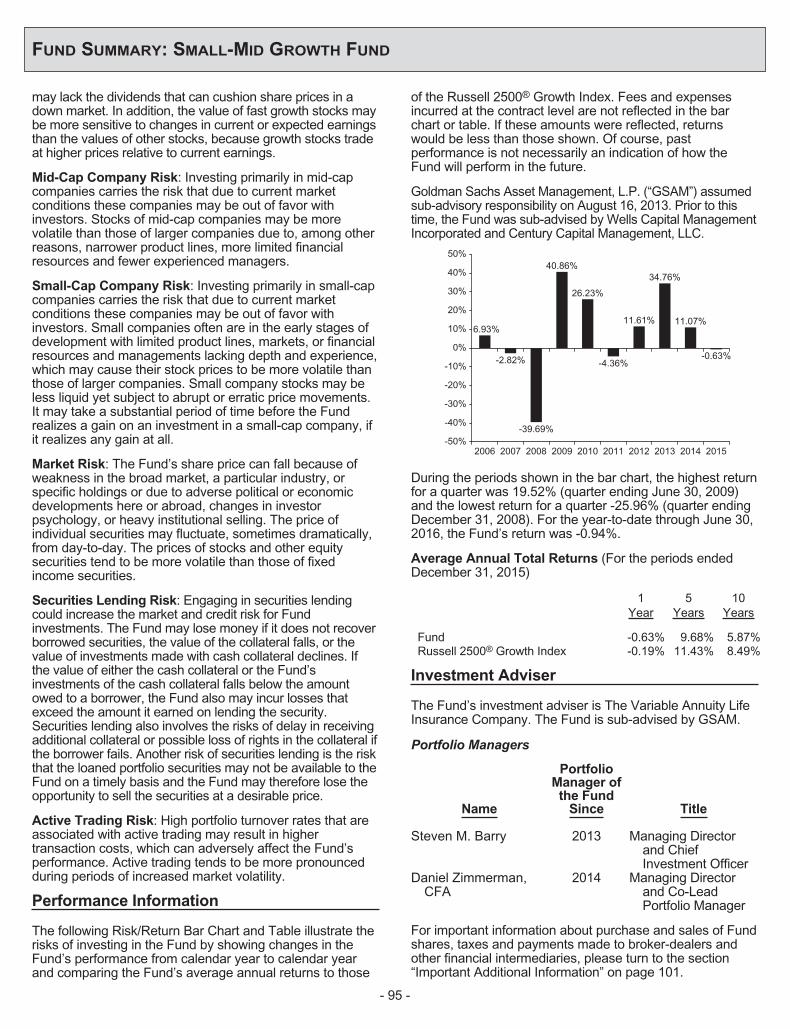
FUND SUMMARY: SMALL-MID GROWTH FUND
may lack the dividends that can cushion share prices in adown market. In addition, the value of fast growth stocks maybe more sensitive to changes in current or expected earningsthan the values of other stocks, because growth stocks tradeat higher prices relative to current earnings.
Mid-Cap Company Risk: Investing primarily in mid-capcompanies carries the risk that due to current marketconditions these companies may be out of favor withinvestors. Stocks of mid-cap companies may be morevolatile than those of larger companies due to, among otherreasons, narrower product lines, more limited financialresources and fewer experienced managers.
Small-Cap Company Risk: Investing primarily in small-capcompanies carries the risk that due to current marketconditions these companies may be out of favor withinvestors. Small companies often are in the early stages ofdevelopment with limited product lines, markets, or financialresources and managements lacking depth and experience,which may cause their stock prices to be more volatile thanthose of larger companies. Small company stocks may beless liquid yet subject to abrupt or erratic price movements.It may take a substantial period of time before the Fundrealizes a gain on an investment in a small-cap company, ifit realizes any gain at all.
Market Risk: The Fund’s share price can fall because ofweakness in the broad market, a particular industry, orspecific holdings or due to adverse political or economicdevelopments here or abroad, changes in investorpsychology, or heavy institutional selling. The price ofindividual securities may fluctuate, sometimes dramatically,from day-to-day. The prices of stocks and other equitysecurities tend to be more volatile than those of fixedincome securities.
Securities Lending Risk: Engaging in securities lendingcould increase the market and credit risk for Fundinvestments. The Fund may lose money if it does not recoverborrowed securities, the value of the collateral falls, or thevalue of investments made with cash collateral declines. Ifthe value of either the cash collateral or the Fund’sinvestments of the cash collateral falls below the amountowed to a borrower, the Fund also may incur losses thatexceed the amount it earned on lending the security.Securities lending also involves the risks of delay in receivingadditional collateral or possible loss of rights in the collateral ifthe borrower fails. Another risk of securities lending is the riskthat the loaned portfolio securities may not be available to theFund on a timely basis and the Fund may therefore lose theopportunity to sell the securities at a desirable price.
Active Trading Risk: High portfolio turnover rates that areassociated with active trading may result in highertransaction costs, which can adversely affect the Fund’sperformance. Active trading tends to be more pronouncedduring periods of increased market volatility.
Performance Information
The following Risk/Return Bar Chart and Table illustrate therisks of investing in the Fund by showing changes in theFund’s performance from calendar year to calendar yearand comparing the Fund’s average annual returns to those
of the Russell 2500® Growth Index. Fees and expensesincurred at the contract level are not reflected in the barchart or table. If these amounts were reflected, returnswould be less than those shown. Of course, pastperformance is not necessarily an indication of how theFund will perform in the future.
Goldman Sachs Asset Management, L.P. (“GSAM”) assumedsub-advisory responsibility on August 16, 2013. Prior to thistime, the Fund was sub-advised by Wells Capital ManagementIncorporated and Century Capital Management, LLC.
2006 2007 2008 2009 2010 2011 2012 2013 2015
6.93%
-2.82%
-39.69%
40.86%
26.23%
-4.36%
11.61%
34.76%
-50%
-40%
-30%
-20%
-10%
0%
10%
20%
30%
40%
50%
-0.63%
2014
11.07%
During the periods shown in the bar chart, the highest returnfor a quarter was 19.52% (quarter ending June 30, 2009)and the lowest return for a quarter -25.96% (quarter endingDecember 31, 2008). For the year-to-date through June 30,2016, the Fund’s return was -0.94%.
Average Annual Total Returns (For the periods endedDecember 31, 2015)
1Year
5Years
10Years
Fund -0.63% 9.68% 5.87%Russell 2500® Growth Index -0.19% 11.43% 8.49%
Investment Adviser
The Fund’s investment adviser is The Variable Annuity LifeInsurance Company. The Fund is sub-advised by GSAM.
Portfolio Managers
Name
PortfolioManager ofthe Fund
Since Title
Steven M. Barry 2013 Managing Directorand ChiefInvestment Officer
Daniel Zimmerman,CFA
2014 Managing Directorand Co-LeadPortfolio Manager
For important information about purchase and sales of Fundshares, taxes and payments made to broker-dealers andother financial intermediaries, please turn to the section“Important Additional Information” on page 101.
- 95 -

FUND SUMMARY: STOCK INDEX FUND
Investment Objective
The Fund seeks long-term capital growth throughinvestment in common stocks that, as a group, areexpected to provide investment results closelycorresponding to the performance of the S&P 500® Index(the “Index”).
Fees and Expenses of the Fund
This table describes the fees and expenses that you maypay if you buy and hold shares of the Fund. The Fund’sannual operating expenses do not reflect the separateaccount fees charged in the variable annuity or variable lifeinsurance policy (“Variable Contracts”) in which the Fund isoffered. If a separate account’s fees were shown, theFund’s annual operating expenses would be higher. Pleasesee your Variable Contract prospectus for more details onthe separate account fees.
Annual Fund Operating Expenses (expenses that youpay each year as a percentage of the value of yourinvestment)
Management Fees 0.25%Other Expenses 0.10%Total Annual Fund Operating Expenses 0.35%
Expense Example
This Example is intended to help you compare the cost ofinvesting in the Fund with the cost of investing in othermutual funds. The Example assumes that you invest$10,000 in the Fund for the time periods indicated and thenredeem all of your shares at the end of those periods. TheExample also assumes that your investment has a 5%return each year and that the Fund’s operating expensesremain the same. The Example does not reflect chargesimposed by the Variable Contract. If the Variable Contractfees were reflected then the expenses would be higher. Seethe Variable Contract prospectus for information on suchcharges. Although your actual costs may be higher or lower,based on these assumptions and the net expenses shownin the fee table, your costs would be:
1 Year 3 Years 5 Years 10 Years
$36 $113 $197 $443
Portfolio Turnover
The Fund pays transaction costs, such as commissions,when it buys and sells securities (or “turns over” itsportfolio). These costs, which are not reflected in annualfund operating expenses or in the example, affect theFund’s performance. During the most recent fiscal year, theFund’s portfolio turnover rate was 3% of the average valueof its portfolio.
Principal Investment Strategies of the Fund
The Fund is managed to seek to track the performance ofthe Index, which measures the stock performance of 500large- and mid-cap companies and is often used to indicatethe performance of the overall stock market. The sub-adviser may endeavor to track the Index by purchasingevery stock included in the Index, in the same proportions.Or, in the alternative, the sub-adviser may invest in asampling of Index stocks by utilizing a statistical techniqueknown as “optimization.” The goal of optimization is to selectstocks which ensure that various industry weightings,market capitalizations, and fundamental characteristics,(e.g., price-to-book, price-to-earnings, debt-to-asset ratiosand dividend yields) closely approximate those of the Index.
The Fund invests, under normal circumstances, at least80% of net assets in stocks that are in the Index. Althoughthe Fund seeks to track the performance of the Index, theperformance of the Fund will not match that of the Indexexactly because, among other reasons, the Fund incursoperating expenses and other investment overhead as partof its normal operations.
In order to generate additional income, the Fund may lendportfolio securities to broker-dealers and other financialinstitutions provided that the value of the loaned securitiesdoes not exceed 30% of the Fund’s total assets. Theseloans earn income for the Fund and are collateralized bycash, securities issued or guaranteed by the U.S.Government or its agencies or instrumentalities, and suchother securities as the Fund and the securities lendingagent may agree upon. Investors will be given at least60 days’ written notice in advance of any change to theFund’s 80% investment policy set forth above.
Principal Risks of Investing in the Fund
There can be no assurance that the Fund’s investmentobjective will be met or that the net return on an investmentin the Fund will exceed what could have been obtainedthrough other investment or savings vehicles. Shares of theFund are not bank deposits and are not guaranteed orinsured by any bank, government entity or the FederalDeposit Insurance Corporation. As with any mutual fund,there is no guarantee that the Fund will be able to achieveits investment objective. If the value of the assets of theFund goes down, you could lose money.
The following is a summary of the principal risks of investingin the Fund.
Index Risk: In attempting to track the performance of theIndex, the Fund may be more susceptible to adversedevelopments concerning a particular security, company orindustry because the Fund generally will not use anydefensive strategies to mitigate its risk exposure.
- 96 -

FUND SUMMARY: STOCK INDEX FUND
Equity Securities Risk: The Fund invests primarily inequity securities and is therefore subject to the risk thatstock prices will fall and may underperform other assetclasses. Individual stock prices fluctuate from day-to-dayand may decline significantly. The prices of individual stocksmay be negatively affected by poor company results orother factors affecting individual prices, as well as industryand/or economic trends and developments affectingindustries or the securities market as a whole.
Large- and Mid-Cap Company Risk: Investing primarily inlarge-cap and mid-cap companies carries the risk that dueto current market conditions these companies may be out offavor with investors. Large-cap companies may be unableto respond quickly to new competitive challenges or attainthe high growth rate of successful smaller companies.Stocks of mid-cap companies may be more volatile thanthose of larger companies due to, among other reasons,narrower product lines, more limited financial resources andfewer experienced managers.
Market Risk: The Fund’s share price can fall because ofweakness in the broad market, a particular industry, orspecific holdings or due to adverse political or economicdevelopments here or abroad, changes in investorpsychology, or heavy institutional selling. The price ofindividual securities may fluctuate, sometimes dramatically,from day-to-day. The prices of stocks and other equitysecurities tend to be more volatile than those of fixedincome securities.
Securities Lending Risk: Engaging in securities lendingcould increase the market and credit risk for Fundinvestments. The Fund may lose money if it does notrecover borrowed securities, the value of the collateral falls,or the value of investments made with cash collateraldeclines. If the value of either the cash collateral or theFund’s investments of the cash collateral falls below theamount owed to a borrower, the Fund also may incur lossesthat exceed the amount it earned on lending the security.Securities lending also involves the risks of delay inreceiving additional collateral or possible loss of rights in thecollateral if the borrower fails. Another risk of securitieslending is the risk that the loaned portfolio securities maynot be available to the Fund on a timely basis and the Fundmay therefore lose the opportunity to sell the securities at adesirable price.
Performance Information
The following Risk/Return Bar Chart and Table illustrate therisks of investing in the Fund by showing changes in theFund’s performance from calendar year to calendar yearand comparing the Fund’s average annual returns to thoseof the S&P 500® Index. Fees and expenses incurred at thecontract level are not reflected in the bar chart or table. Ifthese amounts were reflected, returns would be less thanthose shown. Of course, past performance is notnecessarily an indication of how the Fund will perform in thefuture.
From January 1, 2002 through November 30, 2009,PineBridge Investments LLC (and its predecessors)(“PineBridge”) served as sub-adviser of the Fund. EffectiveDecember 1, 2009, SunAmerica Asset Management, LLC(“SAAMCo”) replaced PineBridge as sub-adviser of theFund.
2006 2007 2008 2009 2010 2011 2012 2013 20152014
15.41%
1.05%5.13%
-37.21%
26.16%31.92%
14.69%
1.82%
15.58%
-50%
-40%
-30%
-20%
-10%
0%
10%
20%
30%
40%
13.28%
During the periods shown in the bar chart, the highest returnfor a quarter was 16.52% (quarter ending June 30, 2009)and the lowest return for a -22.03% (quarter endingDecember 31, 2008). For the year-to-date through June 30,2016, the Fund’s return was 3.67%.
Average Annual Total Returns (For the periods endedDecember 31, 2015)
1Year
5Years
10Years
Fund 1.05% 12.19% 6.96%S&P 500® Index 1.38% 12.57% 7.31%
Investment Adviser
The Fund’s investment adviser is The Variable Annuity LifeInsurance Company. The Fund is sub-advised by SAAMCo.
Portfolio Managers
Name
PortfolioManager of the
Fund Since Title
Timothy Campion 2012 Lead PortfolioManager
Andrew Sheridan 2013 Co-PortfolioManager
Jane Bayar 2015 Co-PortfolioManager
For important information about purchase and sales of Fundshares, taxes and payments made to broker-dealers andother financial intermediaries, please turn to the section“Important Additional Information” on page 101.
- 97 -
FUND SUMMARY: VALUE FUND
Investment Objective
The Fund seeks long-term total return, which consists ofcapital appreciation and income.
Fees and Expenses of the Fund
This table describes the fees and expenses that you maypay if you buy and hold shares of the Fund. The Fund’sannual operating expenses do not reflect the separateaccount fees charged in the variable annuity or variable lifeinsurance policy (“Variable Contracts”) in which the Fund isoffered. If a separate account’s fees were shown, theFund’s annual operating expenses would be higher. Pleasesee your Variable Contract prospectus for more details onthe separate account fees.
Annual Fund Operating Expenses (expenses that youpay each year as a percentage of the value of yourinvestment)
Management Fees 0.78%Other Expenses 0.15%Total Annual Fund Operating Expenses 0.93%Expense Reimbursement(1) 0.08%Total Annual Fund Operating Expenses After
Expense Reimbursement0.85%
(1) The Fund’s investment adviser, The Variable Annuity LifeInsurance Company, has contractually agreed to reimburse theexpenses of the Fund through September 30, 2017, so that theFund’s Total Annual Fund Operating Expenses After ExpenseReimbursement do not exceed 0.85%. For purposes of theExpense Limitation Agreement, “Total Annual Fund OperatingExpenses” shall not include extraordinary expenses (i.e.expenses that are unusual in nature and/or infrequent inoccurrence, such as litigation), or acquired fund fees andexpenses, brokerage commissions and other transactionalexpenses relating to the purchase and sale of portfolio securities,interest, taxes and governmental fees, and other expenses notincurred in the ordinary course of the Fund’s business. ThisExpense Limitation Agreement will continue in effect from year toyear thereafter unless terminated by the Board of Directors priorto any such renewal.
Expense Example
This Example is intended to help you compare the cost ofinvesting in the Fund with the cost of investing in othermutual funds. The Example assumes that you invest$10,000 in the Fund for the time periods indicated and thenredeem all of your shares at the end of those periods. TheExample also assumes that your investment has a 5%return each year and that the Fund’s operating expensesinclude expense reimbursements for year one. TheExample does not reflect charges imposed by the VariableContract. If the Variable Contract fees were reflected thenthe expenses would be higher. See the Variable Contractprospectus for information on such charges. Although youractual costs may be higher or lower, based on theseassumptions and the net expenses shown in the fee table,your costs would be:
1 Year 3 Years 5 Years 10 Years
$87 $288 $507 $1,136
Portfolio Turnover
The Fund pays transaction costs, such as commissions,when it buys and sells securities (or “turns over” itsportfolio). These costs, which are not reflected in annualfund operating expenses or in the example, affect theFund’s performance. During the most recent fiscal year, theFund’s portfolio turnover rate was 15% of the average valueof its portfolio.
Principal Investment Strategies of the Fund
The Fund attempts to achieve its objective by investing incommon stocks of companies that the sub-adviser hasidentified as financially sound but out-of-favor that provideabove-average potential total returns and sell at below-average price/earnings multiples. The Fund employs a“bottom-up” approach, which is the use of fundamentalanalysis to select specific securities from a variety ofindustries. The Fund may buy securities issued bycompanies of any size or market capitalization range and attimes might increase its emphasis on securities of issuers ina particular capitalization range. While the Fund does notlimit its investments to issuers within a particularcapitalization range, the portfolio manager currently focuseson securities of large-cap companies.
In addition to the common stocks described above, theFund may invest in securities of foreign issuers, includingemerging market securities.
In order to generate additional income, the Fund may lendportfolio securities to broker-dealers and other financialinstitutions provided that the value of the loaned securitiesdoes not exceed 30% of the Fund’s total assets. Theseloans earn income for the Fund and are collateralized bycash, securities issued or guaranteed by the U.S.Government or its agencies or instrumentalities, and suchother securities as the Fund and the securities lendingagent may agree upon.
Principal Risks of Investing in the Fund
There can be no assurance that the Fund’s investmentobjective will be met or that the net return on an investmentin the Fund will exceed what could have been obtainedthrough other investment or savings vehicles. Shares of theFund are not bank deposits and are not guaranteed orinsured by any bank, government entity or the FederalDeposit Insurance Corporation. As with any mutual fund,there is no guarantee that the Fund will be able to achieveits investment objective. If the value of the assets of theFund goes down, you could lose money.
The following is a summary of the principal risks of investingin the Fund.
Management Risk: The investment style or strategy usedby the sub-adviser may fail to produce the intended result.The sub-adviser’s assessment of a particular security orcompany may prove incorrect, resulting in losses orunderperformance.
- 98 -

FUND SUMMARY: VALUE FUND
Equity Securities Risk: The Fund invests principally inequity securities and is therefore subject to the risk thatstock prices will fall and may underperform other assetclasses. Individual stock prices fluctuate from day-to-dayand may decline significantly. The prices of individual stocksmay be negatively affected by poor company results orother factors affecting individual prices, as well as industryand/or economic trends and developments affectingindustries or the securities market as a whole.
Currency Risk: Because the Fund’s foreign investmentsare generally held in foreign currencies, the Fund couldexperience gains or losses based solely on changes in theexchange rate between foreign currencies and the U.S.dollar. Such gains or losses may be substantial.
Foreign Investment Risk: Investment in foreign securitiesinvolves risks due to several factors, such as illiquidity, thelack of public information, changes in the exchange ratesbetween foreign currencies and the U.S. dollar, unfavorablepolitical, social and legal developments, or economic andfinancial instability. Foreign companies are not subject tothe U.S. accounting and financial reporting standards andmay have riskier settlement procedures. U.S. investmentsthat are denominated in foreign currencies or that are tradedin foreign markets, or securities of U.S. companies thathave significant foreign operations may be subject to foreigninvestment risk.
Emerging Markets Risk: In addition to the risks associatedwith investments in foreign securities, emerging marketsecurities are subject to additional risks, which cause thesesecurities generally to be more volatile than securities ofissuers located in developed countries.
Large- and Mid-Cap Company Risk: Investing primarily inlarge-cap and mid-cap companies carries the risk that dueto current market conditions these companies may be out offavor with investors. Large-cap companies may be unableto respond quickly to new competitive challenges or attainthe high growth rate of successful smaller companies.Stocks of mid-cap companies may be more volatile thanthose of larger companies due to, among other reasons,narrower product lines, more limited financial resources andfewer experienced managers.
Small-Cap Company Risk: Investing in small-capcompanies carries the risk that due to current marketconditions these companies may be out of favor withinvestors. Small companies often are in the early stages ofdevelopment with limited product lines, markets, or financialresources and managements lacking depth and experience,which may cause their stock prices to be more volatile thanthose of larger companies. Small company stocks may beless liquid yet subject to abrupt or erratic price movements.It may take a substantial period of time before the Fundrealizes a gain on an investment in a small-cap company, ifit realizes any gain at all.
Market Risk: The Fund’s share price can fall because ofweakness in the broad market, a particular industry, or
specific holdings or due to adverse political or economicdevelopments here or abroad, changes in investorpsychology, or heavy institutional selling. The price ofindividual securities may fluctuate, sometimes dramatically,from day-to-day. The prices of stocks and other equitysecurities tend to be more volatile than those of fixedincome securities.
Value Style Risk: Generally, “value” stocks are stocks ofcompanies that the sub-adviser believes are currentlyundervalued in the marketplace. The sub-adviser’sjudgments that a particular security is undervalued inrelation to the company’s fundamental economic value mayprove incorrect and the price of the company’s stock mayfall or may not approach the value the sub-adviser hasplaced on it.
Securities Lending Risk: Engaging in securities lendingcould increase the market and credit risk for Fundinvestments. The Fund may lose money if it does notrecover borrowed securities, the value of the collateral falls,or the value of investments made with cash collateraldeclines. If the value of either the cash collateral or theFund’s investments of the cash collateral falls below theamount owed to a borrower, the Fund also may incur lossesthat exceed the amount it earned on lending the security.Securities lending also involves the risks of delay inreceiving additional collateral or possible loss of rights in thecollateral if the borrower fails. Another risk of securitieslending is the risk that the loaned portfolio securities maynot be available to the Fund on a timely basis and the Fundmay therefore lose the opportunity to sell the securities at adesirable price.
Performance Information
The following Risk/Return Bar Chart and Table illustrate therisks of investing in the Fund by showing changes in theFund’s performance from calendar year to calendar yearand comparing the Fund’s average annual returns to thoseof the Russell 1000® Value Index. Fees and expensesincurred at the contract level are not reflected in the barchart or table. If these amounts were reflected, returnswould be less than those shown. Of course, pastperformance is not necessarily an indication of how theFund will perform in the future.
From June 21, 2004 through March 14, 2011,OppenheimerFunds, Inc. (“Oppenheimer”) sub-advised theFund. Effective March 14, 2011, Wellington ManagementCompany LLP (“Wellington Management”) assumed sub-advisory duties of the Fund.
- 99 -

FUND SUMMARY: VALUE FUND
2006 2007 2008 2009 2010 2011 2012 2013 2015
16.34%
6.30%
-42.16%
33.42%
14.89%
-2.27%
16.94%
31.13%
-50%
-40%
-30%
-20%
-10%
0%
10%
20%
30%
40%
-3.18%
2014
11.40%
During the periods shown in the bar chart, the highest returnfor a quarter was 19.34% (quarter ending June 30, 2009)and the lowest return for a -26.94% (quarter endingDecember 31, 2008). For the year-to-date through June 30,2016, the Fund’s return was 4.14%.
Average Annual Total Returns (For the periods endedDecember 31, 2015)
1Year
5Years
10Years
Fund -3.18% 10.08% 5.89%Russell 1000® Value Index -3.83% 11.27% 6.16%
Investment Adviser
The Fund’s investment adviser is The Variable Annuity LifeInsurance Company. The Fund is sub-advised byWellington Management.
Portfolio Manager
Name
PortfolioManager ofthe Fund
Since Title
Karen H. Grimes, CFA 2011 Senior ManagingDirector and EquityPortfolio Manager
For important information about purchase and sales of Fundshares, taxes and payments made to broker-dealers andother financial intermediaries, please turn to the section“Important Additional Information” on page 101.
- 100 -

IMPORTANT ADDITIONAL INFORMATION
Purchases and Sales of Fund Shares
Shares of the Funds may only be purchased or redeemedthrough Variable Contracts offered by the separateaccounts of The Variable Annuity Life Insurance Company(“VALIC”) or other participating life insurance companiesand through qualifying retirement plans (the “Plans”) andIRAs. Shares of the Funds may be purchased andredeemed each day the New York Stock Exchange is open,at the Fund’s net asset value determined after receipt of arequest in good order.
The Funds do not have any initial or subsequent investmentminimums. However, your insurance company may imposeinvestment or account value minimums. The prospectus (orother offering document) for your Variable Contract maycontain additional information about purchases andredemptions of the Funds’ shares.
Tax Information
The Funds will not be subject to federal income tax on thenet investment company taxable income or net capital gainsdistributed to shareholders as ordinary income dividends orcapital gain dividends and the separate accounts thatreceive the dividends are not subject to tax. However,contractholders may be subject to federal income tax (and afederal Medicare tax of 3.8% that applies to net income,including taxable annuity payments, if applicable) uponwithdrawal from a Variable Contract. Contractholders shouldconsult the prospectus (or other offering document) for theVariable Contract for additional information regardingtaxation.
Payments to Broker-Dealers and Other FinancialIntermediaries
The Funds are not sold directly to the general public butinstead are offered to registered and unregistered separateaccounts of VALIC and its affiliates and to Plans andIRAs. The Funds and their related companies may makepayments to the sponsoring insurance company or itsaffiliates for recordkeeping and distribution. Thesepayments may create a conflict of interest as they may be afactor that the insurance company considers in including theFunds as underlying investment options in a variablecontract. Visit your sponsoring insurance company’swebsite for more information.
- 101 -

VALIC Company IP.O. Box 3206Houston, TX 77252-3206
VC 9017-SP (10/2016) J88281

![faithlutheranyucaipa.orgfaithlutheranyucaipa.org/Bulletin.pdf · Translate this page... (¢Š(¢Š(¢Š(¢Š(¢Š(¢Š(¢Š(¢Š(¢Š( ÿÙ endstream endobj 21 0 obj /ExtGState/XObject/ProcSet[/PDF/Text/ImageB/ImageC/ImageI]](https://img.pdfslide.us/doc/110x75/5aab04227f8b9a2b4c8b7693/this-page-sssssssss-endstream-endobj-21-0-obj-extgstatexobjectprocsetpdftextimagebimagecimagei.jpg)