Embed Size (px)
Citation preview
7/29/2019 Vaccine Preventable Deaths in Colorado's Children Shcc2004
http://slidepdf.com/reader/full/vaccine-preventable-deaths-in-colorados-children-shcc2004 1/6
State of the Health of Colorado’s Children
Volume II Number 1: May 11, 2005
The Children’s Hospital1 of 6
Vaccine-preventable Diseases in Colorado’s
Children, 2004James Todd MD1,2, Marsha Anderson MD1,2, Carl Armon MSPH1, Michael Rannie RN MS1, Stephen Berman MD1,2
Vaccines have been highly effective and very safe in Colorado. The introduction of vaccines in Colorado has had a dramatic effect onreducing vaccine-preventable diseases such as diphtheria, tetanus, polio, measles, mumps, rubella, smallpox, and Haemophilus influen-
zae disease. For every one possible severe event reported in Colorado children in 2002-2003, vaccines prevented an estimated 4,000-8,000 severe vaccine-preventable illnesses. The 2002 and 2003 National Immunization Survey ranked Colorado behind other states invaccinating its children. Reported NIS vaccination rates correlate with actual vaccine-preventable disease rates in Colorado (as vaccina-tion goes up disease goes down). For some diseases, current vaccination rates in Colorado (e.g. pertussis, influenza) are not sufficient to
prevent increasing rates of disease. Although immunization laws result in a high rate of vaccination by the time a child gets to school,the greatest risk for many of these diseases is in young infants. For pertussis, varicella, influenza, Streptococcus pneumoniae, and Hae-mophilus influenzae, there were over $23 million of hospital charges for severe disease associated with these infections in Coloradochildren in 2003, with significant impact in both the public and private sectors. The odds of getting a VPD are 2.3 times more for chil-dren in Colorado with Medicaid/SCHIP or no coverage than for private insurance. Vaccine-preventable diseases appear to be a state-wide problem – both urban and rural. Developing systems that assure timely access to vaccines for all children will be critically impor-tant, especially during the first 2 years of life, when children are at the highest risk of these diseases.
SHCC, 2005;2(1):1-6
Introduction
The Centers for Disease Control ranks vaccinationas one of the top ten most effective public healthmeasures in the last 100 years, and yet the 2002 and2003 National Immunization Surveys (NIS) rank Colorado as the worst of 50 states in overall child-hood vaccination rates. This ongoing analysis wasundertaken to determine if the low vaccination ratesreported by NIS are accurate, if they are associatedwith an increased rate of vaccine-preventable dis-eases in Colorado, and to identify the consequencesand risk factors associated with these illnesses.
Summary of Methods
A number of data sources are available to measurevaccination and disease rates in Colorado. TheColorado Department of Public Health and Envi-ronment (CDPHE) has collected data on reportablediseases since 1920. The Colorado Hospital Asso-ciation (CHA) provides data on all hospital dis-charges from 1995 through 2003. Similar data for hospital discharges are available in the KIDs 2000database for children < 18 years of age from 29 states. The VaccineAdverse Event Reporting System (VAERS) is a national system for state-wide reporting of possible adverse events that might be associ-ated with vaccines. Using a phone survey, the National Immuniza-tion Survey (NIS) measures vaccination rates annually throughoutthe United States.
Vaccine-preventable infections continue to circulate in the popula-tion and to cause disease and death in children in our State. Usingthe above data sources it is possible to estimate the impact of vari-ous vaccine-preventable diseases on the children of Colorado. For the purposes of this analysis, the focus was on patients dischargedwith discharge codes for one or more of five vaccine-preventablediseases1 known to occur in Colorado at the present time. Theseinclude: varicella (chicken pox), pertussis (whooping cough), influ
1Department of Epidemiology, The Children’s Hospital;
2Departments of Pediatrics and Preventive MedicineUniversity of Colorado School of Medicine; Denver, Colorado
enza, S. pneumoniae (a common cause of meningitis), and H. influ-enzae. An analysis of the patients selected in 2002, showed that82% of the cases had such codes as either the principal diagnosis or the second diagnosis. The number of hospital admissions andcharges associated with each vaccine-preventable disease category
were measured and the patient’s insurance status was grouped intoone of two categories: no insurance or Medicaid/SCHIP (pub-lic/none ), or private insurance to estimate the public and privatecosts of hospitalization for these diseases. Public insurance wascombined with none since children admitted to the hospital without
prior insurance coverage are often qualified retroactively for Medi-caid.
Vaccine-preventable Diseases: Colorado, 1920-2002
0.1
1
10
100
1000
10000
100000
1 9 2 0
1 9 2 4
1 9 2 8
1 9 3 2
1 9 3 6
1 9 4 0
1 9 4 4
1 9 4 8
1 9 5 2
1 9 5 6
1 9 6 0
1 9 6 4
1 9 6 8
1 9 7 2
1 9 7 6
1 9 8 0
1 9 8 4
1 9 8 8
1 9 9 2
1 9 9 6
2 0 0 0
YEAR
C A S E S / 1 , 0
0 0 , 0
0 0
5 per. Mov. Avg. (Pertussis) 5 per. Mov. Avg. (Diphtheria)
5 pe r. Mov. Avg. (Polio) 5 pe r. Mov. Avg. (M eas le s)
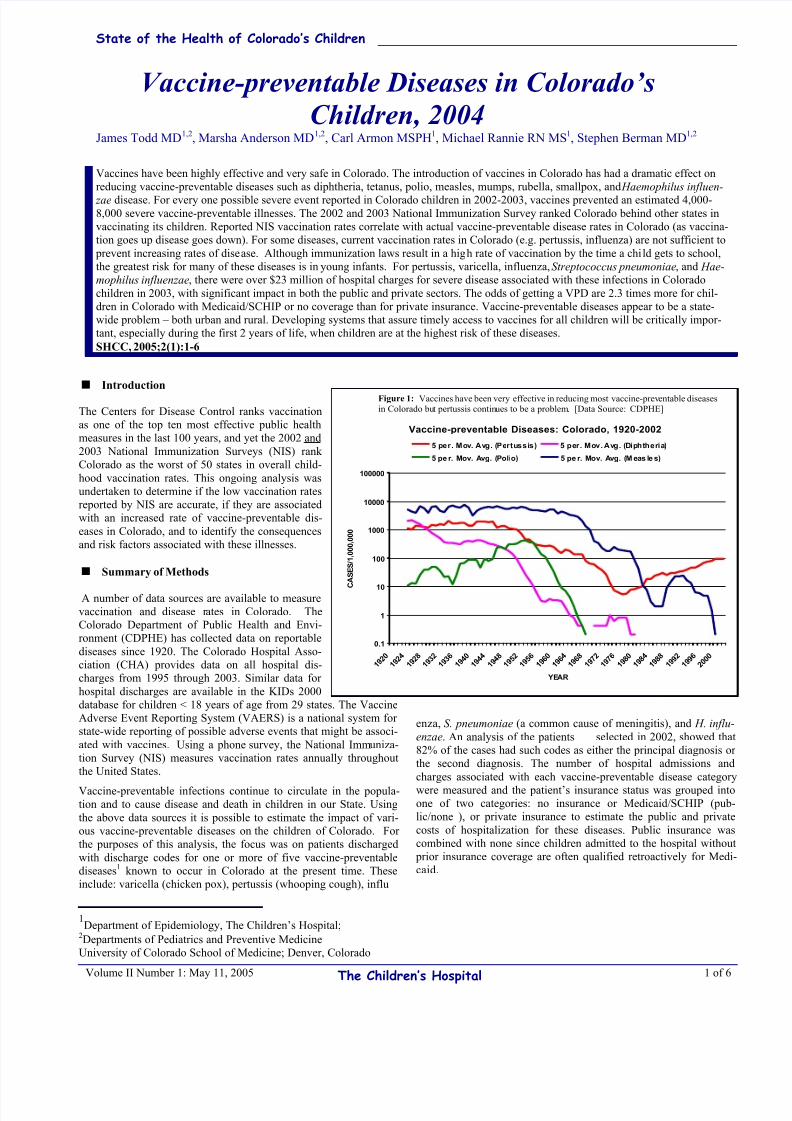
Figure 1: Vaccines have been very effective in reducing most vaccine-preventable diseases
in Colorado but pertussis continues to be a problem. [Data Source: CDPHE]
7/29/2019 Vaccine Preventable Deaths in Colorado's Children Shcc2004
http://slidepdf.com/reader/full/vaccine-preventable-deaths-in-colorados-children-shcc2004 2/6
Vaccine-preventable Diseases in Colorado’s Children, 2004
State of the Health of Colorado’s Children, The Children’s Hospital
Volume II Number 1: May 11, 2005 2 of 6
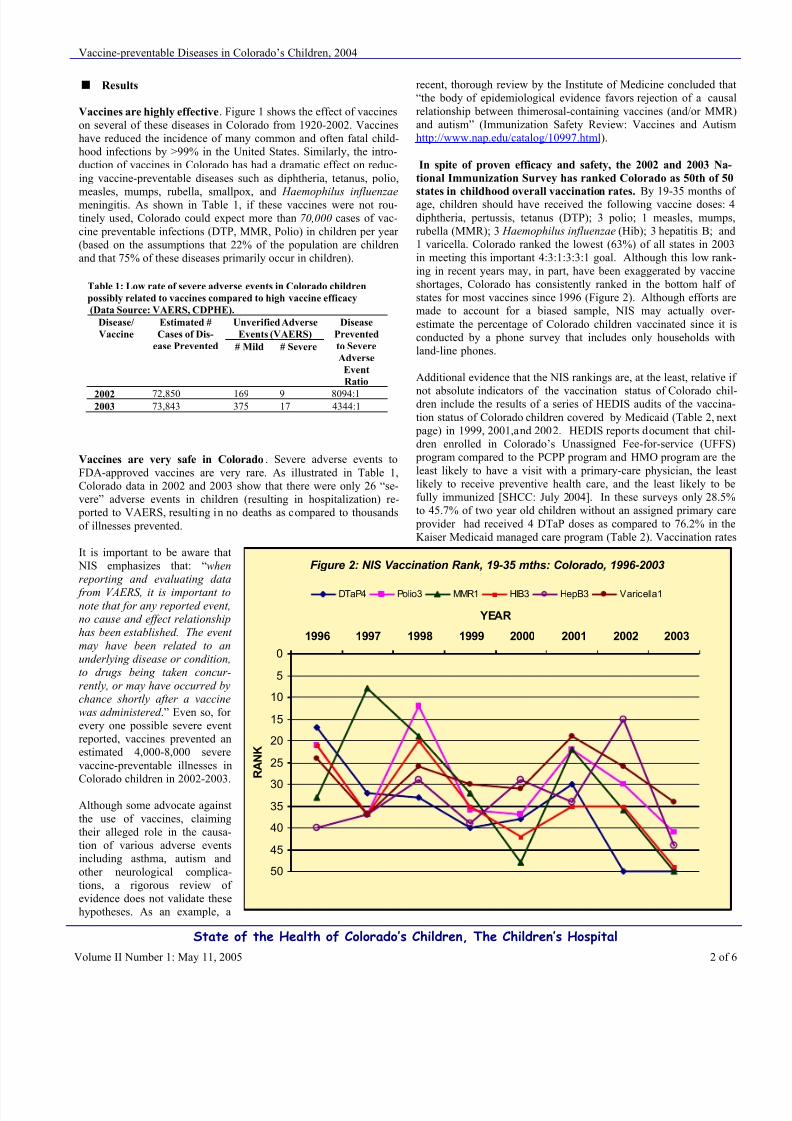
Figure 2: NIS Vaccination Rank, 19-35 mths: Colorado, 1996-2003
0
5
10
15
20
25
30
35
40
45
50
1996 1997 1998 1999 2000 2001 2002 2003
YEAR
R A N K
DTaP4 Polio3 MMR1 HIB3 HepB3 Varicella1
Results
Vaccines are highly effective. Figure 1 shows the effect of vaccineson several of these diseases in Colorado from 1920-2002. Vaccineshave reduced the incidence of many common and often fatal child-hood infections by >99% in the United States. Similarly, the intro-duction of vaccines in Colorado has had a dramatic effect on reduc-ing vaccine-preventable diseases such as diphtheria, tetanus, polio,
measles, mumps, rubella, smallpox, and Haemophilus influenzae meningitis. As shown in Table 1, if these vaccines were not rou-tinely used, Colorado could expect more than 70,000 cases of vac-cine preventable infections (DTP, MMR, Polio) in children per year (based on the assumptions that 22% of the population are childrenand that 75% of these diseases primarily occur in children).
Vaccines are very safe in Colorado. Severe adverse events toFDA-approved vaccines are very rare. As illustrated in Table 1,Colorado data in 2002 and 2003 show that there were only 26 “se-vere” adverse events in children (resulting in hospitalization) re-
ported to VAERS, resulting in no deaths as compared to thousandsof illnesses prevented.
It is important to be aware that NIS emphasizes that: “whenreporting and evaluating data
from VAERS, it is important tonote that for any reported event,no cause and effect relationshiphas been established. The event
may have been related to anunderlying disease or condition,to drugs being taken concur-
rently, or may have occurred bychance shortly after a vaccinewas administered .” Even so, for every one possible severe eventreported, vaccines prevented anestimated 4,000-8,000 severevaccine-preventable illnesses inColorado children in 2002-2003.
Although some advocate againstthe use of vaccines, claimingtheir alleged role in the causa-tion of various adverse eventsincluding asthma, autism andother neurological complica-tions, a rigorous review of evidence does not validate thesehypotheses. As an example, a
recent, thorough review by the Institute of Medicine concluded that“the body of epidemiological evidence favors rejection of a causalrelationship between thimerosal-containing vaccines (and/or MMR)and autism” (Immunization Safety Review: Vaccines and Autismhttp://www.nap.edu/catalog/10997.html ).
In spite of proven efficacy and safety, the 2002 and 2003 Na-
tional Immunization Survey has ranked Colorado as 50th of 50
states in childhood overall vaccination rates. By 19-35 months of age, children should have received the following vaccine doses: 4diphtheria, pertussis, tetanus (DTP); 3 polio; 1 measles, mumps,rubella (MMR); 3 Haemophilus influenzae (Hib); 3 hepatitis B; and1 varicella. Colorado ranked the lowest (63%) of all states in 2003in meeting this important 4:3:1:3:3:1 goal. Although this low rank-ing in recent years may, in part, have been exaggerated by vaccineshortages, Colorado has consistently ranked in the bottom half of states for most vaccines since 1996 (Figure 2). Although efforts aremade to account for a biased sample, NIS may actually over-estimate the percentage of Colorado children vaccinated since it isconducted by a phone survey that includes only households withland-line phones.
Additional evidence that the NIS rankings are, at the least, relative if
not absolute indicators of the vaccination status of Colorado chil-dren include the results of a series of HEDIS audits of the vaccina-tion status of Colorado children covered by Medicaid (Table 2, next
page) in 1999, 2001,and 2002. HEDIS reports document that chil-dren enrolled in Colorado’s Unassigned Fee-for-service (UFFS)
program compared to the PCPP program and HMO program are theleast likely to have a visit with a primary-care physician, the leastlikely to receive preventive health care, and the least likely to befully immunized [SHCC: July 2004]. In these surveys only 28.5%to 45.7% of two year old children without an assigned primary care
provider had received 4 DTaP doses as compared to 76.2% in theKaiser Medicaid managed care program (Table 2). Vaccination rates
Table 1: Low rate of severe adverse events in Colorado children
possibly related to vaccines compared to high vaccine efficacy
(Data Source: VAERS, CDPHE).
Unverified Adverse
Events (VAERS)
Disease/
Vaccine
Estimated #
Cases of Dis-
ease Prevented # Mild # Severe
Disease
Prevented
to Severe
Adverse
Event
Ratio
2002 72,850 169 9 8094:12003 73,843 375 17 4344:1
7/29/2019 Vaccine Preventable Deaths in Colorado's Children Shcc2004
http://slidepdf.com/reader/full/vaccine-preventable-deaths-in-colorados-children-shcc2004 3/6
Vaccine-preventable Diseases in Colorado’s Children, 2004
State of the Health of Colorado’s Children, The Children’s Hospital
Volume II Number 1: May 11, 2005 3 of 6
Table 2: HEDIS immunization rates for Medicaid enrollees in Unassigned Fee-for-Services for 1999, 2001, and 2002 as
reported by the Colorado Department of Health Care Policy and Financing. [Data Source: HCPF]
Age 2 years 1999 2001 2002 Kaiser 2001
4:3:1:2:1 20.9% 33.8% 21.7% 66.2%
4 DTaP 31.9% 45.7% 28.5% 76.2%
1 MMR 49.4% 58.4% 62.0% 92.9%
3 OPV or IPV 37.0% 54.3% 60.1% 85.2%
2 HiB 36.7% 48.9% 50.4% 86.7%
3 Hepatitis B 29.9% 51.3% 53.5% 83.3%
1 VZV 33.6% 52.6% 55.5% 92.4%
Adolecents
2MMR 29.7% 37.2% 44.0% 76.9%
1 Hepatitis B 21.4% 29.9% 35.3% 67.3%
MMR and Hep B 18.3% 26.3% 32.1% 61.5%
VZV 4.1% 11.4% 12.4% 57.7%
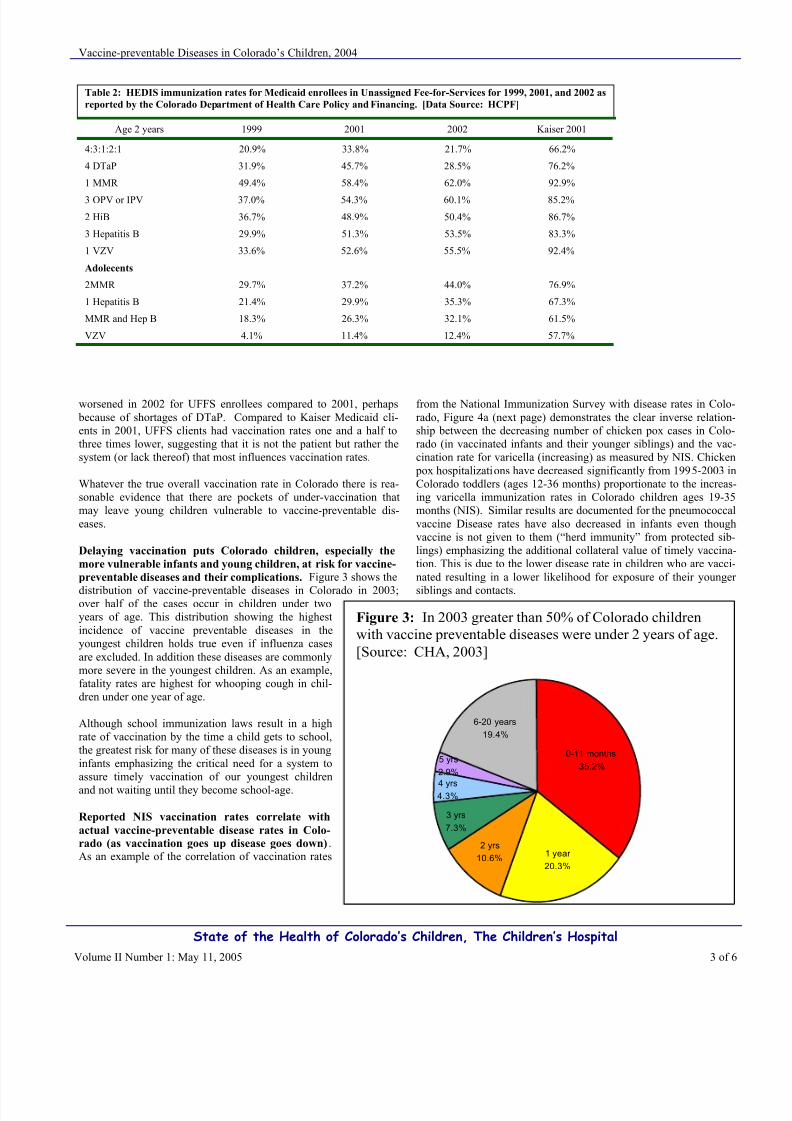
Figure 3: In 2003 greater than 50% of Colorado children
with vaccine preventable diseases were under 2 years of age.
[Source: CHA, 2003]
5 yrs
2.9%
6-20 years
19.4%
4 yrs4.3%
3 yrs
7.3%
2 yrs
10.6%1 year 20.3%
0-11 months 35.2%
worsened in 2002 for UFFS enrollees compared to 2001, perhaps because of shortages of DTaP. Compared to Kaiser Medicaid cli-ents in 2001, UFFS clients had vaccination rates one and a half tothree times lower, suggesting that it is not the patient but rather thesystem (or lack thereof) that most influences vaccination rates.
Whatever the true overall vaccination rate in Colorado there is rea-sonable evidence that there are pockets of under-vaccination thatmay leave young children vulnerable to vaccine-preventable dis-eases.
Delaying vaccination puts Colorado children, especially the
more vulnerable infants and young children, at risk for vaccine-
preventable diseases and their complications. Figure 3 shows the
distribution of vaccine-preventable diseases in Colorado in 2003;over half of the cases occur in children under twoyears of age. This distribution showing the highestincidence of vaccine preventable diseases in theyoungest children holds true even if influenza casesare excluded. In addition these diseases are commonlymore severe in the youngest children. As an example,fatality rates are highest for whooping cough in chil-dren under one year of age.
Although school immunization laws result in a highrate of vaccination by the time a child gets to school,the greatest risk for many of these diseases is in younginfants emphasizing the critical need for a system toassure timely vaccination of our youngest children
and not waiting until they become school-age.
Reported NIS vaccination rates correlate with
actual vaccine-preventable disease rates in Colo-
rado (as vaccination goes up disease goes down).As an example of the correlation of vaccination rates
from the National Immunization Survey with disease rates in Colo-rado, Figure 4a (next page) demonstrates the clear inverse relation-ship between the decreasing number of chicken pox cases in Colo-rado (in vaccinated infants and their younger siblings) and the vac-cination rate for varicella (increasing) as measured by NIS. Chicken
pox hospitalizations have decreased significantly from 1995-2003 inColorado toddlers (ages 12-36 months) proportionate to the increas-ing varicella immunization rates in Colorado children ages 19-35months (NIS). Similar results are documented for the pneumococcalvaccine Disease rates have also decreased in infants even thoughvaccine is not given to them (“herd immunity” from protected sib-lings) emphasizing the additional collateral value of timely vaccina-tion. This is due to the lower disease rate in children who are vacci-nated resulting in a lower likelihood for exposure of their younger
siblings and contacts.
7/29/2019 Vaccine Preventable Deaths in Colorado's Children Shcc2004
http://slidepdf.com/reader/full/vaccine-preventable-deaths-in-colorados-children-shcc2004 4/6
Vaccine-preventable Diseases in Colorado’s Children, 2004
State of the Health of Colorado’s Children, The Children’s Hospital
Volume II Number 1: May 11, 2005 4 of 6
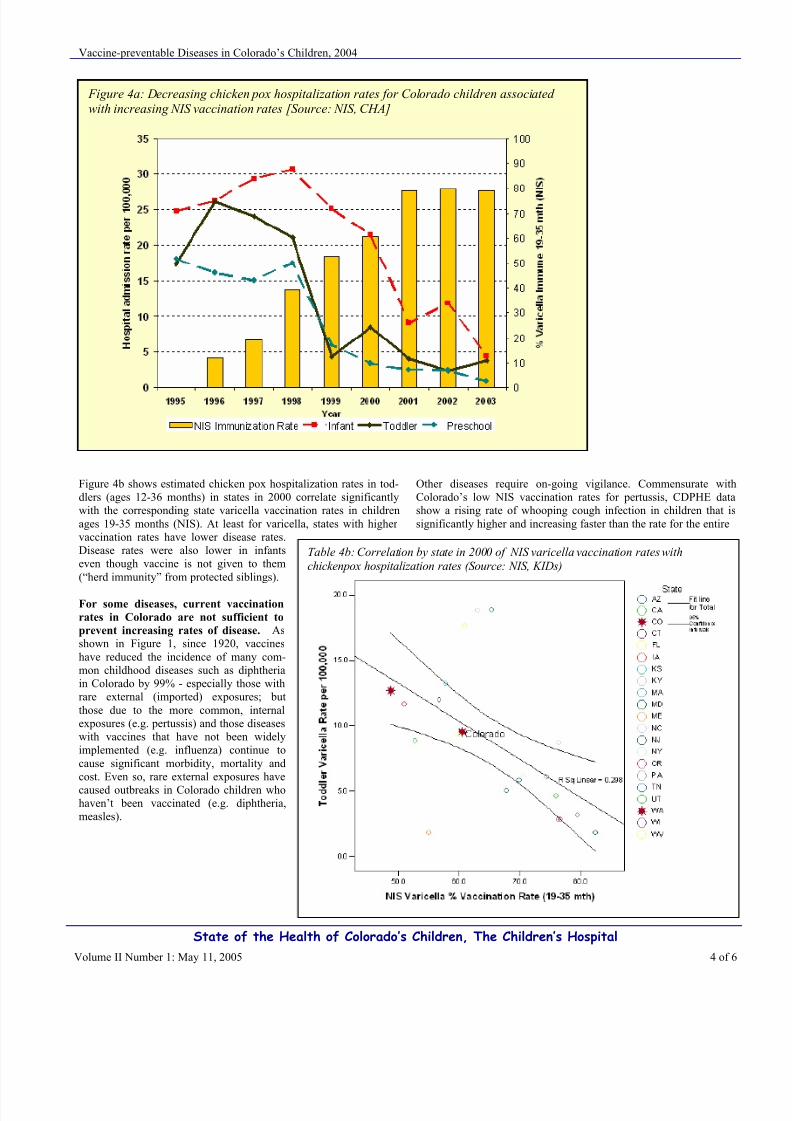
Table 4b: Correlation by state in 2000 of NIS varicella vaccination rates with
chickenpox hospitalization rates (Source: NIS, KIDs)
Figure 4a: Decreasing chicken pox hospitalization rates for Colorado children associated
with increasing NIS vaccination rates [Source: NIS, CHA]
Figure 4b shows estimated chicken pox hospitalization rates in tod-dlers (ages 12-36 months) in states in 2000 correlate significantlywith the corresponding state varicella vaccination rates in childrenages 19-35 months (NIS). At least for varicella, states with higher vaccination rates have lower disease rates.Disease rates were also lower in infantseven though vaccine is not given to them(“herd immunity” from protected siblings).
For some diseases, current vaccination
rates in Colorado are not sufficient to
prevent increasing rates of disease. Asshown in Figure 1, since 1920, vaccineshave reduced the incidence of many com-mon childhood diseases such as diphtheriain Colorado by 99% - especially those withrare external (imported) exposures; butthose due to the more common, internalexposures (e.g. pertussis) and those diseaseswith vaccines that have not been widelyimplemented (e.g. influenza) continue tocause significant morbidity, mortality andcost. Even so, rare external exposures have
caused outbreaks in Colorado children whohaven’t been vaccinated (e.g. diphtheria,measles).
Other diseases require on-going vigilance. Commensurate withColorado’s low NIS vaccination rates for pertussis, CDPHE datashow a rising rate of whooping cough infection in children that issignificantly higher and increasing faster than the rate for the entire
7/29/2019 Vaccine Preventable Deaths in Colorado's Children Shcc2004
http://slidepdf.com/reader/full/vaccine-preventable-deaths-in-colorados-children-shcc2004 5/6
Vaccine-preventable Diseases in Colorado’s Children, 2004
State of the Health of Colorado’s Children, The Children’s Hospital
Volume II Number 1: May 11, 2005 5 of 6
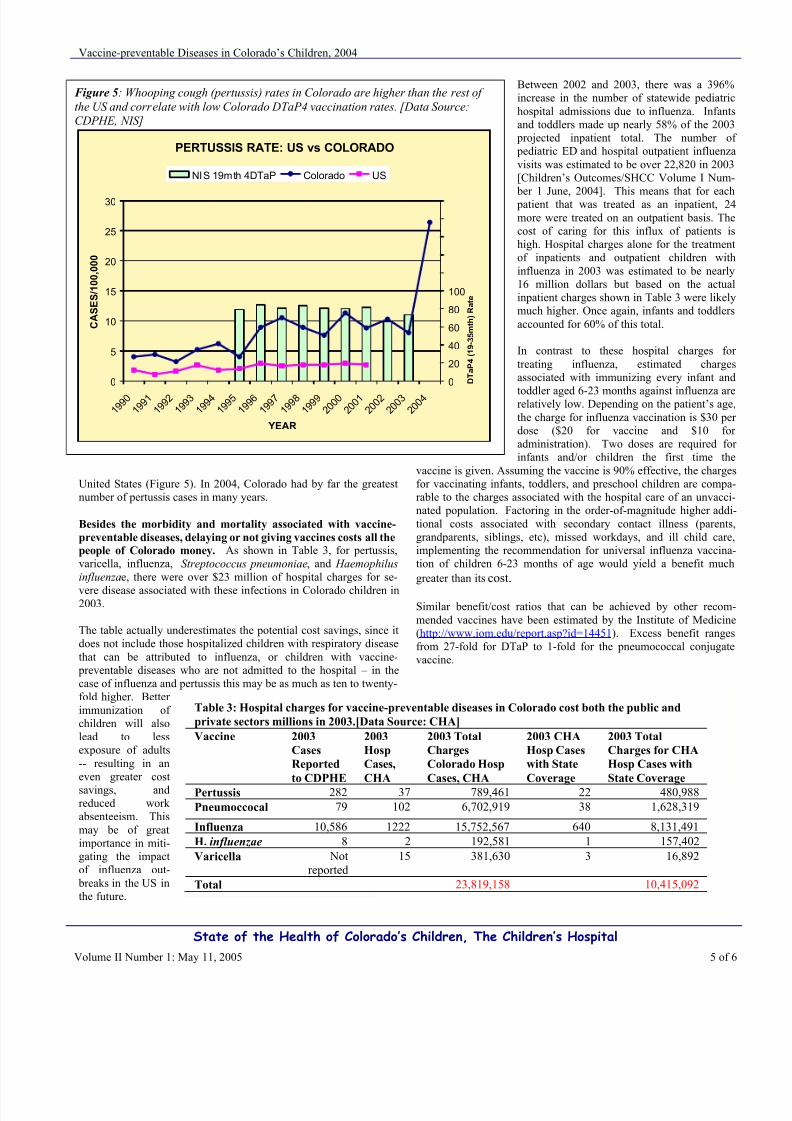
Figure 5: Whooping cough (pertussis) rates in Colorado are higher than the rest of
the US and correlate with low Colorado DTaP4 vaccination rates. [Data Source:
CDPHE, NIS]
PERTUSSIS RATE: US vs COLORADO
0
5
10
15
20
25
30
1 9 9 0
1 9 9 1
1 9 9 2
1 9 9 3
1 9 9 4
1 9 9 5
1 9 9 6
1 9 9 7
1 9 9 8
1 9 9 9
2 0 0 0
2 0 0 1
2 0 0 2
2 0 0 3
2 0 0 4
YEAR
C A S E S / 1 0 0 , 0 0 0
0
20
40
60
80
100
120
140
160
180
200
D T a P 4 ( 1 9 - 3 5 m t h ) R a t e
NIS 19mth 4DTaP Colorado US
Table 3: Hospital charges for vaccine-preventable diseases in Colorado cost both the public and
private sectors millions in 2003.[Data Source: CHA]
Vaccine 2003
Cases
Reported
to CDPHE
2003
Hosp
Cases,
CHA
2003 Total
Charges
Colorado Hosp
Cases, CHA
2003 CHA
Hosp Cases
with State
Coverage
2003 Total
Charges for CHA
Hosp Cases with
State Coverage
Pertussis 282 37 789,461 22 480,988
Pneumoccocal 79 102 6,702,919 38 1,628,319
Influenza 10,586 1222 15,752,567 640 8,131,491
H. influenzae 8 2 192,581 1 157,402
Varicella Not
reported
15 381,630 3 16,892
Total 23,819,158 10,415,092
United States (Figure 5). In 2004, Colorado had by far the greatestnumber of pertussis cases in many years.
Besides the morbidity and mortality associated with vaccine-
preventable diseases, delaying or not giving vaccines costs all the
people of Colorado money. As shown in Table 3, for pertussis,varicella, influenza, Streptococcus pneumoniae, and Haemophilusinfluenzae, there were over $23 million of hospital charges for se-
vere disease associated with these infections in Colorado children in2003.
The table actually underestimates the potential cost savings, since itdoes not include those hospitalized children with respiratory diseasethat can be attributed to influenza, or children with vaccine-
preventable diseases who are not admitted to the hospital – in thecase of influenza and pertussis this may be as much as ten to twenty-fold higher. Better immunization of children will alsolead to lessexposure of adults-- resulting in aneven greater cost
savings, andreduced work absenteeism. Thismay be of greatimportance in miti-gating the impactof influenza out-
breaks in the US inthe future.
Between 2002 and 2003, there was a 396%increase in the number of statewide pediatrichospital admissions due to influenza. Infantsand toddlers made up nearly 58% of the 2003
projected inpatient total. The number of pediatric ED and hospital outpatient influenzavisits was estimated to be over 22,820 in 2003[Children’s Outcomes/SHCC Volume I Num-
ber 1 June, 2004]. This means that for each patient that was treated as an inpatient, 24more were treated on an outpatient basis. Thecost of caring for this influx of patients ishigh. Hospital charges alone for the treatmentof inpatients and outpatient children withinfluenza in 2003 was estimated to be nearly16 million dollars but based on the actualinpatient charges shown in Table 3 were likelymuch higher. Once again, infants and toddlersaccounted for 60% of this total.
In contrast to these hospital charges for treating influenza, estimated chargesassociated with immunizing every infant and
toddler aged 6-23 months against influenza arerelatively low. Depending on the patient’s age,the charge for influenza vaccination is $30 per dose ($20 for vaccine and $10 for administration). Two doses are required for infants and/or children the first time the
vaccine is given. Assuming the vaccine is 90% effective, the chargesfor vaccinating infants, toddlers, and preschool children are compa-rable to the charges associated with the hospital care of an unvacci-nated population. Factoring in the order-of-magnitude higher addi-tional costs associated with secondary contact illness (parents,grandparents, siblings, etc), missed workdays, and ill child care,implementing the recommendation for universal influenza vaccina-tion of children 6-23 months of age would yield a benefit much
greater than its cost.
Similar benefit/cost ratios that can be achieved by other recom-mended vaccines have been estimated by the Institute of Medicine(http://www.iom.edu/report.asp?id=14451). Excess benefit rangesfrom 27-fold for DTaP to 1-fold for the pneumococcal conjugatevaccine.
7/29/2019 Vaccine Preventable Deaths in Colorado's Children Shcc2004
http://slidepdf.com/reader/full/vaccine-preventable-deaths-in-colorados-children-shcc2004 6/6
Vaccine-preventable Diseases in Colorado’s Children, 2004
State of the Health of Colorado’s Children, The Children’s Hospital
Volume II Number 1: May 11, 2005 6 of 6
Vaccine-preventable disease occurs in all parts of Colorado,
both urban and rural, and all social strata. The rate of VPD ishigher in children who have publicly funded coverage than thosewith private insurance (Table 4). In fact, the odds of getting a VPDare 2.3 (95% CI: 2.11, 2.61)times more for children in Coloradowith Medicaid/SCHIP coverage than private insurance. Possibleexplanations for this observation include problems in access to careor delays in implementing the immunization schedule.
Table 4: Rates of hospitalization of Colorado children for VPD in
2003 (Data Source: CHA, US Census)
Insurance Total VPD Insurance
Coverage
VPD Rate
per
100,000
None/Govt. Insur-
ance
695 360,000 193.1
Private
Insurance
662 803,000 82.4
Of the $24 million in charges for vaccine-preventable diseases in2003, it is estimated that access to care and vaccination rates equalto private insurance patients could save hospital charges of almost$7 million for Medicaid/SCHIP/No Insurance children.
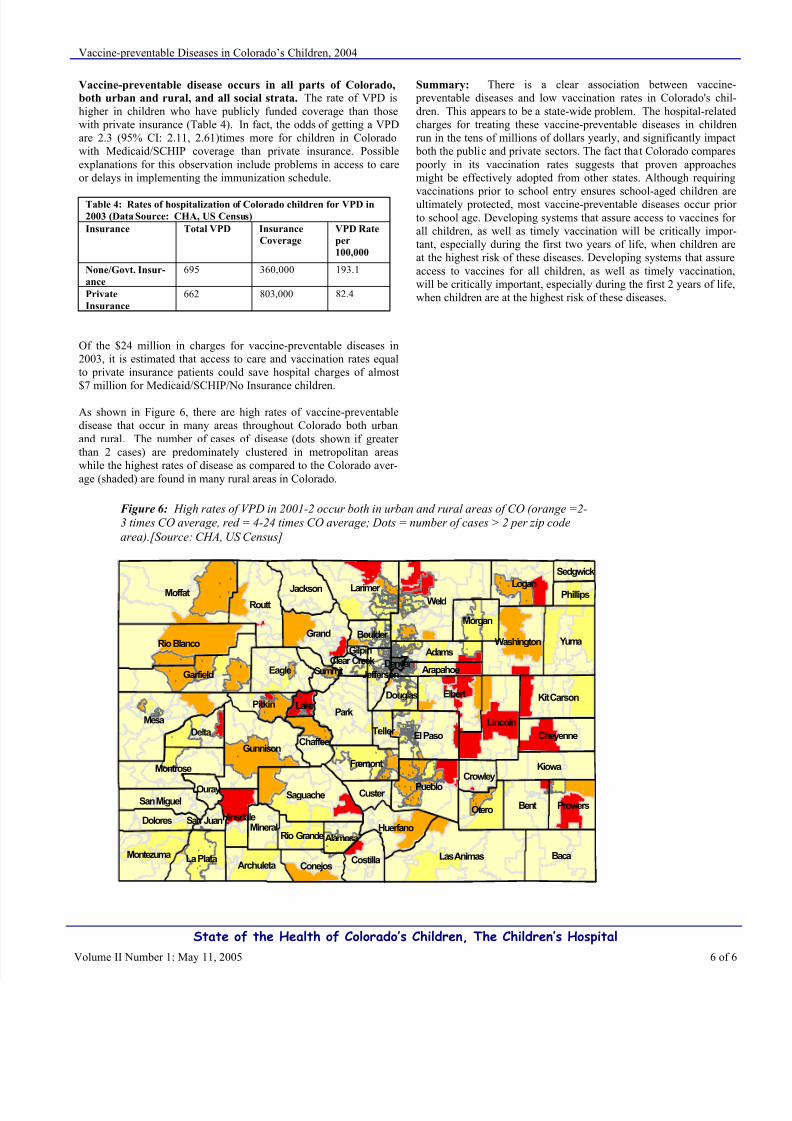
As shown in Figure 6, there are high rates of vaccine-preventabledisease that occur in many areas throughout Colorado both urbanand rural. The number of cases of disease (dots shown if greater than 2 cases) are predominately clustered in metropolitan areaswhile the highest rates of disease as compared to the Colorado aver-age (shaded) are found in many rural areas in Colorado.
Summary: There is a clear association between vaccine- preventable diseases and low vaccination rates in Colorado's chil-dren. This appears to be a state-wide problem. The hospital-relatedcharges for treating these vaccine-preventable diseases in childrenrun in the tens of millions of dollars yearly, and significantly impact
both the public and private sectors. The fact that Colorado compares poorly in its vaccination rates suggests that proven approachesmight be effectively adopted from other states. Although requiring
vaccinations prior to school entry ensures school-aged children areultimately protected, most vaccine-preventable diseases occur prior to school age. Developing systems that assure access to vaccines for all children, as well as timely vaccination will be critically impor-tant, especially during the first two years of life, when children areat the highest risk of these diseases. Developing systems that assureaccess to vaccines for all children, as well as timely vaccination,will be critically important, especially during the first 2 years of life,when children are at the highest risk of these diseases.
k
k k
k
k
kk
k kk
k
kk
k
k
k
kk
k kkk k
k
k
kk k
k
k kkkk
k
kkkkkkk
k
k
k
k
k
kk
k
k k kkk
k
kkkkkkkkkkk
k
k
k
kk k
kk
k
k
k
k
kkk
k
kk
k
kk
kkk k
kkk
kk
kkkkkkkkkk
kkk
k kkkkkkkkk
kk
kk
k
kkkkk k
kk
kk
k
k
k
k
kkkk
kkkkkk
kkk
kk k
k
kkk k
kk
kkkk
kkkkkkk
k kkk
kkkk
kkk k
kkkkkk
kkkk
kkk kkkkkk
kkk
kkkkkk
kkkkk
kkkk
kkkk
k
k
kkkkkkkkkk
kkk
k
k
k
k
kk
kkkkkkkkk
kkkkk
kkkkkkkkk
kkkkkkkkkkk kkkk
kkkkkk kkkkkkkk
k kk kk
k
k
kkk
kkkkkkk
k k
kk
kk k
k
kkkkkkkkkkkkkkkkkkkkkk
kkkkkkkkkkkk
kk
k
k
k
k
kkkkkkkkkkkkkkkkkk kkk
k
kk
kk k
k
kkkkkkk kkkkkkkkkkkkkkkk
kkk
kkkkkkkkkk
kkkkkkkkkkkkkkkkkkkkkkk k
kk
kkkk kkk
kkk
kk
k
k
kkkkkkkkkk k
kk kkkkkkkkkkkkkkkk
k
kkkkkk
kkkkkkkkkkkk
kkkkkk k kkkkk
kkkkkk kkk
k
kkk kkkkk
kk
kkkkkkkk
kk
kkkk
kkkkk
kkk
k
k
k
k
kk
k
k
k
k
kk
k
kk
k
k
k
k
k
k
k
k kk
kk
k
k
k kkk k
k
k
k
kkkkk
kkkkkk
k
k
k
k
k
k kkkkkkkkkkkk k
kk k
kk
k kkkk
kkkkkk
kkkkkkkk
kkk
kkkkkk kkkkkkkk
kkkkkkkkkk
kkkk
kkkkkkk
k
k
k
k
kkkkkkkk
k
kkk
k
kk
k
k
kk
k
kk
k
k
kk
k
k
kk
k
k k
k
k
kk
kk k
k
k
kkk
kkk
kk
k
k
kk
k
kkk
kkkkkkk
kkk
kkk
k
k
kkk
kk
k
k
kkk kk
kk k k
k
k
kk
k
k
k
k
k
k
k
kk
k
k k
k
WeldMoffat
Mesa
Baca
Park
Routt
Yuma
Las Animas
Garfield
Larimer
Lincoln
Pueblo
Gunnison
BentSaguache
Elbert
Grand
Eagle
Logan
Rio Blanco
Kiowa
El Paso
Montrose
Otero
Delta
Washington
Kit Carson
La Plata
Jackson
Prowers
Fremont
Adams
Montezuma
Cheyenne
Morgan
Huerfano
Pitkin
CostillaConejosArchuleta
Dolores
Chaffee
MineralHinsdale
San MiguelCuster
Douglas
Teller
Crowley
Boulder
Phillips
Ouray
JeffersonArapahoeSummit
Lake
AlamosaRio Grande
Sedgwick
San Juan
Clear CreekGilpin
Denver
Figure 6: High rates of VPD in 2001-2 occur both in urban and rural areas of CO (orange =2-3 times CO average, red = 4-24 times CO average; Dots = number of cases > 2 per zip code
area).[Source: CHA, US Census]