Embed Size (px)
Citation preview

VACANT INDUSTRIAL LAND SUPPLY December 2018
Prepared by: Urban Form and Corporate Strategic Development City Planning
Table of Contents
1. INTRODUCTION ......................................................................................................................................... 3
2. PURPOSE ...................................................................................................................................................... 3
3. GENERAL FINDINGS ................................................................................................................................. 5
3.1 DEVELOPABLE LAND ......................................................................................................................... 5
3.2 INDUSTRIAL NEIGHBOURHOODS WITH MOST VACANT LAND ............................................. 11
3.3 INDUSTRIAL LAND ABSORPTION TREND ................................................................................... 12
4. VACANT LAND: SERVICING AND PARCEL SIZE AVAILABILITY ................................................. 16
4.1 SERVICING LEVEL BY ZONE .......................................................................................................... 16
4.2 PARCEL SIZE AVAILABILITY ......................................................................................................... 17
4.3 SERVICING AND PARCEL SIZE AVAILABILITY ........................................................................ ..19
5. BUILDING PERMITS ISSUED .................................................................................................................. 21
6. LAND DEVELOPMENT APPLICATIONS………………………………………………………………25
7. CONCLUSION……………………………………………………………………………………………..26
APPENDIX I .................................................................................................................................................... 27
APPENDIX II ................................................................................................................................................... 29
For inquiries, please contact: Kenan Handzic at 780.496.6193 or [email protected] 2
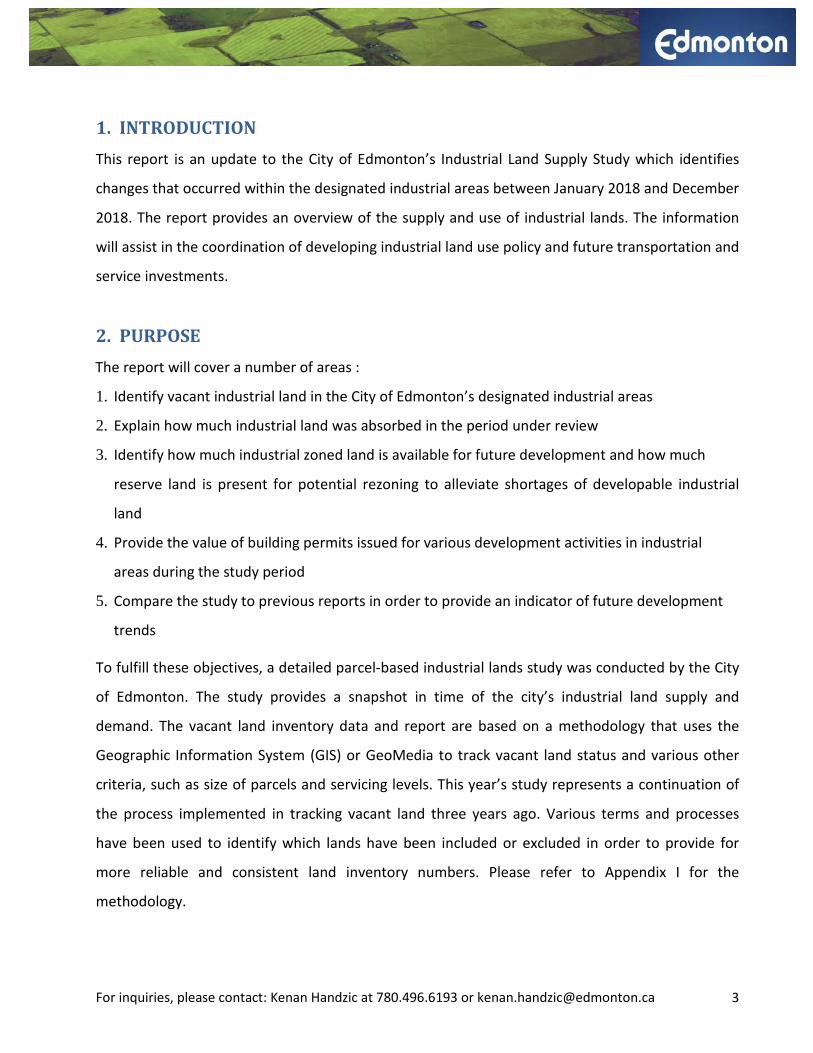
1. INTRODUCTION This report is an update to the City of Edmonton’s Industrial Land Supply Study which identifies
changes that occurred within the designated industrial areas between January 2018 and December
2018. The report provides an overview of the supply and use of industrial lands. The information
will assist in the coordination of developing industrial land use policy and future transportation and
service investments.
2. PURPOSE The report will cover a number of areas :
1. Identify vacant industrial land in the City of Edmonton’s designated industrial areas
2. Explain how much industrial land was absorbed in the period under review
3. Identify how much industrial zoned land is available for future development and how much
reserve land is present for potential rezoning to alleviate shortages of developable industrial
land
4. Provide the value of building permits issued for various development activities in industrial
areas during the study period
5. Compare the study to previous reports in order to provide an indicator of future development
trends
To fulfill these objectives, a detailed parcel-based industrial lands study was conducted by the City
of Edmonton. The study provides a snapshot in time of the city’s industrial land supply and
demand. The vacant land inventory data and report are based on a methodology that uses the
Geographic Information System (GIS) or GeoMedia to track vacant land status and various other
criteria, such as size of parcels and servicing levels. This year’s study represents a continuation of
the process implemented in tracking vacant land three years ago. Various terms and processes
have been used to identify which lands have been included or excluded in order to provide for
more reliable and consistent land inventory numbers. Please refer to Appendix I for the
methodology.
For inquiries, please contact: Kenan Handzic at 780.496.6193 or [email protected] 3

MAP 1: CITY OF EDMONTON INDUSTRIAL DISTRICTS
Source: Urban Form and Corporate Strategic Development, City of Edmonton
For inquiries, please contact: Kenan Handzic at 780.496.6193 or [email protected] 4

3. GENERAL FINDINGS
3.1 DEVELOPABLE LAND
The City of Edmonton has four main designated industrial areas or districts. The traditional
industrial areas in Edmonton include the Northeast Industrial, Northwest Industrial, and
South/Southeast Industrial Districts (now including the annexed southwest Crossroads Area),
which accommodate diverse industrial development. The Edmonton Energy and Technology Park
(EETP) has specific precincts to accommodate petrochemical development, manufacturing,
logistics, and research and development.
The net zoned vacant industrial and gross reserve lands in Edmonton’s traditional industrial
districts (Northeast, Northwest, and South/Southeast) are 910 hectares and 627 hectares
respectively. Edmonton’s traditional industrial areas have 1,537 hectares of vacant land (Table 1
and Chart 1). Northwest District has the largest amount of vacant land comprising 802 hectares of
both net and gross land areas. However, when the recently acquired annexation lands are added
to the South District figure of 547 hectares, the additional 574 hectares of gross land provide a
total of 1,122 hectares. These annexed-area numbers will be adjusted next year under South as
this report covers a period ending in December 2018, before which annexation took place. The
annexed land figures are however broken down in Appendix II. The Edmonton Energy and
Technology Park has an additional 4,753 hectares of undeveloped greenfield vacant industrial land.
Edmonton’s total supply of industrial land is 6,290 hectares without the annexed area and 6,864
hectares with the recently-annexed Crossroads Area.
There was an increase of 84 hectares from 2017 in vacant land, most of which can be accounted
for by previously unavailable or storage areas becoming vacant industrial land that is developable
and partially balanced through absorption via development of previously vacant parcels (less 32
hectares). There were some site adjustments to previously unaccounted vacant parcels, including
newly added sites that had development (buildings or storage) but are now vacant, or proposed
developments that did not occur and which are now vacant in contrast to 2017. For this reason,
the general numbers look very similar to last year with additional adjustments or transfers from
gross to industrial zoned vacant land.
For inquiries, please contact: Kenan Handzic at 780.496.6193 or [email protected] 5
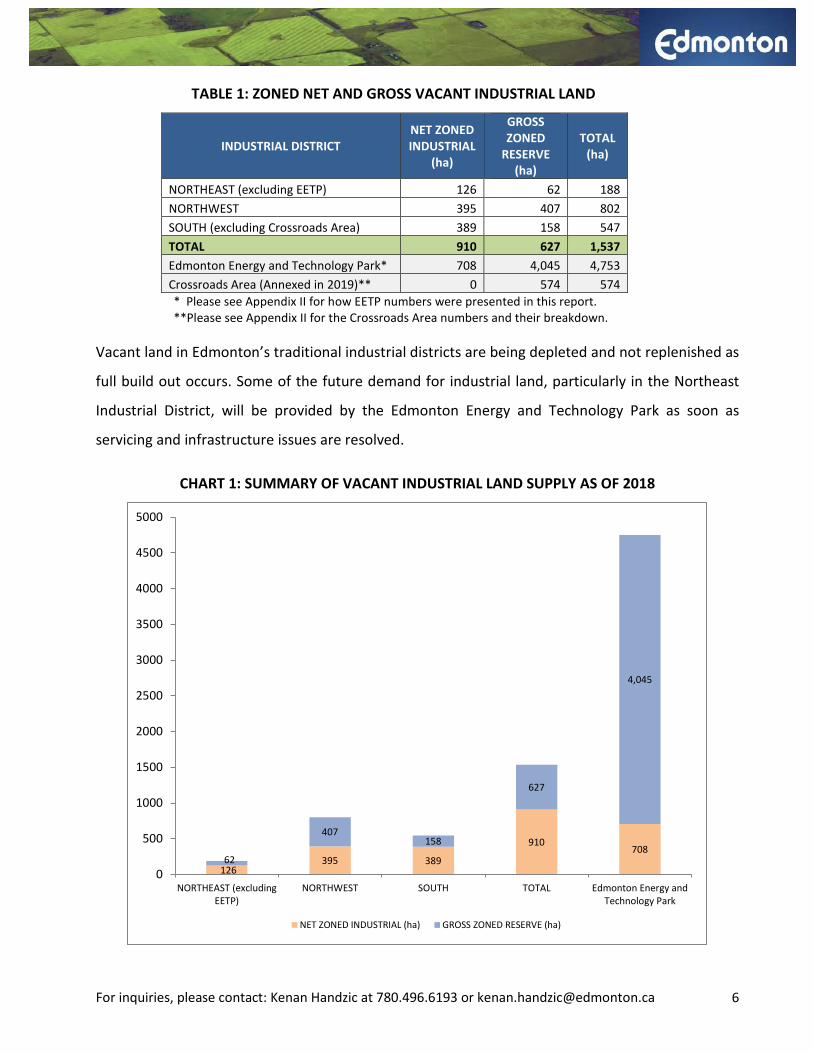
TABLE 1: ZONED NET AND GROSS VACANT INDUSTRIAL LAND
INDUSTRIAL DISTRICT NET ZONED INDUSTRIAL
(ha)
GROSS ZONED
RESERVE (ha)
TOTAL (ha)
NORTHEAST (excluding EETP) 126 62 188 NORTHWEST 395 407 802 SOUTH (excluding Crossroads Area) 389 158 547 TOTAL 910 627 1,537 Edmonton Energy and Technology Park* 708 4,045 4,753 Crossroads Area (Annexed in 2019)** 0 574 574 * Please see Appendix II for how EETP numbers were presented in this report. **Please see Appendix II for the Crossroads Area numbers and their breakdown.
Vacant land in Edmonton’s traditional industrial districts are being depleted and not replenished as
full build out occurs. Some of the future demand for industrial land, particularly in the Northeast
Industrial District, will be provided by the Edmonton Energy and Technology Park as soon as
servicing and infrastructure issues are resolved.
CHART 1: SUMMARY OF VACANT INDUSTRIAL LAND SUPPLY AS OF 2018
126 395 389
910 708
62
407 158
627
4,045
0
500
1000
1500
2000
2500
3000
3500
4000
4500
5000
NORTHEAST (excludingEETP)
NORTHWEST SOUTH TOTAL Edmonton Energy andTechnology Park
NET ZONED INDUSTRIAL (ha) GROSS ZONED RESERVE (ha)
For inquiries, please contact: Kenan Handzic at 780.496.6193 or [email protected] 6

It is important to note that some vacant lands within industrial areas face challenges that hinder
immediate development. These lands may not be available for industrial development due to
servicing and ownership constraints. The following maps also show that there is a concentration of
vacant industrial land at the edge of the city and pockets of infill opportunity within some of the
industrial neighbourhoods.
For inquiries, please contact: Kenan Handzic at 780.496.6193 or [email protected] 7
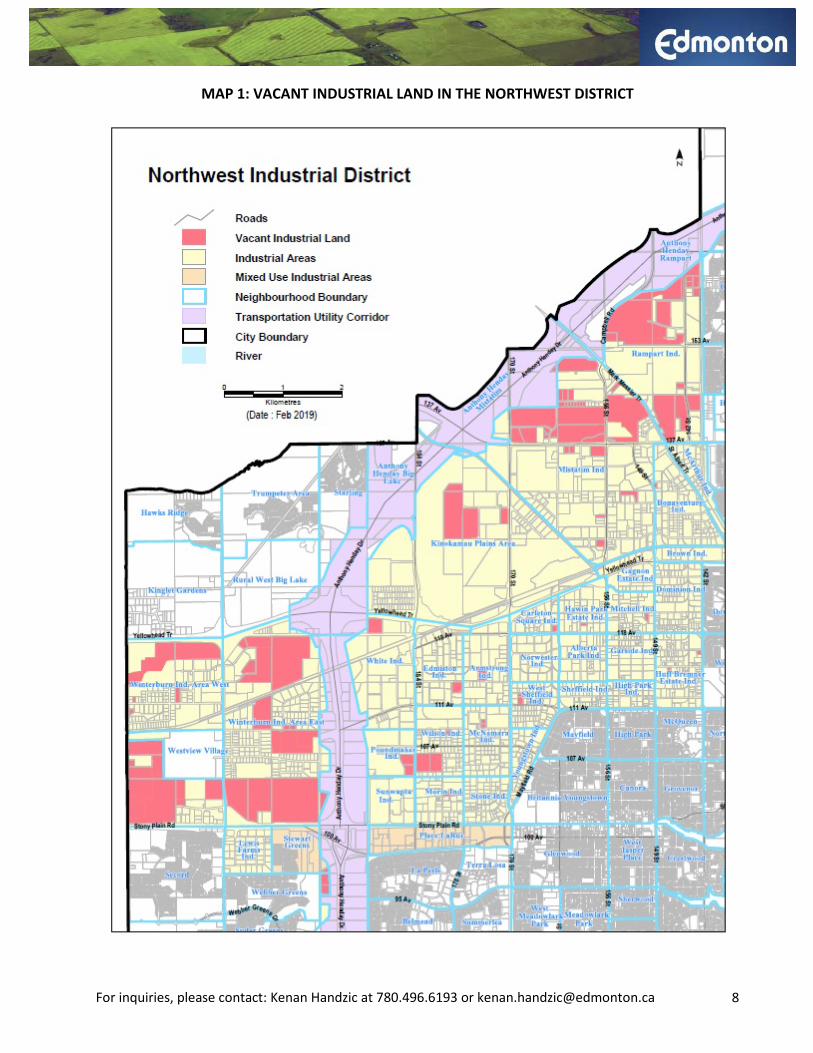
MAP 1: VACANT INDUSTRIAL LAND IN THE NORTHWEST DISTRICT
For inquiries, please contact: Kenan Handzic at 780.496.6193 or [email protected] 8

MAP 2: VACANT INDUSTRIAL LAND IN THE NORTHEAST DISTRICT
For inquiries, please contact: Kenan Handzic at 780.496.6193 or [email protected] 9
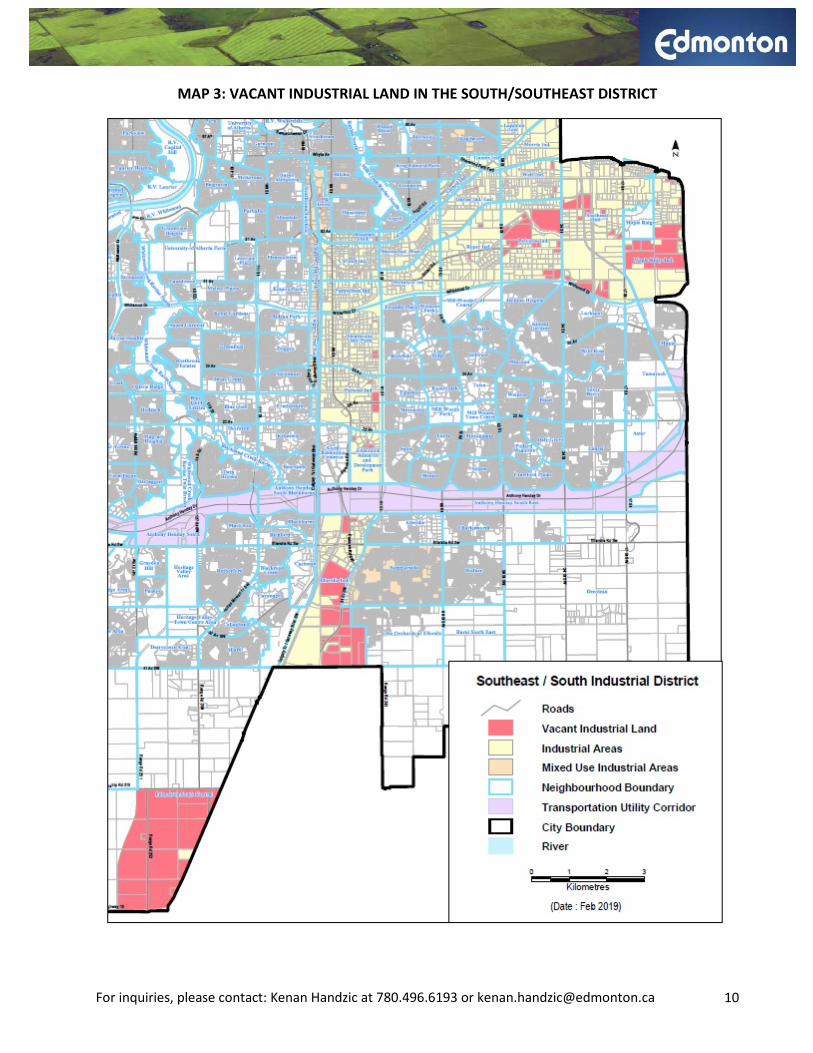
MAP 3: VACANT INDUSTRIAL LAND IN THE SOUTH/SOUTHEAST DISTRICT
For inquiries, please contact: Kenan Handzic at 780.496.6193 or [email protected] 10
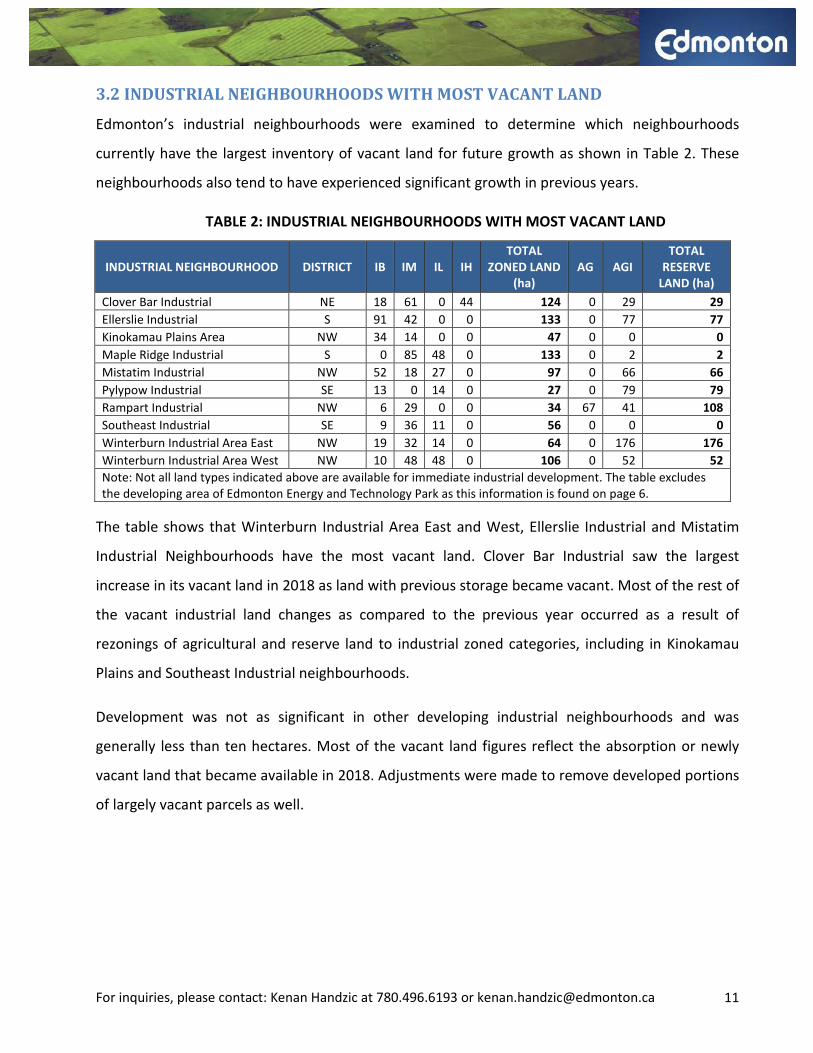
3.2 INDUSTRIAL NEIGHBOURHOODS WITH MOST VACANT LAND
Edmonton’s industrial neighbourhoods were examined to determine which neighbourhoods
currently have the largest inventory of vacant land for future growth as shown in Table 2. These
neighbourhoods also tend to have experienced significant growth in previous years.
TABLE 2: INDUSTRIAL NEIGHBOURHOODS WITH MOST VACANT LAND
INDUSTRIAL NEIGHBOURHOOD DISTRICT IB IM IL IH TOTAL
ZONED LAND (ha)
AG AGI TOTAL
RESERVE LAND (ha)
Clover Bar Industrial NE 18 61 0 44 124 0 29 29 Ellerslie Industrial S 91 42 0 0 133 0 77 77 Kinokamau Plains Area NW 34 14 0 0 47 0 0 0 Maple Ridge Industrial S 0 85 48 0 133 0 2 2 Mistatim Industrial NW 52 18 27 0 97 0 66 66 Pylypow Industrial SE 13 0 14 0 27 0 79 79 Rampart Industrial NW 6 29 0 0 34 67 41 108 Southeast Industrial SE 9 36 11 0 56 0 0 0 Winterburn Industrial Area East NW 19 32 14 0 64 0 176 176 Winterburn Industrial Area West NW 10 48 48 0 106 0 52 52 Note: Not all land types indicated above are available for immediate industrial development. The table excludes the developing area of Edmonton Energy and Technology Park as this information is found on page 6.
The table shows that Winterburn Industrial Area East and West, Ellerslie Industrial and Mistatim
Industrial Neighbourhoods have the most vacant land. Clover Bar Industrial saw the largest
increase in its vacant land in 2018 as land with previous storage became vacant. Most of the rest of
the vacant industrial land changes as compared to the previous year occurred as a result of
rezonings of agricultural and reserve land to industrial zoned categories, including in Kinokamau
Plains and Southeast Industrial neighbourhoods.
Development was not as significant in other developing industrial neighbourhoods and was
generally less than ten hectares. Most of the vacant land figures reflect the absorption or newly
vacant land that became available in 2018. Adjustments were made to remove developed portions
of largely vacant parcels as well.
For inquiries, please contact: Kenan Handzic at 780.496.6193 or [email protected] 11

3.3 INDUSTRIAL LAND ABSORPTION TREND
CHART 2: INDUSTRIAL LAND ABSORPTION IN HECTARES FOR 2018
Industrial absorption data is derived from development permits that the City of Edmonton collects.
The amount of land absorbed by new development (as per development permits issued) in
Edmonton’s industrial areas from January to December of 2018 totaled 31.6 hectares (Chart 2).
The largest land absorption of 21.0 hectares was in the Northwest Industrial Area and 6.4 hectares
in the Southeast Industrial Area. The White Industrial Neighbourhood experienced the largest
absorption at 8.6 hectares.
Much of the absorption was in the form of the construction of general industrial buildings (18.2) or
large warehouse (8.6 hectares). Absorption of industrial land has been slower in 2018 compared to
the previous year most likely due to the economic uncertainty and as previously-developed
industrial buildings are absorbed before new development starts. The least amount of absorption
of one hectare occurred in the South Industrial District. Development in 2018 has generally been in
the form of smaller-scale general industrial buildings and three large warehouses. Some limited
development in 2018 was in the form of new development on sites which were previously used for
storage or through intensification by adding new buildings on large unsubdived sites. Similar to the
previous year, there was no absorption in the Edmonton Energy and Technology Park in 2018.
Northeast Industrial Area, 4.2
Northwest Industrial Area, 21.0
Southeast Industrial Area, 6.4 South
Industrial Area, 1.1
For inquiries, please contact: Kenan Handzic at 780.496.6193 or [email protected] 12

The industrial land absorption from 2009 to 2018 was calculated for each industrial zone to
determine changes in land absorption over time (see Table 3). Subsequently, the average ten-year
absorption rate was calculated using the net annual land absorbed from 2009 to 2018 (shown in
Table 3 and Chart 3). The “net” land absorption defined by Western Management Consultantsi
means “land needs exclusive of allocations for roads, utility rights of way, drainage ponds, other
environmental reserves, municipal reserves, and any other land allocations not strictly for use by
the industrial business.” The calculation revealed an average absorption rate of 117 hectares per
year for the last decade. This was a decrease from 118 hectares from the previous year due to the
drop in development in 2018 because of no large infrastructure projects in industrial areas and
slower traditional industrial development.
CHART 3: TEN YEAR INDUSTRIAL LAND ABSORPTION TREND, 2009 TO 2018 (HECTARES)
0
20
40
60
80
100
120
140
160
2009 2010 2011 2012 2013 2014 2015 2016 2017 2018
IB IL
IM IH
For inquiries, please contact: Kenan Handzic at 780.496.6193 or [email protected] 13

TABLE 3: CITY OF EDMONTON INDUSTRIAL LAND ABSORPTION, 2009 TO 2018 (HECTARES)
CITY OF EDMONTON CITYWIDE INDUSTRIAL LAND ABSORPTION 2009 TO 2018
YEAR IB IL IM IH TOTAL 2009 4 16 18 51 89 2010 10 0 36 0 46 2011 79 27 77 0 183 2012 13 7 123 0 143 2013 115 0 146 30 291 2014 35 40 72 7 155 2015 47 0 30 1 78 2016 52 18 46 0 116
2017 14 2 19 0 35
2018 5 0 27 0 32 TOTAL (HA) 374 110 594 89 1,167
10 YEAR AVERAGE 37 11 59 9 117
The ten-year average industrial land absorption was 35 hectares for the Northeast Industrial
District, 47 hectares for the Northwest Industrial District, and 36 hectares for the South/Southeast
Industrial District, respectively (detailed breakdown in Table 4).
TABLE 4: INDUSTRIAL AREAS – TEN YEAR AVERAGE LAND ABSORPTION (2009 TO 2018)
INDUSTRIAL DISTRICT 10 YEAR TOTAL
2008- 2017
10 YEAR AVERAGE (HA)
Northeast Industrial District 347 35
Northwest Industrial District 466 47
South Industrial District 58 6
Southeast Industrial District 296 30
TOTAL (HA) 1,167 117
Similarly, it is vital to ascertain the amount of prime land in Edmonton that is left for economic
development. To do this, the net zoned vacant industrial lands (IB, IL, IM and IH) mentioned in
Table 1 of this report and the past ten-year average absorption rate indicated in Table 3 above
were matched against each another. When vacant land figures are divided by these absorption
rates, it shows that Edmonton could run out of zoned vacant land in traditional industrial areas in
approximately eight years depending on the rate of future development. However, new land is
rezoned every year from the reserve industrial areas, which by themselves, at current pace of
For inquiries, please contact: Kenan Handzic at 780.496.6193 or [email protected] 14

development can provide an additional four years of supply of industrial land. At the current pace
of development and with the exhaustion of all other supply of industrial land in Edmonton, the
EETP could provide 29 years of additional supply of industrial land assuming net area calculations.
Further, the currently-designated and recently annexed area in Crossroads Area or Discovery
Business Park could provide an additional three years of supply of industrial land assuming net
area calculations.
For inquiries, please contact: Kenan Handzic at 780.496.6193 or [email protected] 15
4. VACANT LAND: SERVICING AND PARCEL SIZE AVAILABILITY For servicing levels, lands were identified in one of four categories:
• Shovel-ready: Already serviced land that is available for development. Usually there is
presence of internal roads. This land is ready for a development permit application.
• Fully serviced and/or immediately serviceable lands: Servicing is in place or can be connected
when development is proposed. Lands that may be subdivided and/or have the presence of
servicing maps are good indicators.
• Partially serviced or potentially serviceable: Requires additional municipal infrastructure or
privately-financed extensions. Lands with rezonings and/or servicing maps are good
indicators.
• Unserviced or vacant long-term growth areas: Not expected to be fully serviced in the short-
term (e.g. five years). The presence of large AGI or AG parcels is a good indicator. Land areas
are usually represented as gross land figures.
4.1 SERVICING LEVEL BY ZONE Table 5 shows that there is generally a moderate supply of shovel-ready industrial sites in
Edmonton. The largest number of shovel-ready industrial sites is found in the Industrial Business
Zone (IB) and Medium Industrial Zone (IM) categories. As zoned industrial land is generally shovel-
ready, there is less of this type of land in the fully-serviced, partially-serviced and unserviced
categories. This is because significant investment is required for industrial development to bring
land to the last stage of the development. Further, Agricultural Zone (AG) and Industrial Reserve
Zone (AGI) parcels are usually unserviced, which is typical for these sites. They generally require
years to develop servicing extensions and subdivision approvals to become readily developable.
For inquiries, please contact: Kenan Handzic at 780.496.6193 or [email protected] 16

TABLE 5: NUMBER OF SITES BY SERVICING LEVEL
Servicing Level INDUSTRIAL NET (Number) INDUSTRIAL GROSS (Number) GRAND
TOTAL IB IL IM IH AG AGI Shovel ready 36 8 27 2 0 2 75 Fully serviced 19 7 27 3 0 3 59 Partially serviced 18 5 16 4 5 14 62 Unserviced 0 8 8 17 151 25 209 TOTAL 73 28 78 26 156 44 405
*Includes the Edmonton Energy and Technology Park under standard zones. Some parcels in EETP were split-zoned and as a result, remained under the AG Zone.
Table 6 shows that the different zones and levels of servicing are more evenly distributed for net
industrial areas. They are concentrated once again for the gross industrial areas, which is
overwhelmingly in the unserviced category. Of note is that Heavy Industrial Zoned (IH) parcels are
undersupplied in the city, which may be a reflection of the general nuisances created by some of
the activities under this zone. These sites tend to be located further away from residential uses,
either on the outskirts of the city or in adjacent municipalities. There is however a concentration of
this type of land, which is unserviced, in the Edmonton Energy and Technology Park under the
Chemical Cluster Zone (EETC).
TABLE 6: AREA AMOUNTS (HECTARES) BY SERVICING LEVEL
Servicing Level INDUSTRIAL NET (Area) INDUSTRIAL GROSS (Area) TOTAL
AREA IB IL IM IH AG AGI Shovel ready 61 17 68 6 0 5 158 Fully serviced 94 69 112 4 0 6 285 Partially serviced 152 36 189 44 23 188 633 Unserviced 0 156 180 428 4,084 366 5,215 TOTAL 308 278 549 483 4,107 565 6,290
*Includes the Edmonton Energy and Technology Park under standard zones.
4.2 PARCEL SIZE AVAILABILITY
Reserve lands are typically larger parcels that can be subdivided for future industrial uses. The
overwhelming amount of vacant industrial land is found in unsubdivided parcels of over ten
hectares in size, which is typically reserve industrial land that will be developed in the long-term
(see Table 7). The 0.5 to 2 hectares, 2 to 5 hectares, and 5 to 10 hectares have a comparable share
of land area, ranging from two to five percent. The type of industrial development that is most
prominent in Edmonton takes place on the 0.5 to 2 hectare and 2 to 5 hectare size categories (see
For inquiries, please contact: Kenan Handzic at 780.496.6193 or [email protected] 17

Tables 7 to 9). There are only 381 hectares of land in these categories, or around three years of
future absorption based on the past decade absorption figures. These parcels typically get
subdivided from the 5 to 10 hectare and above 10 hectare size categories, so the short three-year
time period may present challenges for industrial development. Most want to locate on these
lands, especially in certain in-demand parts of the city. Subdivision, servicing and infrastructure
provision can take two or more years. However, these categories typically get replenished each
year, which provides some stability. The unstable pace of development can be explained by the
nature of the risk-averse and investment-intensive industrial development industry as a result of
the upfront infrastructure cost requirements.
TABLE 7: AREA AND NUMBER OF ALL VACANT ZONED AND RESERVE INDUSTRIAL LAND PARCELS AND SIZE IN 2018
INVENTORY OF ZONED AND RESERVE VACANT INDUSTRIAL LAND PARCELS
Size Area of Land (ha)
Share of Land Area
Number of Sites
Share of Total Number*
TOTAL (0.5-2 ha) 131 2% 118 29% TOTAL (2-5 ha) 250 4% 76 19% TOTAL (5-10 ha) 311 5% 44 11% TOTAL (Above 10 ha) 5,598 89% 169 42% TOTAL (All) 6,290 100% 407 100%
Table 8 shows a breakdown of the number of parcels based on their size and zoning. There is a
shortage of Heavy Industrial sites in most categories. For the most part, there is a balanced
number of net industrial zoned sites. However, there is typically less Light Industrial sites in the 0.5
to 2 hectare and the 2 to 5 hectare categories. Light Industrial Zone is preferable to the existing
greater concentration of vacant sites in the Industrial Business Zone since Light Industrial Zone
sites are limited to industrial uses specifically. The Industrial Business Zone has commercial and
institutional uses that may erode the viability of industrial areas, due to issues such as risk faced
from the proximity of various nuisances and hazardous uses in heavier industrial zones, increased
traffic impacts from institutional and commercial uses, and less concentration and/or quality of
jobs in the non-industrial uses.
For inquiries, please contact: Kenan Handzic at 780.496.6193 or [email protected] 18

TABLE 8: NUMBER OF INDUSTRIAL LAND PARCELS BY SIZE AND ZONING
Size INDUSTRIAL NET (Number) INDUSTRIAL GROSS (Number)
IB IL IM IH AG AGI 0.5 to 2 ha 44 7 37 5 14 11 2 to 5 ha 18 7 15 5 21 10 5 to 10 ha 9 7 7 3 14 4 Above 10 ha 4 7 19 13 107 19 TOTAL 75 28 78 26 156 44
*The table includes the Edmonton Energy and Technology Park under standard zones and does not include the annexed lands in 2019.
Table 9 shows a similar context but provides the total area in hectares for the parcels of different
size categories.
TABLE 9: AREA OF INDUSTRIAL LAND PARCELS BY ZONING AND SIZE
Size INDUSTRIAL NET (Area) INDUSTRIAL GROSS (Area) TOTAL AREA
IB IL IM IH AG AGI 0.5 to 2 ha 47 10 37 5 20 12 131
2 to 5 ha 61 23 50 15 65 36 250 5 to 10 ha 68 48 49 19 96 31 311
Above 10 ha 131 198 413 444 3,926 486 5,598
TOTAL 308 278 549 483 4,107 565 6,290
*The table includes the Edmonton Energy and Technology Park under standard zones.
4.3 SERVICING AND PARCEL SIZE AVAILABILITY
By combining servicing levels and parcel size information, it becomes further evident which
categories of vacant industrial land shortages exist. As seen in Table 10 below, there is a general
concentration of land in the unserviced and partially serviced category, especially for larger
parcels. However, it is important for Edmonton to have shovel-ready and fully-serviced land that is
readily developable in the near term and in every size category to accommodate the needs of
different businesses. There is a shortage of sites in the 5 to 10 hectare size category that is shovel-
ready, which is below twenty hectares in total. Fully and partially serviced sites that are between
0.5 and 2 hectares also comprise an area around or below 30 hectares. Shovel ready and fully
For inquiries, please contact: Kenan Handzic at 780.496.6193 or [email protected] 19

serviced sites in other categories are generally around 20 to 70 hectares. This could result in
challenges for industry trying to accommodate unique businesses with specific site requirements
unless land is rezoned, subdivided and serviced at a fast pace. The amount of land in the shovel-
ready category decreased, while in the fully serviced category it increased from the previous year.
There was an addition of around 75 hectares in the fully serviced category, including an increase of
around five hectares in the 0.5 to 2 hectares, 20 hectares in the 5 to 10 hectares, and 50 hectares
in the above 10 hectares categories. This is mostly as a result of large sites getting subdivided,
serviced, and also brought back into the vacant land category after being previously used for
storage in Aurum/Clover Bar Industrial.
TABLE 10: AREA OF INDUSTRIAL LAND PARCELS BY SERVICING CATEGORY (HECTARES)
Sum of Total Area Servicing Size Category Total
Shovel-ready
0.5-2 ha 63 2-5 ha 49 5-10 ha 12 Above 10 ha 34 Total 158
Fully serviced
0.5-2 ha 27 2-5 ha 47 5-10 ha 64 Above 10 ha 146 Total 285
Partially serviced
0.5-2 ha 12 2-5 ha 59 5-10 ha 98 Above 10 ha 464 Total 633
Unserviced
0.5-2 ha 28 2-5 ha 95 5-10 ha 137 Above 10 ha 4,955 Total 5,215
TOTAL 6,290
For inquiries, please contact: Kenan Handzic at 780.496.6193 or [email protected] 20
5. BUILDING PERMITS ISSUED
Building permit values are calculated in a slightly different fashion than the method used for
vacant land in this report. They are calculated outside of the GIS tracking system using data
provided from a Posse database. All new significant building activity, whether on a vacant site or a
site with existing development is tracked to help understand the major industrial building activity
taking place in the city. The information presented in this section uses tables for simple
comparison. These figures are generally rounded and approximate for individual permits, and may
not capture all the construction value, which has not been provided or recorded in some instances.
For example, construction values for foundations are generally not provided.
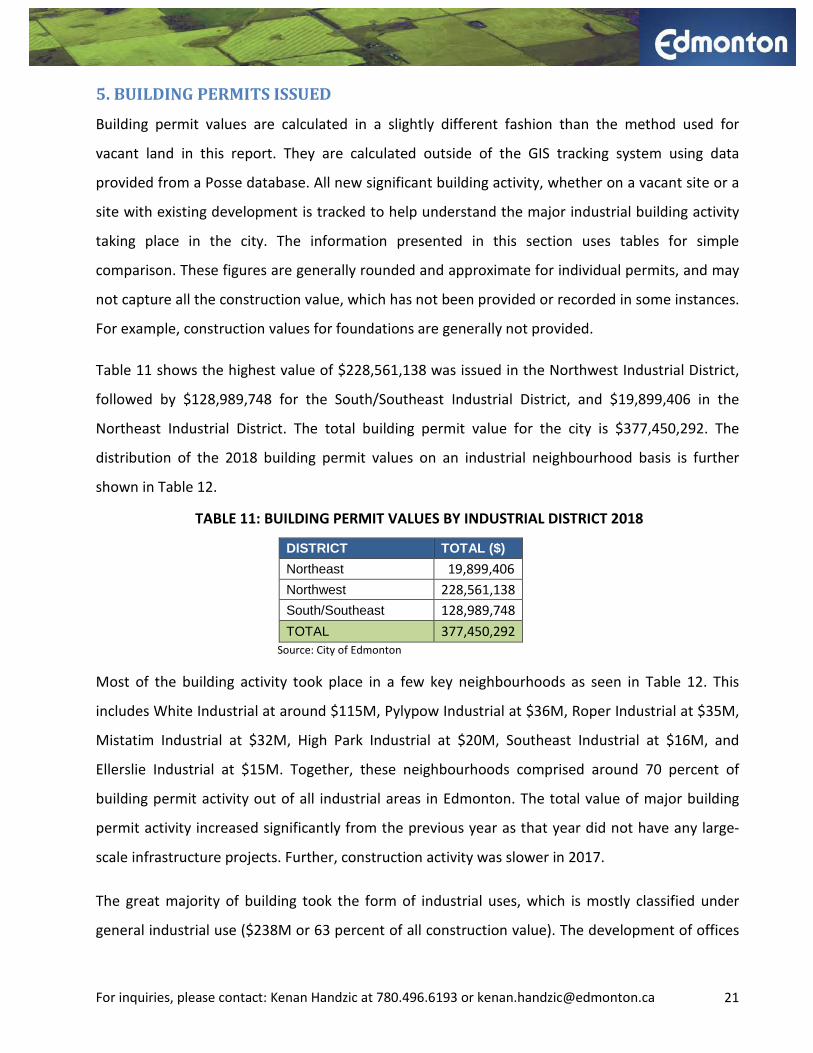
Table 11 shows the highest value of $228,561,138 was issued in the Northwest Industrial District,
followed by $128,989,748 for the South/Southeast Industrial District, and $19,899,406 in the
Northeast Industrial District. The total building permit value for the city is $377,450,292. The
distribution of the 2018 building permit values on an industrial neighbourhood basis is further
shown in Table 12.
TABLE 11: BUILDING PERMIT VALUES BY INDUSTRIAL DISTRICT 2018
DISTRICT TOTAL ($) Northeast 19,899,406 Northwest 228,561,138 South/Southeast 128,989,748 TOTAL 377,450,292
Source: City of Edmonton
Most of the building activity took place in a few key neighbourhoods as seen in Table 12. This
includes White Industrial at around $115M, Pylypow Industrial at $36M, Roper Industrial at $35M,
Mistatim Industrial at $32M, High Park Industrial at $20M, Southeast Industrial at $16M, and
Ellerslie Industrial at $15M. Together, these neighbourhoods comprised around 70 percent of
building permit activity out of all industrial areas in Edmonton. The total value of major building
permit activity increased significantly from the previous year as that year did not have any large-
scale infrastructure projects. Further, construction activity was slower in 2017.
The great majority of building took the form of industrial uses, which is mostly classified under
general industrial use ($238M or 63 percent of all construction value). The development of offices
For inquiries, please contact: Kenan Handzic at 780.496.6193 or [email protected] 21

represented the second most common form of building permits ($47M). However, there was
significant variety of public utility development ($48M) including solar collector installations ($1M).
There was also significant new construction in the form of service retail, gas bar, auto sales and
commercial warehouse uses in industrial areas ($46M) in 2018. Figures in 2018 were significantly
impacted (more than $1M and less than $10M) by the renovations of several transit centres in
industrial areas and the construction of the Valley Line LRT Garry Wright Operations and
Maintenance Facility in Roper Industrial ($35M), which are captured under public utility
development. More specifically, there was large-scale warehouse construction throughout the city
but mainly in White Industrial ($115M), the construction of a hotel in Mistatim Industrial ($8M),
and new general industrial buildings in Pylypow Industrial. However, there was also a wide variety
of development throughout established and developing industrial areas on a citywide scale,
including intensification of existing and developed sites, which represented more than 60 percent
of the total building permit value.
For inquiries, please contact: Kenan Handzic at 780.496.6193 or [email protected] 22

TABLE 12: BUILDING PERMIT VALUES BY INDUSTRIAL NEIGHBOURHOOD 2018
SECTOR NEIGHBOURHOOD TOTAL ($)NORTHEAST BELVEDERE 3,900,000
CLOVER BAR AREA 10,384,406GORMAN 965,000HOMESTEADER 2,000,000INDUSTRIAL HEIGHTS 250,000KENNEDALE INDUSTRIAL 1,125,000MONTROSE 1,200,000YELLOWHEAD CORRIDOR EAST 75,000TOTAL 19,899,406
NORTHWEST CARLETON SQUARE INDUSTRIAL 150,000DOMINION INDUSTRIAL 520,000GAGNON ESTATE INDUSTRIAL 180,000HAGMANN ESTATE INDUSTRIAL 4,650,000HAWIN PARK ESTATE INDUSTRIAL 668,000HIGH PARK INDUSTRIAL 20,295,000LEWIS FARMS INDUSTRIAL 4,818,000MCNAMARA INDUSTRIAL 50,000MISTATIM INDUSTRIAL 32,461,044MITCHELL INDUSTRIAL 11,298,035MORIN INDUSTRIAL 9,961,372MORRIS INDUSTRIAL 105,000PLACE LARUE 8,847,280POUNDMAKER INDUSTRIAL 7,100,000RAMPART INDUSTRIAL 6,100,000WHITE INDUSTRIAL 115,367,345WINTERBURN INDUSTRIAL EAST 350,000WINTERBURN INDUSTRIAL WEST 2,731,342YOUNGSTOWN INDUSTRIAL 2,908,720TOTAL 228,561,138
SOUTH CALGARY TRAIL SOUTH 5,000CORONET INDUSTRIAL 1,050,000DAVIES INDUSTRIAL WEST 3,971,798EASTGATE BUSINESS PARK 325,000ELLERSLIE INDUSTRIAL 14,600,282GAINER INDUSTRIAL 200,000MAPLE RIDGE INDUSTRIAL 685,500MORRIS INDUSTRIAL 335,000PARSONS INDUSTRIAL 523,000PYLYPOW INDUSTRIAL 36,045,810RITCHIE 760,000ROPER INDUSTRIAL 34,772,041SOUTHEAST INDUSTRIAL 16,336,999STRATHCONA INDUSTRIAL PARK 600,000STRATHCONA JUNCTION 4,705,000SUMMERSIDE 9,478,325WEIR INDUSTRIAL 4,595,993TOTAL 128,989,748
EDMONTON TOTAL 377,450,292
For inquiries, please contact: Kenan Handzic at 780.496.6193 or [email protected] 23

Looking at the building permit value trends from 2009 to 2018 in Chart 6 below, values of building
permits have increased for 2018 in comparison to previous two years. Building permit activity
overall increased by around $271M from 2017 to 2018. This is due to several factors, including
increased overall building activity throughout Edmonton’s industrial areas on a general basis, and
the construction of several large warehouses and general industrial uses, especially in White
Industrial ($115M). This makes 2018 the record year for building construction for the past decade
despite the uncertainties in the economy. The ten-year period ending in 2018 was above average
for industrial building activity, being around $10M higher than the previous ten-year period. It was
still $13M lower than the ten-year period ending in 2016, which reflected the negative effect of
the very slow 2017. As previously referenced, South and Southeast Industrial Districts have been
combined for 2014 and onwards.
CHART 6: BUILDING PERMIT VALUES TEN YEAR BUILDING PERMIT VALUES TREND (2009 TO 2018)
For inquiries, please contact: Kenan Handzic at 780.496.6193 or [email protected] 24
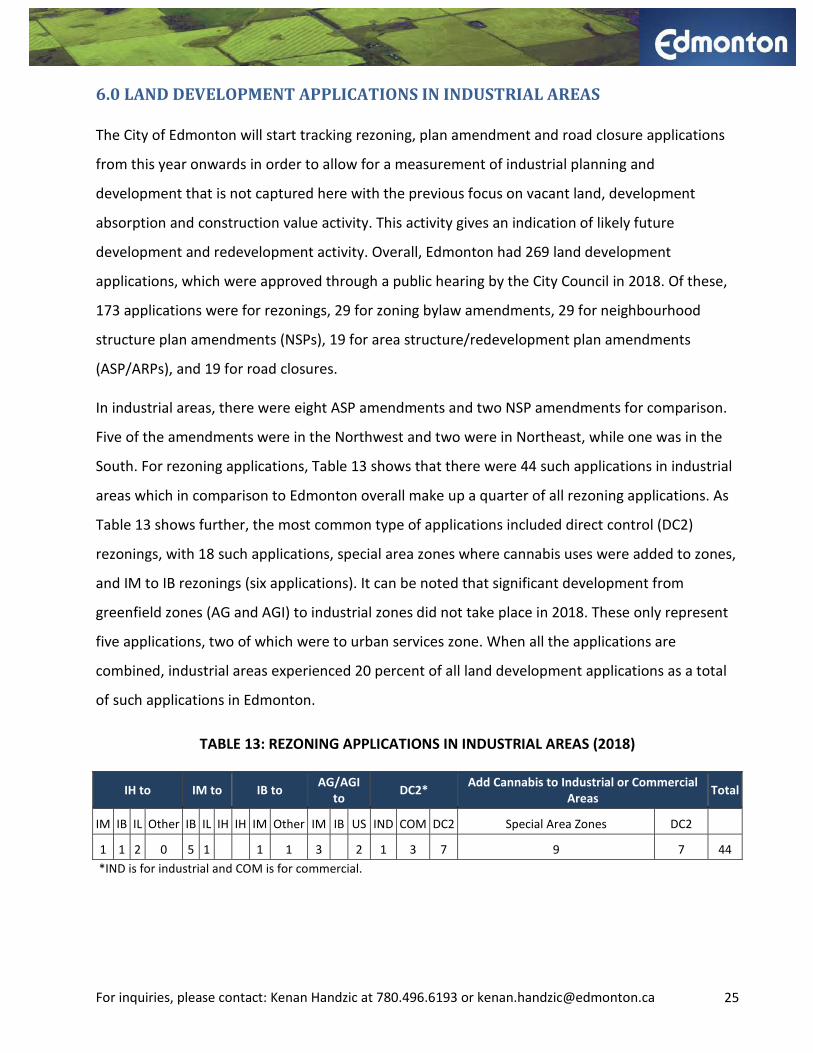
6.0 LAND DEVELOPMENT APPLICATIONS IN INDUSTRIAL AREAS The City of Edmonton will start tracking rezoning, plan amendment and road closure applications
from this year onwards in order to allow for a measurement of industrial planning and
development that is not captured here with the previous focus on vacant land, development
absorption and construction value activity. This activity gives an indication of likely future
development and redevelopment activity. Overall, Edmonton had 269 land development
applications, which were approved through a public hearing by the City Council in 2018. Of these,
173 applications were for rezonings, 29 for zoning bylaw amendments, 29 for neighbourhood
structure plan amendments (NSPs), 19 for area structure/redevelopment plan amendments
(ASP/ARPs), and 19 for road closures.
In industrial areas, there were eight ASP amendments and two NSP amendments for comparison.
Five of the amendments were in the Northwest and two were in Northeast, while one was in the
South. For rezoning applications, Table 13 shows that there were 44 such applications in industrial
areas which in comparison to Edmonton overall make up a quarter of all rezoning applications. As
Table 13 shows further, the most common type of applications included direct control (DC2)
rezonings, with 18 such applications, special area zones where cannabis uses were added to zones,
and IM to IB rezonings (six applications). It can be noted that significant development from
greenfield zones (AG and AGI) to industrial zones did not take place in 2018. These only represent
five applications, two of which were to urban services zone. When all the applications are
combined, industrial areas experienced 20 percent of all land development applications as a total
of such applications in Edmonton.
TABLE 13: REZONING APPLICATIONS IN INDUSTRIAL AREAS (2018)
IH to IM to IB to AG/AGI to DC2* Add Cannabis to Industrial or Commercial
Areas Total
IM IB IL Other IB IL IH IH IM Other IM IB US IND COM DC2 Special Area Zones DC2
1 1 2 0 5 1
1 1 3
2 1 3 7 9 7 44 *IND is for industrial and COM is for commercial.
For inquiries, please contact: Kenan Handzic at 780.496.6193 or [email protected] 25

7.0 CONCLUSION The overall vacant land supply shows that there is a stable supply from year to year. This total
overall supply will serve Edmonton’s needs in the medium-term. This report shows that the City of
Edmonton is currently experiencing a shortage of “developable”, “serviced” and “industrial zoned”
vacant land to meet both short and medium-term land demands. This is similar in comparison to
the available vacant land in these categories for the previous year. This shortage, if compared to
demand, is most acute in the South/Southeast Industrial District of the city and in the IB and IL
zones, particularly for shovel-ready and fully serviced sites in various land size categories. The
recently-annexed lands north of Edmonton International Airport bring much needed supply of
business and industrial lands to this part of the city for Edmonton and will provide some relief for
future industrial development. With the creation of the new Municipal Development Plan in the
next year, there is an opportunity to designate more of the annexed land as business employment
and industrial lands to allow for the expansion of this valuable type of land. The City of Edmonton
has an opportunity to work with various stakeholders to update the Industrial Land Strategy to find
servicing solutions so that Edmonton can accommodate and attract a wide variety of industrial
activity. There is a need for serviced and industrial zoned land in all areas of the city to
accommodate new development, investment and business retention.
For inquiries, please contact: Kenan Handzic at 780.496.6193 or [email protected] 26

APPENDIX I The methodology used in this report is different from previous reports (prior to 2015) on the
industrial land supply in the City of Edmonton. The difference lies in using GIS software
(GeoMedia) to track the vacant land information. Tracking the information using GIS mapping tools
allows for more efficiency, consistency, and ease in comparison from year to year. This approach
includes vacant industrial land data from the City of Edmonton’s Tax Assessment Control System
based on codes found in Table 12. For clarity, additional explanations of zoning and land use
classifications applicable for the industrial areas are given:
• Zoned land refers to vacant parcels of land within industrial areas that are zoned for industrial
uses: IB, IM, IL, IH, direct control zones with industrial uses, or special industrial zones, EETB,
EETC, EETL, EETM, EETR, EIB and EIM. The parcels of land are also classified under land use
codes found in Table 1.
• Reserve land refers to vacant parcels of land within industrial areas that have been designated
for future industrial uses and zoned AG or AGI. The parcels of land are also classified under Land
Use Codes stated in Table 12 below.
• Reserve land is available for rezoning to IB, IM, IL, or IH Zones that allow for industrial uses.
• Other zoned land refers to vacant parcels of land which are within the industrial areas that have
been designated as non-industrial or zoned as A, AJ, AN, AP, CB1, CB2, CB3, CHY, CNC, CO, CSC,
DC1, DC2, NA, PU, RA7, RF1, RF4, RF5, RMH, RPL, RR, RSL, UI or US. The parcels of land are also
classified under the Land Use Codes stated in Table 12 below. These parcels of land are not
considered, in this analysis, as available for industrial development.
• The report also removed areas that will be non-developable or non-industrial in the future,
including those with water bodies, resource development, small size, recent construction,
oil/gas pipelines, utility right-of-ways, physical constraints, parking and temporary storage.
Further analysis was completed according to zoning, servicing levels and parcel sizes.
The report covers the period from January to December of 2018.
For inquiries, please contact: Kenan Handzic at 780.496.6193 or [email protected] 27
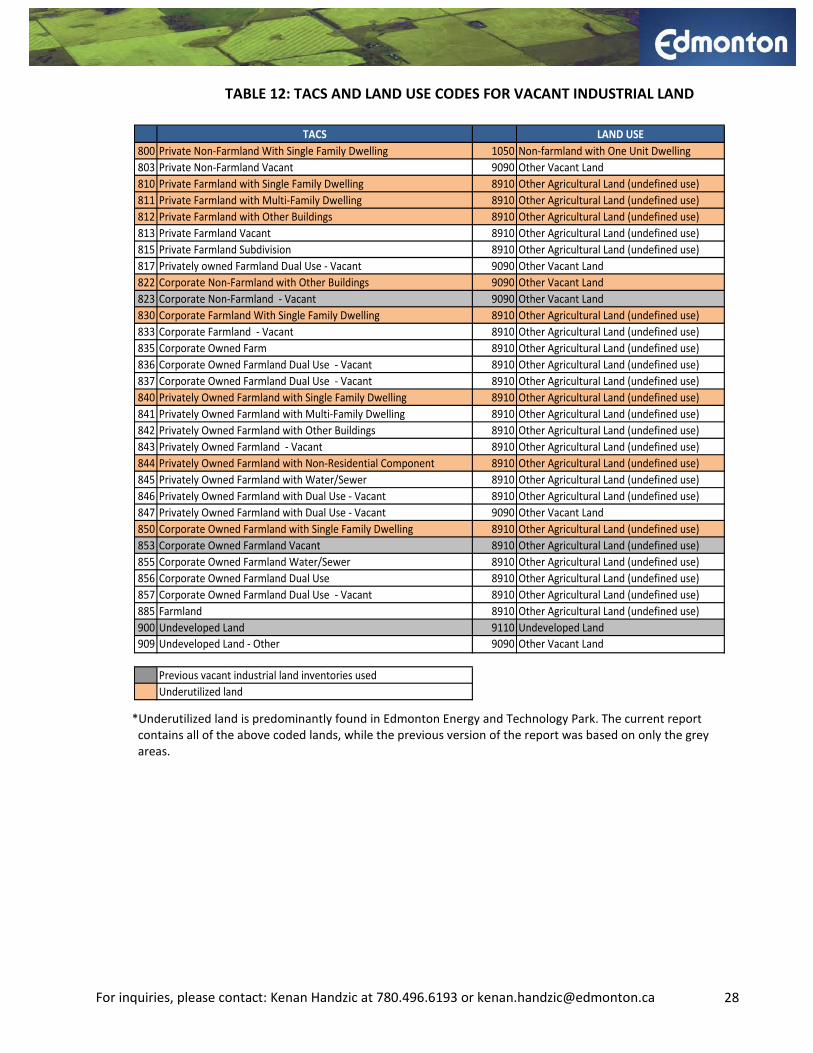
TABLE 12: TACS AND LAND USE CODES FOR VACANT INDUSTRIAL LAND
TACS LAND USE 800 Private Non-Farmland With Single Family Dwelling 1050 Non-farmland with One Unit Dwelling803 Private Non-Farmland Vacant 9090 Other Vacant Land810 Private Farmland with Single Family Dwelling 8910 Other Agricultural Land (undefined use)811 Private Farmland with Multi-Family Dwelling 8910 Other Agricultural Land (undefined use)812 Private Farmland with Other Buildings 8910 Other Agricultural Land (undefined use)813 Private Farmland Vacant 8910 Other Agricultural Land (undefined use)815 Private Farmland Subdivision 8910 Other Agricultural Land (undefined use)817 Privately owned Farmland Dual Use - Vacant 9090 Other Vacant Land822 Corporate Non-Farmland with Other Buildings 9090 Other Vacant Land823 Corporate Non-Farmland - Vacant 9090 Other Vacant Land830 Corporate Farmland With Single Family Dwelling 8910 Other Agricultural Land (undefined use)833 Corporate Farmland - Vacant 8910 Other Agricultural Land (undefined use)835 Corporate Owned Farm 8910 Other Agricultural Land (undefined use)836 Corporate Owned Farmland Dual Use - Vacant 8910 Other Agricultural Land (undefined use)837 Corporate Owned Farmland Dual Use - Vacant 8910 Other Agricultural Land (undefined use)840 Privately Owned Farmland with Single Family Dwelling 8910 Other Agricultural Land (undefined use)841 Privately Owned Farmland with Multi-Family Dwelling 8910 Other Agricultural Land (undefined use)842 Privately Owned Farmland with Other Buildings 8910 Other Agricultural Land (undefined use)843 Privately Owned Farmland - Vacant 8910 Other Agricultural Land (undefined use)844 Privately Owned Farmland with Non-Residential Component 8910 Other Agricultural Land (undefined use)845 Privately Owned Farmland with Water/Sewer 8910 Other Agricultural Land (undefined use)846 Privately Owned Farmland with Dual Use - Vacant 8910 Other Agricultural Land (undefined use)847 Privately Owned Farmland with Dual Use - Vacant 9090 Other Vacant Land850 Corporate Owned Farmland with Single Family Dwelling 8910 Other Agricultural Land (undefined use)853 Corporate Owned Farmland Vacant 8910 Other Agricultural Land (undefined use)855 Corporate Owned Farmland Water/Sewer 8910 Other Agricultural Land (undefined use)856 Corporate Owned Farmland Dual Use 8910 Other Agricultural Land (undefined use)857 Corporate Owned Farmland Dual Use - Vacant 8910 Other Agricultural Land (undefined use)885 Farmland 8910 Other Agricultural Land (undefined use)900 Undeveloped Land 9110 Undeveloped Land909 Undeveloped Land - Other 9090 Other Vacant Land
Previous vacant industrial land inventories usedUnderutilized land
*Underutilized land is predominantly found in Edmonton Energy and Technology Park. The current report contains all of the above coded lands, while the previous version of the report was based on only the grey areas.
For inquiries, please contact: Kenan Handzic at 780.496.6193 or [email protected] 28

APPENDIX II
Edmonton Energy and Technology Park (EETP) was separated in some tables of this report as this
area represents the next area in the development of Edmonton’s industrial land. In other tables,
including those covering servicing and size of parcels, EETP was included under similar standard
industrial zones in order to facilitate the demonstration of the information. It is important to note
that the newly rezoned Chemical Cluster Zone (EETC) has 428 hectares of land in EETP. There are
115 hectares of zoned Logistics (EETL) and 165 hectares of Manufacturing (EETM) areas. The rest
of the area is vacant gross area that comprises 4,045 hectares. Most of the parcels are unserviced
and above ten hectares.
The recently-annexed Crossroads Area or Discovery Business Park became a part of City of
Edmonton boundaries on January 1, 2019. This area contains an additional land area of 574
hectares of currently industrially-designated land. Future land in the annexed area will likely
contain more industrial or business employment land once further planning takes place.
Most of this unserviced land or around 95 percent is above 10 hectares in size. The land is being
subdivided and serviced from the south or Highway 19, immediately north of Edmonton
International Airport. This gross vacant land is further divided into a number of subdesignations,
including commercial (42 hectares), business park including light manufacturing without storage
(122 hectares), and logistics and distribution (411 hectares). The commercial and business park
subdesignations generally correspond to the IB Zone in Edmonton, while the logistics and
distribution subdesignation generally corresponds to the IL Zone and IM Zone (with some
manufacturing).
i Western Management Consultants, 2000. “Industrial Land Strategy Demand Study Final Report”, City of Edmonton, June 30, 2000.
For inquiries, please contact: Kenan Handzic at 780.496.6193 or [email protected] 29