Embed Size (px)
Citation preview

Attachment F
1988 Stream Sanitation Modeling Memoranda Qual2K Water Quality Model


FINAL REPORT | Prepared for
Hanover County Department of
Public Utilities
Dissolved Oxygen Modeling of the North Anna, South Anna, and Pamunkey River System
November 25, 2020

3454 West Clay Street
Richmond, VA 23230
Dissolved Oxygen Modeling of the North Anna, South Anna, and Pamunkey River System
Prepared for
Hanover County, V i rg inia
November 25, 2020
ii
Table of Contents
List of Figures .............................................................................................................................................. iii
List of Tables ............................................................................................................................................... iii
List of Abbreviations ................................................................................................................................... iv
ES Executive Summary ..................................................................................................................... 1
1. Introduction .......................................................................................................................................1-1
2. Data Sources and Methods ..............................................................................................................2-1
2.1 Model Code Selection .............................................................................................................2-1
2.2 Model Domain and Set-Up .....................................................................................................2-1
2.2.1 Reach Properties ......................................................................................................2-1
2.2.2 Water Column Rates ................................................................................................2-5
2.2.3 Algal Parameters ......................................................................................................2-6
2.2.4 Light and Heat Parameters ......................................................................................2-6
2.3 Calibration and Corroboration Scenarios ..............................................................................2-6
2.3.1 Headwater and Diffuse Inflows ...............................................................................2-7
2.3.2 Point Source Inputs ..................................................................................................2-7
2.3.3 Conversion of CBOD5 to CBODU .............................................................................2-8
2.3.4 Bioavailable Organic Nitrogen .................................................................................2-9
2.3.5 Meteorological Data .................................................................................................2-9
2.4 Model Calibration and Corroboration Results .......................................................................2-9
2.4.1 Model Calibration Results ........................................................................................2-9
2.4.2 Model Corroboration Results ................................................................................ 2-10
3. Management Scenario Descriptions ................................................................................................3-1
3.1 Overview of Model Scenarios .................................................................................................3-1
3.2 Management Scenario Model Input Parameters .................................................................3-2
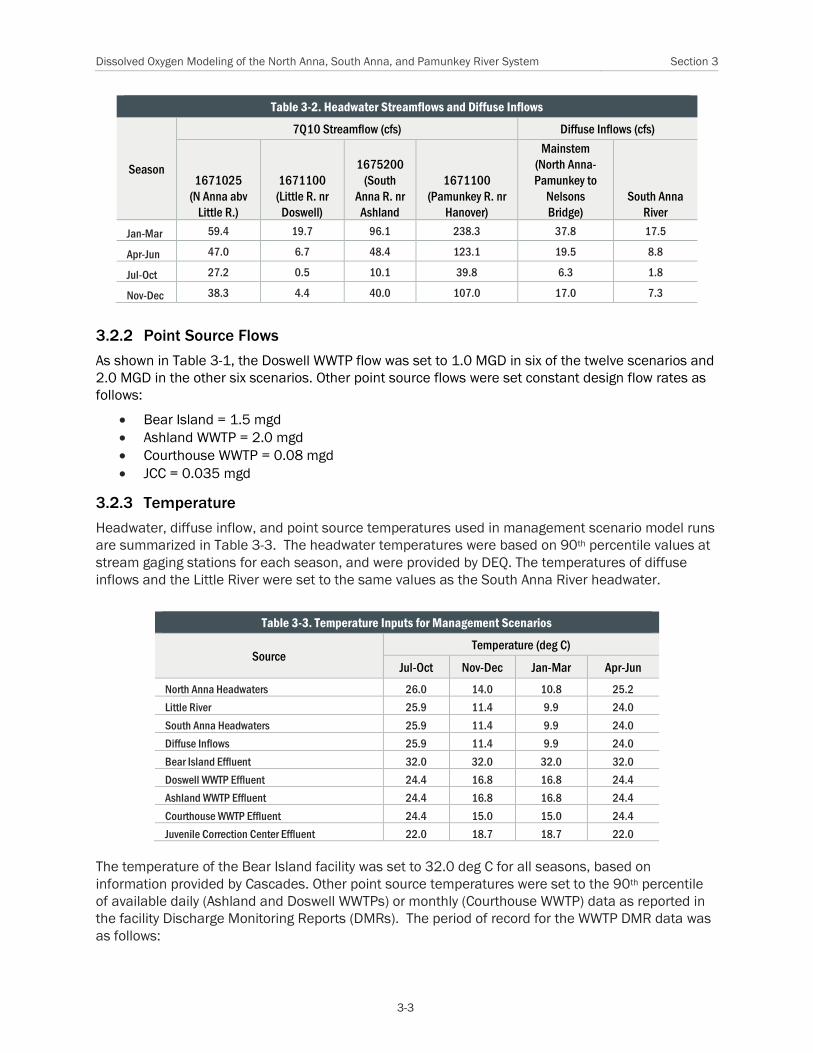
3.2.1 Headwater and Diffuse Inflows ...............................................................................3-2
3.2.2 Point Source Flows ...................................................................................................3-3
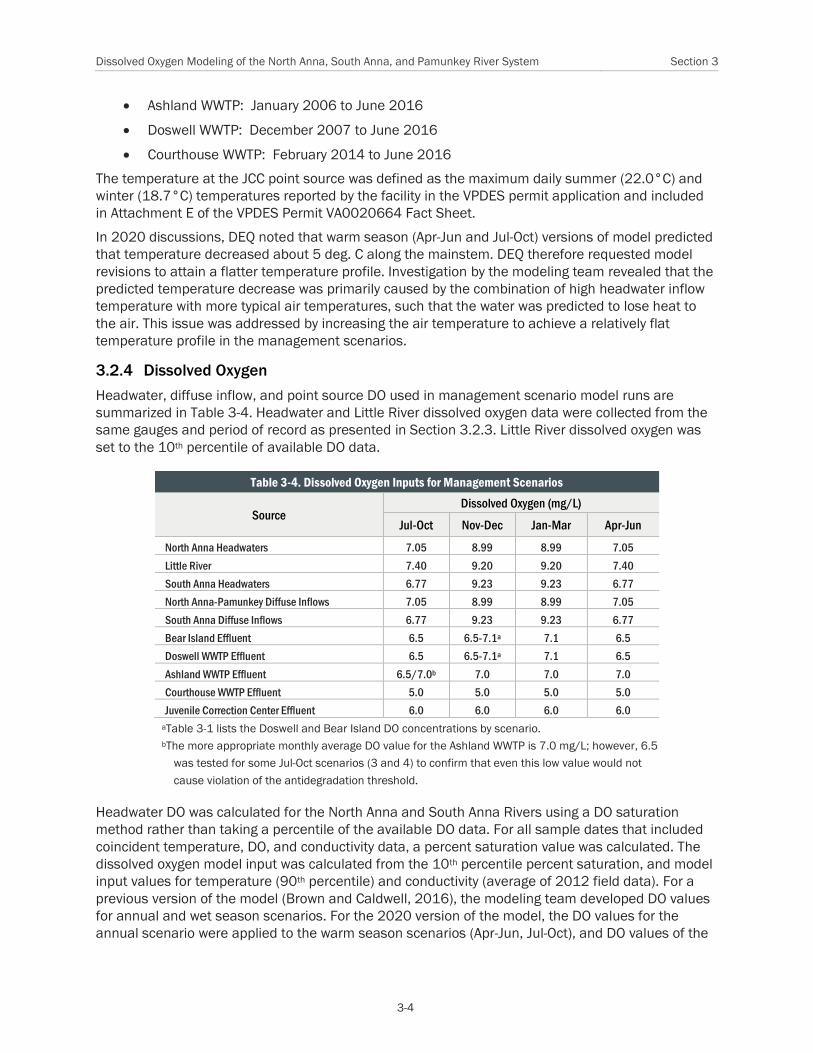
3.2.3 Temperature .............................................................................................................3-3
3.2.4 Dissolved Oxygen ......................................................................................................3-4
3.2.5 pH ..............................................................................................................................3-5
3.2.6 Headwater and Diffuse Inflow Water Quality ..........................................................3-6
3.2.7 Biochemical Oxygen Demand ..................................................................................3-6
3.2.8 Nitrogen Species ......................................................................................................3-6
3.2.9 Meteorological Data .................................................................................................3-7
4. Management Scenario Results ........................................................................................................4-1
5. References ........................................................................................................................................5-1
Appendix A: Field and Lab Data ............................................................................................................... A-1

Dissolved Oxygen Modeling of the North Anna, South Anna, and Pamunkey River System Table of Contents
iii
Calibration Data Set: September 26-27, 2012 ............................................................................... A-1
Corroboration Data Set: October 10-11, 2012 ............................................................................... A-1
Appendix B: Calibration and Corroboration Charts ................................................................................ B-1
Appendix C: Detailed Point Source Inputs for Management Scenarios ................................................C-1
Appendix D: Dissolved Oxygen Profiles for Management Scenarios .................................................... D-1
Appendix E: Average DO and Delta DO by Segment and Scenario ........................................................ E-1
List of Figures
Figure 2-1. QUAL2K Schematic ................................................................................................................2-2
List of Tables
Table 2-1. QUAL2K Reach Data ...............................................................................................................2-3
Table 2-2. QUAL2K Hydraulic Model Components .................................................................................2-3
Table 2-3. QUAL2K Sediment Oxygen Demand ......................................................................................2-4
Table 2-4. Oxidation, Nitrification, and Hydrolysis Rates .......................................................................2-5
Table 2-5. Algal-Related Parameters .......................................................................................................2-6
Table 2-6. Headwater and Diffuse Inflows ..............................................................................................2-7
Table 2-7. Point Sources in the Doswell Water Quality Model ...............................................................2-8
Table 2-8. Carbonaceous Biochemical Oxygen Demand Inputs for the Calibration and Corroboration
Scenarios ............................................................................................................................................2-8
Table 2-9. Nitrogen Inputs for the Calibration and Corroboration Scenarios .......................................2-9
Table 3-1. Overview of Exploratory Management Scenarios ..................................................................3-2
Table 3-2. Headwater Streamflows and Diffuse Inflows ........................................................................3-3
Table 3-3. Temperature Inputs for Management Scenarios ..................................................................3-3
Table 3-4. Dissolved Oxygen Inputs for Management Scenarios ..........................................................3-4
Table 3-5. pH Inputs for Management Scenarios ...................................................................................3-5
Table 3-6. BOD5 Inputs for Management Scenarios ..............................................................................3-6
Table 3-7. Nitrogen Inputs for Management Scenarios .........................................................................3-7
Table 4-1. QUAL2K Model Results by Critical Model Element ...............................................................4-1
Table 4-2. QUAL2K Model Results by Critical Model Segment Average................................................4-2
Table C-1. Point Source Inputs for the Bear Island Facility ....................................................................C-1
Table C-2. Point Source Inputs for the Doswell WWTP ...........................................................................C-1
Table C-3. Point Source Inputs for Other Point Sources .........................................................................C-2
Table E-1. Average DO and Delta DO by Segment and Scenario ........................................................... E-1

Dissolved Oxygen Modeling of the North Anna, South Anna, and Pamunkey River System Table of Contents
iv
List of Abbreviations
BOD5 biochemical oxygen demand (five-day)
CBOD5 carbonaceous biochemical oxygen
demand (five-day)
CBODU carbonaceous biochemical oxygen
demand (ultimate)
cfs cubic feet per second
DEQ Department of Environmental Quality
DO dissolved oxygen
DWQ division of water quality
gph gallons per hours
JCC Juvenile Correction Center
km kilometer
lf linear feet
lb/day pounds per day
MGD million gallons per day
mg/L milligrams per liter
mg/m2 milligrams per meter squared
SOD sediment oxygen demand
TKN Total Kjeldahl Nitrogen
ug/L microgram per liter
USEPA United States Environmental Protection
Agency
USGS United States Geological Survey
VPDES Virginia Pollutant Discharge Elimination
System
VIMS Virginia Institute of Marine Science
WLA wasteload allocation
WWTP wastewater treatment plant
ES-1
Executive Summary
This report describes the development and application of a QUAL2K water quality model to simulate
dissolved oxygen in the North Anna River, South Anna River, and Pamunkey River to Nelson’s Bridge.
Point sources in the model include the Doswell wastewater treatment plant, the future Bear Island
paper manufacturing facility and other permitted discharges such as the Ashland, Hanover
Courthouse, and Hanover Juvenile Correction Center (JCC) wastewater treatment plants. The model
was calibrated and corroborated to water quality data collected during September and October
2012.
After calibration, the QUAL2K model was used to evaluate four seasonal low flow (7Q10) conditions
corresponding to July-October, November-December, January-March, and April-June. Including the
exploration of alternative dissolved oxygen concentrations in selected effluents, a total of twelve
management scenarios were developed to identify average monthly point source loads of oxygen-
demanding substances that would comply with water quality endpoints. Water quality endpoints that
were examined include compliance with dissolved oxygen criteria (5.0 mg/L) and attainment of no
more than 0.2 mg/L difference in dissolved oxygen from an unloaded condition. All twelve
management scenarios were predicted to achieve the water quality endpoints.
1-1
Section 1
Introduction
The North Anna and South Anna Rivers are located in the York River watershed north of Richmond,
VA and flow in an east-southeasterly direction. About 3.5 miles northwest of Hanover Courthouse, VA,
these rivers converge to form the Pamunkey River, which flows into the York River at West Point, VA.
The Hanover County Department of Public Utilities holds Virginia Pollutant Discharge Elimination
System (VPDES) permits for three wastewater treatment plants (WWTPs) that discharge to the North
Anna-South Anna-Pamunkey River system. These include the Doswell WWTP (permit no.
VA0029521) on the North Anna River, the Ashland WWTP (VA0024899) on the South Anna River,
and Hanover County Courthouse WWTP (VA0062154) on the Pamunkey River. Outfall 001 of the
permit VA0029531 represents the combined discharge of the Doswell WWTP and the Bear Island
paper manufacturing facility. That facility was previously operated by White Birch Paper, Co. but
became inactive in 2017 and was sold to Cascades, Inc. in 2018. Cascades is currently planning
future operations at the Bear Island facility. Although the Doswell WWTP and the Bear Island facility
share an outfall structure, they are expected to receive separate VPDES permits in the next renewal.
This technical memorandum presents the methods and results of a modeling project to aid in the
development of wasteload allocations of oxygen-demanding substances for the major discharges to
this river system. A QUAL2K model was developed for the North Anna, South Anna, and Pamunkey
River system, and calibrated/validated to water quality data collected in September and October of
2012. This memorandum presents the model structure, inputs, and calibration/corroboration results
and also describes how the model was used to identify management scenarios for meeting water
quality endpoints under four seasonal low flow conditions. Management scenarios include two
different effluent flows for the Doswell WWTP: 1.0 MGD and 2.0 MGD. Water quality endpoints that
were examined include: (1) meeting water quality criteria for dissolved oxygen and (2) causing no
more than a 0.2 milligram per liter (mg/L) drop in dissolved oxygen from an unloaded condition.
2-1
Section 2
Data Sources and Methods
This section describes the model selection, set-up, calibration approach, and calibration results.
2.1 Model Code Selection
For this project, it was desired to select a modeling code that is well-documented, publicly available,
supported by the United States Environmental Protection Agency (USEPA), and well suited for
modeling dissolved oxygen in a branched river system. QUAL2K was selected because it meets these
requirements and is one of the most commonly used models for wasteload allocation (WLA)
modeling in the nation. The USEPA includes QUAL2K in its toolbox of water quality modeling codes as
compiled in the Watershed & Water Quality Modeling Technical Support Center
(http://epa.gov/athens/wwqtsc/index.html). The version 2.11b8 was applied for this project.
QUAL2K is specifically used for modeling branched rivers and stream networks under steady-state
conditions. As a one-dimensional model, channels are assumed to be well-mixed both vertically and
laterally. QUAL2K simulates two species of carbonaceous oxygen demand (CBOD): fast CBOD and
slow CBOD. It also simulates oxygen demand from nitrogenous sources and sediment. The user can
choose between various reaeration algorithms and thus tailor reaeration rates to the receiving water
body type. Full documentation of QUAL2K is provided by Chapra et al. (2012).
2.2 Model Domain and Set-Up
The model domain and set-up include the reach segmentation/properties and initial
parameterization for water column processes, algae, and light/heat.
2.2.1 Reach Properties
Reach properties in QUAL2K include both the geometry, hydraulic properties, and sediment oxygen
demand of major river segments.
2.2.1.1 Segmentation
The QUAL2K model was constructed to represent the North Anna-Pamunkey River as the
“mainstem,” and the South Anna River as a tributary. As a one-dimensional stream network model,
QUAL2K requires the user to conceptually divide the stream into reaches of similar hydraulic
characteristics. Those reaches are further divided into equally-spaced elements for computational
purposes. A total of 20 reaches were defined for this model: five on the North Anna River, seven on
the South Anna River, and eight on the Pamunkey River. The headwater segment of the North Anna
River begins approximately one km upstream of the Doswell-Bear Island outfall, and the headwater
segment on the South Anna River begins approximately two km upstream of the Ashland WWTP. The
average reach length is 2.48 kilometers. The entire model domain consists of 41.24 km on the North
Anna-Pamunkey River and 8.29 km on the South Anna River. Table 2-1 shows the reaches and
associated length, location, and elevations. Reach segmentation corresponds closely to the locations
of the sampling stations established by EEE Consulting, Inc. (2012), as shown in Figure 2.1

Dissolved Oxygen Modeling of the North Anna, South Anna, and Pamunkey River System Section 2
2-2
Figure 2-1. QUAL2K Schematic
Ashland WWTP Outfall
Hanover CH
WWTP Outfall

Dissolved Oxygen Modeling of the North Anna, South Anna, and Pamunkey River System Section 2
2-3
Table 2-1. QUAL2K Reach Data
Reach
Label
Downstream
(end of reach label)
Reach
Length
(km)
Location Element
Number
>=1
Elevation
Upstream
(km)
Downstream
(km)
Upstream
(m)
Downstream
(m)
NA1 NA2 0.90 41.24 40.34 5 12.06 11.89
NA2 NA3 2.29 40.34 38.05 12 11.89 10.98
NA3 NA4 2.28 38.05 35.77 12 10.98 10.67
NA4 NA5 1.27 35.77 34.50 6 10.67 10.40
NA5 PR1A 0.16 34.50 34.34 1 10.40 10.37
SA1 SA2 0.53 8.29 7.76 3 18.29 13.42
SA2 SA3 1.31 7.76 6.46 7 13.42 13.42
SA3 SA4 1.72 6.46 4.74 9 13.42 12.81
SA4 SA5 1.03 4.74 3.71 5 12.81 11.74
SA5 SA6 1.47 3.71 2.24 7 11.74 10.98
SA6 SA7 1.72 2.24 0.52 9 10.98 10.67
SA7 PR1 0.52 0.52 0.00 3 10.67 10.37
PR1A PR1B 0.20 34.34 34.14 1 10.37 10.06
PR1B PR2 2.69 34.14 31.45 14 9.45 8.38
PR2 PR3 2.98 31.45 28.47 15 9.45 8.38
PR3 PR4 3.30 28.47 25.17 16 8.38 7.47
PR4 PR5 0.74 25.17 24.43 4 7.47 7.32
PR5 PR6 5.05 24.43 19.38 25 7.32 6.10
PR6 PR7 (Norman’s Bridge) 4.01 19.38 15.37 21 6.10 5.35
PR7 (Norman’s
Bridge)
Nelson’s Bridge
(Terminus) 15.37 15.37 0.00 35 5.35 3.00
2.2.1.2 Hydraulic Models
Each reach within QUAL2K is required to have an associated hydraulic model that quantifies the
relations between streamflow, velocity, and depth. Two basic hydraulic model options include
utilizing rating curves or the Manning’s equation. For this model, rating curves developed by AWARE
were used to model the hydraulic characteristics of each element.
Table 2-2. QUAL2K Hydraulic Model Components
Reach
Label
Rating Curves
Velocity Depth
Coefficient Exponent Coefficient Exponent
NA1 0.09 0.43 0.40 0.45
NA2 0.06 0.43 0.45 0.45
NA3 0.06 0.43 0.40 0.45
NA4 0.06 0.43 0.40 0.45
NA5 0.08 0.43 0.40 0.45
SA1 0.18 0.43 0.26 0.45
SA2 0.18 0.43 0.40 0.45
SA3 0.17 0.43 0.40 0.45
SA4 0.17 0.43 0.27 0.45

Dissolved Oxygen Modeling of the North Anna, South Anna, and Pamunkey River System Section 2
2-4
Table 2-2. QUAL2K Hydraulic Model Components
Reach
Label
Rating Curves
Velocity Depth
Coefficient Exponent Coefficient Exponent
SA5 0.25 0.43 0.28 0.45
SA6 0.25 0.43 0.28 0.45
SA7 0.40 0.43 0.20 0.45
PR1A 0.14 0.43 0.29 0.45
PR1B 0.13 0.43 0.26 0.45
PR2 0.13 0.43 0.26 0.45
PR3 0.10 0.43 0.32 0.45
PR4 0.10 0.43 0.32 0.45
PR5 0.10 0.43 0.32 0.45
PR6 0.10 0.43 0.32 0.45
PR7 0.10 0.43 0.32 0.45
2.2.1.3 Sediment Oxygen Demand
Values for prescribed sediment oxygen demand (SOD) and bottom SOD coverage were initially set at
QUAL2K’s default values and were adjusted based on previous modeling efforts and during
calibration as necessary. The SOD values were informed by SOD measurements taken by VIMS in
1985 and AWARE in 2011. Final SOD values by reach are shown in Table 2-3.
Table 2-3. QUAL2K Sediment Oxygen Demand
Reach
Label
Bottom
SOD
Coverage
Prescribed
SOD
gO2/m2/d
NA1 50.00% 2.60
NA2 50.00% 2.60
NA3 50.00% 2.50
NA4 50.00% 2.50
NA5 50.00% 2.50
SA1 50.00% 2.50
SA2 50.00% 2.50
SA3 50.00% 2.50
SA4 50.00% 2.50
SA5 50.00% 2.50
SA6 50.00% 2.50
SA7 50.00% 2.50
PR1A 50.00% 2.00
PR1B 50.00% 2.00
PR2 50.00% 2.00
PR3 50.00% 2.00
PR4 50.00% 2.00
PR5 50.00% 2.00
PR6 50.00% 2.00
PR7 (Normans Bridge) 50.00% 2.00

Dissolved Oxygen Modeling of the North Anna, South Anna, and Pamunkey River System Section 2
2-5
2.2.2 Water Column Rates
This section describes the initial parameterization of the QUAL2K model.
2.2.2.1 Reaeration Models
QUAL2K allows the user to choose among preset reaeration algorithms, or to specify reaeration by
river reach. For the Doswell water quality model, various reaeration algorithms were evaluated during
model calibration, and algorithms were selected based on which gave the best calibration for each
tributary. The Owens-Gibbs reaeration model provided the best calibration for the South Anna River,
and the United States Geological Survey (USGS) “pool-riffle” model provided the best results for the
North Anna-Pamunkey River. Because QUAL2K only allows the use of a single reaeration model for
each model run, a two-step procedure was utilized whereby the model was first run with the Owens-
Gibbs model to obtain the reaeration coefficients for the South Anna. The prescribed reaeration
coefficients for the South Anna were then manually entered in the Reach Rates tab while the model
was run again using the USGS “pool-riffle” model.
2.2.2.2 CBOD Oxidation, Nitrification, and Hydrolysis Rates
Hydrolysis, oxidation, and nitrification rates defined on the Rates tab of QUAL2K represent reactions
associated with different parameters. These rates were initially set at values based on the literature
and were adjusted during calibration as necessary. Slow and fast CBOD were modeled as two
separate pools. The oxidation rate for slow CBOD was set to a value typical of pulp and paper mill
wastewaters (NCASI, 1982) and confirmed for the Bear Island facility effluent (AquAeTer, 2016a).
The oxidation rate for fast CBOD was set to a value typical for municipal secondary effluent (Lung,
2001). The final rates of the calibrated model are shown in Table 2-4.
Table 2-4. Oxidation, Nitrification, and Hydrolysis Rates
Parameter Value Units
Slow CBOD:
Hydrolysis rate 0.0 /d
Temp. correction 1.047 --
Oxidation rate 0.020 /d
Temp. correction 1.047 --
Fast CBOD:
Oxidation rate 0.115 /d
Temp. correction 1.047 --
Organic N:
Hydrolysis 0.1 /d
Temp. correction 1.07 --
Settling velocity 0.01 m/d
Ammonium:
Nitrification 0.32 /d
Temp. correction 1.07 --
Nitrate:
Denitrification 0.5 /d
Temp. correction 1.07 --

Dissolved Oxygen Modeling of the North Anna, South Anna, and Pamunkey River System Section 2
2-6
Table 2-4. Oxidation, Nitrification, and Hydrolysis Rates
Parameter Value Units
Sediment denitrification
transfer coefficient 0.05 m/d
Temp. correction 1.07 --
2.2.3 Algal Parameters
The QUAL2K model simulated both suspended phytoplankton and bottom algal growth. Due to the
predominantly unconsolidated nature of the river bottom sediments in most of the model domain,
the bottom algae coverage was set to only five percent. Table 2-5 lists the algal-related parameters
of the final model.
Table 2-5. Algal-Related Parameters
Parameter Value Units
Phytoplankton
Max. growth rate 3.8 /d
Respiration rate 1.07 /d
Excretion rate 0.3 /d
Death rate 0.01 /d
Ext. N half saturation const. 15 ug/L
Ext. P half saturation const. 2 ug/L
Settling velocity 0.15 m/d
Bottom algae
Growth model Zero-order
Max. growth rate 200 mg/m2/d
Respiration rate 0.2 /d
Excretion rate 0.2 /d
Death rate 0.2 /d
Ext. N half saturation const. 300 ug/L
Ext. N half saturation const. 100 ug/L
2.2.4 Light and Heat Parameters
The model uses the light and heat parameters to account for heat transfers between the
atmosphere and the model components. QUAL2K model default values were used for these
parameters. The selected submodels were as follows:
• Solar short wave radiation model: Bras
• Longwave emissivity model: Koberg
• Wind speed function: Brady-Graves-Geyer
2.3 Calibration and Corroboration Scenarios
The calibration and corroboration scenarios were based on water quality and effluent data collected
by EEE Consulting on September 26-27, 2012 and October 9-10, 2012, respectively. The purpose of
the sampling was to collect samples at least a week apart, with the first sampling event to be used to

Dissolved Oxygen Modeling of the North Anna, South Anna, and Pamunkey River System Section 2
2-7
calibrate the model, and the second to validate the model (EEE Consulting, 2012). Each sampling
event took a span of two days to collect the desired field data and samples for lab analysis. During
both sampling events, the North Anna-Pamunkey was sampled on the first day and the South Anna
was sampled on the second day. The field and lab data for the calibration and corroboration
datasets are tabulated in Appendix A. The following subsections describe how major inputs for these
scenarios were derived.
2.3.1 Headwater and Diffuse Inflows
Headwater flows to the North Anna and South Anna Rivers were based on daily streamflow at USGS
gauges for the calibration and corroboration periods. Specifically, gauge 01671025 (North Anna
River above Little River) was used to specify headwater flows to the North Anna River, and gauge
01672500 (South Anna River near Ashland) was used to specify headwater flows to the South Anna
River.
Diffuse inflows along North Anna, South Anna, and the Pamunkey Rivers were calculated based on
the difference between measured streamflows at the headwater gauges and flow at gauge
01673000 (Pamunkey River near Hanover), after subtracting known point source inflows. These
inflows were proportionally distributed over the length of the model study area according to reach
lengths and were input into the QUAL2K model under the Diffuse Sources tab. The model expressed
the diffuse sources across three reaches: the North Anna-Pamunkey River down to Norman’s Bridge
(river kilometer 15.37), the Pamunkey River between Norman’s Bridge and Nelson’s bridge, and the
South Anna within the model extents. Water quality parameters for the headwater flows and diffuse
inflows were based on data from the most upstream sampling stations on the North Anna River
(station NA1) and South River (station SA1). Headwater and diffuse inflows used in the QUAL2K
model are displayed in Table 2-6.
Table 2-6. Headwater and Diffuse Inflows
USGS Gauge Drainage
Area
(mi2)
Flow (cfs) Flow (m3/s)
Sep 26-27,
2012
Oct 10-11,
2012
Sep 26-27,
2012
Oct 10-
11, 2012
01671025 - North Anna River above Little River 467 31 32 0.877 0.906
01671100 - Little River near Doswell 107 5.4 3.7 0.153 0.105
01672500 -South Anna River near Ashland 395 45 59 1.274 1.670
01673000 - Pamunkey River near Hanover 1,078 116 139 3.283 3.934
North Anna-Pamunkey Diffuse Inflows -- -- -- 0.5662 0.7990
South Anna Diffuse Inflows -- -- -- 0.1804 0.2499
Pamunkey River, Norman’s Bridge to Nelson’s Bridge
Diffuse Inflows -- -- -- 0.6880 0.9535
2.3.2 Point Source Inputs
Five permitted point sources were defined in this model: the Doswell WWTP, the Bear Island facility,
Ashland WWTP, Hanover Courthouse WWTP, and the Juvenile Correction Center (JCC). They are listed
in Table 2-7. Because Doswell WWTP and the Bear Island facility share an outfall structure, the
QUAL2K model accepts the loadings from those two facilities as a single combined discharge.
However, the model pre-processing worksheet allows the user to specify the characteristics of the
individual discharges, and then uses a simple mixing equation to calculate the properties of the
combined discharge.

Dissolved Oxygen Modeling of the North Anna, South Anna, and Pamunkey River System Section 2
2-8
Lab data from samples collected by EEE Consulting in September and October of 2012 and permit
data were used as inputs for the water quality characteristics for the point sources. The Little River
was also treated as a point source inflow in QUAL2K, with streamflow derived from gauge 01671100
(Little River near Doswell) and water quality parameters set to the same values as headwater flows
on the North Anna River.
Table 2-7. Point Sources in the Doswell Water Quality Model
Point Source Name Headwater Location
(km)
Sept 26-27
Inflow
(m3/s)
Oct 10-11
Inflow
(m3/s)
Doswell/Bear Island Outfall North Anna-Pamunkey 40.28 0.205 0.195
Little River North Anna-Pamunkey 40.19 0.153 0.105
Ashland WWTP South Anna 6.50 0.029 0.028
Hanover Courthouse WWTP North Anna-Pamunkey 25.06 0.003 0.002
Juvenile Correction Center North Anna-Pamunkey 13.63 0.001 0.001
2.3.3 Conversion of CBOD5 to CBODU
QUAL2K requires inputs of BOD expressed as slow and fast carbonaceous biochemical oxygen
demand – ultimate (CBODU). The measured water quality data express BOD in terms of BOD5 or
CBOD5, requiring conversion to CBODU. For the calibration and corroboration scenarios, BOD5 was
converted to CBOD5 using a literature factor of 1.1 (Muirhead et al., 2006). DEQ’s default f-ratio of
2.5 was used to convert CBOD5 to CBODU for North Anna, South Anna, Ashland WWTP, Hanover
Courthouse, and JCC. For the Bear Island effluent, the f-ratio of 5.77 was used, based on literature
values for the pulp and paper industry (AWARE, 2011). The default DEQ f-ratio of 2.5 was used for
the other municipal discharges. The Bear Island facility discharge, headwater inflows, and
incremental inflows were considered to have slow CBOD, whereas the Doswell WWTP, Ashland
WWTP, Hanover Courthouse WWTP, and JCC were modeled as discharging fast CBOD. The CBOD
model inputs are shown in Table 2-8.
Table 2-8. Carbonaceous Biochemical Oxygen Demand Inputs for the Calibration and Corroboration Scenarios
Discharge
Measured CBOD5 Slow CBOD5 Fast CBOD5
Sep 26-27,
2012
Oct 10-11,
2012
Sep 26-27,
2012
Oct 10-11,
2012
Sep 26-
27, 2012
Oct 10-11,
2012
North Anna Headwater -- -- 2.27 2.27 -- --
South Anna Headwater -- -- 2.27 2.27 -- --
Little River -- -- 2.5 2.5 -- --
Doswell-Bear Island 10.9 23.3 66.4 121.6 0.081 0.908
Bear Island 11.9 22 -- -- -- --
Doswell 1 8.7 -- -- -- --
Ashland WWTP 1 4.3 -- -- 2.5 10.8
Courthouse WWTP 3.6 5.8 -- -- 9.0 14.5
Juvenile Correction Center 5.0 5.0 -- -- 12.5 12.5

Dissolved Oxygen Modeling of the North Anna, South Anna, and Pamunkey River System Section 2
2-9
2.3.4 Bioavailable Organic Nitrogen
The water quality data sets for the September-October 2012 sampling events included values for
TKN, nitrate + nitrite nitrogen, and ammonia nitrogen. QUAL2K requires inputs for ammonia
nitrogen, nitrate+nitrite nitrogen, and bioavailable organic nitrogen. For the Doswell-Bear Island
effluent, it was assumed that 46% of the TKN is bioavailable, based on a previous TKN bioavailability
study done for the Doswell-Bear Island combined effluent (HDR, 1988). For the other effluents, it
was assumed that 60% of the organic nitrogen would be potentially subject to hydrolysis within the
model domain (Chen et al., 2011). The resulting bioavailable organic nitrogen values are shown in
Table 2-9.
Table 2-9. Nitrogen Inputs for the Calibration and Corroboration Scenarios
Discharge
TKN (mg/L)
Bioavailable Organic N
(mg/L) Ammonia N (mg/L) Nitrate + Nitrite N (mg/L)
Sep 26-27,
2012
Oct 10-
11,
2012
Sep 26-
27, 2012
Oct 10-11,
2012
Sep 26-27,
2012
Oct 10-11,
2012
Sep 26-27,
2012
Oct 10-
11, 2012
North Anna
Headwater 0.24 0.34 0.11 0.17 0.05 0.05 0.05 0.05
South Anna
Headwater 0.37 0.21 0.19 0.10 0.05 0.05 0.05 0.05
Doswell-Bear Island 4.28 12.60 1.58 0.17 0.39 5.11 2.80 5.56
Ashland WWTP 1.23 2.22 0.71 1.14 0.05 0.32 14.60 19.70
Hanover WWTP 1.23 3.26 0.64 1.82 0.17 0.23 21.40 24.80
2.3.5 Meteorological Data
Meteorological data was obtained from the National Climatic Data Center. Meteorological data was
collected for the same days as the calibration (September 26-27, 2012) and corroboration (October
10-11, 2012) data. Air temperature, dewpoint, and shade were varied by hour to represent a diurnal
cycle. Cloud cover was set to 30% during the entire day.
2.4 Model Calibration and Corroboration Results
2.4.1 Model Calibration Results
Model calibration was conducted by visual comparison of model results to data collected by EEE
Consulting on September 26 and 27, 2012. Figures showing the results of the calibration run are
included in Appendix B. Key model calibration parameters include the reaeration algorithm, the
CBOD oxidation rate, the nitrification rate, and sediment oxygen demand. The first steps of the
calibration were to verify that streamflow and temperature estimates were reasonable, and then
water quality was examined. In some cases, discrepancies between the model and calibration data
appeared to be the result of (1) high control of model results from the single sample collected at the
Bear Island-Doswell outfall; or (2) the fact that the North Anna and South Anna Rivers were sampled
on two different days. These results caused limitations on the degree to which model parameters
were adjusted to match in-stream water quality measurements. Calibration results for individual
parameters are discussed below.
Streamflow: The model shows an excellent streamflow calibration on the North Anna-Pamunkey
River, especially to the headwater values and the downstream most-point which represents USGS
gauge 01673000 (Pamunkey River near Hanover). The model appears to slightly overestimate

Dissolved Oxygen Modeling of the North Anna, South Anna, and Pamunkey River System Section 2
2-10
streamflow on the Pamunkey River above the Hanover gauge, and to underestimate streamflow on
South Anna River. Individual field streamflow measurements may not be as accurate as daily
streamflow values from USGS gauges, and so the USGS results were given priority for model
calibration.
Temperature: Overall, the model shows a very good calibration to temperature on both the North
Anna-Pamunkey and South Anna Rivers.
Conductivity: The calibration to conductivity on the North Anna-Pamunkey River system was poor.
The model predicted a significant increase in conductivity below the Doswell-Bear Island effluent,
which was not observed. Conductivity is a conservative parameter and is affected by the magnitude
and conductivity of model input flows rather than any rate coefficient. The model result was largely
driven by a single conductivity measurement of the Doswell-Bear Island effluent collected on
September 26, 2012. Because the flow calibration was good, the simplest explanation for the poor
conductivity calibration is that the Doswell-Bear Island effluent measurement was not representative
of the daily condition. The corroboration dataset shows excellent agreement with observed
conductivity, suggesting that the calibration issue is not a fundamental problem with the model.
Measured conductivity was highly variable on the South Anna River. Model predictions were accurate
for the upstream and downstream portions of the South Anna River. The model also correctly
predicted the approximate magnitude of the step trend in conductivity caused by the mixing of the
South Anna and North Anna Rivers.
Dissolved Oxygen: The model reproduced the location and approximate magnitude of the DO sag on
the North Anna River, below the Doswell-Bear Island outfall, and also showed good agreement with
the DO profile on the South Anna River. Calibration charts appear to show that the model
underestimates the DO on the Pamunkey River, below the confluence of the North Anna River and
South Anna River. This is partially due to difficulties in matching the exact shape of the DO sag below
the Doswell-Bear Island outfall, but also affected by the fact that the North Anna-Pamunkey Rivers
and the South Anna River were sampled on two different days. The model correctly predicted the
approximate magnitude of the step trend in DO caused by the mixing of the South Anna and North
Anna Rivers.
Nitrogen and Phosphorus Species: The calibration plots for nitrogen species (ammonia, TKN, NO3,
and total N) and phosphorus species (inorganic P, total P) are all strongly influenced by results of the
sample of the Doswell-Bear Island effluent collected on September 26, 2012, which largely controls
the predicted magnitude of the “spike” in concentrations below the Doswell-Bear Island outfall. The
predicted increases are in good agreement with river data for parameters such as NO3, total N,
inorganic P, and total P. Ammonia and TKN appear to be underestimated on the North Anna River.
However, the longitudinal variation and step trends associated with North Anna-South Anna
confluence appear to be reasonable.
Chlorophyll-a: The model predicts consistently low phytoplankton chlorophyll-a (1-2 ug/L) through the
river system, which agrees with observation. The model predicted moderate accumulations of
bottom algae (90-120 mg/m2) on available substrate under steady-state low flow conditions.
2.4.2 Model Corroboration Results
Model corroboration was conducted by comparing model results to data collected by EEE Consulting
on October 10 and 11, 2012. Figures showing the results of the calibration run are included in
Appendix B. The model corroboration plots show very good agreement with streamflow and
conductivity. Temperature appears to be oversimulated, possibly due to variability in cloud cover and
other meteorological factors. The corroboration run correctly predicted the approximate maximum
depth of the DO sag on the North Anna River, although the shape of the sag was more difficult to

Dissolved Oxygen Modeling of the North Anna, South Anna, and Pamunkey River System Section 2
2-11
reproduce. As with the calibration run, the model was reasonably accurate for DO on the South Anna,
but discrepancies in the DO concentrations on Pamunkey River were strongly influenced by the fact
that that the North Anna–Pamunkey River was sampled on a different day than the South Anna
River. Nutrient species showed similar results as with the calibration run, with strongly influenced
results from the Doswell-Bear Island effluent samples, but reasonable longitudinal and step trends.
Summary of calibration/corroboration: The QUAL2K water quality model was calibrated using
parameter values that are well within the accepted literature range, and also reflect special studies
of the Doswell-Bear Island effluent BOD and TKN characteristics. As with most models, the model
shows better agreement to the calibration dataset than the corroboration dataset for most
constituents. Some apparent discrepancies between model predictions and observed values were
strongly influenced by the fact that the North Anna-Pamunkey River and South Anna River were
sampled on different days, and that the sample of the Doswell-Bear Island effluent has a strong
control on model results for the North Anna River. Overall, the model calibration was deemed
acceptable for its intended purpose.

3-1
Section 3
Management Scenario
Descriptions
Twelve potential management scenarios were run to explore the effects of oxygen-demanding
substances on water quality endpoints during seasonal low flow (7Q10) conditions. The modeled
management scenarios reflect monthly average point source inputs (Virginia DEQ, 2016). The four
seasonal scenarios corresponded to four different seasonal conditions (Jul-Oct, Nov-Dec, Jan-Mar,
and Apr-Jun) and two different levels of Doswell WWTP effluent flow (1 and 2 MGD). The two water
quality endpoints of interest were (1) attaining water quality criteria (5.0 mg/L) and (2) causing no
more than a 0.2 mg/L decrease in DO from an unloaded condition.
Reaction rates of all exploratory management scenarios were based on the calibration scenario, but
system inputs (headwater/diffuse flow parameters and point source loading) were altered to reflect
the respective seasonal and management conditions. A few additional modifications to the original
(calibrated) model were made in response to discussions between Hanover County Utilities, DEQ,
and the modeling team in 2020. This section describes the assumptions, modifications, and results
of each management scenario.
3.1 Overview of Model Scenarios
The basic approach taken for analysis of the management scenarios was first to configure the
models for the four seasonal conditions under unloaded conditions. To simulate the unloaded
condition, flows from permitted point sources were set to zero. Results of each of the twelve
management (”loaded”) scenarios were examined directly to ensure there were no violations of the
DO criterion (5.0 mg/L). Results of the management scenarios were also compared to the unloaded
condition to identify the change in dissolved oxygen in each river element and segment. This allowed
estimation of the maximum change in DO between the unloaded and loaded conditions.
The twelve management scenarios presented in this document are derived from a much larger
number (>100) of scenarios that were used to explore different combinations of assumptions
regarding seasonal conditions, point source inflows, and other environmental characteristics. These
twelve scenarios were selected as the most relevant scenarios for exploring the assimilative capacity
of the river system. As shown in Table 3-1, the scenarios differ primarily in season, the Doswell
WWTP flow, the BOD5/CBOD5 loading of the Bear Island facility and Doswell WWTP, and the effluent
DO concentrations. Other conditions and point source inputs were kept constant for each season. All
scenarios presented in this document comply with both the DO criterion and the antidegradation-
based goal of no more than a 0.2 mg/L decrease in DO from an unloaded condition. Detailed model
inputs for point sources are provided in Appendix C.

Dissolved Oxygen Modeling of the North Anna, South Anna, and Pamunkey River System Section 3
3-2
Table 3-1. Overview of Exploratory Management Scenarios
Scenario Season
Effluent Flow
(MGD) Bear Island
BOD5
(lb/d)
Doswell
WWTP
CBOD5
(lb/d)
Dissolved Oxygen
(mg/L)
Doswell
WWTP
Bear
Island
Doswell
WWTP
Bear Island Ashland
WWTP
1 Jul-Oct 1.0 1.5 679 41.7 6.5 6.5 7.0
2 Jul-Oct 2.0 1.5 634 83.4 6.5 6.5 7.0
3 Jul-Oct 1.0 1.5 679 41.7 6.5 6.5 6.5
4 Jul-Oct 2.0 1.5 634 83.4 6.5 6.5 6.5
5 Nov-Dec 1.0 1.5 1,078 41.7 7.1 7.1 7.0
6 Nov-Dec 2.0 1.5 911 83.4 7.1 7.1 7.0
7 Nov-Dec 1.0 1.5 963 41.7 6.5 6.5 7.0
8 Nov-Dec 2.0 1.5 634 83.4 6.8 6.8 7.0
9 Jan-Mar 1.0 1.5 1,126 41.7 6.5 6.5 7.0
10 Jan-Mar 2.0 1.5 1,126 83.4 6.5 6.5 7.0
11 Apr-Jun 1.0 1.5 1,126 41.7 6.5 6.5 7.0
12 Apr-Jun 2.0 1.5 1,126 83.4 6.5 6.5 7.0
3.2 Management Scenario Model Input Parameters
3.2.1 Headwater and Diffuse Inflows
Headwater and diffuse inflows used in management scenario model runs are summarized in Table
3-2. The 7Q10 streamflows were provided by DEQ. The approach taken estimating diffuse inflows
was similar to the approach taken for the calibration and corroboration scenario, with the difference
that it was desired to make the diffuse inflows for the management scenarios consistent with the
7Q10 yields (i.e., cfs per mi2 of contributing watershed) provided by DEQ. To calculate diffuse inflows,
the seasonal 7Q10 flows per unit drainage area were calculated for the major gages in the study
area, and these values were multiplied by the watershed drainage area between the headwater
inflow locations and downstream locations in the model domain.
Diffuse inflows for the mainstem (North Anna-Pamunkey) model segments were based on unit 7Q10
values from USGS gage 1673000 (Pamunkey River near Hanover). Specifically, the diffuse inflow to
the mainstem were calculated as the 7Q10 yield at the gage, multiplied by the watershed area
between the upstream and downstream ends of the mainstem model extent. The contributing
watershed area of the Little River was subtracted because the 7Q10 of that stream was specified
separately as a point source to the model. Similarly, the contributing watershed area of the South
Anna River was subtracted from the mainstem diffuse flow calculation because diffuse flows were
estimated separately for that stream, based on unit 7Q10 values from USGS gage 1672500 (South
Anna River near Ashland). These inflows were proportionally distributed over the length of the model
study area according to reach lengths. Unless otherwise noted below, the water quality
characteristics of headwater flows and diffuse inflows were set to the average values of the
September and October 2012 sampling events.
Dissolved Oxygen Modeling of the North Anna, South Anna, and Pamunkey River System Section 3
3-3
Table 3-2. Headwater Streamflows and Diffuse Inflows
Season
7Q10 Streamflow (cfs) Diffuse Inflows (cfs)
1671025
(N Anna abv
Little R.)
1671100
(Little R. nr
Doswell)
1675200
(South
Anna R. nr
Ashland
1671100
(Pamunkey R. nr
Hanover)
Mainstem
(North Anna-
Pamunkey to
Nelsons
Bridge)
South Anna
River
Jan-Mar 59.4 19.7 96.1 238.3 37.8 17.5
Apr-Jun 47.0 6.7 48.4 123.1 19.5 8.8
Jul-Oct 27.2 0.5 10.1 39.8 6.3 1.8
Nov-Dec 38.3 4.4 40.0 107.0 17.0 7.3
3.2.2 Point Source Flows
As shown in Table 3-1, the Doswell WWTP flow was set to 1.0 MGD in six of the twelve scenarios and
2.0 MGD in the other six scenarios. Other point source flows were set constant design flow rates as
follows:
• Bear Island = 1.5 mgd
• Ashland WWTP = 2.0 mgd
• Courthouse WWTP = 0.08 mgd
• JCC = 0.035 mgd
3.2.3 Temperature
Headwater, diffuse inflow, and point source temperatures used in management scenario model runs
are summarized in Table 3-3. The headwater temperatures were based on 90th percentile values at
stream gaging stations for each season, and were provided by DEQ. The temperatures of diffuse
inflows and the Little River were set to the same values as the South Anna River headwater.
Table 3-3. Temperature Inputs for Management Scenarios
Source Temperature (deg C)
Jul-Oct Nov-Dec Jan-Mar Apr-Jun
North Anna Headwaters 26.0 14.0 10.8 25.2
Little River 25.9 11.4 9.9 24.0
South Anna Headwaters 25.9 11.4 9.9 24.0
Diffuse Inflows 25.9 11.4 9.9 24.0
Bear Island Effluent 32.0 32.0 32.0 32.0
Doswell WWTP Effluent 24.4 16.8 16.8 24.4
Ashland WWTP Effluent 24.4 16.8 16.8 24.4
Courthouse WWTP Effluent 24.4 15.0 15.0 24.4
Juvenile Correction Center Effluent 22.0 18.7 18.7 22.0
The temperature of the Bear Island facility was set to 32.0 deg C for all seasons, based on
information provided by Cascades. Other point source temperatures were set to the 90th percentile
of available daily (Ashland and Doswell WWTPs) or monthly (Courthouse WWTP) data as reported in
the facility Discharge Monitoring Reports (DMRs). The period of record for the WWTP DMR data was
as follows:
Dissolved Oxygen Modeling of the North Anna, South Anna, and Pamunkey River System Section 3
3-4
• Ashland WWTP: January 2006 to June 2016
• Doswell WWTP: December 2007 to June 2016
• Courthouse WWTP: February 2014 to June 2016
The temperature at the JCC point source was defined as the maximum daily summer (22.0°C) and
winter (18.7°C) temperatures reported by the facility in the VPDES permit application and included
in Attachment E of the VPDES Permit VA0020664 Fact Sheet.
In 2020 discussions, DEQ noted that warm season (Apr-Jun and Jul-Oct) versions of model predicted
that temperature decreased about 5 deg. C along the mainstem. DEQ therefore requested model
revisions to attain a flatter temperature profile. Investigation by the modeling team revealed that the
predicted temperature decrease was primarily caused by the combination of high headwater inflow
temperature with more typical air temperatures, such that the water was predicted to lose heat to
the air. This issue was addressed by increasing the air temperature to achieve a relatively flat
temperature profile in the management scenarios.
3.2.4 Dissolved Oxygen
Headwater, diffuse inflow, and point source DO used in management scenario model runs are
summarized in Table 3-4. Headwater and Little River dissolved oxygen data were collected from the
same gauges and period of record as presented in Section 3.2.3. Little River dissolved oxygen was
set to the 10th percentile of available DO data.
Table 3-4. Dissolved Oxygen Inputs for Management Scenarios
Source Dissolved Oxygen (mg/L)
Jul-Oct Nov-Dec Jan-Mar Apr-Jun
North Anna Headwaters 7.05 8.99 8.99 7.05
Little River 7.40 9.20 9.20 7.40
South Anna Headwaters 6.77 9.23 9.23 6.77
North Anna-Pamunkey Diffuse Inflows 7.05 8.99 8.99 7.05
South Anna Diffuse Inflows 6.77 9.23 9.23 6.77
Bear Island Effluent 6.5 6.5-7.1a 7.1 6.5
Doswell WWTP Effluent 6.5 6.5-7.1a 7.1 6.5
Ashland WWTP Effluent 6.5/7.0b 7.0 7.0 7.0
Courthouse WWTP Effluent 5.0 5.0 5.0 5.0
Juvenile Correction Center Effluent 6.0 6.0 6.0 6.0
aTable 3-1 lists the Doswell and Bear Island DO concentrations by scenario.
bThe more appropriate monthly average DO value for the Ashland WWTP is 7.0 mg/L; however, 6.5
was tested for some Jul-Oct scenarios (3 and 4) to confirm that even this low value would not
cause violation of the antidegradation threshold.
Headwater DO was calculated for the North Anna and South Anna Rivers using a DO saturation
method rather than taking a percentile of the available DO data. For all sample dates that included
coincident temperature, DO, and conductivity data, a percent saturation value was calculated. The
dissolved oxygen model input was calculated from the 10th percentile percent saturation, and model
input values for temperature (90th percentile) and conductivity (average of 2012 field data). For a
previous version of the model (Brown and Caldwell, 2016), the modeling team developed DO values
for annual and wet season scenarios. For the 2020 version of the model, the DO values for the
annual scenario were applied to the warm season scenarios (Apr-Jun, Jul-Oct), and DO values of the

Dissolved Oxygen Modeling of the North Anna, South Anna, and Pamunkey River System Section 3
3-5
wet season scenario were applied to the cool season scenarios (Nov-Dec, Jan-Mar). Diffuse inflow DO
for the mainstem and South Anna segments were set equal to the respective North Anna and South
Anna River headwater DO values.
Point source dissolved oxygen was set to daily permit limits for the Courthouse WWTP (5 mg/L) and
JCC (6 mg/L). The Bear Island and Doswell effluents were set to different DO concentrations for
different seasons and scenarios. For the Nov-Dec seasons (scenarios 4 through 7), three effluent DO
concentrations (6.5, 6,8, and and 7.1 mg/L) were explored for the Bear Island and Doswell WWTP
effluents (Table 3-1). For the Ashland WWTP effluent, DO concentration was set to 7.0 mg/L for most
scenarios, as a conservatively low estimate of the monthly average DO value that would result from
compliance with daily permit limits. However, for two Jul-Oct scenarios (scenarios 3 and 4), the
Ashland WWTP DO concentration was set to 6.5 mg/L to confirm that even this low value would not
cause violation of the antidegradation threshold.
3.2.5 pH
Headwater, diffuse inflow, and point source pH used in management scenario model runs are
summarized in Table 3-5. Headwater and Little River pH values were set to the median of data from
the following gauges:
• North Anna River at Harts Corner (USGS Gauge 01671020), period of record 2006–2016.
• Little River (DEQ Gauge 8-LTL002.69), period of record 2003–2012.
• South Anna River (DEQ Gauge 8-SAR001.11), period of record 1979-2013.
For a previous version of the model (Brown and Caldwell, 2016), the modeling team developed pH
values for annual and wet season scenarios. For the 2020 version of the model, the pH values for
the annual scenario were applied to the warm season scenarios (Apr-Jun, Jul-Oct), and pH values of
the wet season scenario were applied to the cool season scenarios (Nov-Dec, Jan-Mar). Diffuse
inflow pH values were set equal to the respective South Anna and North Anna River headwater
values.
Table 3-5. pH Inputs for Management Scenarios
Source pH (s.u.)
Jul-Oct Nov-Dec Jan-Mar Apr-Jun
North Anna Headwaters 7.00 7.00 7.00 7.00
Little River 7.10 7.10 7.10 7.10
South Anna Headwaters 7.00 6.90 6.90 7.00
North Anna-Pamunkey Diffuse Inflows 7.00 7.00 7.00 7.00
South Anna Diffuse Inflows 7.00 6.90 6.90 7.00
Bear Island Effluent 7.57 7.57 7.57 7.57
Doswell WWTP Effluent 7.57 7.57 7.57 7.57
Ashland WWTP Effluent 7.39 7.39 7.39 7.39
Courthouse WWTP Effluent 7.60 7.60 7.60 7.60
Juvenile Correction Center Effluent 7.30 6.40 6.40 7.30
Point source pH values were set to permit limits for the Courthouse WWTP (pH of 7.6) and JCC (90th
percentile pH of 7.3) for the annual scenario and a 10th percentile pH of 6.4 for the wet weather
scenario. Bear Island/Doswell WWTP, and Ashland WWTP pH values were set equal to field data
collected at the respective discharge sites in September and October 2012.

Dissolved Oxygen Modeling of the North Anna, South Anna, and Pamunkey River System Section 3
3-6
3.2.6 Headwater and Diffuse Inflow Water Quality
Unless otherwise discussed in the temperature, DO and pH sections above, the water quality
characteristics of headwater flows and diffuse inflows were set to the average values of the
September and October 2012 sampling events. Phytoplankton and inorganic solids concentrations
were set during model calibration and corroboration.
3.2.7 Biochemical Oxygen Demand
As discussed in section 2.3.3, the model requires inputs of biochemical oxygen demand (BOD)
expressed as slow and fast CBODU (carbonaceous biochemical oxygen demand – ultimate). In
contrast, permit limits and treatability studies generally express values as BOD5 or CBOD5. For
headwater inflows, diffuse inflows, and most point sources, the default f-ratio of 2.5 was used to
convert between CBOD5 and CBODU. An f-ratio of 5.77 was used for the Bear Island facility, in
recognition that pulp and paper effluents exhibit higher f-ratios than municipal effluent (AWARE,
2011). As in the calibration scenario, municipal effluent was assumed to discharge fast CBODU,
whereas the Bear Island facility, headwater inflows, and diffuse inflows were assumed to contain
slow CBODU.
The derivation of BOD5 values from CBOD5 values (or vice versa) requires assumptions regarding
the proportion of the BOD5 that is carbonaceous vs. nitrogenous. This proportion is partially
dependent upon the ammonia and organic nitrogen concentrations of each source. The modeling
team used simple calculations to explore how different concentrations of ammonia and organic
nitrogen would affect the ratio of BOD5 to CBOD5. Based on this analysis, a ratio of 1.85 was chosen
for the JCC and Hanover Courthouse WWTP. This value is the average value cited for secondary
treatment by USEPA (1997). A lower ratio of BOD5 to CBOD5 (1.3) was used for the Bear Island
facility, based on lower concentrations of nitrogenous oxygen demand in that effluent. Limits for the
Doswell and Ashland WWTPs are expressed in units of CBOD5, and so no conversion was necessary
for those facilities. Table 3-6 lists the assumptions regarding oxygen demand for each facility and
model scenario.
Table 3-6. BOD5 Inputs for Management Scenarios
Discharge
Apr-Jun and Jul-Oct Seasons
mg/L lb/d
Headwaters and Diffuse Flows 1 NA
Bear Island BOD5 loading varies by scenario; see Table 3-1
Doswell WWTP CBOD5 loading varies by scenario; see Table 3-1
Ashland WWTP 20 (CBOD5) 337 (CBOD5)
Courthouse WWTP 30 20
Juvenile Correction Center 30 8.7
3.2.8 Nitrogen Species
QUAL2k accepts inputs of nitrite-plus-nitrate, ammonia, and organic nitrogen. Within the model,
100% of the organic nitrogen is assumed to be bioavailable. Hence, poorly-bioavailable organic
nitrogen should be subtracted from the organic nitrogen prior to input to the model. Table 3-7 lists
the assumptions regarding nitrogen species for each major source and scenario. As in the calibration
scenario, it was assumed that 46% of TKN for the Bear Island facility was bioavailable, and 60% of
organic nitrogen is bioavailable for most other point source effluents. The exception was the Ashland

Dissolved Oxygen Modeling of the North Anna, South Anna, and Pamunkey River System Section 3
3-7
WWTP, which was assumed to contain 1 mg/L of poorly-bioavailable organic nitrogen based on an
evaluation of effluent monitoring results.
Table 3-7. Nitrogen Inputs for Management Scenarios
Discharge NO2+NO3 N NH4-N Org. N TKN
mg N/L mg /L mg N/L mg/L lb/day
Headwaters and Diffuse Inflows 0.050 0.050 0.144 0.194 NA
Bear Island Facility 1.8 1.0 12.5 10.0 125.1
Doswell WWTP 1.0 1.0 2.0 3.0 25.0 (1 MGD scenarios)
50.0 (2 MGD scenarios)
Ashland WWTP 14.6 1.0 4.0 5.0 83.4
Courthouse WWTP 21.4 2.5 14.5 14.5 15.2
Juvenile Correction Center 18.0 17.5 6.3 10.5 3.1
3.2.9 Meteorological Data
Meteorological data was obtained from the National Climatic Data Center for the same days as the
calibration (September 26-27, 2012) data. Air temperature, dewpoint, and shade were varied by
hour to represent a diurnal cycle. As discussed in section 3.2.3, the air temperature was increased
for the warm weather seasons (Apr-Jun, Jun-Oct) in order to achieve a flat temperature profile for the
mainstem model segments. Cloud cover was set to 30% during the entire day.
4-1
Section 4
Management Scenario Results
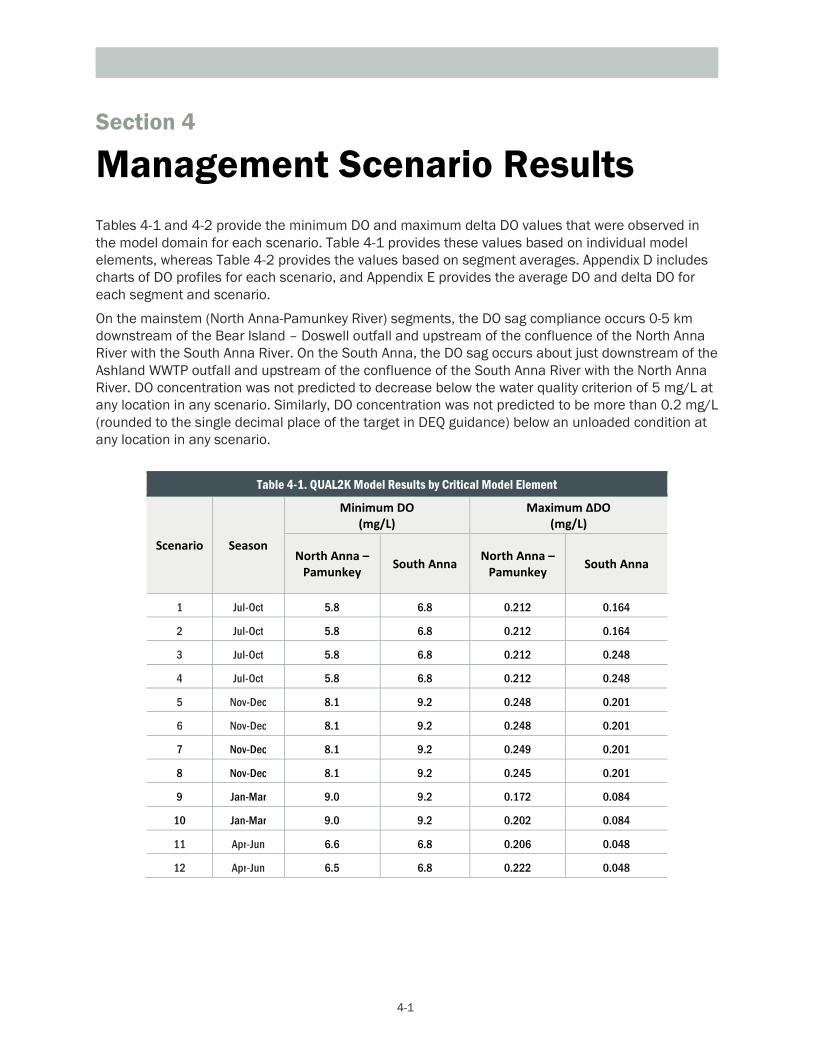
Tables 4-1 and 4-2 provide the minimum DO and maximum delta DO values that were observed in
the model domain for each scenario. Table 4-1 provides these values based on individual model
elements, whereas Table 4-2 provides the values based on segment averages. Appendix D includes
charts of DO profiles for each scenario, and Appendix E provides the average DO and delta DO for
each segment and scenario.
On the mainstem (North Anna-Pamunkey River) segments, the DO sag compliance occurs 0-5 km
downstream of the Bear Island – Doswell outfall and upstream of the confluence of the North Anna
River with the South Anna River. On the South Anna, the DO sag occurs about just downstream of the
Ashland WWTP outfall and upstream of the confluence of the South Anna River with the North Anna
River. DO concentration was not predicted to decrease below the water quality criterion of 5 mg/L at
any location in any scenario. Similarly, DO concentration was not predicted to be more than 0.2 mg/L
(rounded to the single decimal place of the target in DEQ guidance) below an unloaded condition at
any location in any scenario.
Table 4-1. QUAL2K Model Results by Critical Model Element
Scenario Season
Minimum DO
(mg/L)
Maximum ΔDO
(mg/L)
North Anna –
Pamunkey South Anna
North Anna –
Pamunkey South Anna
1 Jul-Oct 5.8 6.8 0.212 0.164
2 Jul-Oct 5.8 6.8 0.212 0.164
3 Jul-Oct 5.8 6.8 0.212 0.248
4 Jul-Oct 5.8 6.8 0.212 0.248
5 Nov-Dec 8.1 9.2 0.248 0.201
6 Nov-Dec 8.1 9.2 0.248 0.201
7 Nov-Dec 8.1 9.2 0.249 0.201
8 Nov-Dec 8.1 9.2 0.245 0.201
9 Jan-Mar 9.0 9.2 0.172 0.084
10 Jan-Mar 9.0 9.2 0.202 0.084
11 Apr-Jun 6.6 6.8 0.206 0.048
12 Apr-Jun 6.5 6.8 0.222 0.048

Dissolved Oxygen Modeling of the North Anna, South Anna, and Pamunkey River System Section 4
4-2
Table 4-2. QUAL2K Model Results by Critical Model Segment Average
Scenario Season
Minimum DO (mg/L)
Maximum ΔDO (mg/L)
North Anna – Pamunkey
South Anna North Anna –
Pamunkey South Anna
1 Jul-Oct 5.8 7.4 0.210 0.125
2 Jul-Oct 5.8 7.4 0.210 0.125
3 Jul-Oct 5.8 7.4 0.210 0.151
4 Jul-Oct 5.8 7.4 0.210 0.151
5 Nov-Dec 8.1 9.5 0.246 0.181
6 Nov-Dec 8.1 9.5 0.247 0.181
7 Nov-Dec 8.1 9.5 0.245 0.181
8 Nov-Dec 8.1 9.5 0.243 0.181
9 Jan-Mar 9.0 9.4 0.172 0.084
10 Jan-Mar 9.0 9.2 0.199 0.084
11 Apr-Jun 6.6 7.1 0.206 0.045
12 Apr-Jun 6.5 7.1 0.222 0.045

5-1
Section 5
References
AquAeTer. 2016a. Analysis of BIPCo k1, deoxygenation rate for cBODu. Technical memo, p. 9
AquAeTer. 2016b. Documentation of Recommended 7Q10’s. Technical memo, p. 16
AWARE Environmental, Inc. March 2011. DRAFT River Quality Modeling Analysis: Bear Island Paper Company, LLC
Brown and Caldwell. 2016. Dissolved Oxygen Modeling of the North Anna, South Anna, and Pamunkey River System.
Report prepared for the Hanover Co. Dept. of Public Utilities. 37 p plus appendices.
Chapra, S.C., Pelletier, G.J. and Tao, H. 2012. QUAL2K: A Modeling Framework for Simulating River and Stream
Water Quality, Version 2.12: Documentation and Users Manual. Civil and Environmental Engineering Dept., Tufts
University, Medford, MA, [email protected]
Chen, B., Kim, Y., and Westerhoff, O. 2011. Occurrence and treatment of wastewater-derived organic nitrogen. Water
Research 45(15):4641-40.
Commonwealth of Virginia Department of Environmental Quality. VPDES Permit Number VA0024899. County of
Hanover Ashland Wastewater Treatment Plant. Effective Date: October 1, 2013
Commonwealth of Virginia Department of Environmental Quality. VPDES Permit VA0020664 Fact Sheet. Department
of Juvenile Justice Hanover Facility. Permit expiration date: August 26, 2013
Commonwealth of Virginia Department of Environmental Quality. VPDES Permit VA0029521 Fact Sheet. Hanover
County Doswell Wastewater Treatment Plant. Permit expiration date: May 18, 2008
EEE Consulting, Inc. September 2012. Stream Sampling Plan: Doswell WWTP Water Quality Stream Sanitation
Model. Prepared for Hanover County
Hammond, D. Undated. VA0029521 – Doswell Wastewater Treatment Facility North Anna River Low Flow Frequency
Analysis. Draft Virginia DEQ memo, p. 6
HDR Infrastructure, Inc. January 1988. Water Quality Modeling: North Anna and Pamunkey Rivers; York River Basin,
Virginia. Prepared for Bear Island Paper Company
Lung, W. 2001. Water Quality Modeling for Wasteload Allocations and TMDLs. Wiley Press, p. 352
Muirhead, W.M., Farmer, G., Walker, S., Robb, L., Elmnedorf, H., Matthews, R., Butler, R., and Melcer, H., 2006.
Study of raw wastewater BOD5 and cBOD5 relationship yields surprising results. Proceedings of WEFTEC 2006,
pp. 840-853
National Council of the Paper Industry for Air and Stream Improvement. 1982. A Review of Ultimate BOD Estimation
and Its Kinetic Formulation for Pulp and Paper Mill Effluent. Technical Bulletin No. 382, p. 42
National Oceanic and Atmospheric Administration National Climatic Data Center. Land Based Station Data.
http://www.ncdc.noaa.gov/cdoweb/datasets/GHCND/stations/GHCND:USW00013740/detail
U.S. Environmental Protection Agency. 1997. Technical Guidance Manual for Performing Wasteload Allocations,
Book II: Streams and Rivers – Part 1: Biochemical Oxygen Demand/Dissolved Oxygen and
Nutrients/Eutrophication. EPA-823-B-97-002. 254 p
Virginia Dept. of Environmental Quality. 2016. DEQ Comments on the Dissolved Oxygen Modeling of the North Anna,
South Anna, and Pamunkey River System, October 7, 2014. Letter from Emilee C. Adamson to David Van Gelder.
3 p.

Dissolved Oxygen Modeling of the North Anna, South Anna, and Pamunkey River System
A-1
Appendix A: Field and Lab Data
Calibration Data Set: September 26-27, 2012
Corroboration Data Set: October 10-11, 2012

Dissolved Oxygen Modeling of the North Anna, South Anna, and Pamunkey River System
B-1
Appendix B: Calibration and Corroboration Charts

September 2012 Field Data
Site Date Time Temp Specific
Conductivity
DO
Concentration
DO
Concentration pH ORP
m/d/y hh:mm C mS/cm % mg/L mV
DOS1 9/27/2012 11:32 30.91 2.36 82.5 6.1 7.57 98.3
DOS2 9/27/2012 11:38 21.79 0.457 86.8 7.56 7.48 96
DOS3 9/27/2012 11:30 30.94 2.356 87 6.42 7.52 102
COURT1 9/27/2012 12:11 22.19 0.492 106.2 9.24 7.48 96
ASH1 9/27/2012 10:06 23.2 0.457 110.1 9.41 7.39 166.5
NA1 9/28/2012 9:24 20:00 0.56 87.6 7.83 6:44 231
NA2 9/27/2012 9:02 19.03 0.108 --- 8.51 6.29 247
NA3 9/27/2012 10:11 20.12 0.494 --- 7.07 7.45 197
NA4 9/27/2012 11:02 20.22 0.491 --- 7.23 7.47 192
NA5 9/27/2012 11:40 20.66 0.486 84 7.52 7.51 220.5
PR1 9/27/2012 12:25 20.83 0.358 94 8.4 7.59 232
PR2 9/27/2012 1:25 20.73 0.309 98.4 8.86 7.63 192
PR3 9/27/2012 2:48 20.86 0.296 100.1 8.9 7.56 212
PR4 9/27/2012 3:00 21.64 0.293 98 8.56 7.55 233
PR5 9/27/2012 3:25 21.78 0.297 95 8.31 7.61 254
SA1 9/26/2012 9:48 17.28 0.6 83.1 7.98 29
SA2 9/26/2012 10:30 17.59 0.67 88.9 8.49 6.77 4.6
SA3 9/26/2012 11:14 17.74 0.8 92.5 8.81 6.88 126.5
SA4 9/26/2012 12:30 18.5 0.85 96.2 8.99 6.98 102
SA5 9/26/2012 1:01 19.09 2 98.4 9.11 7.03 129.9
SA6 9/26/2012 1:50 19.49 1.2 99.8 9.17 6.96 146
SA7 9/27/2012 12:05 19.72 0.137 106 9.74 7.05 254

September 2012 Lab DataSeptember 2012 Lab DataSeptember 2012 Lab DataSeptember 2012 Lab Data
Site ID Sampling
Date Lab Sample ID Ammonia CBOD COD Nitrate
Nitrate+
Nitrite Nitrite Orthophosphate
Phosphorus,
Total
Specific
Conductance TKN Chlorophyll A
m/dd/yyyy mg/L mg/L mg/L mg/L mg/L mg/L mg/L mg/L umhos/cm mg/L mg/m3
SA1 9/26/2012 12090471-001 <0.1 <2 12.5 <0.1 <0.1 <0.05 0.04 0.05 111 0.37 <0.100
SA2 9/26/2012 12090471-002 <0.1 <2 10.8 <0.1 <0.1 <0.05 0.04 0.04 110 0.31 <0.100
SA3 9/26/2012 12090471-003 <0.1 <2 <10 0.4 0.40 <0.05 0.12 0.14 120 0.32 2.90
SA4 9/26/2012 12090471-004 <0.1 <2 10.1 0.2 0.16 <0.05 0.05 0.10 115 0.30 <0.100
SA5 9/26/2012 12090471-005 <0.1 <2 <10 0.2 0.15 <0.05 0.05 0.08 115 0.31 <0.100
SA6 9/26/2012 12090471-006 <0.1 <2 <10 0.2 0.16 <0.05 0.06 0.09 115 0.30 3.70
SA7 9/27/2012 12090502-002 <0.1 <2 <10 0.3 0.34 <0.05 0.13 0.10 Not measured 0.33 1.10
COURT1 9/27/2012 12090479-001 0.17 3.6 13.2 21.3 21.4 0.09 2.51 2.50 Not measured 1.23 <0.100
DOS1 9/27/2012 12090479-004 0.39 10.9 105 1.6 2.80 1.16 0.64 0.73 Not measured 4.28 <0.100
DOS2 9/27/2012 12090479-002 <0.1 <2 16.2 20.2 20.2 <0.05 1.34 1.36 Not measured 1.23 2.40
DOS3 9/27/2012 12090479-003 0.38 11.9 101 0.4 1.63 1.27 0.60 0.58 Not measured 3.71 0.830
ASH1 9/27/2012 12090480-001 <0.1 <2 15.2 14.6 14.6 <0.05 3.74 3.77 Not measured 1.23 <0.100
NA1 9/28/2012 12090502-011 <0.1 <2 10.1 <0.1 <0.1 <0.05 <0.01 0.12 Not measured 0.24 0.300
NA2 9/27/2012 12090502-003 <0.1 <2 <10 <0.1 <0.1 <0.05 0.03 0.02 Not measured 0.30 <0.100
NA3 9/27/2012 12090502-005 0.13 <2 25.1 0.3 0.39 0.09 0.14 0.13 Not measured 0.67 <0.100
NA4 9/27/2012 12090502-001 0.14 <2 27.8 0.3 0.41 0.07 0.13 0.14 Not measured 0.70 1.60
NA5 9/27/2012 12090502-004 0.11 <2 22.0 0.4 0.42 0.06 0.13 0.16 Not measured 0.62 5.80
PR1 9/27/2012 12090502-010 <0.1 <2 21.0 0.4 0.40 <0.05 0.12 0.28 Not measured 0.53 2.20
PR2 9/27/2012 12090502-006 <0.1 <2 14.9 0.4 0.41 <0.05 0.12 0.09 Not measured 0.47 <0.100
PR3 9/27/2012 12090502-007 <0.1 <2 16.6 0.4 0.37 <0.05 0.11 0.09 Not measured 0.41 2.20
PR4 9/27/2012 12090502-009 <0.1 <2 14.2 0.4 0.36 <0.05 0.13 0.09 Not measured 0.41 <0.100
PR5 9/27/2012 12090502-008 <0.1 <2 11.5 0.4 0.38 <0.05 0.12 0.06 Not measured 0.42 1.10

October 2012 Field DataOctober 2012 Field DataOctober 2012 Field DataOctober 2012 Field Data
Site Date Time Temp Specific
Conductivity
DO
Concentration
DO
Concentration pH ORP
m/d/y hh:mm C mS/cm % mg/L mV
DOS1 10/11/2012 10:20 26.35 2.317 88.2 7.04 7.57 179.4
DOS2 10/11/2012 10:31 19.26 0.709 90.7 8.3 7.7 127.5
DOS3 10/11/2012 10:45 27.01 2.444 84.7 6.67 7.54 184.6
COURT1 10/11/2012 11:10 19.44 0.48 99.1 9.09 7.36 115.8
ASH1 10/11/2012 11:52 20.34 0.497 102.1 9.25 7.67 98.8
NA1 10/10/2012 3:17 16.9 0.066 82.8 7.09 7.61 44.7
NA2 10/10/2012 9:26 16.2 0.069 82.2 7.95 7.29 63.5
NA3 10/10/2012 10:17 16.1 0.431 73.2 6.42 7.54 131.6
NA4 10/10/2012 10:56 16.1 0.413 70.3 6.39 7.55 109.3
NA5 10/10/2012 11:27 16.4 0.415 82.2 7.86 7.63 2.2
PR1 10/10/2012 12:08 16.6 0.346 79.8 6.59 7.64 14.4
PR2 10/10/2012 12:43 16 0.248 79.1 6.48 7.73 -72.2
PR3 10/10/2012 1:23 16.2 0.251 85.8 7.13 7.72 -52.3
PR4 10/10/2012 2:04 16.7 0.249 85.9 7.24 7.75 -83.3
PR5 10/10/2012 2:20 17.1 0.247 81.2 7.4 7.81 -97.7
SA1 10/11/2012 9:05 15.1 0.125 88 7.48 7.16 169.9
SA2 10/11/2012 9:35 14.8 0.124 87.1 7.41 7.26 75.1
SA3 10/11/2012 9:55 14.4 0.129 91.3 8.42 7.33 42.7
SA4 10/11/2012 10:35 14.3 0.127 89.8 8.31 7.38 44.3
SA5 10/11/2012 10:40 14.1 0.127 90.6 8.91 7.39 -48.8
SA6 10/11/2012 11:15 14.2 0.128 92.7 8.98 7.41 -51.4
SA7 10/10/2012 11:45 15.3 0.106 91.4 8.62 7.78 0.6

October October October October 2012 Lab Data2012 Lab Data2012 Lab Data2012 Lab Data
Site ID Sampling
Date Lab Sample ID Ammonia CBOD COD Nitrate
Nitrate+
Nitrite Nitrite Orthophosphate
Phosphorus,
Total TKN
Chlorophyll
A
m/dd/yyyy mg/L mg/L mg/L mg/L mg/L mg/L mg/L mg/L mg/L mg/m3
SA1 10/11/2012 12100248-001 <0.1 <2 14.6 <0.1 <0.1 <0.05 0.04 0.06 0.21 <0.100
SA2 10/11/2012 12100248-002 <0.1 <2 16.0 <0.1 <0.1 <0.05 0.09 0.11 0.45 <0.100
SA3 10/11/2012 12100248-003 <0.1 <2 10.7 0.2 0.24 <0.05 0.14 0.10 0.23 <0.100
SA4 10/11/2012 12100248-004 <0.1 <2 14.2 0.2 0.19 <0.05 0.06 0.16 0.22 <0.100
SA5 10/11/2012 12100248-005 <0.1 <2 16.0 0.2 0.20 <0.05 0.08 0.17 0.23 0.700
SA6 10/11/2012 12100248-006 <0.1 <2 15.7 0.3 0.26 <0.05 0.09 0.16 0.24 <0.100
SA7 10/10/2012 12100238-007 <0.1 <2 12.4 0.3 0.29 <0.05 0.13 0.14 0.24 0.400
COURT1 10/11/2012 12100245-004 0.23 5.8 45.4 24.7 24.8 0.14 3.01 3.52 3.26 <0.100
DOS1 10/11/2012 12100245-002 0.70 23.3 318 2.8 5.56 2.74 0.75 0.99 12.6 0.200
DOS2 10/11/2012 12100245-001 0.18 8.7 87.6 41.2 41.2 <0.05 2.62 0.13 4.46 4.30
DOS3 10/11/2012 12100245-003 0.67 22.0 303 0.5 3.36 2.86 0.61 1.92 12.1 <0.100
ASH1 10/11/2012 12100246-001 0.32 4.3 36.4 19.3 19.7 0.42 4.38 4.71 2.22 6.90
NA1 10/10/2012 12100238-002 <0.1 <2 13.5 <0.1 <0.1 <0.05 0.04 0.04 0.34 0.600
NA2 10/10/2012 12100238-005 <0.1 <2 11.0 <0.1 <0.1 <0.05 <0.01 0.02 0.59 1.90
NA3 10/10/2012 12100238-004 0.22 3.0 38.2 0.6 0.89 0.32 0.12 0.16 1.02 2.50
NA4 10/10/2012 12100238-006 0.16 2.1 37.5 0.6 0.81 0.21 0.12 0.16 0.82 0.800
NA5 10/10/2012 12100238-003 0.20 <2 33.9 0.7 0.84 0.18 0.15 0.16 0.89 1.70
PR1 10/10/2012 12100238-008 0.12 <2 29.6 0.6 0.70 0.13 0.14 0.14 0.70 4.30
PR2 10/10/2012 12100238-009 <0.1 <2 22.5 0.5 0.62 0.08 0.14 0.17 0.52 2.80
PR3 10/10/2012 12100238-011 <0.1 <2 23.5 0.5 0.63 0.09 0.15 0.17 0.48 3.50
PR4 10/10/2012 12100238-001 0.13 <2 16.4 0.6 0.69 0.10 0.14 0.17 0.46 1.80
PR5 10/10/2012 12100238-010 <0.1 <2 22.5 0.6 0.71 0.11 0.15 0.14 0.48 2.70

Dissolved Oxygen Modeling of the North Anna, South Anna, and Pamunkey River System
C-1
Appendix C: Detailed Point Source Inputs for
Management Scenarios

Dissolved Oxygen Modeling of the North Anna, South Anna, and Pamunkey River System
C-1
Table C-1. Point Source Inputs for the Bear Island Facility
Table C-2. Point Source Inputs for the Doswell WWTP
Nitrate N Inorg P Org P
MGD m3/s lbs/day mg/L lbs/day mg/L lbs/day mg/L lbs/day mg/L lbs/day mg/L mg/L mg/L mg/L
1 Test 81 Jul-Oct 1.5 0.1 32.0 6.5 679.3 54.3 522.5 41.8 125.1 10.0 12.5 1.0 45.0 3.6 1.8 1.0 1.0
2 Test 82 Jul-Oct 1.5 0.1 32.0 6.5 634.3 50.7 487.9 39.0 125.1 10.0 12.5 1.0 45.0 3.6 1.8 1.0 1.0
3 Test 78 Jul-Oct 1.5 0.066 32.0 6.5 679.3 54.3 522.5 41.8 125.1 10.0 12.5 1.0 45.0 3.6 1.8 1.0 1.0
4 Test 79 Jul-Oct 1.5 0.066 32.0 6.5 634.3 50.7 487.9 39.0 125.1 10.0 12.5 1.0 45.0 3.6 1.8 1.0 1.0
5 Test 47 Nov-Dec 1.5 0.066 32.0 7.1 1078.4 86.2 829.5 66.3 125.1 10.0 12.5 1.0 45.0 3.6 1.8 1.0 1.0
6 Test 53 Nov-Dec 1.5 0.066 32.0 7.1 910.7 72.8 700.6 56.0 125.1 10.0 12.5 1.0 45.0 3.6 1.8 1.0 1.0
7 Test 66 Nov-Dec 1.5 0.066 32.0 6.5 963.0 77.0 740.8 59.2 125.1 10.0 12.5 1.0 45.0 3.6 1.8 1.0 1.0
8 Test 74 Nov-Dec 1.5 0.066 32.0 6.8 634.3 50.7 487.9 39.0 125.1 10.0 12.5 1.0 45.0 3.6 1.8 1.0 1.0
9 Test 67 Jan-Mar 1.5 0.066 32.0 6.5 1125.9 90.0 866.1 69.2 125.1 10.0 12.5 1.0 45.0 3.6 1.8 1.0 1.0
10 Test 70 Jan-Mar 1.5 0.066 32.0 6.5 1125.9 90.0 866.1 69.2 125.1 10.0 12.5 1.0 45.0 3.6 1.8 1.0 1.0
11 Test 49 Apr-Jun 1.5 0.066 32.0 6.5 1125.9 90.0 866.1 69.2 125.1 10.0 12.5 1.0 45.0 3.6 1.8 1.0 1.0
12 Test 55 Apr-Jun 1.5 0.066 32.0 6.5 1125.9 90.0 866.1 69.2 125.1 10.0 12.5 1.0 45.0 3.6 1.8 1.0 1.0
CBOD5 (slow) TKN NH4-N Bioavail. Org N
SeasonScenario
Previous
Name
Bear Island Facility
Flow Temp
(dec. C)
DO
(mg/L)
BOD5
Nitrate N Inorg P Org P
MGD m3/s
Temp
(dec. C)
DO
(mg/L) lbs/day mg/L lbs/day mg/L lbs/day mg/L lbs/day mg/L lbs/day mg/L mg/L mg/L mg/L
1 Test 81 Jul-Oct 1.0 0.044 24.4 6.5 Not used Not used 41.7 5.0 25.0 3.0 8.34 1.0 10.0 1.2 1.0 0.15 0.15
2 Test 82 Jul-Oct 2.0 0.088 24.4 6.5 Not used Not used 83.4 5.0 50.0 3.0 16.68 1.0 20.0 1.2 1.0 0.15 0.15
3 Test 78 Jul-Oct 1.0 0.044 24.4 6.5 Not used Not used 41.7 5.0 25.0 3.0 8.34 1.0 10.0 1.2 1.0 0.15 0.15
4 Test 79 Jul-Oct 2.0 0.088 24.4 6.5 Not used Not used 83.4 5.0 50.0 3.0 16.68 1.0 20.0 1.2 1.0 0.15 0.15
5 Test 47 Nov-Dec 1.0 0.044 16.8 7.1 Not used Not used 41.7 5.0 25.0 3.0 8.34 1.0 10.0 1.2 1.0 0.15 0.15
6 Test 53 Nov-Dec 2.0 0.088 16.8 7.1 Not used Not used 83.4 5.0 50.0 3.0 16.68 1.0 20.0 1.2 1.0 0.15 0.15
7 Test 66 Nov-Dec 1.0 0.044 16.8 6.5 Not used Not used 41.7 5.0 25.0 3.0 8.34 1.0 10.0 1.2 1.0 0.15 0.15
8 Test 74 Nov-Dec 2.0 0.088 16.8 6.8 Not used Not used 83.4 5.0 50.0 3.0 16.68 1.0 20.0 1.2 1.0 0.15 0.15
9 Test 67 Jan-Mar 1.0 0.0 16.8 6.5 Not used Not used 41.7 5.0 25.0 3.0 8.34 1.0 10.0 1.2 1.0 0.15 0.15
10 Test 70 Jan-Mar 2.0 0.1 16.8 6.5 Not used Not used 83.4 5.0 50.0 3.0 16.68 1.0 20.0 1.2 1.0 0.15 0.15
11 Test 49 Apr-Jun 1.0 0.044 24.4 6.5 Not used Not used 41.7 5.0 25.0 3.0 8.34 1.0 10.0 1.2 1.0 0.15 0.15
12 Test 55 Apr-Jun 2.0 0.088 24.4 6.5 Not used Not used 83.4 5.0 50.0 3.0 16.68 1.0 20.0 1.2 1.0 0.15 0.15
SeasonScenario
Previous
Name
Doswell WWTP
Flow BOD5 CBOD5 (fast) TKN NH4-N Bioavail. Org N

Dissolved Oxygen Modeling of the North Anna, South Anna, and Pamunkey River System
C-2
Table C-3. Point Source Inputs for Other Point Sources
Nitrate N Inorg P Org P
MGD m3/s lbs/day mg/L lbs/day mg/L lbs/day mg/L lbs/day mg/L lbs/day mg/L mg/L mg/L mg/L
Apr-Jun & Jul-Sept, Ashland WWTP 2.0 0.0876 24.4 7.00a
Not used Not used 338.7 20.3 83.4 5.0 16.68 1.00 50.0 3.00 14.6 4.38 0.17
Apr-Jun & Jul-Sept, Hanover Courthouse WWTP 0.08 0.0035 24.4 5.00 30.00 10.8 16.2 11.3 17.0 1.668 2.50 5.8 8.70 21.4 3.01 0.17
Apr-Jun & Jul-Sept, JCC 0.035 0.0015 22.0 6.00 30.00 4.7 16.2 8.2 28.0 5.10825 17.50 1.8 6.31 18.0 3.70 0.08
Nov-Dec & Jan-Mar, Ashland WWTP 2.0 0.0876 16.8 7.00 Not used Not used 338.7 20.3 83.4 5.0 16.68 1.00 50.0 3.00 14.6 4.38 0.17
Nov-Dec & Jan-Mar, Hanover Courthouse WWTP 0.08 0.0035 15.0 5.00 30.00 10.8 16.2 11.3 17.0 1.668 2.50 5.8 8.70 21.4 3.01 0.17
Nov-Dec & Jan-Mar, JCC 0.035 0.0015 18.7 6.00 30.00 4.7 16.2 8.2 28.0 5.10825 17.50 1.8 6.31 18.0 3.70 0.08aThe exception was for scenarios 3 and 4, for which Ashland DO was set to 6.5 mg/L to explore effects on delta DO in the South Anna River.
Bioavail. Org N
Seasonal Scenarios - Facility
Other Facilities
Flow Temp
(dec. C)
DOa
(mg/L)
BOD5 CBOD5 (fast) TKN NH4-N

Dissolved Oxygen Modeling of the North Anna, South Anna, and Pamunkey River System
D-1
Appendix D: Dissolved Oxygen Profiles for
Management Scenarios

Bear Island/Doswell Hanover CH JCC Ashland
-0.30
-0.25
-0.20
-0.15
-0.10
-0.05
0.00
0.05
4.0
4.5
5.0
5.5
6.0
6.5
7.0
7.5
8.0
8.5
9.0
051015202530354045
Del
ta D
isso
lved
Oxy
gen
(mg/
L)
Dis
solv
ed O
xyge
n (m
g/L)
River Kilometer
Scenario 1
Mainstem Point Source
S. Anna Point Source
DO-Mainstem
DO-South Anna
Delta DO-Mainstem
Delta DO-S. Anna

Bear Island/Doswell Hanover CH JCC Ashland
-0.30
-0.25
-0.20
-0.15
-0.10
-0.05
0.00
0.05
4.0
4.5
5.0
5.5
6.0
6.5
7.0
7.5
8.0
8.5
9.0
051015202530354045
Del
ta D
isso
lved
Oxy
gen
(mg/
L)
Dis
solv
ed O
xyge
n (m
g/L)
River Kilometer
Scenario 2
Mainstem Point Source
S. Anna Point Source
DO-Mainstem
DO-South Anna
Delta DO-Mainstem
Delta DO-S. Anna

Bear Island/Doswell Hanover CH JCC Ashland
-0.30
-0.25
-0.20
-0.15
-0.10
-0.05
0.00
0.05
4.0
4.5
5.0
5.5
6.0
6.5
7.0
7.5
8.0
8.5
9.0
051015202530354045
Del
ta D
isso
lved
Oxy
gen
(mg/
L)
Dis
solv
ed O
xyge
n (m
g/L)
River Kilometer
Scenario 3
Mainstem Point Source
S. Anna Point Source
DO-Mainstem
DO-South Anna
Delta DO-Mainstem
Delta DO-S. Anna

Bear Island/Doswell Hanover CH JCC Ashland
-0.30
-0.25
-0.20
-0.15
-0.10
-0.05
0.00
0.05
4.0
4.5
5.0
5.5
6.0
6.5
7.0
7.5
8.0
8.5
9.0
051015202530354045
Del
ta D
isso
lved
Oxy
gen
(mg/
L)
Dis
solv
ed O
xyge
n (m
g/L)
River Kilometer
Scenario 4
Mainstem Point Source
S. Anna Point Source
DO-Mainstem
DO-South Anna
Delta DO-Mainstem
Delta DO-S. Anna

Bear Island/Doswell Hanover CH JCC Ashland
-0.30
-0.25
-0.20
-0.15
-0.10
-0.05
0.00
0.05
4.0
5.0
6.0
7.0
8.0
9.0
10.0
11.0
051015202530354045
Del
ta D
isso
lved
Oxy
gen
(mg/
L)
Dis
solv
ed O
xyge
n (m
g/L)
River Kilometer
Scenario 5
Mainstem Point Source
S. Anna Point Source
DO-Mainstem
DO-South Anna
Delta DO-Mainstem
Delta DO-S. Anna


Bear Island/Doswell Hanover CH JCC Ashland
-0.30
-0.25
-0.20
-0.15
-0.10
-0.05
0.00
0.05
4.0
5.0
6.0
7.0
8.0
9.0
10.0
11.0
051015202530354045
De
lta
Dis
solv
ed
Oxy
ge
n (
mg
/L)
Dis
solv
ed
Oxy
ge
n (
mg
/L)
River Kilometer
Scenario 7
Mainstem Point Source
S. Anna Point Source
DO-Mainstem
DO-South Anna
Delta DO-Mainstem
Delta DO-S. Anna

Bear Island/Doswell Hanover CH JCC Ashland
-0.30
-0.25
-0.20
-0.15
-0.10
-0.05
0.00
0.05
4.0
5.0
6.0
7.0
8.0
9.0
10.0
11.0
051015202530354045
Del
ta D
isso
lved
Oxy
gen
(mg/
L)
Dis
solv
ed O
xyge
n (m
g/L)
River Kilometer
Scenario 8
Mainstem Point Source
S. Anna Point Source
DO-Mainstem
DO-South Anna
Delta DO-Mainstem
Delta DO-S. Anna

Bear Island/Doswell Hanover CH JCC Ashland
-0.20
-0.15
-0.10
-0.05
0.00
0.05
4.0
5.0
6.0
7.0
8.0
9.0
10.0
11.0
051015202530354045
De
lta
Dis
solv
ed
Oxy
ge
n (
mg
/L)
Dis
solv
ed
Oxy
ge
n (
mg
/L)
River Kilometer
Scenario 9
Mainstem Point Source
S. Anna Point Source
DO-Mainstem
DO-South Anna
Delta DO-Mainstem
Delta DO-S. Anna

Bear Island/Doswell Hanover CH JCC Ashland
-0.25
-0.20
-0.15
-0.10
-0.05
0.00
0.05
4.0
5.0
6.0
7.0
8.0
9.0
10.0
11.0
051015202530354045
De
lta
Dis
solv
ed
Oxy
ge
n (
mg
/L)
Dis
solv
ed
Oxy
ge
n (
mg
/L)
River Kilometer
Scenario 10
Mainstem Point Source
S. Anna Point Source
DO-Mainstem
DO-South Anna
Delta DO-Mainstem
Delta DO-S. Anna

Bear Island/Doswell Hanover CH JCC Ashland
-0.25
-0.20
-0.15
-0.10
-0.05
0.00
0.05
0.10
0.15
4.0
4.5
5.0
5.5
6.0
6.5
7.0
7.5
8.0
8.5
9.0
051015202530354045
Del
ta D
isso
lved
Oxy
gen
(mg/
L)
Dis
solv
ed O
xyge
n (m
g/L)
River Kilometer
Scenario 11
Mainstem Point Source
S. Anna Point Source
DO-Mainstem
DO-South Anna
Delta DO-Mainstem
Delta DO-S. Anna
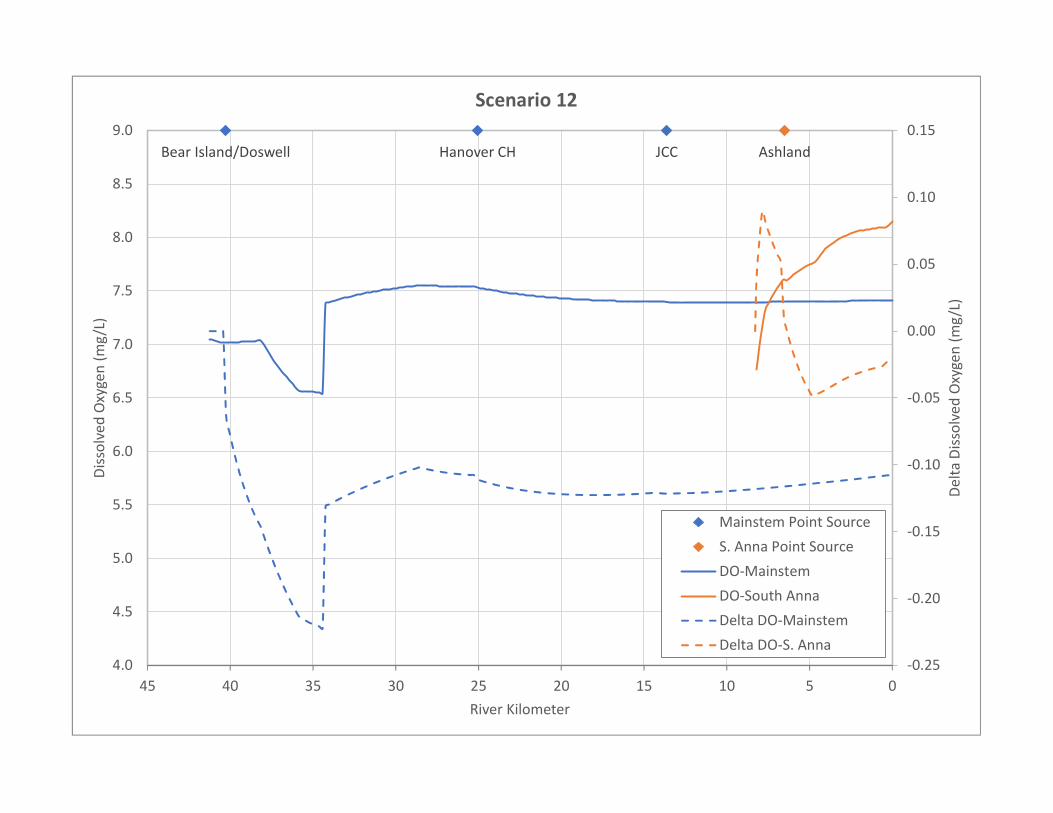
Bear Island/Doswell Hanover CH JCC Ashland
-0.25
-0.20
-0.15
-0.10
-0.05
0.00
0.05
0.10
0.15
4.0
4.5
5.0
5.5
6.0
6.5
7.0
7.5
8.0
8.5
9.0
051015202530354045
Del
ta D
isso
lved
Oxy
gen
(mg/
L)
Dis
solv
ed O
xyge
n (m
g/L)
River Kilometer
Scenario 12
Mainstem Point Source
S. Anna Point Source
DO-Mainstem
DO-South Anna
Delta DO-Mainstem
Delta DO-S. Anna

Dissolved Oxygen Modeling of the North Anna, South Anna, and Pamunkey River System
E-1
Appendix E: Average DO and Delta DO by Segment
and Scenario
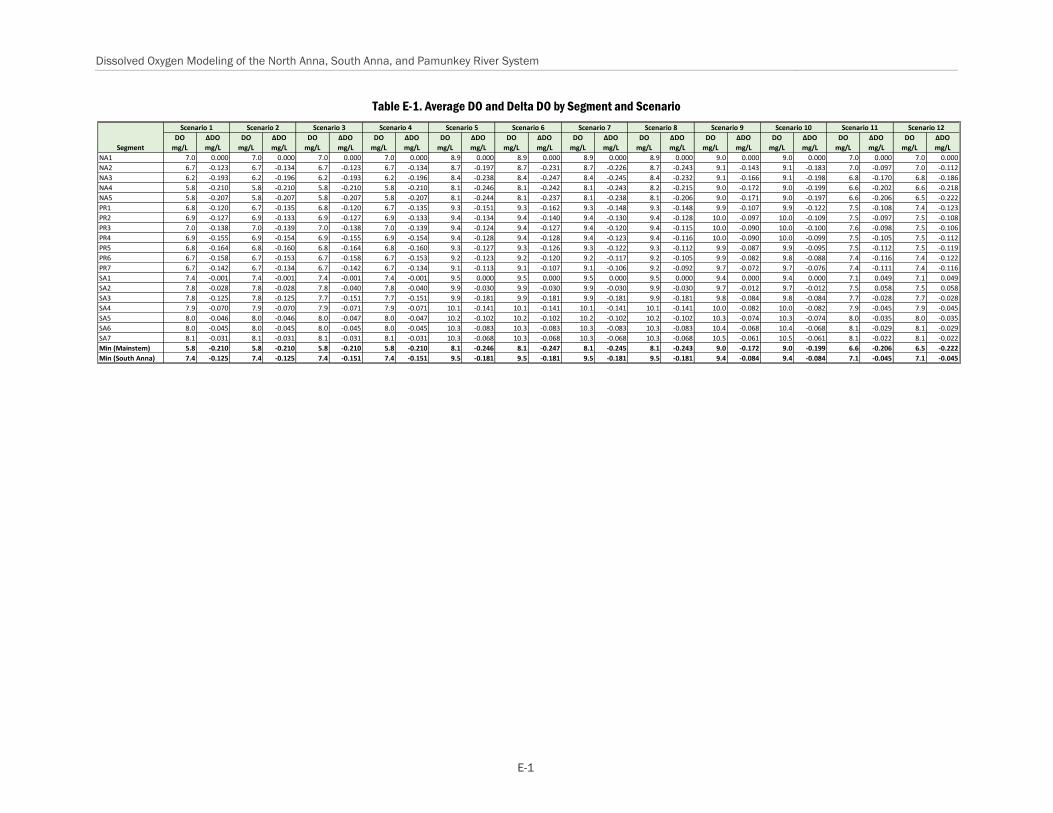
Dissolved Oxygen Modeling of the North Anna, South Anna, and Pamunkey River System
E-1
Table E-1. Average DO and Delta DO by Segment and Scenario
DO
mg/L
ΔDO
mg/L
DO
mg/L
ΔDO
mg/L
DO
mg/L
ΔDO
mg/L
DO
mg/L
ΔDO
mg/L
DO
mg/L
ΔDO
mg/L
DO
mg/L
ΔDO
mg/L
DO
mg/L
ΔDO
mg/L
DO
mg/L
ΔDO
mg/L
DO
mg/L
ΔDO
mg/L
DO
mg/L
ΔDO
mg/L
DO
mg/L
ΔDO
mg/L
DO
mg/L
ΔDO
mg/L
NA1 7.0 0.000 7.0 0.000 7.0 0.000 7.0 0.000 8.9 0.000 8.9 0.000 8.9 0.000 8.9 0.000 9.0 0.000 9.0 0.000 7.0 0.000 7.0 0.000
NA2 6.7 -0.123 6.7 -0.134 6.7 -0.123 6.7 -0.134 8.7 -0.197 8.7 -0.231 8.7 -0.226 8.7 -0.243 9.1 -0.143 9.1 -0.183 7.0 -0.097 7.0 -0.112
NA3 6.2 -0.193 6.2 -0.196 6.2 -0.193 6.2 -0.196 8.4 -0.238 8.4 -0.247 8.4 -0.245 8.4 -0.232 9.1 -0.166 9.1 -0.198 6.8 -0.170 6.8 -0.186
NA4 5.8 -0.210 5.8 -0.210 5.8 -0.210 5.8 -0.210 8.1 -0.246 8.1 -0.242 8.1 -0.243 8.2 -0.215 9.0 -0.172 9.0 -0.199 6.6 -0.202 6.6 -0.218
NA5 5.8 -0.207 5.8 -0.207 5.8 -0.207 5.8 -0.207 8.1 -0.244 8.1 -0.237 8.1 -0.238 8.1 -0.206 9.0 -0.171 9.0 -0.197 6.6 -0.206 6.5 -0.222
PR1 6.8 -0.120 6.7 -0.135 6.8 -0.120 6.7 -0.135 9.3 -0.151 9.3 -0.162 9.3 -0.148 9.3 -0.148 9.9 -0.107 9.9 -0.122 7.5 -0.108 7.4 -0.123
PR2 6.9 -0.127 6.9 -0.133 6.9 -0.127 6.9 -0.133 9.4 -0.134 9.4 -0.140 9.4 -0.130 9.4 -0.128 10.0 -0.097 10.0 -0.109 7.5 -0.097 7.5 -0.108
PR3 7.0 -0.138 7.0 -0.139 7.0 -0.138 7.0 -0.139 9.4 -0.124 9.4 -0.127 9.4 -0.120 9.4 -0.115 10.0 -0.090 10.0 -0.100 7.6 -0.098 7.5 -0.106
PR4 6.9 -0.155 6.9 -0.154 6.9 -0.155 6.9 -0.154 9.4 -0.128 9.4 -0.128 9.4 -0.123 9.4 -0.116 10.0 -0.090 10.0 -0.099 7.5 -0.105 7.5 -0.112
PR5 6.8 -0.164 6.8 -0.160 6.8 -0.164 6.8 -0.160 9.3 -0.127 9.3 -0.126 9.3 -0.122 9.3 -0.112 9.9 -0.087 9.9 -0.095 7.5 -0.112 7.5 -0.119
PR6 6.7 -0.158 6.7 -0.153 6.7 -0.158 6.7 -0.153 9.2 -0.123 9.2 -0.120 9.2 -0.117 9.2 -0.105 9.9 -0.082 9.8 -0.088 7.4 -0.116 7.4 -0.122
PR7 6.7 -0.142 6.7 -0.134 6.7 -0.142 6.7 -0.134 9.1 -0.113 9.1 -0.107 9.1 -0.106 9.2 -0.092 9.7 -0.072 9.7 -0.076 7.4 -0.111 7.4 -0.116
SA1 7.4 -0.001 7.4 -0.001 7.4 -0.001 7.4 -0.001 9.5 0.000 9.5 0.000 9.5 0.000 9.5 0.000 9.4 0.000 9.4 0.000 7.1 0.049 7.1 0.049
SA2 7.8 -0.028 7.8 -0.028 7.8 -0.040 7.8 -0.040 9.9 -0.030 9.9 -0.030 9.9 -0.030 9.9 -0.030 9.7 -0.012 9.7 -0.012 7.5 0.058 7.5 0.058
SA3 7.8 -0.125 7.8 -0.125 7.7 -0.151 7.7 -0.151 9.9 -0.181 9.9 -0.181 9.9 -0.181 9.9 -0.181 9.8 -0.084 9.8 -0.084 7.7 -0.028 7.7 -0.028
SA4 7.9 -0.070 7.9 -0.070 7.9 -0.071 7.9 -0.071 10.1 -0.141 10.1 -0.141 10.1 -0.141 10.1 -0.141 10.0 -0.082 10.0 -0.082 7.9 -0.045 7.9 -0.045
SA5 8.0 -0.046 8.0 -0.046 8.0 -0.047 8.0 -0.047 10.2 -0.102 10.2 -0.102 10.2 -0.102 10.2 -0.102 10.3 -0.074 10.3 -0.074 8.0 -0.035 8.0 -0.035
SA6 8.0 -0.045 8.0 -0.045 8.0 -0.045 8.0 -0.045 10.3 -0.083 10.3 -0.083 10.3 -0.083 10.3 -0.083 10.4 -0.068 10.4 -0.068 8.1 -0.029 8.1 -0.029
SA7 8.1 -0.031 8.1 -0.031 8.1 -0.031 8.1 -0.031 10.3 -0.068 10.3 -0.068 10.3 -0.068 10.3 -0.068 10.5 -0.061 10.5 -0.061 8.1 -0.022 8.1 -0.022
Min (Mainstem) 5.8 -0.210 5.8 -0.210 5.8 -0.210 5.8 -0.210 8.1 -0.246 8.1 -0.247 8.1 -0.245 8.1 -0.243 9.0 -0.172 9.0 -0.199 6.6 -0.206 6.5 -0.222
Min (South Anna) 7.4 -0.125 7.4 -0.125 7.4 -0.151 7.4 -0.151 9.5 -0.181 9.5 -0.181 9.5 -0.181 9.5 -0.181 9.4 -0.084 9.4 -0.084 7.1 -0.045 7.1 -0.045
Scenario 12Scenario 6 Scenario 7 Scenario 8 Scenario 9 Scenario 10 Scenario 11Scenario 5
Segment
Scenario 1 Scenario 2 Scenario 3 Scenario 4

Dissolved Oxygen Modeling of the North Anna, South Anna, and Pamunkey River System

Office
3454 West Clay Street
Richmond, VA 23230
T 804.763.9135