Embed Size (px)
Citation preview
VA UTILIZATION AND PATIENT INSURANCE COVERAGE

VA UTILIZATION AND PATIENT INSURANCE COVERAGE
By
Ann M. Hendricks, PhD
Yujing Shen, PhD John A. Gardner, PhD
Shuo Zhang, MS, MPH Lewis Kazis, ScD
Center for Health Quality, Outcomes and
Economic Research (152)
Edith Nourse Rogers Memorial Hospital
200 Springs Road
Bedford, MA 01730
Management Decision and Research Center
Health Services Research and Development Service
Office of Research and Development
Prepared for the Revenue Office, Office of the Chief Financial Officer
Veterans Health Administration
September 2000
i
ACKNOWLEGEMENTS
The authors thank Austin Lee, Ph.D. of the Center for Health Quality, Outcomes and Economic
Research, Jonathan Perlin, MD, Ph.D. of the Office of Quality and Performance, and Becky Hucks
and Robert Hinson of the Office of Alternative Revenues for assistance with the datasets on which
this report builds. Special thanks are due to Daniel Rosen for his efforts for this project. Remaining
errors are those of the authors. The opinions expressed are those of the authors and do not represent
the opinions of the Veterans Health Administration, the Health Services research and Development
Service, the Office of Quality and Performance or the Office of Alternative Revenues.
ii
HIGHLIGHTS
Since 1997, researchers at the Center for Health Quality, Outcomes and Economic Research (CHQOER) have estimated VA’s potential collections from third-party payers for care provided to veterans at VA medical centers. One long-standing concern with the model is that it assumed, for lack of better data, that the proportion of care delivered to patients with third-party health insurance equals the proportion of insured patients. This assumption led to overestimates of the amount VA can expect to collect from the insurance companies it bills. Despite recognition of the problem, VA could not correct it or even quantify the amount of the overestimate because it lacked detailed, reliable data on the health insurance coverage of veterans receiving care from VA. Now, there are new data available from a unique survey of VA enrollees, the Large Health Survey of VA Enrollees, conducted in 1999 by the Office of Quality and Performance in collaboration with the VHA Health Assessment Project. Using those data, CHQOER will quantify the overestimate. As the first step in that quantification, CHQOER has profiled veterans’ insurance coverage and utilization by analyzing survey data and linking it to VHA utilization databases. This report presents the results of those analyses. CHQOER quantification of overestimates will be presented in a separate report. Among the key findings here:
1. The Large Health Survey provides valid information on VA patients’ health insurance.
• The self-reports of Medicare coverage show high agreement with the coverage estimated from merged VA/Medicare data.
• The match between the survey data and MCCF billing data on insurance coverage for FY 1999 is approximately 90%.
2. Controlling for Medicare status, VA patients with private insurance coverage tend to have higher incomes, lower disability status and better health status than other veterans.
• 52.5% of VA enrollees are also enrolled in Medicare (dually-enrolled) as of the summer of 1999.
• 47% of VA enrollees have third-party private health care insurance.
53% of dually-enrolled patients have private Medigap policies.
40% of VA enrollees who are not in Medicare report private health care insurance.
• Privately insured patients have better health status than patients without coverage.
• The majority (~ 75%) of the dually-enrolled patients are over age 65.
Dually-enrolled patients under age 65 are less likely to have third-party private health care insurance than the older Medicare enrollees who use VA.
iii
• Overall, enrollees who are catastrophically disabled, with low-income priority, or with service-connected disability of 50% or more are much less likely to have private insurance, whether or not they are enrolled in Medicare.
• Enrollees with higher income or lower disability status tend to have Medigap or other private insurance (depending on whether they are Medicare enrollees).
3. Insurance coverage for veterans varies across VISNs.
• Medicare coverage varies across VISNs by a factor of 1.5: from 46.2% of enrollees in VISN 20 to 62.1% in VISN 3.
• The percentage of enrollees with private insurance also varies by a factor of 1.5: from 37.6% in VISN 22 (20.4% with Medigap and 17.2% with other private insurance) to 57.6% in VISN 4 (37.7% with Medigap and 19.9% with other private insurance).
4. The amount of VA care incurred by veterans (valued using MCCF’s reasonable charges) varies by insurance status.
• VA enrollees with any private insurance (Medigap or otherwise) use less VA care on average than patients without any private insurance. Enrollees with any private insurance are admitted to VA hospitals less frequently and have fewer outpatient visits and procedures.
• When the utilization is valued using MCCF’s reasonable charges:
For VA inpatients, Medicare enrollees with Medigap coverage incur average annual reasonable charges roughly equal to Medicare enrollees without private insurance ($26,999 compared to $26,604), but the number of discharges per year is slightly less (1.57 compared to 1.74).
For VA outpatients, Medicare enrollees with Medigap coverage incur annual reasonable charges per patient equal to about half those of Medicare enrollees without private insurance ($2,248 compared to $4,083).
VA patients with private insurance only (i.e., not enrolled in Medicare) incur annual reasonable charges per patient equal to about half those of enrollees without private insurance in both inpatient ($13,541 compared to $22,502) and outpatient ($1,868 compared to $3,672) settings.
This evidence confirms that the CHQOER/MCCF model of VA’s potential collections from third party insurers has tended to overestimate potential billable amounts and that the extent of overstatement varies among the VISNs. The overstatement is considerable larger for non-Medicare enrollees with private health insurance than for Medicare enrollees with Medigap coverage. CHQOER researchers are comparing several approaches to estimating the impact of the new survey information on the CHQOER/MCCF estimates of potential third party collections.
iv
TABLE OF CONTENTS
HIGHLIGHTS ................................................................................................................................... ii
TABLE OF CONTENTS ...................................................................................................................v
LIST OF REPORT TABLES .......................................................................................................... vi
LIST OF REPORT FIGURES ...................................................................................................... viii
LIST OF APPENDIX TABLES ........................................................................................................x
OVERVIEW........................................................................................................................................1
THE 1999 LARGE HEALTH SURVEY OF VA ENROLLEES....................................................2
SURVEY SAMPLE.................................................................................................................................2 MODULE QUESTIONS...........................................................................................................................2 MODULE REPRESENTATIVENESS .........................................................................................................3 VALIDITY OF THE SURVEY INSURANCE INFORMATION ........................................................................7 Medicare Coverage…………………………….………………………………………………..7
Matching Insurance Classification with VA Billing…………………………………..………….8
INSURANCE COVERAGE AND PATIENT CHARACTERISTICS.........................................11
AGE ..................................................................................................................................................12 VA PRIORITY CATEGORY.................................................................................................................14 HEALTH STATUS...............................................................................................................................16 OTHER CHARACTERISTICS................................................................................................................18
DIFFERENCES IN INSURANCE COVERAGE BY VISN .........................................................23
DIFFERENCES IN UTILIZATION BY INSURANCE STATUS ...............................................25
TOTAL WORKLOAD ..........................................................................................................................28 Inpatient………………………………………………………………………………………….28 Outpatient…………………………………………………………………….…………………..29
SPECIFIC CARE .................................................................................................................................34
DIFFERENCES IN UTILIZATION BY VISN..............................................................................39
INPATIENT ........................................................................................................................................39 OUTPATIENT.....................................................................................................................................43
SUMMARY .......................................................................................................................................43
REFERENCES..................................................................................................................................47
APPENDIX........................................................................................................................................48
v
LIST OF REPORT TABLES
TABLE 1: UTILIZATION/ INSURANCE QUESTIONS – 1999 LARGE HEALTH SURVEY ......3
TABLE 2: CHARACTERISTICS OF RESPONDENTS, WEIGHTED .............................................3
TABLE 3: GEOGRAPHIC DISTRIBUTION OF RESPONDENTS, WEIGHTED...........................5
TABLE 4: HEALTH STATUS OF RESPONDENTS, WEIGHTED.................................................6
TABLE 5: PROPORTION OF RESPONDENTS REPORTING SPECIFIC DIAGNOSES, WEIGHTED...................................................................................................................................6
TABLE 6: INSURANCE STATUS BY BILLED STATUS, WEIGHTED .......................................9
TABLE 7: PROPORTION OF PATIENTS BILLED BY PRIORITY CATEGORY, WEIGHTED11
TABLE 8: INSURANCE COVERAGE FOR RESPONDENTS BY MEDICARE STATUS.........12
TABLE 9: DEFINITION OF PRIORITY CATEGORIES...............................................................14
TABLE 10: PRIORITY CATEGORY BY INSURANCE GROUP, WEIGHTED ...........................15
TABLE 11: INSURANCE GROUP BY PRIORITY CATEGORY, WEIGHTED ...........................15
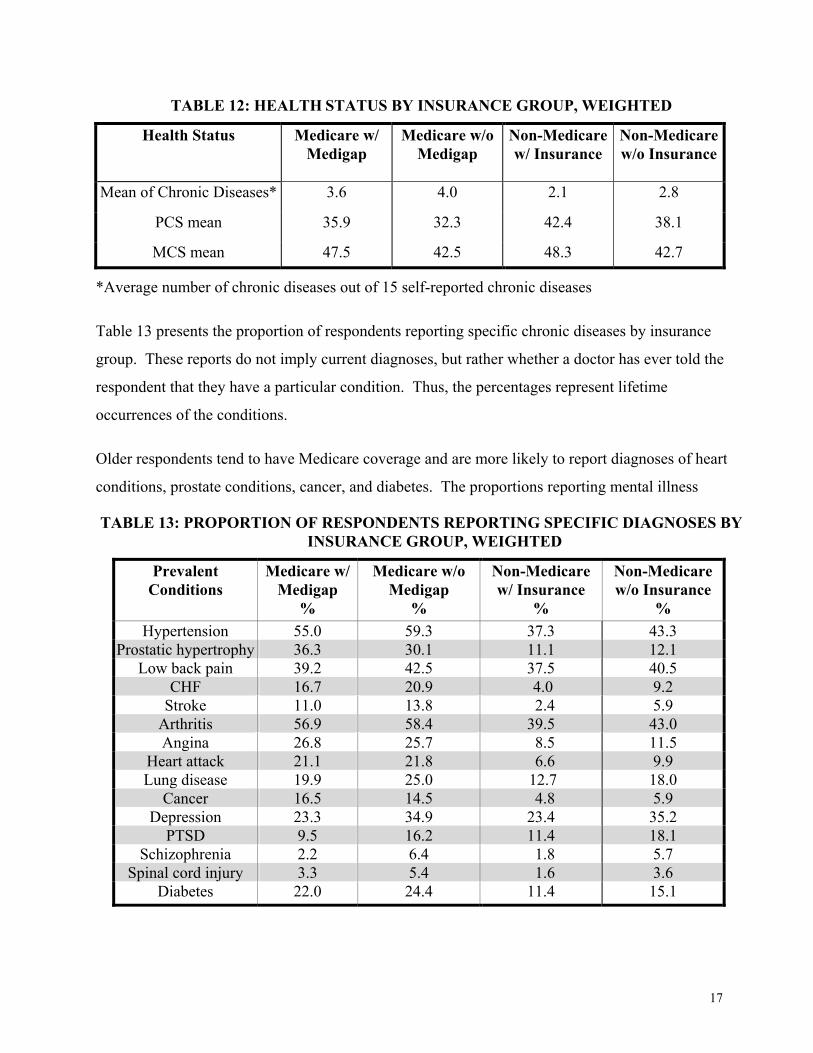
TABLE 12: HEALTH STATUS BY INSURANCE GROUP, WEIGHTED.....................................17
TABLE 13: PROPORTION OF RESPONDENTS REPORTING SPECIFIC DIAGNOSES BY INSURANCE GROUP, WEIGHTED .........................................................................................17
TABLE 14: PATIENTS’ INSURANCE STATUS FOR TOP 25 DRGS, WEIGHTED....................36
TABLE 15: INSURANCE STATUS FOR INPATIENT DAYS IN TOP 25 DRGS, WEIGHTED ..37
TABLE 16: INSURANCE STATUS FOR TOTAL CHARGES IN TOP 25 CPTS , WEIGHTED ..38
TABLE 17: PERCENTAGE OF INPATIENT DISCHARGES IN VISN BY INSURANCE GROUP, WEIGHTED.................................................................................................................................40
TABLE 18: PERCENTAGE OF INPATIENT CHARGES IN VISN BY INSURANCE GROUP, WEIGHTED.................................................................................................................................41
TABLE 19: RATIO OF INPATIENT RESOURCE USED BY PATIENTS WITH PRIVATE INSURANCE TO NUMBER OF PATIENTS WITH PRIVATE INSURANCE, VISN, WEIGHTED.................................................................................................................................42
TABLE 20: PERCENTAGE OF OUTPATIENT VISITS IN VISN BY INSURANCE GROUP, WEIGHTED.................................................................................................................................44

vi
TABLE 21: PERCENTAGE OF CPT CHARGES IN VISN BY INSURANCE GROUP, WEIGHTED.................................................................................................................................45
TABLE 22: RATIO OF OUTPATIENT RESOURCE USED BY PATIENTS WITH PRIVATE INSURANCE TO NUMBER OF PATIENTS WITH PRIVATE INSURANCE, VISN, WEIGHTED.................................................................................................................................46
vii
LIST OF REPORT FIGURES
FIGURE 1: VA ENROLLEES' INSURANCE COVERAGE AGE..................................................................12
FIGURE 2: PATIENT AGE BY INSURANCE GROUP ..............................................................................13
FIGURE 3: PATIENT INSURANCE BY AGE GROUP ..............................................................................14
FIGURE 4: PATIENT GENDER BY INSURANCE GROUP........................................................................18
FIGURE 5: PATIENT ETHNICITY BY INSURANCE GROUP....................................................................19
FIGURE 6: PATIENT EDUCATION BY INSURANCE GROUP ..................................................................20
FIGURE 7: PATIENT MARITAL STATUS BY INSURANCE GROUP.........................................................20
FIGURE 8: PATIENT LIVING ARRANGEMENT BY INSURANCE GROUP ................................................21
FIGURE 9: PATIENT EMPLOYMENT STATUS BY INSURANCE GROUP..................................................22
FIGURE 10: PERCENTAGE OF PATIENTS IN INSURANCE GROUPS WHO REPORT ECONOMIC HARDSHIP 22
FIGURE 11: PERCENTAGE OF PATIENTS IN VISN WITH MEDICARE COVERAGE, WEIGHTED................24
FIGURE 12: PERCENTAGE OF PATIENTS IN VISN WITH PRIVATE INSURANCE, WEIGHTED...................26
FIGURE 13: PERCENT OF PATIENTS IN VISN WITH NO PUBLIC OR PRIVATE INSURANCE, WEIGHTED .27
FIGURE 14: PERCENTAGES OF INPATIENTS AND WORKLOAD BY INSURANCE GROUP.........................28
FIGURE 15: PERCENTAGES OF OUTPATIENTS AND WORKLOAD BY INSURANCE GROUP .....................29
FIGURE 16: PERCENTAGE OF CPT CODES WITH MCCF-PRICE .............................................................30
FIGURE 17: PERCENTAGE OF PATIENTS WITH VA INPATIENT OR OUTPATIENT CARE BY INSURANCE GROUP ..........................................................................................................................................31
FIGURE 18: AVERAGE NUMBER OF INPATIENT STAYS/OUTPATIENT VISITS PER PATIENT BY INSURANCE GROUP, FY 1999 ...........................................................................................................................31
FIGURE 19: AVERAGE NUMBER OF INPATIENT DAYS/PATIENT BY INSURANCE GROUP, FY 1999 .......32
FIGURE 20: AVERAGE ANNUAL REASONABLE CHARGES PER PATIENT WITH ANY CARE, BY INSURANCE GROUP, FY 1999 ...........................................................................................................................33
FIGURE 21: AVERAGE NUMBER OF CPT CODES PER PATIENT BY INSURANCE GROUP, FY 1999 .........33

viii
FIGURE 22: PERCENTAGE OF TOTAL HOSPITAL DAYS IN TOP 25 DRGS ..............................................34
FIGURE 23: PERCENTAGE OF TOTAL CPT REASONABLE CHARGES IN TOP 25 CPT CODES ..................35
ix
LIST OF APPENDIX TABLES
APPENDIX TABLE 1: PATIENTS’ CHARACTERISTICS BY INSURANCE GROUP ........................................48
APPENDIX TABLE 2: TOTAL WORKLOAD IN VA INPATIENT CARE BY INSURANCE GROUP, WEIGHTED49
APPENDIX TABLE 3: TOTAL WORKLOAD IN VA OUTPATIENT CARE BY INSURANCE GROUP,
WEIGHTED....................................................................................................................................49
APPENDIX TABLE 4: AVERAGE WORKLOAD IN VA INPATIENT CARE BY INSURANCE GROUP,
WEIGHTED....................................................................................................................................50
APPENDIX TABLE 5: AVERAGE WORKLOAD IN VA OUTPATIENT CARE BY INSURANCE GROUP, WEIGHTED....................................................................................................................................50
1
OVERVIEW
Since fiscal year (FY) 1997, researchers at the Center for Health Quality, Outcomes and Economic
Research (CHQOER) have estimated the Veterans Health Administration’s (VA's) potential
collections from third party payers for care provided to veterans at VA medical centers. The
CHQOER estimation model was originally developed and refined by Medical Care Cost Recovery’s
“MCCF Goal Methodology” committee and staff. CHQOER researchers have continued to refine
components in the estimation model (e.g., Hendricks et al., 1997a, 1997b).
One concern that has always been acknowledged but has been impossible to address is the model’s
implicit assumption that the proportion of patients with third party health insurance is equal to the
proportion of care delivered to patients with such insurance. This assumption has led to the
overestimate of potential billable amounts, but the size of the overestimate has been unknown.
CHQOER has demonstrated that patients who were billed in FY 1995 averaged fewer inpatient days
and more outpatient visits than those with no bill in that year (1997a, p. 8). Data from the 1992
National Survey of Veterans confirmed that VA patients with private health care coverage reported
less health care from VA providers than patients without such insurance (1997a, p. 9). The model’s
simplifying assumption that the proportion of care covered by insurance was equal to the proportion
of patients with coverage was necessary, however, because no data on the insurance status of all VA
patients or a representative sample of them was available with which to estimate differences in their
services.
This report addresses that concern by analyzing a unique survey of VA enrollees conducted in 1999
(Perlin, et al., 2000). CHQOER merged survey responses with VA utilization data for FY 1999.
The analysis demonstrates the relative overstatement of utilization previously assumed for VA
patients with private health insurance. The overstatement is considerably larger for non-Medicare
enrollees with private health insurance than for Medicare enrollees with Medigap coverage.
This report presents detailed information about the data used in the analysis (Section II) and
describes the insurance coverage of different groups of patients (Sections III and IV). Analyses of
differences in utilization of VA services across the nation are the subject of Section V, while Section
VI presents the information by network (VISN).
2
THE 1999 LARGE HEALTH SURVEY OF VA ENROLLEES
The 1999 Large Health Survey of VA Enrollees is the largest and most detailed survey of veterans
using VA services ever conducted. The VA’s Office of Quality and Performance funded the effort,
which was conducted as a collaborative effort between that office and the VHA Health Assessment
Project at CHQOER. This section briefly describes the survey sample, the questions, and the degree
to which the respondents are representative of VA’s veteran patient population. More information is
available in a series of reports from the Office of Quality and Performance and the VHA Health
Assessment Project (HAP).
Survey Sample
The sampling frame for the Large Survey was the VA enrollment file as of March 1999, which
contained the names, addresses, and pertinent enrollment data for 3,613,877 live enrollees. A total of
1,500,000 enrollees (~43% of the total) were surveyed, using a stratified random sample (Perlin,
2000). Twenty percent of this sample were randomly assigned to each of five survey modules. Each
module focused on one of the following five topics: 1) utilization/insurance, 2) satisfaction with
care, 3) social support, 4) smoking and alcohol use, and 5) physical activity and diet. Each module
shared 31 core questions about enrollees’ health status measured by the Veterans SF-36, prevalence
of medical and mental conditions, and sociodemographic factors including age, gender, marital
status, education level, race, employment, living arrangements (living alone or not), and economic
hardship (measured by a concern for having enough food).
The survey’s overall response rate was 63.1% (n= 887,775). The response rates by VISN ranged
from 57.7% to 68.5%. When weighted for non-response and for the stratification in selection of the
sample, survey respondents provide a representative picture of the health status of the population of
VA enrollees (Perlin, 2000).
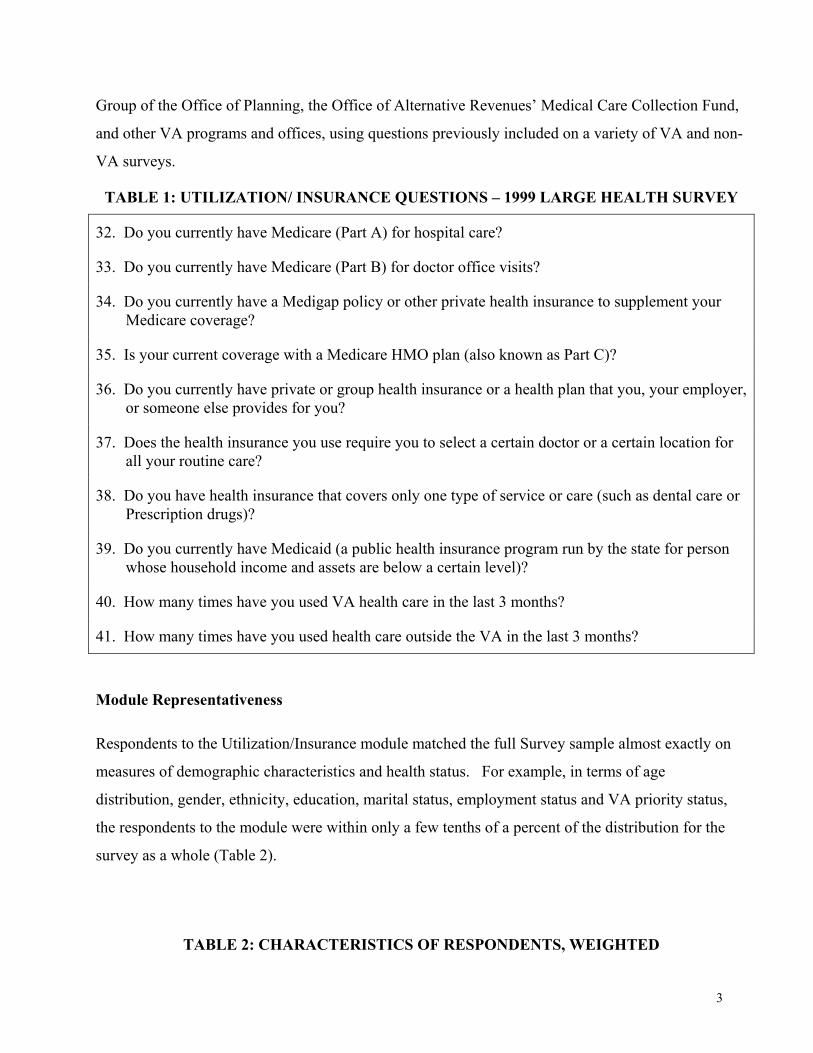
Module Questions
The Utilization/Insurance module (n = 152,258) asked 10 questions about enrollees’ insurance
coverage and inpatient and outpatient utilization (Table 1). HAP researchers developed these
questions with input from CHQOER’s economics section and experts from the Management Science
3
Group of the Office of Planning, the Office of Alternative Revenues’ Medical Care Collection Fund,
and other VA programs and offices, using questions previously included on a variety of VA and non-
VA surveys.
TABLE 1: UTILIZATION/ INSURANCE QUESTIONS – 1999 LARGE HEALTH SURVEY
32. Do you currently have Medicare (Part A) for hospital care?
33. Do you currently have Medicare (Part B) for doctor office visits?
34. Do you currently have a Medigap policy or other private health insurance to supplement your Medicare coverage?
35. Is your current coverage with a Medicare HMO plan (also known as Part C)?
36. Do you currently have private or group health insurance or a health plan that you, your employer, or someone else provides for you?
37. Does the health insurance you use require you to select a certain doctor or a certain location for all your routine care?
38. Do you have health insurance that covers only one type of service or care (such as dental care or Prescription drugs)?
39. Do you currently have Medicaid (a public health insurance program run by the state for person whose household income and assets are below a certain level)?
40. How many times have you used VA health care in the last 3 months?
41. How many times have you used health care outside the VA in the last 3 months?
Module Representativeness
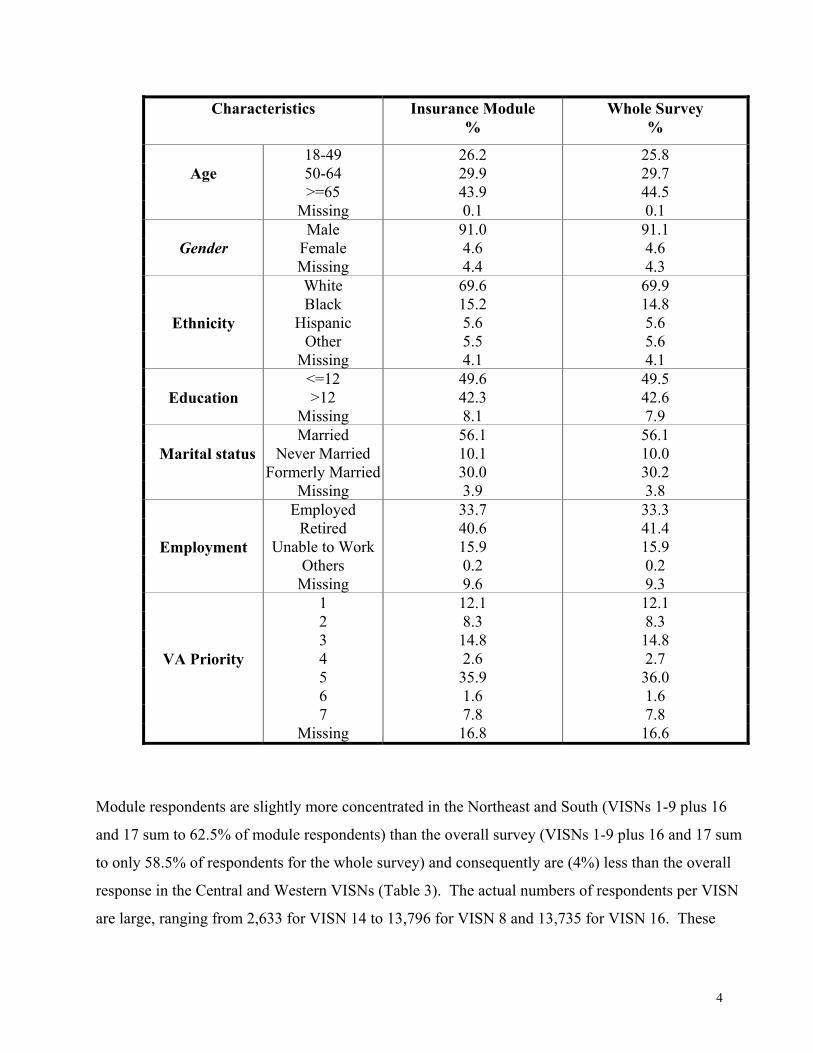
Respondents to the Utilization/Insurance module matched the full Survey sample almost exactly on
measures of demographic characteristics and health status. For example, in terms of age
distribution, gender, ethnicity, education, marital status, employment status and VA priority status,
the respondents to the module were within only a few tenths of a percent of the distribution for the
survey as a whole (Table 2).
TABLE 2: CHARACTERISTICS OF RESPONDENTS, WEIGHTED
4
Characteristics Insurance Module %
Whole Survey %
18-49 26.2 25.8 50-64 29.9 29.7 >=65 43.9 44.5
Age
Missing 0.1 0.1 Male 91.0 91.1
Female 4.6 4.6
Gender Missing 4.4 4.3 White 69.6 69.9 Black 15.2 14.8
Hispanic 5.6 5.6 Other 5.5 5.6
Ethnicity
Missing 4.1 4.1 <=12 49.6 49.5 >12 42.3 42.6
Education
Missing 8.1 7.9 Married 56.1 56.1
Never Married 10.1 10.0 Formerly Married 30.0 30.2
Marital status
Missing 3.9 3.8 Employed 33.7 33.3
Retired 40.6 41.4 Unable to Work 15.9 15.9
Others 0.2 0.2
Employment
Missing 9.6 9.3 1 12.1 12.1 2 8.3 8.3 3 14.8 14.8 4 2.6 2.7 5 35.9 36.0 6 1.6 1.6 7 7.8 7.8
VA Priority
Missing 16.8 16.6
Module respondents are slightly more concentrated in the Northeast and South (VISNs 1-9 plus 16
and 17 sum to 62.5% of module respondents) than the overall survey (VISNs 1-9 plus 16 and 17 sum
to only 58.5% of respondents for the whole survey) and consequently are (4%) less than the overall
response in the Central and Western VISNs (Table 3). The actual numbers of respondents per VISN
are large, ranging from 2,633 for VISN 14 to 13,796 for VISN 8 and 13,735 for VISN 16. These
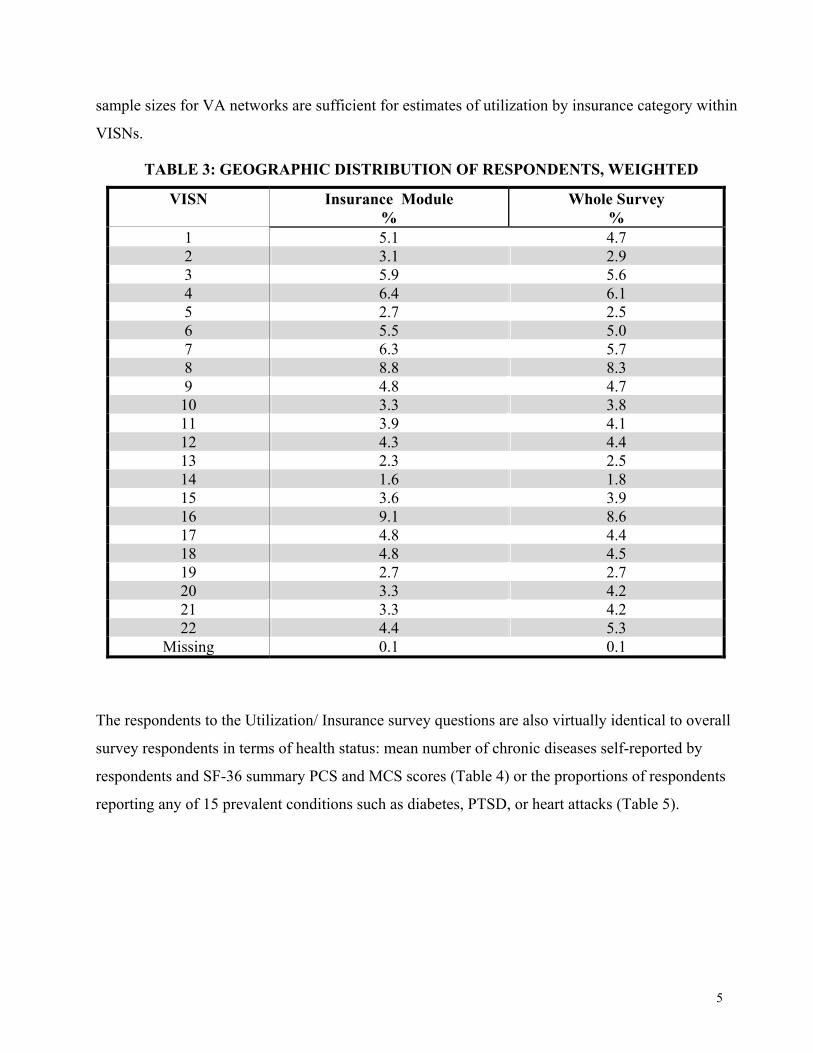
5
sample sizes for VA networks are sufficient for estimates of utilization by insurance category within
VISNs.
TABLE 3: GEOGRAPHIC DISTRIBUTION OF RESPONDENTS, WEIGHTED
VISN Insurance Module %
Whole Survey %
1 5.1 4.7 2 3.1 2.9 3 5.9 5.6 4 6.4 6.1 5 2.7 2.5 6 5.5 5.0 7 6.3 5.7 8 8.8 8.3 9 4.8 4.7 10 3.3 3.8 11 3.9 4.1 12 4.3 4.4 13 2.3 2.5 14 1.6 1.8 15 3.6 3.9 16 9.1 8.6 17 4.8 4.4 18 4.8 4.5 19 2.7 2.7 20 3.3 4.2 21 3.3 4.2 22 4.4 5.3
Missing 0.1 0.1
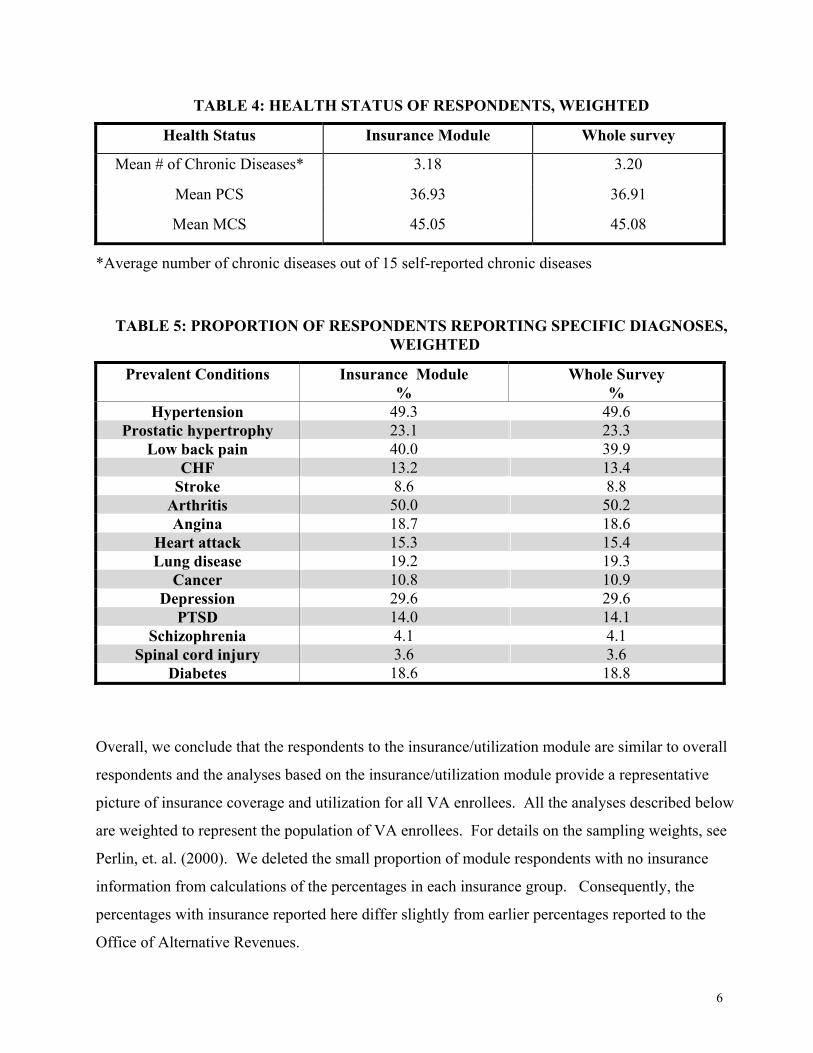
The respondents to the Utilization/ Insurance survey questions are also virtually identical to overall
survey respondents in terms of health status: mean number of chronic diseases self-reported by
respondents and SF-36 summary PCS and MCS scores (Table 4) or the proportions of respondents
reporting any of 15 prevalent conditions such as diabetes, PTSD, or heart attacks (Table 5).
6
TABLE 4: HEALTH STATUS OF RESPONDENTS, WEIGHTED
Health Status Insurance Module Whole survey
Mean # of Chronic Diseases* 3.18 3.20
Mean PCS 36.93 36.91
Mean MCS 45.05 45.08
*Average number of chronic diseases out of 15 self-reported chronic diseases
TABLE 5: PROPORTION OF RESPONDENTS REPORTING SPECIFIC DIAGNOSES, WEIGHTED
Prevalent Conditions Insurance Module %
Whole Survey %
Hypertension 49.3 49.6 Prostatic hypertrophy 23.1 23.3
Low back pain 40.0 39.9 CHF 13.2 13.4
Stroke 8.6 8.8 Arthritis 50.0 50.2 Angina 18.7 18.6
Heart attack 15.3 15.4 Lung disease 19.2 19.3
Cancer 10.8 10.9 Depression 29.6 29.6
PTSD 14.0 14.1 Schizophrenia 4.1 4.1
Spinal cord injury 3.6 3.6 Diabetes 18.6 18.8
Overall, we conclude that the respondents to the insurance/utilization module are similar to overall
respondents and the analyses based on the insurance/utilization module provide a representative
picture of insurance coverage and utilization for all VA enrollees. All the analyses described below
are weighted to represent the population of VA enrollees. For details on the sampling weights, see
Perlin, et. al. (2000). We deleted the small proportion of module respondents with no insurance
information from calculations of the percentages in each insurance group. Consequently, the
percentages with insurance reported here differ slightly from earlier percentages reported to the
Office of Alternative Revenues.
7
We needed to know in greater detail than was available in the survey itself how these enrollees used
the VA, so we used the Patient Treatment File (PTF) datasets and the Outpatient (OPC) datasets
maintained at the VA’s Austin (Texas) Automation Center to determine the frequency and type of
utilization of the VA. We merged the survey and utilization data for FY 1999, using VA’s unique
patient identifiers. For inpatient care, we examined the distribution of discharges and inpatient days
by insurance coverage group. For outpatient care, we compared the total number of visits and
procedures, measured by CPT codes. For both inpatient and outpatient care, we also calculated the
value of the services in PTF and OPC using the MCCF’s reasonable charges. VA is authorized by
statute (PL 105-33) to bill insurers for the reasonable charges for care and services the VA provides.
These reported charges represent the estimated amounts that MCCF could bill for the services if the
veteran had billable insurance.
Validity of the Survey Insurance Information
The self-reported insurance coverage information from the Utilization/Insurance module has validity
in two respects: 1) the self-reports of Medicare coverage (with or without additional Medigap
insurance) are similar to rates from merged VA and Medicare data; and 2) comparisons of self-
reports with MCCR billing data for FY 1999 show a high degree of correlation between patients who
report insurance and those whose insurers were billed by VA.
Medicare Coverage. When we compared the Medicare insurance rates obtained from the Large
Survey with data obtained by CHQOER from HCFA for another study of veterans’ care in VISNs 1
and 2, we find the two sets of data show similar rates of Medicare eligibility. The Large Survey
shows that Medicare eligibility ranges from 22.7% for veterans aged 18-64 to 91.2% for veterans
aged 65 or older. For VISNs 1 and 2, the rates from the survey are slightly higher, 24.6% and 92.4%.
Medicare data for calendar 1996 obtained by CHQOER for VISNs 1 and 2 show corresponding rates
of Medicare eligibility of 25.3% and 95.5% (Hendricks et. al., 1999). The rates from the Large
Survey are quite consistent with the rates CHQOER calculated from 1996 data. In addition, the
pattern of self-reported Medicare enrollment across VISNs is consistent with the pattern reported by
Wright in showing higher rates of Medicare enrollees in VA’s northeastern networks and lower rates
in western VISNs (Wright, 2000). Given this agreement with independent data, we are confident that
8
the rates calculated from the Large Survey are representative for the VA patients in the sampling
frame.
Matching Insurance Classification With VA Billing. We also checked the insurance status
reported in the Large Survey against billing activity by VA in FY1999. Robert Hinson of the Office
of Alternative Revenues provided CHQOER with skeletal information from a data set with billing
information painstakingly compiled from the separate VA facilities. From this information, we were
able to tell whether a respondent’s insurance company had been billed during FY1999 for services
that the VA provided. We could further distinguish whether the services billed for had been provided
during FY1999 and whether a payment had been received on the bill.
Only those veterans who have either Medigap or other private insurance should have their insurers
billed for services. Even so, there are several reasons why the VA might not bill a respondent who
has private insurance or why a respondent might have been billed even though the Survey data show
that the respondent has neither Medigap nor other private insurance. First, VA may not have issued
FY 1999 bills by the time the billing datasets were abstracted because not all services delivered by
VA to insured veterans are billable or the billing may be delayed. If the treatment takes place near
the end of the fiscal year, if verification of the insurance information is difficult, or if complex
treatment requires discussion or negotiation with the insurer, VA may not submit the bill in FY1999
even though the treatment was provided in that year.
In addition, the veteran may not always inform the VA about private insurance policies or the VA
may bill workers’ compensation or other policies rather than health care insurance. The Survey was
administered mostly in the last quarter of FY1999. The respondent’s insurance status may have
changed between the time medical treatment was provided and the time the respondent filled out the
survey form. Finally, some stations have been more successful than others in identifying veterans
who have insurance or in billing insurers for services.
Considering these reasons for a less than perfect match between billing records and insurance status
from the Survey, we concluded that three comparisons would be most informative:
1. The aggregate percentage of VA users in FY1999 whose insurers the VA has billed should be
close to the analogous percentage among respondents to the utilization-insurance module.
9
2. Most module respondents whose insurers have been billed by the VA should report having
either Medigap or other private insurance.
3. Module respondents who are categorized as Priority 7 should be much more likely than other
respondents to have their insurers billed, since Priority 7 veterans do not have service-related
disabilities and have incomes above the VA ceilings for qualification in Priority Group 5.
We could also phrase these comparisons in terms of respondents for whom there has been a payment
on a bill. That restriction would reduce instances of false confirmations when a bill has been created
in error, but it also would increase the chances of erroneous failures to confirm when a payment
simply has not yet been made on a legitimate bill. We examined the comparisons in terms of both
billing and payment. Comparisons were limited to the 147,124 respondents who were identified as
users of the system with VA utilization in either PTF or OPC files for FY1999.
Using the FY1999 file of the Allocation Resource Center (ARC), there were 3,476,931 distinct users
of the VA healthcare system. The data provided to us by Robert Hinson included bills for 469,512
people, or 13.5% of all users as measured by the ARC’s data. Using the PTF and OPC data files, we
get a slightly higher count of distinct users of the system in FY1999: 3,531,803. VA billed the
insurers for 13.3% of this population of enrolled patients in FY1999. We calculate that 13.2% of
respondents, weighted to represent the enrollee population, would have had a bill. The proportions
are close enough for us to be reasonably confident that the utilization/insurance module is
representative of the larger population of VA patients in FY1999 in terms of identifying those whose
insurers were billed.
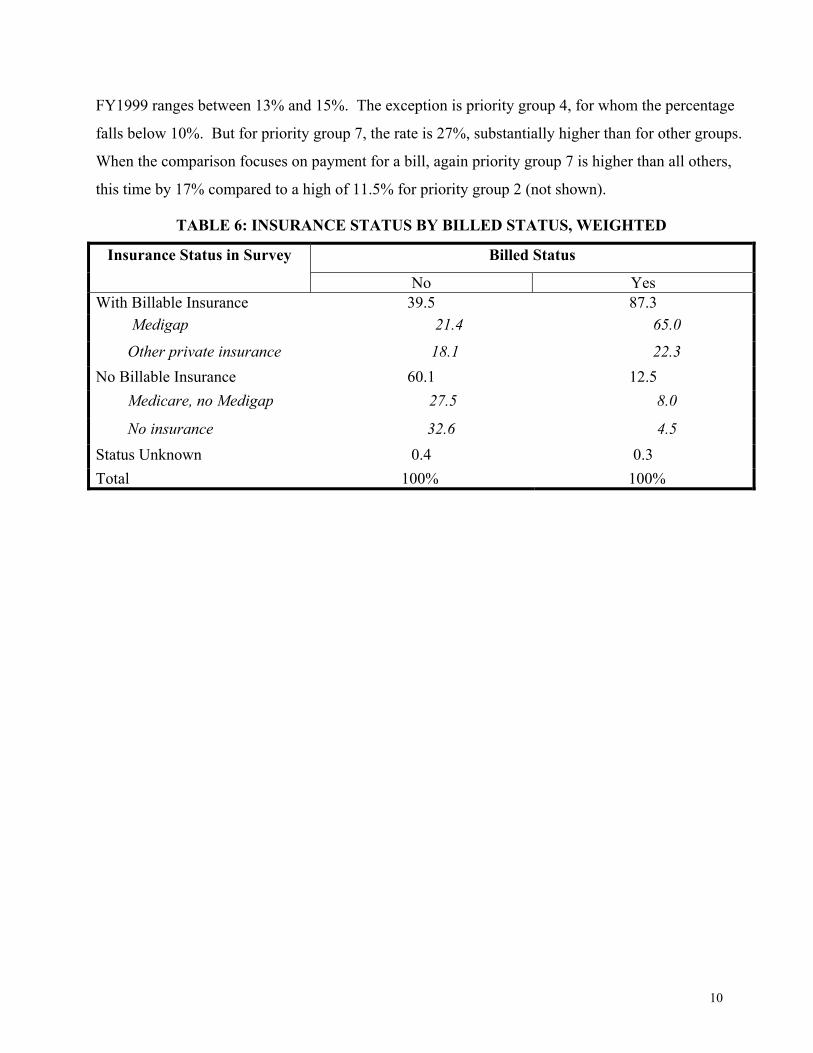
Table 6 shows that the second comparison is reasonably well satisfied by the Survey data. Of all
respondents who were VA patients in FY1999 and whose insurers were billed by the VA in FY1999,
65.0% had Medigap and 22.3% had other private insurance, for a total of 87.3%. In our judgment,
considering all of the ways in which we could fail to find a match even though a legitimate match is
present, this rate of match is very high. The match rate is somewhat higher, 90.5%, for those with a
bill payment in FY1999 (not shown).
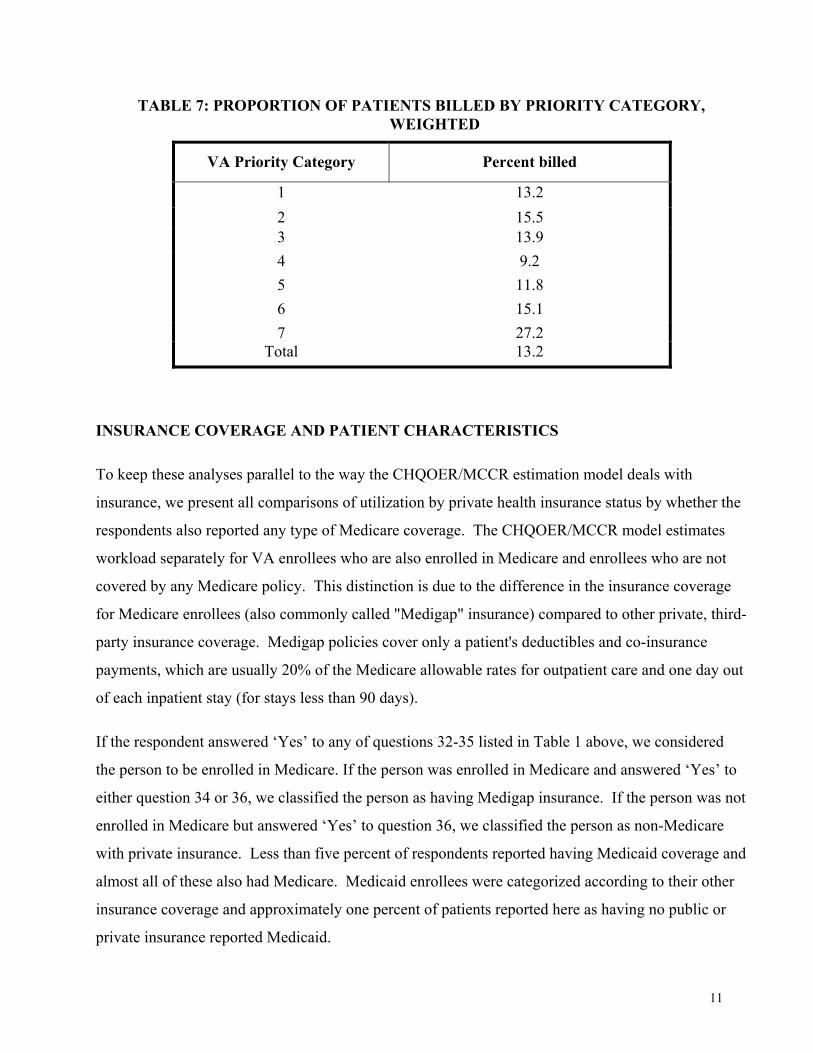
Table 7 shows that the third comparison is also reasonably well satisfied by the Survey data. For
priority groups 1-6 who used the VA in FY1999, the percentage whose insurers were billed in
10
FY1999 ranges between 13% and 15%. The exception is priority group 4, for whom the percentage
falls below 10%. But for priority group 7, the rate is 27%, substantially higher than for other groups.
When the comparison focuses on payment for a bill, again priority group 7 is higher than all others,
this time by 17% compared to a high of 11.5% for priority group 2 (not shown).
TABLE 6: INSURANCE STATUS BY BILLED STATUS, WEIGHTED
Billed Status Insurance Status in Survey
No Yes With Billable Insurance 39.5 87.3 Medigap 21.4 65.0
Other private insurance 18.1 22.3 No Billable Insurance 60.1 12.5 Medicare, no Medigap 27.5 8.0
No insurance 32.6 4.5 Status Unknown 0.4 0.3 Total 100% 100%
11
TABLE 7: PROPORTION OF PATIENTS BILLED BY PRIORITY CATEGORY, WEIGHTED
VA Priority Category Percent billed
1 13.2 2 15.5 3 13.9 4 9.2 5 11.8 6 15.1 7 27.2
Total 13.2
INSURANCE COVERAGE AND PATIENT CHARACTERISTICS
To keep these analyses parallel to the way the CHQOER/MCCR estimation model deals with
insurance, we present all comparisons of utilization by private health insurance status by whether the
respondents also reported any type of Medicare coverage. The CHQOER/MCCR model estimates
workload separately for VA enrollees who are also enrolled in Medicare and enrollees who are not
covered by any Medicare policy. This distinction is due to the difference in the insurance coverage
for Medicare enrollees (also commonly called "Medigap" insurance) compared to other private, third-
party insurance coverage. Medigap policies cover only a patient's deductibles and co-insurance
payments, which are usually 20% of the Medicare allowable rates for outpatient care and one day out
of each inpatient stay (for stays less than 90 days).
If the respondent answered ‘Yes’ to any of questions 32-35 listed in Table 1 above, we considered
the person to be enrolled in Medicare. If the person was enrolled in Medicare and answered ‘Yes’ to
either question 34 or 36, we classified the person as having Medigap insurance. If the person was not
enrolled in Medicare but answered ‘Yes’ to question 36, we classified the person as non-Medicare
with private insurance. Less than five percent of respondents reported having Medicaid coverage and
almost all of these also had Medicare. Medicaid enrollees were categorized according to their other
insurance coverage and approximately one percent of patients reported here as having no public or
private insurance reported Medicaid.
12
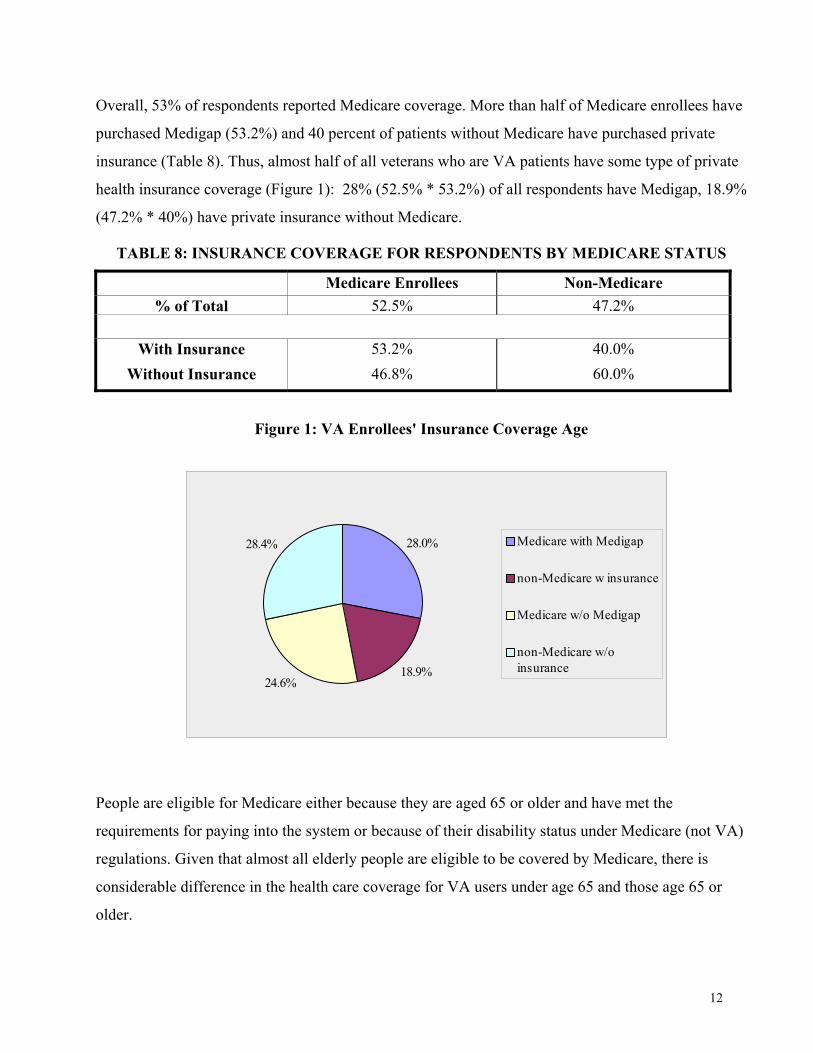
Overall, 53% of respondents reported Medicare coverage. More than half of Medicare enrollees have
purchased Medigap (53.2%) and 40 percent of patients without Medicare have purchased private
insurance (Table 8). Thus, almost half of all veterans who are VA patients have some type of private
health insurance coverage (Figure 1): 28% (52.5% * 53.2%) of all respondents have Medigap, 18.9%
(47.2% * 40%) have private insurance without Medicare.
TABLE 8: INSURANCE COVERAGE FOR RESPONDENTS BY MEDICARE STATUS
Medicare Enrollees Non-Medicare % of Total 52.5% 47.2%
With Insurance 53.2% 40.0%
Without Insurance 46.8% 60.0%
Figure 1: VA Enrollees' Insurance Coverage Age
People are eligible for Medicare either because they are aged 65 or older and have met the
requirements for paying into the system or because of their disability status under Medicare (not VA)
regulations. Given that almost all elderly people are eligible to be covered by Medicare, there is
considerable difference in the health care coverage for VA users under age 65 and those age 65 or
older.
28.0%
18.9%24.6%
28.4% Medicare with Medigap
non-Medicare w insurance
Medicare w/o Medigap
non-Medicare w/oinsurance
13
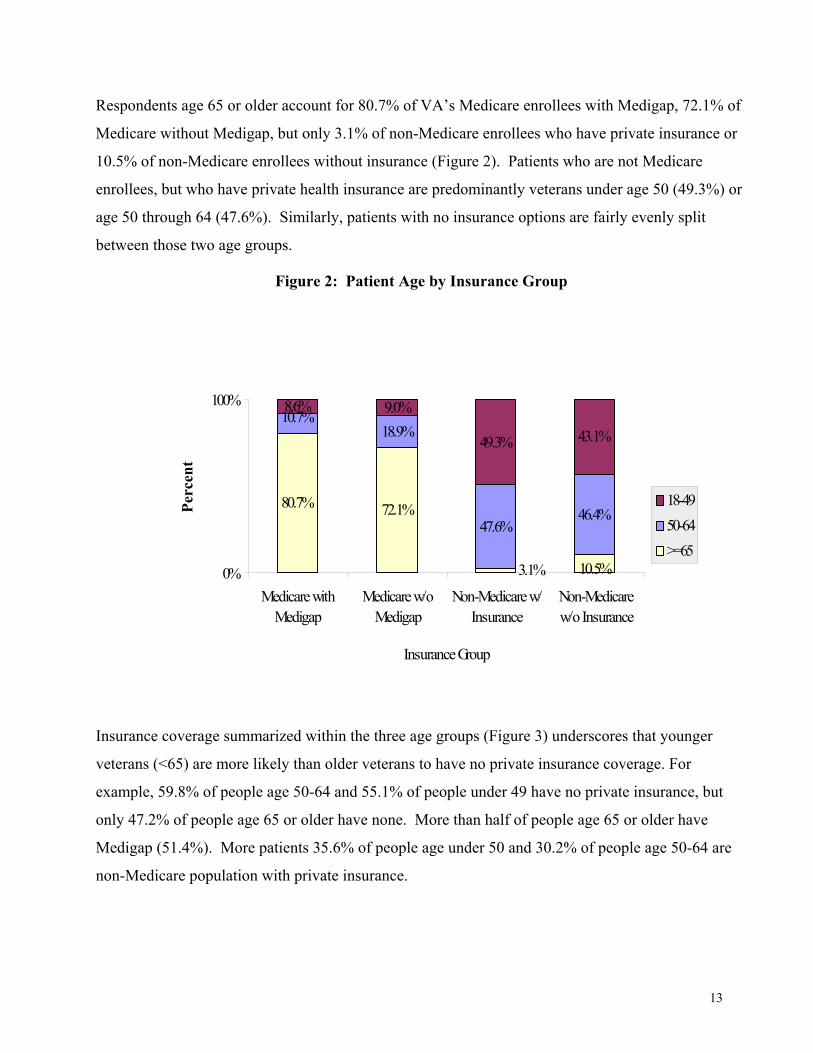
Respondents age 65 or older account for 80.7% of VA’s Medicare enrollees with Medigap, 72.1% of
Medicare without Medigap, but only 3.1% of non-Medicare enrollees who have private insurance or
10.5% of non-Medicare enrollees without insurance (Figure 2). Patients who are not Medicare
enrollees, but who have private health insurance are predominantly veterans under age 50 (49.3%) or
age 50 through 64 (47.6%). Similarly, patients with no insurance options are fairly evenly split
between those two age groups.
Figure 2: Patient Age by Insurance Group
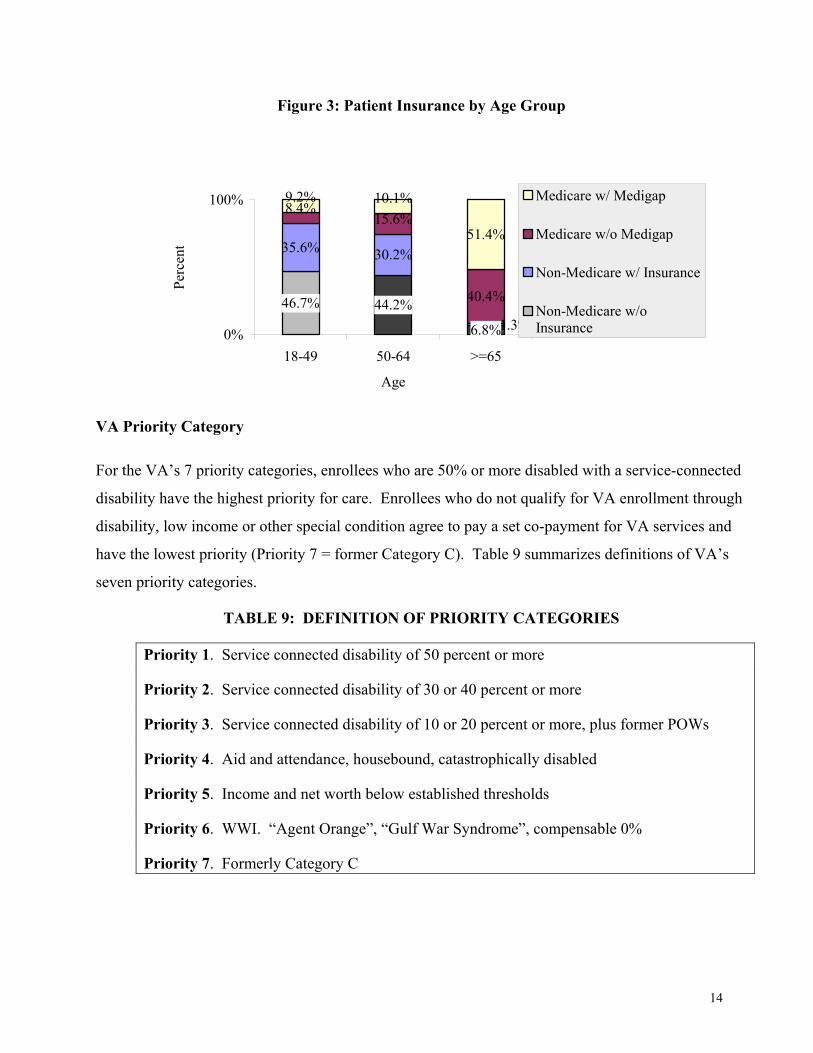
Insurance coverage summarized within the three age groups (Figure 3) underscores that younger
veterans (<65) are more likely than older veterans to have no private insurance coverage. For
example, 59.8% of people age 50-64 and 55.1% of people under 49 have no private insurance, but
only 47.2% of people age 65 or older have none. More than half of people age 65 or older have
Medigap (51.4%). More patients 35.6% of people age under 50 and 30.2% of people age 50-64 are
non-Medicare population with private insurance.
80.7% 72.1%
10.7%18.9%
47.6%46.4%
49.3% 43.1%
10.5%3.1%
8.6% 9.0%
0%
100%
Medicare withMedigap
Medicare w/oMedigap
Non-Medicare w/Insurance
Non-Medicarew/o Insurance
Insurance Group
Perc
ent
18-4950-64>=65
14
Figure 3: Patient Insurance by Age Group
VA Priority Category
For the VA’s 7 priority categories, enrollees who are 50% or more disabled with a service-connected
disability have the highest priority for care. Enrollees who do not qualify for VA enrollment through
disability, low income or other special condition agree to pay a set co-payment for VA services and
have the lowest priority (Priority 7 = former Category C). Table 9 summarizes definitions of VA’s
seven priority categories.
TABLE 9: DEFINITION OF PRIORITY CATEGORIES
Priority 1. Service connected disability of 50 percent or more
Priority 2. Service connected disability of 30 or 40 percent or more
Priority 3. Service connected disability of 10 or 20 percent or more, plus former POWs
Priority 4. Aid and attendance, housebound, catastrophically disabled
Priority 5. Income and net worth below established thresholds
Priority 6. WWI. “Agent Orange”, “Gulf War Syndrome”, compensable 0%
Priority 7. Formerly Category C
44.2%
35.6% 30.2%
8.4%15.6%
40.4%
9.2% 10.1%
51.4%
6.8%
46.7%1.3%
0%
100%
18-49 50-64 >=65
Age
Perc
ent
Medicare w/ Medigap
Medicare w/o Medigap
Non-Medicare w/ Insurance
Non-Medicare w/oInsurance
15
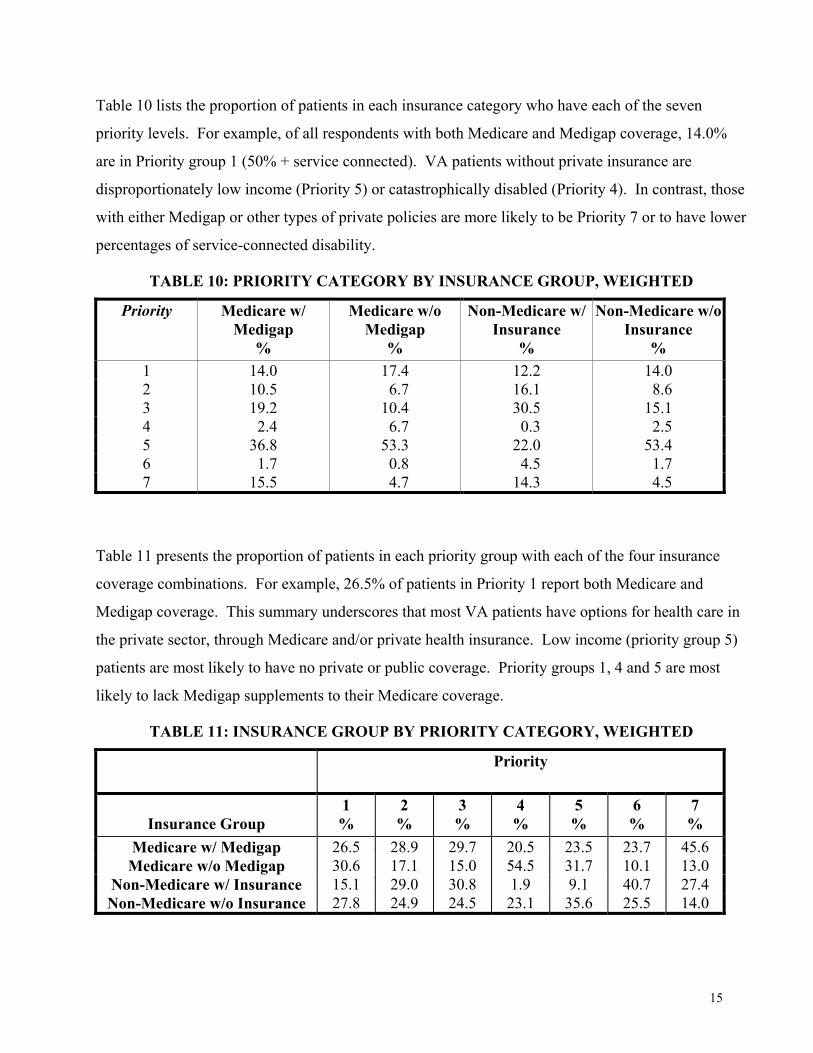
Table 10 lists the proportion of patients in each insurance category who have each of the seven
priority levels. For example, of all respondents with both Medicare and Medigap coverage, 14.0%
are in Priority group 1 (50% + service connected). VA patients without private insurance are
disproportionately low income (Priority 5) or catastrophically disabled (Priority 4). In contrast, those
with either Medigap or other types of private policies are more likely to be Priority 7 or to have lower
percentages of service-connected disability.
TABLE 10: PRIORITY CATEGORY BY INSURANCE GROUP, WEIGHTED
Priority Medicare w/ Medigap
%
Medicare w/o Medigap
%
Non-Medicare w/ Insurance
%
Non-Medicare w/o Insurance
% 1 14.0 17.4 12.2 14.0 2 10.5 6.7 16.1 8.6 3 19.2 10.4 30.5 15.1 4 2.4 6.7 0.3 2.5 5 36.8 53.3 22.0 53.4 6 1.7 0.8 4.5 1.7 7 15.5 4.7 14.3 4.5
Table 11 presents the proportion of patients in each priority group with each of the four insurance
coverage combinations. For example, 26.5% of patients in Priority 1 report both Medicare and
Medigap coverage. This summary underscores that most VA patients have options for health care in
the private sector, through Medicare and/or private health insurance. Low income (priority group 5)
patients are most likely to have no private or public coverage. Priority groups 1, 4 and 5 are most
likely to lack Medigap supplements to their Medicare coverage.
TABLE 11: INSURANCE GROUP BY PRIORITY CATEGORY, WEIGHTED
Priority
Insurance Group
1 %
2 %
3 %
4 %
5 %
6 %
7 %
Medicare w/ Medigap 26.5 28.9 29.7 20.5 23.5 23.7 45.6 Medicare w/o Medigap 30.6 17.1 15.0 54.5 31.7 10.1 13.0
Non-Medicare w/ Insurance 15.1 29.0 30.8 1.9 9.1 40.7 27.4 Non-Medicare w/o Insurance 27.8 24.9 24.5 23.1 35.6 25.5 14.0
16
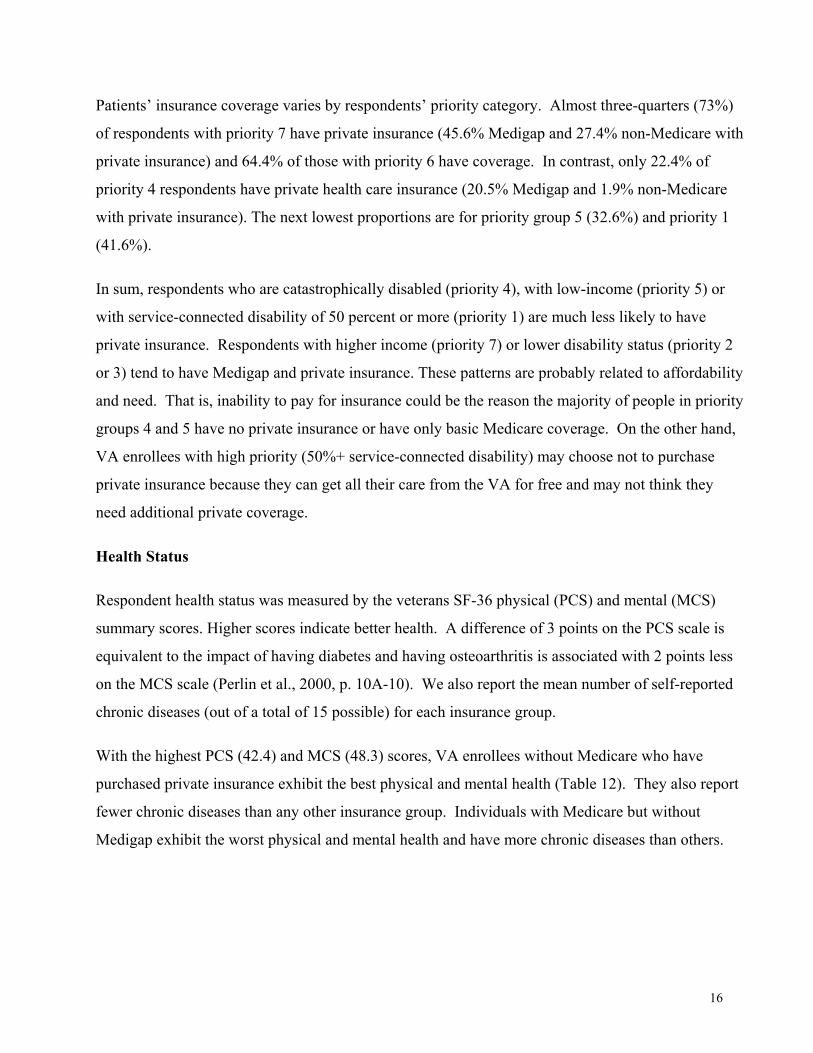
Patients’ insurance coverage varies by respondents’ priority category. Almost three-quarters (73%)
of respondents with priority 7 have private insurance (45.6% Medigap and 27.4% non-Medicare with
private insurance) and 64.4% of those with priority 6 have coverage. In contrast, only 22.4% of
priority 4 respondents have private health care insurance (20.5% Medigap and 1.9% non-Medicare
with private insurance). The next lowest proportions are for priority group 5 (32.6%) and priority 1
(41.6%).
In sum, respondents who are catastrophically disabled (priority 4), with low-income (priority 5) or
with service-connected disability of 50 percent or more (priority 1) are much less likely to have
private insurance. Respondents with higher income (priority 7) or lower disability status (priority 2
or 3) tend to have Medigap and private insurance. These patterns are probably related to affordability
and need. That is, inability to pay for insurance could be the reason the majority of people in priority
groups 4 and 5 have no private insurance or have only basic Medicare coverage. On the other hand,
VA enrollees with high priority (50%+ service-connected disability) may choose not to purchase
private insurance because they can get all their care from the VA for free and may not think they
need additional private coverage.
Health Status
Respondent health status was measured by the veterans SF-36 physical (PCS) and mental (MCS)
summary scores. Higher scores indicate better health. A difference of 3 points on the PCS scale is
equivalent to the impact of having diabetes and having osteoarthritis is associated with 2 points less
on the MCS scale (Perlin et al., 2000, p. 10A-10). We also report the mean number of self-reported
chronic diseases (out of a total of 15 possible) for each insurance group.
With the highest PCS (42.4) and MCS (48.3) scores, VA enrollees without Medicare who have
purchased private insurance exhibit the best physical and mental health (Table 12). They also report
fewer chronic diseases than any other insurance group. Individuals with Medicare but without
Medigap exhibit the worst physical and mental health and have more chronic diseases than others.
17
TABLE 12: HEALTH STATUS BY INSURANCE GROUP, WEIGHTED
Health Status Medicare w/ Medigap
Medicare w/o Medigap
Non-Medicare w/ Insurance
Non-Medicare w/o Insurance
Mean of Chronic Diseases* 3.6 4.0 2.1 2.8
PCS mean 35.9 32.3 42.4 38.1
MCS mean 47.5 42.5 48.3 42.7
*Average number of chronic diseases out of 15 self-reported chronic diseases
Table 13 presents the proportion of respondents reporting specific chronic diseases by insurance
group. These reports do not imply current diagnoses, but rather whether a doctor has ever told the
respondent that they have a particular condition. Thus, the percentages represent lifetime
occurrences of the conditions.
Older respondents tend to have Medicare coverage and are more likely to report diagnoses of heart
conditions, prostate conditions, cancer, and diabetes. The proportions reporting mental illness
TABLE 13: PROPORTION OF RESPONDENTS REPORTING SPECIFIC DIAGNOSES BY INSURANCE GROUP, WEIGHTED
Prevalent Conditions
Medicare w/ Medigap
%
Medicare w/o Medigap
%
Non-Medicare w/ Insurance
%
Non-Medicare w/o Insurance
% Hypertension 55.0 59.3 37.3 43.3
Prostatic hypertrophy 36.3 30.1 11.1 12.1 Low back pain 39.2 42.5 37.5 40.5
CHF 16.7 20.9 4.0 9.2 Stroke 11.0 13.8 2.4 5.9
Arthritis 56.9 58.4 39.5 43.0 Angina 26.8 25.7 8.5 11.5
Heart attack 21.1 21.8 6.6 9.9 Lung disease 19.9 25.0 12.7 18.0
Cancer 16.5 14.5 4.8 5.9 Depression 23.3 34.9 23.4 35.2
PTSD 9.5 16.2 11.4 18.1 Schizophrenia 2.2 6.4 1.8 5.7
Spinal cord injury 3.3 5.4 1.6 3.6 Diabetes 22.0 24.4 11.4 15.1
18
(depression, PTSD, schizophrenia) are very similar for Medicare enrollees and younger patients, with
patients in either age-related category who have no private insurance (neither Medigap nor other
coverage) more likely to report the mental condition. Indeed, both groups without private health care
coverage are more likely to report most of the 15 conditions, compared to either veterans with
Medicare plus Medigap or with non-Medicare private insurance coverage.
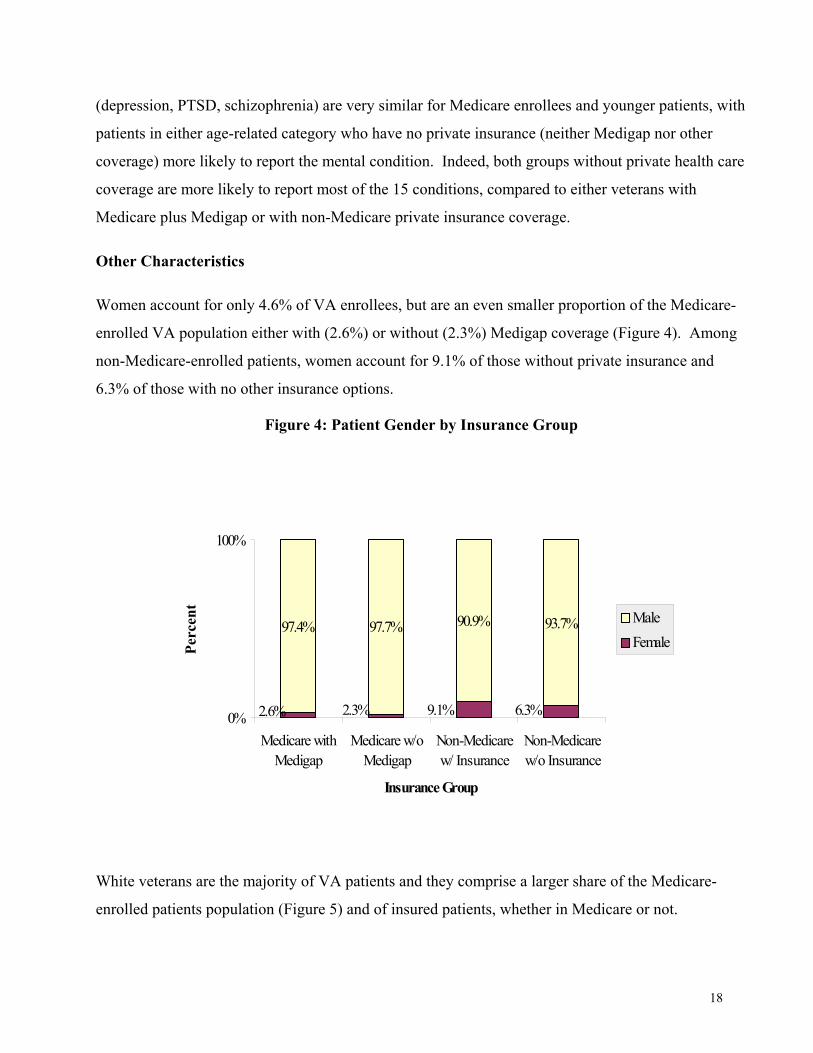
Other Characteristics
Women account for only 4.6% of VA enrollees, but are an even smaller proportion of the Medicare-
enrolled VA population either with (2.6%) or without (2.3%) Medigap coverage (Figure 4). Among
non-Medicare-enrolled patients, women account for 9.1% of those without private insurance and
6.3% of those with no other insurance options.
Figure 4: Patient Gender by Insurance Group
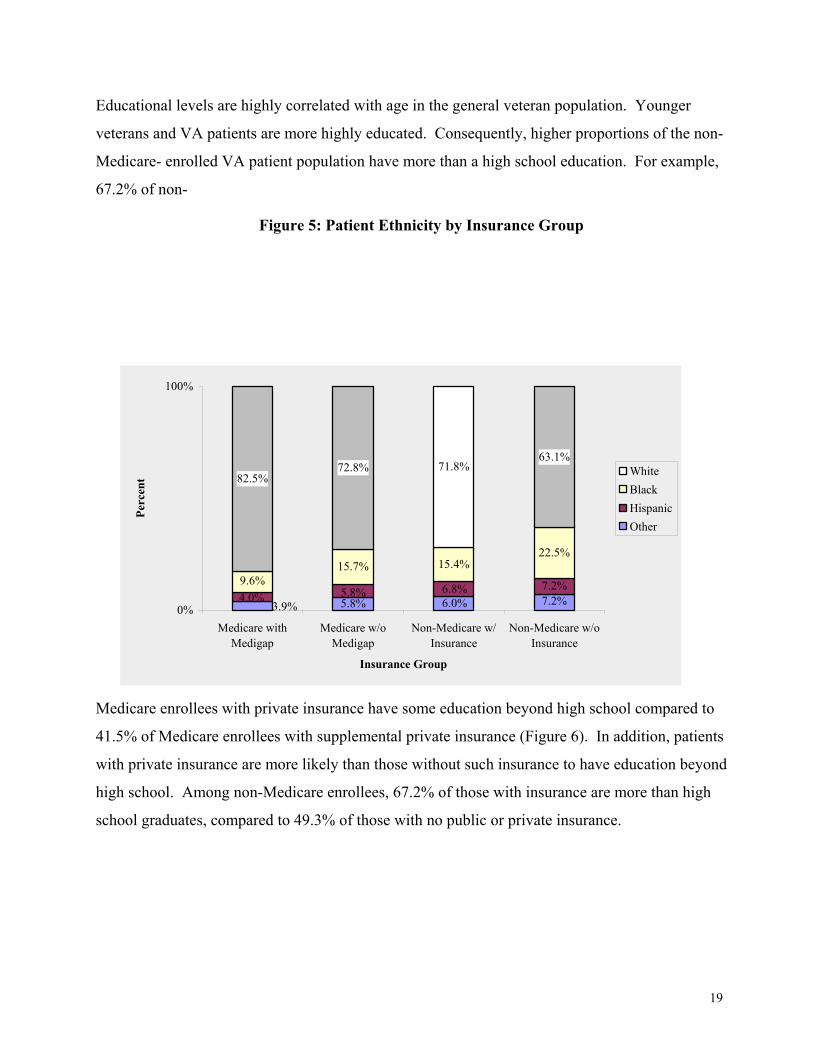
White veterans are the majority of VA patients and they comprise a larger share of the Medicare-
enrolled patients population (Figure 5) and of insured patients, whether in Medicare or not.
97.4% 97.7% 90.9% 93.7%
2.6% 6.3%2.3% 9.1%0%
100%
Medicare withMedigap
Medicare w/oMedigap
Non-Medicarew/ Insurance
Non-Medicarew/o Insurance
Insurance Group
Perc
ent
MaleFemale
19
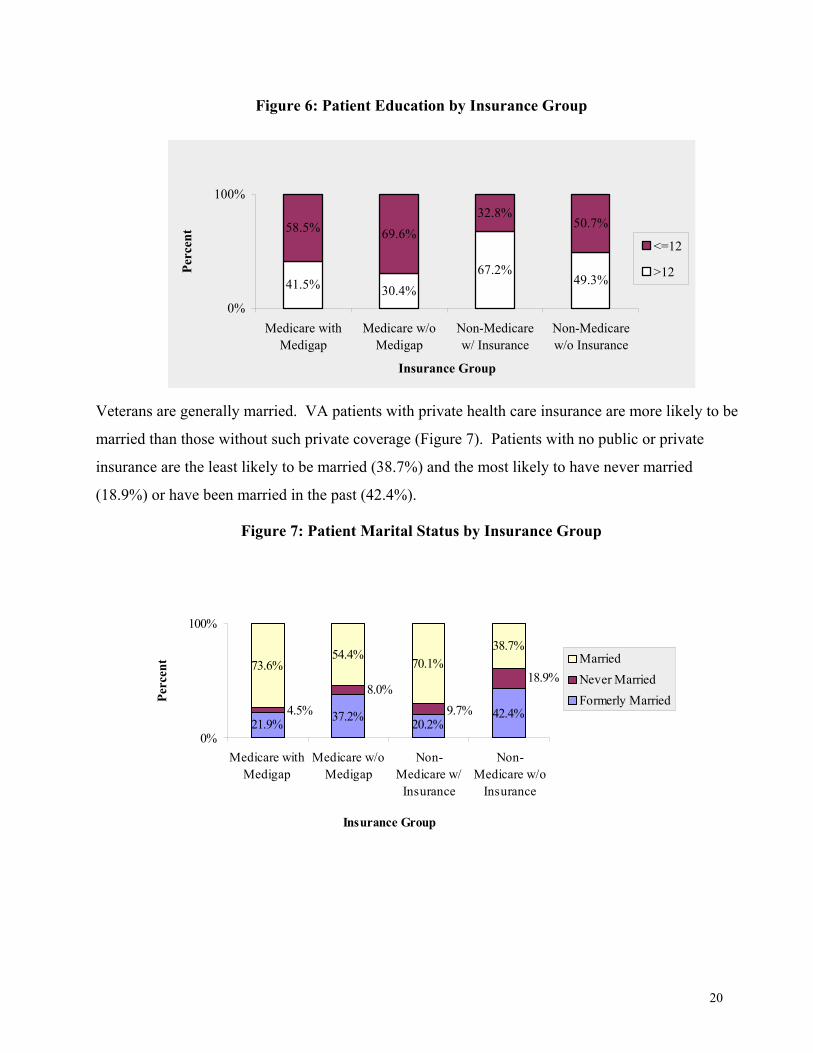
Educational levels are highly correlated with age in the general veteran population. Younger
veterans and VA patients are more highly educated. Consequently, higher proportions of the non-
Medicare- enrolled VA patient population have more than a high school education. For example,
67.2% of non-
Figure 5: Patient Ethnicity by Insurance Group
Medicare enrollees with private insurance have some education beyond high school compared to
41.5% of Medicare enrollees with supplemental private insurance (Figure 6). In addition, patients
with private insurance are more likely than those without such insurance to have education beyond
high school. Among non-Medicare enrollees, 67.2% of those with insurance are more than high
school graduates, compared to 49.3% of those with no public or private insurance.
15.7% 15.4%22.5%
82.5%72.8% 71.8%
63.1%
3.9% 5.8% 7.2%6.0%4.0% 5.8% 6.8% 7.2%9.6%
0%
100%
Medicare withMedigap
Medicare w/oMedigap
Non-Medicare w/Insurance
Non-Medicare w/oInsurance
Insurance Group
Perc
ent White
BlackHispanicOther
20
Figure 6: Patient Education by Insurance Group
Veterans are generally married. VA patients with private health care insurance are more likely to be
married than those without such private coverage (Figure 7). Patients with no public or private
insurance are the least likely to be married (38.7%) and the most likely to have never married
(18.9%) or have been married in the past (42.4%).
Figure 7: Patient Marital Status by Insurance Group
41.5% 30.4%67.2%
49.3%
58.5% 69.6%32.8%
50.7%
0%
100%
Medicare withMedigap
Medicare w/oMedigap
Non-Medicarew/ Insurance
Non-Medicarew/o Insurance
Insurance Group
Perc
ent
<=12
>12
21.9% 37.2% 20.2%42.4%
73.6%54.4%
70.1%38.7%
18.9%
9.7%4.5%8.0%
0%
100%
Medicare withMedigap
Medicare w/oMedigap
Non-Medicare w/
Insurance
Non-Medicare w/o
Insurance
Insurance Group
Perc
ent Married
Never MarriedFormerly Married
21
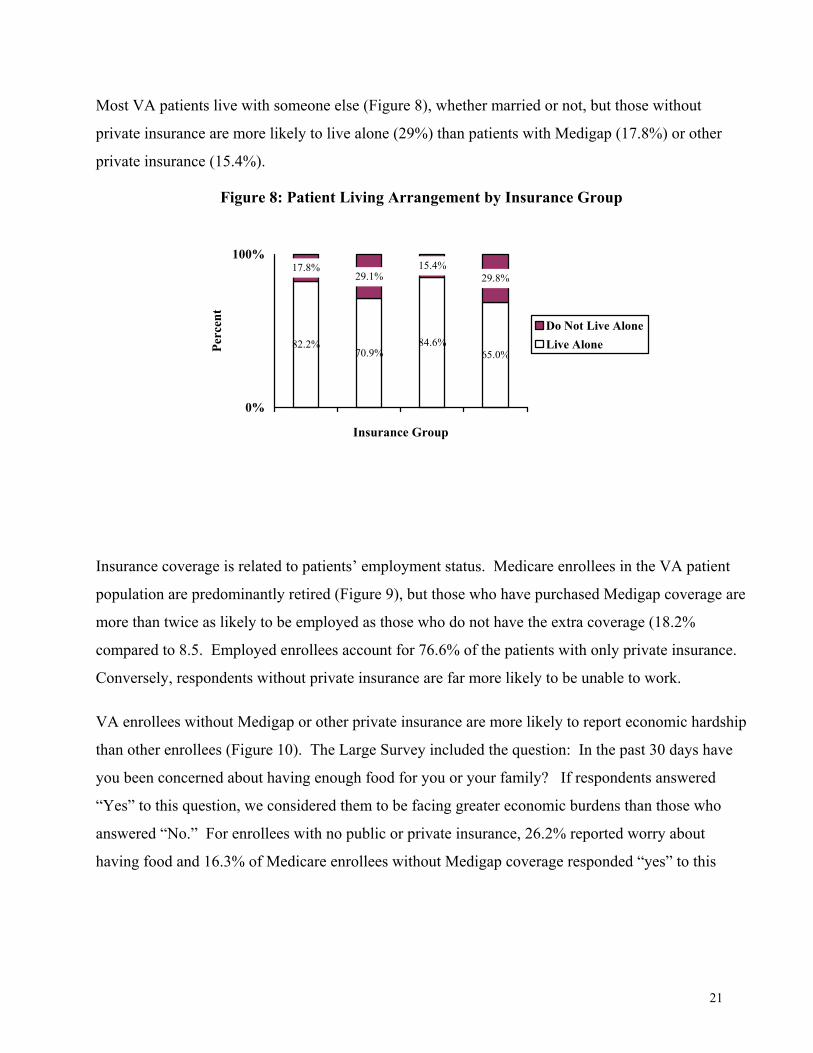
Most VA patients live with someone else (Figure 8), whether married or not, but those without
private insurance are more likely to live alone (29%) than patients with Medigap (17.8%) or other
private insurance (15.4%).
Figure 8: Patient Living Arrangement by Insurance Group
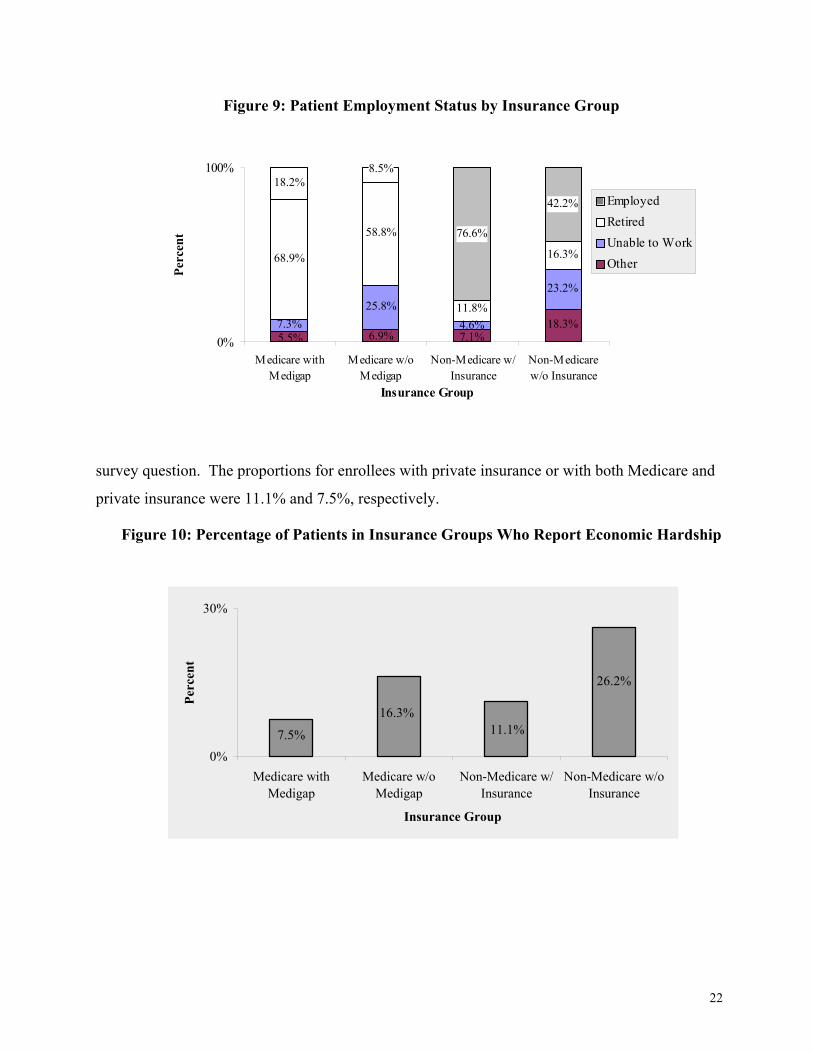
Insurance coverage is related to patients’ employment status. Medicare enrollees in the VA patient
population are predominantly retired (Figure 9), but those who have purchased Medigap coverage are
more than twice as likely to be employed as those who do not have the extra coverage (18.2%
compared to 8.5. Employed enrollees account for 76.6% of the patients with only private insurance.
Conversely, respondents without private insurance are far more likely to be unable to work.
VA enrollees without Medigap or other private insurance are more likely to report economic hardship
than other enrollees (Figure 10). The Large Survey included the question: In the past 30 days have
you been concerned about having enough food for you or your family? If respondents answered
“Yes” to this question, we considered them to be facing greater economic burdens than those who
answered “No.” For enrollees with no public or private insurance, 26.2% reported worry about
having food and 16.3% of Medicare enrollees without Medigap coverage responded “yes” to this
82.2%70.9%
84.6%65.0%
17.8%29.1%
15.4%29.8%
0%
100%
Insurance Group
Perc
ent
Do Not Live AloneLive Alone
22
Figure 9: Patient Employment Status by Insurance Group
survey question. The proportions for enrollees with private insurance or with both Medicare and
private insurance were 11.1% and 7.5%, respectively.
Figure 10: Percentage of Patients in Insurance Groups Who Report Economic Hardship
18.3%25.8%
23.2%
68.9%
58.8%
11.8%
16.3%
18.2%
76.6%
42.2%
5.5% 7.1%6.9%4.6%7.3%
8.5%
0%
100%
Medicare withMedigap
Medicare w/oMedigap
Non-Medicare w/Insurance
Non-Medicarew/o Insurance
Insurance Group
Perc
ent
EmployedRetiredUnable to WorkOther
7.5%
16.3%11.1%
26.2%
0%
30%
Medicare withMedigap
Medicare w/oMedigap
Non-Medicare w/Insurance
Non-Medicare w/oInsurance
Insurance Group
Perc
ent

23
DIFFERENCES IN INSURANCE COVERAGE BY VISN
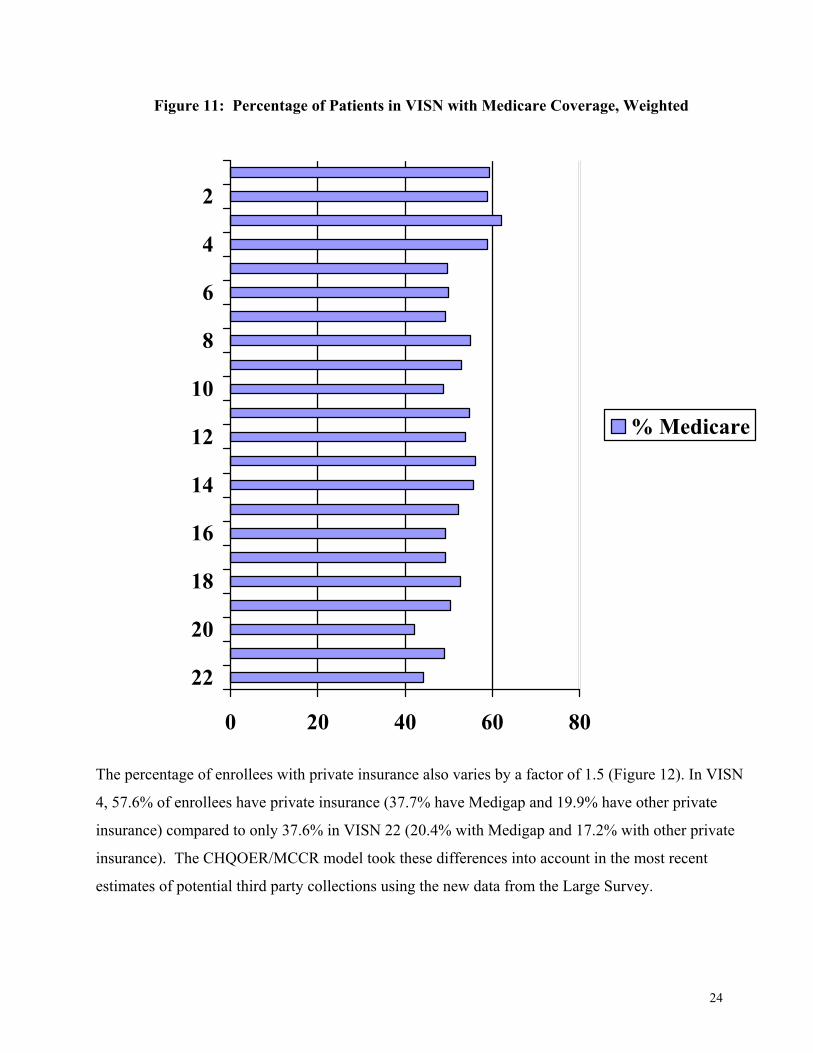
Insurance coverage varies across VISNs. For example, the percentage of enrollees with Medicare
varies by a factor of 1.5. While the national average of VA patients in Medicare is 52.6%, only
46.2% of enrollees in VISN 20 have Medicare coverage compared to 62.1% of patients in VISN 3
(Figure 11).
24
Figure 11: Percentage of Patients in VISN with Medicare Coverage, Weighted
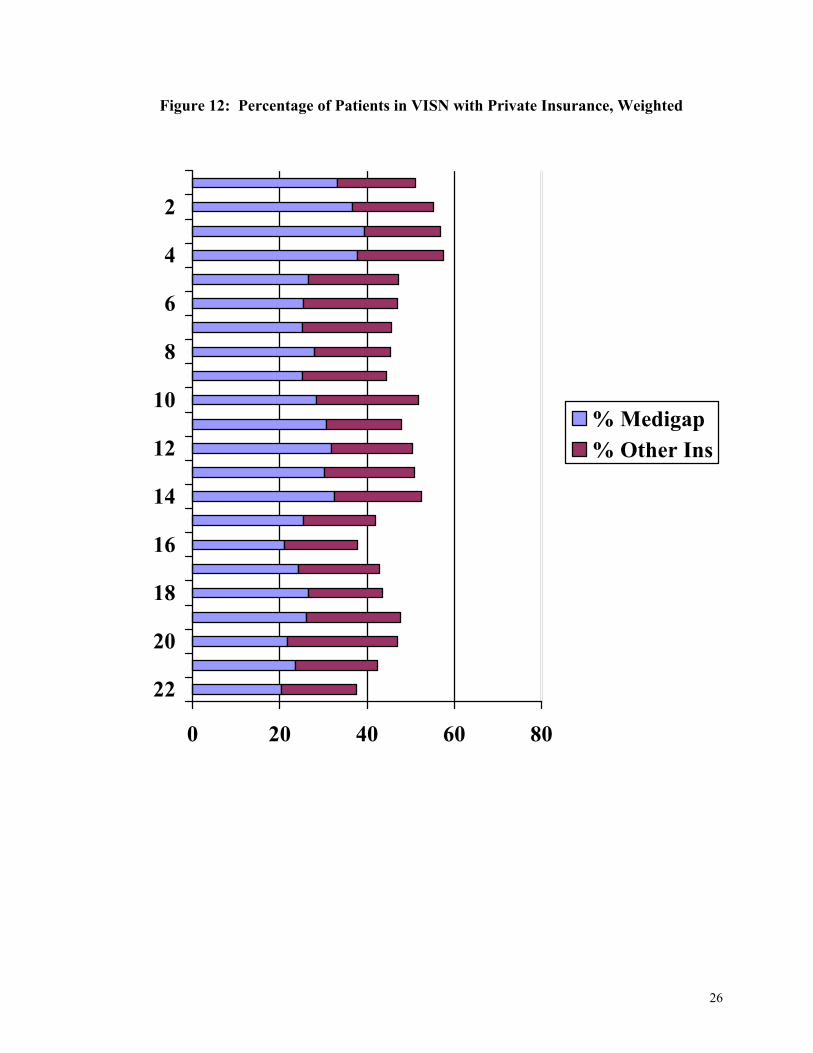
The percentage of enrollees with private insurance also varies by a factor of 1.5 (Figure 12). In VISN
4, 57.6% of enrollees have private insurance (37.7% have Medigap and 19.9% have other private
insurance) compared to only 37.6% in VISN 22 (20.4% with Medigap and 17.2% with other private
insurance). The CHQOER/MCCR model took these differences into account in the most recent
estimates of potential third party collections using the new data from the Large Survey.
0 20 40 60 80
22
20
18
16
14
12
10
8
6
4
2
% Medicare
25
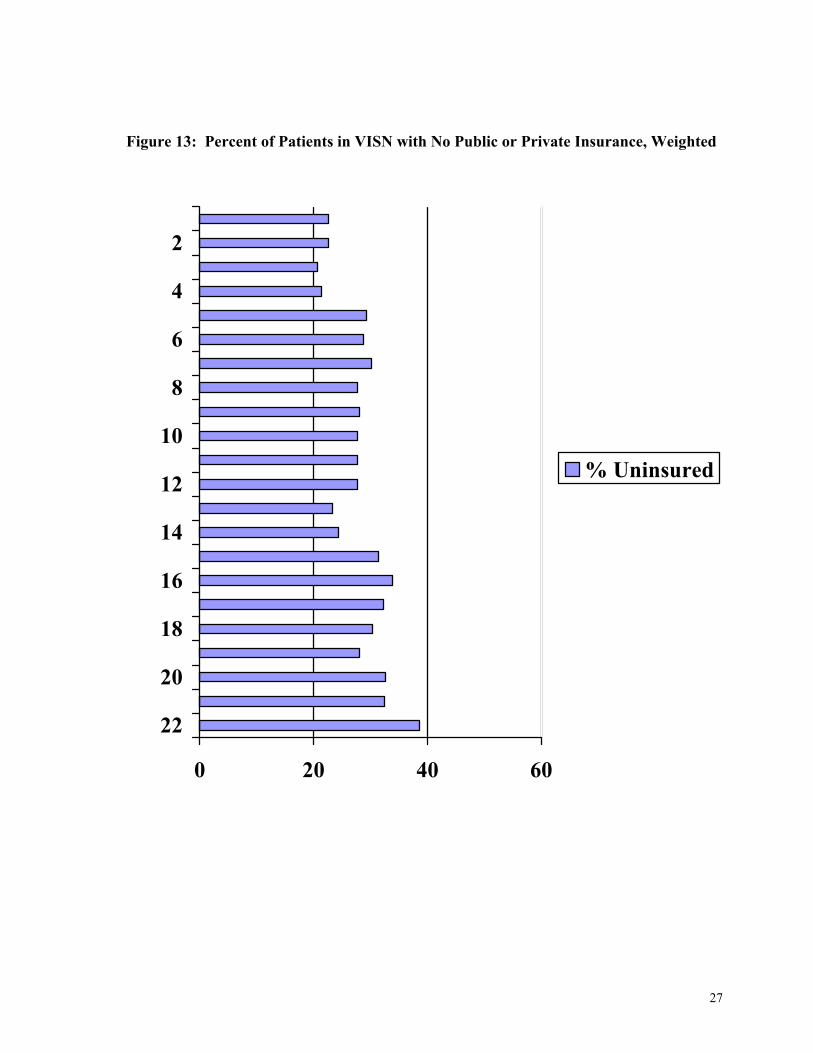
Another way to compare enrollees across the VISNs is by the percentage of enrollees who have
neither public nor private insurance and hence have no options for health care beyond VA. VISN 3
has the lowest percentage of enrollees with no public or private insurance (20.6%) and VISN 22 has
the highest (38.6%). Figure 13 also demonstrates that Medicare is the major alternative coverage for
VA enrollees because more veteran patients have Medicare coverage than have only private
insurance (and Medicaid is almost always in addition to Medicare). Therefore, VISNs with fewer
enrollees on Medicare have more enrollees without any alternative coverage. The correlation
between the percentage of VA-Medicare dual enrollees with the percentage of VA enrollees without
alternative coverage by VISNs is -.89. This relationship is explored in a report of the Office of
Quality and Planning (Shen, et al., 2000).
DIFFERENCES IN UTILIZATION BY INSURANCE STATUS
Using FY 1999 PTF and OPC files, we found that VA enrollees with Medigap or other private
insurance used proportionately less VA care than those without any private insurance. Although
insured enrollees were 47% of all veteran patients, they accounted for only 20% of all inpatient
discharges, 21% of the value of inpatient care (as measured by MCCF’s reasonable charges).
Similarly, insured enrollees account for about 30% of all outpatient visits, but less than 27% of
reasonable charges for outpatient care.
26
Figure 12: Percentage of Patients in VISN with Private Insurance, Weighted
0 20 40 60 80
22
20
18
16
14
12
10
8
6
4
2
% Medigap% Other Ins
27
Figure 13: Percent of Patients in VISN with No Public or Private Insurance, Weighted
0 20 40 60
22
20
18
16
14
12
10
8
6
4
2
% Uninsured
28
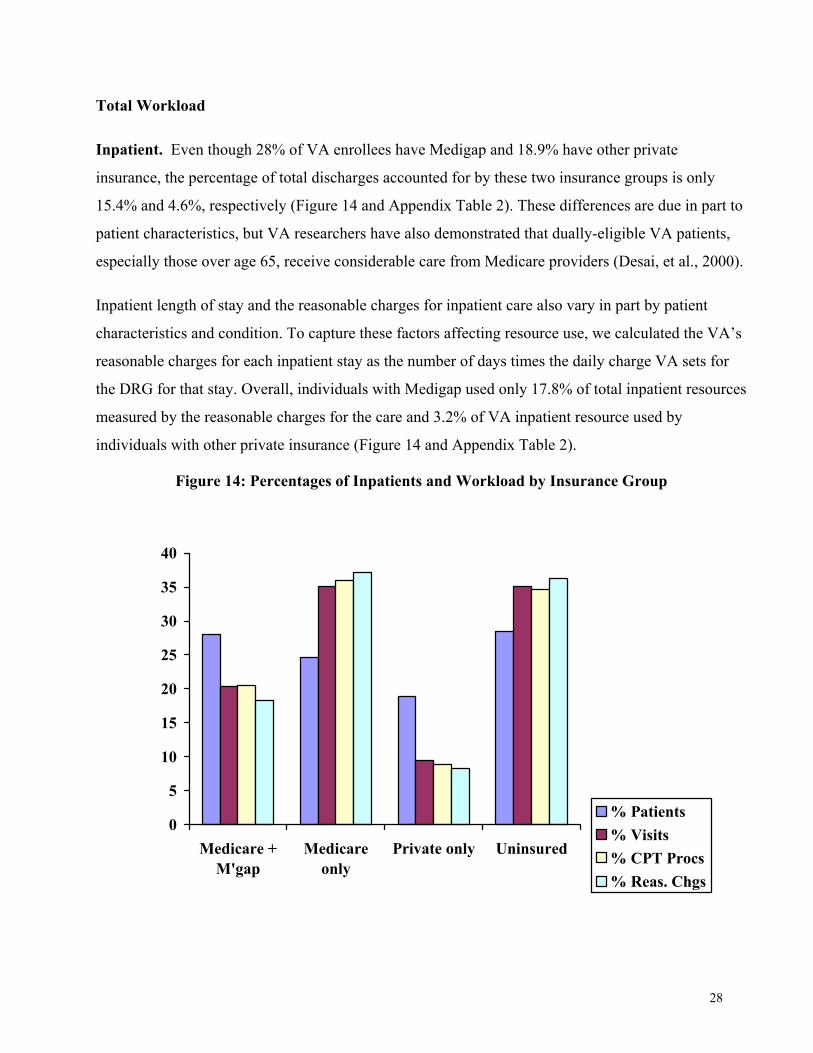
Total Workload
Inpatient. Even though 28% of VA enrollees have Medigap and 18.9% have other private
insurance, the percentage of total discharges accounted for by these two insurance groups is only
15.4% and 4.6%, respectively (Figure 14 and Appendix Table 2). These differences are due in part to
patient characteristics, but VA researchers have also demonstrated that dually-eligible VA patients,
especially those over age 65, receive considerable care from Medicare providers (Desai, et al., 2000).
Inpatient length of stay and the reasonable charges for inpatient care also vary in part by patient
characteristics and condition. To capture these factors affecting resource use, we calculated the VA’s
reasonable charges for each inpatient stay as the number of days times the daily charge VA sets for
the DRG for that stay. Overall, individuals with Medigap used only 17.8% of total inpatient resources
measured by the reasonable charges for the care and 3.2% of VA inpatient resource used by
individuals with other private insurance (Figure 14 and Appendix Table 2).
Figure 14: Percentages of Inpatients and Workload by Insurance Group
0
5
10
15
20
25
30
35
40
Medicare +M'gap
Medicareonly
Private only Uninsured
% Patients% Visits% CPT Procs% Reas. Chgs
29
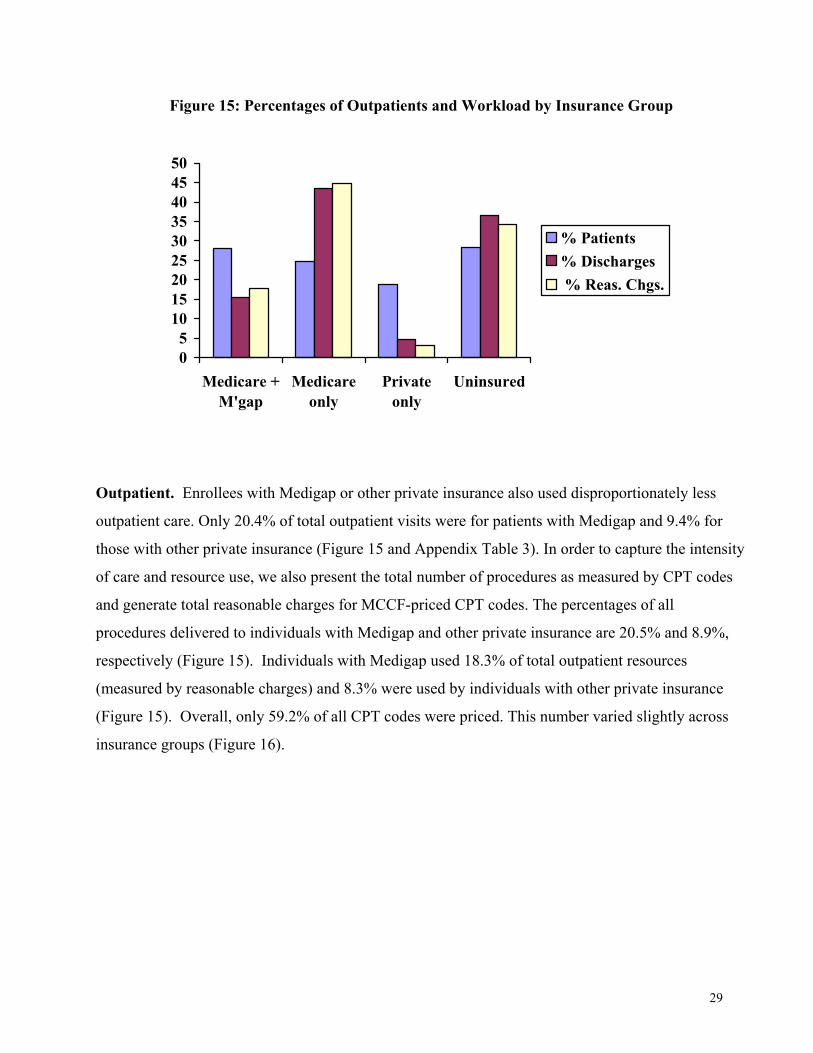
Figure 15: Percentages of Outpatients and Workload by Insurance Group
Outpatient. Enrollees with Medigap or other private insurance also used disproportionately less
outpatient care. Only 20.4% of total outpatient visits were for patients with Medigap and 9.4% for
those with other private insurance (Figure 15 and Appendix Table 3). In order to capture the intensity
of care and resource use, we also present the total number of procedures as measured by CPT codes
and generate total reasonable charges for MCCF-priced CPT codes. The percentages of all
procedures delivered to individuals with Medigap and other private insurance are 20.5% and 8.9%,
respectively (Figure 15). Individuals with Medigap used 18.3% of total outpatient resources
(measured by reasonable charges) and 8.3% were used by individuals with other private insurance
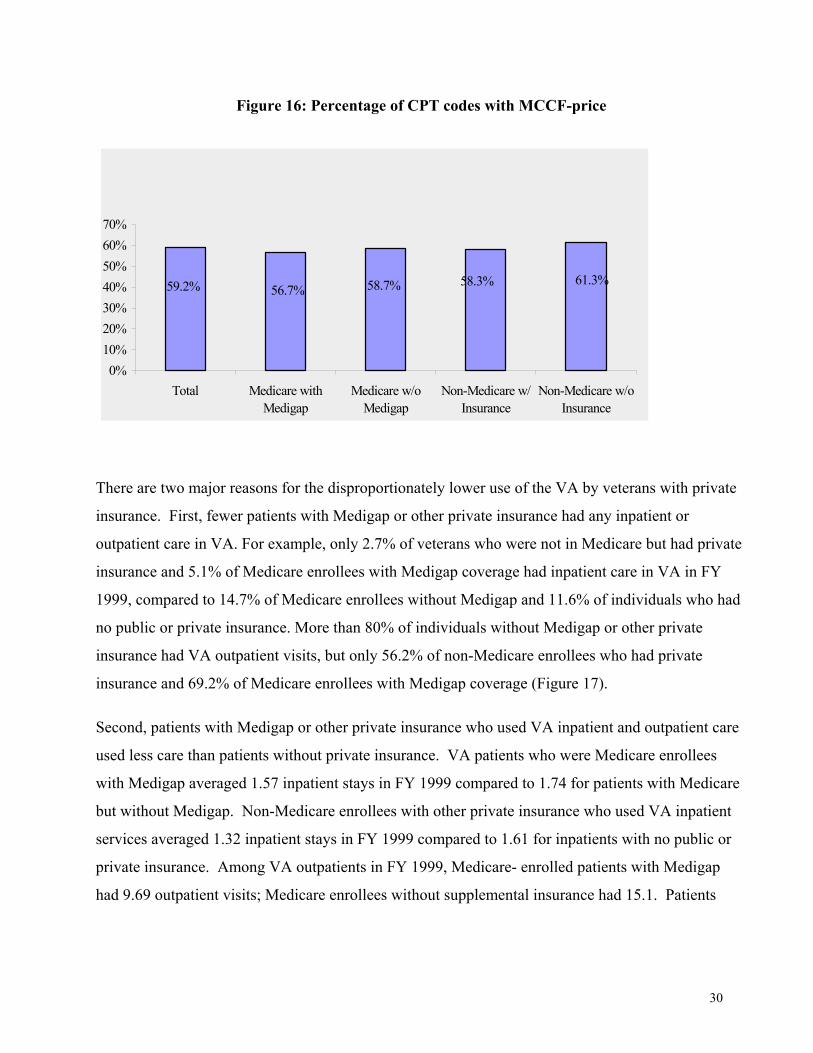
(Figure 15). Overall, only 59.2% of all CPT codes were priced. This number varied slightly across
insurance groups (Figure 16).
05
101520253035404550
Medicare +M'gap
Medicareonly
Privateonly
Uninsured
% Patients% Discharges % Reas. Chgs.
30
Figure 16: Percentage of CPT codes with MCCF-price
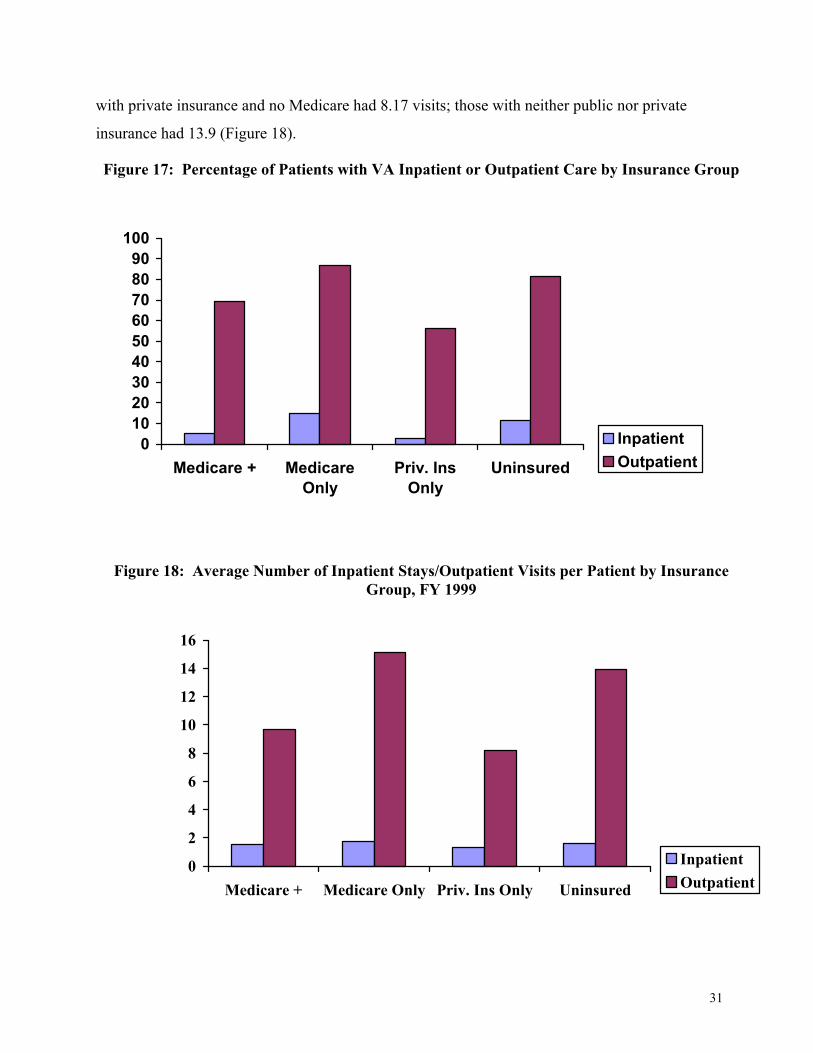
There are two major reasons for the disproportionately lower use of the VA by veterans with private
insurance. First, fewer patients with Medigap or other private insurance had any inpatient or
outpatient care in VA. For example, only 2.7% of veterans who were not in Medicare but had private
insurance and 5.1% of Medicare enrollees with Medigap coverage had inpatient care in VA in FY
1999, compared to 14.7% of Medicare enrollees without Medigap and 11.6% of individuals who had
no public or private insurance. More than 80% of individuals without Medigap or other private
insurance had VA outpatient visits, but only 56.2% of non-Medicare enrollees who had private
insurance and 69.2% of Medicare enrollees with Medigap coverage (Figure 17).
Second, patients with Medigap or other private insurance who used VA inpatient and outpatient care
used less care than patients without private insurance. VA patients who were Medicare enrollees
with Medigap averaged 1.57 inpatient stays in FY 1999 compared to 1.74 for patients with Medicare
but without Medigap. Non-Medicare enrollees with other private insurance who used VA inpatient
services averaged 1.32 inpatient stays in FY 1999 compared to 1.61 for inpatients with no public or
private insurance. Among VA outpatients in FY 1999, Medicare- enrolled patients with Medigap
had 9.69 outpatient visits; Medicare enrollees without supplemental insurance had 15.1. Patients
59.2% 56.7% 58.7% 58.3% 61.3%
0%10%20%30%40%50%60%70%
Total Medicare withMedigap
Medicare w/oMedigap
Non-Medicare w/Insurance
Non-Medicare w/oInsurance
31
with private insurance and no Medicare had 8.17 visits; those with neither public nor private
insurance had 13.9 (Figure 18).
Figure 17: Percentage of Patients with VA Inpatient or Outpatient Care by Insurance Group
Figure 18: Average Number of Inpatient Stays/Outpatient Visits per Patient by Insurance Group, FY 1999
0102030405060708090
100
Medicare + MedicareOnly
Priv. InsOnly
Uninsured
InpatientOutpatient
0
2
4
6
8
10
12
14
16
Medicare + Medicare Only Priv. Ins Only Uninsured
InpatientOutpatient
32
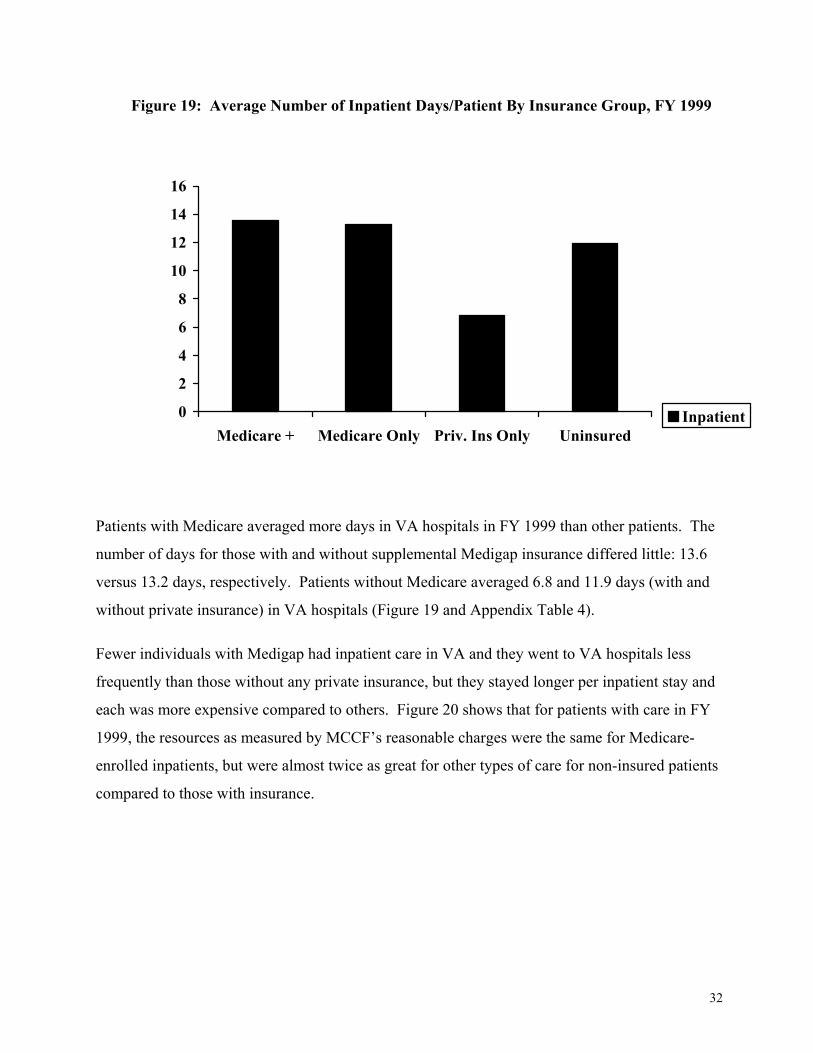
Figure 19: Average Number of Inpatient Days/Patient By Insurance Group, FY 1999
Patients with Medicare averaged more days in VA hospitals in FY 1999 than other patients. The
number of days for those with and without supplemental Medigap insurance differed little: 13.6
versus 13.2 days, respectively. Patients without Medicare averaged 6.8 and 11.9 days (with and
without private insurance) in VA hospitals (Figure 19 and Appendix Table 4).
Fewer individuals with Medigap had inpatient care in VA and they went to VA hospitals less
frequently than those without any private insurance, but they stayed longer per inpatient stay and
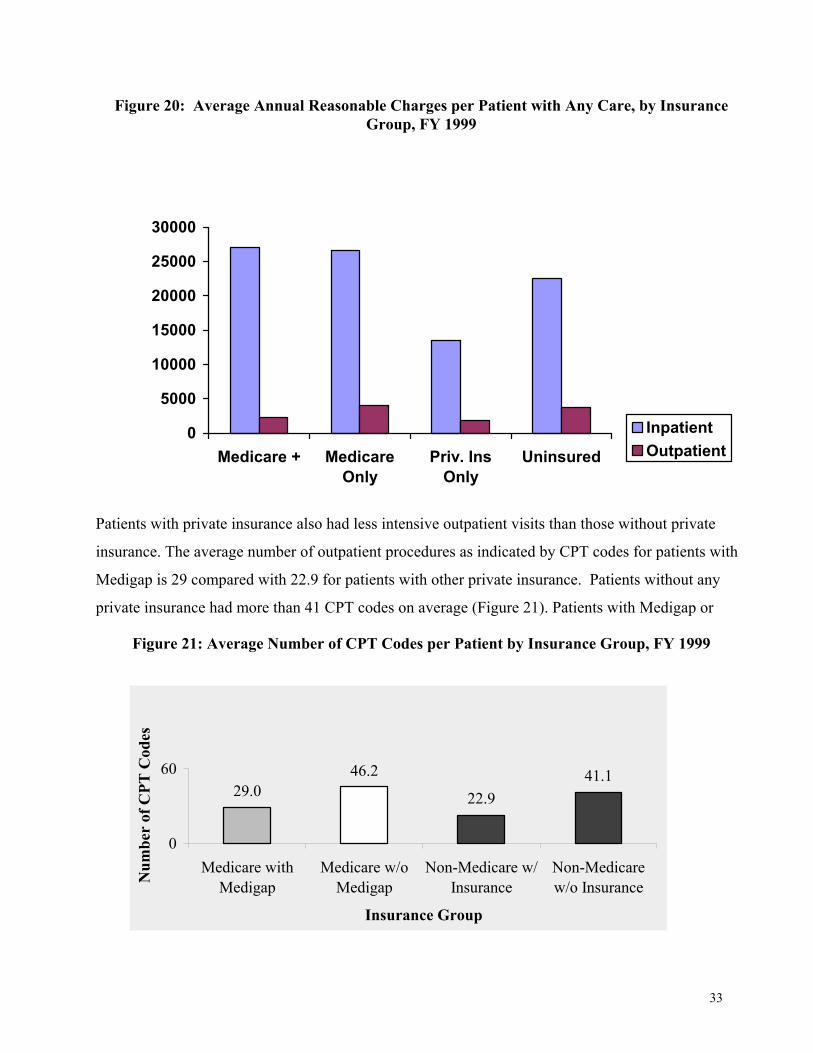
each was more expensive compared to others. Figure 20 shows that for patients with care in FY
1999, the resources as measured by MCCF’s reasonable charges were the same for Medicare-
enrolled inpatients, but were almost twice as great for other types of care for non-insured patients
compared to those with insurance.
0
2
4
6
8
10
12
14
16
Medicare + Medicare Only Priv. Ins Only UninsuredInpatient
33
Figure 20: Average Annual Reasonable Charges per Patient with Any Care, by Insurance Group, FY 1999
Patients with private insurance also had less intensive outpatient visits than those without private
insurance. The average number of outpatient procedures as indicated by CPT codes for patients with
Medigap is 29 compared with 22.9 for patients with other private insurance. Patients without any
private insurance had more than 41 CPT codes on average (Figure 21). Patients with Medigap or
Figure 21: Average Number of CPT Codes per Patient by Insurance Group, FY 1999
29.0 22.941.146.2
0
60
Medicare withMedigap
Medicare w/oMedigap
Non-Medicare w/Insurance
Non-Medicarew/o Insurance
Insurance Group
Num
ber
of C
PT C
odes
0
5000
10000
15000
20000
25000
30000
Medicare + MedicareOnly
Priv. InsOnly
Uninsured
InpatientOutpatient
34
other private insurance also had lower average outpatient cost based on billable CPT codes (Figure
20).
Specific Care
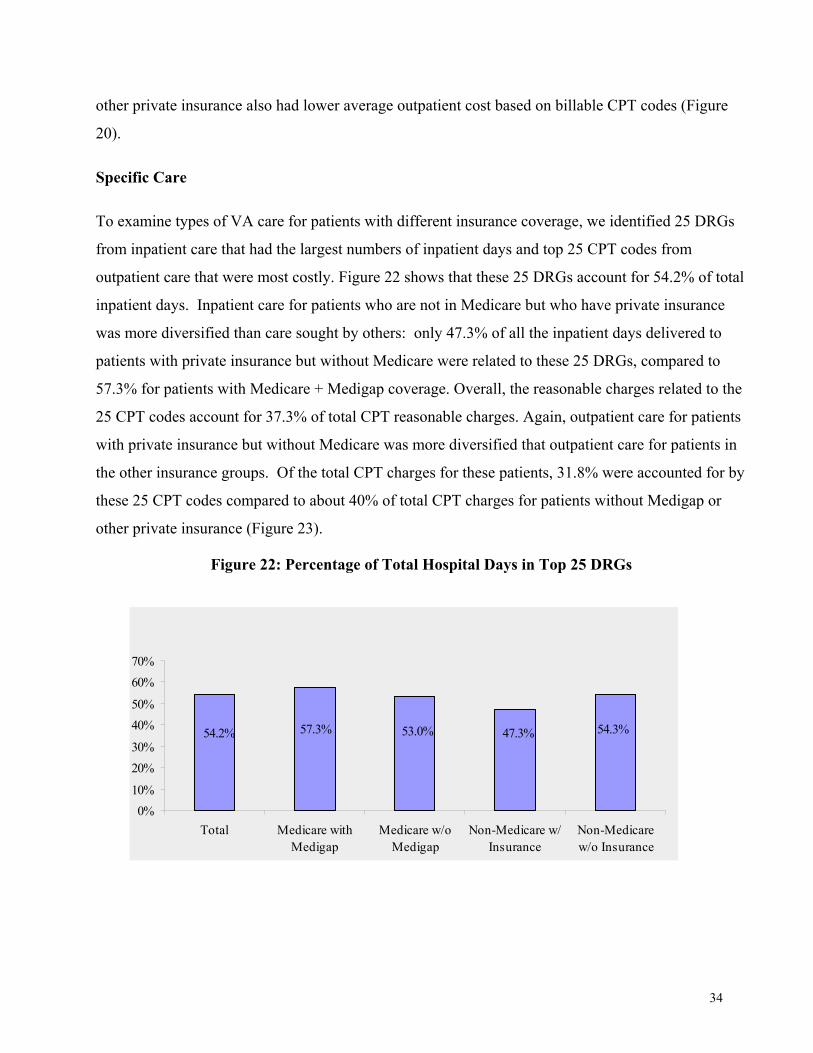
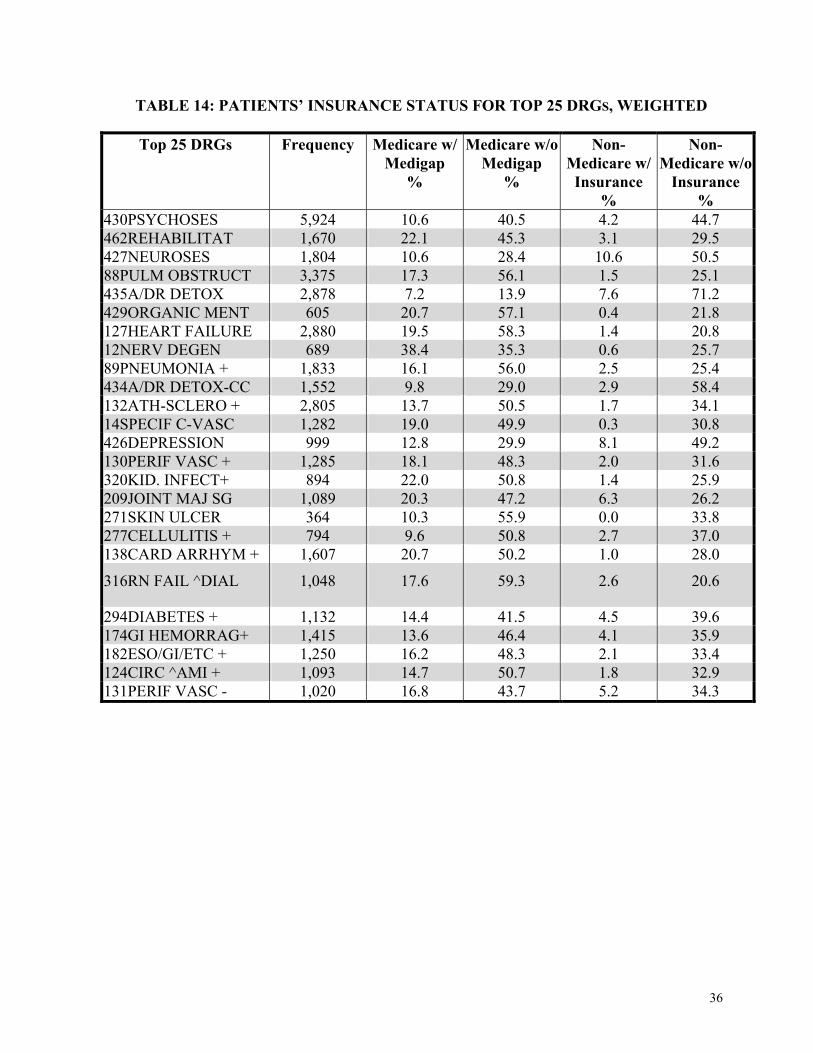
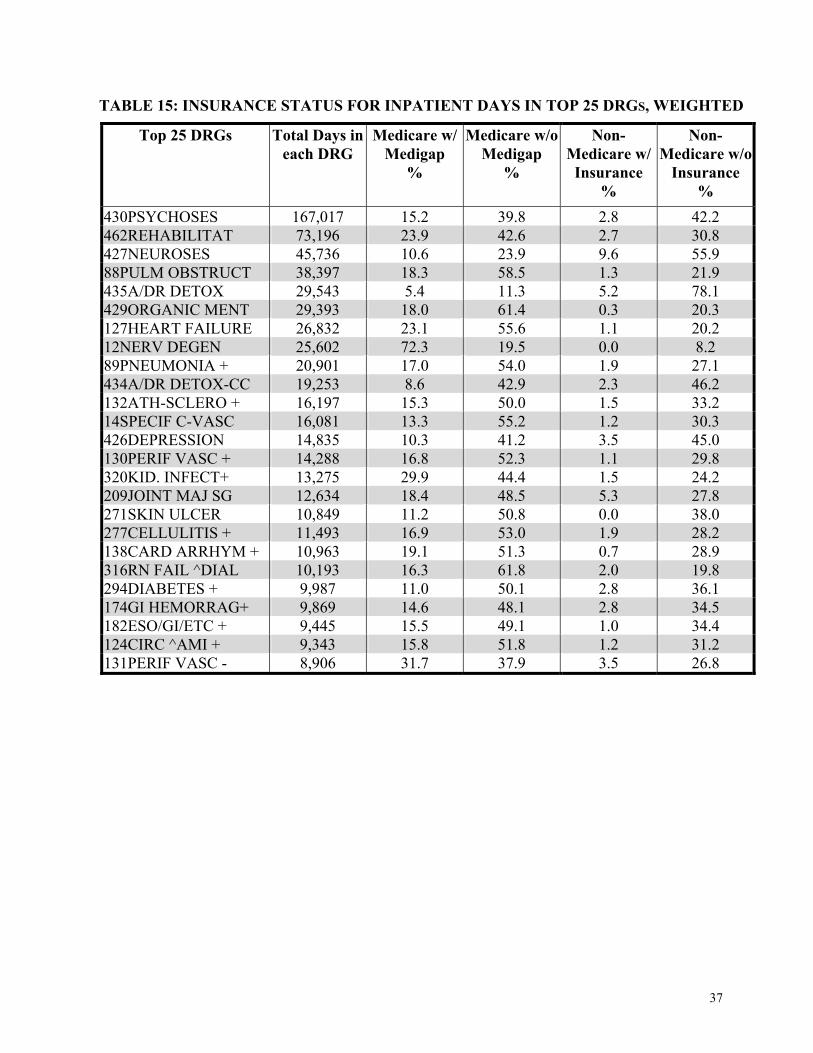
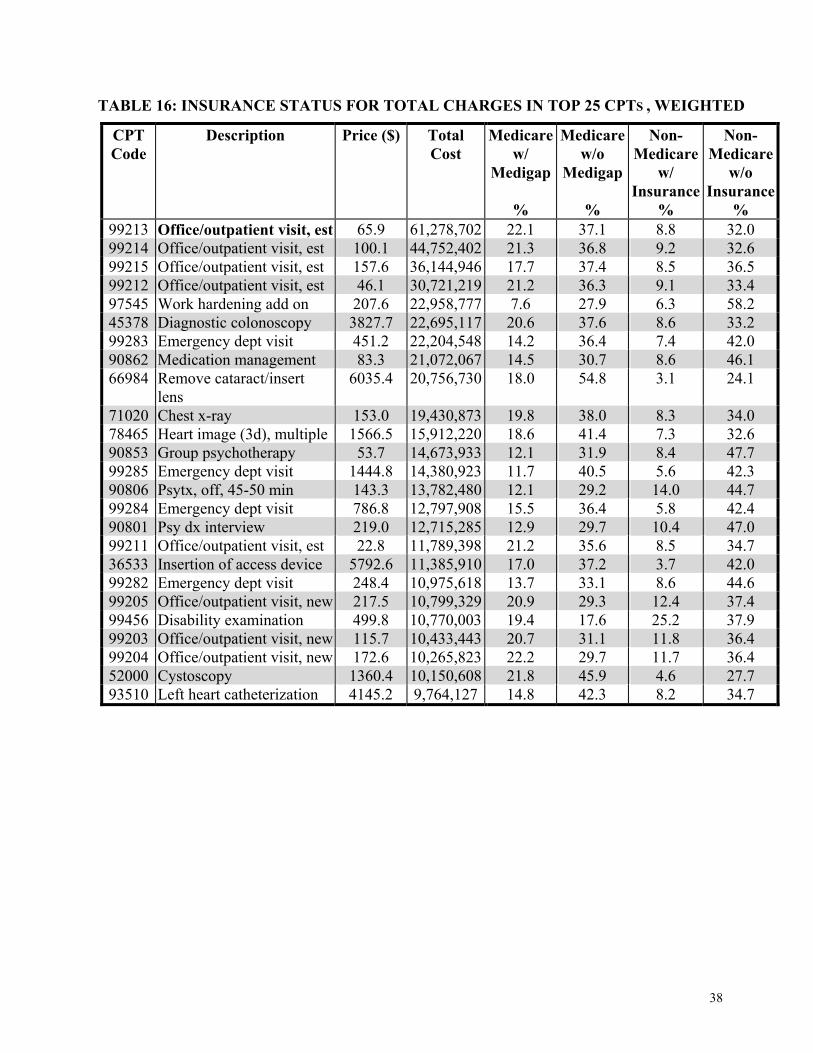
To examine types of VA care for patients with different insurance coverage, we identified 25 DRGs
from inpatient care that had the largest numbers of inpatient days and top 25 CPT codes from
outpatient care that were most costly. Figure 22 shows that these 25 DRGs account for 54.2% of total
inpatient days. Inpatient care for patients who are not in Medicare but who have private insurance
was more diversified than care sought by others: only 47.3% of all the inpatient days delivered to
patients with private insurance but without Medicare were related to these 25 DRGs, compared to
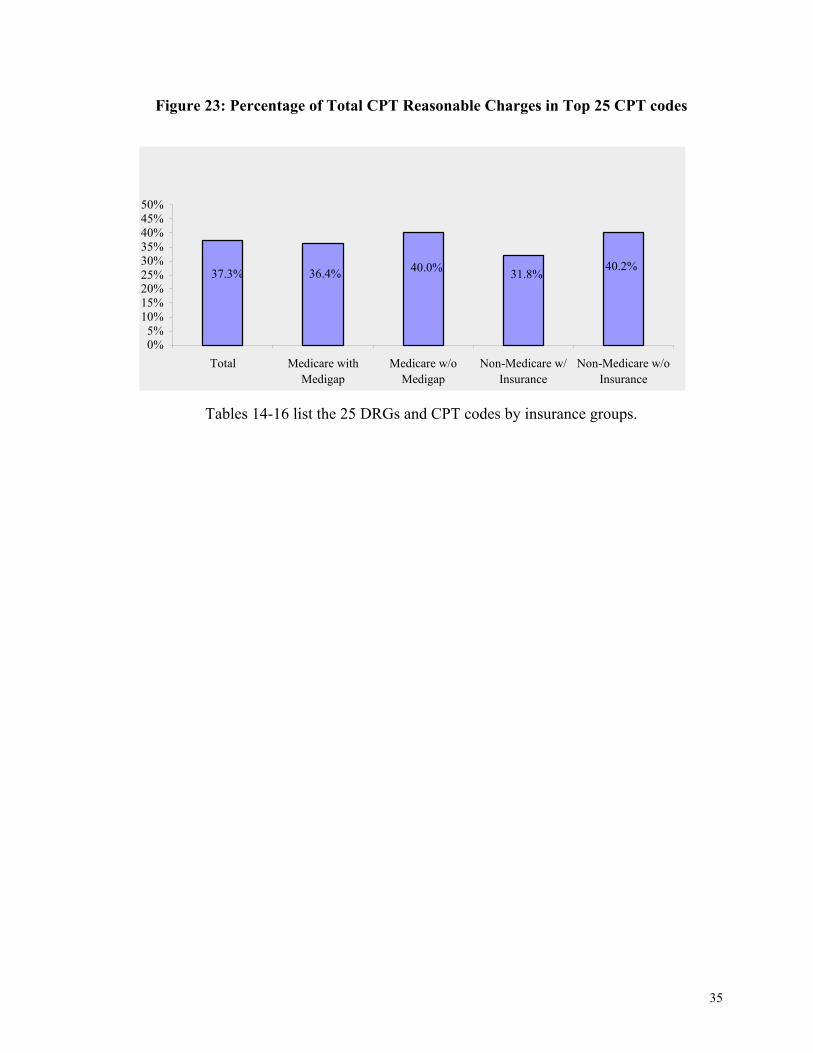
57.3% for patients with Medicare + Medigap coverage. Overall, the reasonable charges related to the
25 CPT codes account for 37.3% of total CPT reasonable charges. Again, outpatient care for patients
with private insurance but without Medicare was more diversified that outpatient care for patients in
the other insurance groups. Of the total CPT charges for these patients, 31.8% were accounted for by
these 25 CPT codes compared to about 40% of total CPT charges for patients without Medigap or
other private insurance (Figure 23).
Figure 22: Percentage of Total Hospital Days in Top 25 DRGs
54.3%47.3%53.0%57.3%54.2%
0%10%
20%30%
40%50%
60%70%
Total Medicare withMedigap
Medicare w/oMedigap
Non-Medicare w/Insurance
Non-Medicarew/o Insurance
35
Figure 23: Percentage of Total CPT Reasonable Charges in Top 25 CPT codes
Tables 14-16 list the 25 DRGs and CPT codes by insurance groups.
37.3% 36.4% 40.0% 31.8% 40.2%
0%5%
10%15%20%25%30%35%40%45%50%
Total Medicare withMedigap
Medicare w/oMedigap
Non-Medicare w/Insurance
Non-Medicare w/oInsurance
36
TABLE 14: PATIENTS’ INSURANCE STATUS FOR TOP 25 DRGS, WEIGHTED
Top 25 DRGs Frequency
Medicare w/ Medigap
%
Medicare w/o Medigap
%
Non-Medicare w/
Insurance %
Non-Medicare w/o
Insurance %
430PSYCHOSES 5,924 10.6 40.5 4.2 44.7 462REHABILITAT 1,670 22.1 45.3 3.1 29.5 427NEUROSES 1,804 10.6 28.4 10.6 50.5 88PULM OBSTRUCT 3,375 17.3 56.1 1.5 25.1 435A/DR DETOX 2,878 7.2 13.9 7.6 71.2 429ORGANIC MENT 605 20.7 57.1 0.4 21.8 127HEART FAILURE 2,880 19.5 58.3 1.4 20.8 12NERV DEGEN 689 38.4 35.3 0.6 25.7 89PNEUMONIA + 1,833 16.1 56.0 2.5 25.4 434A/DR DETOX-CC 1,552 9.8 29.0 2.9 58.4 132ATH-SCLERO + 2,805 13.7 50.5 1.7 34.1 14SPECIF C-VASC 1,282 19.0 49.9 0.3 30.8 426DEPRESSION 999 12.8 29.9 8.1 49.2 130PERIF VASC + 1,285 18.1 48.3 2.0 31.6 320KID. INFECT+ 894 22.0 50.8 1.4 25.9 209JOINT MAJ SG 1,089 20.3 47.2 6.3 26.2 271SKIN ULCER 364 10.3 55.9 0.0 33.8 277CELLULITIS + 794 9.6 50.8 2.7 37.0 138CARD ARRHYM + 1,607 20.7 50.2 1.0 28.0
316RN FAIL ^DIAL 1,048 17.6 59.3 2.6 20.6
294DIABETES + 1,132 14.4 41.5 4.5 39.6 174GI HEMORRAG+ 1,415 13.6 46.4 4.1 35.9 182ESO/GI/ETC + 1,250 16.2 48.3 2.1 33.4 124CIRC ^AMI + 1,093 14.7 50.7 1.8 32.9 131PERIF VASC - 1,020 16.8 43.7 5.2 34.3
37
TABLE 15: INSURANCE STATUS FOR INPATIENT DAYS IN TOP 25 DRGS, WEIGHTED
Top 25 DRGs Total Days in each DRG
Medicare w/ Medigap
%
Medicare w/o Medigap
%
Non-Medicare w/
Insurance %
Non-Medicare w/o
Insurance %
430PSYCHOSES 167,017 15.2 39.8 2.8 42.2 462REHABILITAT 73,196 23.9 42.6 2.7 30.8 427NEUROSES 45,736 10.6 23.9 9.6 55.9 88PULM OBSTRUCT 38,397 18.3 58.5 1.3 21.9 435A/DR DETOX 29,543 5.4 11.3 5.2 78.1 429ORGANIC MENT 29,393 18.0 61.4 0.3 20.3 127HEART FAILURE 26,832 23.1 55.6 1.1 20.2 12NERV DEGEN 25,602 72.3 19.5 0.0 8.2 89PNEUMONIA + 20,901 17.0 54.0 1.9 27.1 434A/DR DETOX-CC 19,253 8.6 42.9 2.3 46.2 132ATH-SCLERO + 16,197 15.3 50.0 1.5 33.2 14SPECIF C-VASC 16,081 13.3 55.2 1.2 30.3 426DEPRESSION 14,835 10.3 41.2 3.5 45.0 130PERIF VASC + 14,288 16.8 52.3 1.1 29.8 320KID. INFECT+ 13,275 29.9 44.4 1.5 24.2 209JOINT MAJ SG 12,634 18.4 48.5 5.3 27.8 271SKIN ULCER 10,849 11.2 50.8 0.0 38.0 277CELLULITIS + 11,493 16.9 53.0 1.9 28.2 138CARD ARRHYM + 10,963 19.1 51.3 0.7 28.9 316RN FAIL ^DIAL 10,193 16.3 61.8 2.0 19.8 294DIABETES + 9,987 11.0 50.1 2.8 36.1 174GI HEMORRAG+ 9,869 14.6 48.1 2.8 34.5 182ESO/GI/ETC + 9,445 15.5 49.1 1.0 34.4 124CIRC ^AMI + 9,343 15.8 51.8 1.2 31.2 131PERIF VASC - 8,906 31.7 37.9 3.5 26.8
38
TABLE 16: INSURANCE STATUS FOR TOTAL CHARGES IN TOP 25 CPTS , WEIGHTED
CPT Code
Description Price ($) Total Cost
Medicare w/
Medigap
%
Medicare w/o
Medigap
%
Non-Medicare
w/ Insurance
%
Non-Medicare
w/o Insurance
% 99213 Office/outpatient visit, est 65.9 61,278,702 22.1 37.1 8.8 32.0 99214 Office/outpatient visit, est 100.1 44,752,402 21.3 36.8 9.2 32.6 99215 Office/outpatient visit, est 157.6 36,144,946 17.7 37.4 8.5 36.5 99212 Office/outpatient visit, est 46.1 30,721,219 21.2 36.3 9.1 33.4 97545 Work hardening add on 207.6 22,958,777 7.6 27.9 6.3 58.2 45378 Diagnostic colonoscopy 3827.7 22,695,117 20.6 37.6 8.6 33.2 99283 Emergency dept visit 451.2 22,204,548 14.2 36.4 7.4 42.0 90862 Medication management 83.3 21,072,067 14.5 30.7 8.6 46.1 66984 Remove cataract/insert
lens 6035.4 20,756,730 18.0 54.8 3.1 24.1
71020 Chest x-ray 153.0 19,430,873 19.8 38.0 8.3 34.0 78465 Heart image (3d), multiple 1566.5 15,912,220 18.6 41.4 7.3 32.6 90853 Group psychotherapy 53.7 14,673,933 12.1 31.9 8.4 47.7 99285 Emergency dept visit 1444.8 14,380,923 11.7 40.5 5.6 42.3 90806 Psytx, off, 45-50 min 143.3 13,782,480 12.1 29.2 14.0 44.7 99284 Emergency dept visit 786.8 12,797,908 15.5 36.4 5.8 42.4 90801 Psy dx interview 219.0 12,715,285 12.9 29.7 10.4 47.0 99211 Office/outpatient visit, est 22.8 11,789,398 21.2 35.6 8.5 34.7 36533 Insertion of access device 5792.6 11,385,910 17.0 37.2 3.7 42.0 99282 Emergency dept visit 248.4 10,975,618 13.7 33.1 8.6 44.6 99205 Office/outpatient visit, new 217.5 10,799,329 20.9 29.3 12.4 37.4 99456 Disability examination 499.8 10,770,003 19.4 17.6 25.2 37.9 99203 Office/outpatient visit, new 115.7 10,433,443 20.7 31.1 11.8 36.4 99204 Office/outpatient visit, new 172.6 10,265,823 22.2 29.7 11.7 36.4 52000 Cystoscopy 1360.4 10,150,608 21.8 45.9 4.6 27.7 93510 Left heart catheterization 4145.2 9,764,127 14.8 42.3 8.2 34.7
39
DIFFERENCES IN UTILIZATION BY VISN
Inpatient
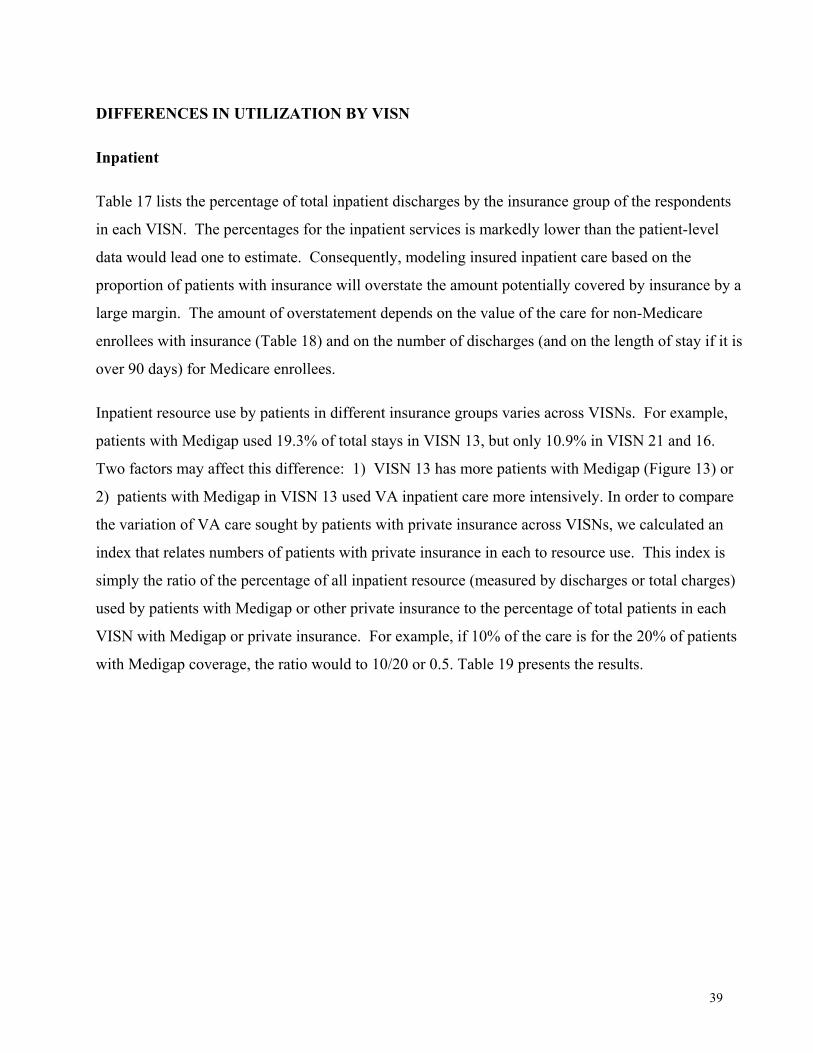
Table 17 lists the percentage of total inpatient discharges by the insurance group of the respondents
in each VISN. The percentages for the inpatient services is markedly lower than the patient-level
data would lead one to estimate. Consequently, modeling insured inpatient care based on the
proportion of patients with insurance will overstate the amount potentially covered by insurance by a
large margin. The amount of overstatement depends on the value of the care for non-Medicare
enrollees with insurance (Table 18) and on the number of discharges (and on the length of stay if it is
over 90 days) for Medicare enrollees.
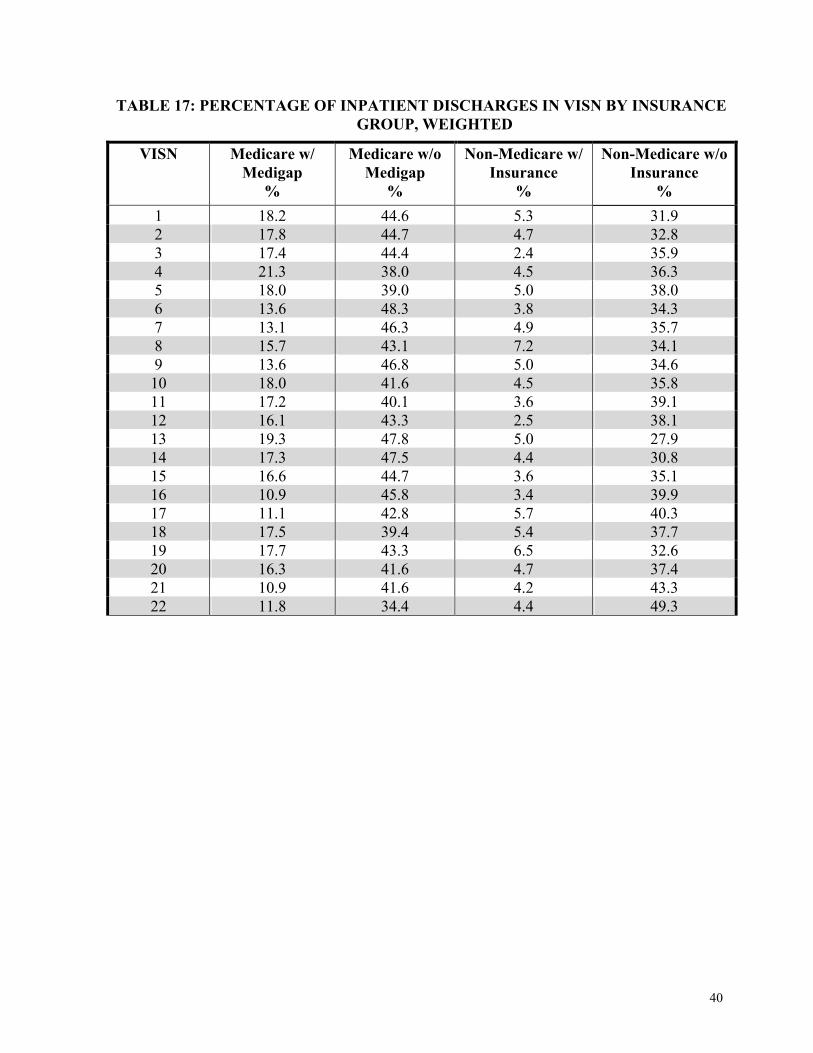
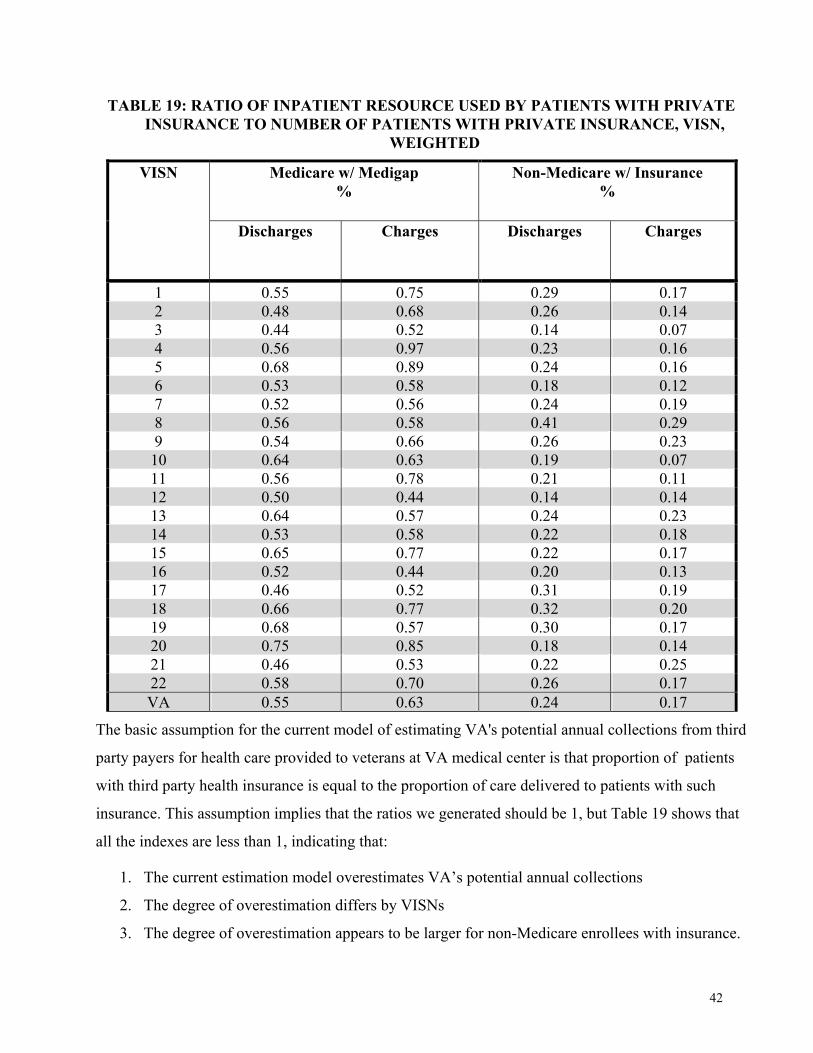
Inpatient resource use by patients in different insurance groups varies across VISNs. For example,
patients with Medigap used 19.3% of total stays in VISN 13, but only 10.9% in VISN 21 and 16.
Two factors may affect this difference: 1) VISN 13 has more patients with Medigap (Figure 13) or
2) patients with Medigap in VISN 13 used VA inpatient care more intensively. In order to compare
the variation of VA care sought by patients with private insurance across VISNs, we calculated an
index that relates numbers of patients with private insurance in each to resource use. This index is
simply the ratio of the percentage of all inpatient resource (measured by discharges or total charges)
used by patients with Medigap or other private insurance to the percentage of total patients in each
VISN with Medigap or private insurance. For example, if 10% of the care is for the 20% of patients
with Medigap coverage, the ratio would to 10/20 or 0.5. Table 19 presents the results.
40
TABLE 17: PERCENTAGE OF INPATIENT DISCHARGES IN VISN BY INSURANCE GROUP, WEIGHTED
VISN Medicare w/ Medigap
%
Medicare w/o Medigap
%
Non-Medicare w/ Insurance
%
Non-Medicare w/o Insurance
% 1 18.2 44.6 5.3 31.9 2 17.8 44.7 4.7 32.8 3 17.4 44.4 2.4 35.9 4 21.3 38.0 4.5 36.3 5 18.0 39.0 5.0 38.0 6 13.6 48.3 3.8 34.3 7 13.1 46.3 4.9 35.7 8 15.7 43.1 7.2 34.1 9 13.6 46.8 5.0 34.6 10 18.0 41.6 4.5 35.8 11 17.2 40.1 3.6 39.1 12 16.1 43.3 2.5 38.1 13 19.3 47.8 5.0 27.9 14 17.3 47.5 4.4 30.8 15 16.6 44.7 3.6 35.1 16 10.9 45.8 3.4 39.9 17 11.1 42.8 5.7 40.3 18 17.5 39.4 5.4 37.7 19 17.7 43.3 6.5 32.6 20 16.3 41.6 4.7 37.4 21 10.9 41.6 4.2 43.3 22 11.8 34.4 4.4 49.3
41
TABLE 18: PERCENTAGE OF INPATIENT CHARGES IN VISN BY INSURANCE GROUP, WEIGHTED
VISN Total Estimated
Reasonable Charges $
Medicare w/ Medigap %
Medicare w/o Medigap %
Non-Medicare w/ Insurance
%
Non-Medicare w/o Insurance %
1 63,995,064 24.9 44.2 3.0 27.9 2 26,316,200 24.9 45.5 2.6 26.9 3 66,293,584 20.4 47.8 1.3 30.4 4 57,056,767 36.6 34.8 3.2 25.4 5 37,562,590 23.7 40.8 3.3 32.1 6 79,073,395 14.7 45.7 2.6 37.0 7 74,679,231 14.1 52.1 3.9 29.8 8 103,921,916 16.2 43.9 5.0 34.9 9 70,436,962 16.6 48.1 4.3 31.0 10 32,501,651 18.0 44.6 1.6 35.8 11 57,911,676 24.0 45.3 1.9 28.9 12 60,990,969 14.2 44.9 2.6 38.3 13 28,429,639 17.3 49.3 4.8 28.6 14 15,136,998 19.0 47.3 3.7 30.1 15 46,613,607 19.7 43.8 2.7 33.8 16 113,598,064 9.3 47.7 2.2 40.8 17 67,078,761 12.6 45.7 3.5 38.2 18 44,668,434 20.4 44.8 3.4 31.4 19 31,802,472 15.0 45.9 3.6 35.5 20 28,959,436 18.3 40.4 3.4 37.9 21 38,891,236 12.7 39.6 4.7 43.1 22 42,242,770 14.3 31.6 3.0 51.1
42
TABLE 19: RATIO OF INPATIENT RESOURCE USED BY PATIENTS WITH PRIVATE INSURANCE TO NUMBER OF PATIENTS WITH PRIVATE INSURANCE, VISN,
WEIGHTED
1 0.55 0.75 0.29 0.17 2 0.48 0.68 0.26 0.14 3 0.44 0.52 0.14 0.07 4 0.56 0.97 0.23 0.16 5 0.68 0.89 0.24 0.16 6 0.53 0.58 0.18 0.12 7 0.52 0.56 0.24 0.19 8 0.56 0.58 0.41 0.29 9 0.54 0.66 0.26 0.23 10 0.64 0.63 0.19 0.07 11 0.56 0.78 0.21 0.11 12 0.50 0.44 0.14 0.14 13 0.64 0.57 0.24 0.23 14 0.53 0.58 0.22 0.18 15 0.65 0.77 0.22 0.17 16 0.52 0.44 0.20 0.13 17 0.46 0.52 0.31 0.19 18 0.66 0.77 0.32 0.20 19 0.68 0.57 0.30 0.17 20 0.75 0.85 0.18 0.14 21 0.46 0.53 0.22 0.25 22 0.58 0.70 0.26 0.17 VA 0.55 0.63 0.24 0.17
The basic assumption for the current model of estimating VA's potential annual collections from third
party payers for health care provided to veterans at VA medical center is that proportion of patients
with third party health insurance is equal to the proportion of care delivered to patients with such
insurance. This assumption implies that the ratios we generated should be 1, but Table 19 shows that
all the indexes are less than 1, indicating that:
1. The current estimation model overestimates VA’s potential annual collections
2. The degree of overestimation differs by VISNs
3. The degree of overestimation appears to be larger for non-Medicare enrollees with insurance.
Medicare w/ Medigap %
Non-Medicare w/ Insurance %
VISN
Discharges Charges Discharges Charges
43
Outpatient
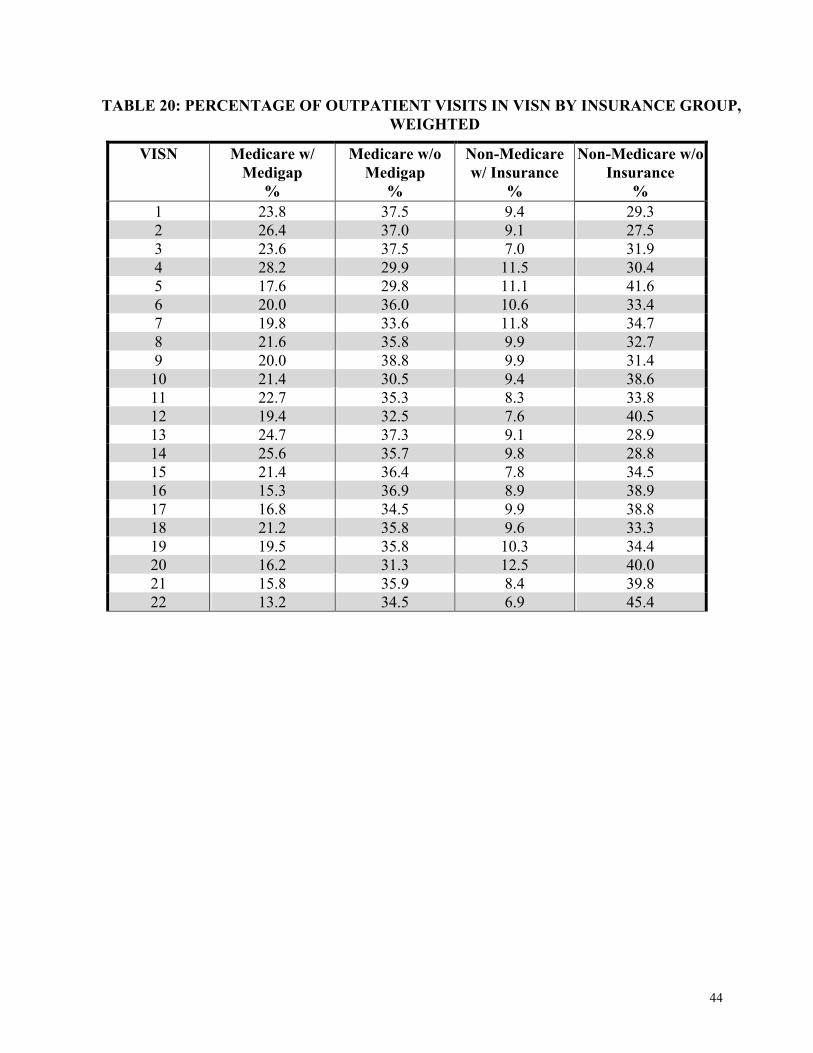
The outpatient resources used by different insurance groups also vary by VISNs (Tables 20 and 21).
After controlling for shares of private insurance in each VISN by creating ratios of outpatient care
analogous to the inpatient ratios above, the variation still exists (Table 22). All the ratios in Table 22
are smaller than 1, which again implies that patients with private insurance had less VA outpatient
use in all 22 VISNs and the potential annual collections from outpatient care are overestimated too.
SUMMARY
CHQOER’s analyses of the 1999 Large Health Survey of VA Enrollees merged with FY 1999 VA
utilization information has shown: 1) that almost half of all veterans who are VA patients have either
private Medigap insurance or other private health care insurance coverage and 2) that the acute
inpatient and outpatient utilization of veteran patients with private health insurance is markedly lower
than the utilization of other VA patients who do not have such coverage. At least some of the lower
utilization is probably due to the somewhat better circumstances of patients with private insurance as
evidenced by their having, on average, better health status, more stable living arrangements, lower
levels of service-connected disability, and higher incomes.
Insurance coverage and utilization differ markedly, both in the aggregate and across the 22 VISNs.
This evidence confirms that the CHQOER/MCCF model of VA’s potential collections from third
party insurers has tended to overestimate potential billable amounts and that the extent of
overstatement varies among the VISNs. The overstatement is considerable larger for non-Medicare
enrollees with private health insurance than for Medicare enrollees with Medigap coverage.
There are several methods for estimating the impact of the new survey information on the
CHQOER/MCCF model. CHQOER researchers are comparing several approaches and will submit a
memo on estimate revisions under separate cover.
44
TABLE 20: PERCENTAGE OF OUTPATIENT VISITS IN VISN BY INSURANCE GROUP, WEIGHTED
VISN Medicare w/ Medigap
%
Medicare w/o Medigap
%
Non-Medicare w/ Insurance
%
Non-Medicare w/o Insurance
% 1 23.8 37.5 9.4 29.3 2 26.4 37.0 9.1 27.5 3 23.6 37.5 7.0 31.9 4 28.2 29.9 11.5 30.4 5 17.6 29.8 11.1 41.6 6 20.0 36.0 10.6 33.4 7 19.8 33.6 11.8 34.7 8 21.6 35.8 9.9 32.7 9 20.0 38.8 9.9 31.4 10 21.4 30.5 9.4 38.6 11 22.7 35.3 8.3 33.8 12 19.4 32.5 7.6 40.5 13 24.7 37.3 9.1 28.9 14 25.6 35.7 9.8 28.8 15 21.4 36.4 7.8 34.5 16 15.3 36.9 8.9 38.9 17 16.8 34.5 9.9 38.8 18 21.2 35.8 9.6 33.3 19 19.5 35.8 10.3 34.4 20 16.2 31.3 12.5 40.0 21 15.8 35.9 8.4 39.8 22 13.2 34.5 6.9 45.4
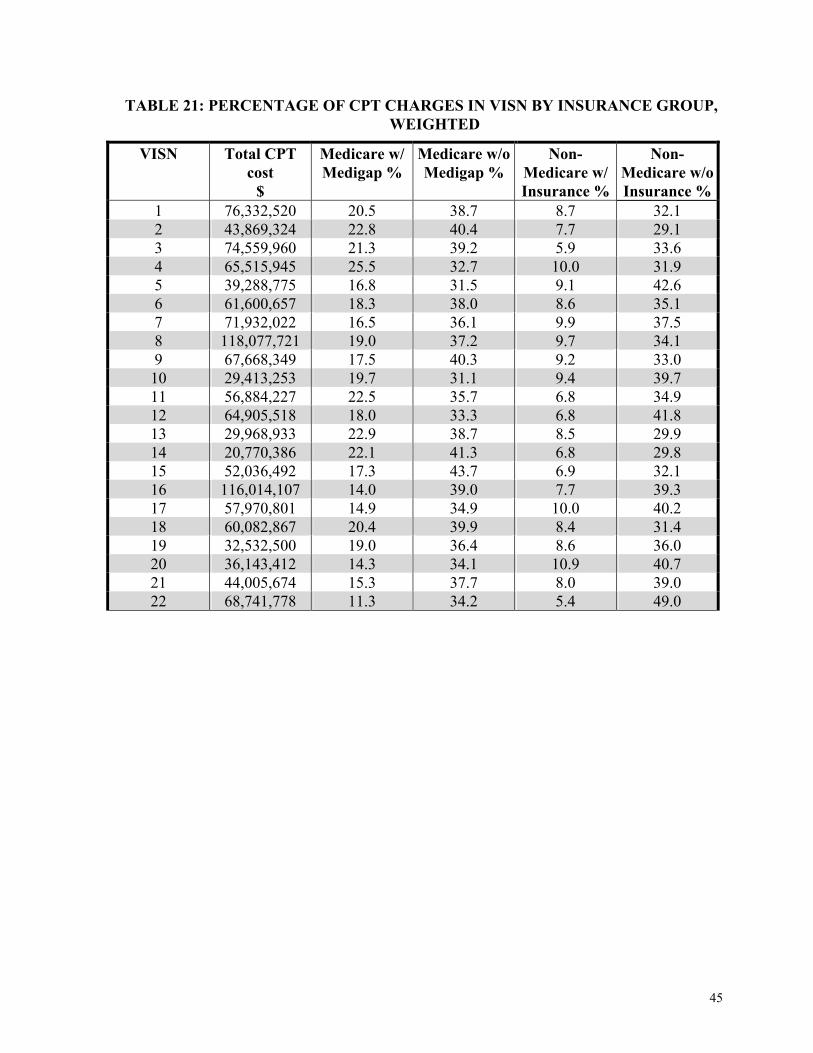
45
TABLE 21: PERCENTAGE OF CPT CHARGES IN VISN BY INSURANCE GROUP, WEIGHTED
VISN Total CPT cost
$
Medicare w/ Medigap %
Medicare w/o Medigap %
Non-Medicare w/ Insurance %
Non-Medicare w/o Insurance %
1 76,332,520 20.5 38.7 8.7 32.1 2 43,869,324 22.8 40.4 7.7 29.1 3 74,559,960 21.3 39.2 5.9 33.6 4 65,515,945 25.5 32.7 10.0 31.9 5 39,288,775 16.8 31.5 9.1 42.6 6 61,600,657 18.3 38.0 8.6 35.1 7 71,932,022 16.5 36.1 9.9 37.5 8 118,077,721 19.0 37.2 9.7 34.1 9 67,668,349 17.5 40.3 9.2 33.0 10 29,413,253 19.7 31.1 9.4 39.7 11 56,884,227 22.5 35.7 6.8 34.9 12 64,905,518 18.0 33.3 6.8 41.8 13 29,968,933 22.9 38.7 8.5 29.9 14 20,770,386 22.1 41.3 6.8 29.8 15 52,036,492 17.3 43.7 6.9 32.1 16 116,014,107 14.0 39.0 7.7 39.3 17 57,970,801 14.9 34.9 10.0 40.2 18 60,082,867 20.4 39.9 8.4 31.4 19 32,532,500 19.0 36.4 8.6 36.0 20 36,143,412 14.3 34.1 10.9 40.7 21 44,005,674 15.3 37.7 8.0 39.0 22 68,741,778 11.3 34.2 5.4 49.0
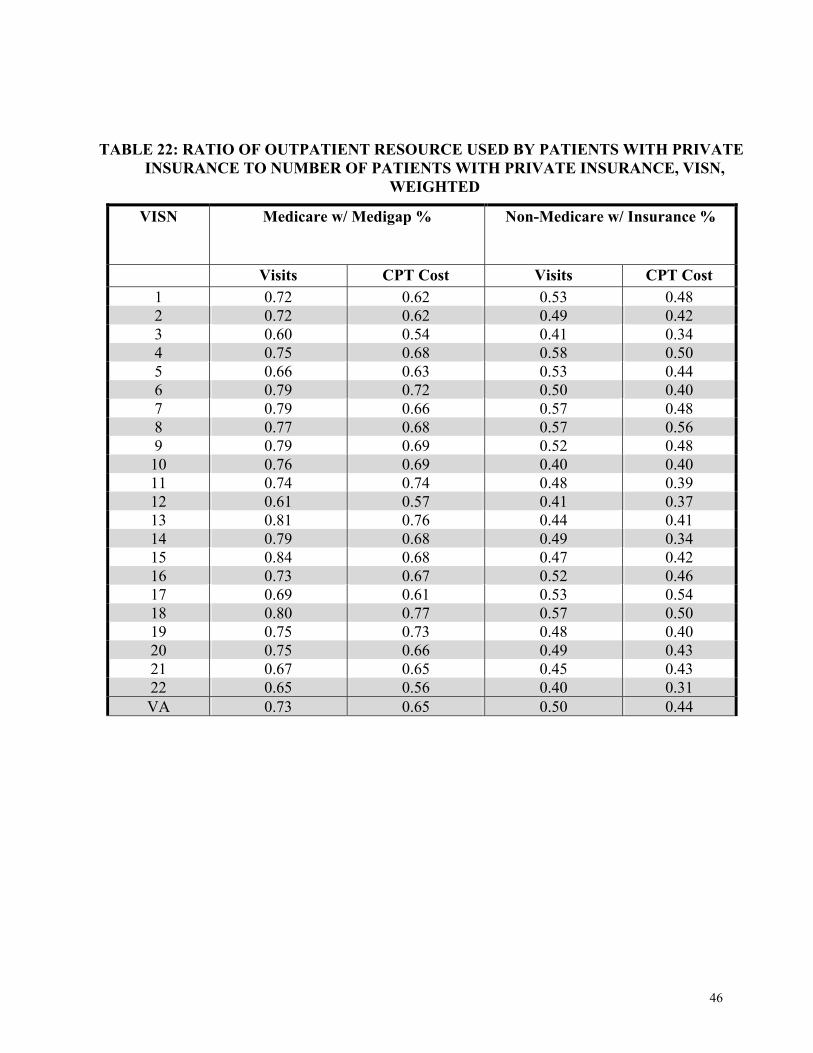
46
TABLE 22: RATIO OF OUTPATIENT RESOURCE USED BY PATIENTS WITH PRIVATE INSURANCE TO NUMBER OF PATIENTS WITH PRIVATE INSURANCE, VISN,
WEIGHTED
Visits CPT Cost Visits CPT Cost 1 0.72 0.62 0.53 0.48 2 0.72 0.62 0.49 0.42 3 0.60 0.54 0.41 0.34 4 0.75 0.68 0.58 0.50 5 0.66 0.63 0.53 0.44 6 0.79 0.72 0.50 0.40 7 0.79 0.66 0.57 0.48 8 0.77 0.68 0.57 0.56 9 0.79 0.69 0.52 0.48 10 0.76 0.69 0.40 0.40 11 0.74 0.74 0.48 0.39 12 0.61 0.57 0.41 0.37 13 0.81 0.76 0.44 0.41 14 0.79 0.68 0.49 0.34 15 0.84 0.68 0.47 0.42 16 0.73 0.67 0.52 0.46 17 0.69 0.61 0.53 0.54 18 0.80 0.77 0.57 0.50 19 0.75 0.73 0.48 0.40 20 0.75 0.66 0.49 0.43 21 0.67 0.65 0.45 0.43 22 0.65 0.56 0.40 0.31 VA 0.73 0.65 0.50 0.44
VISN Medicare w/ Medigap % Non-Medicare w/ Insurance %
47
REFERENCES
Desai, KR, Comstock, CB, Hendricks, AM, Utilization Patterns of Dually-Eligible (VA and Medicare Veterans by Age, Presentation at the HSR&D Service 18th Annual Meeting, Washington, D.C. March, 2000. Hendricks, Ann M., Anderson, Jennifer, Cahill, Leslie, The Model for MCCR Projections Report I, Management Decision and Research Center, Health Services Research and Development Services, Report prepared for the Office of Medical Care Cost Recover, Veterans Health Administration, April 1997a. Hendricks, Ann M., Anderson, Jennifer, Comstock, Catherine, The Model for MCCR Projections Report II: Forecasts of Medical Care Cost Recoveries to FY 2002, Management Decision and Research Center, Health Services Research and Development Services, Report prepared for the Office of Medical Care Cost Recover, Veterans Health Administration, July 1997a. Perlin, J, et al., Health Status and Outcomes of Veterans: Physical and Mental Component Summary Scores Veterans SF-36: 1999 Large Health Survey of Veterans Enrollees, Executive Report, Department of Veterans Affairs, Veterans Health Administration, Office of Quality and Performance, Washington, D.C. and VHA Health Assessment Project, Center for Health Quality, Outcomes and Economic Research, HSR&D Field Program, Edith Nourse Rogers Memorial Veterans Hospital, Bedford, Massachusetts, May 2000. Shen, Y, et al., Health Insurance and Use of Services by Veterans: 1999 Large Health Survey of Veterans Enrollees, Department of Veterans Affairs, Veterans Health Administration, Office of Quality and Performance, Washington, D.C. and VHA Health Assessment Project, Center for Health Quality, Outcomes and Economic Research, HSR&D Field Program, Edith Nourse Rogers Memorial Veterans Hospital, Bedford, Massachusetts, September 2000. Wright, S. Medicare Enrollment Status among VA Users by VISN, Presentation at the HSR&D Service 18th Annual Meeting, Washington, D.C. March, 2000.
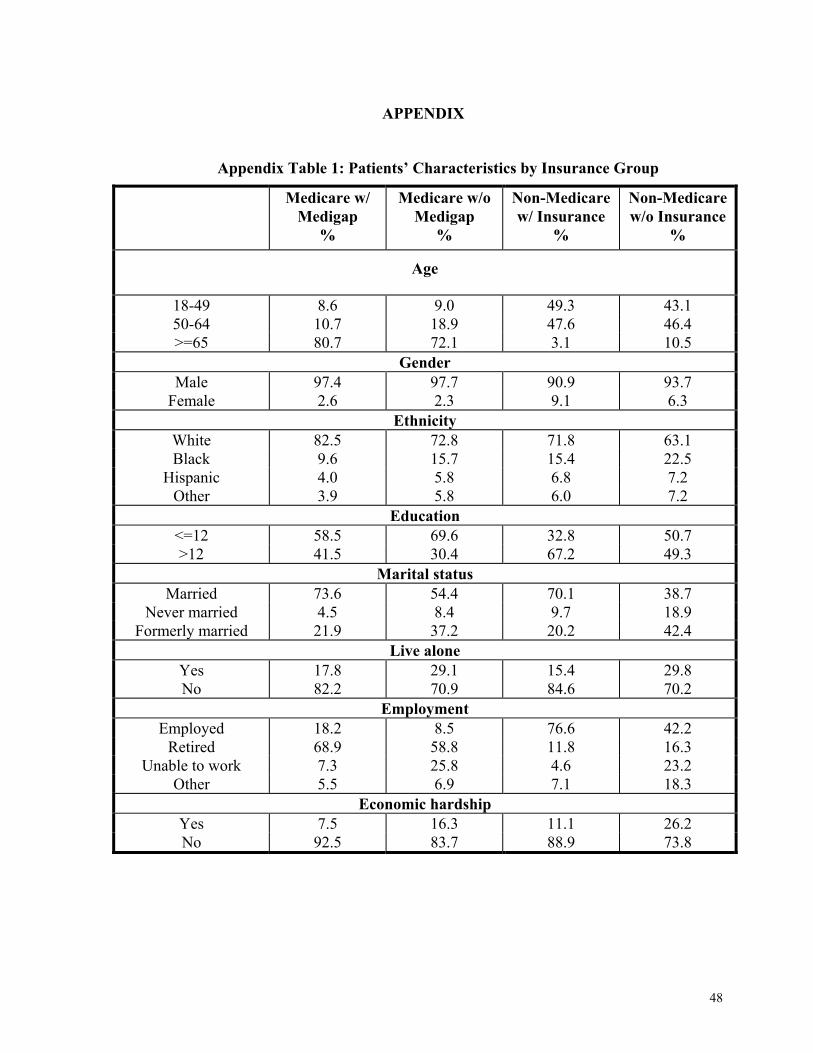
48
APPENDIX
Appendix Table 1: Patients’ Characteristics by Insurance Group
Medicare w/ Medigap
%
Medicare w/o Medigap
%
Non-Medicare w/ Insurance
%
Non-Medicare w/o Insurance
%
Age
18-49 8.6 9.0 49.3 43.1 50-64 10.7 18.9 47.6 46.4 >=65 80.7 72.1 3.1 10.5
Gender Male 97.4 97.7 90.9 93.7
Female 2.6 2.3 9.1 6.3 Ethnicity
White 82.5 72.8 71.8 63.1 Black 9.6 15.7 15.4 22.5
Hispanic 4.0 5.8 6.8 7.2 Other 3.9 5.8 6.0 7.2
Education <=12 58.5 69.6 32.8 50.7 >12 41.5 30.4 67.2 49.3
Marital status Married 73.6 54.4 70.1 38.7
Never married 4.5 8.4 9.7 18.9 Formerly married 21.9 37.2 20.2 42.4
Live alone Yes 17.8 29.1 15.4 29.8 No 82.2 70.9 84.6 70.2
Employment Employed 18.2 8.5 76.6 42.2
Retired 68.9 58.8 11.8 16.3 Unable to work 7.3 25.8 4.6 23.2
Other 5.5 6.9 7.1 18.3 Economic hardship
Yes 7.5 16.3 11.1 26.2 No 92.5 83.7 88.9 73.8
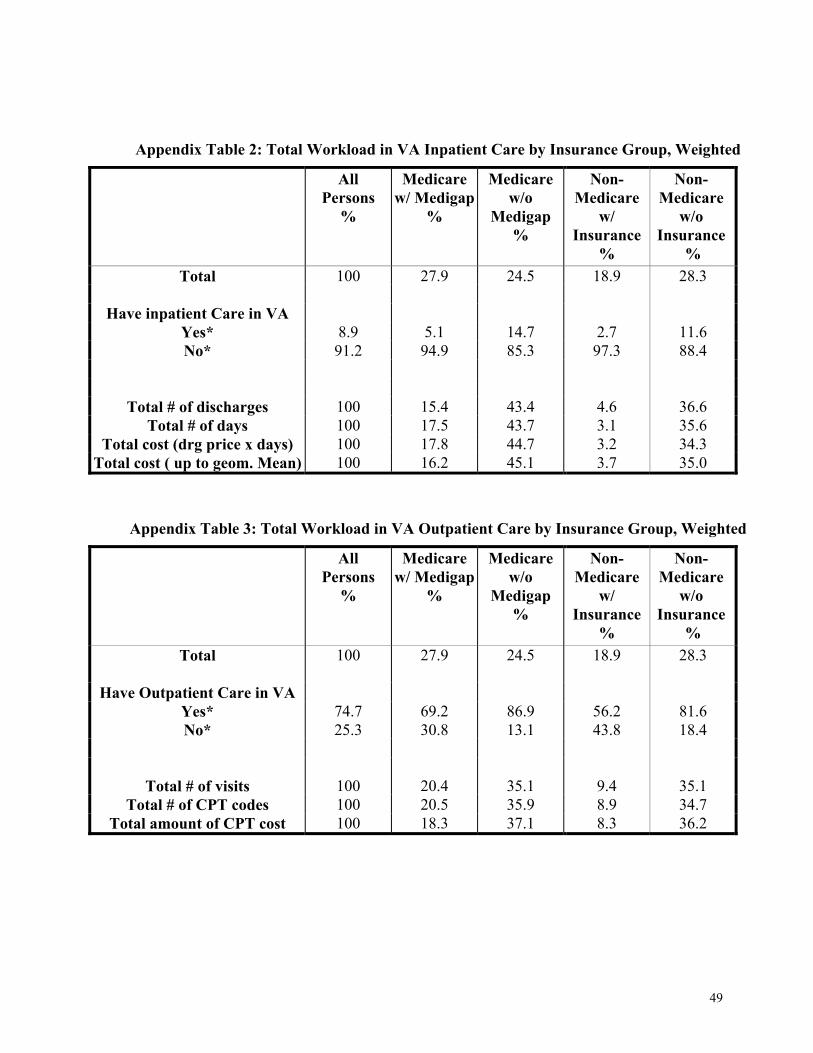
49
Appendix Table 2: Total Workload in VA Inpatient Care by Insurance Group, Weighted
All Persons
%
Medicare w/ Medigap
%
Medicare w/o
Medigap %
Non-Medicare
w/ Insurance
%
Non-Medicare
w/o Insurance
% Total 100 27.9 24.5 18.9 28.3
Have inpatient Care in VA
Yes* 8.9 5.1 14.7 2.7 11.6 No* 91.2 94.9 85.3 97.3 88.4
Total # of discharges 100 15.4 43.4 4.6 36.6 Total # of days 100 17.5 43.7 3.1 35.6
Total cost (drg price x days) 100 17.8 44.7 3.2 34.3 Total cost ( up to geom. Mean) 100 16.2 45.1 3.7 35.0
Appendix Table 3: Total Workload in VA Outpatient Care by Insurance Group, Weighted
All Persons
%
Medicare w/ Medigap
%
Medicare w/o
Medigap %
Non-Medicare
w/ Insurance
%
Non-Medicare
w/o Insurance
% Total 100 27.9 24.5 18.9 28.3
Have Outpatient Care in VA
Yes* 74.7 69.2 86.9 56.2 81.6 No* 25.3 30.8 13.1 43.8 18.4
Total # of visits 100 20.4 35.1 9.4 35.1 Total # of CPT codes 100 20.5 35.9 8.9 34.7
Total amount of CPT cost 100 18.3 37.1 8.3 36.2
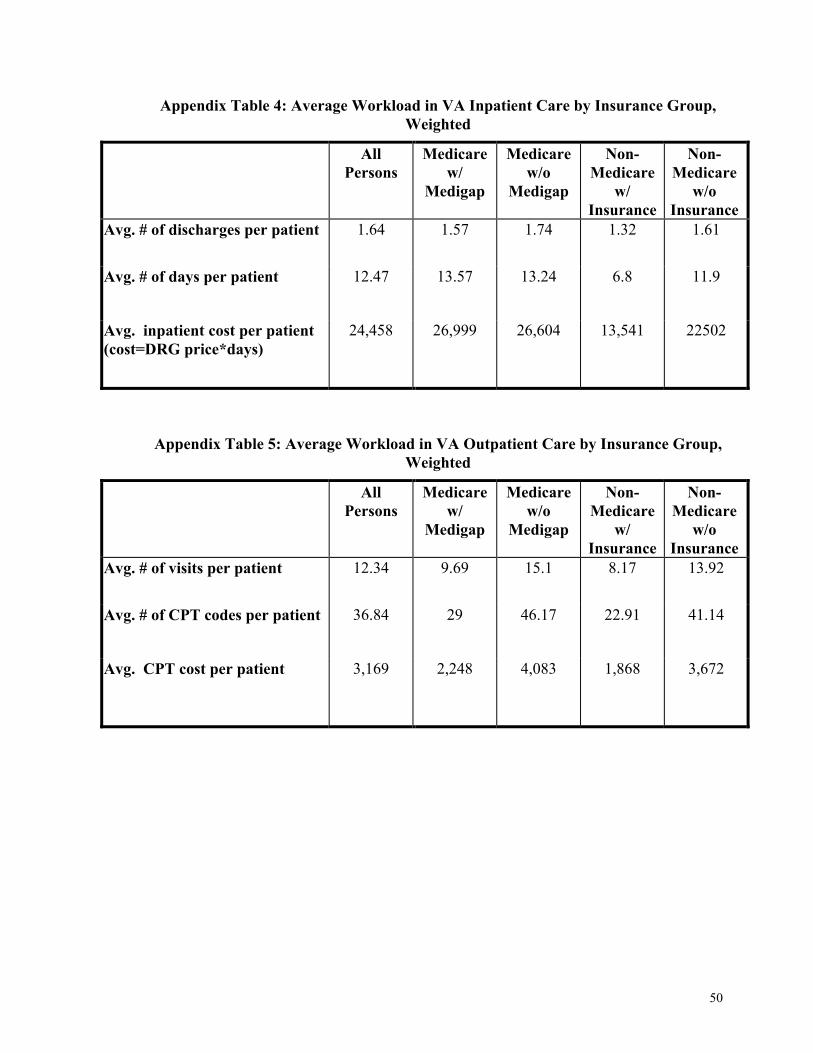
50
Appendix Table 4: Average Workload in VA Inpatient Care by Insurance Group, Weighted
All Persons
Medicare w/
Medigap
Medicare w/o
Medigap
Non-Medicare
w/ Insurance
Non-Medicare
w/o Insurance
Avg. # of discharges per patient 1.64 1.57 1.74 1.32 1.61
Avg. # of days per patient 12.47 13.57 13.24 6.8 11.9
Avg. inpatient cost per patient (cost=DRG price*days)
24,458 26,999 26,604 13,541 22502
Appendix Table 5: Average Workload in VA Outpatient Care by Insurance Group, Weighted
All Persons
Medicare w/
Medigap
Medicare w/o
Medigap
Non-Medicare
w/ Insurance
Non-Medicare
w/o Insurance
Avg. # of visits per patient 12.34 9.69 15.1 8.17 13.92
Avg. # of CPT codes per patient 36.84 29 46.17 22.91 41.14
Avg. CPT cost per patient 3,169 2,248 4,083 1,868 3,672