Embed Size (px)
DESCRIPTION
Christian Erik Kampmann Christian Erik Kampmann [email protected] 2009-09-12 V83 Business Strategies for V83 Business Strategies for Sustainable Innovation A • Does it pay to be first (FMA)? • Systems and sustainability efforts – a • Systems and sustainability efforts a qualitative approach – (Markides and Geroski – and others) – (Sterman et al) – (Marshall and Brown) – (Marshall and Brown)
Citation preview
V83 Business Strategies for V83 Business Strategies for Sustainable Innovation
Christian Erik KampmannChristian Erik [email protected]
2009-09-12
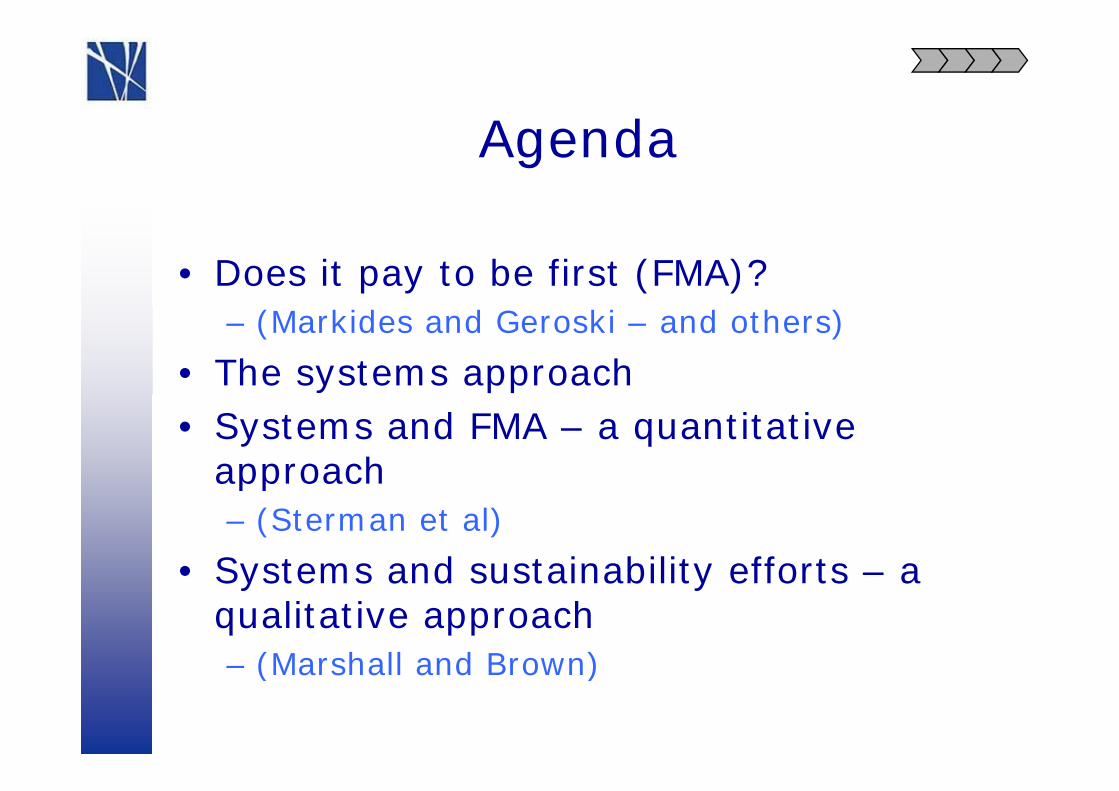
A dAgenda
• Does it pay to be first (FMA)?– (Markides and Geroski – and others)
• The systems approach• Systems and FMA – a quantitative
approach pp– (Sterman et al)
• Systems and sustainability efforts – a • Systems and sustainability efforts a qualitative approach – (Marshall and Brown)– (Marshall and Brown)
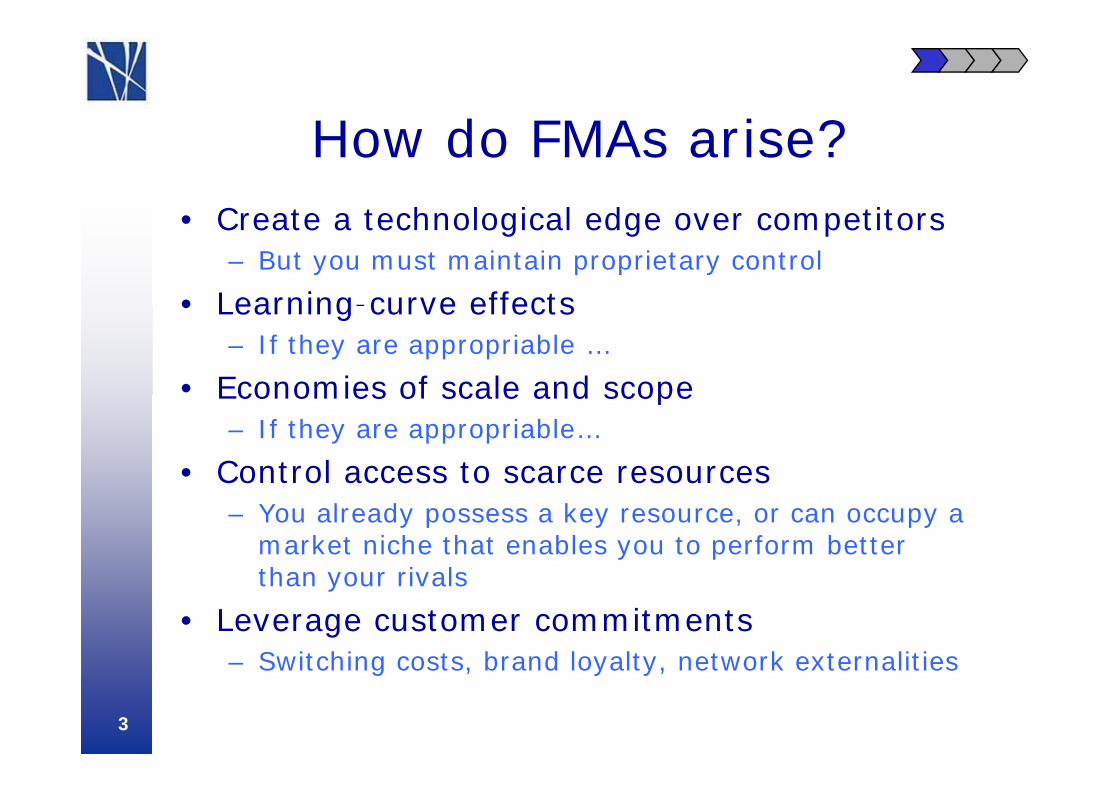
H d FMA i ?How do FMAs arise?• Create a technological edge over competitors• Create a technological edge over competitors
– But you must maintain proprietary control
• Learning-curve effects• Learning curve effects– If they are appropriable …
• Economies of scale and scopeEconomies of scale and scope– If they are appropriable…
• Control access to scarce resources– You already possess a key resource, or can occupy a
market niche that enables you to perform better than your rivalsthan your rivals
• Leverage customer commitments– Switching costs brand loyalty network externalitiesSwitching costs, brand loyalty, network externalities
3
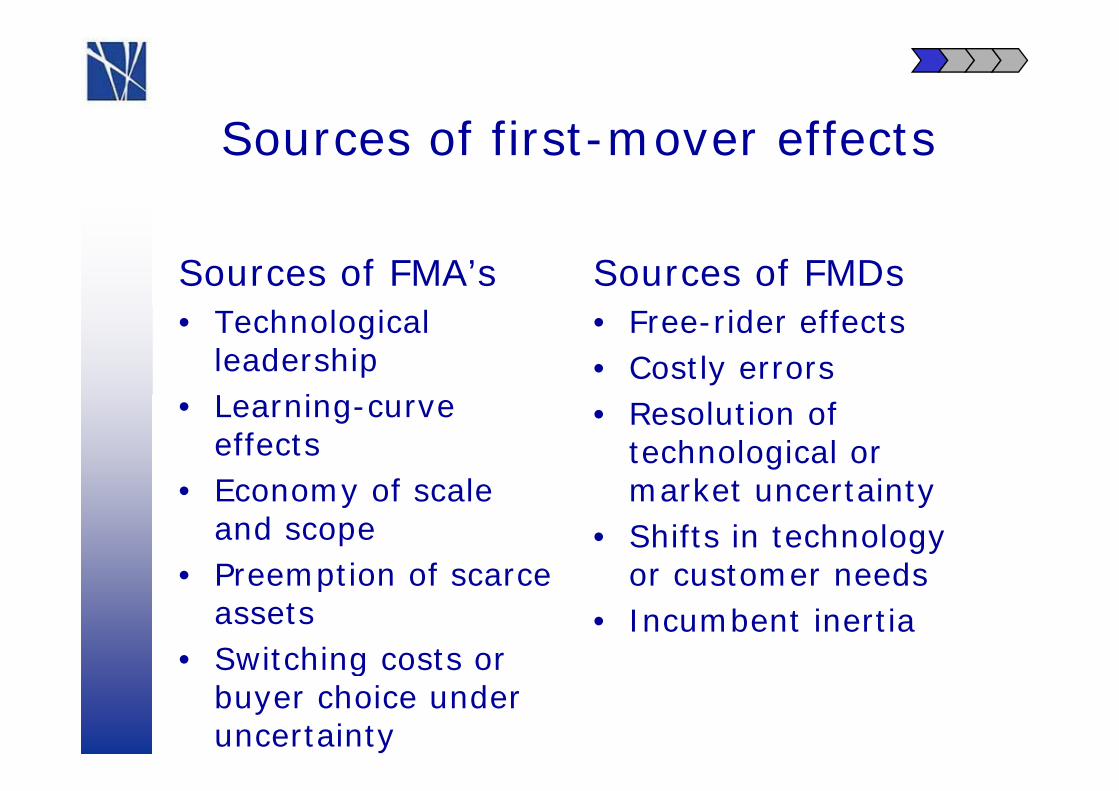
S f fi t ff tSources of first-mover effects
Sources of FMA’s Sources of FMDs• Technological
leadershipL i
• Free-rider effects• Costly errors
• Learning-curve effects
• Economy of scale
• Resolution of technological or market uncertainty• Economy of scale
and scope• Preemption of scarce
market uncertainty• Shifts in technology
or customer needs• Preemption of scarce assets
• Switching costs or
or customer needs• Incumbent inertia
• Switching costs or buyer choice under uncertainty
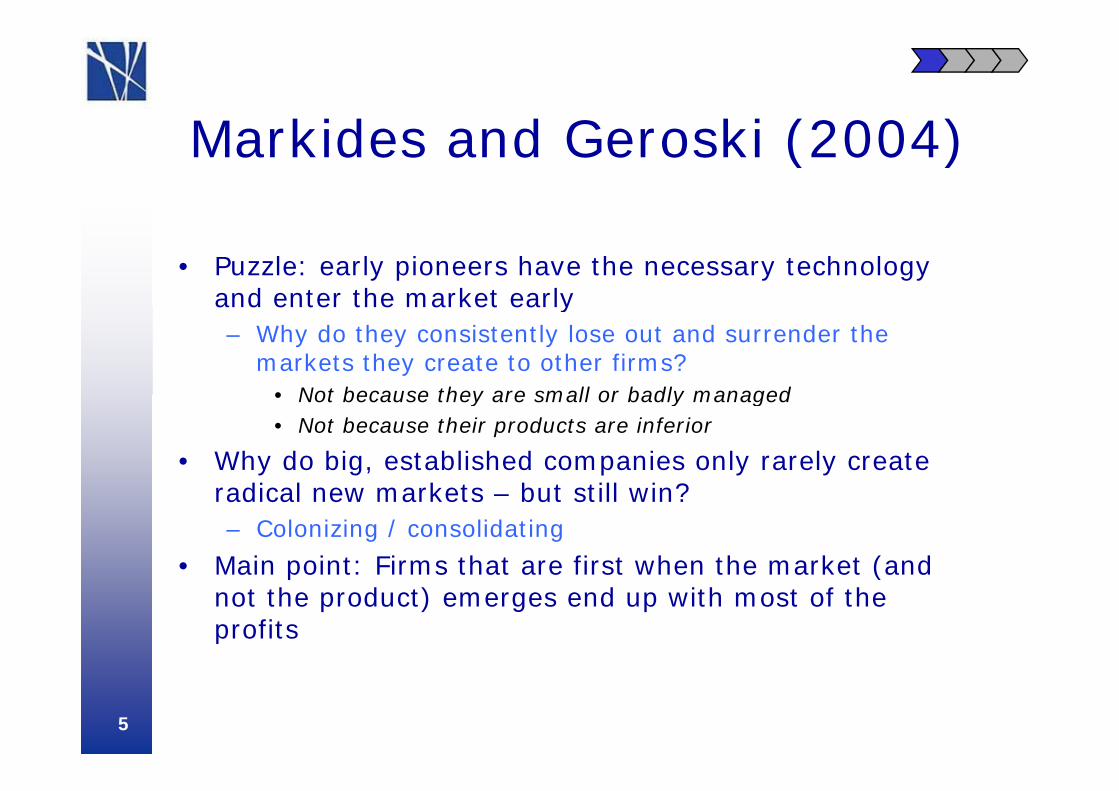
M kid d G ki (2004)Markides and Geroski (2004)
• Puzzle: early pioneers have the necessary technology and enter the market earlyand enter the market early– Why do they consistently lose out and surrender the
markets they create to other firms?• Not because they are small or badly managed• Not because they are small or badly managed• Not because their products are inferior
• Why do big, established companies only rarely create di l k t b t till i ?radical new markets – but still win?
– Colonizing / consolidating
• Main point: Firms that are first when the market (and p (not the product) emerges end up with most of the profits
5
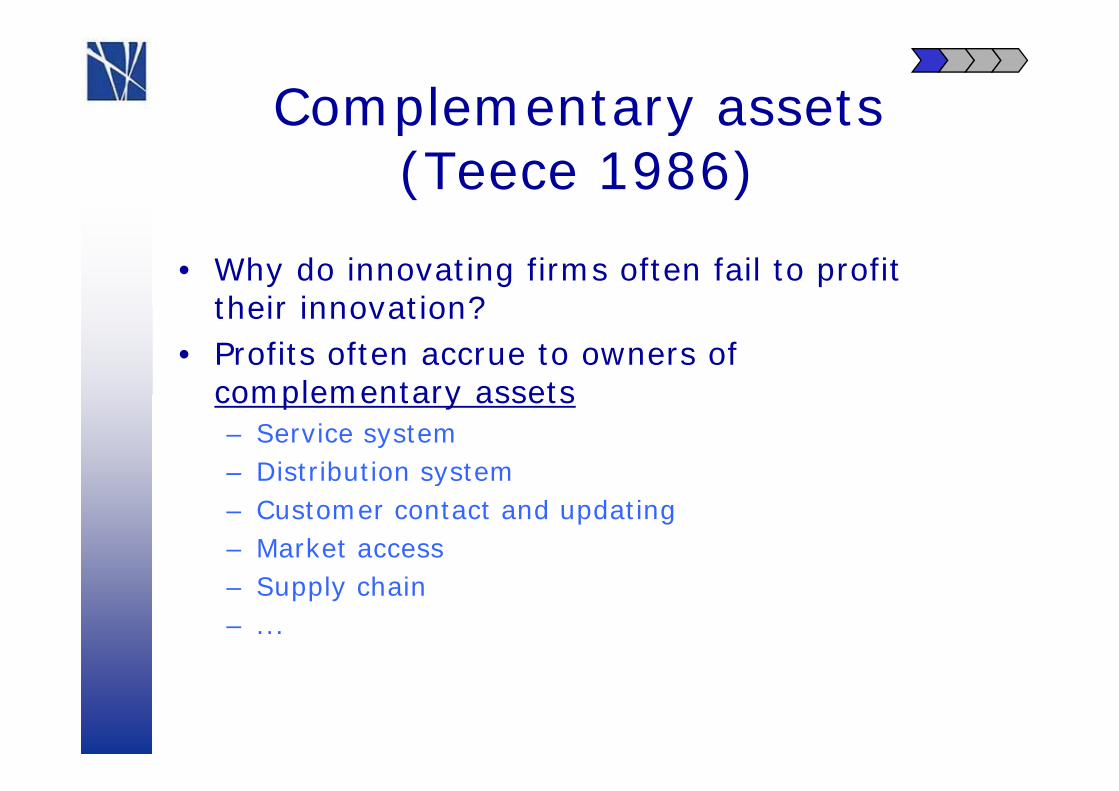
Complementary assets p y(Teece 1986)
• Why do innovating firms often fail to profit their innovation?their innovation?
• Profits often accrue to owners of complementary assetscomplementary assets– Service system– Distribution systemy– Customer contact and updating– Market access– Supply chain– ...
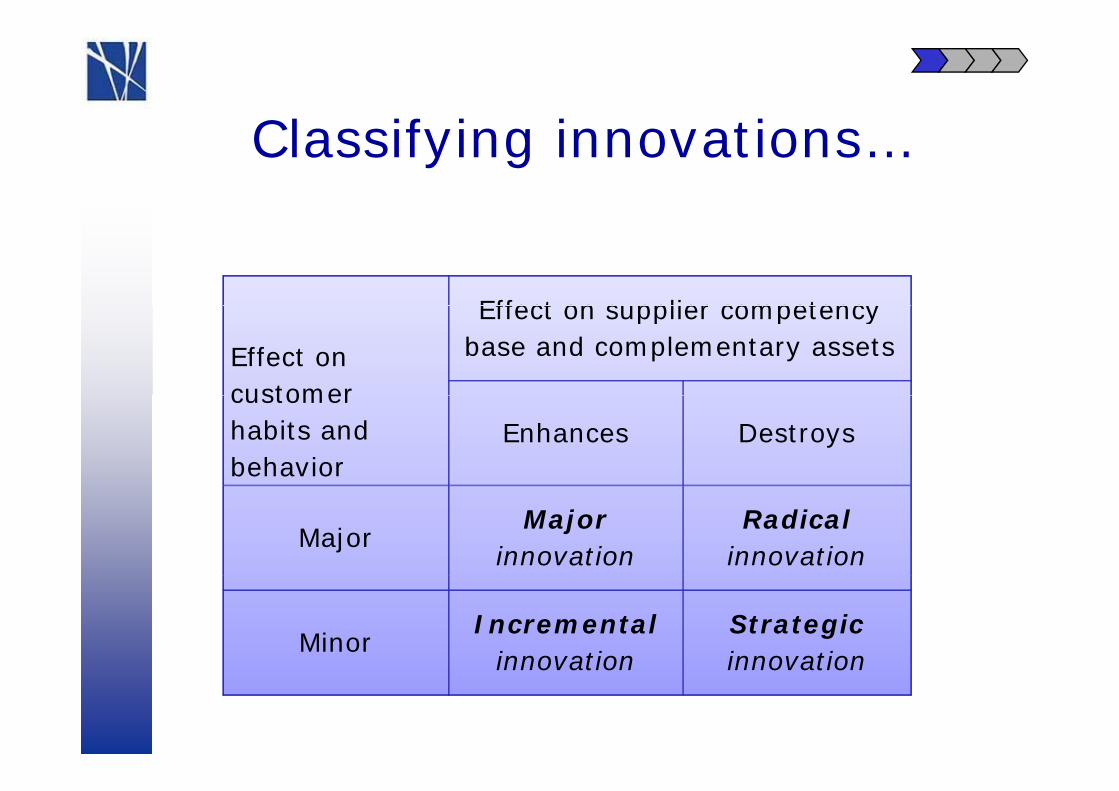
Cl if i i tiClassifying innovations…
Effect on supplier competency
Effect on customer
Effect on supplier competency base and complementary assets
customer habits and behavior
Enhances Destroys
MajorMajor
innovationRadical
innovation
MinorIncremental
innovationStrategicinnovationinnovation innovation
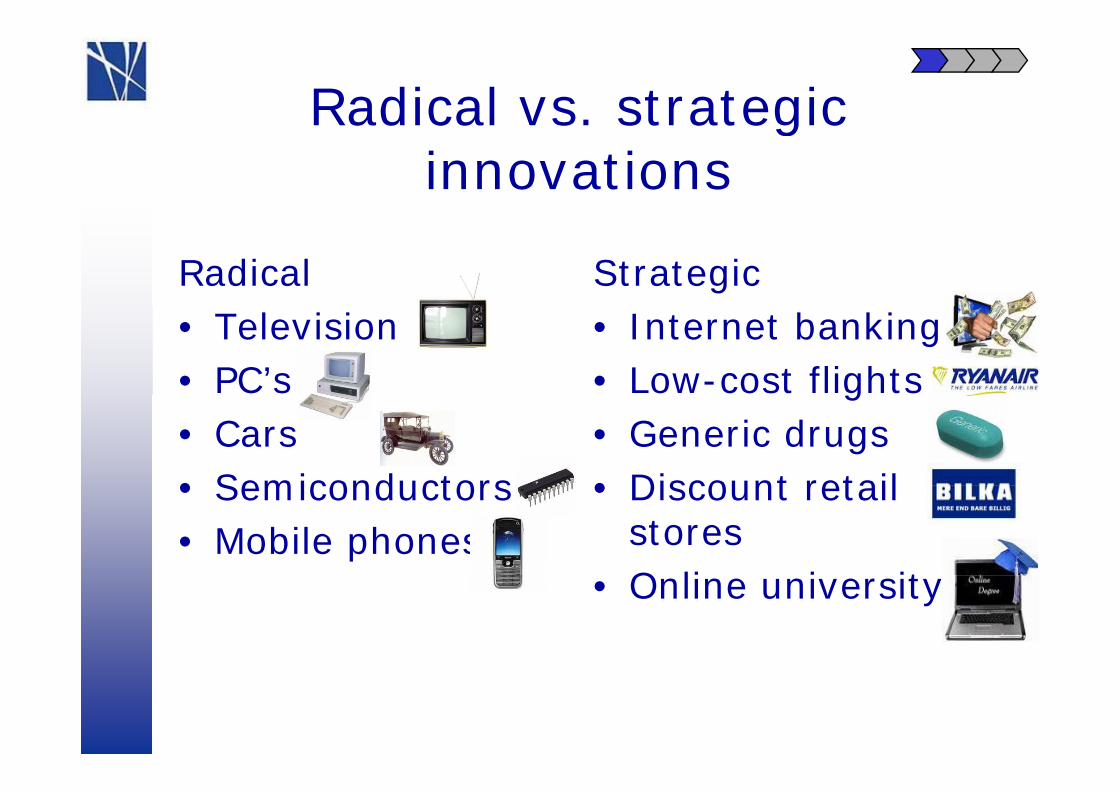
Radical vs. strategic ginnovations
Radical Strategic• Television• PC’s
• Internet banking• Low-cost flights
• Cars• Semiconductors
g• Generic drugs• Discount retail • Semiconductors
• Mobile phones• Discount retail
storesO li i it• Online university
Radical innovations on the horizon...
• Smart grids• Alternative-fuel vehicles• Cradle to crade systems• Cradle-to-crade systems• Distributed energy systems• De-materializing of offerings
Characteristics of radical innovations
• Disrupt both customers and producers• Rarely driven by demand or immediate
need• Lack champions (lead customers or
market leaders))• No one knows…
– what customers really wantwhat customers really want– what technology can do– how to produce it best– how to produce it best
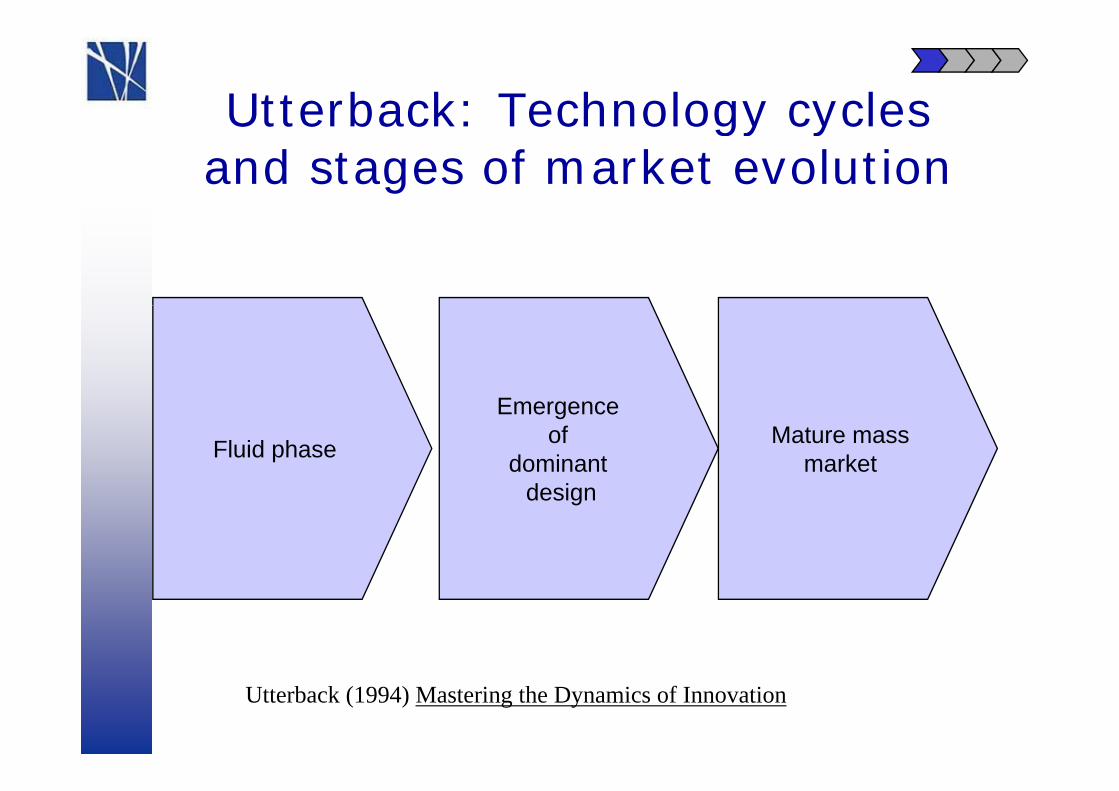
Utterback: Technology cyclesUtterback: Technology cyclesand stages of market evolution
Fluid phase
Emergence of
dominant d i
Mature massmarket
design
Utterback (1994) Mastering the Dynamics of Innovation
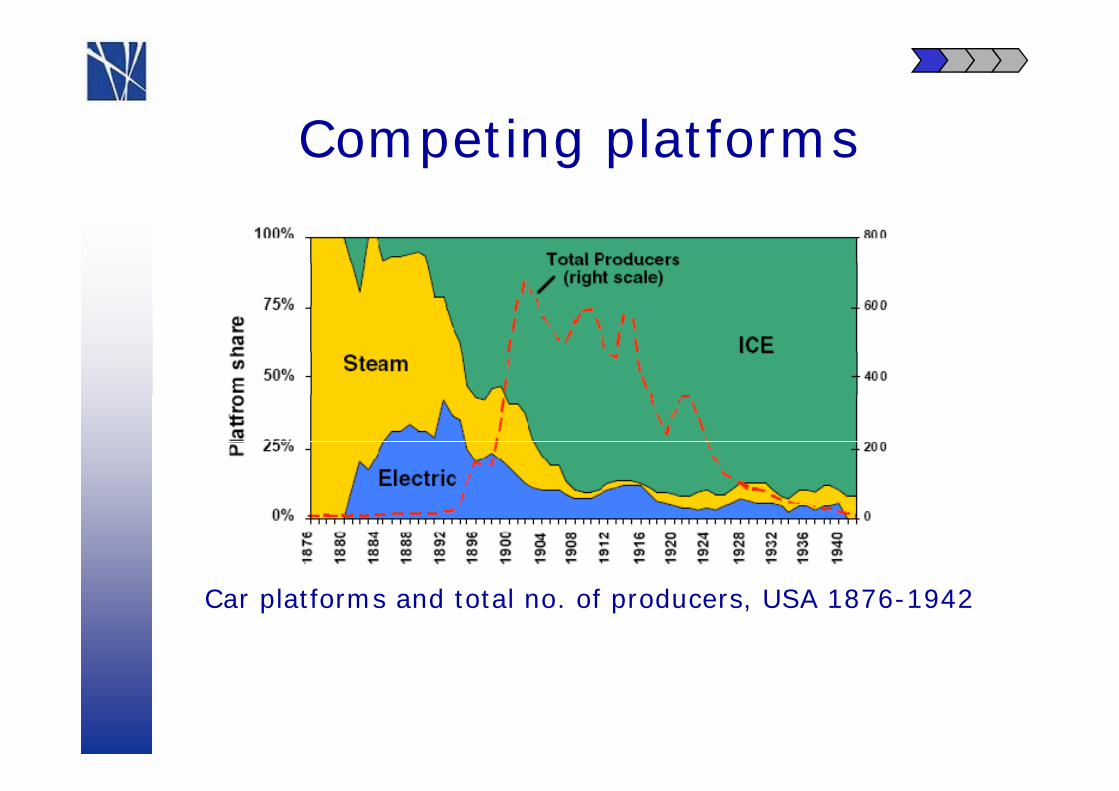
C ti l tfCompeting platforms
Car platforms and total no. of producers, USA 1876-1942
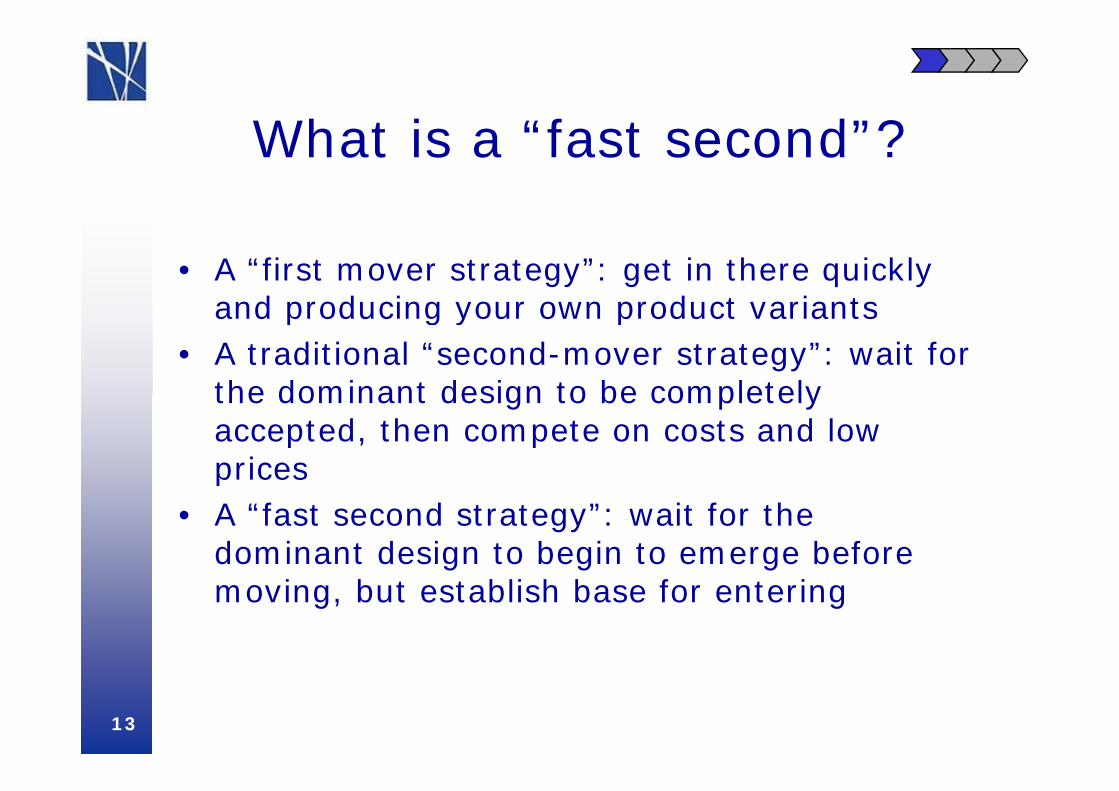
Wh t i “f t d”?What is a “fast second”?
• A “first mover strategy”: get in there quickly and producing your own product variantsand producing your own product variants
• A traditional “second-mover strategy”: wait for the dominant design to be completely the dominant design to be completely accepted, then compete on costs and low pricesp
• A “fast second strategy”: wait for the dominant design to begin to emerge before moving, but establish base for entering
13
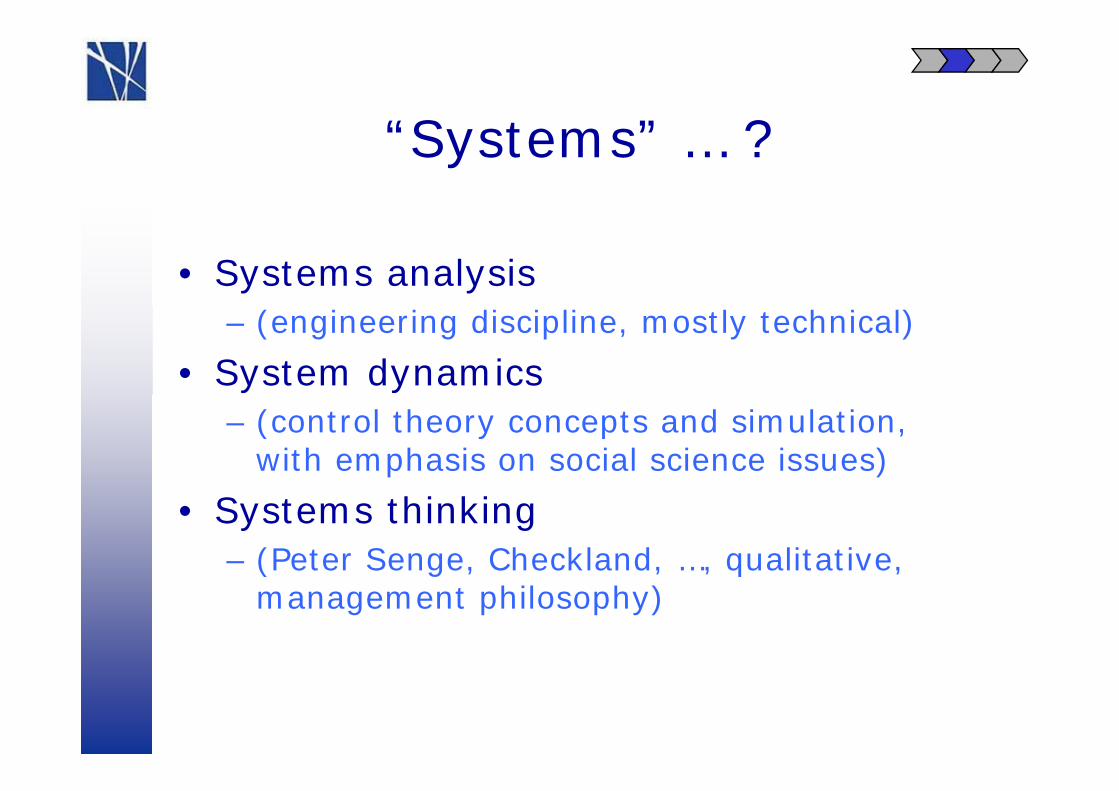
“S t ” ?“Systems” … ?
• Systems analysis – (engineering discipline, mostly technical)
• System dynamics – (control theory concepts and simulation,
with emphasis on social science issues)
• Systems thinking – (Peter Senge, Checkland, …, qualitative, ( g , , , q ,
management philosophy)
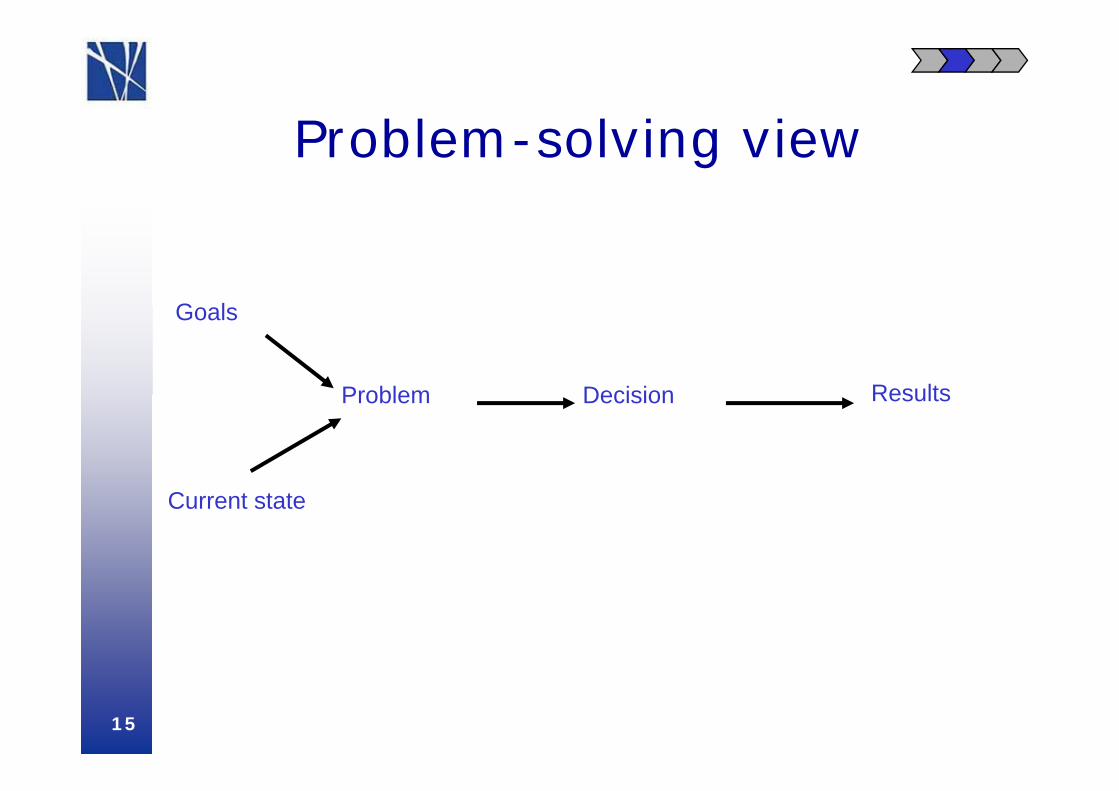
P bl l i iProblem-solving view
G lGoals
Problem Decision ResultsProblem Decision Results
Current state
15

F db k iFeedback view
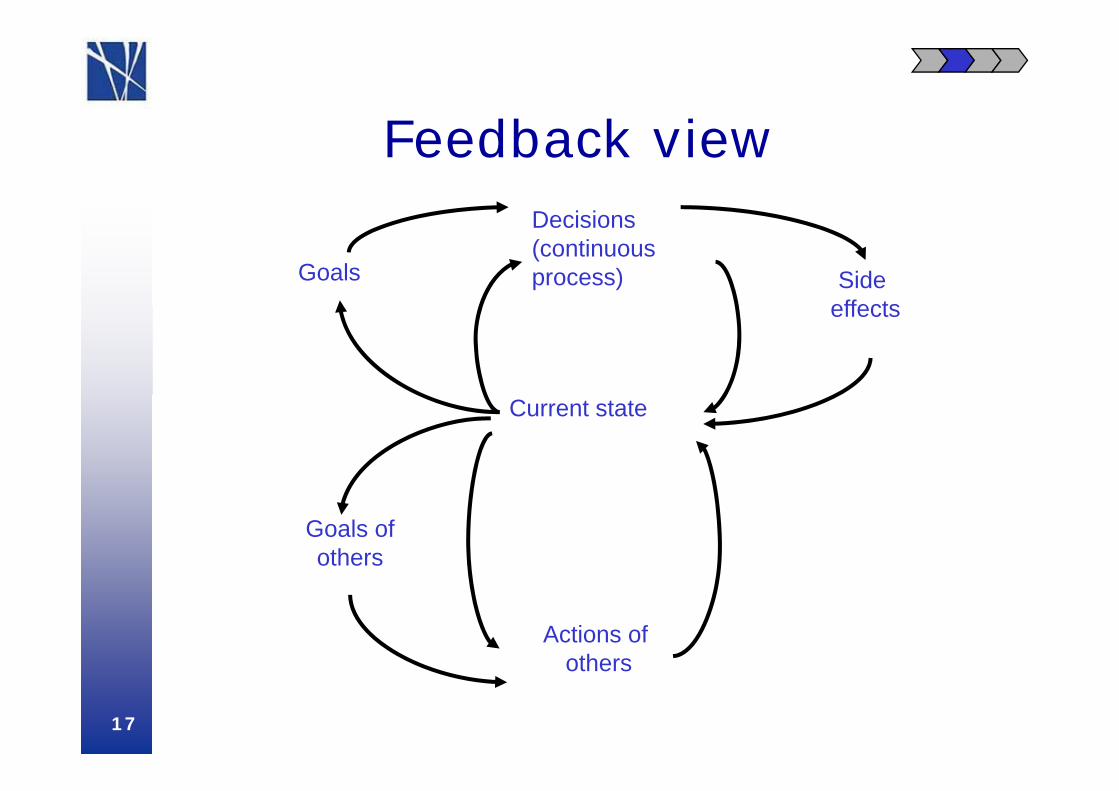
F db k iFeedback viewDecisions
Goals
Decisions(continuous process) Side
effectseffects
Current state
Goals ofothers
Actions of others
17
others
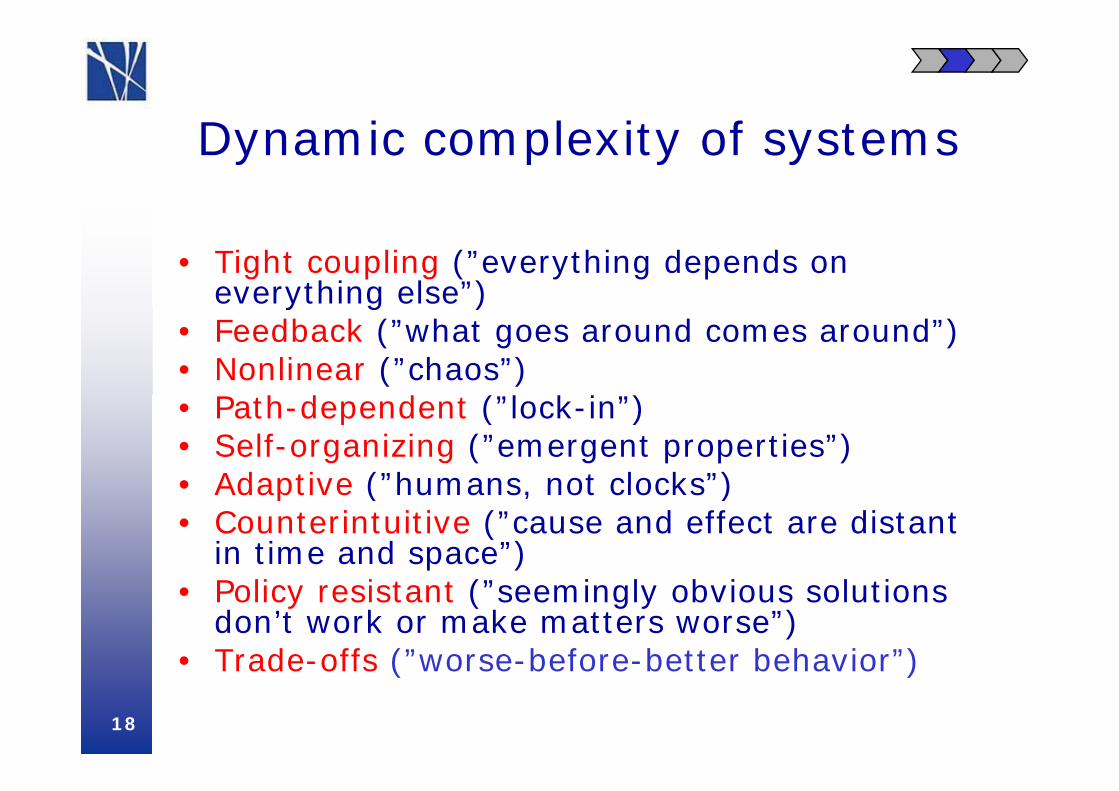
D i l it f tDynamic complexity of systems
• Tight coupling (”everything depends on everything else”)y g )
• Feedback (”what goes around comes around”)• Nonlinear (”chaos”)
P h d d (”l k i ”)• Path-dependent (”lock-in”)• Self-organizing (”emergent properties”)• Adaptive (”humans not clocks”)• Adaptive ( humans, not clocks )• Counterintuitive (”cause and effect are distant
in time and space”)• Policy resistant (”seemingly obvious solutions
don’t work or make matters worse”)• Trade-offs (”worse-before-better behavior”)• Trade offs ( worse before better behavior )
18
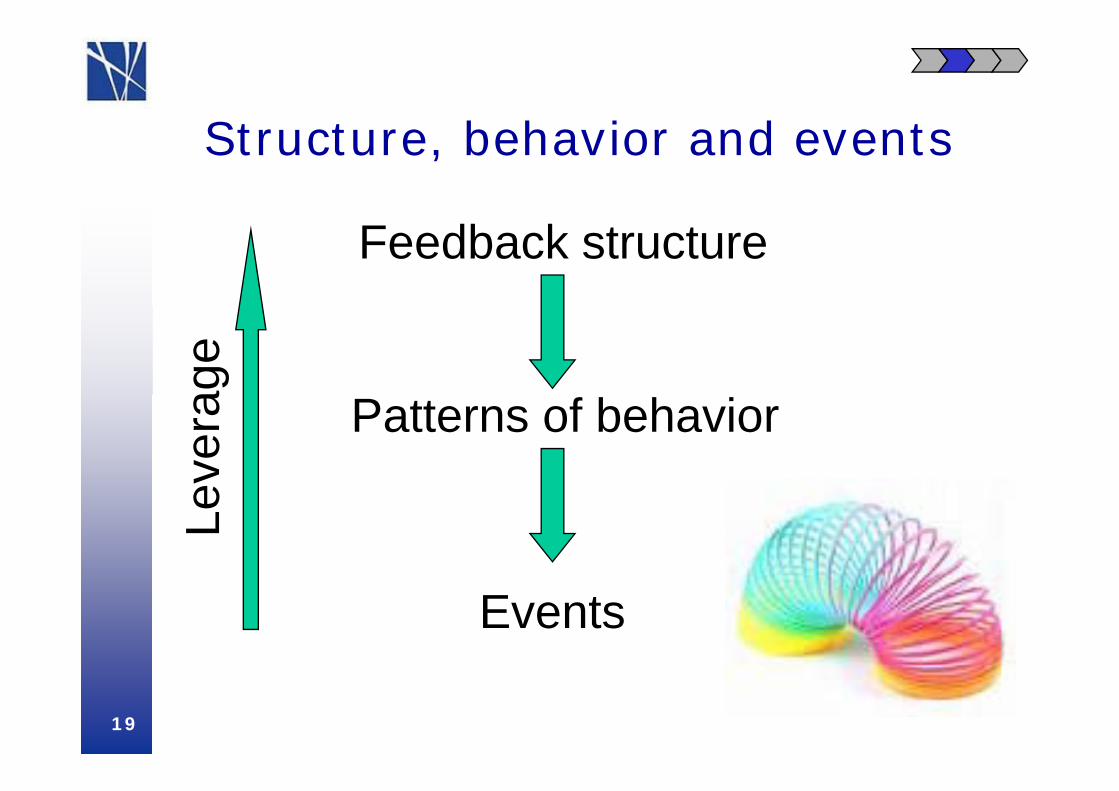
St t b h i d tStructure, behavior and events
Feedback structureag
e
Patterns of behavior
vera
Le
Events
19
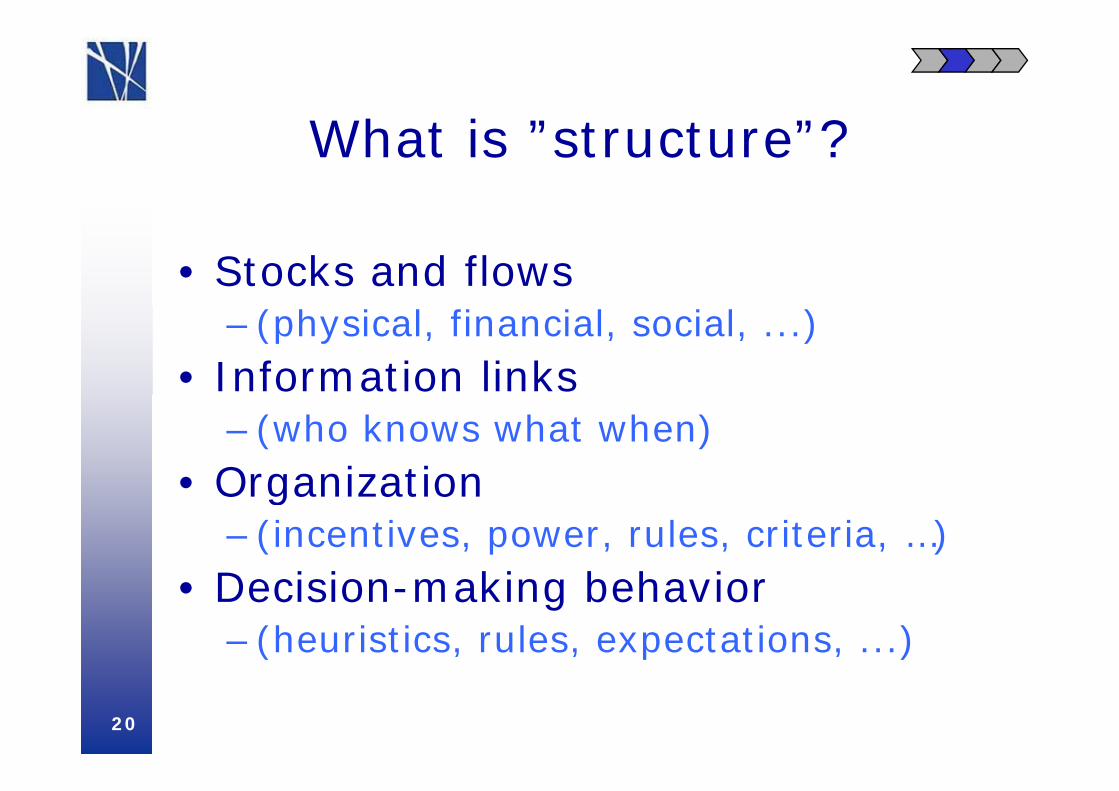
Wh t i ” t t ”?What is ”structure”?
• Stocks and flows – (physical, financial, social, ...)
• Information links– (who knows what when)
• Organization• Organization– (incentives, power, rules, criteria, …)D i i ki b h i• Decision-making behavior– (heuristics, rules, expectations, ...)
20
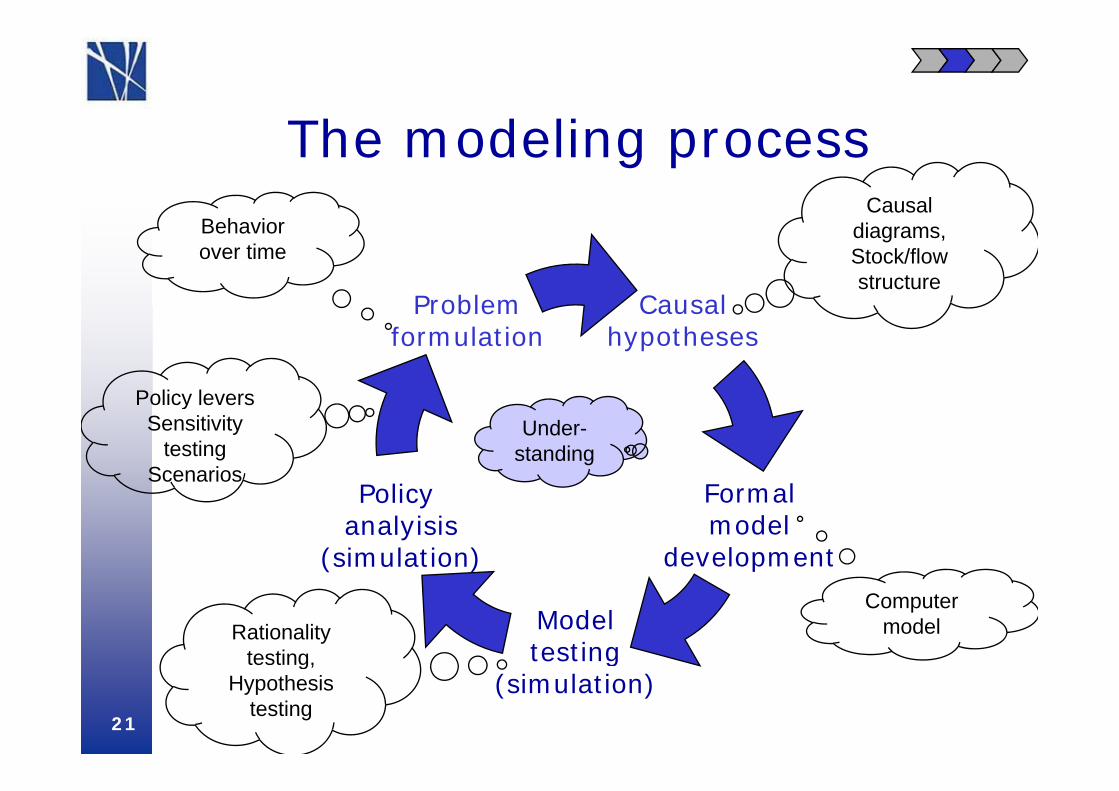
Th d liThe modeling processCausal
Problem Causal
Behavior over time
diagrams,Stock/flow structure
Problemformulation
Causalhypotheses
Policy levers
P li F l
Policy leversSensitivity
testingScenarios
Under-standing
Policy analyisis
(simulation)
Formalmodel
development
Modeltesting
Computer modelRationality
testing, g(simulation)
21
test g,Hypothesis
testing
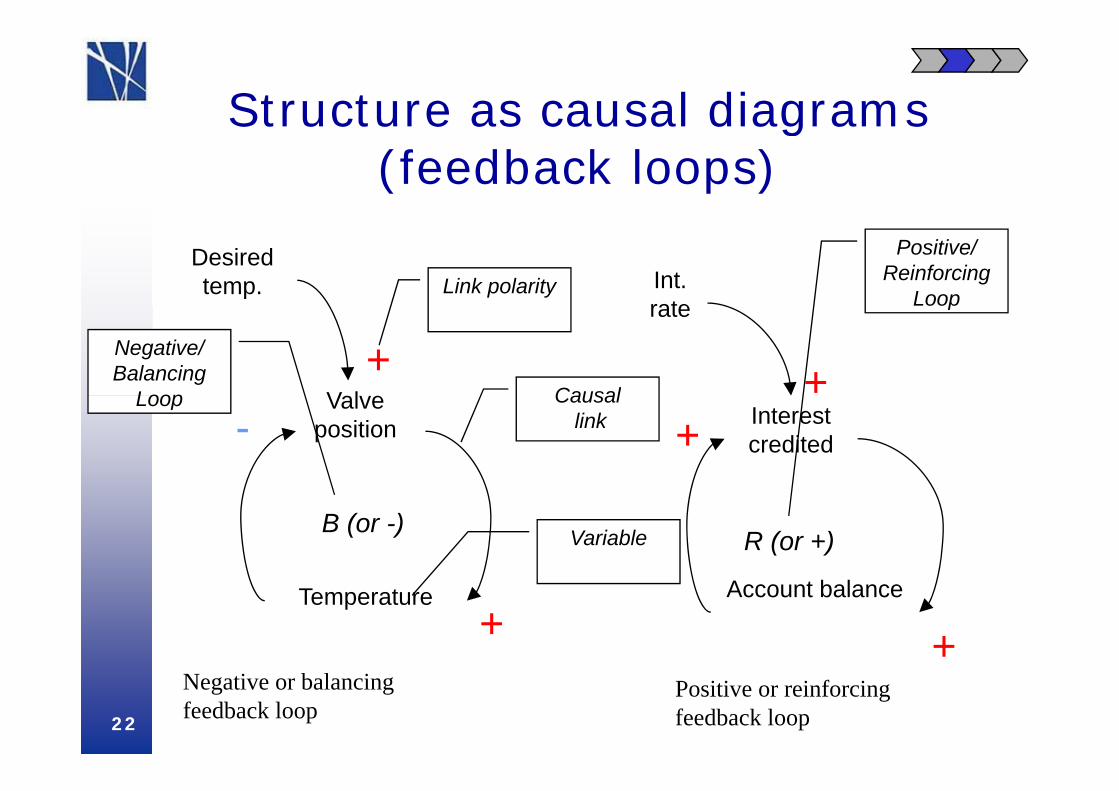
Structure as causal diagrams Structure as causal diagrams (feedback loops)
Desiredtemp. Int.
rateLink polarity
Positive/Reinforcing
Looprate
V l+ +Causal
Negative/Balancing
Loop
oop
Interestcredited
Valveposition- +
Causallink
Loop
R (or +)B (or -) Variable
Temperature Account balance
+ +22
Negative or balancingfeedback loop
Positive or reinforcingfeedback loop
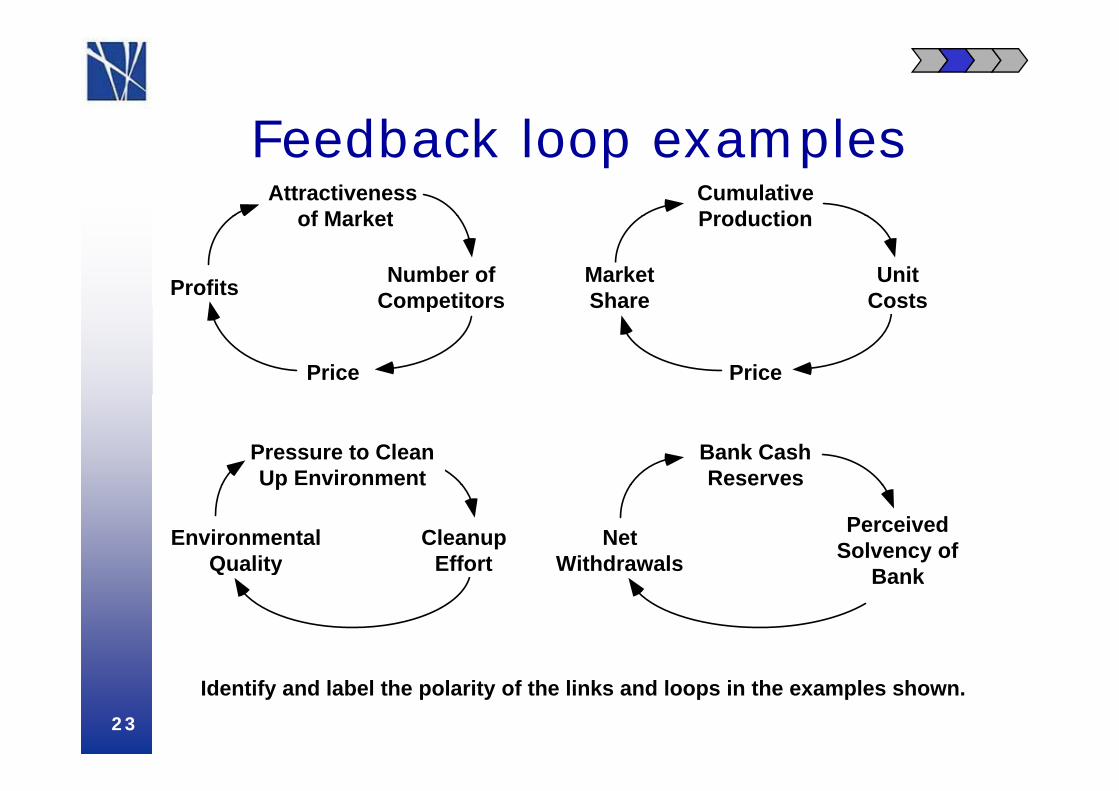
F db k l lAttractiveness
of MarketCumulativeProduction
Feedback loop examples
Profits Number ofCompetitors
of Market Production
MarketShare
UnitCostsCompetitors
Price Price
Share Costs
Bank CashReserves
Pressure to CleanUp Environment ese es
PerceivedSolvency of
Bank
NetWithdrawals
CleanupEffort
EnvironmentalQuality
Up o e t
Banky
Identify and label the polarity of the links and loops in the examples shown.23
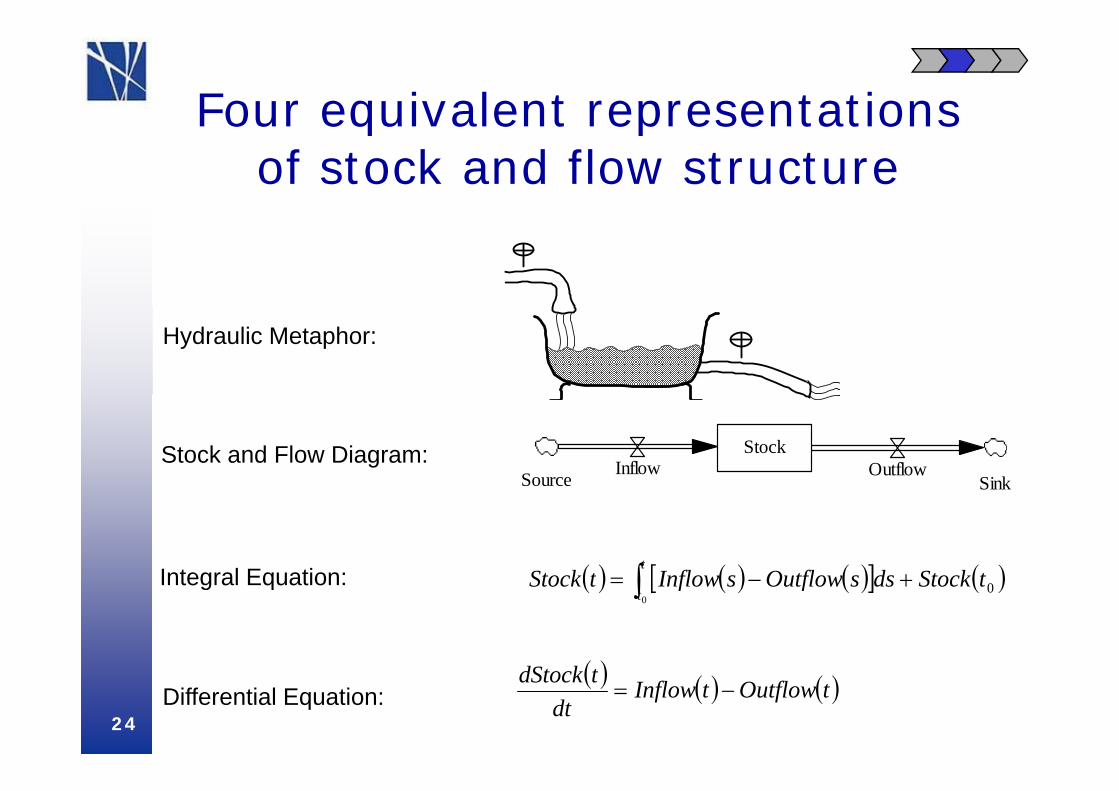
Four equivalent representationsFour equivalent representationsof stock and flow structure
Hydraulic Metaphor:
Stock and Flow Diagram: StockInflow OutflowSource Sink
Integral Equation:
Source Sink
tSt kdO tflI fltSt kt
Integral Equation: 00
tStockdssOutflowsInflowtStockt
Differential Equation:
tOutflowtInflowdt
tdStock
24
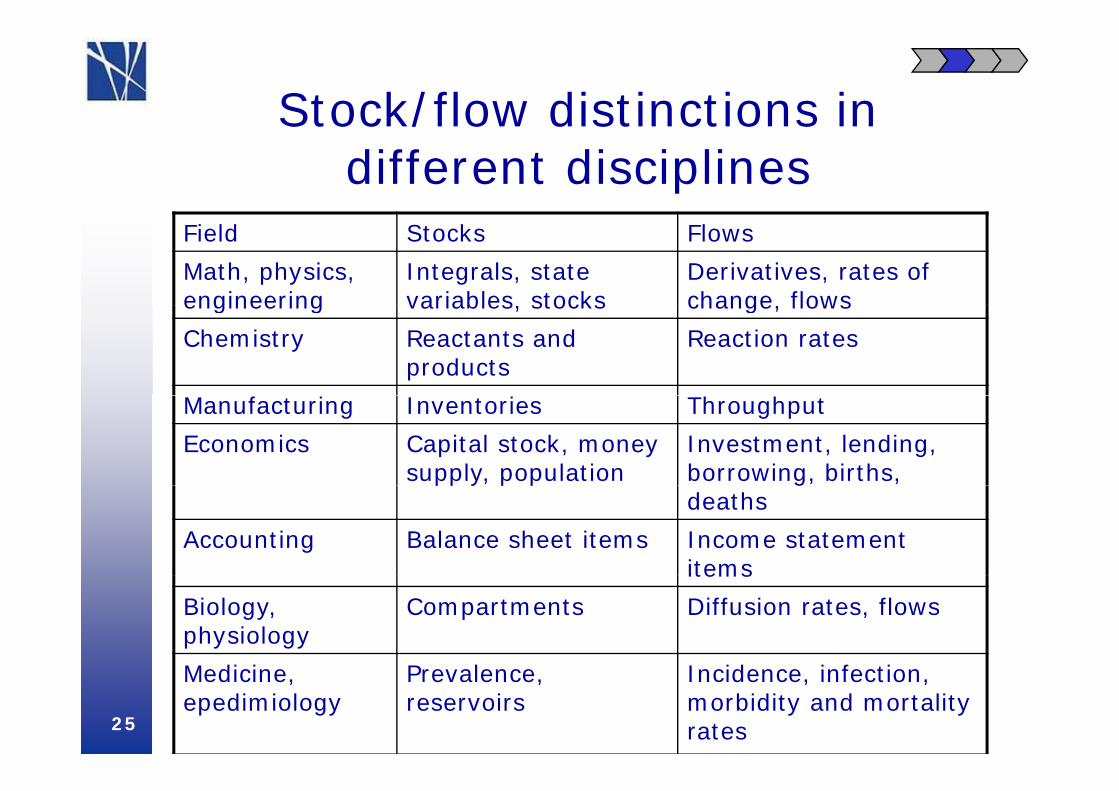
Stock/flow distinctions in Stock/flow distinctions in different disciplines
Field Stocks Flows
Math, physics, engineering
Integrals, state variables, stocks
Derivatives, rates of change, flowsengineering variables, stocks change, flows
Chemistry Reactants and products
Reaction rates
fManufacturing Inventories Throughput
Economics Capital stock, money supply, population
Investment, lending, borrowing, births, pp y p p gdeaths
Accounting Balance sheet items Income statement itemsitems
Biology, physiology
Compartments Diffusion rates, flows
M di i P l I id i f i Medicine, epedimiology
Prevalence, reservoirs
Incidence, infection, morbidity and mortality rates25
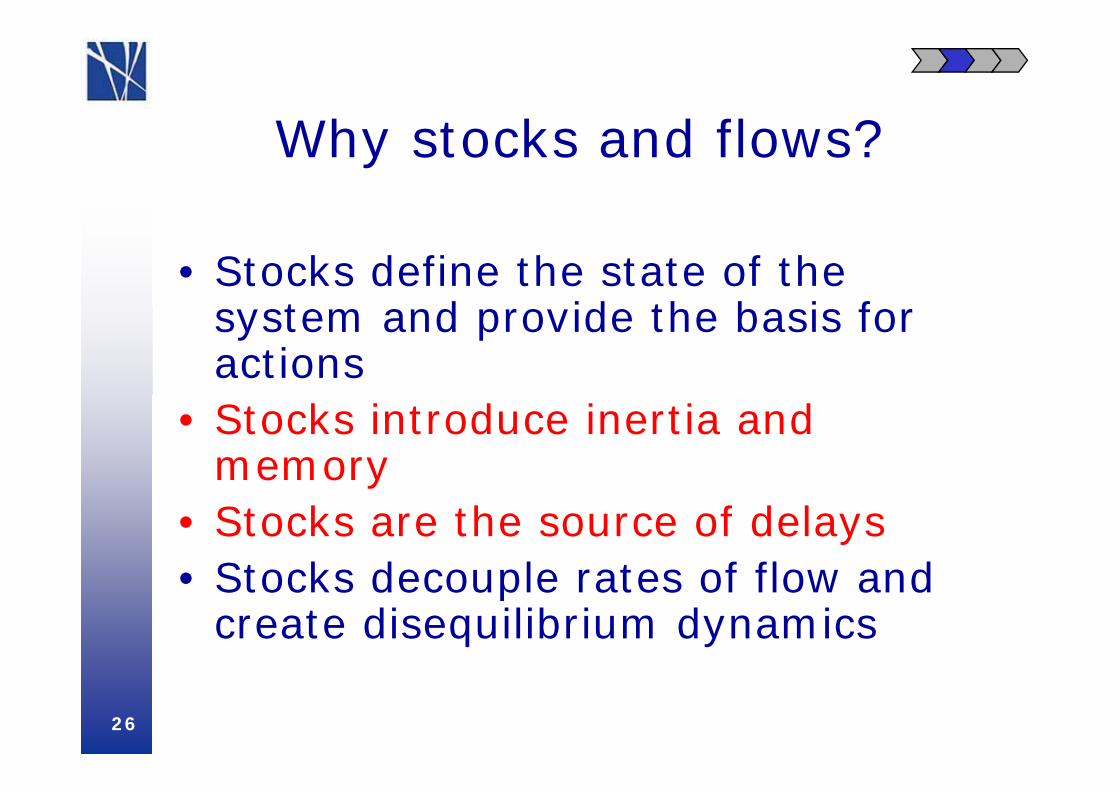
Wh t k d fl ?Why stocks and flows?
• Stocks define the state of the t d id th b i f system and provide the basis for
actions• Stocks introduce inertia and
memoryy• Stocks are the source of delays• Stocks decouple rates of flow and • Stocks decouple rates of flow and
create disequilibrium dynamics
26
6
8
issi
ons
ear)
CO24
6
ogen
ic C
O2 E
mi
on m
etric
tons
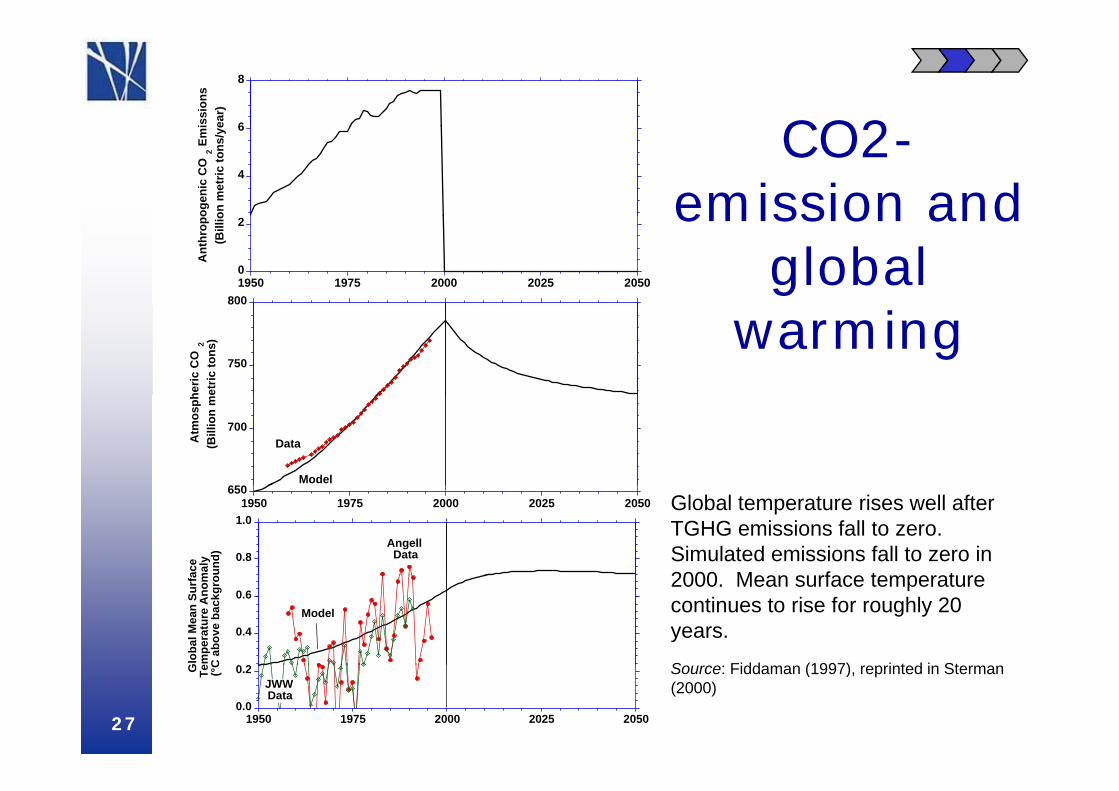
/ye CO2-emission and
0
2
1950 1975 2000 2025 2050
Ant
hrop
o(B
illio
800
emission and global
750
heric
CO
2 et
ric to
ns) warming
650
700
Atm
osph
(Bill
ion
m
Data
Model
Global temperature rises well after TGHG emissions fall to zero. Simulated emissions fall to zero in 2000 M f t t
6501950 1975 2000 2025 2050
0.8
1.0
ace
mal
y un
d)
Angell Data
2000. Mean surface temperature continues to rise for roughly 20 years.
S Fidd (1997) i t d i St0 2
0.4
0.6
Glo
bal M
ean
Surf
aem
pera
ture
Ano
mC
abo
ve b
ackg
ro
Model
Source: Fiddaman (1997), reprinted in Sterman (2000)
0.0
0.2
1950 1975 2000 2025 2050
G Te (°C
JWW Data
27
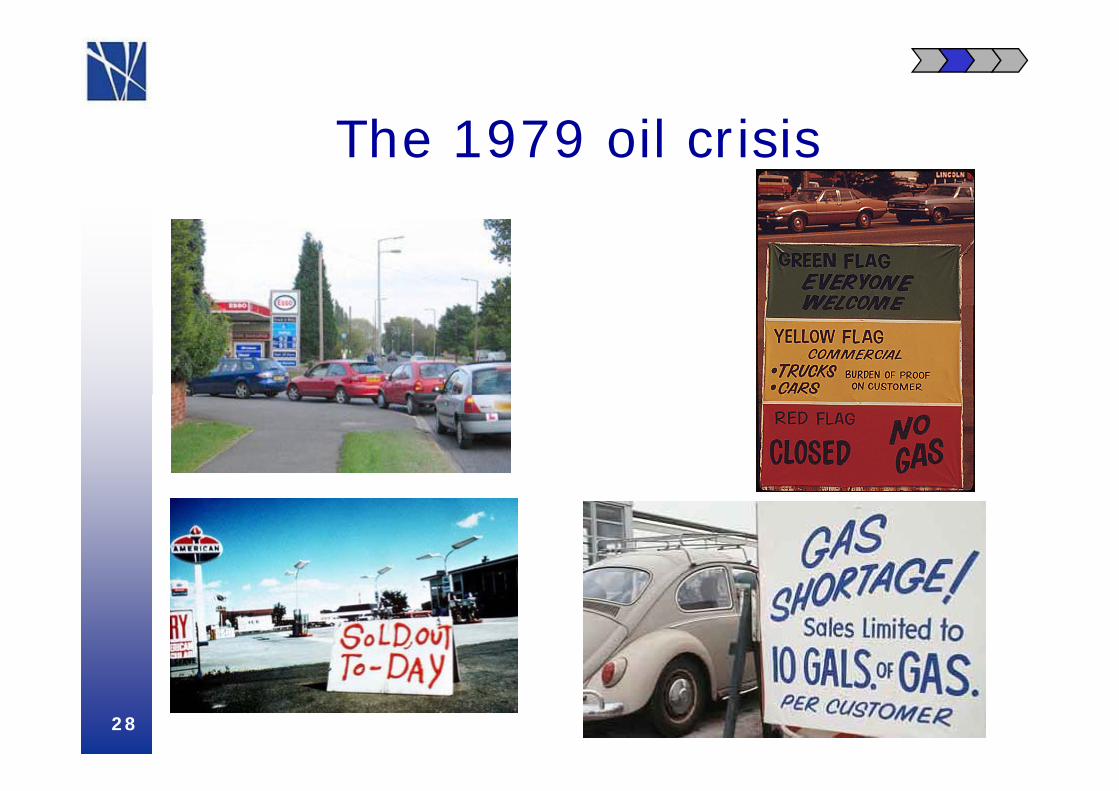
Th 1979 il i iThe 1979 oil crisis
28
P li Policy responses
• Odd/even days linked to license plate numbers
• Maximum purchase each time ($ • Maximum purchase each time ($ or gallons)
29
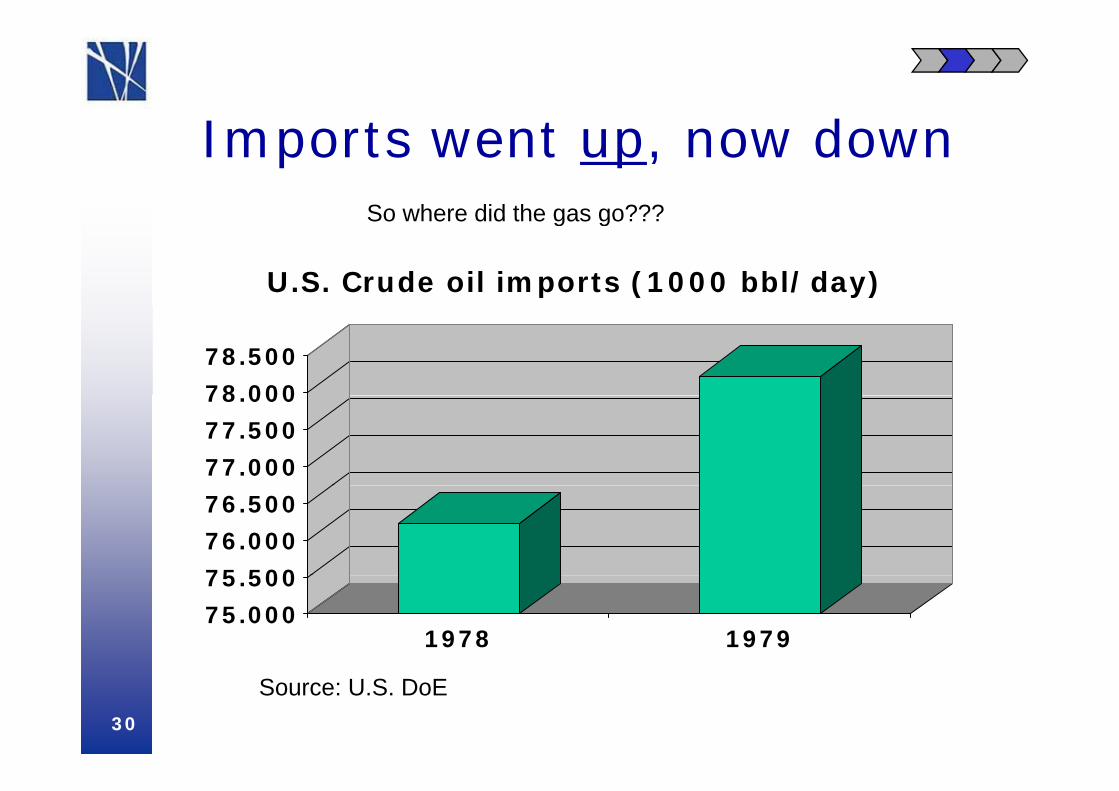
I t t dImports went up, now downSo where did the gas go???
U.S. Crude oil imports (1000 bbl/day)
So where did the gas go???
78 000
78.500
77.000
77.500
78.000
75 500
76.000
76.500
75.000
75.500
1978 1979
30
Source: U.S. DoE
P i iPair up exercise
• What was/were the key cause/causes of the gas shortage?
• Do you think the policies worked?• Do you think the policies worked?• Why/why not?• Alternative policies that might
work better?work better?
31
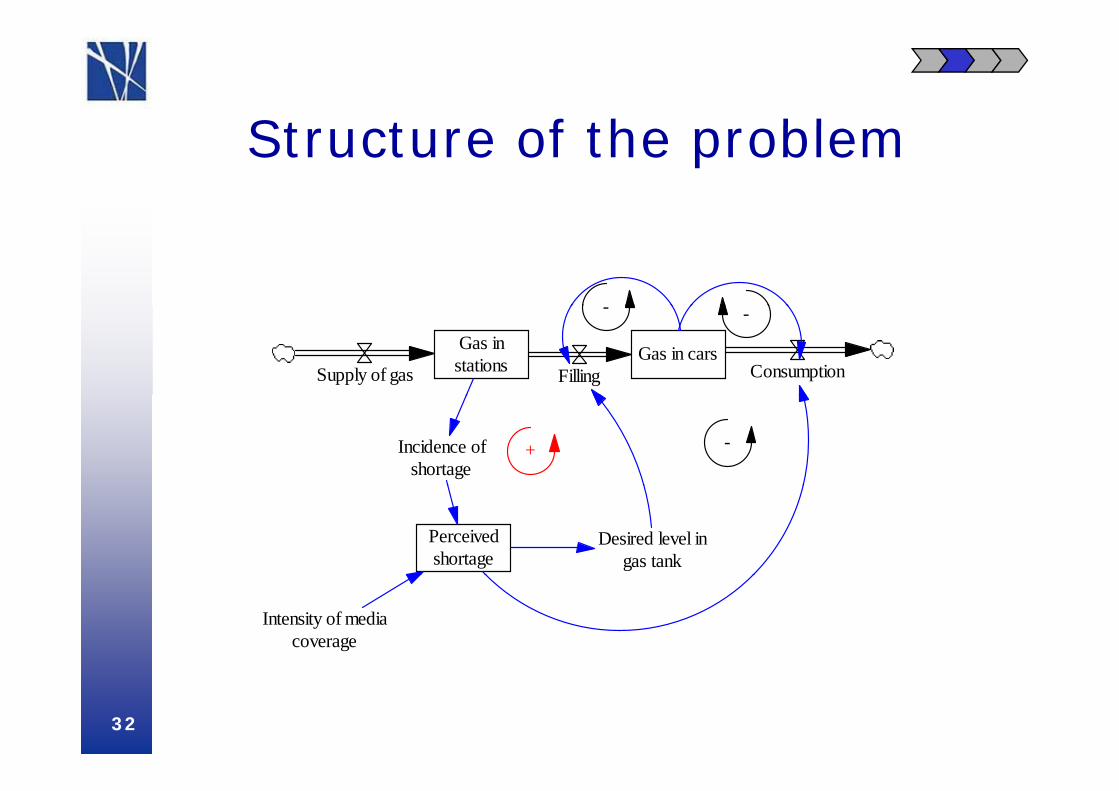
St t f th blStructure of the problem
Gas in carsGas instationsSupply of gas Filling Consumption
--
Incidence ofshortage
+ -
Perceivedshortage
Desired level ingas tank
Intensity of mediacoverage
32
St t l (2007)Sterman et al (2007)
• Example of quantitative system dynamics study
• Explores the challenges of the “get • Explores the challenges of the get big fast” strategy often dictated by neoclassical perspectives on FMAneoclassical perspectives on FMA
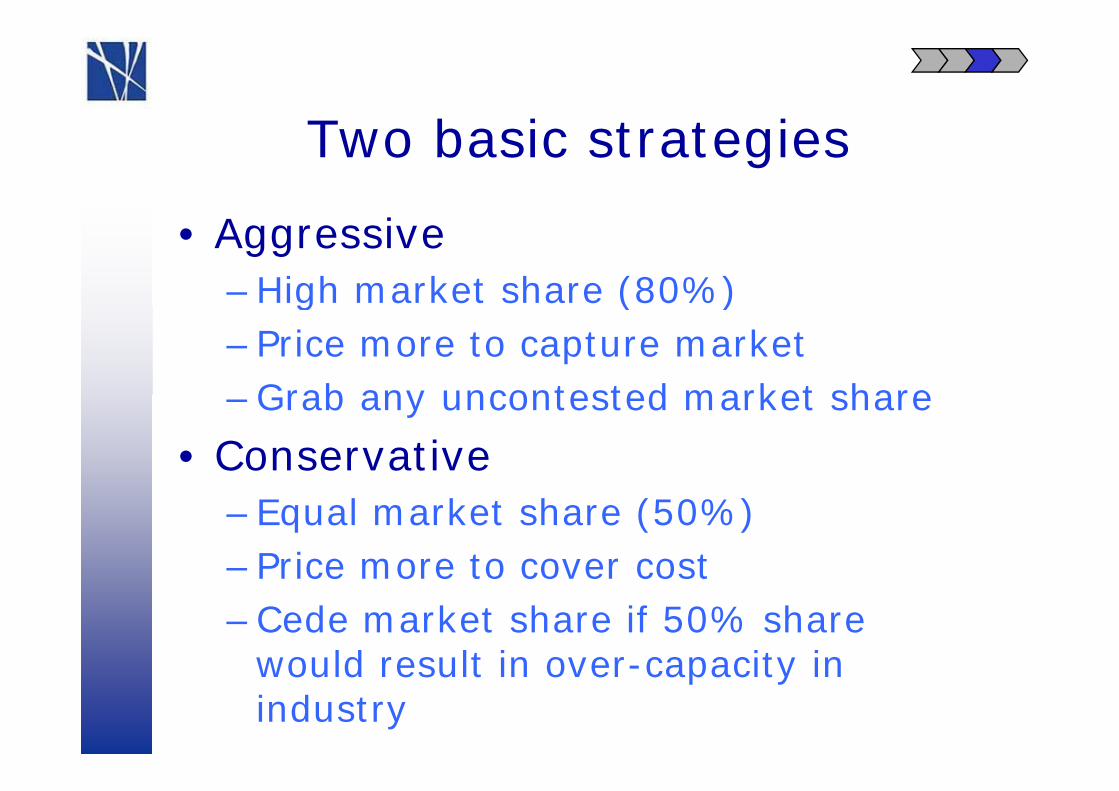
T b i t t iTwo basic strategies
• Aggressive–High market share (80%)g ( )–Price more to capture market
Grab any uncontested market share–Grab any uncontested market share
• Conservative–Equal market share (50%)–Price more to cover costPrice more to cover cost–Cede market share if 50% share
would result in over-capacity in would result in over-capacity in industry
Fi t l t’ b ild d lFirst, let’s build a model…
• Vensim Bass model• Extension
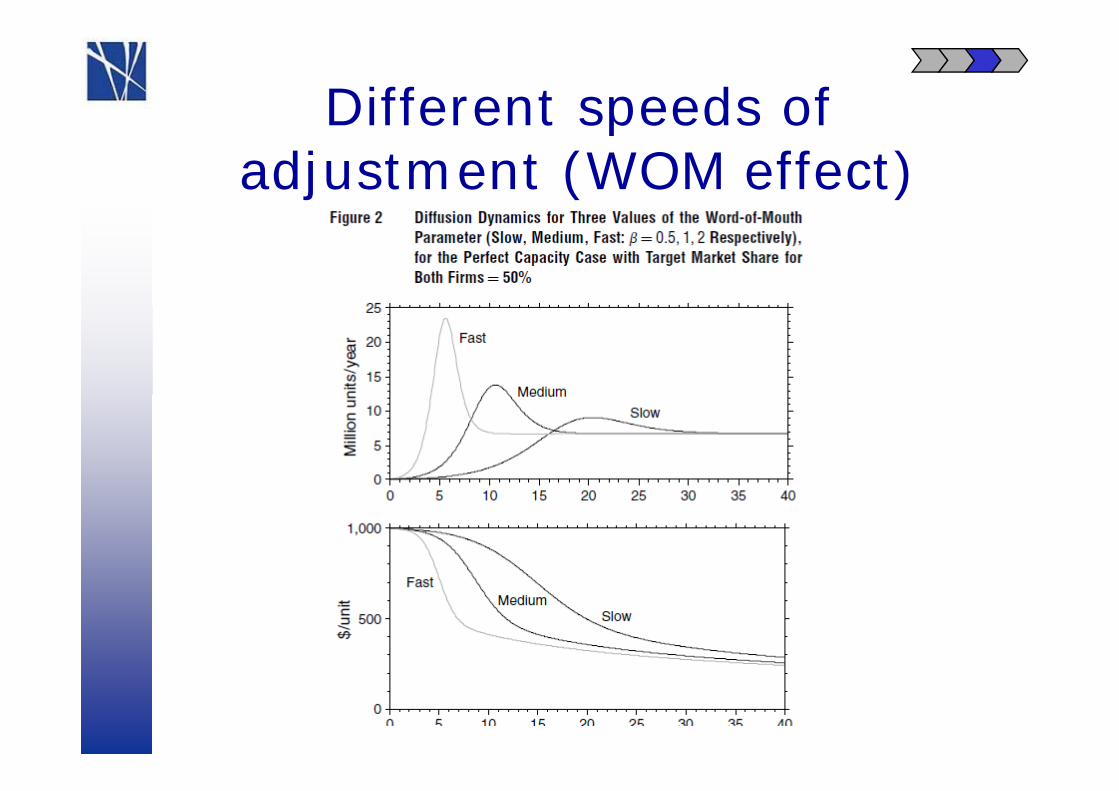
Different speeds of padjustment (WOM effect)
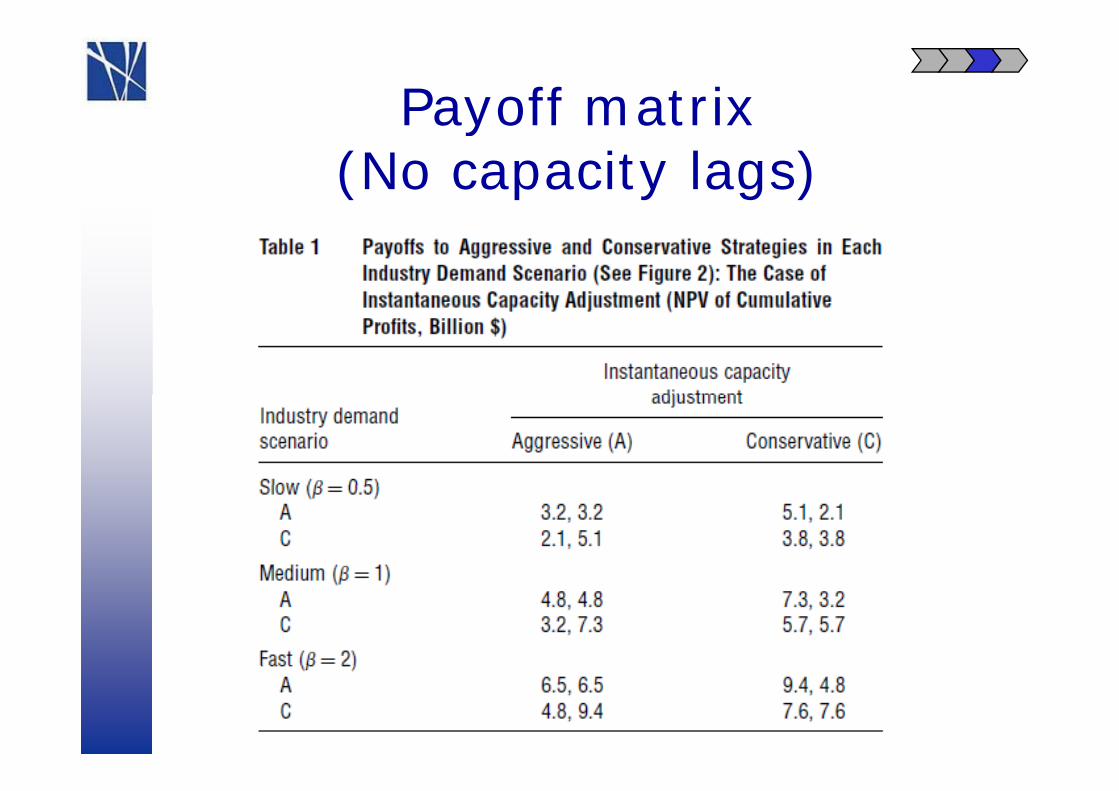
Payoff matrixy(No capacity lags)
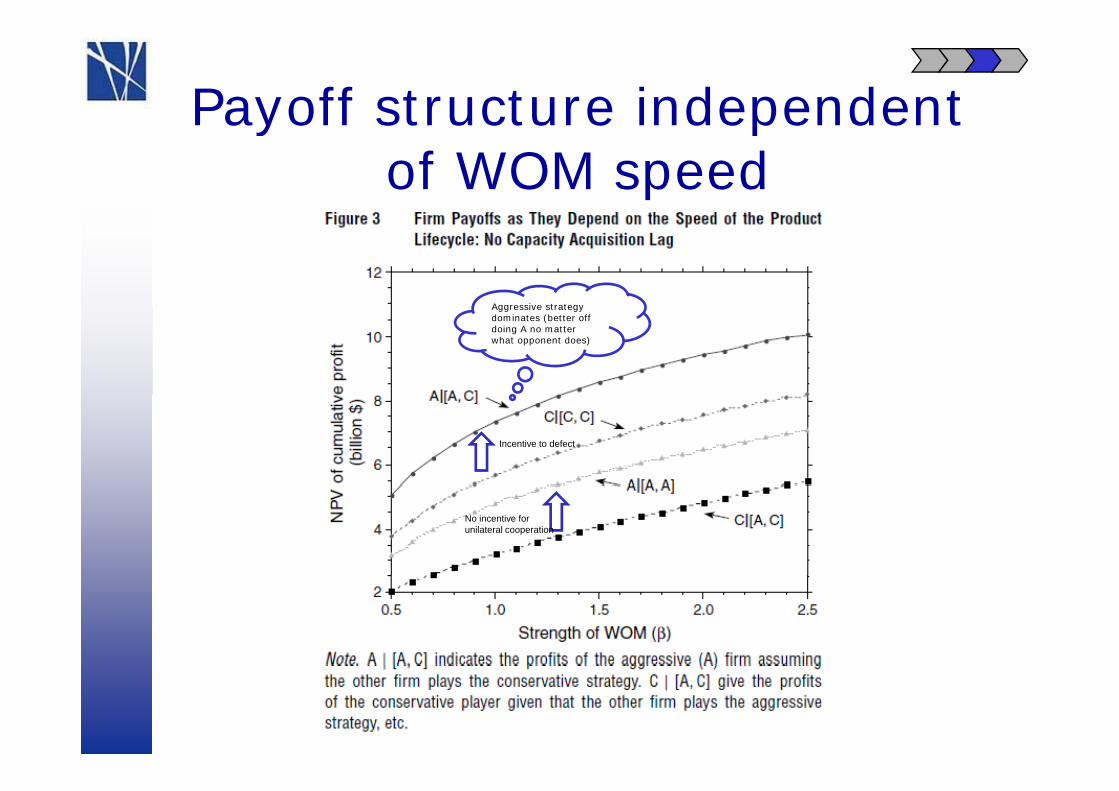
Payoff structure independent y pof WOM speed
Aggressive strategy Aggressive strategy dominates (better off doing A no matter what opponent does)
Incentive to defect
No incentive for unilateral cooperation
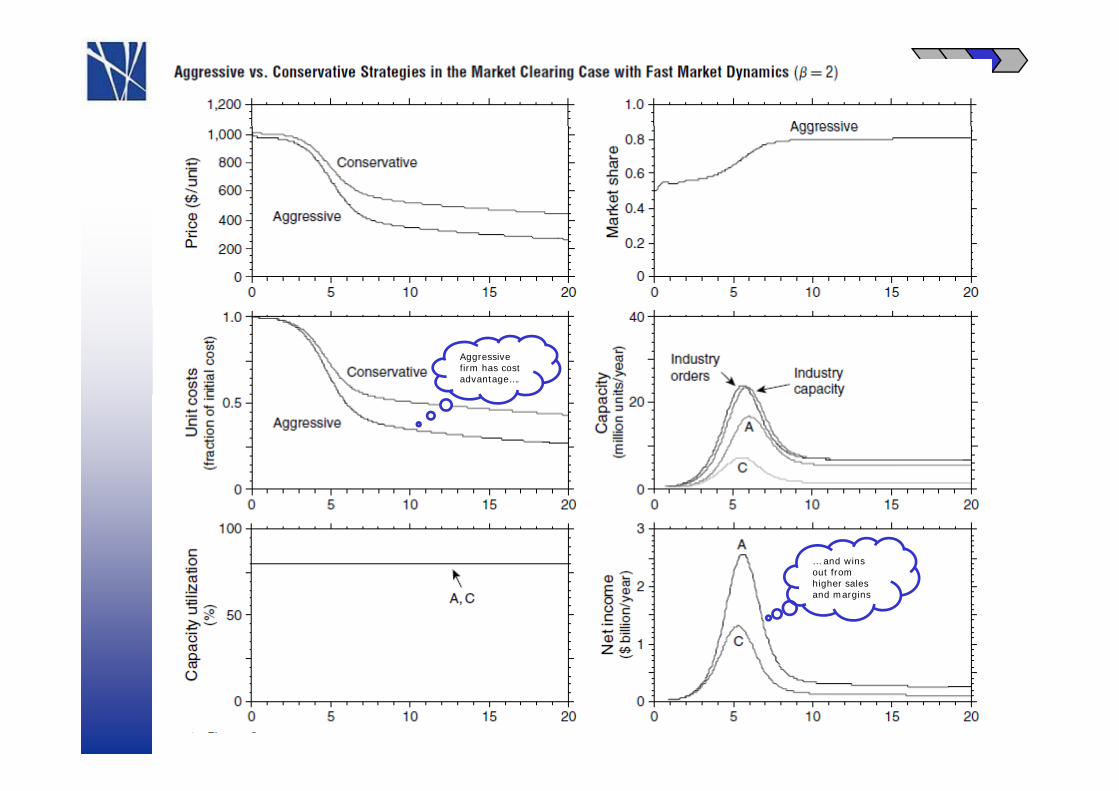
Dynamics under perfect y pforesight
Aggressive firm has cost advantage….
… and wins out from out from higher sales and margins
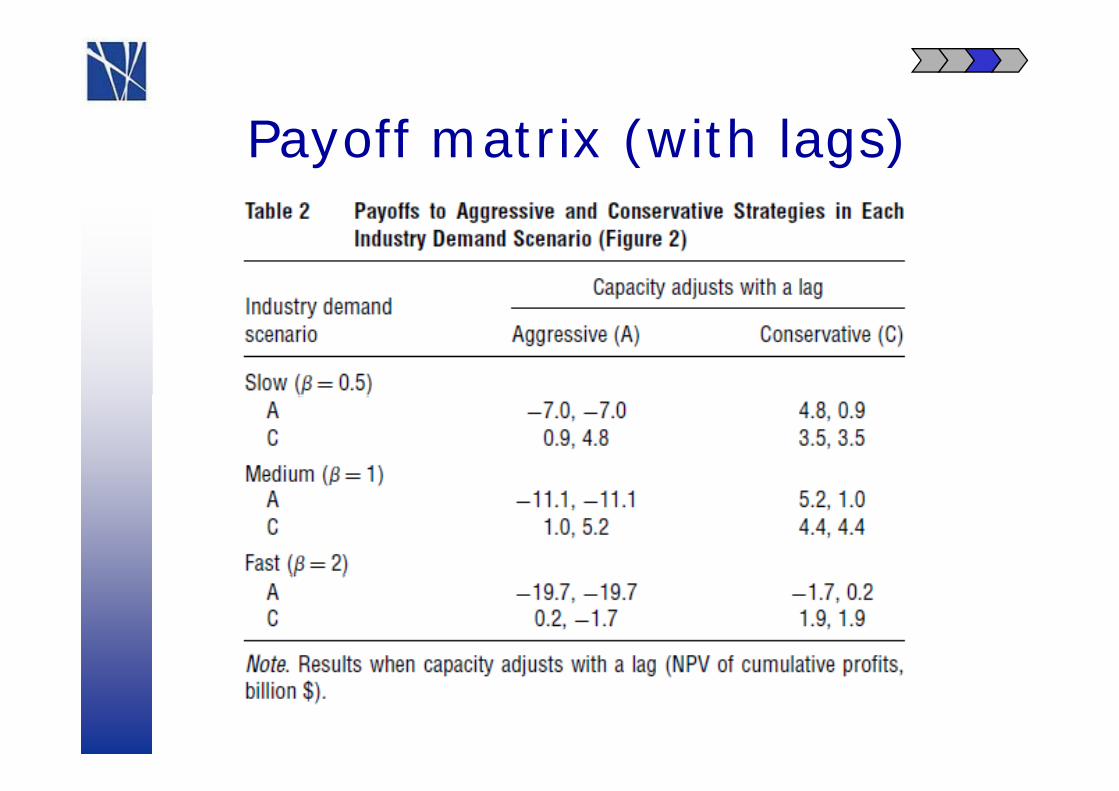
P ff t i ( ith l )Payoff matrix (with lags)
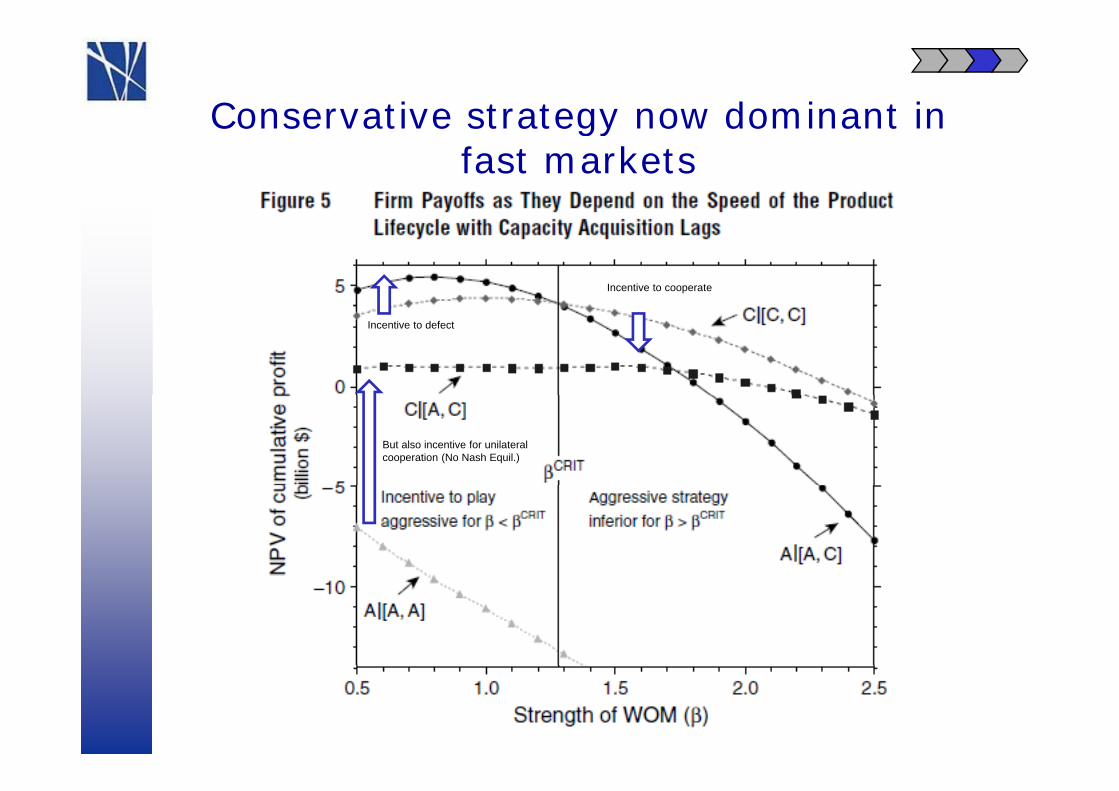
Conservative strategy now dominant in Conservative strategy now dominant in fast markets
Incentive to cooperate
Incentive to defect
But also incentive for unilateralcooperation (No Nash Equil.)
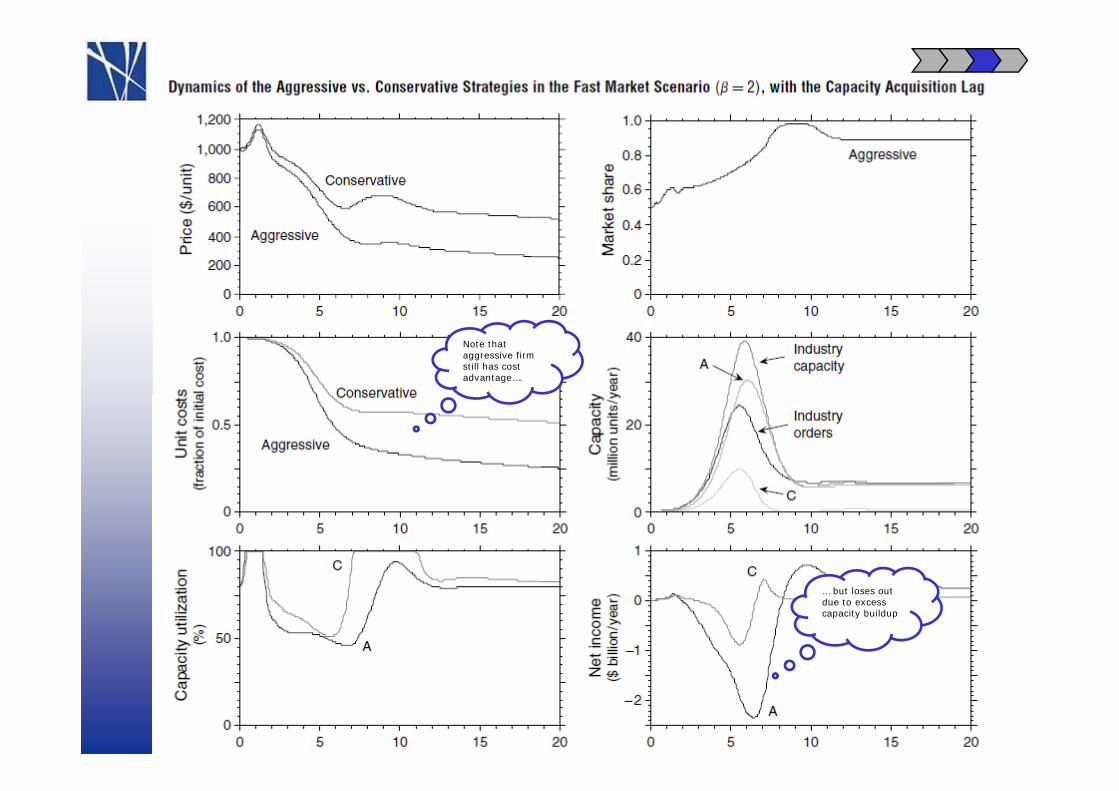
Why? Due to capacity dynamics Why? Due to capacity dynamics and errors
Note that aggressive firm still has cost advantage….
… but loses out due to excess capacity buildup
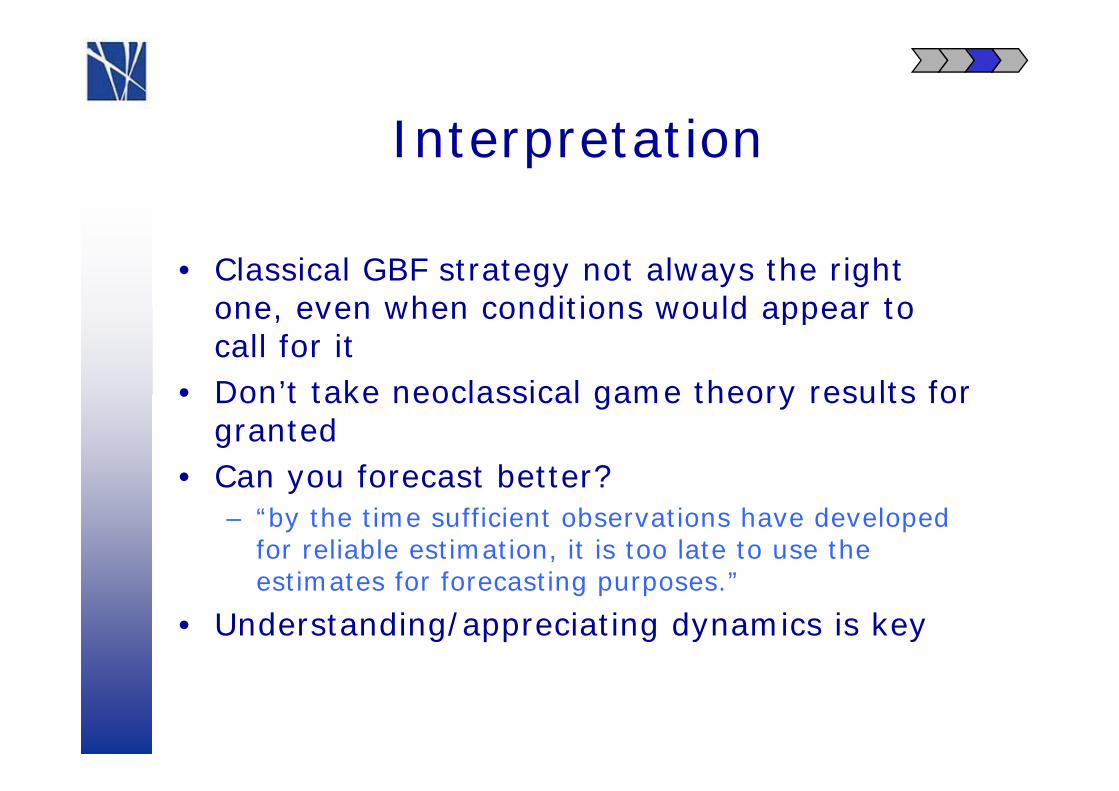
I t t tiInterpretation
• Classical GBF strategy not always the right one even when conditions would appear to one, even when conditions would appear to call for it
• Don’t take neoclassical game theory results for • Don t take neoclassical game theory results for granted
• Can you forecast better? Can you forecast better? – “by the time sufficient observations have developed
for reliable estimation, it is too late to use the ti t f f ti ”estimates for forecasting purposes.”
• Understanding/appreciating dynamics is key
M h ll & B (2003)Marshall & Brown (2003)
• Example of qualitative use of systems thinking
• NTO: Catalog sales of high-end • NTO: Catalog sales of high end outdoors equipment and apparelT i bili ff• Two sustainability efforts–Recycled paper for catalogsy p p g–Sustainability supply strategy
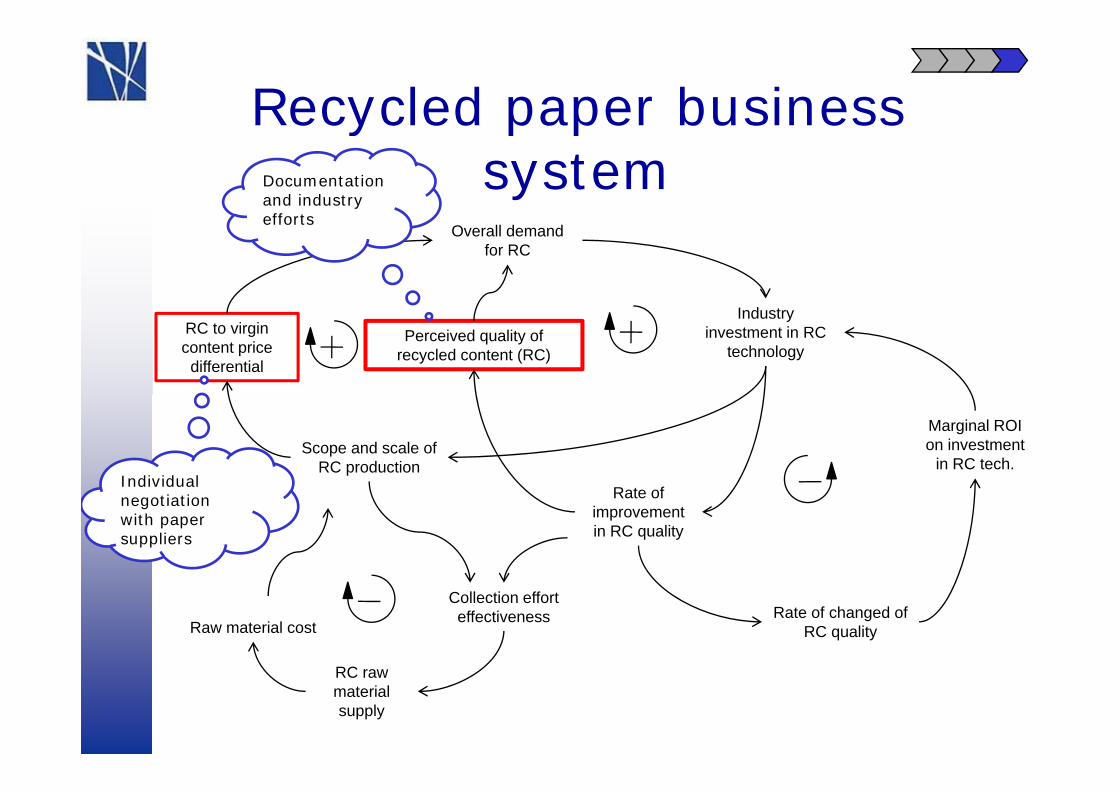
Recycled paper business y p psystemDocumentation
and industry efforts
Overall demand for RC
efforts
Perceived quality of recycled content (RC)
Industry investment in RC
technologyRC to virgin content price
differential
Scope and scale of RC production
Marginal ROIon investment
in RC tech.Individual
Rate of improvement in RC quality
Individual negotiation with paper suppliers
Rate of changed of RC quality
Collection effort effectiveness
Raw material cost
RC raw material supply
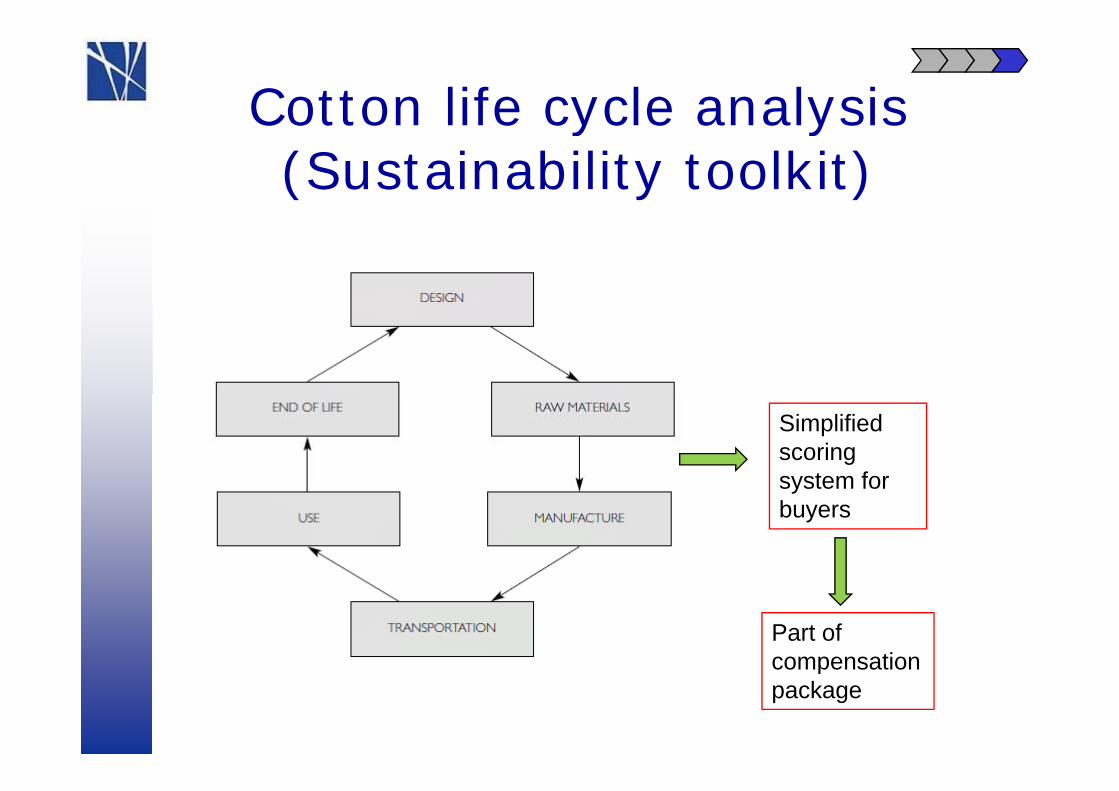
Cotton life cycle analysisy y(Sustainability toolkit)
Simplified scoring system forsystem for buyers
Part of compensationcompensation package
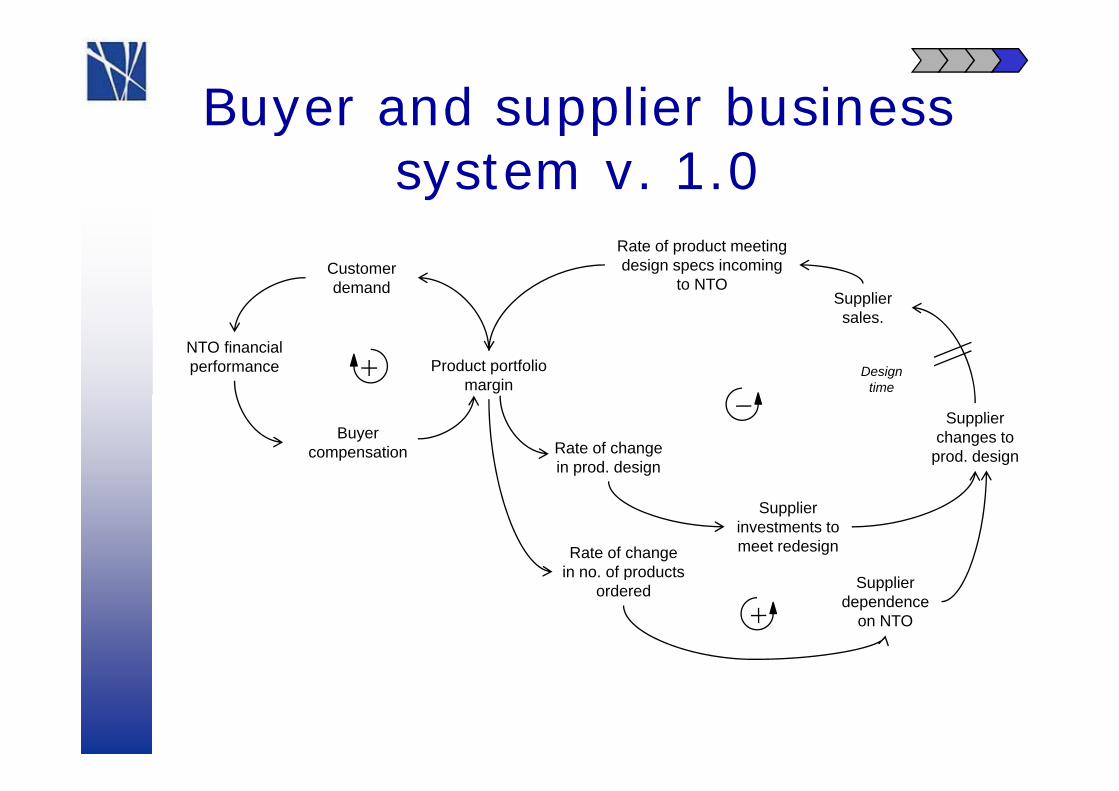
Buyer and supplier business y ppsystem v. 1.0
Rate of product meeting design specs incoming
to NTOCustomer demand
Supplier
Product portfolio margin
NTO financial performance
ppsales.
Design time
Buyer compensation
Supplier changes to
prod. designRate of change in prod. design
Supplier investments to meet redesignRate of change
in no of productsSupplier
dependence on NTO
in no. of products ordered
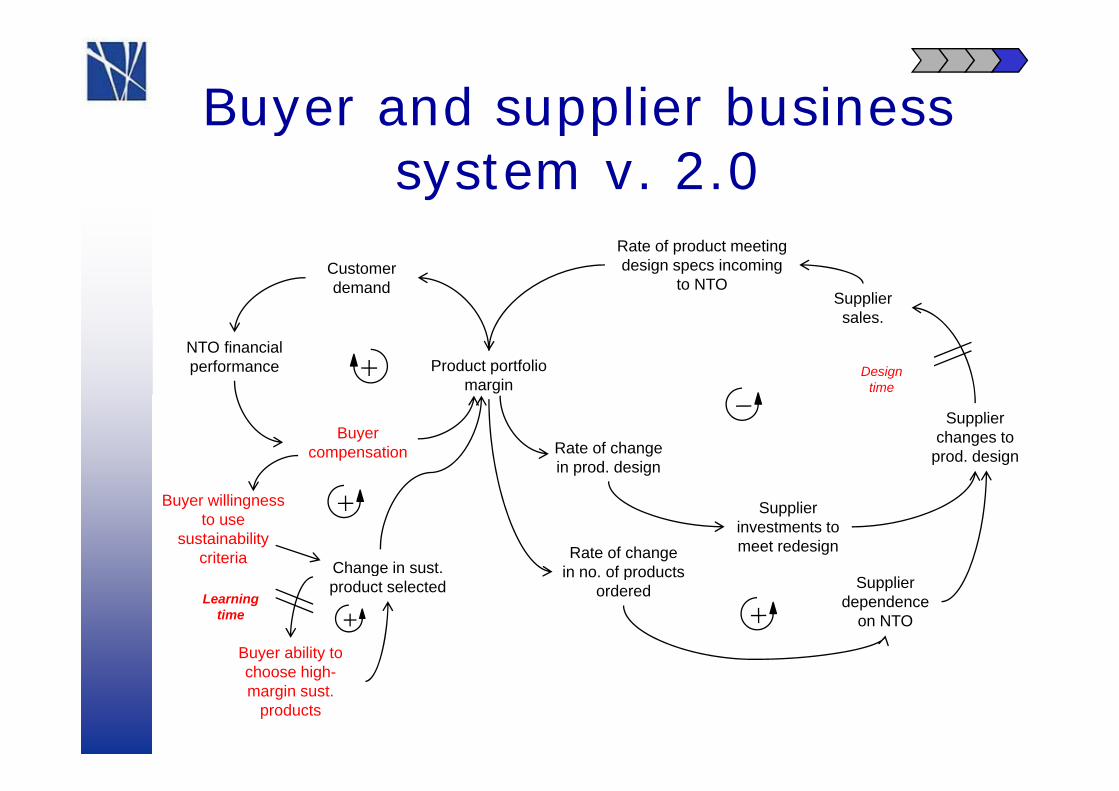
Buyer and supplier business y ppsystem v. 2.0
Rate of product meeting design specs incoming
to NTOCustomer demand
Supplier
Product portfolio margin
NTO financial performance
ppsales.
Design time
Buyer compensation
Supplier changes to
prod. designRate of change in prod. design
Supplier investments to meet redesignRate of change
in no of products
Buyer willingness to use
sustainability criteria Change in sust.
Supplier dependence
on NTO
in no. of products ordered
gproduct selected
Buyer ability to
Learning time
choose high-margin sust.
products
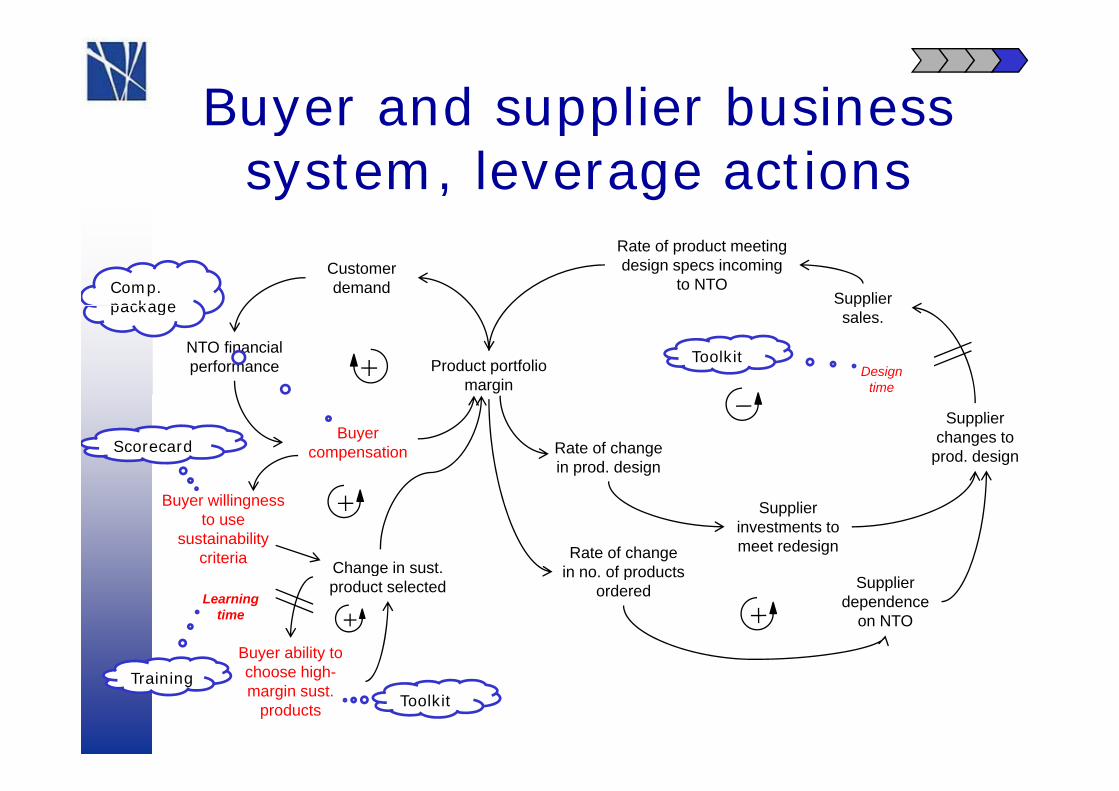
Buyer and supplier business y ppsystem, leverage actions
Rate of product meeting design specs incoming
to NTOCustomer demand
Supplier Comp. package
Product portfolio margin
NTO financial performance
ppsales.
Design time
package
Toolkit
Buyer compensation
Supplier changes to
prod. designRate of change in prod. design
Scorecard
Supplier investments to meet redesignRate of change
in no of products
Buyer willingness to use
sustainability criteria Change in sust.
Supplier dependence
on NTO
in no. of products ordered
gproduct selected
Buyer ability to
Learning time
Training choose high-margin sust.
products Toolkit
Cl i th htClosing thoughts
• Greentech is likely to revolutionize i d t i ti it ti f many industries – creating situations of
radical technology change• This brings about situations where
FMA/FMD are highly pertinent• Systems thinking/system dynamics can
be a useful tool for analyzing strategies y g gunder radical change
• And a tool for indentifying leverage And a tool for indentifying leverage points for less radical innovation
N t tiNext time…
Open innovation and platform strategy in the context of sustainability innovationy(with Jens Frøslev Christensen)