Embed Size (px)
Citation preview
Outdoor Space Quality: A Field Study in an Urban Residential Community in Central China
Dayi Laia, Chaobin Zhoua,b, Jianxiang Huangc, Yi Jiangd,a, Zhengwei Longa* and Qingyan Chena,e
aSchool of Environment Science and Engineering, Tianjin University, Tianjin, China bChina Vanke Co., LTD. Chengdu Regional Headquarters, Chengdu, China cThe Graduate School of Design, Harvard University, Massachusetts, USA dBuilt Environment Group, Tianjin, China eSchool of Mechanical Engineering, Purdue University, Indiana, USA
*Email: [email protected]
ABSTRACT The quality of outdoor spaces in a residential community affects the quality of life of its residents. This paper presents the findings of a study on outdoor thermal comfort and space usage at a residential community in Wuhan, central China, through the monitoring of microclimate conditions, interviews with residents, and recording of occupants’ activities. The data were used to develop a Thermal Sensation Vote (TSV) model and a space usage rate model. An alternative design strategy was proposed for considering thermal environment and usage rate. The results show that thermal comfort is the most important factor in the quality of outdoor spaces. Other significant factors include air quality, acoustic environment, functionality, and convenience. The study provided valuable information for the design of outdoor spaces in residential communities.
Keywords: Outdoor space quality, Outdoor thermal comfort, Residential community, Usage rate, Thermal Sensation Vote
1. Introduction
Over half of the world’s population lives in cities [1], and much of it lives in housing communities, especially in countries with a high population density such as China. Outdoor space quality, including outdoor thermal comfort, functionality, safety, convenience, and aesthetic concerns, is the primary factor in the activity level of community residents. It also affects the community’s closeness and the city’s livability and vitality. In addition, revitalizing outdoor spaces will lead to energy savings inside buildings. As people spend more time in outdoor spaces, the usage of air conditioners and other electronic equipment will be reduced. Although it is difficult to evaluate outdoor space quality, one method is the investigation of residents’ activities. Residents go to particular places as determined by their physiological and psychological needs. High-quality outdoor spaces attract more residents. Gehl [2] used many examples to illustrate the relationship between physical conditions and outdoor activities, but no quantifiable relationships were proposed.
Among the many factors that influence outdoor space quality, the outdoor microclimate or the concomitant outdoor thermal comfort is significant [3]. In the past decade, a growing numbers of studies concerning outdoor thermal comfort have been conducted in various kinds of outdoor spaces under different climate conditions. For example, Spagnolo et al. [4] conducted investigations at a variety of outdoor and semi-outdoor locations in Sydney; Lin [5]
Lay, D., Zhou, C., Huang, J., Jiang, Y., Long, Z., and Chen, Q. 2014. “Outdoor space quality: a field study in an urban residential community in central China,” Energy and Buildings, 68, Part B, 713-720.
in a public square in Taiwan; Mahmoud [6] in a park in Cairo, Kruger et al. [7] in a pedestrian area in Glasgow; Nikolopoulou et al. [8] at a wide variety of locations in seven cities across five European countries; Xi et al. [9] on a campus in Guangzhou; etc. These studies have advanced our knowledge of outdoor thermal comfort to a great extent. The large-scale field survey across five European countries [8] confirmed a strong relationship between microclimatic conditions and comfort. Nikolopoulou et al. [10] demonstrated that the physiological aspect alone is not sufficient to describe outdoor thermal comfort. There is also strong evidence of psychological or cultural adaption [11].
The results from different climate zones have yielded inconsistent findings. Studies
conducted in hot and humid regions in Taiwan [12] have demonstrated that in the cool season the number of people who visited the public square increased with a rise in thermal indices, such as air temperature, mean radiant temperature (Tmrt), and Physiological Equivalent Temperature (PET), but the trend was reversed during the hot season. This result contradicts the findings of other studies in temperate regions [13, 14], where the number of people increased with a rise in thermal indices such as global temperature and Tmrt in both summer and winter. Such a contradiction calls for further studies in various climatic regions. Few studies have been conducted for housing communities or for mainland China where the climate and culture are different from those in previous studies. Chen et al. [15] investigated the thermal environment in a housing community in Guangzhou. However, their study focused solely on the thermal environment, whereas outdoor thermal environment, outdoor thermal comfort and outdoor space usage should be considered together.
Currently, two methods are typically used to assess outdoor thermal comfort. One method
is the use of models based on the heat balance of the human body [16]. Some indices, such as the Predicted Mean Vote (PMV) [17], Effective Temperature (ET*), and Standard Effective Temperature (SET*) [18], were originally developed for indoor assessments. Other indices, such as PET [19], OUT_SET* [20] or the recently developed Universal Thermal Climate Index (UTCI) [21], were created or modified for outdoor applications. However, because of the adaption process [10], including physical, physiological and psychological adaption, such indices should be calibrated before using them to assess outdoor thermal comfort in a different climate [22]. The second method is the assessment of outdoor thermal comfort with a regression model which defines outdoor thermal sensation in terms of several climatic parameters (air temperature, humidity, wind speed, global solar radiation, global temperature, ground surface temperature, etc.). Instead of taking into consideration every complex physical, physiological and psychological aspect, this method treats the cause-and-effect relationship as a “black box”, simplifies the prediction of thermal sensation, and determines the thermal comfort level from climatic data. However, the validity of regression models is limited to the climate regions where the data are obtained [23, 24].
Due to the lack of field data for outdoor space quality, especially outdoor thermal comfort
and its influence on outdoor space usage in Chinese housing communities, the primary aims of this study were to: analyze the outdoor thermal environment and comfort in Chinese housing communities in
a subtropical climate; investigate the relationship between microclimate and outdoor thermal comfort; and quantify the relationship between outdoor thermal comfort and outdoor space usage rate. This paper reports the findings of this study.
2. Research method
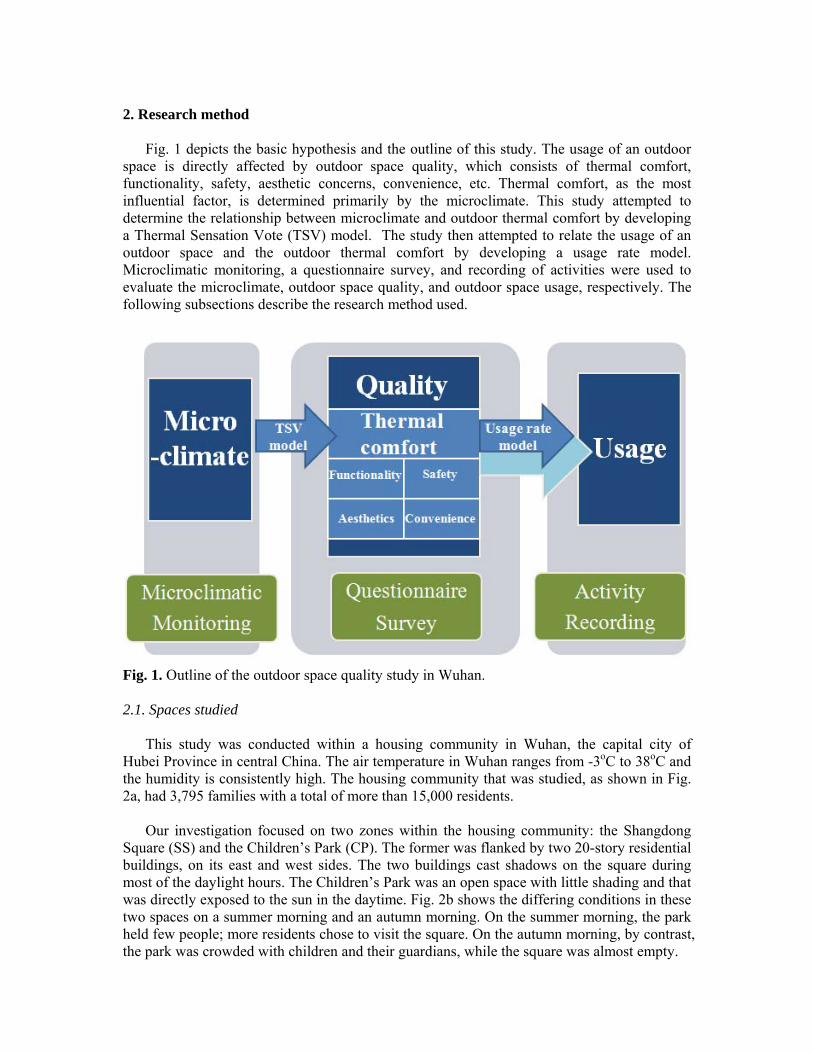
Fig. 1 depicts the basic hypothesis and the outline of this study. The usage of an outdoor space is directly affected by outdoor space quality, which consists of thermal comfort, functionality, safety, aesthetic concerns, convenience, etc. Thermal comfort, as the most influential factor, is determined primarily by the microclimate. This study attempted to determine the relationship between microclimate and outdoor thermal comfort by developing a Thermal Sensation Vote (TSV) model. The study then attempted to relate the usage of an outdoor space and the outdoor thermal comfort by developing a usage rate model. Microclimatic monitoring, a questionnaire survey, and recording of activities were used to evaluate the microclimate, outdoor space quality, and outdoor space usage, respectively. The following subsections describe the research method used.
Fig. 1. Outline of the outdoor space quality study in Wuhan. 2.1. Spaces studied
This study was conducted within a housing community in Wuhan, the capital city of Hubei Province in central China. The air temperature in Wuhan ranges from -3oC to 38oC and the humidity is consistently high. The housing community that was studied, as shown in Fig. 2a, had 3,795 families with a total of more than 15,000 residents.
Our investigation focused on two zones within the housing community: the Shangdong
Square (SS) and the Children’s Park (CP). The former was flanked by two 20-story residential buildings, on its east and west sides. The two buildings cast shadows on the square during most of the daylight hours. The Children’s Park was an open space with little shading and that was directly exposed to the sun in the daytime. Fig. 2b shows the differing conditions in these two spaces on a summer morning and an autumn morning. On the summer morning, the park held few people; more residents chose to visit the square. On the autumn morning, by contrast, the park was crowded with children and their guardians, while the square was almost empty.
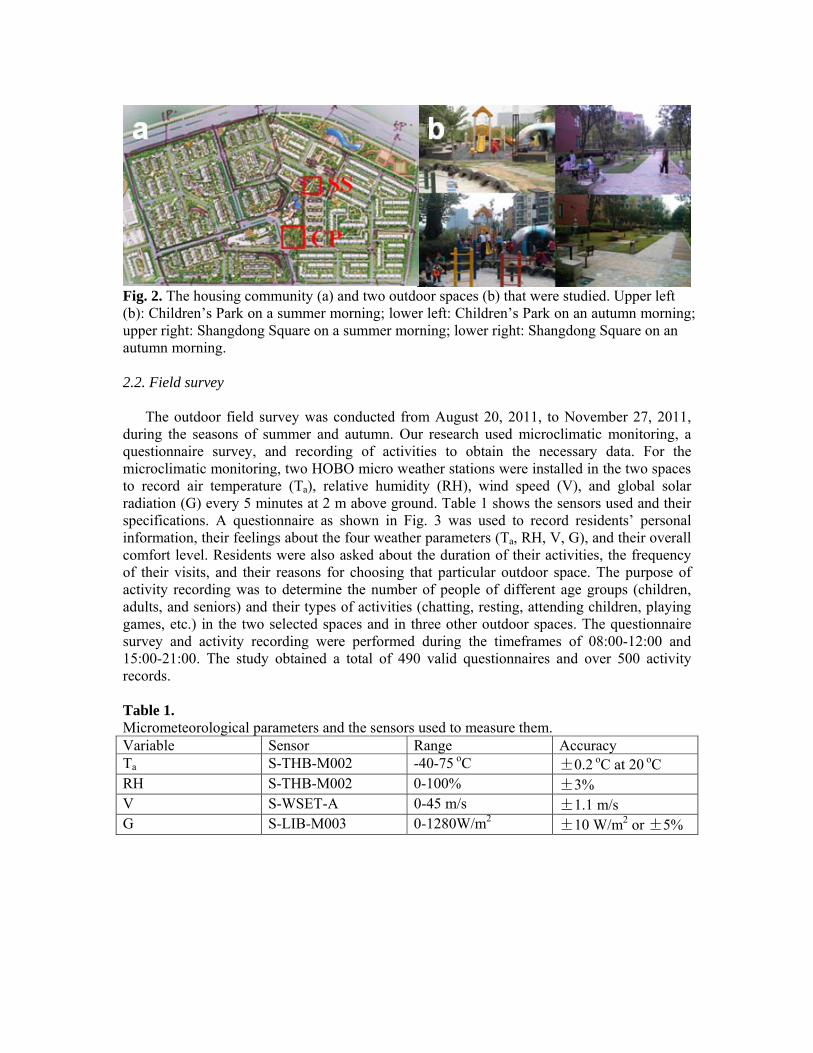
Fig. 2. The housing community (a) and two outdoor spaces (b) that were studied. Upper left (b): Children’s Park on a summer morning; lower left: Children’s Park on an autumn morning; upper right: Shangdong Square on a summer morning; lower right: Shangdong Square on an autumn morning. 2.2. Field survey
The outdoor field survey was conducted from August 20, 2011, to November 27, 2011, during the seasons of summer and autumn. Our research used microclimatic monitoring, a questionnaire survey, and recording of activities to obtain the necessary data. For the microclimatic monitoring, two HOBO micro weather stations were installed in the two spaces to record air temperature (Ta), relative humidity (RH), wind speed (V), and global solar radiation (G) every 5 minutes at 2 m above ground. Table 1 shows the sensors used and their specifications. A questionnaire as shown in Fig. 3 was used to record residents’ personal information, their feelings about the four weather parameters (Ta, RH, V, G), and their overall comfort level. Residents were also asked about the duration of their activities, the frequency of their visits, and their reasons for choosing that particular outdoor space. The purpose of activity recording was to determine the number of people of different age groups (children, adults, and seniors) and their types of activities (chatting, resting, attending children, playing games, etc.) in the two selected spaces and in three other outdoor spaces. The questionnaire survey and activity recording were performed during the timeframes of 08:00-12:00 and 15:00-21:00. The study obtained a total of 490 valid questionnaires and over 500 activity records. Table 1. Micrometeorological parameters and the sensors used to measure them. Variable Sensor Range Accuracy Ta S-THB-M002 -40-75 oC ±0.2 oC at 20 oC RH S-THB-M002 0-100% ±3% V S-WSET-A 0-45 m/s ±1.1 m/s G S-LIB-M003 0-1280W/m2 ±10 W/m2 or ±5%
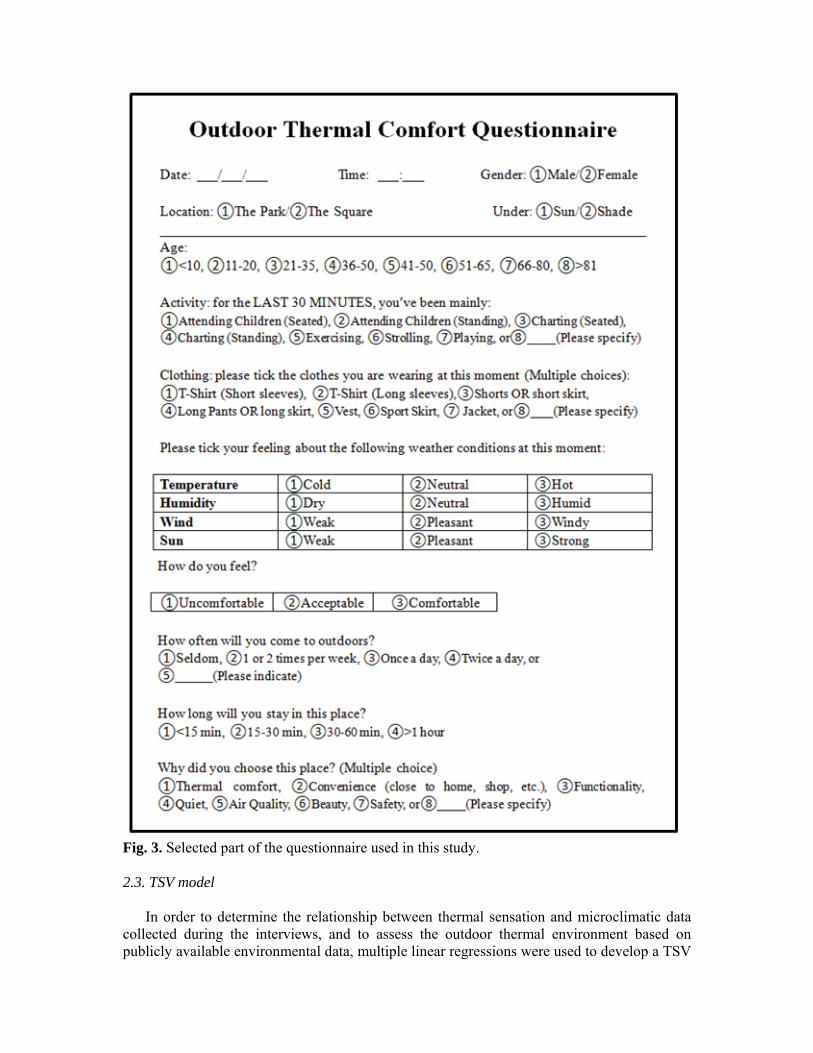
Fig. 3. Selected part of the questionnaire used in this study. 2.3. TSV model
In order to determine the relationship between thermal sensation and microclimatic data
collected during the interviews, and to assess the outdoor thermal environment based on publicly available environmental data, multiple linear regressions were used to develop a TSV
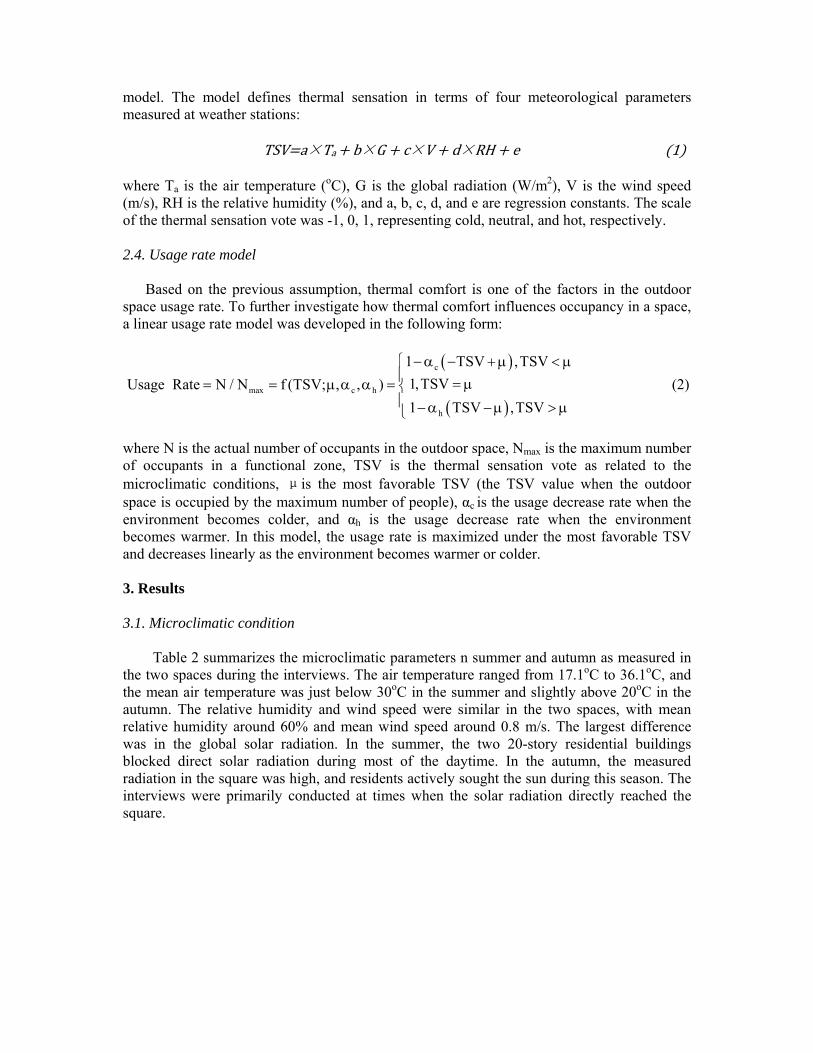
model. The model defines thermal sensation in terms of four meteorological parameters measured at weather stations:
TSV a×Ta b×G c×V d×RH e 1
where Ta is the air temperature (oC), G is the global radiation (W/m2), V is the wind speed (m/s), RH is the relative humidity (%), and a, b, c, d, and e are regression constants. The scale of the thermal sensation vote was -1, 0, 1, representing cold, neutral, and hot, respectively. 2.4. Usage rate model
Based on the previous assumption, thermal comfort is one of the factors in the outdoor space usage rate. To further investigate how thermal comfort influences occupancy in a space, a linear usage rate model was developed in the following form:
c
max c h
h
1 TSV ,TSV
1,TSVUsage Rate N / N f (TSV; , , )
1 TSV ,TSV
(2)
where N is the actual number of occupants in the outdoor space, Nmax is the maximum number of occupants in a functional zone, TSV is the thermal sensation vote as related to the microclimatic conditions, μis the most favorable TSV (the TSV value when the outdoor space is occupied by the maximum number of people), αc is the usage decrease rate when the environment becomes colder, and αh is the usage decrease rate when the environment becomes warmer. In this model, the usage rate is maximized under the most favorable TSV and decreases linearly as the environment becomes warmer or colder. 3. Results 3.1. Microclimatic condition
Table 2 summarizes the microclimatic parameters n summer and autumn as measured in the two spaces during the interviews. The air temperature ranged from 17.1oC to 36.1oC, and the mean air temperature was just below 30oC in the summer and slightly above 20oC in the autumn. The relative humidity and wind speed were similar in the two spaces, with mean relative humidity around 60% and mean wind speed around 0.8 m/s. The largest difference was in the global solar radiation. In the summer, the two 20-story residential buildings blocked direct solar radiation during most of the daytime. In the autumn, the measured radiation in the square was high, and residents actively sought the sun during this season. The interviews were primarily conducted at times when the solar radiation directly reached the square.
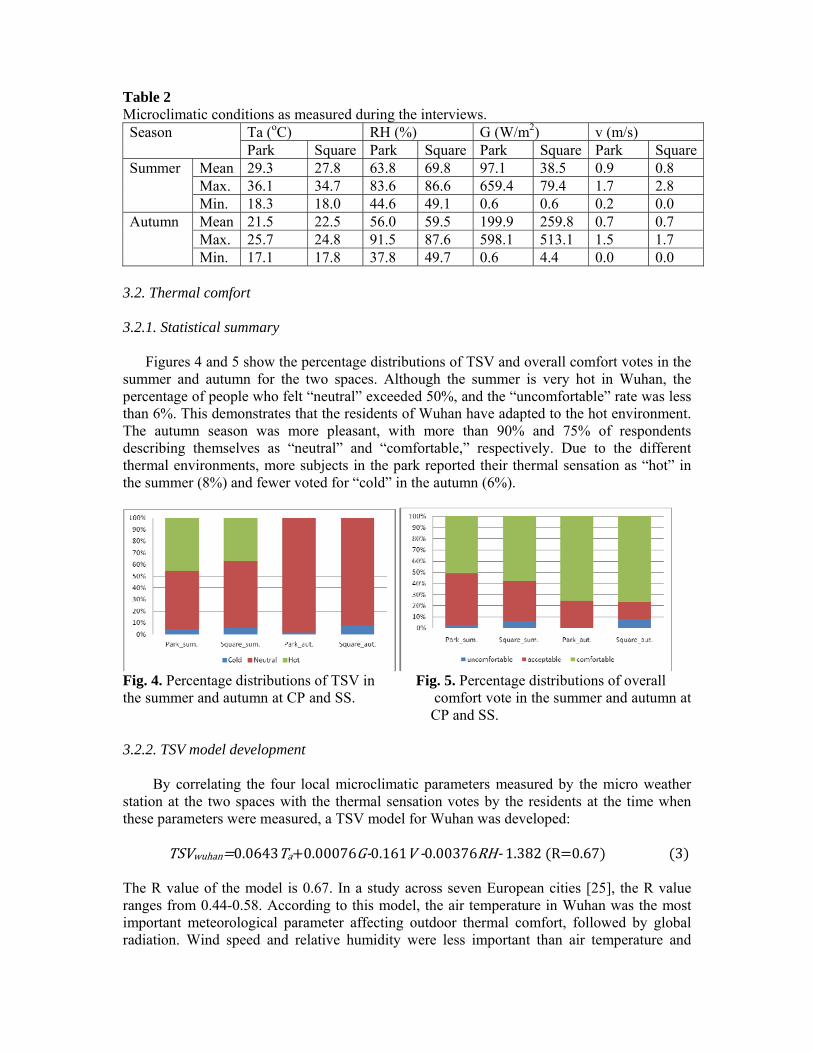
Table 2 Microclimatic conditions as measured during the interviews. Season Ta (oC) RH (%) G (W/m2) v (m/s)
Park Square Park Square Park Square Park SquareSummer Mean 29.3 27.8 63.8 69.8 97.1 38.5 0.9 0.8
Max. 36.1 34.7 83.6 86.6 659.4 79.4 1.7 2.8 Min. 18.3 18.0 44.6 49.1 0.6 0.6 0.2 0.0
Autumn Mean 21.5 22.5 56.0 59.5 199.9 259.8 0.7 0.7 Max. 25.7 24.8 91.5 87.6 598.1 513.1 1.5 1.7 Min. 17.1 17.8 37.8 49.7 0.6 4.4 0.0 0.0
3.2. Thermal comfort 3.2.1. Statistical summary
Figures 4 and 5 show the percentage distributions of TSV and overall comfort votes in the
summer and autumn for the two spaces. Although the summer is very hot in Wuhan, the percentage of people who felt “neutral” exceeded 50%, and the “uncomfortable” rate was less than 6%. This demonstrates that the residents of Wuhan have adapted to the hot environment. The autumn season was more pleasant, with more than 90% and 75% of respondents describing themselves as “neutral” and “comfortable,” respectively. Due to the different thermal environments, more subjects in the park reported their thermal sensation as “hot” in the summer (8%) and fewer voted for “cold” in the autumn (6%).
Fig. 4. Percentage distributions of TSV in Fig. 5. Percentage distributions of overall the summer and autumn at CP and SS. comfort vote in the summer and autumn at
CP and SS. 3.2.2. TSV model development
By correlating the four local microclimatic parameters measured by the micro weather station at the two spaces with the thermal sensation votes by the residents at the time when these parameters were measured, a TSV model for Wuhan was developed:
TSVwuhan 0.0643Ta 0.00076G‐0.161V‐0.00376RH‐1.382 R 0.67 3 The R value of the model is 0.67. In a study across seven European cities [25], the R value ranges from 0.44-0.58. According to this model, the air temperature in Wuhan was the most important meteorological parameter affecting outdoor thermal comfort, followed by global radiation. Wind speed and relative humidity were less important than air temperature and
solar radiation. A change of 84.6 W/m2 in global radiation or a change of 0.4 m/s in wind speed would have the same effect as a change of 1 K in air temperature.
Since air temperature and relative humidity cannot be controlled easily in an outdoor environment, the blockage of solar radiation and the reduction or acceleration of wind speed are the only feasible ways to improve outdoor thermal comfort. 3.2.3. Application of the TSV model
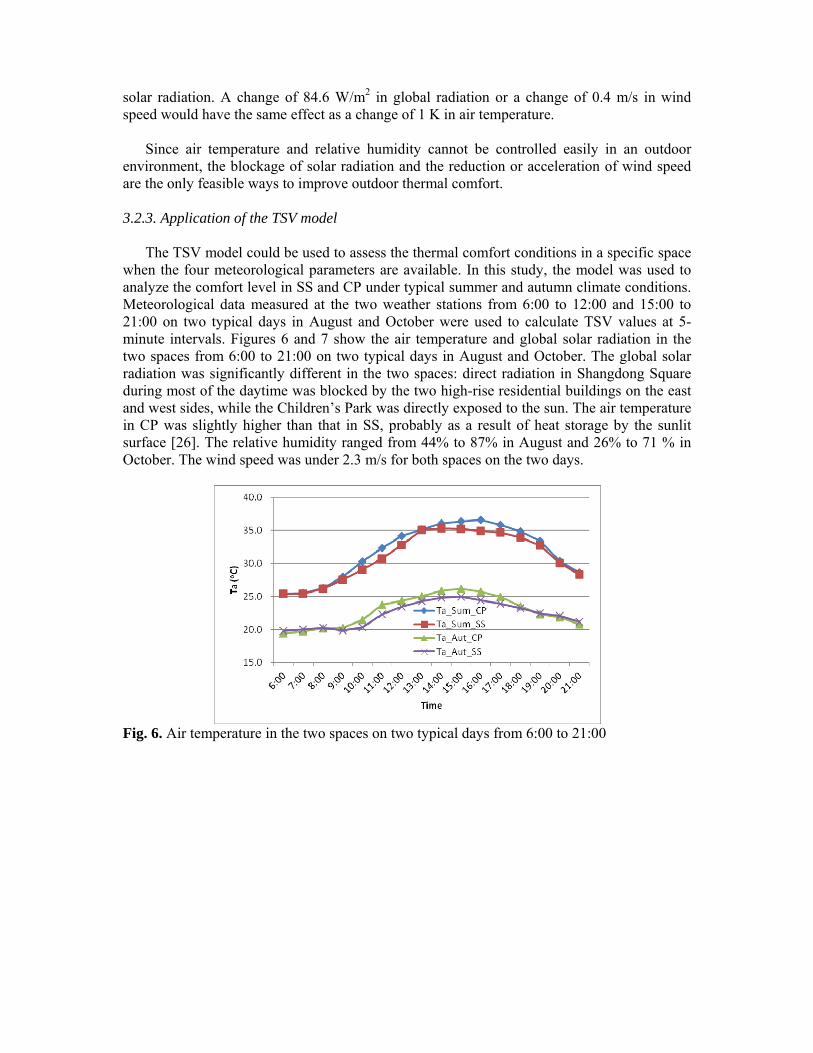
The TSV model could be used to assess the thermal comfort conditions in a specific space when the four meteorological parameters are available. In this study, the model was used to analyze the comfort level in SS and CP under typical summer and autumn climate conditions. Meteorological data measured at the two weather stations from 6:00 to 12:00 and 15:00 to 21:00 on two typical days in August and October were used to calculate TSV values at 5-minute intervals. Figures 6 and 7 show the air temperature and global solar radiation in the two spaces from 6:00 to 21:00 on two typical days in August and October. The global solar radiation was significantly different in the two spaces: direct radiation in Shangdong Square during most of the daytime was blocked by the two high-rise residential buildings on the east and west sides, while the Children’s Park was directly exposed to the sun. The air temperature in CP was slightly higher than that in SS, probably as a result of heat storage by the sunlit surface [26]. The relative humidity ranged from 44% to 87% in August and 26% to 71 % in October. The wind speed was under 2.3 m/s for both spaces on the two days.
Fig. 6. Air temperature in the two spaces on two typical days from 6:00 to 21:00
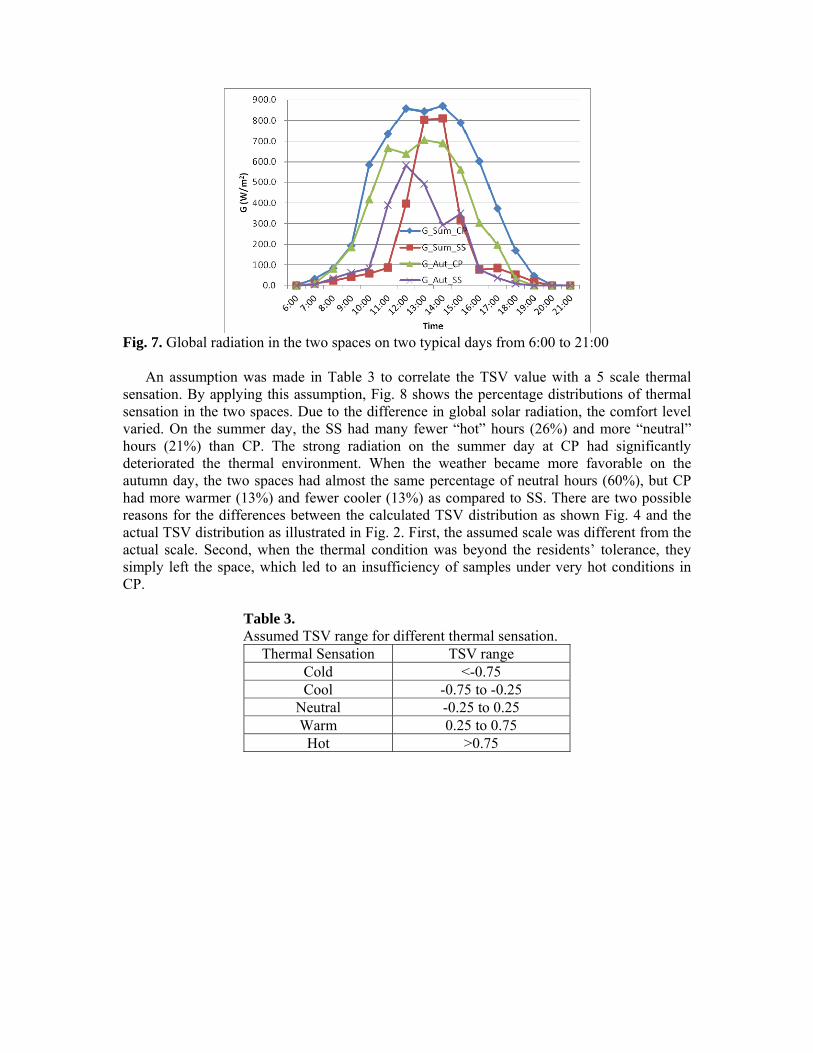
Fig. 7. Global radiation in the two spaces on two typical days from 6:00 to 21:00
An assumption was made in Table 3 to correlate the TSV value with a 5 scale thermal sensation. By applying this assumption, Fig. 8 shows the percentage distributions of thermal sensation in the two spaces. Due to the difference in global solar radiation, the comfort level varied. On the summer day, the SS had many fewer “hot” hours (26%) and more “neutral” hours (21%) than CP. The strong radiation on the summer day at CP had significantly deteriorated the thermal environment. When the weather became more favorable on the autumn day, the two spaces had almost the same percentage of neutral hours (60%), but CP had more warmer (13%) and fewer cooler (13%) as compared to SS. There are two possible reasons for the differences between the calculated TSV distribution as shown Fig. 4 and the actual TSV distribution as illustrated in Fig. 2. First, the assumed scale was different from the actual scale. Second, when the thermal condition was beyond the residents’ tolerance, they simply left the space, which led to an insufficiency of samples under very hot conditions in CP.
Table 3. Assumed TSV range for different thermal sensation.
Thermal Sensation TSV range Cold <-0.75 Cool -0.75 to -0.25
Neutral -0.25 to 0.25 Warm 0.25 to 0.75 Hot >0.75
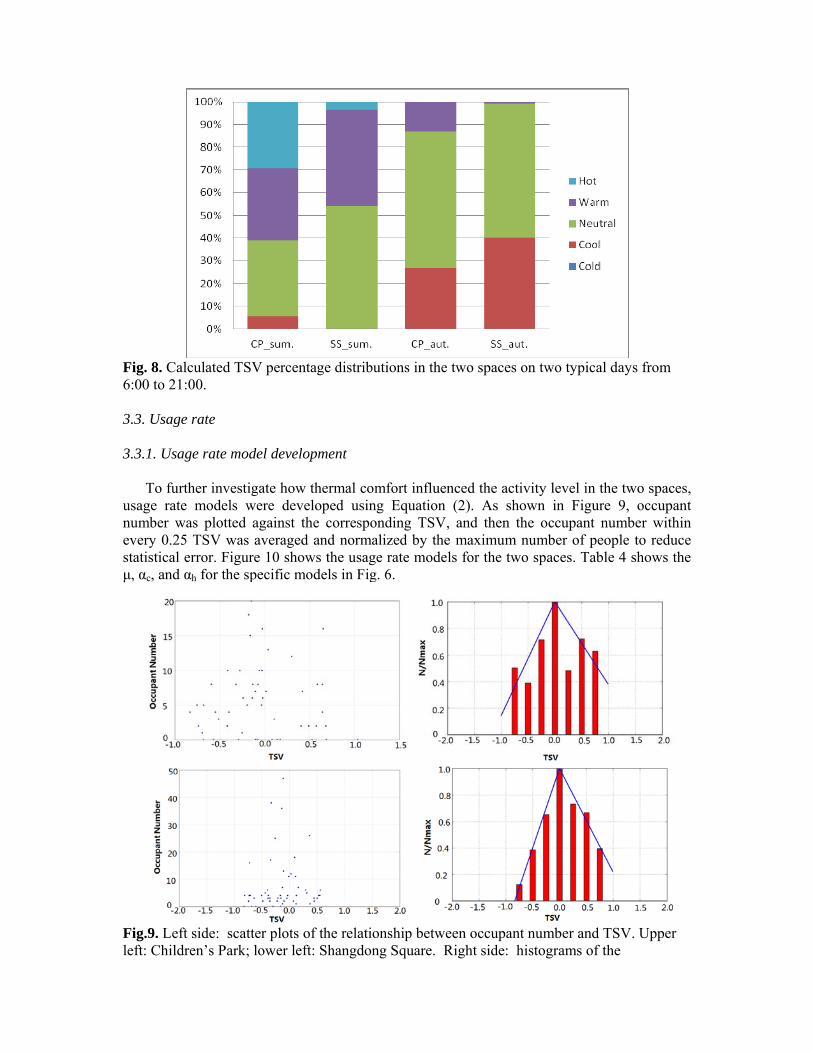
Fig. 8. Calculated TSV percentage distributions in the two spaces on two typical days from 6:00 to 21:00. 3.3. Usage rate 3.3.1. Usage rate model development
To further investigate how thermal comfort influenced the activity level in the two spaces, usage rate models were developed using Equation (2). As shown in Figure 9, occupant number was plotted against the corresponding TSV, and then the occupant number within every 0.25 TSV was averaged and normalized by the maximum number of people to reduce statistical error. Figure 10 shows the usage rate models for the two spaces. Table 4 shows the μ, αc, and αh for the specific models in Fig. 6.
Fig.9. Left side: scatter plots of the relationship between occupant number and TSV. Upper left: Children’s Park; lower left: Shangdong Square. Right side: histograms of the
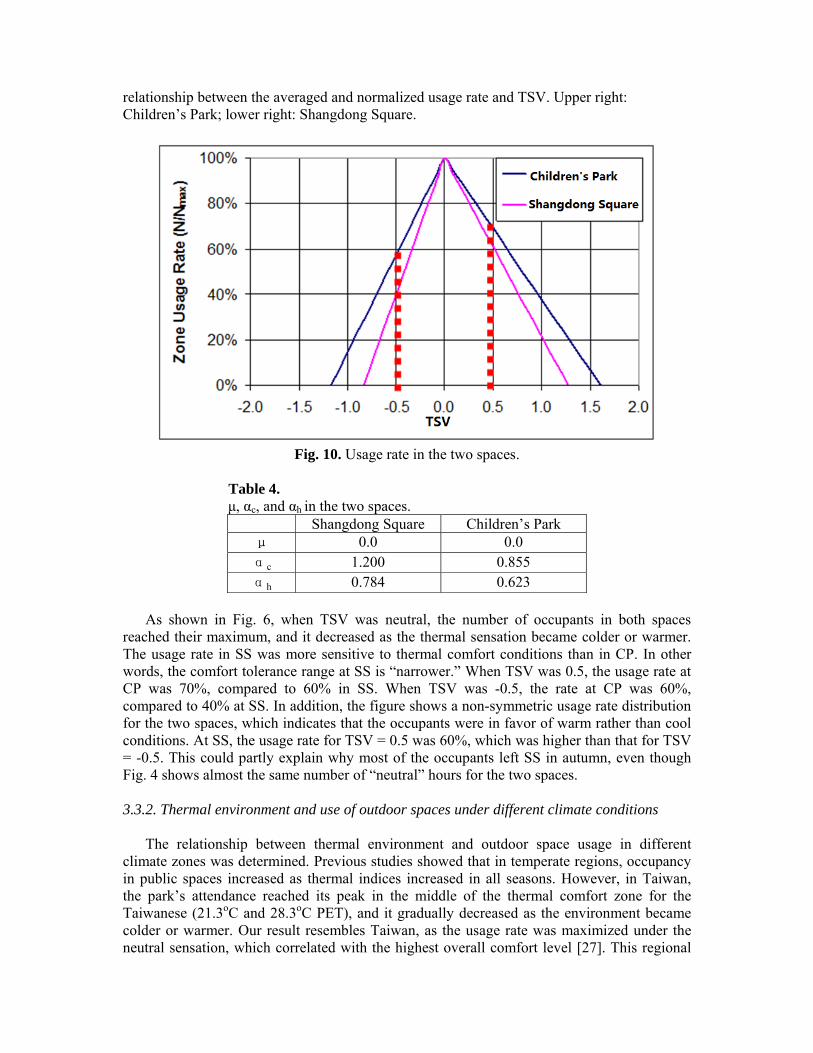
relationship between the averaged and normalized usage rate and TSV. Upper right: Children’s Park; lower right: Shangdong Square.
Fig. 10. Usage rate in the two spaces.
Table 4. μ, αc, and αh in the two spaces.
Shangdong Square Children’s Park μ 0.0 0.0
αc 1.200 0.855
αh 0.784 0.623
As shown in Fig. 6, when TSV was neutral, the number of occupants in both spaces reached their maximum, and it decreased as the thermal sensation became colder or warmer. The usage rate in SS was more sensitive to thermal comfort conditions than in CP. In other words, the comfort tolerance range at SS is “narrower.” When TSV was 0.5, the usage rate at CP was 70%, compared to 60% in SS. When TSV was -0.5, the rate at CP was 60%, compared to 40% at SS. In addition, the figure shows a non-symmetric usage rate distribution for the two spaces, which indicates that the occupants were in favor of warm rather than cool conditions. At SS, the usage rate for TSV = 0.5 was 60%, which was higher than that for TSV = -0.5. This could partly explain why most of the occupants left SS in autumn, even though Fig. 4 shows almost the same number of “neutral” hours for the two spaces. 3.3.2. Thermal environment and use of outdoor spaces under different climate conditions
The relationship between thermal environment and outdoor space usage in different climate zones was determined. Previous studies showed that in temperate regions, occupancy in public spaces increased as thermal indices increased in all seasons. However, in Taiwan, the park’s attendance reached its peak in the middle of the thermal comfort zone for the Taiwanese (21.3oC and 28.3oC PET), and it gradually decreased as the environment became colder or warmer. Our result resembles Taiwan, as the usage rate was maximized under the neutral sensation, which correlated with the highest overall comfort level [27]. This regional
divergence can be attributed primarily to the climatic difference. In the studies conducted in temperate regions, the temperature rarely exceeded 30oC, but the summer temperature in Taiwan and Wuhan could easily exceed 30oC.
This finding sheds light on the design of outdoor spaces in order to increase utilization rate. In temperate regions, access to sunlight is the first priority. However, in cities like Wuhan with a wider temperature range, a variety of microclimates, such as sunny and shady sub-spaces, should be considered in order to provide residents with more opportunities to interact with the environment, thus improving their thermal comfort as well as the usage rate. 3.3.3. Other factors affecting usage rate
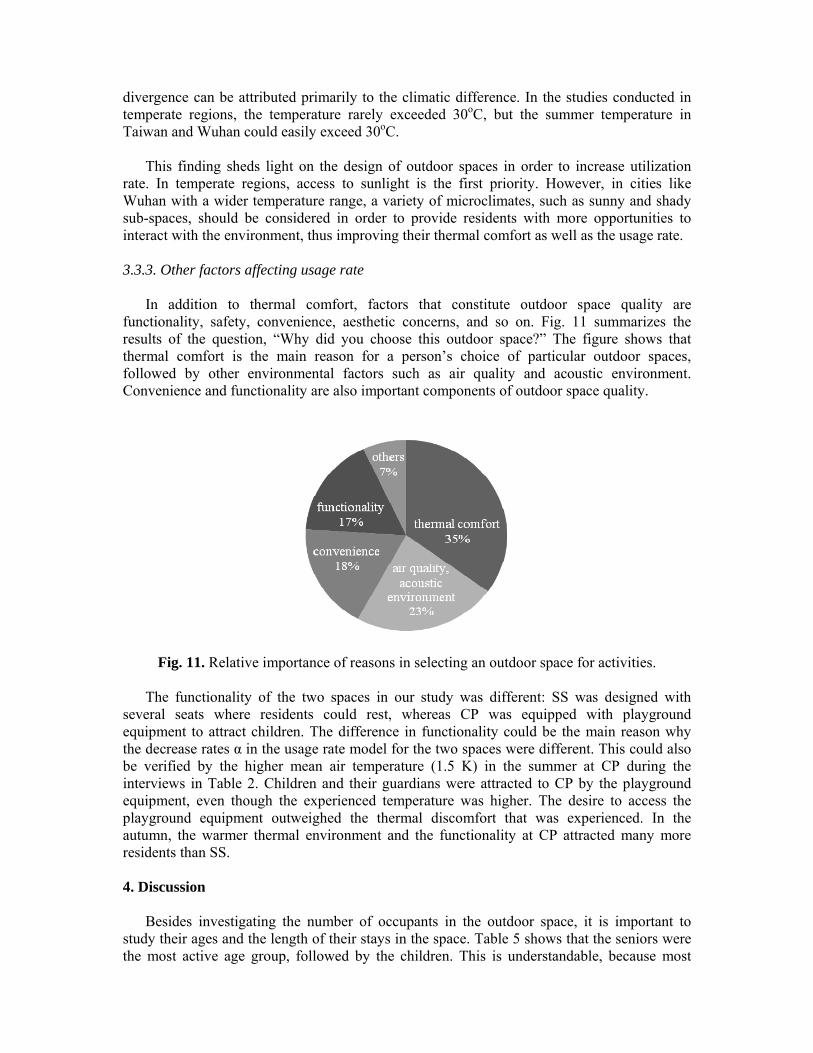
In addition to thermal comfort, factors that constitute outdoor space quality are functionality, safety, convenience, aesthetic concerns, and so on. Fig. 11 summarizes the results of the question, “Why did you choose this outdoor space?” The figure shows that thermal comfort is the main reason for a person’s choice of particular outdoor spaces, followed by other environmental factors such as air quality and acoustic environment. Convenience and functionality are also important components of outdoor space quality.
Fig. 11. Relative importance of reasons in selecting an outdoor space for activities.
The functionality of the two spaces in our study was different: SS was designed with
several seats where residents could rest, whereas CP was equipped with playground equipment to attract children. The difference in functionality could be the main reason why the decrease rates α in the usage rate model for the two spaces were different. This could also be verified by the higher mean air temperature (1.5 K) in the summer at CP during the interviews in Table 2. Children and their guardians were attracted to CP by the playground equipment, even though the experienced temperature was higher. The desire to access the playground equipment outweighed the thermal discomfort that was experienced. In the autumn, the warmer thermal environment and the functionality at CP attracted many more residents than SS. 4. Discussion
Besides investigating the number of occupants in the outdoor space, it is important to study their ages and the length of their stays in the space. Table 5 shows that the seniors were the most active age group, followed by the children. This is understandable, because most
non-senior adults were working during the daytime and had less chance to be outdoors. This information is useful for architects and planners when they design the outdoor spaces of housing communities. Because seniors spend more time outdoors, their needs should be considered in the design of outdoor spaces. Table 5. Activity duration, daily activity frequency, and proportion of outdoor occupants to total population for different age groups. Children Adults Senior Average Activity duration (minute) 38.60 48.18 67.06 52.86 Daily activity frequency (Times/Day) 0.66 0.93 1.34 1.01 Proportion of outdoor occupants to total population 31% 11% 33% 20%
The R-square values in the TSV model in this study as well as in other studies [25] were less than 0.5, demonstrating that another 50% of sensation variation cannot be explained by this model. The sensation variation might be attributed to differences in season, age group, adaptation, etc. These factors brought uncertainties to the regressed TSV models. Further efforts may be needed to specify the TSV models according to season or age group to improve the precision of these models.
Occupancy was affected not only by outdoor space quality, but also by the daily life
patterns of the residents. For example, citizens in Wuhan often went home for lunch and took a nap afterward, resulting in a significant decrease in the number of people outside. It was difficult to take such life patterns into consideration in the present study. For this reason, the study did not include data obtained from 12:00 to 15:00. 5. Conclusions
This paper presents our findings from surveys of the quality of outdoor spaces in a residential community in Wuhan, central China. The field survey included microclimatic monitoring, questionnaire surveys, and recording of activities in a shaded space (Shangdong Square) and in a playground with equipment (Children’s Park). The study has led to the following conclusions.
A TSV model was developed for Wuhan and was used to analyze the comfort level of a typical day in summer (hot and humid climate) and another typical day in autumn (mild climate) in two outdoor spaces in the community. Because of shading from the sun, on the summer day Shandong Square had a greater number of comfortable hours than the Children’s Park. On the autumn day, the comfort condition in Shangdong Square was slightly cooler and the Children’s Park was warmer.
A usage rate model was also developed to analyze the two outdoor spaces. The non-symmetric distribution of this model shows that the residents preferred warm conditions. An alternative strategy for creating a diversified environment was proposed in order to improve thermal comfort and utilization rate. Other factors such as playground equipment would influence the usage of outdoor spaces as well.
This investigation helps explain the relationship between thermal environment, thermal comfort, and usage rate in outdoor spaces of residential communities in central China. The data were from summer and autumn days. Data for winter and spring should be evaluated in
future research. Because climate can greatly affect outdoor thermal comfort as well as space usage, this study should be expanded to other climate regions in China, Furthermore, the proposed design strategy could be tested by putting it into practice. 6. References [1] Population Reference Bureau. 2011 World population data sheet. <
http://www.prb.org/Publications/Datasheets/2011/world-population-data-sheet.aspx>, (2011)
[2] J. Gehl, Life between buildings: Using public space. Danish Architecture Press, Distributed by Island Press, (1971).
[3] L. Chen, E. Ng, Outdoor thermal comfort and outdoor activities: A review of research in the past decade, Cities, (2011).
[4] J. Spagnolo, R. De Dear, A field study of thermal comfort in outdoor and semi-outdoor environments in subtropical Sydney Australia, Building and Environment, 38 (5) (2003) 721-738.
[5] T.P. Lin, Thermal perception, adaptation and attendance in a public square in hot and humid regions, Building and Environment, 44 (10) (2009) 2017-2026.
[6] A.H.A. Mahmoud, Analysis of the microclimatic and human comfort conditions in an urban park in hot and arid regions, Building and Environment, 46 (12) (2011) 2641-2656.
[7] R. Emmanuel, E. Krüger, Urban heat island and its impact on climate change resilience in a shrinking city: The case of Glasgow, UK, Building and Environment, 53 (2012) 137-149.
[8] M. Nikolopoulou, S. Lykoudis, Thermal comfort in outdoor urban spaces: analysis across different European countries, Building and Environment, 41 (11) (2006) 1455-1470.
[9] T. Xi, Q. Li, A. Mochida, Q. Meng, Study on the outdoor thermal environment and thermal comfort around campus clusters in subtropical urban areas, Building and Environment, (2011).
[10] M. Nikolopoulou, K. Steemers, Thermal comfort and psychological adaptation as a guide for designing urban spaces, Energy and Buildings, 35 (1) (2003) 95-101.
[11] I. Knez, S. Thorsson, Influences of culture and environmental attitude on thermal, emotional and perceptual evaluations of a public square, International Journal of Biometeorology, 50 (5) (2006) 258-268.
[12] T.P. Lin, K.T. Tsai, R.L. Hwang, A. Matzarakis, Quantification of the effect of thermal indices and sky view factor on park attendance, Landscape and Urban Planning, (2012).
[13] M. Nikolopoulou, N. Baker, K. Steemers, Thermal comfort in outdoor urban spaces: understanding the human parameter, Solar Energy, 70 (3) (2001) 227-235.
[14] S. Thorsson, M. Lindqvist, S. Lindqvist, Thermal bioclimatic conditions and patterns of behaviour in an urban park in Göteborg, Sweden, International Journal of Biometeorology, 48 (3) (2004) 149-156.
[15] Z. Chen, L. Zhao, Q. Meng, C. Wang, Y. Zhai, F. Wang, Field measurements on microclimate in residential community in Guangzhou, China, Frontiers of Architecture and Civil Engineering in China, 3 (4) (2009) 462-468.
[16] J.K. Vanos, J.S. Warland, T.J. Gillespie, N.A. Kenny, Review of the physiology of human thermal comfort while exercising in urban landscapes and implications for bioclimatic design, International Journal of Biometeorology, 54 (4) (2010) 319-334.
[17] P.O. Fanger. Thermal comfort. New York: McGraw Hill. (1972).
[18] A.P. Gagge, A. Fobelets, L.G. Berglund, A standard predictive index of human response to the thermal environment, ASHRAE Trans.;(United States), 92 (CONF-8606125-) (1986).
[19] P. Höppe, The physiological equivalent temperature–a universal index for the biometeorological assessment of the thermal environment, International Journal of Biometeorology, 43 (2) (1999) 71-75.
[20] J. Pickup, R. de Dear, An outdoor thermal comfort index (OUT_SET*)-Part I-The Mmodel and its assumptions, in: Biometeorology and Urban Climatology at the Turn of the Millenium. Selected papers from the Conference ICB-ICUC, 2000, pp. 279-283.
[21] G. Jendritzky, R. de Dear, G. Havenith, UTCI—Why another thermal index?, International Journal of Biometeorology, (2012) 1-8.
[22] T.P. Lin, A. Matzarakis, Tourism climate and thermal comfort in Sun Moon Lake, Taiwan, International Journal of Biometeorology, 52 (4) (2008) 281-290.
[23] P. Höppe, Different aspects of assessing indoor and outdoor thermal comfort, Energy and Buildings, 34 (6) (2002) 661-665.
[24] J.M. Caldieron, M. THITISAWAT, K. POLAKIT, G. MANGONE, Statistical model evaluations and calibrations for outdoor comfort assessment in South Florida, PLEA 2011: Architecture and Sustainability Development, (2010).
[25] M. Nikolopoulou, Designing open spaces in the urban environment: a bioclimatic approach. Athens: CRES. (2004).
[26] M. Santamouris, A. Synnefa, T. Karlessi, Using advanced cool materials in the urban built environment to mitigate heat islands and improve thermal comfort conditions, Solar Energy, 85 (12) (2011) 3085-3102.
[27] B. Givoni, M. Noguchi, H. Saaroni, O. Pochter, Y. Yaacov, N. Feller, S. Becker, Outdoor comfort research issues, Energy and Buildings, 35 (1) (2003) 77-86.