Embed Size (px)
Citation preview
BP SECRET
3Q 2017Results
31 October 2017
1

BP 3Q 2017 RESULTS
Jess MitchellGroup Head of Investor Relations
Hello and welcome. This is BP’s third-quarter 2017 results webcast and conference call.
I’m Jess Mitchell, BP’s Head of Investor Relations and I’m here with our Chief FinancialOfficer, Brian Gilvary.
Before we start, I need to draw your attention to our cautionary statement.
2

BP 3Q 2017 RESULTS 3
Cautionary statementForward-looking statements - cautionary statement
In order to utilize the ‘safe harbor’ provisions of the United States Private Securities Litigation Reform Act of 1995 (the ‘PSLRA’), BP is providing the following cautionary statement. This presentation and theassociated slides and discussion contain forward-looking statements – that is, statements related to future, not past events – with respect to the financial condition, results of operations and business of BPand certain of the expectations, intentions, plans and objectives of BP with respect to these items, in particular statements regarding expectations related to future oil prices and supply and demand;expectations regarding future inventory levels; expectations regarding industry refining margins and turnaround activity in the fourth quarter of 2017; expectations regarding Upstream reported production in thefourth quarter of 2017; expectations regarding Upstream momentum through 2018 and beyond; expectations regarding BP’s share of Rosneft’s production and underlying net income in the third quarter of2017; expectations regarding Rosneft interim dividends for 2017 and Rosneft operational and financial information for the third quarter of 2017; expectations regarding the timing and amount of futurepayments relating to the Gulf of Mexico oil spill; plans and expectations with respect to Upstream projects, investments and activities in Australia, Azerbaijan, Egypt, Oman and Trinidad; expectations regardingAker BP ASA’s agreement to acquire Hess Norge AS; expectations regarding BP’s divestment of its shareholding in SECCO; expectations regarding the full year effective tax rate; expectations regardingorganic capital expenditure and organic free cash flow through 2021; expectations regarding inorganic cash flow; expectations regarding the amount and timing of divestment proceeds, including expectationsregarding divestment proceeds through 2021; plans and expectations to target gearing within a 20-30% band; plans and expectations to reduce the organic cash balance point to around $35-40 per barrel by2021 and to sustain a balanced position in 2018; [and plans and expectations with respect to dividends]. By their nature, forward-looking statements involve risk and uncertainty because they relate to eventsand depend on circumstances that will or may occur in the future and are outside the control of BP. Actual results may differ materially from those expressed in such statements, depending on a variety offactors, including: the specific factors identified in the discussions accompanying such forward-looking statements; the receipt of relevant third party and/or regulatory approvals; the timing and level ofmaintenance and/or turnaround activity; the timing and volume of refinery additions and outages; the timing of bringing new fields onstream; the timing, quantum and nature of certain divestments; futurelevels of industry product supply, demand and pricing, including supply growth in North America; OPEC quota restrictions; PSA effects; operational and safety problems; potential lapses in product quality;economic and financial market conditions generally or in various countries and regions; political stability and economic growth in relevant areas of the world; changes in laws and governmental regulations;regulatory or legal actions including the types of enforcement action pursued and the nature of remedies sought or imposed; the actions of prosecutors, regulatory authorities and courts; delays in theprocesses for resolving claims; exchange rate fluctuations; development and use of new technology; recruitment and retention of a skilled workforce; the success or otherwise of partnering; the actions ofcompetitors, trading partners, contractors, subcontractors, creditors, rating agencies and others; our access to future credit resources; business disruption and crisis management; the impact on our reputationof ethical misconduct and non-compliance with regulatory obligations; trading losses; major uninsured losses; decisions by Rosneft’s management and board of directors; the actions of contractors; naturaldisasters and adverse weather conditions; changes in public expectations and other changes to business conditions; wars and acts of terrorism; cyber-attacks or sabotage; and other factors discussed under“Principal risks and uncertainties” in the results announcement for the period ended 30 June 2017 and “Risk factors” in BP Annual Report and Form 20-F 2016 as filed with the US Securities and ExchangeCommission.
This document contains references to non-proved resources and production outlooks based on non-proved resources that the SEC's rules prohibit us from including in our filings with the SEC. U.S. investorsare urged to consider closely the disclosures in our Form 20-F, SEC File No. 1-06262. This form is available on our website at www.bp.com. You can also obtain this form from the SEC by calling 1-800-SEC-0330 or by logging on to their website at www.sec.gov
Reconciliations to GAAP - This presentation also contains financial information which is not presented in accordance with generally accepted accounting principles (GAAP). A quantitative reconciliation of thisinformation to the most directly comparable financial measure calculated and presented in accordance with GAAP can be found on our website at www.bp.com.Tables and projections in this presentation are BP projections unless otherwise stated. October 2017
During today’s presentation, we will make forward-looking statements that refer to ourestimates, plans and expectations. Actual results and outcomes could differ materially due tofactors we note on this slide and in our UK and SEC filings. Please refer to our Annual Report,Stock Exchange Announcement and SEC filings for more details. These documents areavailable on our website.
Thank you, and now over to Brian.
3

BP 3Q 2017 RESULTS 4
BP 3Q 2017 RESULTS
Brian GilvaryChief Financial Officer
Thanks Jess.
4

BP 3Q 2017 RESULTS 5
Agenda
Environment
3Q 2017 Results
Financial frame
Business update
Q&A
Good morning everyone and thank you for joining us.
Our third-quarter results saw continued strong operational and financial performance. TheUpstream and Downstream businesses are executing against the growth plan we laid out atthe start of the year, and we have seen another quarter of robust underlying earnings andcash flow delivery. All of this provides us with momentum as we approach the end of the yearand look forward into 2018.
I’ll start by looking at the external environment in more detail, before taking you through theresults and updating you on the financial frame, including the significant progress made inrebalancing sources and uses of cash. I’ll then finish with an update on progress in each of theSegments before taking time to answer any questions.
5

So starting with the oil market.
The Brent oil price has shown some recovery since September, reaching the highest levelsince July 2015. Inventory reductions and continued efforts from OPEC and non-OPECcountries to maintain cuts supported price gains in the third quarter.
Looking ahead there are a number of factors influencing the oil price. Oil demand over theremainder of the year is expected to remain robust. Non-OPEC supply is projected to increase,largely driven by stronger US tight oil production. At the same time overall compliance amongthe OPEC and non-OPEC countries participating in agreed production cuts remains high andthe agreement is currently in force through March 2018.
Overall we expect inventory levels to continue to edge lower, although there still remains a lotof uncertainty around the pace of that adjustment and around the longer term outlook.
6
BP 3Q 2017 RESULTS 6
2500
2600
2700
2800
2900
3000
3100
2014 2015 2016 2017
Oil market
OECD commercial inventories2
mbbls
(1) Source: Platts (2) Source: International Energy Agency © OECD/IEA 2017
Brent oil price1
$/bbl
20
30
40
50
60
70
2015 2016 2017 2018
Spot Futures
5-year rolling average
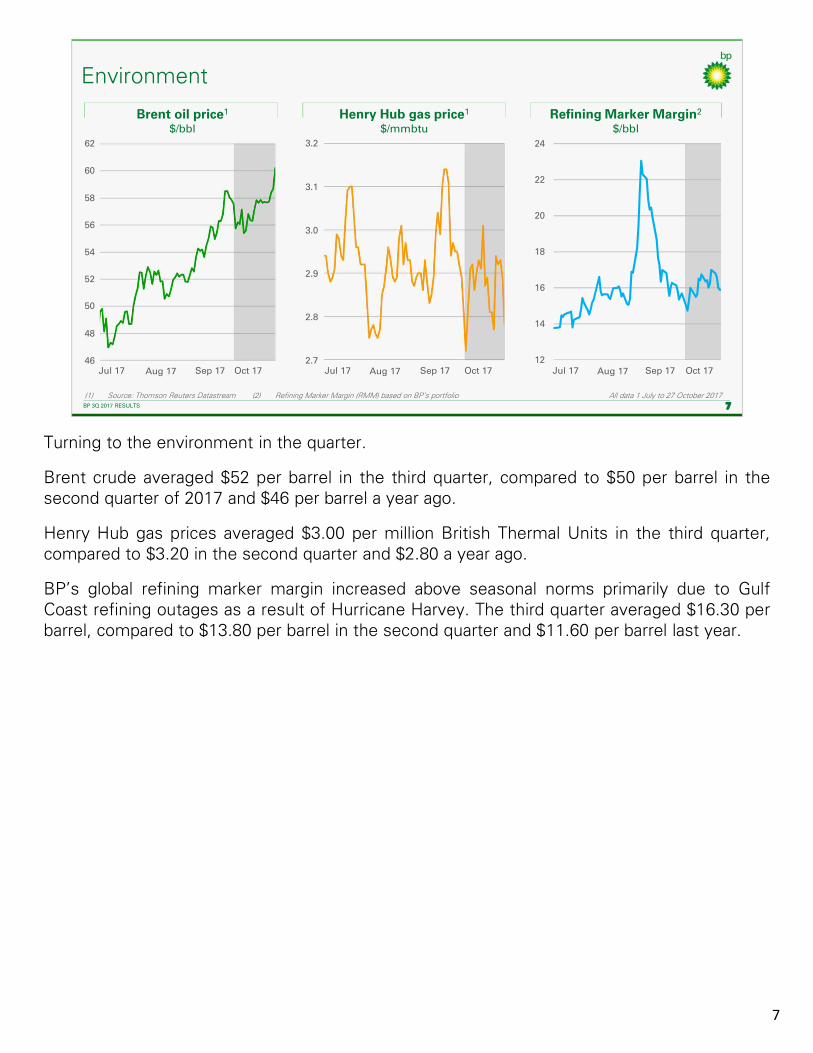
Turning to the environment in the quarter.
Brent crude averaged $52 per barrel in the third quarter, compared to $50 per barrel in thesecond quarter of 2017 and $46 per barrel a year ago.
Henry Hub gas prices averaged $3.00 per million British Thermal Units in the third quarter,compared to $3.20 in the second quarter and $2.80 a year ago.
BP’s global refining marker margin increased above seasonal norms primarily due to GulfCoast refining outages as a result of Hurricane Harvey. The third quarter averaged $16.30 perbarrel, compared to $13.80 per barrel in the second quarter and $11.60 per barrel last year.
7
BP 3Q 2017 RESULTS 7
12
14
16
18
20
22
24
Environment
Brent oil price1
$/bblHenry Hub gas price1
$/mmbtuRefining Marker Margin2
$/bbl3.2
Jul 17 Aug 17
48
50
52
46
2.9
3.056
Sep 17
54
58
62
3.1
2.8
2.7
(1) Source: Thomson Reuters Datastream (2) Refining Marker Margin (RMM) based on BP’s portfolio All data 1 July to 27 October 2017
Oct 17 Jul 17 Aug 17 Sep 17 Oct 17 Jul 17 Aug 17 Sep 17 Oct 17
60

BP 3Q 2017 RESULTS 8
3Q 2017 Summary
(1) Replacement cost profit before interest and tax (RCPBIT), adjusted for non-operating items and fair value accounting effects(2) BP estimate of Rosneft earnings after interest, tax and minority interest(3) Finance costs and net finance income or expense relating to pensions and other post-retirement benefits(4) Underlying operating cash flow is net cash provided by/(used in) operating activities excluding pre-tax Gulf of Mexico oil spill payments
$bn 3Q16 2Q17 3Q17 % Y-o-Y % Q-o-Q
Upstream (0.2) 0.7 1.6
Downstream 1.4 1.4 2.3
Other businesses & corporate (0.3) (0.4) (0.4)
Underlying business RCPBIT1 0.9 1.8 3.5 270% 99%
Rosneft2 0.1 0.3 0.1
Consolidation adjustment - unrealised profit in inventory 0.0 0.1 (0.1)
Underlying RCPBIT1 1.1 2.2 3.5 224% 62%
Finance costs3 (0.4) (0.4) (0.4)
Tax 0.2 (1.1) (1.2)
Minority interest 0.0 (0.0) 0.0
Underlying replacement cost profit 0.9 0.7 1.9 100% 173%
Underlying operating cash flow4 4.8 6.9 6.6 36% (5%)
Underlying earnings per share (cents) 5.0 3.5 9.4 90% 172%
Dividend paid per share (cents) 10 10 10 0% 0%
Looking at the results for the Group.
BP’s third-quarter underlying replacement cost profit was $1.9 billion, compared with $930million a year ago, and $680 million in the second quarter of 2017.
Compared to a year ago, the result reflects:
− Higher liquids and gas realisations; coupled with
− Higher Upstream volumes from major project start-ups and the Abu Dhabi concessionrenewal; and
− Underlying Downstream growth and a stronger refining environment.
Partly offset by the absence of a one-off tax benefit related to the UK North Sea.
Compared to the previous quarter, the result reflects:
− Higher liquids realisations;
− Lower exploration write-offs; and
− A stronger refining environment along with an improved oil supply and trading result aftera weak second quarter.
Third-quarter underlying operating cash flow, which excludes pre-tax Gulf of Mexico oil spillpayments, was $6.6 billion.
The third-quarter dividend, payable in the fourth quarter of 2017, remains unchanged at 10cents per ordinary share.
8
BP 3Q 2017 RESULTS 9
Upstream
(1) Realisations based on sales of consolidated subsidiaries only, excluding equity-accounted entities(2) Group reported oil and gas production including Rosneft(3) Replacement cost profit (loss) before interest and tax (RCPBIT), adjusted for non-operating items and fair value accounting effects
Realisations1
$/bbl, $/mcfVolumemboe/d
Underlying RCPBIT3
$bn
0
2
4
6
8
10
12
0
10
20
30
40
50
60
3Q16 4Q16 1Q17 2Q17 3Q17
Liquids ($/bbl) Gas ($/mcf)
1500
2000
2500
3000
3500
4000
3Q16 4Q16 1Q17 2Q17 3Q17
Group production
Upstream production excluding Rosneft
(0.2)
0.4
1.4
0.7
1.6
(0.5)
0.0
0.5
1.0
1.5
2.0
3Q16 4Q16 1Q17 2Q17 3Q17
Non-US US Total RCPBIT
2
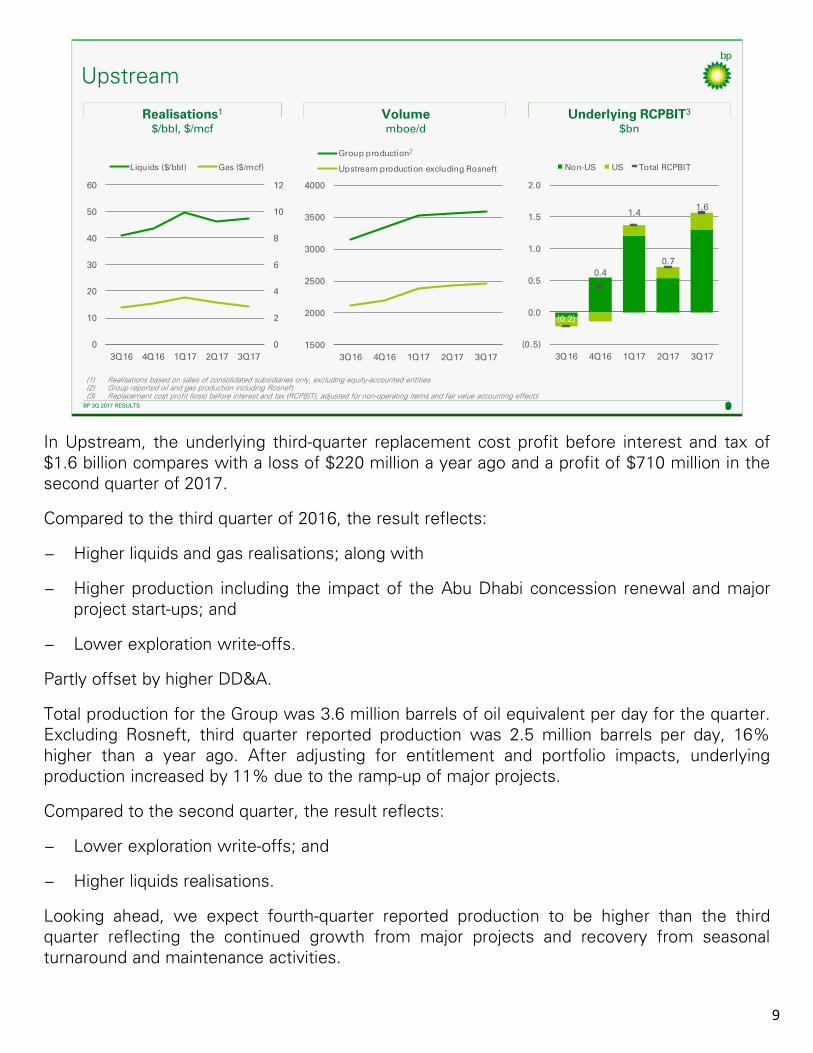
In Upstream, the underlying third-quarter replacement cost profit before interest and tax of$1.6 billion compares with a loss of $220 million a year ago and a profit of $710 million in thesecond quarter of 2017.
Compared to the third quarter of 2016, the result reflects:
− Higher liquids and gas realisations; along with
− Higher production including the impact of the Abu Dhabi concession renewal and majorproject start-ups; and
− Lower exploration write-offs.
Partly offset by higher DD&A.
Total production for the Group was 3.6 million barrels of oil equivalent per day for the quarter.Excluding Rosneft, third quarter reported production was 2.5 million barrels per day, 16%higher than a year ago. After adjusting for entitlement and portfolio impacts, underlyingproduction increased by 11% due to the ramp-up of major projects.
Compared to the second quarter, the result reflects:
− Lower exploration write-offs; and
− Higher liquids realisations.
Looking ahead, we expect fourth-quarter reported production to be higher than the thirdquarter reflecting the continued growth from major projects and recovery from seasonalturnaround and maintenance activities.
9

BP 3Q 2017 RESULTS 10
0
4
8
12
16
20
24
3Q16 4Q16 1Q17 2Q17 3Q17
RMM WTI CMA-WCS spread
Downstream
Refining environment$/bbl
Refining availability%
Underlying RCPBIT2
$bn
(1) Source: Platts (CMA: Calendar Month Average); lagged by one month(2) Replacement cost profit before interest and tax (RCPBIT), adjusted for non-operating items and fair value accounting effects
1
1.4
0.9
1.7
1.4
2.3
0.0
0.5
1.0
1.5
2.0
2.5
3Q16 4Q16 1Q17 2Q17 3Q17
Fuels Lubricants
Petrochemicals Total RCPBIT
86
88
90
92
94
96
98
3Q16 4Q16 1Q17 2Q17 3Q17
Turning to Downstream, the third-quarter underlying replacement cost profit before interestand tax was $2.3 billion compared with $1.4 billion a year ago and $1.4 billion in the secondquarter.
The Fuels business reported an underlying replacement cost profit before interest and tax of$1.8 billion in the third quarter, compared with $980 million a year ago and $910 million in thesecond quarter.
Compared to a year ago the result reflects:
− Strong refining operational performance, capturing improved industry refining marginspartly offset by narrower North American heavy crude oil differentials;
− Continued earnings growth in fuels marketing; and
− An improved supply and trading contribution.
Compared to the second quarter, the result reflects:
− Increased refining performance from stronger operations, higher industry refining marginsand a lower level of turnaround activity;
− A stronger supply and trading contribution after a weak second quarter; and
− Continued earnings growth in fuels marketing.
The Lubricants business reported an underlying replacement cost profit of $360 million in thethird quarter reflecting continued premium brand growth, offset by the impact of higher baseoil prices due to temporary supply constraints.
And the Petrochemicals business reported an underlying replacement cost profit of $19010

million in the third quarter reflecting an improved margin environment,improved margin optimisation and lower costs from our simplification andefficiency programmes.
While industry refining margins have remained robust coming into the fourthquarter we would expect a normal seasonal decline compared with the thirdquarter. And we expect a higher level of turnaround activity in the fourthquarter.
10

Turning to Rosneft.
Based on preliminary estimates, we have recognised $140 million as BP’s share of Rosneft’sunderlying net income for the third quarter compared to $120 million a year ago and $280million in the second quarter of 2017. The estimate reflects a higher Urals price and duty lagbenefit but was impacted by adverse foreign exchange movements.
Our estimate of BP’s share of Rosneft’s production for the third quarter is 1.1 million barrels ofoil equivalent per day, an increase of 9% compared with a year ago and broadly flat comparedwith the previous quarter. The increase compared with last year reflects the completion ofrecent acquisitions and new fields coming online.
In line with the new dividend policy that includes payments to shareholders twice a year,Rosneft announced an interim dividend for the first half of 2017 representing 50% of IFRS netincome. At current exchange rates, BP’s share of the dividend is around $120 million after taxand is expected to be received in the fourth quarter. This is in addition to the $190 millionreceived in the third quarter for the 2016 annual dividend.
Further details will be available when Rosneft report their third-quarter results.
11
BP 3Q 2017 RESULTS 11
BP share of underlying net income1
$bn
Average Urals price$/bbl
BP share of Rosneftdividend
$bn
(1) On a replacement cost basis and adjusted for non-operating items; 3Q17 represents BP estimate(2) Half yearly dividend declared representing 50% of Rosneft’s IFRS net income for 1H 2017, expected to be paid in the fourth quarter(3) Annual dividends paid in the third quarter, in respect of the previous year
38
40
42
44
46
48
50
52
54
3Q16 4Q16 1Q17 2Q17 3Q170.0
0.1
0.2
0.3
3Q16 4Q16 1Q17 2Q17 3Q170.0
0.2
0.4
2015 2016 2017
Half yearly dividend declared
Annual dividend for previous year
2
3
Rosneft

BP 3Q 2017 RESULTS 12
Other items
OB&C underlying RCPBIT1
$bnAdjusted effective tax rate2
%
(1) Other businesses and corporate replacement cost profit before interest and tax (RCPBIT), adjusted for non-operating items (2) Effective tax rate on replacement cost profit adjusted to remove the effects of non-operating items and fair value accounting effects
(0.5)
(0.4)
(0.3)
(0.2)
(0.1)
0.03Q16 4Q16 1Q17 2Q17 3Q17
0
10
20
30
40
50
60
70
3Q16 4Q16 1Q17 2Q17 3Q17
In Other Businesses and Corporate, we reported a pre-tax underlying replacement cost chargeof $400 million for the third quarter. The average quarterly charge for the first nine months ofthe year is $400 million.
The adjusted effective tax rate for the third quarter was 40% compared to 37% a year ago.This reflects the impact of the Abu Dhabi concession renewal and other changes in the mix ofprofits.
We expect the full-year underlying effective tax rate to be above 40%.
12

BP 3Q 2017 RESULTS 13
0
3
6
9
0
3
6
9
0
4
8
12
16
20
0
4
8
12
16
20
Sources and uses of cashYTD 2016 organic cash inflows/outflows $bn
Other inflows/outflows $bn
YTD 2017 organic cash inflows/outflows $bn
Other inflows/outflows $bn
(1) Underlying operating cash flow is net cash provided by/(used in) operating activities excluding pre-tax Gulf of Mexico oil spill payments(2) Cash dividends paid
Underlying cash flow1 Organic capex
Dividends2
Disposals
Gulf of Mexico oil spill
Underlying cash flow1 Organic capex
Dividends2
Disposals
Gulf of Mexico oil spill
Inorganic capexInorganic capex
Moving to cash flows, this slide compares our sources and uses of cash in the first ninemonths of 2016 and 2017.
Excluding pre-tax oil spill related outgoings, underlying operating cash flow was $17.9 billionfor the first nine months, of which $6.6 billion was generated in the third quarter. Thisincludes a working capital release of $1.5 billion in the first nine months with $1.4 billion in thethird quarter.
Organic capital expenditure was $11.9 billion in the first nine months and $4.0 billion in thethird quarter.
Divestment proceeds year-to-date totalled $1.0 billion.
Pre-tax Gulf of Mexico oil spill payments were significantly lower in the third quarter at $560million, bringing payments for the first nine months to $4.9 billion.
Net debt at the end of the quarter was flat compared with last quarter at $39.8 billion. Gearingreduced to 28.4%, within our 20-30% band.
13

14
BP 3Q 2017 RESULTS 14
Financial framework
Rebalancing organic sources and uses of cash –year-to-date surplus $1.8bn1
Momentum in operating performance across our businesses
Continuous efficiency improvement and transformation
share buyback programme to offset the impact of scrip dilution over time
2018 to 20212017
Organic capital expenditure ~$16bn $15-17bn p.a. with flexibility to go lower
Divestments ~$4.5bn Typically $2-3bn p.a.
Deepwater Horizon cash payments ~$5.5bn Just over $2bn in 2018Stepping down thereafter
Recommencing
(1) Surplus: operating cash flow excluding Gulf of Mexico oil spill payments, plus proceeds from loan repayments, less organic capital expenditure and the cash dividend
Turning to the financial frame. We have made strong progress in rebalancing organic sourcesand uses of cash. Underlying operating cash flow more than covered organic capitalexpenditure and the full dividend in a quarter where Brent averaged $52 per barrel. We remainconfident in sustaining a balanced position in 2018 and beyond, which will allow us to beginoffsetting the dilution from our optional scrip dividend – I will come back to the detail of thisshortly.
Our operating businesses continue to execute against the plan we laid out at the start of thisyear. Upstream have now started-up six of the seven major projects planned for the year. AndDownstream continues to deliver resilient underlying performance across the businesses.Across the Group, we remain focused on delivering continuous efficiency improvements, aswe progress our modernisation and transformation agenda.
Our capital expenditure plans remain very disciplined. Looking out to 2021 we expect tomaintain organic capital expenditure within a range of $15-17 billion without exceeding $17billion in any year. We expect organic capital expenditure this year to be around $16 billion. For2018, at oil prices of around $50 per barrel, we would expect to be at the lower end of therange. However, as we said previously, this is not a floor. If oil prices moved structurally lowerwe would continue to drive towards an even lower investment frame for the Group.
Turning to inorganic cash flow. In line with our previous guidance, we expect the full year Gulfof Mexico oil spill payments to be around $5.5 billion. From 2018 we expect payments to bematerially lower, at just over $2 billion, weighted towards the first half of the year consistentwith the Civil and Criminal settlement schedule. Payments then step down to a little over $1billion per annum from 2019 onwards.
Divestment proceeds expected to be received in the fourth quarter include $1.4 billion fromthe SECCO transaction announced in the second quarter and net proceeds of over $700

million from the initial public offering of BP Midstream Partners. Totalproceeds in 2017 are expected to be around $4.5 billion. Longer term, weexpect divestments to reduce to a more typical $2-3 billion per annum, whileremaining a lever for high-grading our portfolio and creating flexibility withinthe financial frame.
14

15
BP 3Q 2017 RESULTS 15
(1) Organic free cash flow: operating cash flow excluding Gulf of Mexico oil spill payments less organic capital expenditure. In USD cents per ordinary share, based on BP planning assumptions(2) DPS: dividend per ordinary share. Cash DPS assumes 20% scrip uptake (3) Illustrative only, not to scale. Based on BP planning assumptions. Covers full dividend
Capacity to grow distributions Oil price balance point3
$/bblOrganic free cash flow per share1
2018 2021
Current cash DPS2
100% currentDPS2
Brent price$50-55/bbl real
2014 2015 2016 2017 2018 2019 2020 2021
Balance point reduces
$35-40/bbl
2021+
Now coming back to the oil price balance point.
As already noted, we delivered surplus organic free cash flow of $1.8 billion in the first ninemonths. The Brent oil price cash balance point for the Group was $42 per barrel, or theequivalent of $49 per barrel on a full dividend basis. Our balance sheet remains robust, withgearing at 28.4% at the end of the third quarter, down 0.4% from the end of last quarter andwithin our target 20-30% band.
With that background, let me remind you of our position on the scrip dividend option that weprovide to our shareholders. This program was put in place in 2010 as an undiscountedalternative to the cash dividend. On average, since inception, the election uptake has beenaround 20%. This has provided some financial flexibility during the transition to lower oilprices. We have also been clear that once we return to generating free cash flow, our intentwould be to address the dilution from the scrip dividend as a first priority.
Given the strong progress we have made towards rebalancing so far this year, and ourconfidence in our ability to grow organic free cash flow in 2018 and beyond, we will berecommencing a share buyback programme this quarter to offset the impact of the secondquarter scrip dividend issued in September. Looking ahead, our intent would be to offset anyongoing scrip dilution through further buybacks over time. The shape of the programme willnot necessarily match the dilution on a quarterly basis, but will reflect the ongoing judgementof factors including changes in the environment, the underlying performance of the business,the outlook for the Group financial framework, and other market factors which may vary fromquarter to quarter.
Looking further out to 2021, and in a constant price environment, we expect organic free cashflow to grow, driven by the growth in our Upstream and Downstream businesses, with theorganic cash balance point for the Group reducing steadily to around $35-40 per barrel,

covering the full dividend including scrip. With free cash flow growing, wewould then aim to ensure the right balance between disciplined investmentand distributions growth, depending on the context and outlook at the time.
15

BP 3Q 2017 RESULTS 16
Upstream milestones and progress
ACG extended to 2049
Accessed discovered resource at $5-6/bbl
Long term growth opportunity
Deepening in an incumbent region
Balanced commercial terms
Quad 204,North Sea
On track for 4Q start-up
6 major projects online
Khazzan,Oman
Persephone,Australia
Juniper,Trinidad & Tobago
Trinidad Onshore Compression
West Nile Delta Taurus/Libra,
Egypt
Zohr, Egypt
16
Now turning to milestones and progress across our businesses.
In the Upstream, our track record of delivery of new major projects continued in the thirdquarter. We now have six out of our seven 2017 major projects online.
Along with our first half start-ups in Egypt, Trinidad and the UK North Sea, we have broughtonline three more projects. Each of which started up on or ahead of schedule and underbudget.
− In July, Persephone in Western Australia started-up successfully, and is expected toproduce around 50 thousand barrels of oil equivalent per day gross from two wells tiedback to the existing North Rankin complex.
− In August, Juniper, BP’s first subsea field development in Trinidad came online. It is thelargest new project to start-up in Trinidad for several years and is expected to producearound 95 thousand barrels of oil equivalent per day.
− In September, we began production from the giant Khazzan gas field in Oman, BP’slargest 2017 start-up. We expect the first phase of the project, made up of 200 wellsfeeding into a two-train central processing facility, to deliver 1 billion cubic feet per daygross. Production will gradually ramp-up through a single 500 million cubic feet per daytrain, with a second identical train expected to come online in the next few months.Production is expected to rise to 1.5 billion cubic feet per day with further expansion ofthe project which is on track for 2020. The two phases together will develop an estimated10.5 trillion cubic feet of recoverable gas resources.
Zohr in Egypt remains on track to come online this year, to complete the seven major projectstart-ups we planned for the year.
Aided by these major projects brought online in 2017, year-to-date underlying production was

around 7% higher than a year ago.
In September, BP, together with our partners, extended the productionsharing agreement for the Azeri, Chirag and Deep Water Gunashli Fields inAzerbaijan to the end of 2049.
This renewal, which extends the PSA by 25 years, includes changes to thepartner equity shares alongside improved profit share terms. Through theextension we have also accessed more than 200 million barrels of proved andprobable reserves at $5-6 per barrel.
We see enormous potential to optimise around this giant field and therenewed agreement allows us to progress into the next stage of developmentof a new platform project.
And also last week, Aker BP, in which we hold a 30% stake, entered into anagreement to acquire Hess Norge. Through this transaction Aker BPbecomes the sole owner of the Valhall and Hod fields in Norway. We seegreat future value here through increased oil recovery and flankdevelopments. This demonstrates the ambition of Aker BP to continue togrow and we expect to see the benefits from late 2017 through increaseddividends.
And as part of the recent 3rd Pre-salt Bid Round in Brazil we have secured twolicenses in partnership with Petrobras and CNPC. These exploration blockspresent us with the opportunity to test some of the largest oil structures inthe prolific Santos pre-salt basin.
Our strong performance year-to-date in the Upstream underlines our progressand we see this momentum continuing as we look to 2018 and beyond.
16

BP 3Q 2017 RESULTS 17
Downstream continued underlying earnings growth
Profitable marketing growth
Double-digit fuels marketing earnings growth
>170 additional convenience partnership sites year-to-date
Strategic partnership in lubricants
US Midstream IPO
Advantaged manufacturing
Underlying earnings growth in refining and petrochemicals
Higher commercial optimisation and advantaged feedstock
SECCO divestment
In Downstream, we continue to make good strategic progress delivering underlying earningsgrowth in both our marketing and manufacturing businesses, delivering the highest quarter forunderlying earnings in 5 years.
In fuels marketing year-to-date, we have delivered double-digit earnings growth and grownpremium fuel volumes by 7%. We continued the rollout of our convenience partnership modelto more than 170 retail sites. This brings our total number of convenience partnership sites toover one thousand globally.
In addition, we have continued to build our strategic partnerships which are underpinned bythe strength of our brands. For example, in Lubricants we announced the renewal of ourglobal partnership and supply agreement with Volvo.
As previously mentioned, the initial public offering of BP Midstream Partners in the USdelivers net proceeds of over $700 million.
In refining, we continued to grow the value from commercial optimisation across the portfolio.In the US, Solomon availability for the quarter was the highest in more than 10 years and weprocessed record levels of advantaged feedstock.
And in Petrochemicals we expect to complete the sale of our share in the SECCO jointventure in China in the fourth quarter.
17

So in summary.
We have made solid progress year-to-date in delivering against the key milestones we set forourselves, and have established strong momentum in the longer-term investment propositionthat we laid out earlier in the year. We are building a track record of organic growth acrossboth our key businesses. The tangible progress we continue to see in sustainably rebalancingorganic sources and uses of cash will allow us to recommence a share buyback programmeto offset the dilution impact of the scrip dividend later this quarter.
- In the Upstream we have started-up six of the seven major projects planned for the year, inmany cases ahead of schedule and under budget.
- In the Downstream, we have added more than 170 new convenience partnership sites,underpinning the growth proposition across our marketing businesses.
- We continue to optimise our portfolio and seek out opportunities to support renewal andgrowth in the future.
- We remain committed to capital discipline and continue to focus on driving costs lower in asafe and sustainable way.
Taken together, these support our principal aim of growing sustainable free cash flow anddistributions to shareholders in both the near and long term.
So on that note, thank you for listening, and we’ll now open to questions.
18
BP 3Q 2017 RESULTS 18
The BP proposition
Safer
Fit for the future
Focused on returns
Safe, reliable and efficient execution
A distinctive portfolio fit for a changing world
Value based,disciplined investment and cost focus
Growing sustainable free cash flow and
distributions toshareholders over
the long-term

BP 3Q 2017 RESULTS 19
Q&A
Brian Gilvary
Chief Financial Officer
Jess Mitchell
Group Head of Investor Relations
19


![6XSHULQWHQGHQW %ULDQ *ROGHQ …...6rxwk0dlq6w _ 0doyhuq $5 6xshulqwhqghqw %uldq *roghq (quroophqw $yj &odvv6l]h $yj \hduvwhdfklqj([shulhqfh 'lvwulfwdyj](https://img.pdfslide.us/doc/110x75/5f5e353f2af192586d656b8f/6xshulqwhqghqw-uldq-roghq-6rxwk0dlq6w-0doyhuq-5-6xshulqwhqghqw-uldq-roghq.jpg)


![fri · 683(5,25 &2857 67$7( 2) &$/,)251,$ &2817< 2) 6$17$ &/$5$ 'hsduwphqw +rqrudeoh %uldq & :dovk 3uhvlglqj -hh-hh 9l]frqgh &rxuwurrp &ohun 1ruwk )luvw 6wuhhw 6dq -rvh &$](https://img.pdfslide.us/doc/110x75/5f914f21ff72fb40bf642aa6/fri-683525-2857-677-2-251-2817-2-617-5.jpg)