Embed Size (px)
Citation preview

V10: Core Pluripotency Network
Chen et al., Cell 133,
1106-1117 (2008)
Mouse ES cells were isolated for the first time in 1981 from mouse blastocysts.
Maintenance of the self-renewing state of mouse ES cells requires the cytokine leukemia inhibitory factor (LIF).
Cytokines (Greek cyto-, cell; and -kinos, movement) are small signaling protein
molecules that are used extensively in intercellular communication..
They are secreted by the glial cells of the nervous system and by numerous cells
of the immune system.
The binding of LIF to its receptor induces overexpression and tyrosine phosphorylation of the protein STAT3 (“signal transducer and activator of transcription 3”) and its subsequent nuclear translocation.
STAT proteins (Signal Transducer and Activator of Transcription) regulate many aspects of growth, survival and differentiation in cells.
SS 2015 – lecture 101
Modeling Cell Fate

2
Cytokines
Cytokines can be classified into proteins, peptides, and glycoproteins.
The term "cytokine" encompasses a large and diverse family of regulators
produced throughout the body by cells of diverse embryological origin.
Sometimes, the term "cytokine" is restricted to immunomodulating agents,
such as interleukins and interferons.
Biochemists disagree as to which molecules should be termed
cytokines and which hormones.
Modeling Cell FateSS 2015 – lecture 10
www.wikipedia.org

3
Cytokines vs. hormones
Concentration:
Classic protein hormones circulate in nanomolar (10-9 M/l) concentrations that
usually vary by less than one order of magnitude.
In contrast, some cytokines (such as IL-6) circulate in picomolar (10-12 M/l)
concentrations that can increase up to 1,000-fold during trauma or infection.
Production:
Virtually all nucleated cells, but especially endo/epithelial cells and resident
macrophages are potent producers of IL-1, IL-6, and TNF-α.
In contrast, classic hormones, such as insulin, are secreted from discrete glands
(e.g., the pancreas).
Modeling Cell FateSS 2015 – lecture 10
www.wikipedia.org
4
Response to cytokines
Each cytokine has a matching cell-surface receptor.
Subsequent cascades of intracellular signalling then alter cell functions.
This may include - the upregulation and/or downregulation of several genes and their TFs, resulting
in the production of other cytokines,
- an increase in the number of surface receptors for other molecules,
- or the suppression of their own effect by feedback inhibition.
Modeling Cell FateSS 2015 – lecture 10
www.wikipedia.org
5
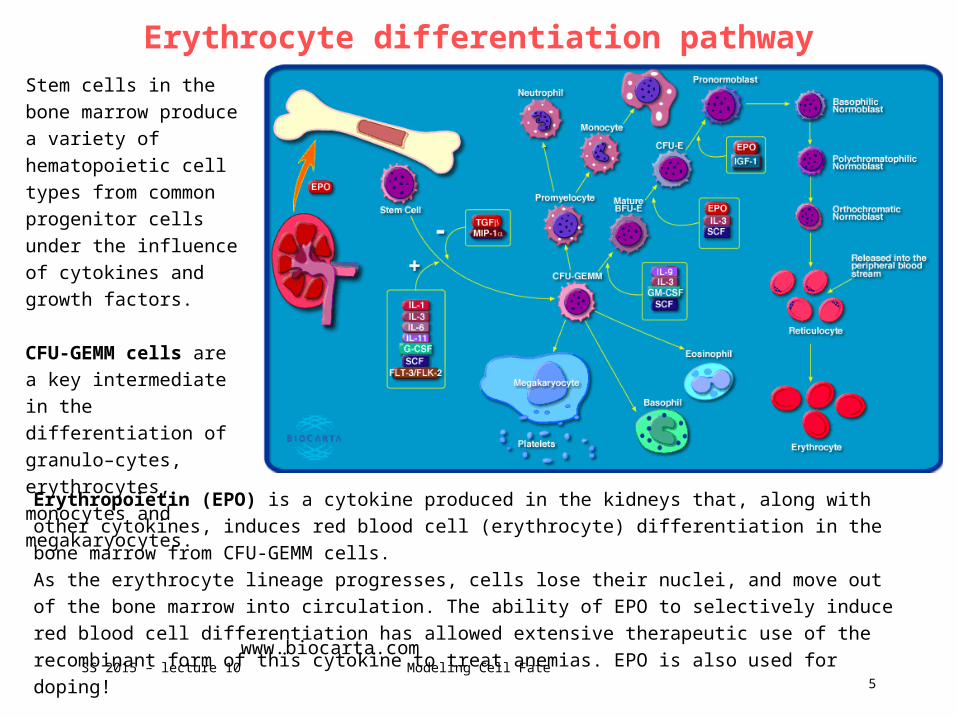
Erythrocyte differentiation pathwayStem cells in the bone
marrow produce a variety
of hematopoietic cell
types from common
progenitor cells under the
influence of cytokines and
growth factors.
CFU-GEMM cells are a
key intermediate in the
differentiation of granulo–
cytes, erythrocytes,
monocytes and
megakaryocytes.
Modeling Cell FateSS 2015 – lecture 10www.biocarta.com
Erythropoietin (EPO) is a cytokine produced in the kidneys that, along with other cytokines, induces red
blood cell (erythrocyte) differentiation in the bone marrow from CFU-GEMM cells.
As the erythrocyte lineage progresses, cells lose their nuclei, and move out of the bone marrow into
circulation. The ability of EPO to selectively induce red blood cell differentiation has allowed extensive
therapeutic use of the recombinant form of this cytokine to treat anemias. EPO is also used for doping!
BMPs
Chen et al., Cell 133,
1106-1117 (2008)
LIF alone, however, is not sufficient to maintain ES cells.
Maintenance of ES cells also requires the presence of fetal calf serum.
Fetal bovine serum (FBS) or fetal calf serum is the blood fraction remaining after the natural coagulation of blood (dt. Blutgerinnung), followed by centrifugation to remove any remaining red blood cells.
Fetal bovine serum is the most widely used serum-supplement for the in vitro cell culture of eukaryotic cells. It contains very low levels of antibodies and many growth factors. One of its major components is the globular protein bovine serum albumin (BSA).
Bone morphogenetic proteins (BMPs) appear to be key serum-derived factors that act in conjunction with LIF to enhance the self-renewal and pluripotency of mouse ES cells.
SS 2015 – lecture 106
Modeling Cell Fate
Integrating effect of signaling pathways
Chen et al., Cell 133,
1106-1117 (2008)
The binding of BMP4 to its receptors triggers the phosphorylation of Smad1 and activates the expression of members of the Id (inhibitor of differentiation) gene family.
ES cells that overexpress Ids can self-renew in the absence of BMP4.
Thus, induction of Id expression is likely a critical contribution of the BMP/Smad pathway.
Hence, the LIF and BMP signaling pathways play a central role in the maintenance of a pluripotent stem cell phenotype.
Besides these signaling pathways, which sense the presence of extrinsic growth factors in the environment, intrinsic factors such as transcription factors (TFs) are also essential for specifying the undifferentiated state of ES cells.
SS 2015 – lecture 107
Modeling Cell Fate
TFs in Core Pluripotency Network
Chen et al., Cell 133,
1106-1117 (2008)
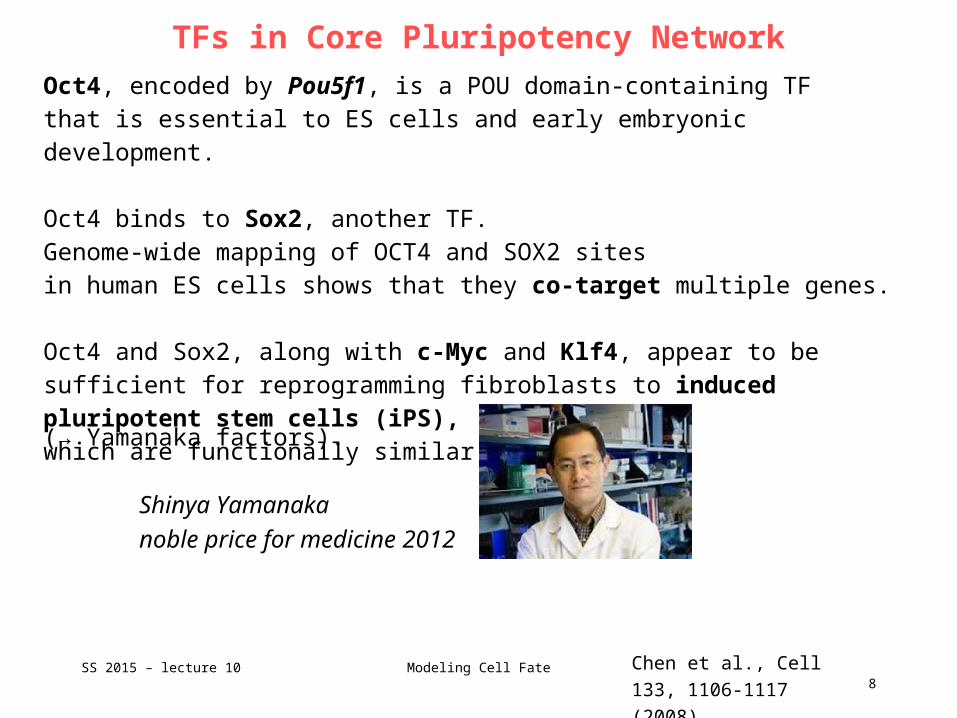
Oct4, encoded by Pou5f1, is a POU domain-containing TF that is essential to ES cells and early embryonic development.
Oct4 binds to Sox2, another TF. Genome-wide mapping of OCT4 and SOX2 sites in human ES cells shows that they co-target multiple genes.
Oct4 and Sox2, along with c-Myc and Klf4, appear to be sufficient for reprogramming fibroblasts to induced pluripotent stem cells (iPS),which are functionally similar to ES cells.
SS 2015 – lecture 108
Modeling Cell Fate
(→ Yamanaka factors).
Shinya Yamanaka
noble price for medicine 2012

Other TFs in Core Pluripotency Network
Chen et al., Cell 133,
1106-1117 (2008)
Hence, these 4 TFs can exert a dominant role in reconstructing the transcriptional regulatory network of ES cells.
A third well-studied TF in ES cells is Nanog. Nanog can sustain pluripotency in ES cells even in the absence of LIF.
In addition to this, some further transcriptional regulators such as Esrrb and Zfxare required to maintain ES cells in the state of pluripotency.
Q: How do these TFs control cell fate?
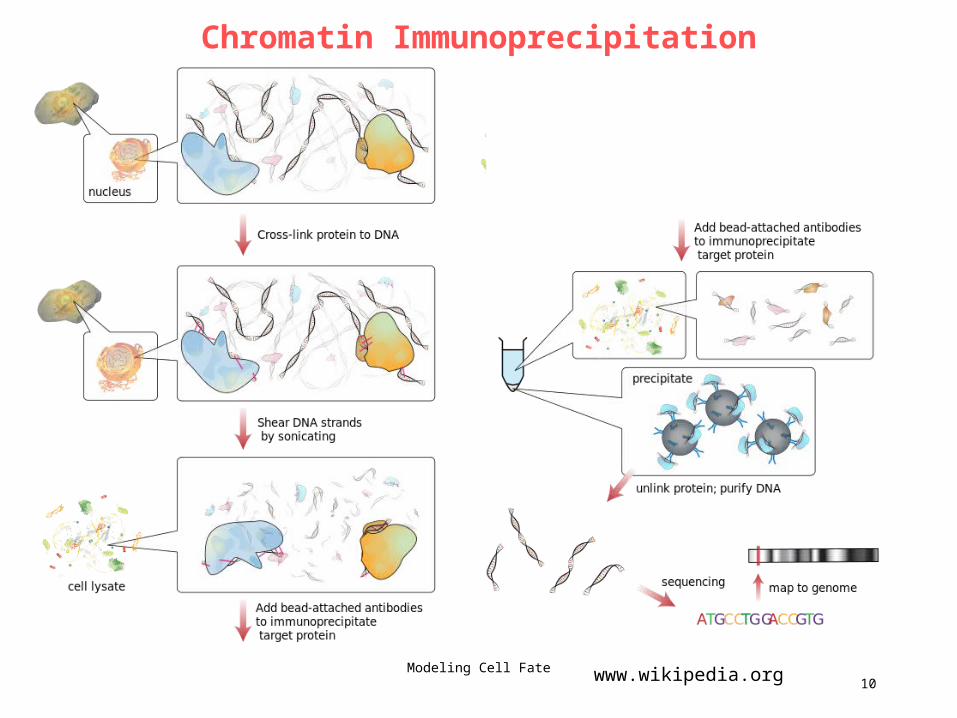
Idea: map the in vivo binding loci for 13 sequence-specific TFs and 2 transcription coregulators in living mouse ES cells using ChIP-seq experiments.
SS 2015 – lecture 109
Modeling Cell Fate
www.wikipedia.orgSS 2015 – lecture 1010
Chromatin Immunoprecipitation
Modeling Cell Fate

Other TFs in Core Pluripotency Network
Chen et al., Cell 133,
1106-1117 (2008)
Nanog, Oct4, Sox2, Esrrb, and Zfx are known regulators of pluripotency and/or self-renewal.
Smad1 and STAT3 are key components of the signaling pathways mediated by BMP and LIF, respectively.
Tcfcp2l1 is preferentially upregulated in ES cells.
E2F1 regulates cell-cycle progression and associates extensively with promoter regions.
Klf4 and Myc TFs are reprogramming factors that are also implicated in the maintenance of the undifferentiated state of ES cells
CTCF is required for transcriptional insulation.
SS 2015 – lecture 1011
Modeling Cell Fate
Binding data at Oct4 and Nanog gene loci
Chen et al., Cell 133,
1106-1117 (2008)
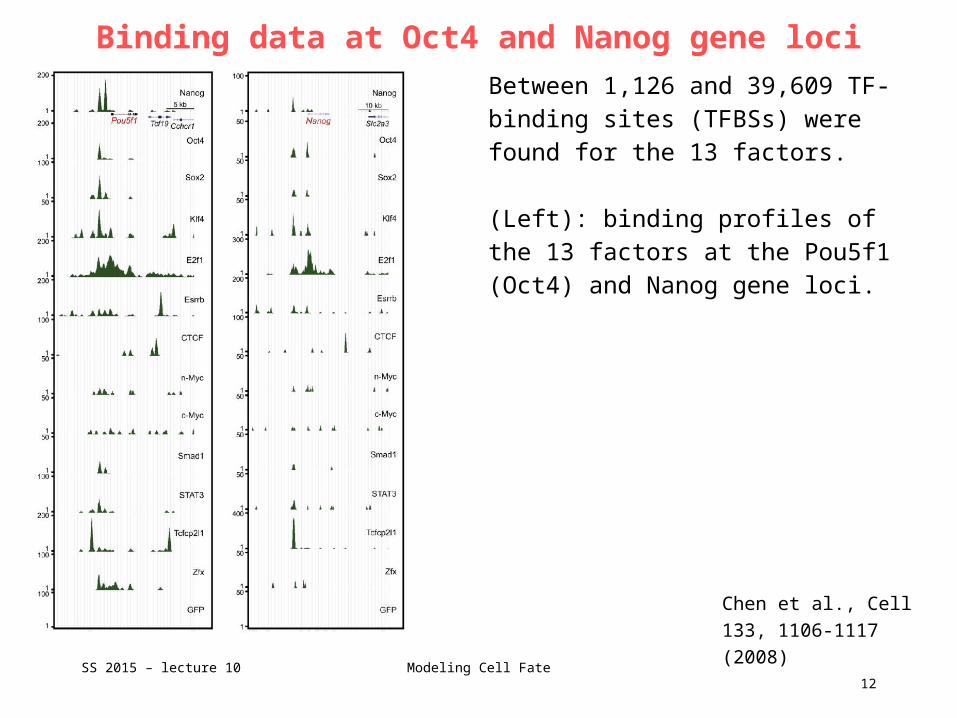
Between 1,126 and 39,609 TF-binding sites (TFBSs) were found for the 13 factors.
(Left): binding profiles of the 13 factors at the Pou5f1 (Oct4) and Nanog gene loci.
SS 2015 – lecture 1012
Modeling Cell Fate

Derivation of binding motifs
Chen et al., Cell 133,
1106-1117 (2008)
To determine the in vivo sequence specificity of the TFs, derive consensus sequence motifs by a de novo motif-discovery algorithm.
- For each factor, select the sequences (±100 bp) corresponding to its top 500 binding peaks, - mask sequence repeats, - find sequences that are overrepresen-ted against what is expected to occur randomly (using the program Weeder).
SS 2015 – lecture 1013
Modeling Cell Fate
Motif Discovery
Pavesi et al., Nucl Ac Res
32, W199-W203 (2004)SS 2015 – lecture 10
14Modeling Cell Fate
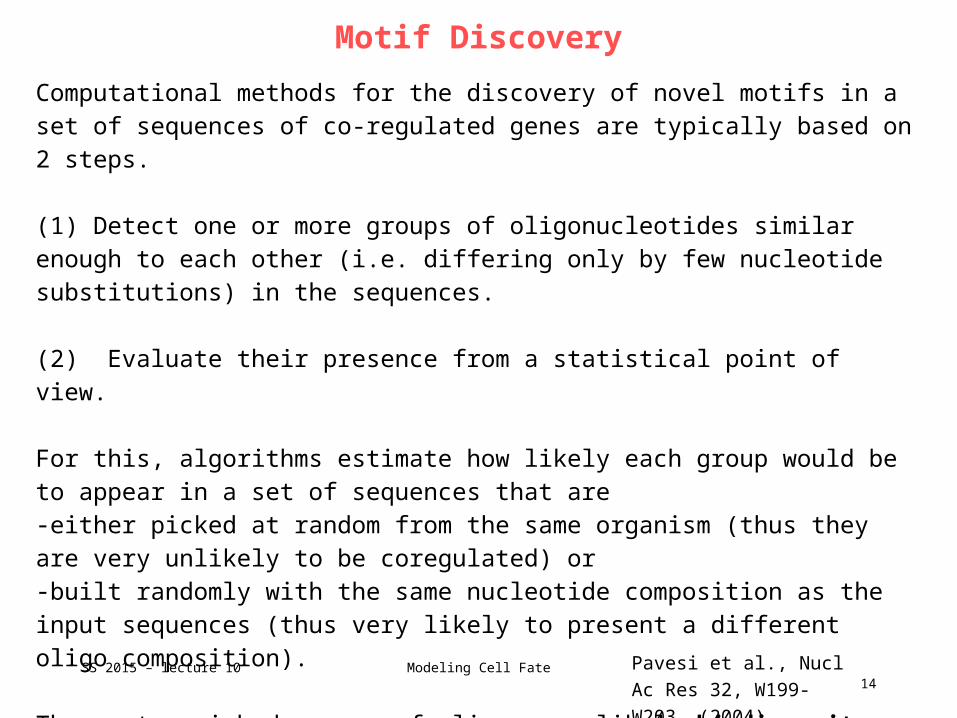
Computational methods for the discovery of novel motifs in a set of sequences of co-regulated genes are typically based on 2 steps.
(1) Detect one or more groups of oligonucleotides similar enough to each other (i.e. differing only by few nucleotide substitutions) in the sequences. (2) Evaluate their presence from a statistical point of view.
For this, algorithms estimate how likely each group would be to appear in a set of sequences that are -either picked at random from the same organism (thus they are very unlikely to be coregulated) or -built randomly with the same nucleotide composition as the input sequences (thus very likely to present a different oligo composition).
The most enriched groups of oligos are likely binding sites for some TFs.
Sox2-Oct4 pair
Chen et al., Cell 133,
1106-1117 (2008)
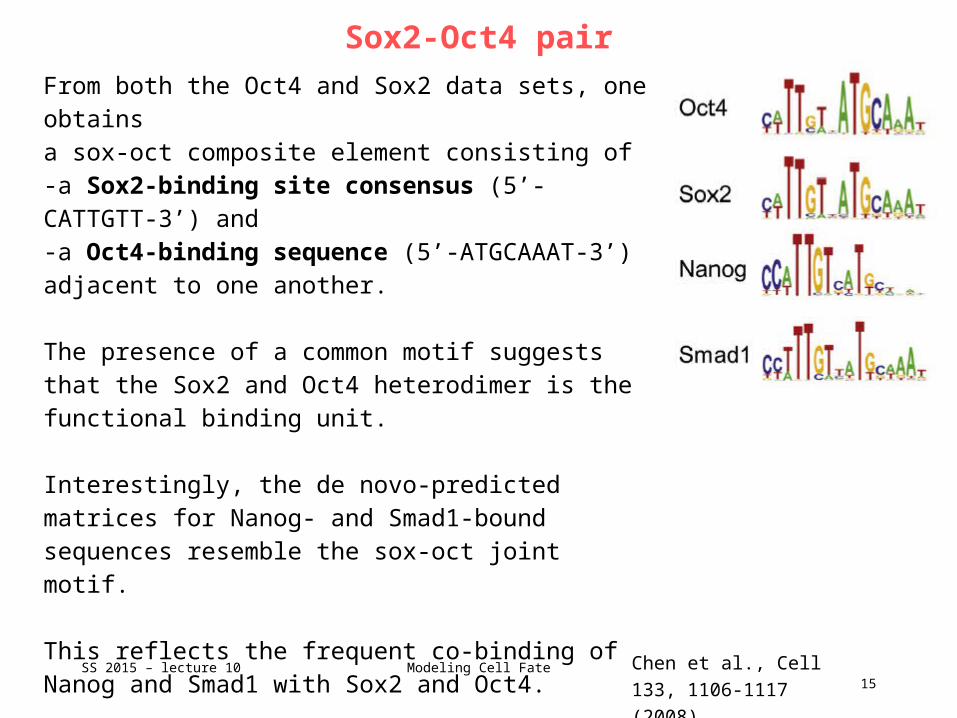
From both the Oct4 and Sox2 data sets, one obtainsa sox-oct composite element consisting of -a Sox2-binding site consensus (5’-CATTGTT-3’) and -a Oct4-binding sequence (5’-ATGCAAAT-3’) adjacent to one another.
The presence of a common motif suggests that the Sox2 and Oct4 heterodimer is the functional binding unit.
Interestingly, the de novo-predicted matrices for Nanog- and Smad1-bound sequences resemble the sox-oct joint motif.
This reflects the frequent co-binding of Nanog and Smad1 with Sox2 and Oct4.
SS 2015 – lecture 1015
Modeling Cell Fate
16
Complexes of the central regulator Oct4
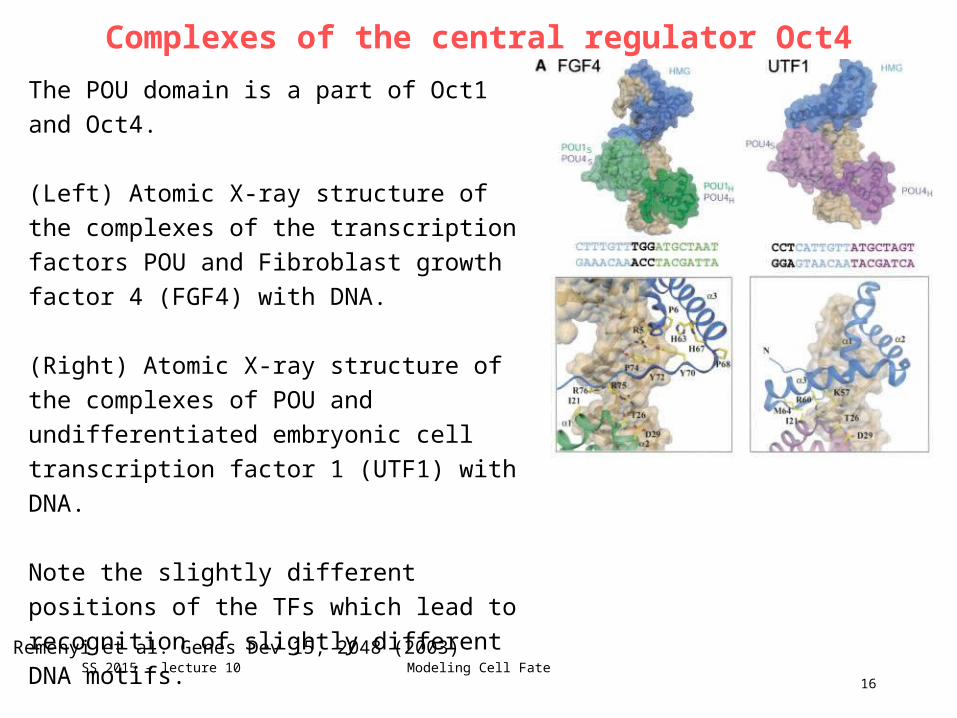
The POU domain is a part of Oct1 and Oct4.
(Left) Atomic X-ray structure of the complexes
of the transcription factors POU and Fibroblast
growth factor 4 (FGF4) with DNA.
(Right) Atomic X-ray structure of the
complexes of POU and undifferentiated
embryonic cell transcription factor 1 (UTF1)
with DNA.
Note the slightly different positions of the TFs
which lead to recognition of slightly different
DNA motifs.
Remenyi et al. Genes Dev 15, 2048 (2003)Modeling Cell FateSS 2015 – lecture 10

MTLs: multiple TF-binding loci
Chen et al., Cell 133,
1106-1117 (2008)
Close examination of the binding profiles from these 13 TFs shows that a subset of binding sites was bound by many of these TFs.
determine the significance of such enrichments of TFBSs.
Peak sites within 100 bp were iteratively clustered to define multiple transcription factor-binding loci (MTL).
SS 2015 – lecture 1017
Modeling Cell Fate

Multiple TF-Binding Loci
Chen et al., Cell 133,
1106-1117 (2008)SS 2015 – lecture 10
18Modeling Cell Fate
(A) Number of TFs bound per co-bound locus. The distribution of randomly occurring co-bound loci is obtained by simulation.Loci bound by 4 or more TFs are highly significant (p < 0.001). Of these, 40.2% were found in the intergenic regions, and the remaining loci were spread between promoter regions (37.2%) and within gene regions (22.6%).
Less than 20% of the clusters with 7 or more TFs are found at promoter regions (yellow columns), compared with 40% of the clusters that have fewer than 5 TFs. Hence, the co-occurrence of TFBSswithin the MTL is not mainly due to their occurrence at promoters.
Multiple TF-Binding Loci
Chen et al., Cell 133,
1106-1117 (2008)
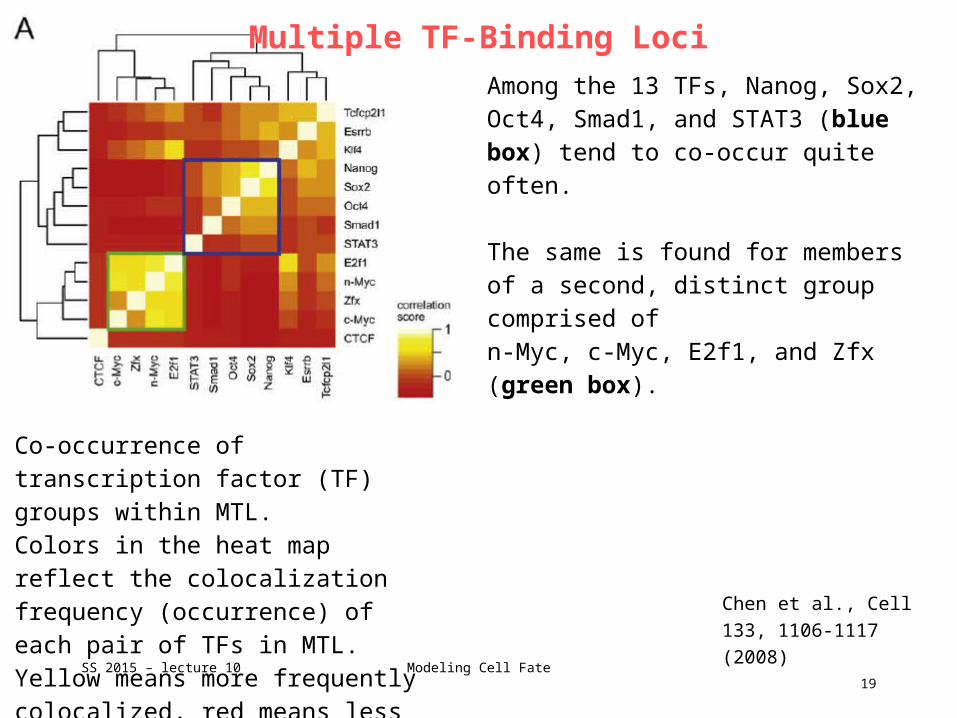
Among the 13 TFs, Nanog, Sox2, Oct4, Smad1, and STAT3 (blue box) tend to co-occur quite often.
The same is found for members of a second, distinct group comprised of n-Myc, c-Myc, E2f1, and Zfx (green box).
SS 2015 – lecture 1019
Modeling Cell Fate
Co-occurrence of transcription factor (TF) groups within MTL. Colors in the heat map reflect the colocalization frequency (occurrence) of each pair of TFs in MTL.Yellow means more frequently colocalized, red means less frequent.
TF-composition of MTLs
Chen et al., Cell 133,
1106-1117 (2008)
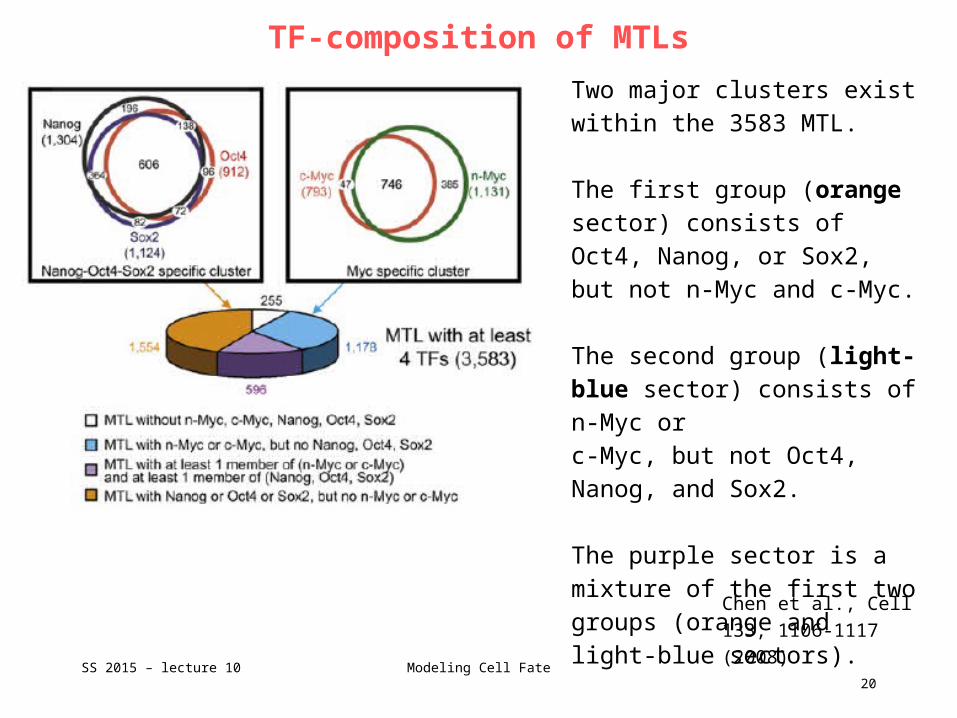
Two major clusters exist within the 3583 MTL.
The first group (orange sector) consists of Oct4, Nanog, or Sox2, but not n-Myc and c-Myc.
The second group (light-blue sector) consists of n-Myc or c-Myc, but not Oct4, Nanog, and Sox2.
The purple sector is a mixture of the first two groups (orange and light-blue sectors).
SS 2015 – lecture 1020
Modeling Cell Fate

Determine association of genes with TFs (I)
Chen et al., Cell 133,
1106-1117 (2008)
Let g represent a non-redundant gene and tf represent a TF in our dataset,
We assume that the probability of gene g being the target of tf is dependent on the location of the nearest tf binding site, denoted by l(g,tf), relative to the TSS of g.
To quantitatively estimate the location-dependent association between genes and TFs, align the TSSs of all 17,442 genes and divide the genomic locations into 16 bins, separated by
{-100k bps, -50k bps, -20k bps, -10k bps, -5k bps, -2k bps, -1k bps, 0 bps, 1k bps, 2k bps, 5k bps, 10k bps, 20k bps, 50k bps, 100k bps},
Calculate the histogram of l(g,tf ) based on these bins.
SS 2015 – lecture 1021
Modeling Cell Fate
Determine association of genes with TFs (II)
Chen et al., Cell 133,
1106-1117 (2008)
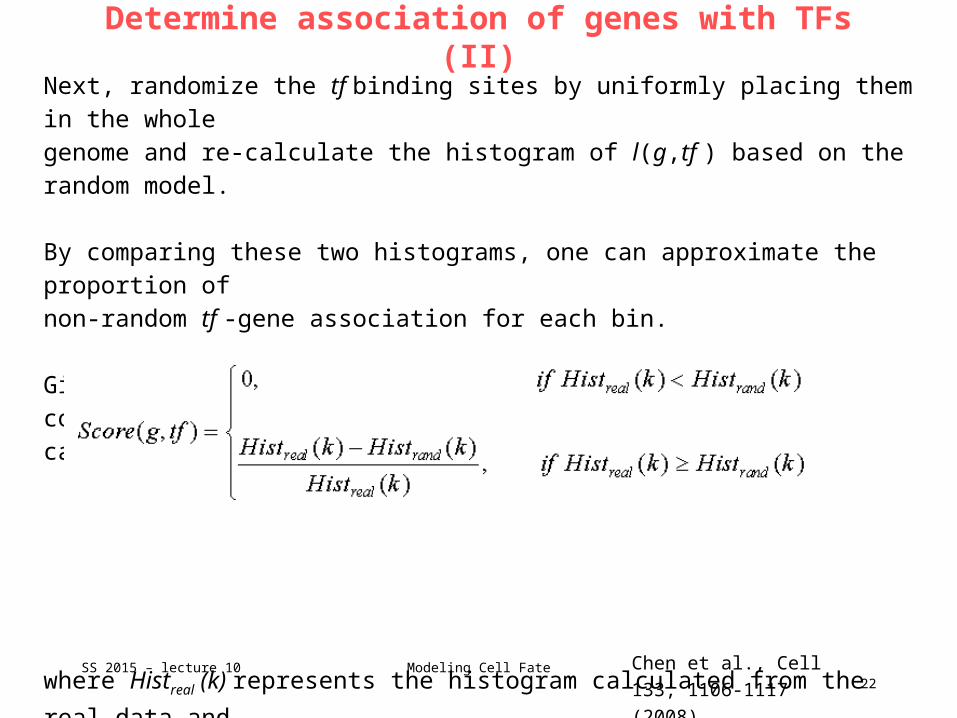
Next, randomize the tf binding sites by uniformly placing them in the wholegenome and re-calculate the histogram of l(g,tf ) based on the random model.
By comparing these two histograms, one can approximate the proportion ofnon-random tf -gene association for each bin.
Given a pair, g and tf , let k represent the index of bin corresponding to l(g,tf ), calculate an association score by:
where Histreal (k) represents the histogram calculated from the real data andHistrand (k) represents the histogram calculated from the random model.
SS 2015 – lecture 1022
Modeling Cell Fate
Association scores
Chen et al., Cell 133,
1106-1117 (2008)SS 2015 – lecture 10
23Modeling Cell Fate
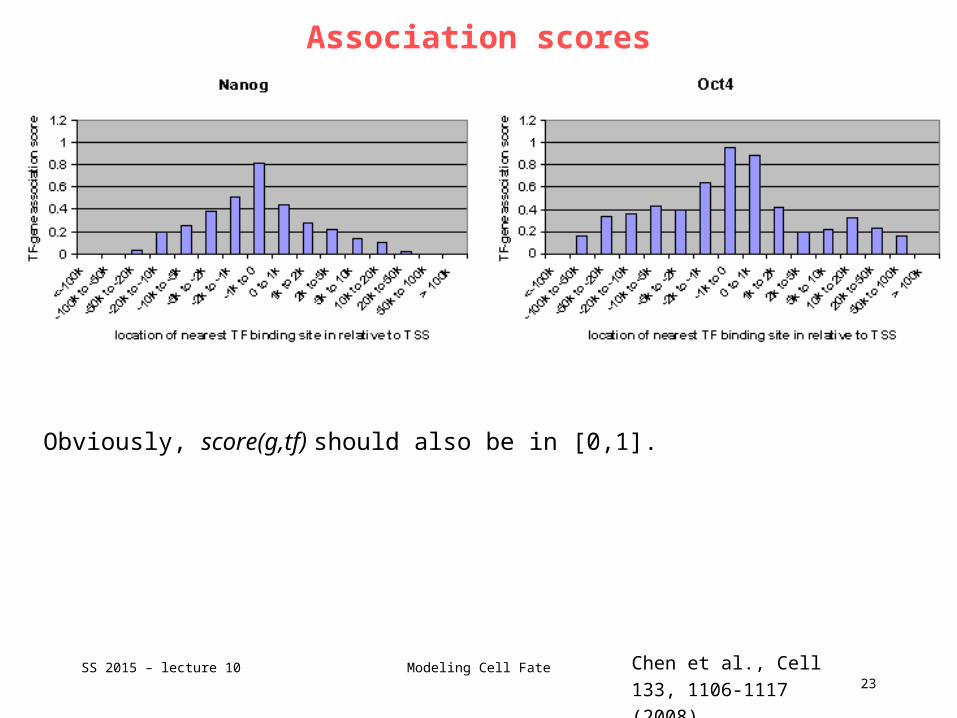
Obviously, score(g,tf) should also be in [0,1].

Gene-TF association
Chen et al., Cell 133,
1106-1117 (2008)
SS 2015 – lecture 1024
Modeling Cell Fate
Heatmap showing 5 classes of genes that are associated with a
similar set of TFs obtained from k-means clustering based on the
TF-gene association scores.
Class I genes are enriched in binding sites for Nanog, Oct4, Sox2,
Smad1, and STAT3.
Class II genes are bound heavily by c-Myc and n-Myc.
Class III genes show enrichment (more than 1-fold) in binding by
n-Myc, Klf4, Esrrb, Tcfcp2l1, Zfx, and E2f1.
Class IV genes are highly enriched in Suz12-bound genes.
Class V genes are deficient in all TFs.
About half of all genes (48%) are deficient in TF binding by the 13
TFs (and thus belong to classes IV and V).
Expression levels in ES cells
Chen et al., Cell 133,
1106-1117 (2008)
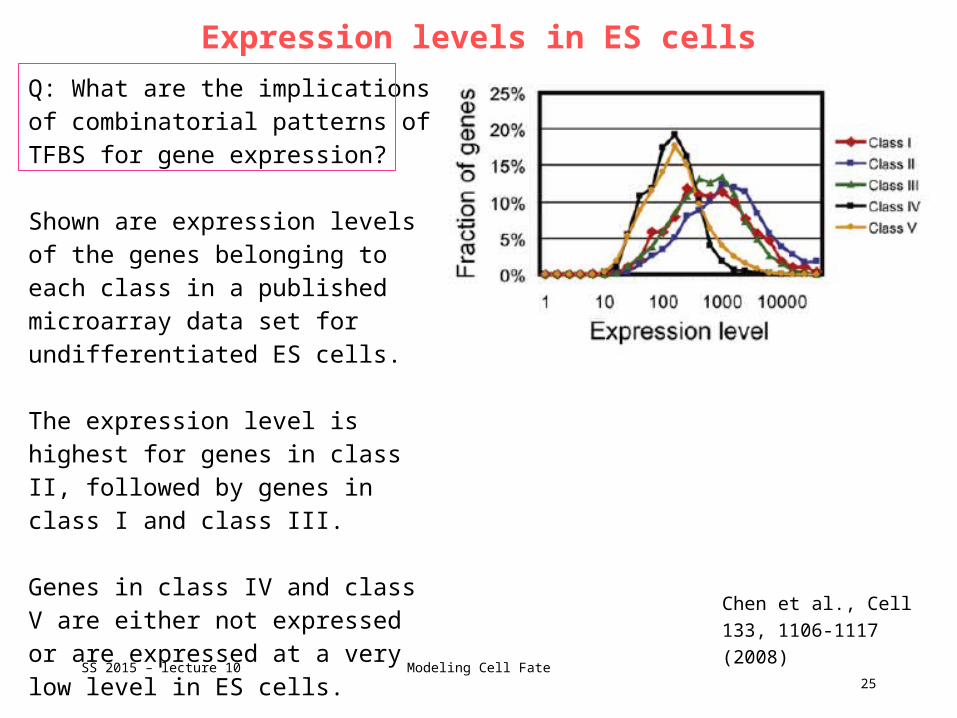
Q: What are the implications of combinatorial patterns of TFBS for gene expression?
Shown are expression levels of the genes belonging to each class in a published microarray data set for undifferentiated ES cells.
The expression level is highest for genes in class II, followed by genes in class I and class III.
Genes in class IV and class V are either not expressed or are expressed at a very low level in ES cells.
SS 2015 – lecture 1025
Modeling Cell Fate
Upregulated genes in ES cells
Chen et al., Cell 133,
1106-1117 (2008)
60% of the genes upregulated in ES cells are from classes I and II.
→ Gene clustering based on TF occupancies has the potential to predict ES-cell specific gene expression.
→ This suggests that the TF-binding patterns of these two groups are relevant in specifying ES-cell-specific expression.
In summary, combinatorial binding patterns of TFs have great predictive power for ES cell-specific expression.
SS 2015 – lecture 1026
Modeling Cell Fate
Identify Core Pluripotency Network
Chen et al., Cell 133,
1106-1117 (2008)
Next aim: construct regulatory network that specifies ES-cell-specific expression by using binding sites of transcriptional regulators under the undifferentiated state.
Define for each individual TFi the regulatory interactions of its target genes by intersecting the rank-ordered list of genes bound to TFi and the rank-ordered list of
differentially expressed genes.
SS 2015 – lecture 1027
Modeling Cell Fate
Chen et al., Cell 133,
1106-1117 (2008)
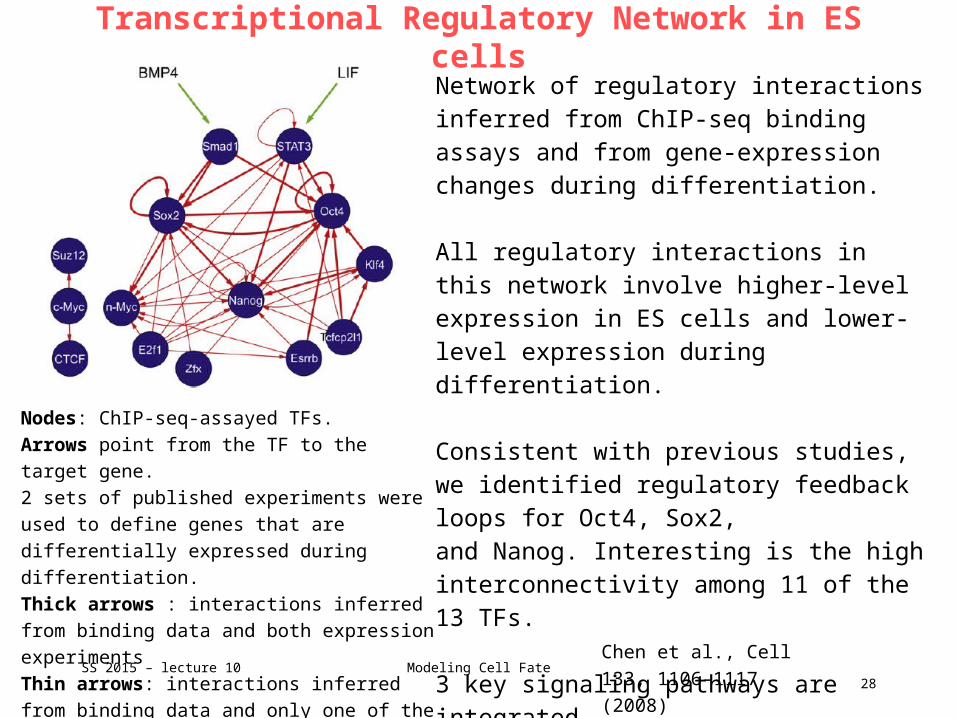
Network of regulatory interactions inferred from ChIP-seq binding assays and from gene-expression changes during differentiation.
All regulatory interactions in this network involve higher-level expression in ES cells and lower-level expression during differentiation.
Consistent with previous studies, we identified regulatory feedback loops for Oct4, Sox2,and Nanog. Interesting is the high interconnectivity among 11 of the 13 TFs.
3 key signaling pathways are integratedto the Oct4, Sox2, and Nanog circuitries through Smad1 and STAT3.
SS 2015 – lecture 1028
Modeling Cell Fate
Nodes: ChIP-seq-assayed TFs.
Arrows point from the TF to the target gene.
2 sets of published experiments were used to
define genes that are differentially expressed
during differentiation.
Thick arrows : interactions inferred from binding
data and both expression experiments
Thin arrows: interactions inferred from binding
data and only one of the expression experiments.
Transcriptional Regulatory Network in ES cells

Compare Pluripotency Networks of Mouse vs. Human
Göke et al., PLoS
Comput Biol 7,
e1002304 (2011)
Given: the core of the regulatory network that maintains the pluripotent state is a set of TFs. Among these, OCT4 seems to play a key role.
OCT4 co-occupies many regulatory sites together with SOX2 and NANOG.
Many genes which are important for early embryogenesis have a conserved function in mouse and human.
BUT: only about 5% of binding events of the key pluripotency factors OCT4 and NANOG are conserved at orthologous genomic locations in mouse and human ES cells.
This is also true for other TFs. E.g. the liver TFs CEBP and HNF4 only showed 7% conserved binding events between human and mouse.
SS 2015 – lecture 1029
Modeling Cell Fate
Pluripotency Network in mouse and human ES cells
Göke et al., PLoS
Comput Biol 7,
e1002304 (2011)
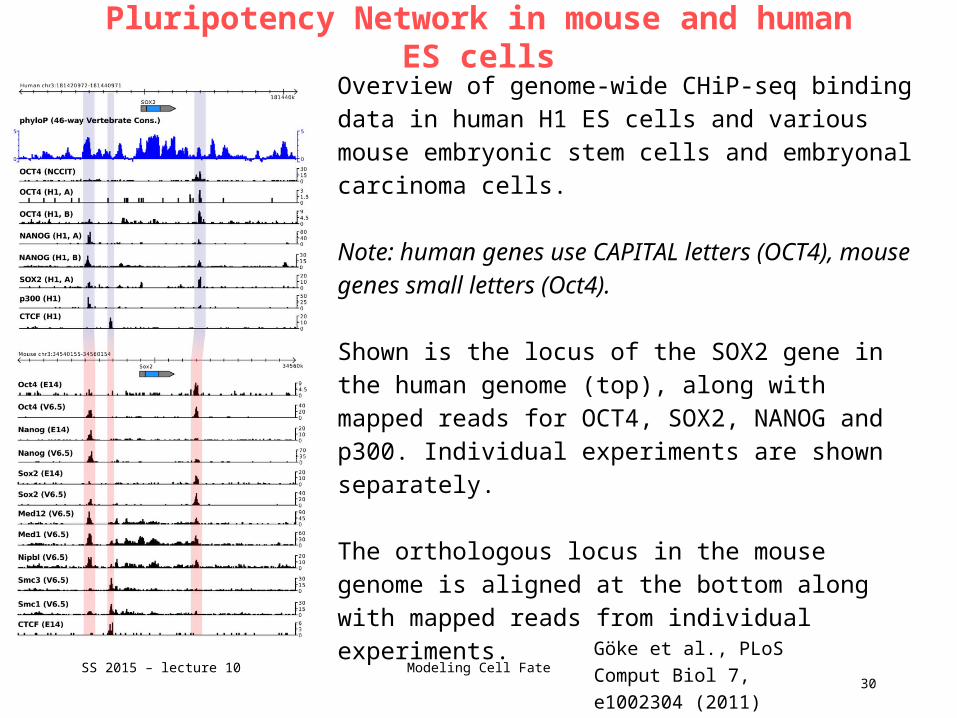
Overview of genome-wide CHiP-seq binding data in human H1 ES cells and various mouse embryonic stem cells and embryonal carcinoma cells.
Note: human genes use CAPITAL letters (OCT4), mouse genes small letters (Oct4).
Shown is the locus of the SOX2 gene in the human genome (top), along with mapped reads for OCT4, SOX2, NANOG and p300. Individual experiments are shown separately.
The orthologous locus in the mouse genome is aligned at the bottom along with mapped reads from individual experiments.
SS 2015 – lecture 1030
Modeling Cell Fate
Co-localization identifies know protein interaction
Göke et al., PLoS
Comput Biol 7,
e1002304 (2011)
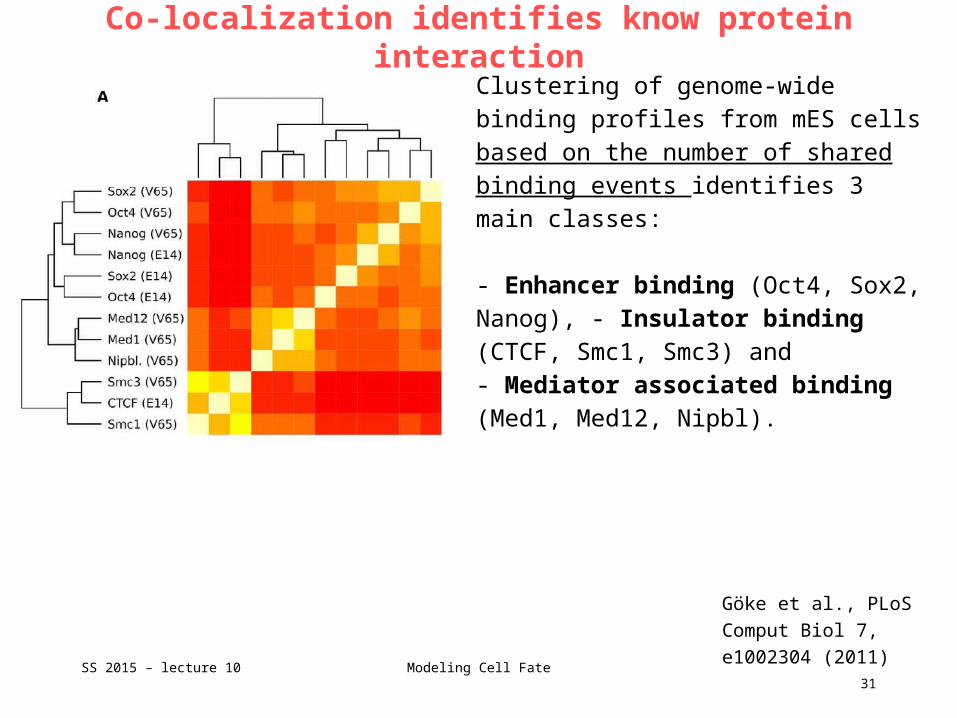
Clustering of genome-wide binding profiles from mES cells based on the number of shared binding events identifies 3 main classes: - Enhancer binding (Oct4, Sox2, Nanog), - Insulator binding (CTCF, Smc1, Smc3) and - Mediator associated binding (Med1, Med12, Nipbl).
SS 2015 – lecture 1031
Modeling Cell Fate
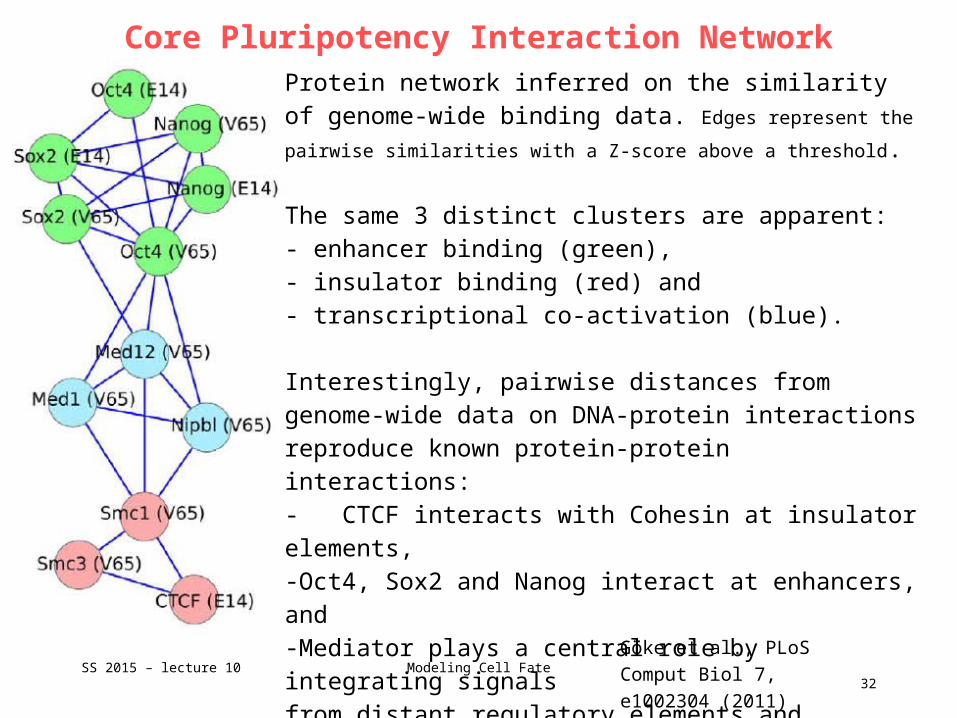
Core Pluripotency Interaction Network
Göke et al., PLoS
Comput Biol 7,
e1002304 (2011)
SS 2015 – lecture 1032
Modeling Cell Fate
Protein network inferred on the similarity of genome-wide binding data. Edges represent the pairwise similarities with a Z-score
above a threshold.
The same 3 distinct clusters are apparent: - enhancer binding (green), - insulator binding (red) and - transcriptional co-activation (blue).
Interestingly, pairwise distances from genome-wide data on DNA-protein interactions reproduce known protein-protein interactions: - CTCF interacts with Cohesin at insulator elements, -Oct4, Sox2 and Nanog interact at enhancers, and -Mediator plays a central role by integrating signalsfrom distant regulatory elements and Cohesin.

Combined binding of Oct4, Sox2 and Nanog
Göke et al., PLoS
Comput Biol 7,
e1002304 (2011)
SS 2015 – lecture 1033
Modeling Cell Fate
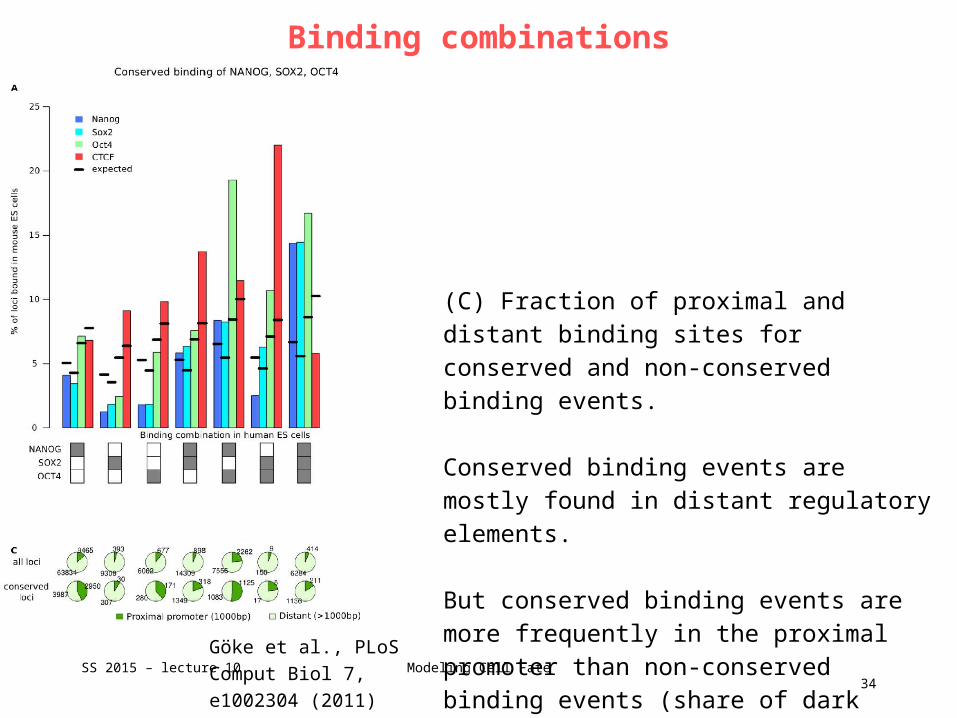
The combination of OCT4, SOX2 and NANOG influences conservation of binding events. (A) Bars indicate the fraction of loci where binding of Nanog, Sox2, Oct4 or CTCF can be observed at the orthologous locus in mouse ES cells for all combinations of OCT4, SOX2 and NANOG in human ES cells as indicated by the boxes below.
Dark boxes indicate binding, white boxes indicate no binding (‘‘AND’’ relation).
Combinatorial binding of OCT4, SOX2 and NANOG shows the largest fraction of conserved binding for Oct4, Sox2 and Nanog in mouse.
Binding combinations
Göke et al., PLoS
Comput Biol 7,
e1002304 (2011)
SS 2015 – lecture 1034
Modeling Cell Fate
(C) Fraction of proximal and distant binding sites for conserved and non-conserved binding events.
Conserved binding events are mostly found in distant regulatory elements.
But conserved binding events are more frequently in the proximal promoter than non-conserved binding events (share of dark green increases).

Increased Binding conservation in ES cells at developmental enhancers
Göke et al., PLoS
Comput Biol 7,
e1002304 (2011)
Fraction of loci where binding of Nanog, Sox2, Oct4 and CTCF can be observed at the orthologous locus in mouse ESC.
Combinations of OCT4, SOX2 and NANOG in human ES cells are discriminated by developmental activity as indicated by the boxes below. Dark boxes : ‘‘AND’’ relation, light grey boxes with ‘‘v’’ : ‘‘OR’’ relation, ‘‘?’’ : no restriction. Combinatorial binding events at develop-mentally active enhancers show the highest levels of binding conservation between mouse and human ES cells.
SS 2015 – lecture 1035
Modeling Cell Fate

Conserved binding events
720 loci are conserved in human and mouse ES cells that are bound combinatorially by OCT4/Oct4, SOX2/Sox2, and NANOG/Nanog.
These loci are associated with 608 genes nearby.
Testing genes for enrichment of GO terms yields:
Pattern specification process (p = 4.7 e-13 )Regionalization (p = 2.5 e-12 )Development induction (p = 8.4 e-8 )
as significantly enriched terms. All these terms are related to early development.
SS 2015 – lecture 1036
Modeling Cell Fate
Göke et al., PLoS
Comput Biol 7,
e1002304 (2011)

Summary
26% of combinatorially bound loci which are conserved between mouse and human ES cells are developmental enhancers in the mouse. This suggests that many enhancers bound by OCT4, SOX2 and NANOG are also developmental enhancers in human.
The very same regulatory elements bound by key pluripotency factors in ES cells frequently act as enhancers during early development.
the gene regulatory networks of ES cells and early development are linked at the level of transcriptional regulation.
The finding that binding at these developmental enhancers are highly conserved in mouse and human ES cells suggests that these elements are crucial for the maintenance of the pluripotent state.
SS 2015 – lecture 1037
Modeling Cell Fate
Göke et al., PLoS
Comput Biol 7,
e1002304 (2011)
Summary (II)
The fast evolutionary rewiring of regulatory networks mainly affects individual binding events.
In contrast to these events, there is a group of conserved enhancers in the genome which recruit multiple interacting factors and are active in multiple tissues of the developing embryo.
Many of these ‘‘gene regulatory hotspots’’ are under strong evolutionary constraints and seem to play a major role by linking the regulatory networks of cellular differentiation during early mammalian development.
SS 2015 – lecture 1038
Modeling Cell Fate
Göke et al., PLoS
Comput Biol 7,
e1002304 (2011)