Embed Size (px)
Citation preview

V. Other Supporting Materials

This page has been intentionally left blank.

LineNumber
9 Reimbursable 2004 200510 2003 Mid-Year Preliminary11 Actual Forecast Budget 2006 2007 200812 Operating Revenue13 Farebox Revenue $0 $0 $0 $0 $0 $014 Toll Revenue 0 0 0 0 0 015 Other Revenue (Excludes B&T Investment Income for Capital) 0 0 0 0 0 016 Capital and Other Reimbursements 1,088 1,096 1,051 1,074 1,095 1,12417 Total Operating Revenue $1,088 $1,096 $1,050.9 $1,074.5 $1,094.7 $1,123.81819 Operating Expense20 Labor Expenses:21 Payroll $439 $454 $430 $440 $448 $45922 Overtime 90 66 70 72 73 7523 Health & Welfare 28 33 36 40 44 4724 Pensions 13 19 28 33 35 3825 Other-Fringe Benefits 105 110 107 110 111 11426 Reimbursable Overhead 251 243 231 234 238 24427 Sub-total Labor Expenses $927 $925 $901.4 $928.4 $949.1 $976.62829 Non-Labor Expenses:30 Traction and Propulsion Power $0 $0 $0 $0 $0 $031 Fuel for Buses and Trains 0 0 0 0 0 032 Insurance 4 4 5 5 5 533 Claims 1 0 0 0 0 034 Paratransit Service Contracts 0 0 0 0 0 035 Maintenance and Other Operating Contracts 49 40 32 32 32 3236 Professional Service Contracts 18 24 23 22 22 2237 Materials & Supplies 83 97 83 82 81 8238 Other Business Expenses 6 6 5 5 5 539 Sub-total Non-Labor Expenses $161 $171 $149.4 $146.0 $145.6 $147.24041 Other Expense Adjustments:42 Other $0 $0 $0 $0 $0 $043 Sub-total Other Expense Adjustments $0 $0 $0.0 $0.0 $0.0 $0.04445 Total Operating Expense Before Depreciation $1,088 $1,096 $1,050.9 $1,074.5 $1,094.7 $1,123.84647 Depreciation $0.0 $0.0 $0.0 $0.0 $0.0 $0.04849 Total Operating Expense $1,088 $1,096 $1,050.9 $1,074.5 $1,094.7 $1,123.85051 Baseline Surplus/(Deficit) $0 $0 $0.0 $0.0 $0.0 ($0.0)5253 GAP CLOSING ACTIONS:54 Program to Eliminate the Gap 0 0 0 0 0 055 Increased Fare and Toll Yields 0 0 0 0 0 05657 Net Surplus/(Deficit) $0 $0 $0.0 $0.0 $0.0 ($0.0)
($ in millions)
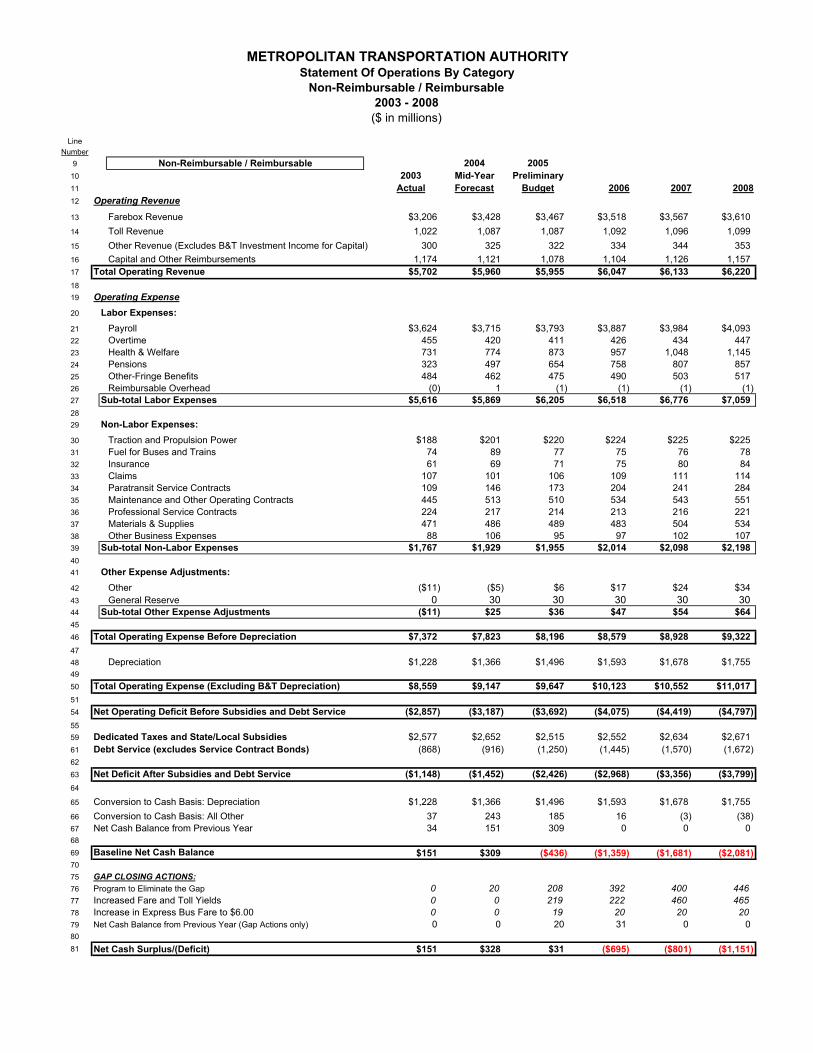
METROPOLITAN TRANSPORTATION AUTHORITYStatement Of Operations By Category
Reimbursable2003 - 2008
LineNumber
9 Non-Reimbursable / Reimbursable 2004 200510 2003 Mid-Year Preliminary11 Actual Forecast Budget 2006 2007 200812 Operating Revenue13 Farebox Revenue $3,206 $3,428 $3,467 $3,518 $3,567 $3,61014 Toll Revenue 1,022 1,087 1,087 1,092 1,096 1,09915 Other Revenue (Excludes B&T Investment Income for Capital) 300 325 322 334 344 35316 Capital and Other Reimbursements 1,174 1,121 1,078 1,104 1,126 1,15717 Total Operating Revenue $5,702 $5,960 $5,955 $6,047 $6,133 $6,2201819 Operating Expense20 Labor Expenses:21 Payroll $3,624 $3,715 $3,793 $3,887 $3,984 $4,09322 Overtime 455 420 411 426 434 44723 Health & Welfare 731 774 873 957 1,048 1,14524 Pensions 323 497 654 758 807 85725 Other-Fringe Benefits 484 462 475 490 503 51726 Reimbursable Overhead (0) 1 (1) (1) (1) (1)27 Sub-total Labor Expenses $5,616 $5,869 $6,205 $6,518 $6,776 $7,0592829 Non-Labor Expenses:30 Traction and Propulsion Power $188 $201 $220 $224 $225 $22531 Fuel for Buses and Trains 74 89 77 75 76 7832 Insurance 61 69 71 75 80 8433 Claims 107 101 106 109 111 11434 Paratransit Service Contracts 109 146 173 204 241 28435 Maintenance and Other Operating Contracts 445 513 510 534 543 55136 Professional Service Contracts 224 217 214 213 216 22137 Materials & Supplies 471 486 489 483 504 53438 Other Business Expenses 88 106 95 97 102 10739 Sub-total Non-Labor Expenses $1,767 $1,929 $1,955 $2,014 $2,098 $2,1984041 Other Expense Adjustments:42 Other ($11) ($5) $6 $17 $24 $3443 General Reserve 0 30 30 30 30 3044 Sub-total Other Expense Adjustments ($11) $25 $36 $47 $54 $644546 Total Operating Expense Before Depreciation $7,372 $7,823 $8,196 $8,579 $8,928 $9,3224748 Depreciation $1,228 $1,366 $1,496 $1,593 $1,678 $1,7554950 Total Operating Expense (Excluding B&T Depreciation) $8,559 $9,147 $9,647 $10,123 $10,552 $11,0175154 Net Operating Deficit Before Subsidies and Debt Service ($2,857) ($3,187) ($3,692) ($4,075) ($4,419) ($4,797)5559 Dedicated Taxes and State/Local Subsidies $2,577 $2,652 $2,515 $2,552 $2,634 $2,67161 Debt Service (excludes Service Contract Bonds) (868) (916) (1,250) (1,445) (1,570) (1,672)6263 Net Deficit After Subsidies and Debt Service ($1,148) ($1,452) ($2,426) ($2,968) ($3,356) ($3,799)64
65 Conversion to Cash Basis: Depreciation $1,228 $1,366 $1,496 $1,593 $1,678 $1,75566 Conversion to Cash Basis: All Other 37 243 185 16 (3) (38)67 Net Cash Balance from Previous Year 34 151 309 0 0 06869 Baseline Net Cash Balance $151 $309 ($436) ($1,359) ($1,681) ($2,081)7075 GAP CLOSING ACTIONS:76 Program to Eliminate the Gap 0 20 208 392 400 44677 Increased Fare and Toll Yields 0 0 219 222 460 46578 Increase in Express Bus Fare to $6.00 0 0 19 20 20 2079 Net Cash Balance from Previous Year (Gap Actions only) 0 0 20 31 0 08081 Net Cash Surplus/(Deficit) $151 $328 $31 ($695) ($801) ($1,151)
($ in millions)
METROPOLITAN TRANSPORTATION AUTHORITYStatement Of Operations By Category
Non-Reimbursable / Reimbursable2003 - 2008

LineNumber
7 Non-Reimbursable 2004 20058 2003 Adopted Change Preliminary Change Change Change Change9 Actual Budget 2004 - 2003 Budget 2005 - 2004 2006 2006 - 2005 2007 2007 - 2006 2008 2008 - 200710 Operating Revenue11 Farebox Revenue $3,206 $3,428 $222 $3,467 $39 $3,518 $51 $3,567 $49 $3,610 $4312 Toll Revenue 1,022 1,087 65 1,087 1 1,092 4 1,096 4 1,099 413 Other Revenue (Excludes B&T Investment Income for Capital) 300 325 25 322 (3) 334 11 344 10 353 1014 Capital and Other Reimbursements 86 25 (61) 27 2 29 2 32 2 33 215 Total Operating Revenue $4,614 $4,864 $250 $4,904 $40 $4,973 $69 $5,038 $65 $5,096 $5816
17 Operating Expense18 Labor Expenses:19 Payroll $3,185 $3,261 ($76) $3,363 ($102) $3,446 ($83) $3,537 ($91) $3,634 ($98)20 Overtime 365 353 11 341 12 355 (13) 360 (6) 372 (12)21 Health & Welfare 703 741 (38) 837 (96) 917 (80) 1,004 (88) 1,099 (94)22 Pensions 309 478 (169) 626 (148) 726 (99) 772 (46) 819 (48)23 Other-Fringe Benefits 379 352 26 368 (16) 381 (12) 392 (11) 403 (11)24 Reimbursable Overhead (252) (242) (10) (232) (10) (234) 2 (239) 4 (245) 625 Sub-total Labor Expenses $4,690 $4,945 ($255) $5,304 ($359) $5,589 ($286) $5,827 ($237) $6,083 ($256)26
27 Non-Labor Expenses:28 Traction and Propulsion Power $188 $201 ($13) $220 ($19) $224 ($4) $225 ($1) $225 ($0)29 Fuel for Buses and Trains 74 89 (16) 77 12 75 2 76 (1) 78 (2)30 Insurance 57 65 (8) 66 (1) 70 (4) 74 (4) 79 (5)31 Claims 106 101 5 106 (5) 109 (3) 111 (2) 114 (3)32 Paratransit Service Contracts 109 146 (37) 173 (27) 204 (31) 241 (37) 284 (43)33 Maintenance and Other Operating Contracts 397 473 (77) 478 (4) 502 (24) 511 (8) 519 (8)34 Professional Service Contracts 206 193 13 190 3 191 (0) 194 (3) 199 (5)35 Materials & Supplies 388 389 (1) 406 (17) 401 5 423 (22) 452 (28)36 Other Business Expenses 81 100 (19) 90 10 92 (2) 97 (5) 101 (4)37 Sub-total Non-Labor Expenses $1,606 $1,758 ($152) $1,806 ($48) $1,868 ($62) $1,952 ($84) $2,051 ($98)38
39 Other Expense Adjustments:40 Other ($11) ($5) ($7) $6 ($10) $17 ($12) $24 ($7) $34 ($10)41 General Reserve 0 30 (30) 30 0 30 0 30 0 30 042 Sub-total Other Expense Adjustments ($11) $25 ($37) $36 ($10) $47 ($12) $54 ($7) $64 ($10)43
44 Total Operating Expense Before Depreciation $6,284 $6,728 ($444) $7,145 ($417) $7,505 ($360) $7,833 ($328) $8,198 ($364)45
46 Depreciation 1,228 1,366 (138) 1,496 (130) 1,593 (97) 1,678 (85) 1,755 (77)47 Total Operating Expense (Excluding B&T Depreciation) $7,471 $8,052 ($581) $8,596 ($544) $9,048 ($452) $9,457 ($409) $9,893 ($436)50
51 Net Operating Deficit Before Subsidies and Debt Service ($2,857) ($3,187) ($330) ($3,692) $584 ($4,075) ($521) ($4,419) $474 ($4,797) $49452
53 Dedicated Taxes and State/Local Subsidies $2,577 $2,652 $74 $2,515 ($136) $2,552 $37 $2,634 $82 $2,671 $3754 Debt Service (excludes Service Contract Bonds) (868) (916) (48) (1,250) (334) (1,445) (195) (1,570) (125) (1,672) (102)55 Net Deficit After Subsidies and Debt Service ($1,148) ($1,452) ($304) ($2,426) $114 ($2,968) ($679) ($3,356) $431 ($3,799) $42956
57 Conversion to Cash Basis: Depreciation $1,228 $1,366 $138 $1,496 $130 $1,593 $97 $1,678 $85 $1,755 $7758 Conversion to Cash Basis: All Other 37 243 206 185 (58) 16 (169) (3) (19) (38) (34)59 Net Cash Balance from Previous Year 34 151 118 309 157 0 (309) 0 0 0 060 Baseline Net Cash Balance $151 $309 $157 ($436) ($745) ($1,359) ($923) ($1,681) ($321) ($2,081) ($401)61
62 Adjusted Net Cash Surplus/(Deficit) $151 $309 $157 ($436) ($745) ($1,359) ($923) ($1,681) ($321) ($2,081) ($401)63
64 GAP CLOSING ACTIONS:65 Program to Eliminate the Gap 0 20 20 208 189 392 184 400 8 446 4666 Increased Fare and Toll Yields 0 0 0 219 219 222 3 460 238 465 567 Increase in Express Bus Fare to $6.00 0 0 0 19 19 20 1 20 0 20 068 Net Cash Balance from Previous Year 0 0 0 20 20 31 11 0 (31) 0 069 Net Cash Surplus/(Deficit) $151 $328 $177 $31 ($298) ($695) ($725) ($801) ($106) ($1,151) ($350)
METROPOLITAN TRANSPORTATION AUTHORITYChanges Year-to-Year By Category
2003-2008Favorable/(Unfavorable)

Agency
Bridges & Tunnels 2.5$ Lower than anticipated costs associated with E-ZPass Customer Service Center
None None None None
24.6$ WTC claim settlement; cash received in 2004, accrual booked in 2003
Subtotal 27.1$ -$ -$ -$ -$
Long Island Bus None None None None None
Subtotal $ - $ - $ - $ - $ -
Long Island Rail Road 7.9$ WTC Claim Settlement 30.0$ 2003 Pension Pre-payment
None None None
Subtotal 7.9$ 30.0$ -$ -$ -$
Metro-North Railroad $ 1.6 Lower costs due to M7 procurement
$ 1.2 Outside building withdrawal from GCT power grid
None $1.6 Equipment Replacement Plan - Disposal Costs
$3.3 Equipment Replacement Plan - Harlem & Hudson
$ 3.7 WTC Claim Settlement (1.2)$ Outside building withdrawal from GCT power grid
$2.2 Equipment Replacement Plan - Harlem & Hudson
$1.0 Office Space Renovation
20.0$ 2003 Pension Pre-payment
$3.8 Equipment Strategy - Genesis Locomotive Remanufacture
$3.3 Equipment Strategy - West of Hudson Locomotive Remanufacture
Subtotal $ 5.3 $ 20.0 $ - $ 10.9 $ 4.3
Staten Island Railway None None None None None
Subtotal -$ -$ -$ -$ -$
METROPOLITAN TRANSPORTATION AUTHORITYJULY FINANCIAL PLAN 2005-2008
MTA-WIDE NON-RECURRING REVENUES AND SAVINGS ($ in millions)
2004 Mid-Year Forecast 2005 Preliminary Budget
Non-recurring revenues and savings with a value of $1 million or more in calendar years 2004 through 2008.
2006 Plan 2008 Plan2007 Plan

Agency
MTA Capital Construction Company
None None None None None
Subtotal $ - $ - $ - $ - $ -
MTA Headquarters $ 7.5 WTC Claim Settlement None None None None
Subtotal 7.5$ -$ -$ -$ -$
New York City Transit 10.3$ Drawdown of accumulated transit adjudication funds
3.5$ Reduce normal replacement costs--data processing equipment
None None None
42.5$ Timing of MaBSTOA pension payments
68.1$ Timing of MaBSTOA pension payments
10.8$ Drawdown of accumulated stabilization fund interest income
10.1$ Insurance reimbursements associated with non-World Trade Center losses
103.1$ WTC Settlement
2.6$ Paratransit rent savings
1.3$ Materiel vendor inspection claim settlement
1.2$ Eliminate Health & Welfare deposit requirement
Subtotal 181.9$ 71.6$ -$ -$ -$
MTA Transactions 111.2$ Prior year MRT distributed to NYCT & CR
8.7$ Prior year MRT distributed to NYCT & CR
-$ None -$ None -$ None
30.0$ NYCT Debt Pre-payment in 2003
16.7$ NYCT Debt Pre-payment in 2003
49.7$ CR Debt Pre-payment in 2003
15.3$ CR Debt Pre-payment made in early 2004 (originally scheduled to be made in Dec. 2003)
Subtotal 190.9$ 40.7$ -$ -$ -$
Total Non-Recurring Resources (>or = $1million)
420.6$ 162.3$ -$ 10.9$ 4.3$
Note: The 2003 closing cash balance MTA-wide was $32.1 million higher than the February Plan. As is the case with all positive cash balances, this is carried into the next year. Similarly, 2005's closing cash balance of $308 million (before gap closing) is utilized in 2006.
2006 Plan 2007 Plan 2008 Plan2004 2005 Plan

2004Mid-YearForecast
2005Preliminary
Budget 2006 2007 2008
MTA Consolidated: -MTA General Reserve $30.000 $30.000 $30.000 $30.000Gap Closers - PEG Implementation Provision - $20.000 $30.000 - -
MTAHQ:Actuarial Pension Adjustment Reserve $25.000 $25.000 $25.000 $25.000 $25.000
METROPOLITAN TRANSPORTATION AUTHORITYMTA-WIDE JULY FINANCIAL PLAN 2005 - 2008
MTA OPERATING BUDGET RESERVES($ in millions)

MTA Agencies 2003
Actuals 1
2004Mid-Year Forecast
2005Preliminary
Budget 2006 2007 2008
NYC Transit 47,768 47,706 47,673 47,641 47,627 47,624Long Island Rail Road 6,309 6,496 6,556 6,713 6,745 6,766Metro-North Railroad 1 5,993 5,803 5,920 5,934 5,950 5,960Bridges & Tunnels 1,732 1,811 1,816 1,819 1,819 1,819Headquarters 1,226 1,371 1,371 1,371 1,371 1,371Long Island Bus 1,126 1,194 1,194 1,194 1,194 1,194Staten Island Railway 2 305 313 313 313 313 313Capital Construction Company 0 79 150 150 150 150
Baseline Total Positions 64,459 64,773 64,993 65,135 65,169 65,197
Non-Reimbursable 57,378 57,568 58,121 58,141 58,221 58,259Reimbursable 7,081 7,205 6,872 6,994 6,948 6,938
Total Full-Time 64,047 64,369 64,590 64,732 64,766 64,794Total Full-Time-Equivalents 412 404 403 403 403 403
Impact of:PEGs 0 (90) (2,731) (4,856) (4,690) (4,870)Increase Express Bus Fare 0 0 (58) (58) (58) (58)
Total Positions 64,459 64,683 62,204 60,221 60,421 60,269
2 Baseline positions for 2004 - 2008 include 10 authorized positions which represent vacancy savings in the February 2004 Financial Plan.
($ in millions)
1 For 2003, all Agencies except Metro-North reflect actual incumbents. Metro-North reflects authorized positions reduced by vacancies; 2003 stated as authorized positions, 2004 - 2008 as paid positions.
Metropolitan Transportation AuthorityJuly Financial Plan 2005 - 2008
Total Non-Reimbursable - Reimbursable Positions at End-of-YearFull-Time Positions and Full Time Equivalents

MTA Agencies 2003
Actuals 1
2004Mid-Year Forecast
2005Preliminary
Budget 2006 2007 2008
($ in millions)
Metropolitan Transportation AuthorityJuly Financial Plan 2005 - 2008
Total Non-Reimbursable - Reimbursable Positions at End-of-YearFull-Time Positions and Full Time Equivalents
Non-Reimbursable 57,378 57,478 55,332 53,227 53,473 53,331Reimbursable 7,081 7,115 4,083 2,080 2,200 2,010
Total Full-Time 64,047 64,279 61,801 59,818 60,018 59,866Total Full-Time-Equivalents 412 314 (2,386) (4,511) (4,345) (4,525)
Non-Reimbursable NYC Transit 42,278 42,018 42,357 42,431 42,457 42,464 Long Island Rail Road 5,539 5,789 5,884 5,813 5,851 5,872 Metro-North Railroad 1 5,288 5,188 5,303 5,317 5,333 5,343 Bridges & Tunnels 1,687 1,766 1,771 1,774 1,774 1,774 Headquarters 1,174 1,320 1,319 1,319 1,319 1,319 Long Island Bus 1,113 1,180 1,180 1,180 1,180 1,180 Staten Island Railway 2 299 307 307 307 307 307 Capital Construction Company 0 0 0 0 0 0Total Non-Reimbursable 57,378 57,568 58,121 58,141 58,221 58,259
Reimbursable NYC Transit 5,490 5,688 5,316 5,210 5,170 5,160 Long Island Rail Road 770 707 672 900 894 894 Metro-North Railroad 1 705 615 617 617 617 617 Bridges & Tunnels 45 45 45 45 45 45 Headquarters 52 51 52 52 52 52 Long Island Bus 13 14 14 14 14 14 Staten Island Railway 2 6 6 6 6 6 6 Capital Construction Company 0 79 150 150 150 150Total Reimbursable 7,081 7,205 6,872 6,994 6,948 6,938
2 Baseline positions for 2004 - 2008 include 10 authorized positions which represent vacancy savings in the February 2004 Financial Plan.
1 For 2003, all Agencies except Metro-North reflect actual incumbents. Metro-North reflects authorized positions reduced by vacancies; 2003 stated as authorized positions, 2004 - 2008 as paid positions.

MTA Agencies 2003
Actuals 1
2004Mid-Year Forecast
2005Preliminary
Budget 2006 2007 2008
($ in millions)
Metropolitan Transportation AuthorityJuly Financial Plan 2005 - 2008
Total Non-Reimbursable - Reimbursable Positions at End-of-YearFull-Time Positions and Full Time Equivalents
Total Full-Time NYC Transit 47,480 47,458 47,426 47,394 47,380 47,377 Long Island Rail Road 6,309 6,496 6,556 6,713 6,745 6,766 Metro-North Railroad 1 5,988 5,798 5,915 5,929 5,945 5,955 Bridges & Tunnels 1,732 1,811 1,816 1,819 1,819 1,819 Headquarters 1,226 1,371 1,371 1,371 1,371 1,371 Long Island Bus 1,007 1,043 1,043 1,043 1,043 1,043 Staten Island Railway 2 305 313 313 313 313 313 Capital Construction Company 0 79 150 150 150 150Total Full-Time 64,047 64,369 64,590 64,732 64,766 64,794
Total Full-Time-Equivalents NYC Transit 288 248 247 247 247 247 Long Island Rail Road 0 0 0 0 0 0 Metro-North Railroad 1 5 5 5 5 5 5 Bridges & Tunnels 0 0 0 0 0 0 Headquarters 0 0 0 0 0 0 Long Island Bus 119 151 151 151 151 151 Staten Island Railway 2 0 0 0 0 0 0 Capital Construction Company 0 0 0 0 0 0Total Full-Time Equivalents 412 404 403 403 403 403
2 Baseline positions for 2004 - 2008 include 10 authorized positions which represent vacancy savings in the February 2004 Financial Plan.
1 For 2003, all Agencies except Metro-North reflect actual incumbents. Metro-North reflects authorized positions reduced by vacancies; 2003 stated as authorized positions, 2004 - 2008 as paid positions.

MTA Agencies 2003
Actuals 1
2004Mid-Year Forecast
2005Preliminary
Budget 2006 2007 2008
($ in millions)
Metropolitan Transportation AuthorityJuly Financial Plan 2005 - 2008
Total Non-Reimbursable - Reimbursable Positions at End-of-YearFull-Time Positions and Full Time Equivalents
Impact: PEGs NYC Transit 0 (54) (2,136) (3,930) (3,767) (3,960) Long Island Rail Road 0 0 (362) (616) (616) (616) Metro-North Railroad 1 0 (27) (180) (251) (251) (238) Bridges & Tunnels 0 0 (1) 0 0 0 Headquarters 0 (9) (17) (18) (18) (18) Long Island Bus 0 0 0 0 0 0 Staten Island Railway 2 0 0 (35) (41) (38) (38) Capital Construction Company 0 0 0 0 0 0Total PEG Impact 0 (90) (2,731) (4,856) (4,690) (4,870)
Impact: Increase Express Bus Fare NYC Transit 0 0 (58) (58) (58) (58) Long Island Rail Road 0 0 0 0 0 0 Metro-North Railroad 1 0 0 0 0 0 0 Bridges & Tunnels 0 0 0 0 0 0 Headquarters 0 0 0 0 0 0 Long Island Bus 0 0 0 0 0 0 Staten Island Railway 2 0 0 0 0 0 0 Capital Construction Company 0 0 0 0 0 0Total Impact: Increase Express Bus Fare 0 0 (58) (58) (58) (58)
2 Baseline positions for 2004 - 2008 include 10 authorized positions which represent vacancy savings in the February 2004 Financial Plan.
1 For 2003, all Agencies except Metro-North reflect actual incumbents. Metro-North reflects authorized positions reduced by vacancies; 2003 stated as authorized positions, 2004 - 2008 as paid positions.