Embed Size (px)
Citation preview

UWinnipeg Sustainability Performance Report
FY2010 “University of Winnipeg students have pushed hard on the issue of
sustainability, and we’ve risen to their challenge calling for this
University to become a leader in sustainable practices and policies.”
- President & Vice-Chancellor Lloyd Axworthy, March 2005
2
Contents 1 Summary ................................................................................................................................................................................................................ 5
1.1 Sustainability Performance ............................................................................................................................................................................ 5
1.2 Key Achievements .......................................................................................................................................................................................... 5
1.3 Kyoto Compliance Forecast ........................................................................................................................................................................... 6
2 Introduction ........................................................................................................................................................................................................... 7
2.1 Reporting Period and Scope .......................................................................................................................................................................... 7
2.2 Sustainability Governance & Strategic Plan ................................................................................................................................................... 7
2.3 Annual Demographic, Weather, and Space Variations .................................................................................................................................. 9
2.3.1 Area Under Operational Control ............................................................................................................................................................ 9
2.3.2 Campus Population & Operational Changes ........................................................................................................................................ 10
2.3.3 FY 2010 Weather .................................................................................................................................................................................. 10
3 GHG Emissions & Air Quality ................................................................................................................................................................................ 11
3.1 GHG Emissions & Air Quality Key Initiatives ................................................................................................................................................ 11
3.2 GHG Emissions & Air Quality Performance .................................................................................................................................................. 11
3.3 Kyoto Target Forecast .................................................................................................................................................................................. 13
4 Energy .................................................................................................................................................................................................................. 14
4.1 Key Energy Initiatives ................................................................................................................................................................................... 14
4.2 Energy Performance .................................................................................................................................................................................... 14
4.2.1 Hydro-electricity .................................................................................................................................................................................. 15
4.2.2 Natural Gas........................................................................................................................................................................................... 17
4.2.3 Fleet Vehicles ....................................................................................................................................................................................... 19

3
4.3 When can we expect our energy performance to improve? ....................................................................................................................... 20
5 Water ................................................................................................................................................................................................................... 21
5.1 Key Water Initiatives .................................................................................................................................................................................... 21
5.2 Water Performance ..................................................................................................................................................................................... 21
5.3 What accounts for the extreme variations in water consumption? ............................................................................................................ 23
6 Waste ................................................................................................................................................................................................................... 24
6.1 Key Waste Initiatives .................................................................................................................................................................................... 24
6.2 The Ongoing Challenge of Tracking Waste and Diversion Rates ................................................................................................................. 24
6.3 Performance ................................................................................................................................................................................................ 24
7 Transportation ..................................................................................................................................................................................................... 26
7.1 Key Transportation Initiatives ...................................................................................................................................................................... 26
7.2 Transportation Performance ....................................................................................................................................................................... 26
7.3 Tracking & Monitoring: Future Transportation Priorities ............................................................................................................................ 28
8 Buildings and Land ............................................................................................................................................................................................... 29
8.1 Key Buildings and Land Initiatives ................................................................................................................................................................ 29
8.2 Buildings and Land Performance ................................................................................................................................................................. 29
8.3 New Buildings: can we keep building and still meet our sustainability goals? ............................................................................................ 29
9 Procurement ........................................................................................................................................................................................................ 31
9.1 Key Initiatives ............................................................................................................................................................................................... 31
9.2 Performance ................................................................................................................................................................................................ 31
9.3 Comments .................................................................................................................................................................................................... 31
10 Academics ........................................................................................................................................................................................................ 32
10.1 Key Initiatives ............................................................................................................................................................................................... 32
10.2 What do students and faculty think about integrated sustainability teaching, learning, and research? ................................................... 33

4
11 Key Challenges ................................................................................................................................................................................................. 34
12 Conclusion – campus sustainability, campus growth & the bigger picture ..................................................................................................... 35
13 Appendix A – Performance Indicators ............................................................................................................................................................. 37
14 Appendix B – List of Committee Members & Focus Group Participants ......................................................................................................... 62
15 Appendix C – Sustainability-Related Research at UWinnipeg ......................................................................................................................... 64

5
1 Summary
1.1 Sustainability Performance
1.2 Key Achievements Strategic Plan: The Campus Sustainability Office and Council began a strategic planning process. The aim of this process is to establish campus-
wide quantifiable reduction targets for energy, water, waste, and greenhouse gas emissions, along with targets related to procurement,
transportation, and sustainability teaching, learning, and research. The aim is to launch the plan in early 2012.
Hybrid heating system: The system consists of two electric boilers (one in Centennial Hall and one in Ashdown Hall) and new controls to enable
UW to switch from Natural Gas to electric boilers at off-peak times. The boiler in Centennial was operational as of January 2011. The boiler in
Ashdown Hall continues to experience challenges with its emergency release valve. It is not yet operational. Once fully operational, we can
expect annual savings in the order of 1000 T CO2e relative to the campus heating system operating without the electric boilers.
GHG Emissions
Natural Gas Consumption
Electricity Consumption
Water Consumption
Business Travel
Recyling Collection
Compost Collection
Total Area
+ 0.89%
-2.82%
+ 14.70%
-7.04%
+ 61.78%
+ 22.38%
+ 72.46%
+ 3%
FY2010 UW Sustainability Performance Summary

6
Comprehensive facilities audit: Johnson Controls International was hired to conduct a sustainability audit of Ashdown, Bryce, Centennial,
Graham, Lockhart, Manitoba, Riddell, HBO, Duckworth, Sparling, MacNamara, and Young buildings in summer 2010. Opportunities for energy
and GHG savings were identified and UW’s current water conservation strategy was reviewed. Based on audit results, JCI recommended a 24%
reduction of GHG emissions and 27% energy reduction target for the buildings audited, with a payback period of approximately 15 years. We
have begun implementing some recommended measures internally.
Water retrofit: UWinnipeg plumber Doug Foster introduced a bathroom fixture retrofit program that promises to save the University in excess
of one million gallons of water per year. This initiative developed as a result of COPSE (Council on Post-Secondary Education) funding intended to
improve the accessibility of washrooms. It has achieved this aim while also significantly reducing our demand for potable water. Mr. Foster was
awarded the Campus Sustainability Recognition Award in recognition of this achievement.
Bike Lab: The UWSA Bike Lab/UWinnipeg Bike Hub project continues to inch its way forward. As of May 2011, a CCDC contract has been signed
with contractors and construction is set to begin in earnest as soon as the lab site is available after spring convocation. Key financial
contributors to the project include a private donor ($100,000), Ken Cranwell (shipping containers), the University of Winnipeg Students’
Association (UWSA, $55,000), and the VP HR, Audit & Sustainability Office ($10,000).
Grass Routes Sustainability Festival: In February 2011, the Campus Sustainability Office and the UWSA held a week long celebration of the skills,
creativity and community required for a more sustainable planet. On the basis of the success of the event, the CSO and UWSA hope to make this
an annual event. In 2012, efforts will be make to include a stronger academic component to the festival.
Phase 1 integrated waste management project: With the help of grants from the Winnipeg Foundation and a provincial Waste Reduction and
Pollution Prevention grant, the CSO undertook the first phase of an integrated waste management project. This included developing maps and
databases of waste, compost, and recycling bins on campus, developing the CSO’s education & outreach capacities, completing a compost
machine feasibility study, establishing a single-stream recycling system, and re-designing waste-related posters throughout campus. Education
and outreach activities appear to have had an impact - compost collection increased 72% through 2010/2011, while we collected on average 1
tonne more of recycling per month since the implementation of our augmented recycling system.
LEED Buildings: The UWSA Daycare and McFeetors Hall earned LEED Silver certification. The Buhler Centre, built over the summer of 2010, is
targeting LEED Silver, while the new Science Building, to be completed by the end of June 2011, is aiming for LEED Gold.
1.3 Kyoto Compliance Forecast UW’s 2012 GHG emission reduction target of 6% below 1990 is still within reach, provided that a defined set of energy efficiency measures in
existing buildings is carried out in order to offset the impact of new buildings. A further target of achieving emission reductions of 10% below
1990 levels by 2016 is also proposed for the Strategic Plan.

7
2 Introduction
2.1 Reporting Period and Scope This report applies to FY2010 – April 1 2010-March 31 2011, and applies to the full scope of the University of Winnipeg’s Sustainability
Management System. This includes:
1. All physical facilities and buildings owned and managed by The University of Winnipeg including all future acquisitions of real properties
which come to be owned and managed by The University.
2. All physical facilities and buildings, or spaces within facilities or buildings, leased or rented by The University of Winnipeg, and over
which The University can reasonably influence the sustainability performance of the facility.
3. All routine activities, programs and operations of The University of Winnipeg, whether on or off campus, and including staff, faculty and
student travel, both directly on behalf of the University in conducting its operations and programs, or commuting of staff, faculty and
students to and from their places of residence for purposes of work, teaching, research, study, recreation or any other University
activity.
4. All activities, programs or special events which may from time to time be hosted by The University of Winnipeg, or for which the
University may provide physical facilities, active partnerships, or other support when such programs or events are offered by
institutions, groups, corporations or organizations that are not formally recognized as part of the University community.
5. All “arms length” agencies, corporations, institutes, research centres or other entities, to which University policies may generally apply.
2.2 Sustainability Governance & Strategic Plan Implementation of the University of Winnipeg’s Sustainability Policy, along with its eight accompanying administrative policies is coordinated
through the Campus Sustainability Office, with the help of the Campus Sustainability Council and its working groups. With the support of the
Director of the Campus Sustainability Office, the VP HR, Audit & Sustainability champions sustainability-related issues at the University’s senior
level.
In FY2010, the University launched a sustainability strategic planning process, which should be complete early in 2012. The aim of this process is
to update the vision and mission of UW’s sustainability efforts; to update the organizational structure of UW’s sustainability activities in order to
achieve greater integration and coordination between all parts of the University with respect to sustainability; and to establish a set of
measurable targets that will help the University meet the goals set down in its Sustainability Policy. The table below illustrates a draft target
structure for the plan.

8
# Targets Phase 1
(2011-2014)
Phase 2
(2015-2018) Policy Goal
1 Reduce GHG emissions. X% X% Net 0
2 Reduce energy and water consumption. X% X% Continuously reduce overall demand
3 Divert solid, hazardous, and electronic waste. X% X% 100%
4 Reduce solid, hazardous, and electronic waste. X% X% Strive for zero net waste
5 New and existing buildings achieve green
certification status.
all new buildings,
X% existing
all new buildings,
X% existing all new buildings
6 University purchasing power supports
sustainable communities. Plan Assessed against plan Assessed against plan
7 Active culture of sustainability teaching, learning,
research, and work. Assessed at each phase through qualitative and quantitative measures.
9 Continue to develop and simplify Sustainability
Management System Assessed at each phase through qualitative and quantitative measures.

9
The University’s first priority for FY2011 will be to complete its sustainability strategic plan. This is likely to include a careful consideration of the
merits of participating in the STARS (Sustainability Tracking & Rating System) program, administered by the Association for the Advancement of
Sustainability in Higher Education (AASHE).
In FY 2010, UW President and Vice-Chancellor Lloyd Axworthy also signed the University and College Presidents’ Climate Change Statement of
Action for Canada. This formalizes UW’s commitment to join a national community of Universities that recognize their responsibility to advance
knowledge for society and our obligation to demonstrate leadership in areas of community, national and global importance and that are
committed to tracking, monitoring, and strategically reducing their greenhouse gas emissions.
2.3 Annual Demographic, Weather, and Space Variations The number of people on campus, annual variations in weather, and changes in the campus footprint all have an impact on the University’s
sustainability performance. More people, cold winters, hot summers, and a larger footprint will all increase resource demand, while fewer
people, warmer winters, cooler summers, and reductions in the University’s footprint would have the opposite effect.
2.3.1 Area Under Operational Control
The University of Winnipeg’s annual sustainability report reflects data on buildings that the University owns and/or that the University exercises
some degree of control over utility consumption. Currently, 91% of the space occupied by the University’s is represented in this report. The
remaining 9% represents space over which the University does not have any operational control and does not have access to utility consumption
data.
The table below summarizes campus area under operational control since 2006, along with the percent change in this area year over year.
UWinnipeg Area Under
Operational Control (sq. m)
FY2006 91750 % change
FY2007 91750 0%
FY2008 92950 1%
FY2009 101169 9%
FY2010 104148 3%

10
2.3.2 Campus Population & Operational Changes
There have been no significant changes in the number of people regularly on campus over FY2010, nor have there been significant changes to
campus hours of operation or other building use patterns that may impact the resource use of the University.
UWinnipeg Student & Staff
Population
FCE # Staff #
FY2006 30180 NA
FY2007 30626 NA
FY2008 30160 NA
FY2009 34670 782
FY2010 33920 812
2.3.3 FY 2010 Weather
FY2010 was slightly colder through the winter and warmer through the summer than FY2009. We can expect this difference to cause a slight
increase in the University’s overall gross energy use, particularly in our hydroelectricity consumption. FY2010 was also significantly wetter than
FY2009 (761 vs. 460 mm of precipitation over the year). We can expect this to have reduced demand for potable water use for the purpose of
landscaping.
*Richardson International Airport weather data
**Heating degree-days (HDD) for a given day are the number of Celsius degrees that the mean
temperature is below 18°C.
*** Cooling degree-days (CDD) for a given day are the number of Celsius degrees that the mean
temperature is above 18°C.
Winnipeg Weather Data*
HDD** CDD*** Precipitation
FY2006 5443 NA NA
FY2007 5897 NA NA
FY2008 6002 NA NA
FY2009 5464 119 460 mm
FY2010 5600 173 761 mm

11
3 GHG Emissions & Air Quality The University’s greenhouse gas emissions and other air quality impacts are addressed in its Air Quality Management Policy and monitored on
the basis of the indicators developed to reflect the goals set down in it.
3.1 GHG Emissions & Air Quality Key Initiatives Hybrid heating system: The system consists of two electric boilers (one in Centennial Hall and one in Ashdown Hall) and new controls to enable
UW to switch from Natural Gas to electric boilers at off-peak times. The boiler in Centennial was operational as of January 2011. The boiler in
Ashdown Hall continues to experience challenges with its emergency release valve and is therefore not yet operational. Numerous fixes have
been attempted without success, and efforts to make the boiler operational are ongoing. Once fully operational, we can expect annual savings in
the order of 1000 T CO2e relative to the campus heating system operating without the electric boilers.
Comprehensive facilities audit: Johnson Controls International was hired to conduct a sustainability audit of Ashdown, Bryce, Centennial,
Graham, Lockhart, Manitoba, Riddell, HBO, Duckworth, Sparling, MacNamara, and Young buildings. Opportunities for energy and GHG savings
were identified and UW’s current water conservation strategy was reviewed. Based on audit results, JCI recommended a 24% reduction of GHG
emissions and 27% energy reduction target for the buildings audited, with a payback period of approximately 15 years.
Science Building and Richardson College for the Environment: This new building will add approximately 30% more space to the campus, which
presents a challenge with respect to the university’s total energy, water, and GHG performance. However, once open (summer of 2011), some
of this added consumption will be offset by allowing the University to vacate some leased space over which it has little control over building
systems. The University will also decommission several old, inefficient labs in core buildings. Converting these labs into basic classrooms and
offices should help reduce energy consumption of core buildings, while the labs in the Science Building are among the most energy efficient in
North America.
3.2 GHG Emissions & Air Quality Performance See Appendix for air quality performance indicators. In FY2010, University greenhouse gas emissions increased by 0.89%. Provincial and
national data for 2010 emissions is not yet available. Total emissions in Manitoba in 2009 decreased 6.3%1 and total emissions in Canada
decreased 6% over the previous year.2
1 http://news.gov.mb.ca/news/index.html?item=11511
2 National Inventory Report Executive Summary, Environment Cadana: http://www.ec.gc.ca/Publications/A07097EF-8EE1-4FF0-9AFB-
6C392078D1A9/NationalInventoryReportGreenhouseGasSourcesAndSinksInCanada19902009ExecutiveSummary.pdf

12
At UWinnipeg, reductions in emissions from lower natural gas consumption were offset by an increase in business travel (discussed further in
the Transportation section below). The tables below outline total GHG emissions since 2006 as well as the distribution of campus GHG
emissions FY2010.
3621 4190 4017 4134 4286 4324
0
1000
2000
3000
4000
5000
1990 2006 2007 2008 2009 2010
GH
G E
mis
sio
ns
(TC
O2
e)
year
Total GHG Emissions (TCO2e)
Target = 3404 TCO2e
Annual Emissions
Electricity, 34, 1%
Natural Gas, 3365, 78%
Fleet Vehicles, 22, 0%
Business Travel, 500,
12%
Waste, 404, 9%
FY2010 GHG Emissions (TCO2e)

13
3.3 Kyoto Target Forecast UW’s 2012 GHG emission reduction target of 6% below 1990 is still within reach, provided that a defined set of energy efficiency measures in
existing buildings is carried out to offset the impact of new buildings. Based on the total projected area under university management in
FY2011, the University will require a reduction of approximately 1,225T CO2e. This can be achieved primarily through the completion of the
installation of a hybrid heating system and with the implementation of audit recommendations.
Hybrid Heating System, 800 T,
65%
Audit Measures, Building
Demolitions, User-oriented
strategies, Savings from lab
decommissioning, 425 T, 35%
GHG Reduction Measures
14
4 Energy The University’s energy impacts are addressed in its Energy Management Policy and monitored on the basis of the indicators developed to
reflect the goals set down in it.
4.1 Key Energy Initiatives As with the University’s greenhouse gas performance, key energy-related initiatives for FY2010 consisted of the installation of a hybrid heating
system, the completion of a comprehensive facilities audit, and the construction of the new Science Building. We can hope for energy
consumption and energy intensity to decline as audit measures are implemented over the next few years.
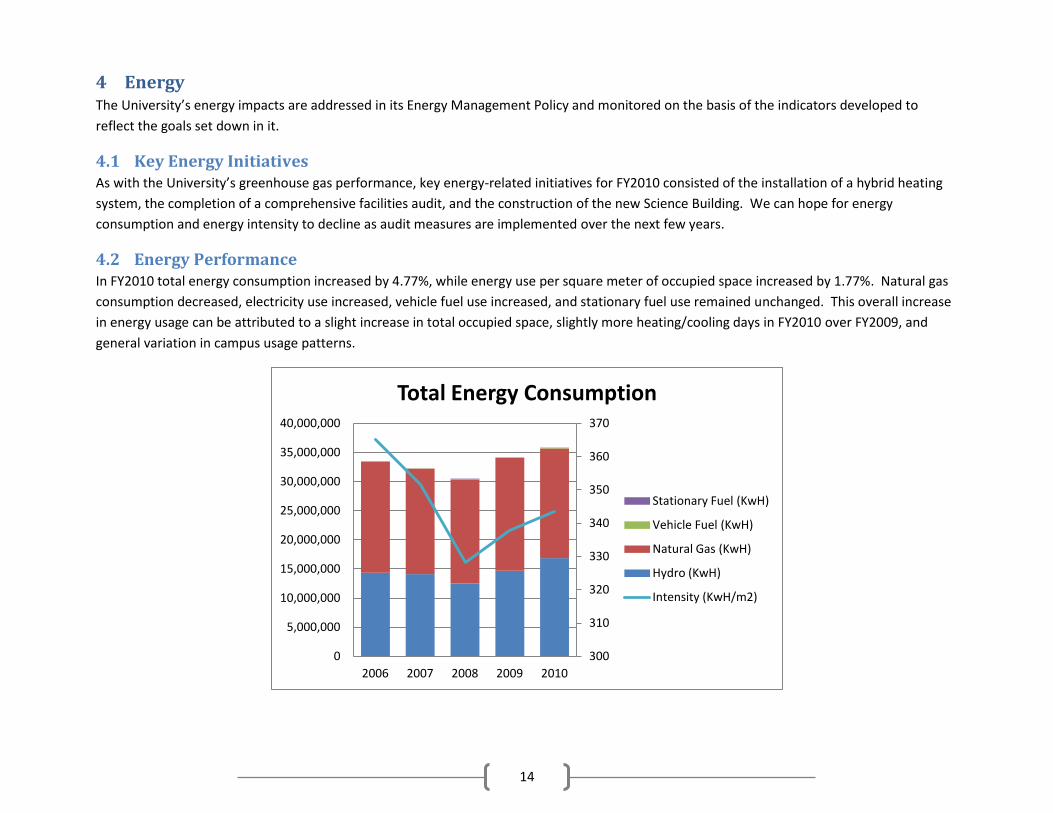
4.2 Energy Performance In FY2010 total energy consumption increased by 4.77%, while energy use per square meter of occupied space increased by 1.77%. Natural gas
consumption decreased, electricity use increased, vehicle fuel use increased, and stationary fuel use remained unchanged. This overall increase
in energy usage can be attributed to a slight increase in total occupied space, slightly more heating/cooling days in FY2010 over FY2009, and
general variation in campus usage patterns.
300
310
320
330
340
350
360
370
0
5,000,000
10,000,000
15,000,000
20,000,000
25,000,000
30,000,000
35,000,000
40,000,000
2006 2007 2008 2009 2010
Total Energy Consumption
Stationary Fuel (KwH)
Vehicle Fuel (KwH)
Natural Gas (KwH)
Hydro (KwH)
Intensity (KwH/m2)

15
Building-specific impacts in natural gas and electricity consumption over the year do reflect the installation of the first of two electric boilers as
part of the hybrid system. This system is not expected to reduce total energy consumption; however it is expected to reduce natural gas
consumption and the GHG emissions associated with it. It will also increase low-emission electricity consumption.
4.2.1 Hydro-electricity
In FY2010, total electricity consumption increased by 14.70% over FY2009. Electricity consumption per square meter of managed University
space increased by 14.42%.
Electricity use and year over year changes according to building are summarized in the table below. Most changes reflect general shifts in
building occupancy use. Exceptions include:
A 10.96% (1,716,066 KwH) increase in electricity consumption metered in Manitoba Hall. This reflects the January installation of the first electric boiler associated with the hybrid heating system.
The apparent 77.75% decrease in electricity use in McFeetors’ Hall reflects the addition of a separate meter to monitor the electricity being drawn to power construction for the new Science Building.
The 34.4% increase in electrical consumption at 520 Portage is a reflection of significantly improved data for this building, rather than of a significant increase in consumption.
2007 2008 2009 2010
Total Electricity (KwH) 14,118,810 12,501,378 14,702,975 16,864,380
Electricity Intensity (KwH/m2)
153.88 134.50 145.33 161.93
0
20
40
60
80
100
120
140
160
180
0
2,000,000
4,000,000
6,000,000
8,000,000
10,000,000
12,000,000
14,000,000
16,000,000
18,000,000
Total Electricity

16
2009 vs. 2010 electricity by
building KwH change % change 2009 (KwH) 2010 (KwH)
370 Langside (McFeetors) -636,117 -77.75% 818,171 182,054
511 Ellice -18,919 -7.97% 237,492 218,573
342 Young -13,683 -100.00% 13,683 0
Duckworth Centre -13,570 -0.71% 1,923,570 1,910,000
440 Spence -3,756 -100.00% 3,756 0
284 Balmoral -2,110 -13.84% 15,243 13,133
359 Young -1,920 -3.82% 50,220 48,300
MacNamara Hall -1,800 -0.76% 236,880 235,080
270 Balmoral -1,580 -13.66% 11,570 9,990
434 Spence -1,080 -100.00% 1,080 0
266 Balmoral 76 1.24% 6,119 6,195
Garage 82 1.67% 4,903 4,985
449 Spence 894 15.08% 5,929 6,823
480 Portage 1,140 1.63% 70,020 71,160
278 Balmoral 1,373 10.38% 13,230 14,603
T21 (Theatre) 12,600 2.70% 467,280 479,880
Wesley Hall 15,120 2.37% 637,200 652,320
520 Portage 37,989 34.42% 110,355 148,344
Manitoba Hall 188,106 10.96% 1,716,066 1,904,172
Lockhart Hall 199,800 2.39% 8,360,208 8,560,008
Buhler 656,160 100.00% 0 656,160
370 Langside #2 1,742,600 100.00% 0 1,742,600
TOTAL 2,161,405 14.70% 14,702,975 16,864,380
red=campus building, green=residence building
In comparing the proportional area and the proportional electricity consumption for recently renovated or constructed buildings, we see that
the Buhler building is consuming a larger proportion of electricity than its proportion of total campus area. This consumption is more than offset

17
by its very low natural gas consumption (more below) – a reflection of our attempts at prioritising lower emitting energy sources in new
construction. McFeetors Hall and the Daycare are performing efficiently.
% Consumption vs. %
Total Area
% of total
area
% of electricity
consumption
T21 (Theatre) 4.33% 2.85%
370 Langside (McFeetors)
& 548 Furby (Daycare) 7.84% 1.08%
Buhler* 4.28% 6.42%
* Buhler compared to total consumption over Sept-March to reflect occupancy
date
4.2.2 Natural Gas
In FY2010, total natural gas consumption decreased by 2.82% over FY2009. Natural gas consumption per square meter of managed University
space decreased by 5.60%.
Natural Gas use and year over year changes according to building are summarized in the table below. Most changes reflect general shifts in
building occupancy use. An exception to this is the 15.94% (59,431 m3) decrease in natural gas consumption metered in Lockhart Hall, which
reflects reduced consumption for the gas boilers due to the installation of the first electric boiler associated with the hybrid heating system.
2007 2008 2009 2010
Natural Gas (m3) 1,710,947 1,688,739 1,830,931 1,779,367
NG Intensity (m3/m2) 18.65 18.17 18.10 17.08
16.00
16.50
17.00
17.50
18.00
18.50
19.00
1,600,000
1,650,000
1,700,000
1,750,000
1,800,000
1,850,000
Total Natural Gas

18
2009 vs. 2010 Natural Gas by Building volume change (m3) % change 2009
(m3) 2010 (m3)
Lockhart Hall -59,431 -15.84% 375,286 315,855
Ashdown (F) -11,246 -29.04% 38,724 27,478
T21 (Theatre) -8,266 -8.99% 91,966 83,700
Duckworth Centre -6,119 -9.98% 61,330 55,211
480 Portage -4,276 -25.46% 16,798 12,522
370 Langside (McFeetors) -3,486 -3.27% 106,471 102,985
548 Furby (Daycare) -887 -4.91% 18,061 17,174
270 Balmoral -753 -16.01% 4,701 3,948
440 Spence -750 -100.00% 750 0
342 Young -717 -100.00% 717 0
MacNamara Hall -628 -5.33% 11,793 11,165
434 Spence -604 -100.00% 604 0
266 Balmoral -218 -6.99% 3,123 2,905
Wesley Hall -187 -8.54% 2,191 2,004
Garage 119 6.47% 1,845 1,964
284 Balmoral 434 7.74% 5,602 6,036
359 Young 663 6.95% 9,542 10,205
511 Ellice 1,169 6.37% 18,345 19,514
278 Balmoral 1,273 29.39% 4,332 5,605
449 Spence 2,120 71.55% 2,963 5,083
Ashdown (I) 26,167 2.48% 1,055,787 1,081,954
*green= residence buildings, orange=campus buildings
In comparing the proportional area and the proportional natural gas consumption for recently renovated or constructed buildings, we see that
the daycare and T21 are consuming a larger proportion of natural gas than their proportion of total campus area, while McFeetors Hall and the
Buhler building are performing more efficiently. The reasons for higher natural gas consumption in the daycare and T21 are under investigation.

19
% Consumption vs. % Total
Area
% of total
area
% of natural gas
consumption
T21 (Theatre) 4.33% 4.70%
370 Langside (McFeetors) 6.97% 5.79%
548 Furby (Daycare) 0.87% 0.97%
Buhler* 4.28% 0.90%
* Buhler compared to consumption over Sept-March to reflect occupancy date
The construction of the Buhler building made it possible to move the Division of Continuing Education out of leased space and into space owned
by the university. At present, UWinnipeg does not have access to energy performance data for the majority of its leased space. It is likely that
the building in which the Division of Continuing Education was housed prior to relocating to the Buhler building was significantly less energy
efficient than its current home.
4.2.3 Fleet Vehicles
Campus fleet vehicles logged 18.03% more kilometres in FY2010 than in FY2009, while the total fuel consumed by fleet vehicles and equipment
increased by 33%. Part of this increase can be attributed to better monitoring of fuel use for landscape machinery. The number and type of
vehicles remained unchanged.
Campus Vehicle and Equipment Fuel
Consumption (L) FY2007 FY2008 FY2009 FY2010 % change 2009/2010
Other (Regular) NA NA NA 332 NA
Other (Diesel) NA NA NA 791 na
Bobcats (Diesel) 915 928 871 1,205 38%
Enrollment Services 1,160 824 1,131 955 -16%
Physical Plant Van 748 974 724 764 6%
Security Van** 3,288 4,992 5,109 5,200 2%
Total (Regular Fuel) 5,196 6,790 7,835 7,252 -7%
Total (Diesel Fuel) 915 928 871 1,996 129%**
Total (All Fuel) 6,111 7,718 6,964 9,248 33%
*Security Van for FY2010 is estimated
** Note artificial spike due to incomplete data for
„Other Diesel‟ fuel for previous years.

20
4.3 When can we expect our energy performance to improve? The completion of the comprehensive facilities audit in FY2010 positions the University to achieve real energy efficiency improvements to core
buildings in FY2011 and for years to come. The hiring of a new Controls Technician in the Physical Plant establishes the in-house capabilities
required to undertake several audit measures internally. The potential for energy performance improvements forms an integral part of the
university’s sustainability strategic planning process. With these facts in mind, we can hope to see improvements in the University’s energy
efficiency in FY2011, while overall energy use reductions remain a goal upon which we can set our sights as we continue to pursue our
sustainability goals.

21
5 Water The University’s water impacts are addressed in its Water Use Management Policy and monitored on the basis of the indicators developed to
reflect the goals set down in it.
5.1 Key Water Initiatives The University undertook an extensive water fixture retrofit project in FY2010, with approximately 45% of washrooms now outfitted with water
conserving fixtures. The remaining washrooms are scheduled to be switched out in the coming year. The project was introduced by UWinnipeg
plumber Mr. Doug Foster and developed as a result of COPSE funding intended to improve the accessibility of washrooms. It achieved this aim
while also reducing demand for potable water and dramatically improving the cleanliness of washrooms. Targeted pre- and post- retrofit
metering of washrooms suggests a cumulative saving in excess of one million gallons of water a year once all washrooms have been completed.
Mr. Foster was awarded the Campus Sustainability Recognition Award in recognition of this achievement.
5.2 Water Performance In FY2010 total recorded water use decreased by 7.04%, or 5,262,546 litres. Water use and year over year changes according to building are
summarized in the tables below.
0
10,000,000
20,000,000
30,000,000
40,000,000
50,000,000
60,000,000
70,000,000
80,000,000
90,000,000
2006 2007 2008 2009 2010
Total Water Consumption 47,388,592 43,897,460 80,113,761 74,714,597 69,452,051
Tota
l Co
nsu
mp
tio
n (
L)
Total Water Consumption

22
2009 vs. 2010 water by
building Litres change % change 2009 (Litres) 2010 (Litres)
370 Langside -22,772,000 -89.54% 25,433,000 2,661,000
MacNamara Hall North -257,200 -79.14% 325,000 67,800
440 Spence -104,400 -100.00% 104,400 NA
MacNamara Hall South -102,500 -12.17% 842,000 739,500
T21 (Theatre) -84,000 -17.87% 470,000 386,000
449 Spence -79,900 -15.51% 515,200 435,300
434 Spence -76,500 -100.00% 76,500 NA
266 Balmoral -65,891 -18.17% 362,691 296,800
359 Young -46,100 -31.36% 147,000 100,900
284 Balmoral 0 0.00% 464,251 464,251
371/377 Langside 15,600 NA NA 15,600
Garage 22,200 35.24% 63,000 85,200
Graham Hall 71,000 11.74% 605,000 676,000
270 Balmoral 139,122 21.57% 644,978 784,100
276 Balmoral 232,623 32.69% 711,577 944,200
480 Portage 262,700 66.84% 393,000 655,700
548 Furby 268,800 71.49% 376,000 644,800
Buhler 276,000 NA NA 276,000
Lockhart Hall 276,000 0.91% 30,351,000 30,627,000
511 Ellice 398,200 61.36% 649,000 1,047,200
Wesley Hall 2,674,200 62.72% 4,264,000 6,938,200
Bryce Hall 3,239,500 210.08% 1,542,000 4,781,500
Duckworth Centre 10,450,000 163.92% 6,375,000 16,825,000
TOTAL -5,262,546 -7.04% 74,714,597 69,452,051
red=campus building green=residence building

23
5.3 What accounts for the extreme variations in water consumption? Variable water consumption data at the University continues to present challenges. Over the five years that UWinnipeg has compiled annual
sustainability reports, total water consumption has tended to vary significantly and unpredictably from building to building. We continue to
work to achieve a better understanding of the cause of these variations and to seek out ways of acquiring more precise water consumption data.
One reason for this variation may be quarterly estimated meter readings that can sometimes vary considerably from actual usage. If an
estimated reading is adjusted against actual usage over two fiscal years, total consumption for each will be significantly skewed. This took place
with McFeetors Hall over FY2009 and FY2010. Other variations in water consumption would reflect changes in the use and fixtures in
washrooms, kitchens, laundry, and grounds keeping. They would also reflect changes in water use for heating and cooling, where annual
variations in water use are affected by heating/cooling degree days and humidity. Finally, annual variation in water used for grounds keeping is
affected by precipitation.
24
6 Waste The University’s waste impacts are addressed in its Waste Minimization Policy and monitored on the basis of the indicators developed to reflect
the goals set down in it.
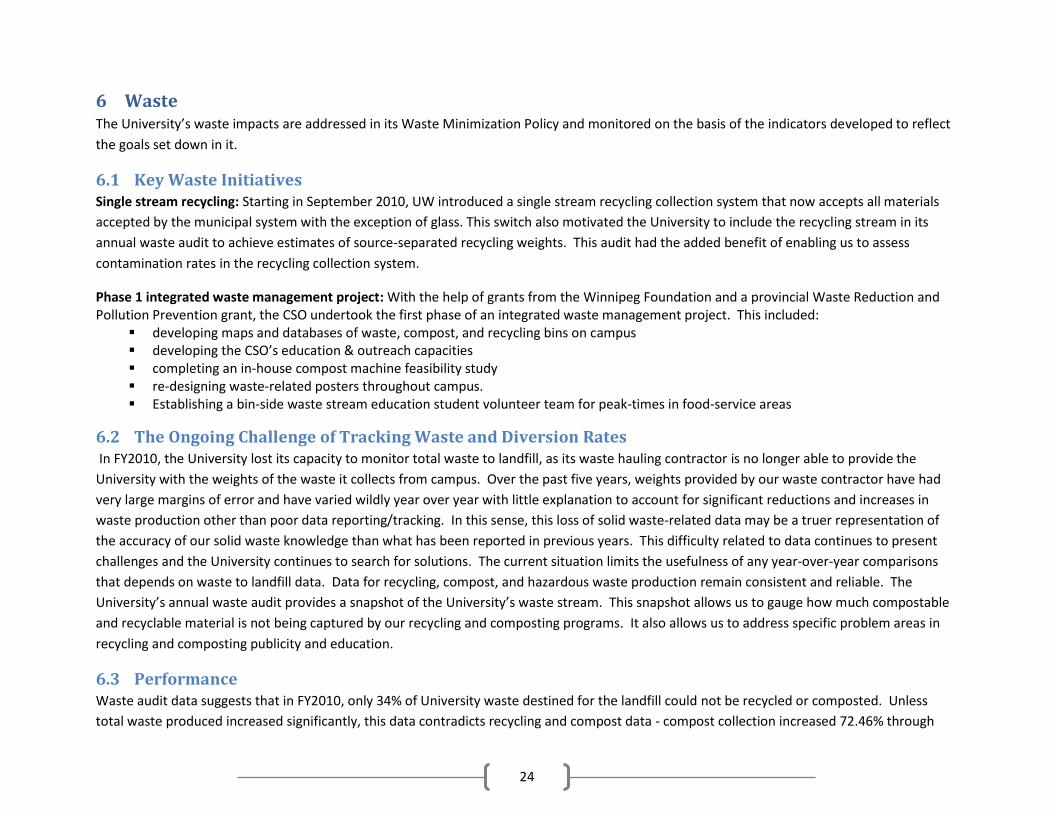
6.1 Key Waste Initiatives Single stream recycling: Starting in September 2010, UW introduced a single stream recycling collection system that now accepts all materials
accepted by the municipal system with the exception of glass. This switch also motivated the University to include the recycling stream in its
annual waste audit to achieve estimates of source-separated recycling weights. This audit had the added benefit of enabling us to assess
contamination rates in the recycling collection system.
Phase 1 integrated waste management project: With the help of grants from the Winnipeg Foundation and a provincial Waste Reduction and Pollution Prevention grant, the CSO undertook the first phase of an integrated waste management project. This included:
developing maps and databases of waste, compost, and recycling bins on campus developing the CSO’s education & outreach capacities completing an in-house compost machine feasibility study re-designing waste-related posters throughout campus. Establishing a bin-side waste stream education student volunteer team for peak-times in food-service areas
6.2 The Ongoing Challenge of Tracking Waste and Diversion Rates In FY2010, the University lost its capacity to monitor total waste to landfill, as its waste hauling contractor is no longer able to provide the
University with the weights of the waste it collects from campus. Over the past five years, weights provided by our waste contractor have had
very large margins of error and have varied wildly year over year with little explanation to account for significant reductions and increases in
waste production other than poor data reporting/tracking. In this sense, this loss of solid waste-related data may be a truer representation of
the accuracy of our solid waste knowledge than what has been reported in previous years. This difficulty related to data continues to present
challenges and the University continues to search for solutions. The current situation limits the usefulness of any year-over-year comparisons
that depends on waste to landfill data. Data for recycling, compost, and hazardous waste production remain consistent and reliable. The
University’s annual waste audit provides a snapshot of the University’s waste stream. This snapshot allows us to gauge how much compostable
and recyclable material is not being captured by our recycling and composting programs. It also allows us to address specific problem areas in
recycling and composting publicity and education.
6.3 Performance Waste audit data suggests that in FY2010, only 34% of University waste destined for the landfill could not be recycled or composted. Unless
total waste produced increased significantly, this data contradicts recycling and compost data - compost collection increased 72.46% through

25
2010/2011, while recycling collection increased by 22.38%. These results would suggest improvements in diversion rates. This contradiction
further highlights the need to establish reliable waste-to-landfill data. For data on hazardous and electronic waste, see waste indicators in
appendix.
0.0
20.0
40.0
60.0
80.0
100.0
120.0
140.0
2006 2007 2008 2009 2010
Recycling 83.1 92.7 93.2 108.0 132.2
Compost 0.0 1.5 11.1 13.5 23.2
Me
tric
To
nn
es
Annual Compost & Recycling Rates
Waste, 613.2kg, 34%
Could have been recycled,
444.5kg, 25%
Could have been composted,
728.8kg, 41%
Waste Audit: Recyclable & Compostable Material
Found in the Garbage

26
7 Transportation The University’s transportation impacts are addressed in its Sustainable Transportation Policy and monitored on the basis of the indicators
developed to reflect the goals set down in it.
7.1 Key Transportation Initiatives Bike Lab: The UWSA Bike Lab/UWinnipeg Bike Hub project continues to inch its way forward and should be operational on time for the start of
the 2011/2012 academic year. Key financial contributors to the project include a private major donor ($100,000), Ken Cranwell (shipping
containers), the UWSA ($55,000), and the VP HR, Audit & Sustainability Office ($10,000).
Ice Riders: Launched in the spring of 2010, the UWSA-run Ice Riders winter cycling team had an incredibly successful season. Membership
ballooned from about 10 to over 50; regular bicycle maintenance workshops were held through the cold winter months, and the team produced
a high-quality video about the Bike Lab. This momentum promises to propel programming in the Bike Lab once it is completed.
Underground bicycle parking: In FY2010, indoor secure bicycle parking underground the Duckworth Centre was made available to students,
faculty, and staff for $10 a month. All students, as well as faculty and staff with Duckworth Centre memberships, have easy access to
Duckworth showers from this parking location. For an additional $2.00/month, faculty and staff without Duckworth Centre memberships can
also access showers.
UWinnipeg Balmoral Transit Terminal: In FY2010, The University of Winnipeg partnered with Winnipeg Transit to redevelop the former
Greyhound Bus depot into the new UWinnipeg Balmoral Transit Terminal, providing improved service to students and thousands of downtown
commuters. Once the first phase of the Southwest Rapid Transit Corridor is completed in late 2011, the terminal will also make it possible for
commuters to travel efficiently from neighbourhoods such as St. Norbert, Fort Garry, Fort Richmond, Waverley Heights and Linden Woods in the
southwest end of the city to the UWinnipeg campus.
7.2 Transportation Performance Though staff travel budgets decreased by 4% in FY2010 over FY2009, significantly more reimbursed travel took place (+61.48% T CO2e, +63.17%
km). This increase likely reflects an increase in research-related travel, funded through external grants. Establishing means of minimizing
research-related travel impacts remains a challenge. At present, the University is working to facilitate the substitution of travel with distance
communication technologies by installing two Cisco TelePresence TM video conference sites on campus.

27
Transportation Impacts Units FY2008 FY2009 FY2010
%
Change
(FY2010
vs
FY2009)
Reimbursed Air Travel
km 3,599,160 2,054,975 3,393,691 65.15%
# of trips/claims 462 340 486 42.94%
TCO2e 489 279 461 65.15%
Reimbursed Automobile
Travel
km 220,590 128,790 158,314 22.92%
# of trips/claims 601 393 522 32.82%
TCO2e 52 30 37 22.92%
Reimbursed Intra-City Bus
Travel
km 5,851 632 8,956 1318.12%
# of trips/claims 35 20 23 15.00%
2008 2009 2010
km 3825791 2185508 3566003
TCO2e 542 309.9 500.4
0
100
200
300
400
500
600
0
500,000
1,000,000
1,500,000
2,000,000
2,500,000
3,000,000
3,500,000
4,000,000
4,500,000
Total Reimbursed Travel
28
TCO2e 0.85 0.09 1.31 1318.12%
Other Reimbursed Travel
(esp. rail, km)
km 190 1,111.5 5,042 353.62%
# of trips/claims 30 24 10 -58.33%
TCO2e 0.00 0.11 0.52 353.63%
Campus Fleet Vehicles
fuel L 7,717 7,835 9,248 18.03%
TCO2e 18.22 18.49 21.83 18.03%
Totals
km 3,825,791 2,185,508 3,566,003 63.17%
# of
trips/claims 1,128 777 1,041 33.98%
TCO2e 542.0 309.9 500.4 61.48%
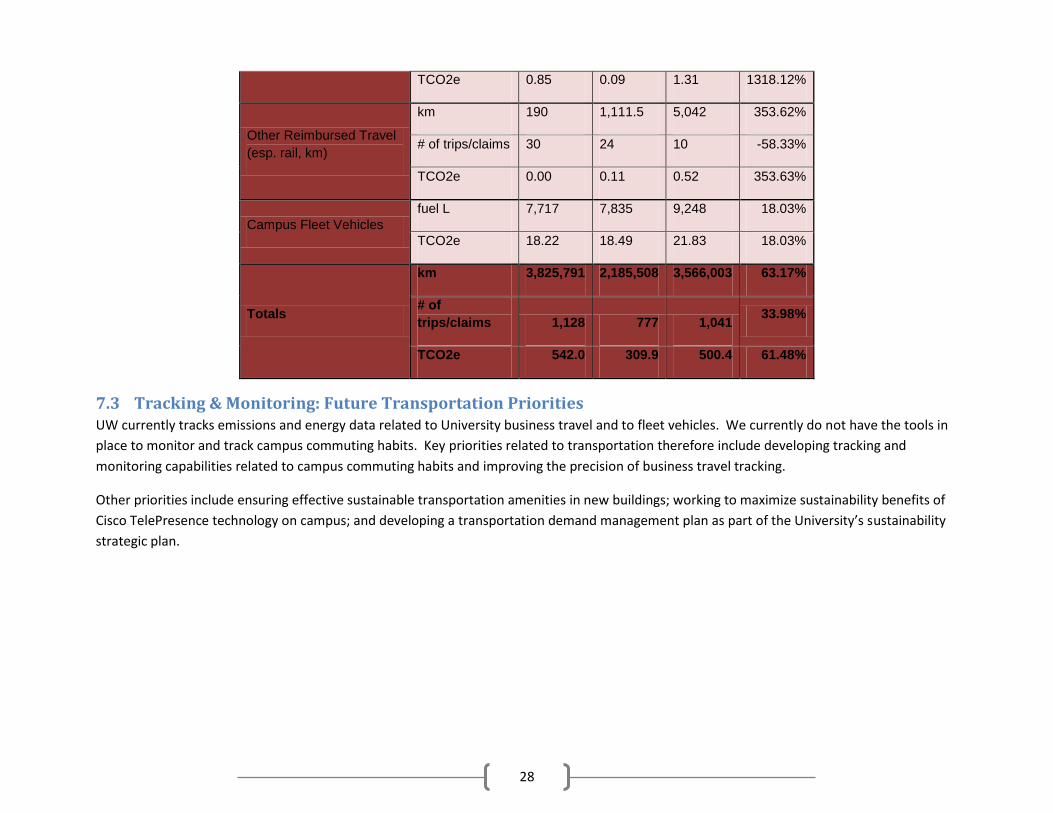
7.3 Tracking & Monitoring: Future Transportation Priorities UW currently tracks emissions and energy data related to University business travel and to fleet vehicles. We currently do not have the tools in
place to monitor and track campus commuting habits. Key priorities related to transportation therefore include developing tracking and
monitoring capabilities related to campus commuting habits and improving the precision of business travel tracking.
Other priorities include ensuring effective sustainable transportation amenities in new buildings; working to maximize sustainability benefits of
Cisco TelePresence technology on campus; and developing a transportation demand management plan as part of the University’s sustainability
strategic plan.

29
8 Buildings and Land Buildings and Land refers to the way in which campus grounds and buildings are maintained. This includes issues related to the application of
chemicals for the purpose of pest control and cleaning, as well as to the use of landscaping and design techniques that maximize campus
facilities’ sustainability performance. Impacts related to these functions are handled in the University’s Land Use and Property Management
Policy and monitored on the basis of the indicators developed to reflect the goals set down in it.
8.1 Key Buildings and Land Initiatives Lake Friendly: In FY2010, UW strengthened its commitment to the use of green cleaning products by signing on to the Lake Friendly initiative.
The initiative seeks to raise awareness of the impact that daily procurement decisions in Manitoba institutions and households have on Lake
Winnipeg.
Green Leases: As part of the green management of the Buhler building, UW negotiated a Green Lease with its food service tenant, to help
ensure that tenants in University space operate in compliance with the University’s Sustainability Policy.
LEED Buildings: Both new construction projects underway in FY2010 (the Buhler Centre and the new Science Building & Richardson College for
the Environment) are targeting LEED certification – the Buhler Centre is seeking LEED Silver, while the RCFE will seek LEED Gold.
8.2 Buildings and Land Performance See Appendix for details on Buildings & Land performance.
Along with maintaining ongoing xeriscaping landscape techniques and green cleaning procedures, the UWSA Daycare and McFeetors Hall earned
formal LEED Silver certifications in FY2010.
8.3 New Buildings: can we keep building and still meet our sustainability goals? UWinnipeg’s growing campus is contributing to the densification and revitalization of our downtown – key elements of intelligent urban design
for sustainable cities. Alongside these and other benefits, to date this growth has also represented a net increase in the university’s ecological
footprint. The greener building principles that sit at the core of current campus development help to mitigate the impacts of increased demand
for natural gas and other natural resources. The challenge and opportunity for leadership ahead is to achieve the benefits of campus
development in a manner that works to decrease, rather than increase, total net resource use. Seeking solutions to this challenge and creative
approaches to seizing it as an opportunity for leadership is at the heart of the strategic planning process currently underway.
The key challenge and opportunity for leadership ahead is to work with public and private partners in maintaining the University's notable
commitment to sustainable building practices for new development while at the same time attending to the sustainability performance of our

30
current building stock. In many respects, innovative building retrofits represent the future of truly progressive greener building. UWinnipeg is
poised to lead the way here, pushing the boundaries of what can be achieved through ongoing commitment to marked improvements in the
efficiency of existing buildings in Manitoba. Success in achieving the University's sustainability targets will undoubtedly draw on UWinnipeg’s
significant achievements in developing greener new buildings, just as it will require the same commitment and valued partnerships that made
these achievements possible.

31
9 Procurement The University’s procurement impacts are addressed in its Green Procurement Policy and are meant to be monitored on the basis of the
indicators developed to reflect the goals set down in it. Currently, the University’s ability to gather data relative to green procurement is very
limited.
9.1 Key Initiatives Social Responsibility: In FY2010, UW purchasing agents worked to incorporate social responsibility requirements in RFP’s alongside extant
environmental requirements.
Provincial Procurement Initiative: Members of the University purchasing department continue to participate in the Province of Manitoba’s
sustainable procurement initiatives and activities.
9.2 Performance The University’s purchasing agents continue to put forward their best efforts under limited resources to support UW’s green procurement goals.
See indicators in appendix for further detail.
9.3 Comments Sustainability language has been included in the University’s Board-level policy; however, administrative policies require review in order to fully
include sustainability into procurement decisions. There is also an ongoing need to develop mass/volume/materials based tracking and
monitoring capabilities in order to support the purchase of more responsible goods and services and to reduce material inputs into the
University.

32
10 Academics While there is no policy related to the role that academics can play in the University’s sustainability work, it is clear that the University’s
teaching, learning, and research has an important role to play both in educating the next generation of leaders for a more sustainable future and
in contributing to the development of solutions to current sustainability challenges locally and globally.
10.1 Key Initiatives Richardson College for the Environment (RCFE): Through FY2010, work continued on the development of the Richardson College for the Environment. College membership will include the Canada Research Chair in Indigenous Science Education and the Canada Research Chair in Inner City Issues and Community Learning and Engagement; the Institute of Urban Studies; the Master’s in Development Practice program; the Indigenous Studies program; the CISCO Centre for Collaborative Technologies which includes a world-class TelePresence system and the endowed Cisco Chair for Collaborative Technology; the Campus Sustainability Office; the University’s medical isotope initiative; and the UW Community Renewal Corporation. The College is intended to stimulate and support interdisciplinary scholarship that addresses concrete sustainability challenges from scientific, policy, and social science perspectives. Governance structures and supports to facilitate this activity are under development. ELIN: The Experiential Learning Initiative Network’s objectives are to support the development of community-service/experiential learning in all
its aspects for the university, faculty, staff, prospective and current students and community partners. ELIN is comprised of dedicated, engaged
and knowledgeable students, staff and faculty. In Spring 2008, ELIN was formed to coordinate initiatives developed through SUNSET (Sustainable
University Now, Sustainable Earth Together), courses with practicum components, teach-ins offered through the Institute for Literacy and
Transformative Learning , as well as university-wide PLAR (Prior Learning Assessment & Recognition) initiatives and consultations with Colin
Russell, University Registrar. Experiential learning is an umbrella term used to describe the following: co-ops, internships, clinicals, service
learning, practicums, student teaching, fieldwork and prior learning.
Research: UW faculty and students continue to undertake a range of research projects relevant to sustainability in Manitoba and in the world at
large. A list of research project titles is included in Appendix C.
Student Projects: The Campus Sustainability Office continues to seek out ways to engage students in campus-based sustainability learning. In
FY2010, the CSO developed a list of potential student projects, to be undertaken by students through honours thesis, directed readings, or major
projects courses. Through the summer and fall of 2011, CSO staff will be meeting with individual departments to seek ways to make it possible
for students to take on these projects.

33
10.2 What do students and faculty think about integrated sustainability teaching, learning, and research? A better integration of teaching, learning, and research with campus sustainability performance remains a priority for staff in the Campus
Sustainability Office; however, efforts at achieving this integration have to date met with very modest results. Many faculty members express
support for the principle of integrating these types of educational experiences into research and students’ academic work; however, it remains
unclear what, if any, specific structures might better facilitate this process. Moreover, in a survey conducted as part of the University
sustainability strategic planning process, student and faculty responses to questions related to the issue of integrating campus sustainability into
academics demonstrated a gap in the degree of support for proposed mechanisms for achieving integration:
Several universities in North America seek to integrate academic teaching and research into their sustainability plans. How supportive would
you be of (1 not supporting, 5 very supportive):
In FY 2010, the CSO will continue to work with faculty and students to seek out appropriate means of integrating the university’s sustainability
efforts with students’ academic experience.
0.0
0
0.5
0
1.0
0
1.5
0
2.0
0
2.5
0
3.0
0
3.5
0
4.0
0
4.5
0
A comprehensive database of sustainability-related
research on campus.
The encouragement of research directly related to
the University's sustainability performance.
A registry of sustainability-related research project
proposals on campus and/or in the community for
students and/or faculty to consult as they develop
their research agendas.
Integrating campus-based sustainability
w ork/research into student coursew ork.
Faculty Rating Average
Student Rating Average

34
11 Key Challenges Campus development & planning: UWinnipeg’s growing campus is contributing to the densification and revitalization of our downtown – key
elements of intelligent urban design for sustainable cities. Alongside these and other benefits, to date this growth has also represented a net
increase in the university’s ecological footprint. The greener building principles that sit at the core of current campus development help to
mitigate the impacts of increased demand for natural gas and other natural resources. The challenge and opportunity for leadership ahead is to
achieve the benefits of campus development in a manner that works to decrease, rather than increase, total net resource use. Seeking solutions
to this challenge and creative approaches to seizing it as an opportunity for leadership is at the heart of the strategic planning process currently
underway. UWinnipeg has the opportunity to show decisive commitment and leadership in this respect by completing an energy retrofit to core
buildings and by working with public and private partners to push the boundaries of economically feasible greener building in Manitoba even
further than we already have.
Financing sustainability initiatives: The University continues to seek out financial resources and tools to enable substantive energy and GHG
emission reduction measures in its core buildings. Solutions to this challenge are being explored during the strategic planning process.
Water use tracking: Considerable and unpredictable variance in year-over-year water use data limits the University’s ability to accurately report
on water use performance. Quarterly bills spanning over two reporting years alongside regularly estimated water bills appear to be the cause of
this challenge. The CSO is working to ensure increased internal monitoring of water use as a first step in remedying this situation.
Waste Tracking: In FY2010, the University lost its capacity to monitor total waste to landfill, as its waste hauling contractor is no longer able to
provide the University with the weights of the waste it collects from campus. Over the past five years, weights provided by our waste contractor
have had very large margins of error and have varied wildly year over year with little explanation to account for significant reductions and
increases in waste production other than poor data reporting/tracking. In this sense, this loss of solid waste-related data may be a truer
representation of the accuracy of our solid waste knowledge than what has been reported in previous years. This difficulty related to data
continues to present challenges and the University continues to search for solutions.
Procurement Tracking: While the University continues to recognize the importance of monitoring the mass, volume, and composition of the
items purchased for campus use, current procurement indicators remain impossible to monitor and track. Through its sustainability strategic
planning process, the University will seek to improve its ability to track procurement performance through a combination of indicator review and
tracking capacity development.
Transportation Tracking/Impact: As with procurement, current transportation indicators related to commuting habits remain impossible to
monitor and track. The strategic planning process presents the University with the opportunity to review indicators and to set transportation
targets and action plans that reflect the University’s real sphere of influence on commuting and business travel habits.

35
12 Conclusion – campus sustainability, campus growth & the bigger picture The University of Winnipeg’s core campus was initially built for a campus population approximately 66% smaller than its current enrolment and
staff complement represents. This situation, along with the ongoing interest in attracting increasing numbers of students, contextualizes
UWinnipeg campus expansion. This expansion can serve to rectify existing space restrictions and prepare UWinnipeg for future increases in
enrolment. It can also help to revitalize and increase the density of Winnipeg’s downtown.
Global energy and resource trends suggest the need to meet these goals by pursuing development strategies that respond to limited global
supplies of natural resources and to global excesses of carbon emissions.
In January 2011, BP Oil published BP Energy Outlook 2030: 60 years Statistical Review.3 According to its estimates, flattening population growth
and energy demand in OECD countries, along with increasing populations, standards of living, and energy demands in non OECD countries, will
cause global energy demand to continue to increase through to 2030.
According to BP’s survey of available energy sources, this increase in demand will imply an increase in energy-related GHG emissions that far
exceeds 350 ppm of CO2e in the atmosphere – the level that is considered to be safe. Even the most aggressive climate change policies (which
few countries are succeeding in successfully implementing) fail to deliver greenhouse gas emission reductions that approach these levels (see
chart below).
This global challenge is characterized by a flattening OECD energy demand caused by improved efficiency and continued physical growth, along
with the pressures of increased populations and standards of living elsewhere. UWinnipeg’s difficulties in reconciling the space demands
represented by its increased population and lifestyle expectations with the pressures that these demands place on its resource consumption are
best understood within this global context.
As an academic institution with the intellectual resources to address the most pressing issues of the day and the mandate to continually improve
its sustainability performance, UWinnipeg is well positioned to address this dynamic tension between continued growth and sustainability both
academically and experientially. The potential this possibility represents in developing a living example of sustainability in action remains a
vision upon which we can all set our sights.
3 BP Oil. BP Energy Outlook 2030: 60 years Statistical Review. London: (available online).

36
BP Energy Forecast GHG projections for 2030 based on projected energy demand (p.66)

37
13 Appendix A – Performance Indicators
GHG & Air Indicators Unit Target FY2006 FY2007 FY2008 FY2009 FY 2010
GHG emissions from electricity
T of CO2e
Diminishing annually to zero.
163.99 203.67 167.09 80.87 33.73
GHG emissions from Natural Gas
T of CO2e
Diminishing annually to zero.
3409.96 3223.88 3187.78 3462.42 3364.91
GHG emissions from Fleet Vehicles
T of CO2e
Diminishing annually to zero.
10.09 14.42 18.22 18.49 21.83
GHG emissions from Business Travel
T of CO2e
Diminishing annually to zero.
336.61 435.93 542.05 309.88 500.40

38
GHG emissions from Waste
T of CO2e
Diminishing annually to zero.
269.42 139.29 218.54 414.68 403.61
Total GHG emissions from all University operations in Tonnes CO2e per annum for all gases and substances reportable under the CSA GHG reporting protocol
T of CO2e
Diminishing annually to zero.
4190 4017 4134 4286 4324
Total square meters of indoor space contaminated with asbestos which has potential to negatively impact human health
m2
Diminishing annually to zero.
0 0 0 See report See report
Total square meters of indoor space contaminated with mold which has potential to negatively impact human health
m2
Diminishing annually to zero.
0 0 0 0 0
Number of air pollution incident reports or complaints received per fiscal year and documented evidence of the action taken to address them
Zero air pollution incident reports or complaints per FY and/or document
Complaints – 15 Complaints – 9 Complaints - 5 NA
number/ text
no data Complaints requiring testing – 7
Complaints requiring testing – 7
Complaints requiring testing - 4
NA

39
ation of steps taken to address them.
Complaints still ongoing – 4
Complaints still ongoing - 3
Complaints still ongoing - 1
NA
Total amount of pesticides (including all types of plant and animal poisons) in grams used indoors each year, divided by the total square meters of interior space; multiply by 1000
g/m2
0 g/1000 m2
No data 45.61 45.19 36.66 37.56
Total amount of pesticides in grams used indoors
g 0 g No data 4185 4200 3709 3912
Total annual quantities of substances discharged to the air which exceed the thresholds listed with the National Pollution Release Inventory (NPRI) as reportable substances
Within NPRI tolerances.
No data 0 0 0 0
Total percentage of indoor space in square meters designated smoke-free
% 100 100 100 100 100 100

40
Total percentage of indoor space in square meters designated scent-free
% 100 0 0 0 0 0
Minutes or reports documenting decisions taken to rehabilitate economic, environmental or human health impacts arising from air pollution if such have occurred
text
Minutes or reports of full rehabilitation if damaging impacts have been incurred.
No occurrences No occurrences. No occurrences. No occurences No occurences
Number and short description of research projects or innovations implemented with the intent of improving air quality in University facilities or programs offered on or off-campus
number; text on file/in report
Non-zero positive number with short description of each.
No data Included in CSO Annual Report
Included in CSO Annual Report
Included in CSO Annual Report
Included in CSO Annual Report
Energy Indicators Unit Target FY2006 FY2007 FY2008 FY2009 FY 2010
Total energy use KwH
Annual reductions
to theoretical minimum.
33,490,941 32,253,322 30,507,144 34,158,051 35,786,939
Total energy cost $ $1,447,027.83 $1,428,889.16 $1,388,785.52 $1,469,416.42 $1,495,579.55
Total energy intensity of operations of facilities
KwH/m2 365 352 328 338 344
Total energy intensity of operations
KwH/m2/CDD
0.067 0.060 0.055 0.060 0.060

41
Total energy intensity of operations
KwH/FCE/CDD
0.204 0.179 0.169 0.180 0.183
Total annual electrical consumption in
KwH 14,347,029 14,118,810 12,501,378 14,702,975 16,864,380
Total annual electrical cost
$ $760,564.50 $770,608.66 $718,719.33 $839,021.19 $1,008,052.14
Energy intensity of electricity for facilities under management
KwH/m2 Derived 156 154 134 145 162
Energy intensity of electricity of facilities under management
KwH/m2/CDD
Derived 0.029 0.026 0.022 0.0260 0.0280
Energy intensity of electricity
KwH/ FCE /CDD
Derived 0.087 0.078 0.069 0.0760 0.0861
Total annual natural gas (KwH equivalent)
KwH equivalent
Annual reductions
to theoretical minimum.
19,102,349 18,107,465 17,872,431 19,377,292 18,831,043
Total annual natural gas cost
$ $686,463.33 $651,473.71 $662,233.43 $622,004.03 $487,527.41
Energy intensity of natural gas of facilities under management
KwH/m2 Derived 208 197 192 192 181
Energy intensity of operations for natural gas of facilities under management
KwH/m2 / CDD
Derived 0.038 0.033 0.032 0.035 0.0313
Energy intensity for natural gas of operations
KwH/FCE/CDD
Derived 0.116 0.100 0.099 0.102 0.0962
Total annual fleet vehicle fuel consumption
KwH equivalent
Replacement of fleet vehicles
with zero emission models
operated on
renewable
41,563 27,047 75,015 76,159 89,891

42
energy sources.
Total annual fleet vehicle fuel consumption cost
$ no data $6,806.79 $7,832.76 $8,391.20 $8214.67
Total estimated annual energy consumption incurred for intra-city transportation of students, staff, administration and faculty
KwH
Annual reductions
to theoretical minimum.
no data no data no data no data no data
Total annual energy consumption incurred for extra-regional transportation of students, staff, faculty and administration which was reimbursed travel by the university
KwH
Annual reductions
to theoretical minimum.
no data no data no data no data no data
Percent of annual energy obtained from renewable energy sources (hydro-electric, wind, solar thermal, solar PV, biomass, tidal, geothermal)
%
Increasing annually to 100%.
42.84% 43.77% 40.98% 43.04% 47.12%
Total annual stationary fuel consumption
KwH equivalent
Annual reductions
to theoretical minimum.
no data no data 58320 1625 1625
Total annual stationary fuel consumption cost
no data no data no data no data no data

43
Water Indicators Unit Target FY2006 FY2007 FY2008 FY2009 FY 2010
Percentage of all water fixtures operating on campus which are water conserving models
%
Increasing annually to 100%.
5% (est.) 10%-15% (est.) 45%
Evidence of conformance with neutralization of toxic, chemically active, or biohazard substances before discharge to waste water stream
text
Periodic verification reports.
On file in Chem / Bio Depts.
On file On File
Annual Total Cost of Water
$
$152,511.44 $176,042.70 $198,374.53
Total annual volume of potable water in liters consumed by the University
L
Report.
80,113,761 74,714,597 64,515,600
Percentage of total annual volume of water for which non-potable sources are acceptable (e.g., toilets, irrigation) supplied from grey water and/or storm water collected annually (in liters) that is reused on-site
%
Increasing annually to 100%.
0% 0% 0%
Total storm water recovered and treated / recycled (in liters)
%
Increasing annually to 100%.
0% 0% 0%
Summary of educational, professional development, and general awareness activities designed to encourage research and increase participation in water conservation
text
Anecdotal reports.
No data No data
On File in CSO - Communications re: Campus Sustainability Recognition Award granted to UW plumber, Lake Friendly

44
activities, practices, and product choices
initiative
Participation in educational, professional development, and general awareness activities that encourage research and increase participation in water conservation activities, practices and product choices
text
Increasing year over
year to practical
maximum. No data No data No data
Annual report of water use management performance
text Tabled
annually. Done Done Done
Post Water Use Management Policy and performance reports to website
text
Policy and reports posted.
Done Done Done
Waste Indicators Unit Target FY2006 FY2007 FY2008 FY2009 FY2010
Waste to landfill
Decreasing annually to theoretical minimum.
150.6 77.8 125.1 221.5
T no data
Annual total weight of materials diverted from landfill and recycled (broken down below)
Increasing annually to theoretical maximum.
83.1 94.4 104.4 121.9
155.81
T
Organic Materials T 0 1.5 11.1 13.5 23.2
Toner Cartridges T 0 0.1 0.04 0.12 0.311
Batteries T 0 0.1 0.04 0.04 0.096
Cardboard & T 30.5 35.1 33.1 45.6 59.1

45
Boxboard
Paper (2010 =confidential paper only)
T 49 51.4 49.4 43.2 15.2
PET drink containers/comingled
T 3.6 6.2 10.8 6.9 57.9
Percent change over previous year‟s waste production
% derived 3.50% -26.32% 60.50% 49.63% no data
Total Waste Generated (trash, recycling, compost, Hazardous Waste & E-Waste)
T
Decreasing annually to theoretical minimum.
233.7 172.2 229.5 343.4 no data
Percentage change over previous year's waste to landfill
% no data -48.34% 60.80% 77.06% no data
Percentage of the total weight (in kilograms) of waste destined for landfill or incineration comprised of recyclables (including organic wastes)
% derived No data 15.80% 14.30% 14% recycling; 32% compost
25% recycling; 41% compost
Annual total weight (in kilograms) of solid and liquid hazardous waste produced by or discharged from University facilities and operations
T of solids Decreasing annually to theoretical minimum.
No data 0.65 T Solids 0.24T Solids 0.3T Solids 0.240
L of liquids 1,000L Liquids 1,241L Liquids 1363 L liquids 650
Change in hazardous wastes produced by the University over previous year
%
derived
No data Not calculable. - 65.6% for solids
+24.5% Solids -20.0% Solids
% + 24.1% for liquids
+9.9% Liquids -52.3% Liquids
Annual total weight (in Kg Increasing No data 0T On campus. 0T On campus. 0T On campus 0T on campus

46
kilograms) of solid and liquid hazardous wastes recycled (either on- or off-campus)
Kg
annually to theoretical maximum.
Unknown off campus.
Unknown off campus.
Unknown off campus
Unknown off campus
Percentage of total annual weight (in kilograms) of solid and liquid hazardous waste recycled
% derived No data No data No data No data no data
Waste to landfill disposal cost
$ $32,400.00 $33,323.93 $34,613.87 $49,273.49 $91,687.72
Recycling collection fees
$ $5,000.00 $5,100.00 $5,000.00 $5,250.00 $5,245.99
Confidential paper shredding service
$ $4,258.06 $7,176.72 $7,445.81 $9,280.60 $11,191.13
Hazardous waste removal fees
$ $6,278.48 $15,000.00 $7,743.26 $4,775.19 $5,627.49
Compost collection fees $ $0.00 $0.00 $0.00 $1,889.84 $4,842.06
Total waste management costs
$ derived $47,936.54 $60,600.65 $54,802.94 $70,469.12 $118,594.39
Summary of educational, professional development, and general awareness activities designed to encourage research and increase participation in waste reduction activities, practices, and product choices
text Anecdotal reports.
No data On file in CSO. On file in CSO. On file in CSO On file in CSO
Participation in educational, professional development, and general awareness activities that encourage research and increase participation in waste
text
Increasing year over year to practical maximum.
No data No data No data No data On file in CSO (Takeout Without)

47
reeducation activities, practices and product choices
Transportation Indicators
Unit Target FY2006 FY2007 FY2008 FY2009 FY 2010
Total annual fossil fuel consumption for University fleet vehicles.
L
Reducing annually to theoretical minimum.
6,111 7,717 7,835 9,248
Total estimated annual fossil fuel consumption incurred from reimbursed air travel by University faculty, students or support staff
km Reducing annually to theoretical minimum.
2,988,800 3,599,160 2,054,975 3,393,691
L 104,608 125,971 71,924 118,785
Total estimated annual fossil fuel consumption incurred from reimbursed automobile travel by University faculty, students or support staff
L
Reducing annually to theoretical minimum.
12,589 22,059 12,879 15,831
Total estimated annual fossil fuel consumption incurred from reimbursed intra-city bus travel by University faculty, students or support staff
km Reducing annually to theoretical minimum.
No data
5,851 631.54 8,956
L 175 19 270
Total estimated annual fossil fuel consumption incurred from reimbursed inter-city bus travel by University faculty, students or
L
Reducing annually to theoretical minimum.
22.1 0 0 0

48
support staff
Total estimated annual fossil fuel consumption incurred from reimbursed rail travel by University faculty, students or support staff
km
Reducing annually to theoretical minimum.
0 190 1111.5 5,042
Total estimated annual fossil fuel consumption incurred from intra-city bus travel from residence to campus and back by students, faculty and support staff
Reducing annually to theoretical minimum.
No data No data No data No data
Total estimated annual fossil fuel consumption incurred automobile travel from residence to campus and back by students, faculty and support staff
Reducing annually to theoretical minimum.
No data No data No data No data
Total estimated annual fossil fuel consumption incurred from carpooling and ride sharing travel from residence to campus and back by students, faculty and support staff
Reducing annually to theoretical minimum.
No data No data No data No data
Percentage of total area of campus property devoted to parking lots, streets and lanes
Constant or reducing over time.
No data No data No data No data
Total annual emission of GHGs incurred from use of fleet vehicles
T CO2e derived 14.4 18.2 18.5 21.8

49
Total annual emission of GHGs incurred from intra-city travel by all modes from residence to campus and back by students, faculty and support staff
derived No data No data No data No data
Total annual emission of GHGs incurred from reimbursed travel by all modes by students, faculty and support staff
T CO2e derived 435.9 542.1 309.88 500.4
Percentage of Transit buses with special access features to accommodate the needs of seniors, children, and the disabled
100% No data No data No data No data
Percentage of transportation-related facilities on campus with access features for seniors, children and disabled
100% No data 100% 100% 100%
Cost of Transit fares as a percentage of annual income for students, faculty, and staff
derived No data No data No data No data
Adequacy of Transit service including air quality in buses and at stops/shelters; seating space per person within buses; scheduling of service; timely scheduling and routing information for Transit users; Transit user satisfaction ratings
Improving annually to practical maximum.
No data No data No data No data

50
Attendance numbers for seminars, information events, and training sessions for students, faculty or support staff that address sustainable transportation literacy
Increasing annually to practical maximum.
No data
Campus Commuter Challenge - Unknown.
Campus Commuter Chalenge - Unknown
Campus Commuter Challenge - Unknown
Workplace Commuter Challenge - 67.
Workplace Commuter Challenge - 57, or 7.5%
Workplace Commuter Challenge - 108, or 13.3%
Walk for Wellness event - 89.
Pre-training-post-training change scores measuring knowledge about and use of sustainable transportation modalities and services by students, faculty and support staff
Positive change values.
No data No data No data No data
Anecdotal reports of information services, equipment, activities or events that promote sustainable transportation on campus
Reports tabled.
On file in CSO. On file in CSO. On file in CSO On file in CSO
Percentage of students, faculty and support staff who regularly walk to campus
Increasing annually to practical maximum.
2005 Wpg Transit Study – CSO Office
2005 Wpg Transit Study – CSO Office
2005 Wpg Transit Study – CSO Office
2005 Wpg Transit Study – CSO Office
Percentage of students, faculty and support staff who regularly cycle to campus
Increasing annually to practical maximum.
2005 Wpg Transit Study – CSO Office
2005 Wpg Transit Study – CSO Office
2005 Wpg Transit Study – CSO Office
2005 Wpg Transit Study – CSO Office

51
Percentage of students, faculty and support staff who regularly use urban mass transit to travel to campus
Increasing annually to practical maximum.
2005 Wpg Transit Study – CSO Office
2005 Wpg Transit Study – CSO Office
2005 Wpg Transit Study – CSO Office
2005 Wpg Transit Study – CSO Office
Percentage of students, faculty and support staff who regularly use carpooling or ridesharing to travel to and from campus for work or classes
Increasing annually to practical maximum.
2005 Wpg Transit Study – CSO Office
2005 Wpg Transit Study – CSO Office
2005 Wpg Transit Study – CSO Office
2005 Wpg Transit Study – CSO Office
Percentage of students, faculty and support staff who regularly drive single occupant vehicles to campus
Decreasing annually to practical minimum.
No data No data No data No data
Participation rates for students, faculty and support staff in Resource Conservation Manitoba‟s Commuter Challenge
Increasing annually to practical maximum.
48 67 57 108
Avoided trips represented by distance-education course delivery, teleconferences, telecourse enrollments, etc.
Increasing annually to practical maximum.
No data No data No data
1953 registrants in distance/tele courses, 696 of whom attended class in person and 1257 of whom attended class remotely
Evidence that such measurement and monitoring system is in place
Documented system.
Not in place. Not in place. Not in place Not it place
Annual report of transportation activities
Tabled annually.
Done Done Done Done
Post Sustainable Transportation Policy and performance reports to website
Policy and reports posted.
Done Done Done Done

52
Land Use & Facilities Indicators
Unit Target FY2006 FY2007 FY2008 FY2009 FY 2010
Annual amount of chemical herbicide applied to University landscapes in liters
L 0 kgs. or 0 liters.
No data 0 L. 0 L. 14 L (Par 3; Roundup)
6.5 L Par 3; 2.5 L Roundup
Annual amount of artificial pesticide used on University landscapes in liters
Kg 0 kgs. or 0 liters.
No data 3.4 kgs. 3.4 kgs. (est.) 0 0
Annual amounts (in kgs., liters, g., etc) of chemicals applied to University landscapes for any purpose (e.g., chemical fertilizers, ice-melt compounds, dust control products, etc.)
Kg
Annual reductions to practical minimum.
No data 3,080 kg 3,600 kg (est.) 3.600 (est.)
(Mtn. Organic Ice Melt)
(Mtn. Organic Ice Melt)
(Mtn. Organic Ice Melt)
17,500 Kg Summit safety salt; 175 lb urea; 90 lb potassium; 8 oz ferrous sulphate
Percentage of landscaping using xeriscaping techniques and materials
%
Increasing annually to 100%.
No data 70% 70% 100% 100%
Annual quantity in liters of fossil fuels consumed by grounds maintenance machinery and vehicles (mowers, snow blowers, sidewalk plows, etc.)
L
Decreasing year over year to practical minimum.
No data 915 L 928 L 225 L 332 L regular fuel, 791 L diesel
Percentage of yard wastes composted
%
Increasing annually to 100%.
0% 100% 100% 100% 100%
Percentage of grounds watering supplied from grey water / storm water recycling compared to use of city treated water
%
Increasing annually to 100%.
No data 0% 0% 0% 0%

53
Percentage of paper products (toilet paper, hand towels, etc.) consumed annually which are composed of 90% or more post-consumer recycled stock
% 100% No data 100% 100% 100% 100%
Percentage of cleaning products defined as all purpose/hard surface, industrial cleaner, toilet bowl cleaner, floor cleaner/degreaser, glass, carpet cleaner, spot and stain remover, which meet the equivalent of, or be certified by, Standard CCD-146, CCD-147 and CCD-148 Environmental Choice
% 100% No data 90% 90% 90%
90% (some products used in kitchens have no Environmental Choice alternatives)
Percentage of cleaning products defined as graffiti remover, drain cleaner and floor stripper for which the following information is disclosed to Property and Plant:
% 100% No data
1% 100% 100% 100%
-Hazardous ingredients present
- Biodegradability of total product
- Percent VOC in product
- pH

54
- Fragrance
- Type of dye
- Oral toxicity of product
- Presence of optical brightener
- Third party certification (if available)
Percentage of cleaning products used annually that contain:
% 0% No data
0% 0% 0% 0%
- Any known or suspected carcinogens/teratogens/mutagens as per IARC, ACGIH
- Endocrine disrupters
- Phosphates
- Substances listed on CEPA toxic substance lists
Percentage of cleaning products used annually the unused portions of which are designated as hazardous wastes (as defined by CEPA or Federal Transportation of Dangerous Goods Act.)
% 0% No data 0% 0% 0% 0%

55
If landscape design and construction has occurred since the last reporting period, documented evidence that xeriscaping / permaculture and organic maintenance regimes have been employed
text
Document as required.
No data Report on file in CSO.
No projects in FY2008.
No projects in FY2009
No projects in FY2010
Documented evidence from RFPs that LEED standards or better have been specified for bidders
%
Document as required.
No data 100% (Provincial Policy)
100% (Provincial Policy.)
100% (Provincial Policy)
100% (Provincial Policy)
Measurement and record systems established and maintained
text
Record system in place.
Under develop-ment
Done Done Done Done
Annual report of land use and property management performance
text Tabled annually.
CSO annual report
CSO annual report
CSO annual report
CSO annual report
CSO annual report
Post Land Use and Property Management Policy and performance reports to website
text
Policy and reports posted.
Done Done Done Done Done
Procurment Indicators Unit Target FY2006 FY2007 FY2008 FY2009 FY 2010
Documentation that each procurement decision involving the purchase of $X or more of a good, material, product or service, has included a needs assessment as well as a demand-reduction plan whenever possible
text
All procurement decisions include a needs analysis and demand reduction
No data - Procurement decisions are normally made by individual departments. Gently-used alternatives are regularly offered as an option to reduce demand,
No data - Procurement decisions are normally made by individual departments. Gently-used alternatives are regularly offered as an option to reduce demand,

56
plan. but most demand reduction is driven by budgetary considerations. Needs assessments are performed as required, on an office-by-office basis.
but most demand reduction is driven by budgetary considerations. Needs assessments are performed as required, on an office-by-office basis.
Percentage of total annual dollar value of equipment purchases for which life-cycle cost analysis was applied
text
Increasing annually to 100%.
No data - Applying formal life cycle costs analysis would require more procedures than the purchasing department currently has time, resources, and training to implement and develop. Purchasing agents do take into consideration long-term costs, both environmental and financial, when making purchasing decisions – buying things that have specific certifications, production location and shipping
No data - Applying formal life cycle costs analysis would require more procedures than the purchasing department currently has time, resources, and training to implement and develop. Purchasing agents do take into consideration long-term costs, both environmental and financial, when making purchasing decisions – buying things that have specific certifications, production location and shipping

57
distances, extensive warranties so that items can b repaired and reused rather than rebought.
distances, extensive warranties so that items can be repaired and reused rather than rebought.
Total number of goods, materials, products or services procured by the University that contain or use toxic or carcinogenic compounds, or the use of which may pose a threat to human health or well-being
text
Decreasing annually to zero.
No data - All purchase orders are kept on file for three years along with all associated documentation, including data sheets and email/snail mail conversations. The end user is informed of any issues relating to toxicity or possible health or environmental risks due to the purchase and use of the product.
No data - All purchase orders are kept on file for three years along with all associated documentation, including data sheets and email/snail mail conversations. The end user is informed of any issues relating to toxicity or possible health or environmental risks due to the purchase and use of the product.
Documentation that when goods, materials, products or services are procured that contain toxic ingredients or components, a thorough review of alternatives was undertaken and included in the procurement decision
text
All toxic product procurement is accompanied by alternative search / review
The University does not buy products that use toxic compounds unless there are no reasonably priced alternatives available. The definition of
The University does not buy products that use toxic compounds unless there are no reasonably priced alternatives available. The definition of

58
reports. reasonably priced is somewhat fluid, but generally hovers around 150% of the less desireable product. In the case of specific equipment required by researchers, there are instances in which no alternatives are available.
reasonably priced is somewhat fluid, but generally hovers around 150% of the less desireable product. In the case of specific equipment required by researchers, there are instances in which no alternatives are available.
Percentage of total annual dollar value of all goods, materials and services procured from local and neighbourhood suppliers
text
Increasing annually to theoretical maximum.
No data - The University does not track how many purchases are locally sourced – again, this sort of tracking would require more resources than currently available. Every effort is made to buy within 100 miles of the City of Winnipeg, then nationally, then internationally. Efforts are also made not to buy products produced overseas.
No data - The University does not track how many purchases are locally sourced – again, this sort of tracking would require more resources than currently available. Every effort is made to buy within 100 miles of the City of Winnipeg, then nationally, then internationally. Efforts are also made not to buy products produced overseas.

59
Percentage of goods, services and materials procured annually that are approved / certified as environmentally friendly / sustainable
text
Year over year increase in %age to practical maximum.
No data - Purchasing agents ensure that they pick the “greenest” products they can and attempt to steer end-users towards the most sustainable choice possible.
No data - Purchasing agents ensure that they pick the “greenest” products they can and attempt to steer end-users towards the most sustainable choice possible.
Percentage of goods, services and materials procured annually that are sourced from certified / approved environmentally friendly suppliers
text
Year over year increase in %age to practical maximum.
No data - Almost all furniture purchases are made from certified environmentally friendly suppliers. All paper is 30% post-consumer recycled and is FSC certified. All services have environmental protection clauses in them that state the work has to be done in the most “green” manner possible. The purchase of recycled or used equipment is encouraged.
No data - Almost all furniture purchases are made from certified environmentally friendly suppliers. All paper is 30% post-consumer recycled and is FSC certified. All services have environmental protection clauses in them that state the work has to be done in the most “green” manner possible. The purchase of recycled or used equipment is encouraged.

60
Total annual weight (in kilograms) of metals and / or metal products procured by the University
text
Decreasing annually to theoretical minimum.
No data No data
Total annual weight (in kilograms) of metals and / or metal products procured by the University from recycled sources
text
Increasing annually to 100% of consumption.
No data No data
Total annual weight (in kilograms) of wood and paper products procured by the University
text
Decreasing annually to theoretical minimum.
No data No data
Total annual weight (in kilograms) of wood and paper products procured by the University from recycled sources
text
Increasing annually to 100% of consumption.
No data No data
Percentage of total number of goods, materials and products that contain recycled material content
text
Positive year over year increase as products become available, approaching 100%.
No data - see above
No data - see above
Total annual embodied energy of the products, materials, goods, and services procured by the University
text
Year over year decrease.
No data No data

61
Summary of educational, professional development, and general awareness activities designed to encourage research and increase participation in green procurement activities, practices, and product choices
text
Anecdotal reports & number (increase to some opti-mum?)
No data
Purchasing Services participates in the Manitoba public sector "Going Green" Working Group. Resources limit the amount of workshops and seminars attended, but Purchasing Services makes all efforts to attend any possible sessions.
Percentage of RFPs, tenders and supplier contracts that included the University‟s green procurement policy
% 100% 100% 100%
Evidence that mass / volume-based measurements are being made of all materials and products procured by the University
text
Mass measurement system in place.
Under development.
Under development.
Annual report of green procurement performance
text Tabled annually.
Done Done
Post Green Procurement Policy and performance reports to website
text
Policy and reports posted.
Done Done

62
14 Appendix B – List of Committee Members & Focus Group Participants Staff
Jodene Baccus (Community Learning) Campus Sustainability Council Len Cann (Physical Plant) Campus Sustainability Council, Materials Conservation Working Group Steve Coppinger (Retired) Campus Sustainability Council Michael Dudley (Institute of Urban Studies) Campus Sustainability Council Michael Emslie (Financial Services) Campus Sustainability Council Laurel Repski (VP-Sustainability.) Campus Sustainability Council Mark Burch (Retired) Campus Sustainability Council Kisti Thomas(CSO) All Lydia Warkentin (UWCRC) Campus Sustainability Council, Materials Conservation Working Group Alana Lajoie-O‟Malley(CSO) All Chris Harwood (Student Housing) Materials Conservation Working Group Karin Krueger (ELP) Sustainable Campus Life Kathleen Legris (Student Services) Sustainable Campus Life Melissa Dupuis (President's Office) Sustainable Campus Life, Focus Group Suzanne Martin (Education) Sustainable Campus Life Cathleen Jeanson (Human Resources) Sustainable Campus Life, Focus Group Cathleen Hjalmarson (Rhetoric, Writing & Communications) Focus Group Sharon Leonard (Marketing & Communications) Focus Group Premal Modha (Student Recruitment) Focus Group
Faculty
Schnitzer, Debbie (English) Campus Sustainability Council Diduck, Alan (Environmental Studies) Campus Sustainability Council, Academic Initiatives Working Group, Focus Group Charleton, Kimberly (Chemistry) Campus Sustainability Council, Academic Initiatives Working Group Bill Buhay (Geography) Materials Conservation Working Group Ernest Prokopchuk (Chemistry) Materials Conservation Working Group Darshani Kumaragamage Academic Initiatives Working Group Don Metz (Education) Academic Initiatives Working Group Danny Blair (Geography) Academic Initiatives Working Group Joanne Boucher (Politics) Focus Group Sandra Tomsons (Philosophy) Focus Group Rod Hanley (Dean of Science) Focus Group

63
Students
William Ring (EcoPIA) Campus Sustainability Council Ava Jerao (UWSA) Campus Sustainability Council Matt Morison Academic Initiatives Working Group Andree Forest Volunteer
Jordan Janisse Volunteer
Avery Artimowich Volunteer Caleigh Christie Volunteer Marlowe Brownlee Focus Group Andrea Globa Focus Group Katie Haig-Anderson Focus Group Ginger Boyer Focus Group Katrina Derbecker Focus Group Christopher Clacio Focus Group Kaeleigh Ayre Focus Group

64
15 Appendix C – Sustainability-Related Research at UWinnipeg Biology German Avila Sakar - Restoration of quarry lands through compost amendment of soil. Scott Forbes - Development of Sustainable Inland Fisheries; Developing Organic Fertilizers from Fishery Waste. Paul Holloway – Natural Products as a Biocontrol Method for Freshwater Fouling. Andy Park – Comparing cumulative growth, stand biomass, and carbon storage among fire-origin and planted stands of Red and Jack pine in Sandilands Provincial Forest, Manitoba; A framework for managed relocation of forest trees in southeast Manitoba. Jacques Tardif – Gap Dynamics in Trembling Aspen Stands, Dendroclimatology of Jack Pine and Tree-Ring Anomalies in Conifers from Manitoba. Richard Westwood - Growth & diversity of Pine/Spruce plantations in Manitoba. Craig Willis - Ecological Energetics of Small, Wild Animals: From Flexibility to Fitness; Artifical Thermal Refugia and White Nose Syndrome. Chemistry Athar Ata - Phytochemical Studies on Medicinally Important Plants (creating natural pharmaceuticals). Charles Wong – Limiting phosphorous and contaminant loading to Lake Winnipeg from the Grindstone Park cottage development by optimizing nutrient sequestration and recycling in a lagoon - wetland wastewater treatment system. Enviromental Studies Alan Diduck – Resource Management and Community Development. Darshani Kumaragamage – Investigating phosphorus release from waterlogged soils in Manitoba to facilitate design standards and operational protocols for drainage systems. Geography Danny Blair – Infrastructure for Wide Market Adoption of PHEV (Plug-in Hybrid Electric Vehicles); Assessment of climate change and variability in Manitoba/Western Interior; Impacts of climate change on transportation in the Western Interior. Bill Buhay – Methane and Nitrous Oxide cycling in the Red River, Manitoba: Implications for a pollution instigated greenhouse gas emissions from an anthropogencially impacted river; Morden's Community Lead Environmental Action on Nutrient Elimination and Removal (CLEANER) in Dead Horse Creek.

65
Jino Distasio – Churchill Sustainability Planning Framework (through the Institute of Urban Studies). Patricia Fitzpatrick - Government and Voluntary Policies for Mining Sustainability: Development, Implementation and Learning in Canada and Brazil; Silos and Systems, Development and Sustainability: Catalytic Forces in Mineral Policy? Other Samantha Arnold (Politics) – Climate Change and Commercial Shipping Developments in the Arctic. SSHRC Aid to Small Universities – Environment, Sustainability and Health. This grant was awarded to the University and had three streams: Urban, Rural and Northern. Approximately 6 faculty were awarded seed grants from here and a number of students were supported. Government of Canada Northern Scientific Training Program – two senior undergraduates participated in this program, working with adjunct faculty member LeeAnn Fishback at the Churchill Northern Studies Centre during the summer on projects that are related to the tundra and boreal forest near Churchill.