Embed Size (px)
Citation preview

UNIVERSITY OF WASHINGTON
UW Profiles User Guide
Note: This user guide covers information about working with the Tableau browser interface. Tableau Desktop information is not included. UW Profiles is accessible from mobile and tablet devices. Some features are not available on these devices.

UW Profiles User Guide
1
Table of Contents
Table of Contents .................................................................................................................................... 1
UW Profiles ............................................................................................................................................ 2
Accessing Using UW Profiles .................................................................................................................. 2
UW Profiles Portal .............................................................................................................................. 2
Permission ........................................................................................................................................... 3
Access From Outside UW’s Network .................................................................................................. 3
Welcome Screen .................................................................................................................................. 4
Dashboards.............................................................................................................................................. 6
Tabs .................................................................................................................................................... 7
Toolbars ............................................................................................................................................ 10
Home ................................................................................................................................................ 10
Alerts ................................................................................................................................................ 10
Global Filters..................................................................................................................................... 11
Favorites ........................................................................................................................................... 11
Printer Friendly Overview ................................................................................................................. 12
Open dashboard in separate window .................................................................................................. 12
Hover ................................................................................................................................................ 12
Filters ................................................................................................................................................ 13
Zoom and Pan ................................................................................................................................... 14
Dashboard Toolbar ............................................................................................................................ 14
Export ............................................................................................................................................... 15
Revert All .......................................................................................................................................... 16
Pause Automatic Updates .................................................................................................................. 16
Resume Automatic Updates ............................................................................................................... 17
Refresh Data ...................................................................................................................................... 17
Sharing .............................................................................................................................................. 17
Remembering Changes (saving your customized views) .................................................................... 18
UW Profiles Data Models for Academic Dashboards ............................................................................. 19
Data Model Page ............................................................................................................................... 19
Data Model Detail Page ..................................................................................................................... 20
Data Model Wiki Page....................................................................................................................... 21
Add to Favorites – Data Model .......................................................................................................... 21
Data Model Download ....................................................................................................................... 22
Help ...................................................................................................................................................... 24

UW Profiles User Guide
2
UW Profiles UW Profiles is a web-based tool that uses visualizations created with Tableau Software. It is designed to provide University decision-makers with a dynamic way to access, explore, and understand University data. UW Profiles makes it easy to search and aggregate data at any level of the organization. These active reports are displayed as a Tableau Dashboard.
Accessing Using UW Profiles
UW Profiles Portal
You can access the UW Profiles portal by going to the following URL: https://uwprofiles.uw.edu/ (copy and paste in your browser). The portal is available to anyone with a UW NetID. You will be prompted to log in with your NetID credentials.
Note: You can also access Academic Dashboards and Research Dashboards through the Business
Intelligence Portal for the University’s Enterprise Data Warehouse. Peer Dashboards are not available in the BI Portal at this time. Copy and paste the following URL in your browser: https://biportal.uw.edu. Click the Visualizations button.

UW Profiles User Guide
3
Permission
To access and interact with UW Profiles Dashboards you will need to have rights to The Enterprise
Data Warehouse (EDW) and the UW Tableau Server.
Enterprise Data Warehouse Access
You can use ASTRA to check your access. 1. Log in to ASTRA using your UW NetID and password on the ASTRA website:
https://ucs.admin.washington.edu/astra/ 2. Click Show me my authorizations:
3. Your access level will be displayed.
4. Look under the application column. You have access to Enterprise Data Warehouse data if you see EDW listed. You can also see what role you have. The view above shows access to the EDW in an Administrator role.
5. If you need to request new or different access to EDW, visit the Request Access page here: http://www.washington.edu/itconnect/work/data/use-data/get-access/request-access/.
Tableau Server
Once you have obtained access to the EDW, access to the Tableau Server will follow within 48 hours.
Browsers
Mozilla Firefox or Google Chrome are the preferred browsers but UW Profiles Portal and Dashboards perform well in any browser.
Access From Outside UW’s Network
If you need to access UW Profiles outside of the UW network, you will need to have NetID access through Virtual Private Network (VPN). Information and instructions on setting up VPN are available here: http://www.washington.edu/itconnect/wares/nebula/connecting-remotely/nebula-vpn-virtual-private-network-service/
UW Profiles User Guide
4
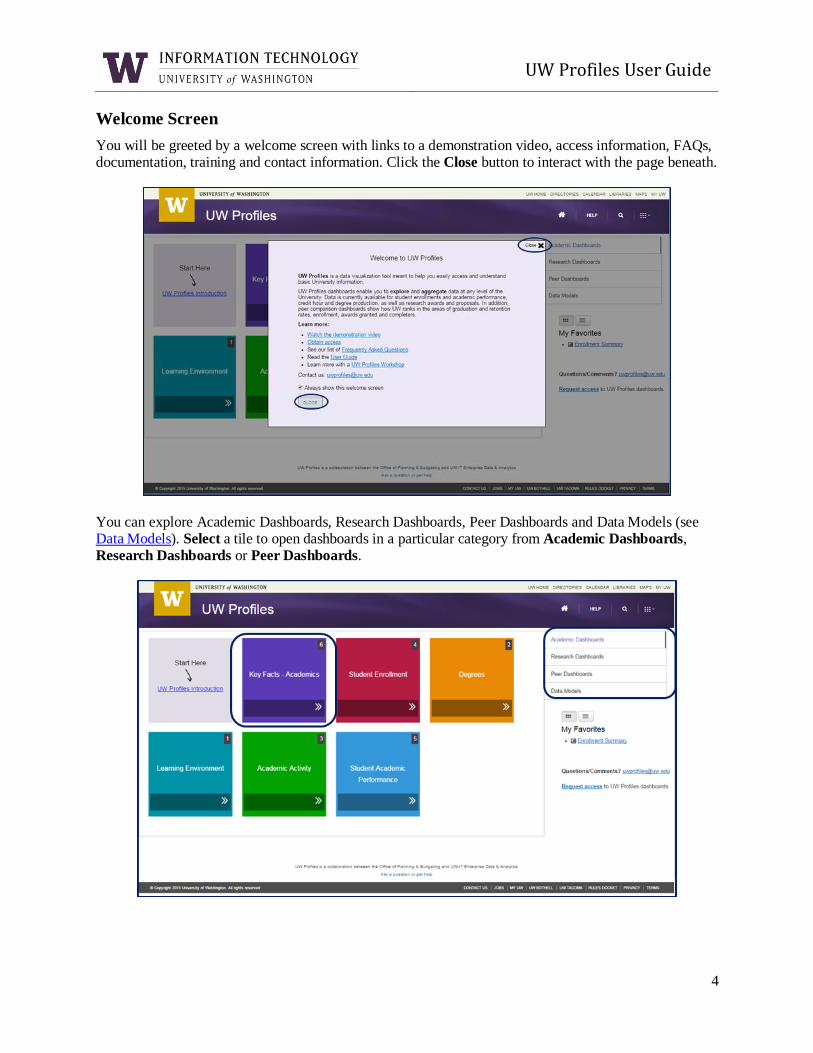
Welcome Screen
You will be greeted by a welcome screen with links to a demonstration video, access information, FAQs, documentation, training and contact information. Click the Close button to interact with the page beneath.
You can explore Academic Dashboards, Research Dashboards, Peer Dashboards and Data Models (see Data Models). Select a tile to open dashboards in a particular category from Academic Dashboards, Research Dashboards or Peer Dashboards.

UW Profiles User Guide
5
Thumbnails of dashboards will be revealed. Click a thumbnail to open the viz details page.
You can also view the dashboards in list view.

UW Profiles User Guide
6
Dashboards
A dashboard is a collection of more than one visualization (viz) or table on a single page. You can compare and modify a variety of data simultaneously among multiple vizzes or tables. The dashboard content consists of two or more vizzes, ranging from area charts, crosstabs, bar charts, geographic maps and others. When you open a dashboard details page, you will see a preview. You will need to click to interact with
the dashboard.
The sample dashboard below displays Tabs, Filters, Legend, Navigation toolbar, Switch to Tables.

UW Profiles User Guide
7
Tabs
Each tab reveals information to help you understand the dashboard in the categories shown below. Note: all screenshots below are from the Enrollment Summary. The contents of the tabs will display information for that particular dashboard.
The Overview tab shows a high-level summary of the dashboard, including what measure we are tracking and what time period we are viewing.
The Interpretation tab shows a graph-by-graph interpretation guide. You can read more about how to customize the dashboard in a number of different ways.

UW Profiles User Guide
8
The Filters tab shows a list and explanation of all the filters used in the dashboard.
The Definitions tab shows definitions relevant to the dashboard.

UW Profiles User Guide
9
Click one of the links to open the definition details page. Details include:
Definition
Synonyms/Abbreviations
Related Topics
Example and Usage
The About tab contains update history and a link to the Data Model(s) used to build
the dashboard. Note: Data Models are only available for Academic Dashboards. See Data Model(s).
Click the View Viz and Data Update History
link to see a screen with updates. When you open Update History, you will see a comprehensive list of the latest updates.

UW Profiles User Guide
10
Toolbars
Home
Click the Home button to return to the UW Profiles main page. You will be returned to the Dashboard page, in the list or the tile view.
Alerts
A colored dot on the Alerts button will be displayed if there are announcements or changes to a dashboard. Click the Alert button to show the alert. Click the Close button to close the alert.
There are different levels of color coded alerts: Blue = Notification Yellow = Warning
Red = Critical Warning The alert background title bar color will change color accordingly and the colored dot on the alert button will disappear once the Alert is read. The Alert content will still be visible after the Alert is read. You can click the button to re-read the contents.

UW Profiles User Guide
11
Global Filters
Global filters allow you to filter data globally, across all Academic Dashboards. Click the Global Filter button to reveal the filter selections. The filter button will be displayed in gold when there is a filter applied. Once you apply any of the filters, they will be active in all of the Academic Dashboards you select in the future.
Note: A filter must exist within the dashboard in order for the global filter selections to be applied. Click the Apply Filter button to activate the filter. Click the Clear Filter button to clear the filter.
Favorites
You can save favorite dashboards by clicking the Favorites button on the Dashboard Details toolbar. A yellow star shows that this dashboard has been chosen as a favorite.

UW Profiles User Guide
12
Printer Friendly Overview
Click the Printer Friendly Overview Button to generate a printer-friendly summary, suitable for a handout
or presentation.
Open dashboard in separate window
Click this button to open the dashboard in a separate window. Note: This option takes you out of the UW Profiles Portal and directly to the UW Tableau Server.
Hover
You can hover your mouse over any mark (chart element) or point in the plot area to see more information. For example, by hovering over the 1998 column below, you can see Student No
Breakdown, Cohort Year and % of Cohort Grad in 1-4 Years.

UW Profiles User Guide
13
You can also hover over navigation buttons to show tooltips. The image below shows a Show More
Values option.
The image below shows a Sorting icon when the mouse is hovered near a breakdown.
Filters
Filters are available for filtering views in a dashboard. By selecting a filter on the left panel, the dashboard will display data based on the filter selection.
Filter by Campus: Filter by Cohort Quarter:

UW Profiles User Guide
14
The dashboard will reflect the choices you made in the filters:
Zoom and Pan
To help you navigate views of maps, a toolbar appears when you mouse over a map in a dashboard. The
toolbar lets you zoom in and out; zoom and center; select a rectangular, radial or lasso area; and return the map to its initial state. You can also pan by using the mouse.
Dashboard Toolbar
The UW Profiles Toolbar contains four buttons: Export, Refresh, Pause/Resume and Revert All.

UW Profiles User Guide
15
Export
You can export a view as an image or PDF. You can also export the data as a crosstab or comma-separated value (.csv). Select an option on the Export menu from the toolbar:
Export Image
When you export an Image, you will see this pop-up window. Click Download to download an image of your view.
Export Data
When you export data, you will see a summary of the data in your view.
Export Crosstab
When you export a Crosstab, you will see this pop-up window. Click Download to generate a .csv file. You can open a .csv file in Microsoft Excel, Access or other application.

UW Profiles User Guide
16
Export PDF
When you export a PDF, you will see this dialog box. Make your selections and then click Export.
Click Download.
Revert All
You can revert any changes you have made, such as filter or sort, and restore the view to how it was originally published.
Pause Automatic Updates
As you interact with the view in your browser, a query is sent to the data source to update the data in the view. If you are working with a dense view containing a lot of data or a very large data source, the automatic update may take a long time. To avoid waiting for the screen to refresh each time you change a selection, you can click Pause Automatic Updates on the toolbar. This allows you to make several
selections without having to wait for the refresh. Note: The dependent filters will not update while pause is selected.

UW Profiles User Guide
17
Resume Automatic Updates
When you are finished making selections and are ready for the view to refresh, click Resume
Automatic Updates using the same toolbar button. You only have to wait for a single query to the data source to retrieve all your changes at once.
Refresh Data
If the data source has changed, the view will reflect those changes the next time you load the page. You may need to manually update the view using the Refresh Data button on the toolbar.
When you refresh the data, you clear any cache that may exist. The latest data from the data source will be refreshed. This option is different than the Pause Automatic Updates option, which may still load the view based on cached data. Depending on the size of your data source and the view, refreshing the data
may take longer than other queries operating on cached data.
Sharing
You can choose to share original views or your customized views with others by clicking the Share button. You can copy and paste a link to add to an email message. Or copy and paste the URL to embed the dashboard in your website or send the link in an email message. Note: The recipient or viewer of these links will need to have the UW NetID permissions mentioned in the
Access section above.

UW Profiles User Guide
18
Remembering Changes (saving your customized views)
You can save any filter or breakdown settings you have made in your dashboard. Click Remember my
changes and then enter a name for your view. Click Remember to save the view. Next time you visit this dashboard, you will find your saved view in the same location.
Name your view and click Remember:
To revert to the original view, click Original View:

UW Profiles User Guide
19
UW Profiles Data Models for Academic Dashboards
You can download the data models used to create the Academic Dashboards.
Important: You will need to have Tableau Desktop Software installed and you will need sufficient ASTRA permissions (see Accessing Using UW Profiles section above). FiscalTech and PayrollCoordinator roles do not have access. Users in this group will need to apply for another role to see student data.
From the home page, click the Data Models tab.
Data Model Page
You can see the data models in tile view or list view by clicking the view buttons.
Tile View:

UW Profiles User Guide
20
List View
Click a data model tile or a data model link to view the detail page.
Data Model Detail Page
An alert button will be displayed to the right of the data model title if there are announcements or changes to a data model. There are different levels of color coded alerts:
Blue = Notification
Yellow = Warning Red = Critical Warning
Click the Download button to download the data model. Click the Data Model Wiki Page link to read more detailed technical information. Click the Add to Favorites button to add this data model to Favorites.

UW Profiles User Guide
21
Data Model Wiki Page
The wiki page contains detailed information, including Definitions and Source tables. Note: Field Name is the name of the field in the data model and Definition is specific to UW Profiles.
Add to Favorites – Data Model
You can add any of the Data Models to your list of favorites, along with any of the other dashboards you may have also added. Your list of favorites will be on the home screen and will have unique icons for dashboards or data models:

UW Profiles User Guide
22
Data Model Download
Use your browser’s download button or dialog box to open or save the data model once you click the blue Download button:
The image below is from Google Chrome:
The data model will open in Tableau Desktop:
Click the Data Source button to view the tables and joins used in the data model.
UW Profiles User Guide
23
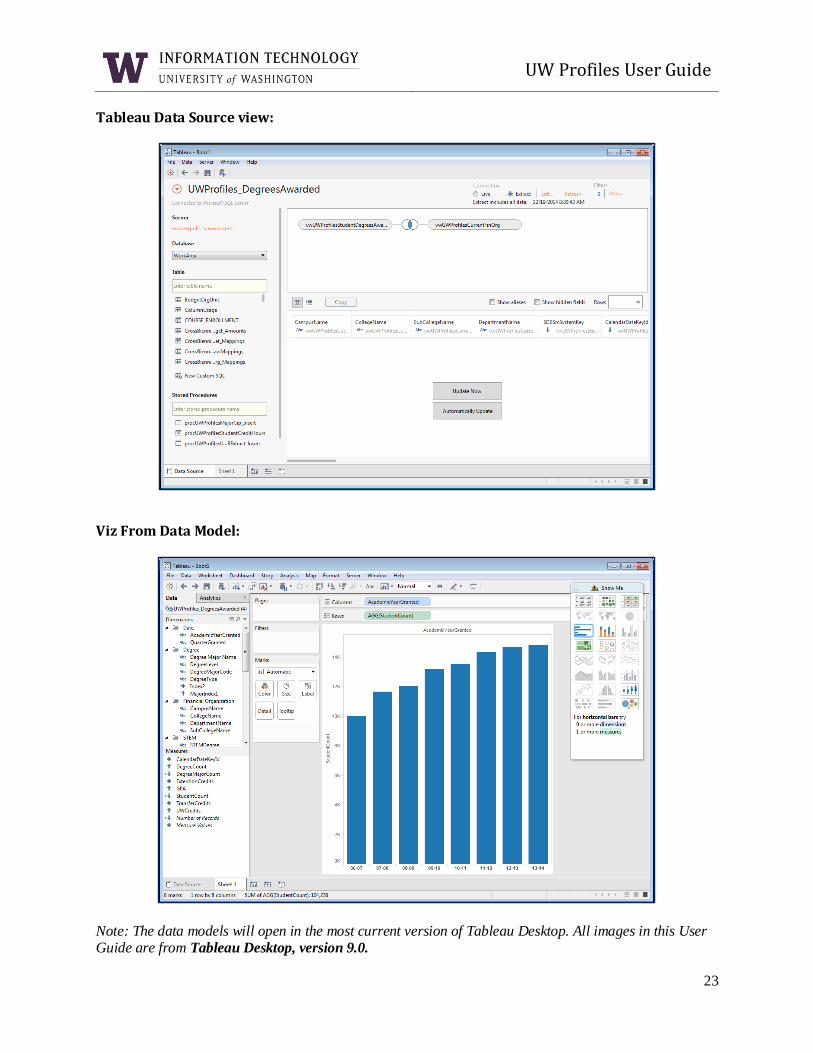
Tableau Data Source view:
Viz From Data Model:
Note: The data models will open in the most current version of Tableau Desktop. All images in this User Guide are from Tableau Desktop, version 9.0.

UW Profiles User Guide
24
Help
You can access Help for UW Profiles from the homepage.