Embed Size (px)
Citation preview
UvA-DARE is a service provided by the library of the University of Amsterdam (http://dare.uva.nl)
UvA-DARE (Digital Academic Repository)
Quantitative analysis of minimal residual disease by PCR in childhood acute lymphoidleukemiade Haas, V.
Link to publication
Citation for published version (APA):de Haas, V. (2001). Quantitative analysis of minimal residual disease by PCR in childhood acute lymphoidleukemia 2001: in eigen beheer
General rightsIt is not permitted to download or to forward/distribute the text or part of it without the consent of the author(s) and/or copyright holder(s),other than for strictly personal, individual use, unless the work is under an open content license (like Creative Commons).
Disclaimer/Complaints regulationsIf you believe that digital publication of certain material infringes any of your rights or (privacy) interests, please let the Library know, statingyour reasons. In case of a legitimate complaint, the Library will make the material inaccessible and/or remove it from the website. Please Askthe Library: http://uba.uva.nl/en/contact, or a letter to: Library of the University of Amsterdam, Secretariat, Singel 425, 1012 WP Amsterdam,The Netherlands. You will be contacted as soon as possible.
Download date: 19 Jun 2018

Chapter r
QUANTIFICATIO NN OF MINIMA L RESIDUAL DISEASE IN CHILDRE N WIT H OLIGOCLONA LL B-PRECURSOR ACUTE LYMPHOBLASTI C LEUKEMI A
INDICATE SS THAT THE CLONES THAT GROW OUT DURING RELAPSE HAVE THEE SLOWEST RATE OF REDUCTION ALREAD Y DURING INDUCTIO N
THERAPY Y
LeukemiaLeukemia 2001,15:134-140
2 2

ChapterChapter 2
Quantificationn of Minima l Residual Disease in children with oligoclonal B-
precursorr Acute Lymphoblastic Leukemia indicates that the clones that grow
outt durin g relapse have the slowest rate of reduction already durin g induction
therapy y
V.. de Haas1'2, O.J.H.M. Verhagen2, A.E.G.Kr. von dem Borne3, W. Kroes4, H. van den Berg'' and C.E. van der Schoot2'3
'Emmaa Kinderziekenhuis Academic Medical Centre, University of Amsterdam; 2Central Laboratory of the
Netherlandss Red Cross Blood Transfusion Service and Laboratory of Experimental and Clinical Immunology,
Academicc Medical Centre, University of Amsterdam; department of Hematology, Academic Medical Centre,
Amsterdam;; 4Department of Cytogenetics, Academic Medical Centre, Amsterdam; The Netherlands
ABSTRAC T T
Antigenn receptor gene rearrangements are applied for the PCR-based minimal residual diseasee (MRD) detection in acute lymphoblastic leukemia (ALL). It is known that ongoing rearrangementss result in subclone formation, and that the relapsing subclone(s) can contain antigenn receptor rearrangements) that differ from the rearrangements found in the major clone(s)) at diagnosis. However, the mechanism leading to this so-called clonal evolution is nott known, particularly at which time point in the disease the relapsing subclone obtains its (relative)) therapy resistance. To obtain insight in clonal evolution, we followed the kinetics off several subclones in three oligoclonal ALL patients during induction therapy. Clone-specificc nested PCR for immunoglobulin heavy chain ilGH) or T-cell receptor 5 (TCRD) genee rearrangements were performed in limiting dilution assays on bone marrow samples takenn at diagnosis, at the end of induction therapy and at possible relapse in three children withh oligoclonal B-precursor ALL. We demonstrated that in all three patients the subclones behavedd differently during induction treatment of the patient. Moreover, in the two patients whoo relapsed, the clones that grew out during relapse showed the slowest regression or evenn evoluated during induction therapy and the clones that were not present at relapse showedd good response to induction therapy.
Thesee results support the hypothesis that at least in some patients already at diagnosiss or in the very first weeks, subclones have important differences in respect to therapyy resistance. Hence, these data give experimental evidence for the need to develop -alreadyy during the first month after diagnosis - quantitative PCR assays for at least two differentt IGH/TCR gene rearrangement targets for every ALL patient.
20 0

DifferentialDifferential therapy resistance of subclones in ALL during induction therapy
INTRODUCTIO N N
Thee junctional regions of rearranged immunoglobulin heavy chains (IGH) and T-cell
receptorr (TCR) genes can be used as patient-specific PCR targets for the detection of
"minimall residual disease" (MRD) in childhood acute lymphoblastic leukemia (ALL) , but
thee major drawback of these targets is their instability.3** 35* 3"46 Therefore, at least two
independentt monoclonal Ig/TCR targets have to be used for MRD-studies to circumvent the
losss of hybridization of clonospecific primers or probes. However, false negative results
causedd by continuing rearrangements have only been described when relapse or impending
relapsee samples are compared to diagnosis samples.3;8;43 So far, no studies have been
performedd to investigate whether oligoclonality already hampers the application of antigen
receptorr PCR-based MRD detection during the initial phases of treatment, whereas the
MRDD levels at these early time points are used especially for MRD-based risk stratification.
TwoTwo hypotheses can be put forward to explain the differential outgrowth of
subcloness at relapse: 1) the presence of leukemic subclones that already differ in their
therapyy resistance at diagnosis; 2) the selection of subclones during continuous
chemotherapy,, possibly by the acquisition of additional genetic event(s) after diagnosis. In
thee latter situation, it should be possible to obtain a reliable estimation of MRD levels at the
endd of induction therapy by testing only a single PCR target. There are several arguments
supportingg this second hypothesis, particularly the fact that there is no direct link between
antigenn receptor rearrangements and the oncogenic process in acute leukemias. A leukemia
cann be considered as monoclonal with regard to the major oncogenic events. Therefore, it
mightt be possible that during the initial treatment phases leukemias are monoclonal with
regardd to their response to therapy. In other words, in a relatively therapy-resistant
leukemia,, all leukemic cells wil l respond slowly to induction therapy, independently on the
antigenn receptor rearrangements present in the cells. Although the presence of distinct
subcloness at diagnosis suggests different biological behaviour of these subclones, this is not
necessarilyy so. We have previously shown that the vast majority (80-85%) of the childhood
ALLL patients showed oligoclonality for IGH and TCRD rearrangements at diagnosis,35'45
butt that this oligoclonality became only visible on Southern blot analysis in patients with a
smallerr fraction of cells in S-phase.45 The differential outgrowth of subclones at relapse
mightt then be explained by mutations acquired later in the disease or it might be the result
off extreme cell reduction. Indeed, we have previously shown that when leukemic cells
obtainedd at diagnosis from patients with oligoclonal B-precursor ALL are injected into
severall SCID mice, different subclones can grow out in different mice.47
Too obtain more insight into the mechanisms of clonal evolution, we monitored the
kineticss of different subclones in oligoclonal ALL patients during induction therapy.
21 1

ChapterChapter 2
MATERIAL SS AND METHOD S
Patient ss and Material s
Thee bone marrow samples from children with B-precursor ALL treated in the Emma Kinderziekenhuis/AMCC were obtained at diagnosis, at the end of induction therapy and at eventuall relapse. All patients were treated according to the BFM strategy-based protocol ALL-88 of the Dutch Childhood Leukemia Study Group (DCLSG).13 Induction therapy includedd prednisolone, vincristine, daunorubicine and asparaginase. Additionally methotrexate,, prednisolone and cytarabine were administered intrathecally (triple therapy). Totall duration of treatment was two years. Immunophenotypic and cytogenetic analysis wass routinely performed at diagnosis or relapse (Table 1). DNA was extracted from cryopreservedd mononuclear cell fractions, isolated by Ficoll - Hypaque density gradient centrifugation,, by means of the QIAamp Blood Kit (Qiagen, Dusseldorf, Germany) as describedd previously.48 For Southern blot analysis DNA was digested with BgliX (Life Technologies,, BRL, Gaithersburg, MD) and hybridized with the H24 JH probe118 and a JS1 probe.499 Three patients were selected on the basis of oligoclonality as assessed by Southern blott analysis (the number of bands exceeded the number of chromosome 14 copies per cell orr clear differences were found in the intensity of the bands, indicative for the existence of subpopulations).. A single monoclonal patient was studied as a control case.
Tablee 1. Immunophenotypic and cytogenetic data of patients
Patientt TdT CD 19 CD 10 clgM Karyotype of leukemic cells
I(J)) + + + - 46,XY,t(x;12)(pll;pl2-13),del(lXq31;q44),
K7;9Xq21;p) )
H(S)) + + + 45,XY,dic(9;20Xpl3;qll)
III(Y )) + + + 47,XY,+21c
IV(Z )) + + + 54,XX,+X,+4,+6,+8,+14,+17,+21,+21
Targe tt identificatio n
Completee IGH rearrangements were amplified with VH-family-specific framework region
onee (FR1) primers (VH1-VH6) as described by Deane and Norton50 with a consensus JH.
primerr (JH21).51 V82D83- and D52D83-rearrangements were amplified with primers VS2-
3/DS2-33 and D83-3 respectively.51 PCR bands on ethidium-bromide stained polyacrylamide
22 2

DifferentialDifferential therapy resistance of subclones in ALL during induction therapy
gelss were excised and eluted in water. After a second round PCR with the same primer
combination,, the PCR product was used as a template in the sequencing reaction using the
BRLL Cycle Sequencing kit (BRL), with one of the PCR primers end labelled with 32P-
gammaa dATP (Amersham, Buckinghamshire, UK). The products were always sequenced
onn both strands to eliminate sequencing artefacts. The number of different rearrangements
wass checked by fingerprinting PCR. This is an analysis of first-round PCR products with 32PP end-labelled consensus JH21 primer (Amersham). By comparing the sequences
obtainedd from different rearrangements it was possible to determine the ongoing
rearrangementt mechanisms responsible for the oligoclonality in each patient.
Quantificatio nn of MRD levels by limitin g dilutio n
Too quantify residual leukemic cells limiting dilution assays were performed with a
heminested-patient-specificc PCR using a consensus primer set FR3/JH21 or a consensus
primersett V52-3 or D82-3 / D83-3 in the first reaction and a clone specific sense primer in
thee second round on two-fold serial diluted DNA samples. Reactions were performed in
mixturess as previously described.51 The input of genomic DNA was 1 ug per reaction. The
PCRR protocol took place in a thermal cycler (Perkin Elmer Cetus Model 9600; Norwik, CT)
andd consisted of 10 min at 95°C followed by 35 cycles of 30 sec at 95°C, 45 sec at 55°C and
finallyy 5 min at 72°C. The second-round of the heminested PCR had an input of 2 ul of
PCRR product from the first PCR reaction. After testing the ASO-primers at various
temperatures,, it turned out that 60°C was the ideal annealing/extension temperature for
mostt of these primers. In preliminary experiments five-fold serial dilutions of DNA
sampless in water were tested in five replicas to investigate at which dilution the PCRs
becamee negative. Subsequently, two-fold serial dilutions in 20 replicates were tested
rangingg from the highest preliminary dilution showing amplification to the lowest
preliminaryy dilution not showing amplification in the five-fold diluted samples. After size
separationn each PCR product was visualized by ethidium bromide staining (Figure 1).
Specificityy was tested by amplification of 1 ug of normal DNA from peripheral blood
mononuclearr cells. Sensitivity was tested by performing PCR on serial dilutions of
leukemicc DNA mixed with DNA isolated from normal mononuclear cells. The number of
cellss at each dilution was verified by amplification of the FcyReceptorlllb gene, present in
eachh cell.52 The ratio of leukemic cells to total bone marrow cells was calculated from the
ratioo of leukemic to Fc-receptor (FCR) targets, considering the presence of one rearranged
IGHIGH allele and two FCR genes per cell. Because both nested PCRs are able to detect a
singlee cell, the number of positive PCR reactions at a certain dilution is distributed
accordingg to a Poisson distribution, and as such quantification of malignant cells is
23 3
ChapterChapter 2
possible.. ' The mean number of targets required to give a positive reaction was
determinedd by the Taswell method.53'54 A computer program, developed at the University
off Tilburg and Maastricht by Leo Strijbosch55 was used to perform the necessary
calculations. .
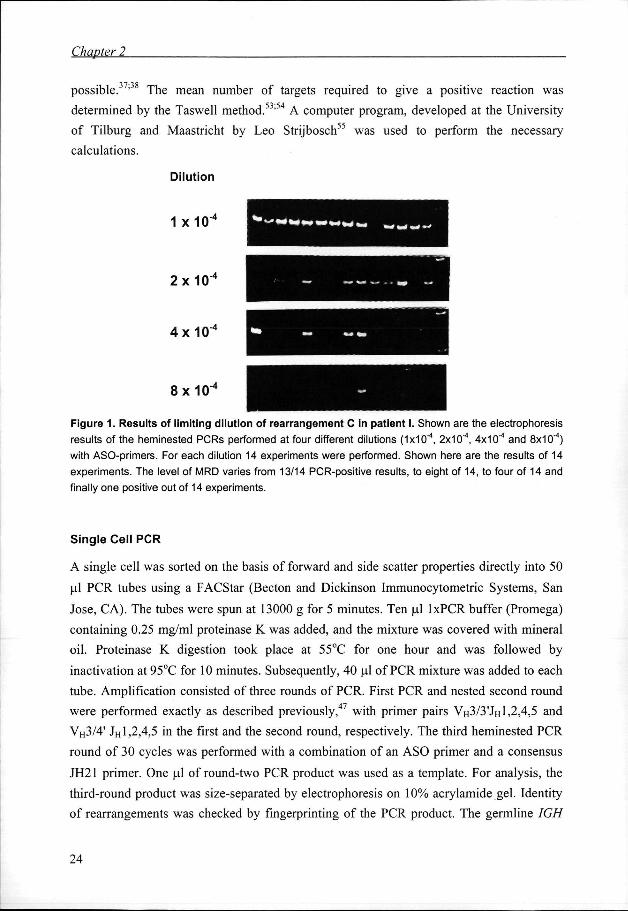
Dilutio n n
11 x 1 0 " *
2X10⁻⁴ 4
4XKT 4 4
8X10⁻⁴ 4
Figur ee 1. Result s of limitin g dilutio n of rearrangemen t C in patien t I. Shown are the electrophoresis
resultss of the heminested PCRs performed at four different dilutions (IxlO"4, 2x10"4, 4x10"4 and 8x10"4)
withh ASO-primers. For each dilution 14 experiments were performed. Shown here are the results of 14
experiments.. The level of MRD varies from 13/14 PCR-positive results, to eight of 14, to four of 14 and
finallyy one positive out of 14 experiments.
Singl ee Cel l PCR
AA single cell was sorted on the basis of forward and side scatter properties directly into 50
ull PCR tubes using a FACStar (Becton and Dickinson Immunocytometric Systems, San
Jose,, CA). The tubes were spun at 13000 g for 5 minutes. Ten ul lxPCR buffer (Promega)
containingg 0.25 mg/ml proteinase K was added, and the mixture was covered with mineral
oil.. Proteinase K digestion took place at 55°C for one hour and was followed by
inactivationn at 95°C for 10 minutes. Subsequently, 40 ul of PCR mixture was added to each
tube.. Amplification consisted of three rounds of PCR. First PCR and nested second round
weree performed exactly as described previously,47 with primer pairs VH3/3'JH 1,2,4,5 and
VH3/4'' JH 1,2,4,5 in the first and the second round, respectively. The third heminested PCR
roundd of 30 cycles was performed with a combination of an ASO primer and a consensus
JH211 primer. One ul of round-two PCR product was used as a template. For analysis, the
third-roundd product was size-separated by electrophoresis on 10% aerylamide gel. Identity
off rearrangements was checked by fingerprinting of the PCR product. The germline IGH
24 4

DifferentialDifferential therapy resistance of subclones in ALL during induction therapy
rearrangementt was identified by a nested PCR approach with primers located precisely
beforee and after the DHQ52-JH1 junction. In the first round PCR, primer set 5'
TATTGGCACAAGACTCCAGAGTGG and 5' CCGCTATCCCCAGTACAGCAG was
used,, whereas in the second round primer set 5' TGGCTGAGCTGAGAACCACTG and 5'
CCACGGTGAGTCAGCCCTGAGG was used.
RESULTS S
Casee I
Patientt I presented with a common ALL at the age of 14 months and experienced a relapse
111 months after initiation of therapy. Southern blot analysis with a H24 JH probe showed
threee rearrangements in Bglll digests at diagnosis. These three rearrangements had different
intensities:: one major and two minor rearrangements. At relapse the major IGH
rearrangementt was still present as a major band (Table 2). The minor rearrangements were
nott detected anymore, and a new rearrangement with the same intensity as the major
rearrangementt was now seen. With the J51 probe only a germline configuration was found
att diagnosis and at relapse.
PCRR at diagnosis and at relapse. In this patient five different VH-D-JH joinings were detected
byy PCR analysis at diagnosis. At relapse only two rearrangements, I-C and I-A2, were
detected.. Rearrangement I-A2 seemed to be a major clone at relapse by FR3-PCR, while
thiss clone was initially not identified on diagnosis material. The other rearrangements
presentt at diagnosis, I-Al , B and D, were not detectable in the relapse sample (Table 2).
Sequencee analysis revealed that rearrangements I-Al and I-A2 had identical DLR4-JH2
joiningss and were the result of VH replacements. Rearrangements I-B, C and D were
unrelatedd to these rearrangements (Table 3). Single cell analysis was performed to
investigatee which of these sequences represented the two alleles of a cell. Bone marrow
cellss obtained at diagnosis were sorted to obtain one cell per tube, and VH-D-JH
rearrangementss were amplified. A total of 67 tubes with FACS-sorted single cells from the
samplee at diagnosis were analyzed. At least one positive result in one of the junctional
regionn PCRs was obtained in 66 tubes. In 58 tubes, rearrangement I-C was amplified. In 46
off 66 experiments one of the other rearrangements was found (rearrangement I-Al , 13/46; I-
A2,4/46;; I-B, 11/46; I-D,13/46; and unknown or new, related sequences in 5/46 cases). In
122 of 66 experiments a combination of rearrangement I-C with a germline IGH gene was
identified.. From these results we conclude that most likely in the leukemic cells I-C
originatess from one allele, whereas I-Al , I-A2, I-B and I-D are derived from the other
allele,, which was in some of the leukemic cells still in germline configuration.
25 5

ChapterChapter 2
Tablee 2.
Patient t
1 1
II I
III I
IV V
Result ss of Souther n Blo t and PCR analysi s
Southernn Blot analysts3
Diagnosis s
IGH: : r V G R 3 3
IGH: : R1R2R3R4 4
IGH: : R1R¥r4g g
IGH: : R1R2 2
TCRD: : R1R2 2
Relapse e
GR3R4 4
R2RSR6 6
R1R2 2
R1R2 2
Subclone e
I-A1 1 I-A2 2 l-B B l-C C l-D D
II-A A II-B1 1 II-B2 2 II-B3 3 II-B4 4
III-A1 1 III-A2 2 lll-B B III-C1 1 III-C2 2 III-D1 1 III-D2 2
IV-A A IV-B B IV-VD D IV-DD D
PCRR analvsis"
Diagnosis s
+c c
+ + + + + + + +
+ + + + + + + + + +
+ + + + + + + + --+ + --+ + + + + + + +
Relapse e _c c
+ + . . + + --
m m
+ + --+ + + + + + + +
+ + + + + + + +
aa H24 JH and J81 probes were hybridized to fig/ll digested DNA. R=relatively major clone, irrelatively minorr clone, G=germline;b PCR analysis was performed on undiluted DNA with consensus primers for IGHIGH rearrangements (FR1 and FR3 in combination with JH21) and with consensus primers for TCRD rearrangementss (V52-3 and D62-3 in combination with D63); 0 ' + '' = present;'-' = not detected after size separation on ethidium bromide stained acrylamide gels.
Quantificationn of subclones. These results indicated that I-C was the major clonal
rearrangementt at diagnosis, present in about 79% of the cells (Table 4). This result was in
agreementt with the results of the single cell analysis, which indicated that this
rearrangementt was present as a stable rearrangement in probably all leukemic cells. At
diagnosis,, this rearrangement was in the majority of leukemic cells present in combination
withh rearrangement I-Al or I-B and in only small numbers of cells in combination with
rearrangementss I-A2 and I-D (3.9% and 1.4% of the mononuclear cells in the bone marrow,
respectively).. At the end of induction therapy the level of MRD, as measured by the
quantificationn of the stable rearrangement I-C, was about 1.3%. The relative reduction of
thee different rearrangements varied greatly. In contrast to the diagnosis sample, in which
theyy were presenting as a minor clone, the leukemic cells carrying rearrangement I-C
combinedd with I-A2 were found to be a relatively major clone at the end of induction
therapy,, with a concentration of 1.6%. Also in the relapse sample, almost all leukemic cells
26 6

DeferentialDeferential therapy resistance of subclones in ALL during induction therapy
belongedd to the clone carrying I-C and I-A2, whereas rearrangements I-Al , I-D and I-B
weree not or hardly detectable.
Casee II
Patientt II was diagnosed with common ALL at the age of 2.5 yrs, and after a follow-up periodd of 70 months he is still in continuous complete remission. Southern analysis with the H244 JH probe on the sample taken at diagnosis revealed four rearrangements of equal intensityy in Bgtil digests (Table 2).
Tablee 3. Sequenc e analysi s of the variou s clone s
Patientt Rearrangemen t Sequenc e 11 WÏÏ V„ 4 w CATCGGACCGGAC GCGTCCCCCT m DLR4 ™ - " J«2
I-A22 V « 4 W GCGTCCCCCT *»DLR4(<I-(-2,JH2 l-BB V H ^ T A C G G G G G G G ^ J M B C l-CC VM3 m GGGTCCCGGG ** OLR1 (-14) TAGT m JH48 1-00 VH5mCAACCCATAGGG mJH3b
III IW V^ <- ,»GTCCCCTGTHIDLR2H>TTTCTTCMGGCmJH1 H-B11 VH3mGATTGGCTGAGTG GAGCCCCGAGCCCTGGGCC ** JH3b I1-B22 V H 3 M GATGGCGCTCGA GAGCCCCGAGCCCTGGGCC ™ JH3b H-B33 VM G A T C T G G A G G GAGCCCCGAGCCCTGGGCC ™JH3b II-B44 V„ 4 «"CGCCAGCTTA G CGAGGCCTGGGCC(J| JH3O
IIII III-A1 V H ^ T T T C A T T ' ^ J M » III A22 V ' A C T C T « J M » HII B y MÏ TCT *"** Jt#6b III-C11 VH m GATAGGGGGCCCAAATACCCGCGG C (-,w Dxp3 Hl GAGGGGT«J^ b III-C22 VK
W GATGTGCCTGGGGGGCTTAGGAGATAGGGGGCCCAAATACCCGCGG C H " Dxp3 M l GAGGGGT m J«4b 111-011 VH™CACA A ATGTG ( , a Dxp2 HI>GGAGG<-,) J»6b IN-D22 V H
m G ATGTG <'1*1 Dxp2 ," ) GGAGG w * * b
IVV W,A V „3 m TGGGGA (W)DLR2TCM,JM6b IV-BB VH3 ,T)TACCTAAGGG wDN4<0,GGmJH5b W-VOO V82 m CCCTAGA (-5|D83 IV-DDD P82 ** CACCCCGTGGGT ** 083 . .
Shownn are the nucleotide sequences of VH-D-JH junctional regions and for patient IV V82D53 and D52D633 junctional regions. Related sequences are shown in groups and labeled "A", "B". "C" and "D". Regionss are fractionated into VH-region, N-nucleotides, D-regiont N-nucleotides and ÜH-region. If identified,, the family of each VH-, D-, Jn-region is described. For each region the number of deleted nucleotidess are pointed in ( ' \ inserted N-nucleotides are given.
PCRR analysis at diagnosis. VH-famiry-specific-FRl PCR and consensus FR3 PCR analysis revealedd five rearrangements (II-A, II-B1, II-B2, II-B3 and II-B4)(Table 2). Sequence analysiss showed that rearrangement II-A was the only rearrangement with a DLR2 region andd JH1 region. Rearrangements II-B1, II-B2, II-B3 and II-B4 were related, as they shared identicall JH3 regions and no identifiable D region. All rearrangements were supposed to be derivedd from VH replacements (Table 3).
Quantificationn of subclones. Rearrangement II-A was shown to be the major rearrangement att diagnosis, present in 98% of the cells (Table 4). Rearrangement II-B1 and II-B4 were
27 7

ChapterChapter 2
alsoo present in relatively large clones. The other rearrangements II-B2 and II-B3 appeared att diagnosis in lower percentages. These percentages were in agreement with the assumption,, based on sequence analysis, that rearrangement II-A is present in all cells in combinationn with one of the other related rearrangements II-B. Also in this patient, the rearrangementss had reduced to a different extent at the end of induction. The stable rearrangementt showed a large reduction (of about 260 fold) comparable to rearrangements II-BB 1, II-B3 and II-B4 whereas rearrangement II-B2 was not detectable at the end of inductionn (reduction > 13000 fold).
Tablee 4. Quantificatio n of leukemi c rearrangement s at diagnosis , at the end of induction and at relapse relapse
ASO-Prime r r
11 I-A1 I-A2 2 IB B l-C C l-D D
III ll-A II-B1 1 II-B2 2 II-B3 3 II-B4 4
Mll III-A1 III-C1 1 III-C2 2 III-D1 1 III-D2 2
IVV IV-A IV-B B IV-VD D (V-DD D
% % Incidenc e e at t Diagnosi s s
27 7 3.9 9 24 4 79 9 1.4 4
98 8 78 8 13 3 8.2 2 57 7
186 6 160 0 <0.001 1 47 7 <0.001 1
116 6 130 0 260 0 260 0
96% % Confidenc e e Interva l l
22^ 0 0 3.0-5.7 7 20-35 5 62-117 7 1.1-1.9 9
74-147 7 56-115 5 10-19 9 6.1-12 2 4442 2
126-363 3 122-230 0
36-67 7
88-166 6 102-194 4 203-407 7 203-407 7
% % Incidenc e e att the End of Inductio n n
Therapy y
0.02 2 1.6 6 0.7 7 1.3 3 <0.001 1
0.4 4 0.3 3 <0.001 1 0.07 7 0.1 1
0.05 5 0.5 5 0.1 1 0.3 3 2.3 3
0.6 6 0.3 3 0.6 6 0.9 9
95% % Confidenc e e Interva l l
0.01-0.06 6 1.5-2.8 8 0.6-12 2 0.6-21 1
0.3-0.6 6 0.1-0.2 2
0.04-0.1 1 0.08-0.2 2
0.04-0.1 1 0.4-0.7 7 0.1-0.2 2 0.1-0.5 5 1.4-5.4 4
0.4-0.8 8 0.2-0.4 4 0.5-0.9 9 0.6-1.6 6
% % Incidenc e e at t Relapse e
<0.001* * 215 5 O.001 1 280 0 <0.001 1
<0.001 1 76.5 5 62.5 5 10.1 1 15.4 4
98 8 35 5 122 2 75.6 6
95% % Confidenc e e Interva l l
139-466 6
163-699 9
50-175 5 33-125 5 6.0-20 0 11-36 6
71-164 4 23-62 2 76-328 8 46-164 4
Reductio n n Factor r Diagnosis --Endd Inductio n Therapy y
1350 0 2.4 4 34 4 61 1 >1400 0
230 0 260 0 >13000 0 115 5 570 0
3720 0 320 0 <0.0001 1 156 6 <0.0004 4
205 5 520 0 440 0 285 5
'' <0.001 = below detection level
Twoo fold dilutions of DNA were used as input in hemi-nested PCRs using ASO-primers. All reactions weree performed in 20 replica's. Using Poisson statistics the relative frequency of the different rearrangementss was calculated. The number of cells used as input, was estimated by performing a similarr limiting dilution analysis of all DNA samples using a control PCR reaction amplifying a genomic sequencee present in each cell. 1 itg of DNA as estimated from the A260 extinction was found to be derivedd from 160.000 to 22.400 cells, indicating that not all DNA samples are equally well amplifiable in thee PCR reactions. 95% confidence intervals were determined by the Taswell Method. The reduction factor,, which means the fold reduction achieved during indcution therapy, was calculated by deviding thee relative frequency at diagnosis by the relative frequency at the end of induction.
Casee III
Patientt III was diagnosed with common ALL at the age of 5.4 yrs; he relapsed 19 months afterr diagnosis. Southern analysis with the H24 JH probe at diagnosis revealed two major
28 8
DifferentialDifferential therapy resistance of subclones in ALL during induction therapy
rearrangementss (R\R2) and two minor rearrangements (r3,r4) in Bgl\\ digests. At relapse
threee IGH rearrangements (R2, R5, R6) were seen by Southern blot analysis (Table 2).
PCRR analysis at diagnosis and at relapse. At diagnosis five clonal VH-D-JH rearrangements
weree found (III-A1 , III-A2 , III-B , III-C1 and III-D1). At relapse, two new clonal
rearrangements,, III-C2 and III-D2, were detected and rearrangements III-A 1 and III-B ,
presentt at diagnosis, were not detectable anymore during relapse (Table 2). Sequence
analysiss revealed VH3-JH5b joinings and no D-region in both rearrangements III-A 1 and III -
A2.. Because the junctional region was related (based on deletion of the same two
nucleotidess at 5' JH5b and one identical N-nucleotide) we assume that the rearrangements
weree a result of VH replacement. Rearrangement III-C1, present at diagnosis and III-C2,
onlyy present at relapse had identical DXP3-JH4b joining and seem to be derived from VH
replacementss (Table 3).
Quantificationn of subclones. Due to the large number of subclones in patient III , only five
rearrangementss (III-A1 , CI, C2, Dl and D2) were selected for quantification. Again great
variationn in response to therapy was observed (Table 4). Rearrangement III-A 1 showed the
highestt incidence at diagnosis, but decreased very rapidly in response to therapy and was
nott detectable anymore in the relapse sample. Rearrangement III-C1 and III-D 1 were
presentt in major clones at diagnosis and were reduced at the end of induction therapy to
similarr levels (0.3-0.5%). Surprisingly, the rearrangements III-C2 and III-D2, which both
couldd not be detected at diagnosis, were present at the end of induction therapy, III-D 2 even
att a relatively high level (2.3%). Both rearrangements (III-C2 and III-D2) were also present
inn the leukemic cells at relapse, accompanied by III-C1 and III-D1.
Casee IV
Patientt IV was diagnosed with common ALL at the age of 3.3 yrs and relapsed 6 months
afterr initiation of therapy. Despite a trisomy 14, on Southern blot analysis with the H24 JH
probee only two major bands of equal intensity were seen in Bgtll digests. Thus most likely
thee duplication of chromosome 14 has occurred after IGH rearrangement (Table 2).
PCRR analysis at diagnosis and at relapse. Both VH3-FR1 PCR and consensus FR3 PCR
amplificationamplification of the VH-D-JH rearrangements revealed two rearrangements, IV-A and IV-B,
inn diagnosis and relapse samples. Both rearrangements were not related to each other. By
applyingg V52D63 and D82D53 primers, two rearrangements were detected at the TCRD
level:: one V82D83 rearrangement (IV-VD) and one D52D83 rearrangement (IV-DD)
(Tablee 2). Amplification of the leukemic rearrangements in the bone marrow sample
obtainedd at relapse resulted in the same four rearrangements.
29 9

ChapterChapter 2
Singlee cell analysis. Single cell analysis of VH-D-JH rearrangements at diagnosis was
performed.. At the same time, V52D53 and DÖ2D53 rearrangements of the TCRD gene
weree also amplified by three rounds of heminested PCR. Rearrangements IV-A , IV-B, IV-
VDD and IV-DD were co-amplified in 50 of the 150 tubes tested. From these results we
concludee that probably all rearrangements occur in the same cell, confirming the
monoclonall status of this patient.
Quantificationn of subclones. Statistical analysis of patient IV showed the presence of IGH
rearrangementss IV-A and IV-B in comparable ratio's of 116% and 130%, respectively
TCRDTCRD rearrangements, IV-VD and IV-DD, appeared in higher concentration in comparison
too the IGH rearrangements (260%)(Table 4). At the end of induction therapy, the average
reductionn was for all rearrangements in the same range (200-500). At relapse, all
rearrangementss were detected in similar amounts.
DISCUSSION N
Thee general assumption for MRD detection based on antigen receptor targets is that at least
twoo independent IGHITCR PCR targets have to be used to minimize the risk of false
negativityy due to clonal diversity.*6* 3* 43"46 However, so far no data are available as to
whetherr oligoclonality is already hampering MRD detection during the early treatment
phases.. In the present study we demonstrated that the various subclones at diagnosis in
threee patients strongly differ in their response to induction therapy.
Byy determining precisely the concentration of the various oligoclonal IGH gene
rearrangementss at diagnosis and at the end of induction therapy, we were able to calculate
thee reduction factor of each IGH rearrangement in response to induction therapy. Since
cellularityy of the bone marrow is higher at diagnosis than at the end of induction therapy,
thee reduction rates should be considered as relative values. The equal reduction of all IGH
rearrangementss in the patient without detectable subclones (patient IV) supports the
reliabilityy of these kinetic studies. By detailed analysis of the DNA sequences of the
junctionall regions and in some cases by single cell PCR, we were able to identify which
IGHIGH gene rearrangements were present in the different subclones of the patients. In this
wayy we demonstrated that the various subclones showed strongly different reduction rates,
varyingg from two-fold to more then 13000 fold. Furthermore, it was shown that the
rearrangementss present in the relapsing subclones (I-A2, I-C, III-C1, III-C2 and III-D )
showedd the slowest reduction during induction therapy, whereas the rearrangements that
weree reduced quickly in response to therapy (I-Al , I-D and III-A1 ) were not detectable at
relapse.. These data demonstrate that (at least in oligoclonal ALL ) the relapse-causing
subcloness already show a different biological behaviour at the very beginning of the disease
30 0

DifferentialDifferential therapy resistance of subclones in ALL durine induction therapy
andd are not selected during therapy by ongoing genetic events under chemotherapeutic
pressure.. In this respect it is interesting that in one of the relapsing patients (patient III ) two
rearrangementss (III-C2 and III-D2), present in the relapse sample were not detectable in the
diagnosiss sample but were detected at the end of induction therapy. Presumably, these
rearrangementss were present in small leukemic subclones at diagnosis which were below
thee detection limit. Apparently these subclones were hardly responsive to induction therapy
andd were therefore selected during therapy. Our analyzed data suggest that the increased
riskk of relapse in patients with slow regression of MRD during induction therapy ' ' ' '
iss caused by therapy-resistant leukemic cells already present at diagnosis. This notion is
moree likely than the idea that in these patients, just by the longer persistence of (only
relativelyy therapy-resistant) leukemic cells, an increased risk exists that with time some
leukemicc cells become therapy resistant by the acquisition of additional mutations.
However,, before this conclusion can be drawn, more patients have to be studied. Three
extremelyy oligoclonal patients (all had at least five different IGH rearrangements) were
investigatedd and two patients relapsed during therapy. It has to be studied whether in all
oligoclonall patients and also in patients that relapse off-therapy, the various subclones
behavee differently. We show in the present study that in the absence of a real genetic
markerr for therapy resistance, antigen receptor rearrangements may serve as surrogate
markerss that allow the tracking of cell populations with differential response to therapy.
Ourr results have direct consequences for the strategy of MRD detection. We show
forr the first time that already during induction therapy oligoclonality may hamper the
antigenn receptor-based PCR approach. It further stresses the importance to screen for
oligoclonalityy at diagnosis and to select for stable monoclonal PCR targets. However, this
wil ll not always be possible. If only oligoclonal targets are available, PCRs have to be
developedd that enable the detection of the different subclones. In contrast to the approach in
thee present study one does not have to select for clonospecific primers or probes that detect
thee subclones separately, but preferentially primers or probes have to be designed that
detectt all subclones of a patient simultaneously. As previously described, this might be
achievedd in most cases with oligoclonal IGH gene rearrangements by designing D-N-JH
primerss or probes.8;36;45
Thee findings presented in this paper may also be relevant for monoclonal patients.
Alsoo in these apparently monoclonal patients subclones that are less responsive to therapy
mayy be present at diagnosis, and it might be possible that in these resistant subclones
ongoingg IGH and/or TCR rearrangements already have taken place. In view of our present
resultss and also of the growing evidence that oligoclonal leukemias behave more
aggressively,599 it is tempting to speculate that the factors that promote clonal diversity are
alsoo involved in inducing a more aggressive phenotype. Such a factor might be an active
31 1
ChapterChapter 2
recombinasee machinery that might also lead to instability elsewhere in the genome. In that
casee a small therapy-resistant subclone present at diagnosis or selected during the first
weekss of treatment might not be detected by the clonospecific primers/probes at the end of
inductionn therapy. Therefore, in monoclonal patients different PCR targets also have to be
appliedd to minimize the risk that these small subclones are missed during PCR follow-up.
Inn conclusion, we have shown that in oligoclonal patients leukemic subclones can
occurr that differ in their response to induction therapy. Our results demonstrate that
quantificationn of MRD can be used to better understand clonal evolution of leukemia
duringg treatment. Our findings suggest that in some patients therapy-resistant subclones
emergee already very early during treatment. Given the poor results of patients with relapsed
leukemia,, this might indicate that patients with high levels of MRD at the end of induction
therapyy may already suffer at that moment from very therapy-resistant leukemia and may
nott be cured with current chemotherapy. Furthermore, our results have direct impact for the
optimall strategy for monitoring of MRD in early treatment phases: at the first sampling
time-pointss at least two different antigen receptor PCR targets have to be studied. This
meanss that in a very short time span after diagnosis of B-precursor ALL , it has to be
investigatedd which antigen-receptor targets are oligoclonal, and quantitative PCRs40 have to
bee developed for at least two different Ig/TCR gene rearrangement targets.
A C K N O W L E D G E M E N TS S
Thiss work was supported by the SKK (grant 96.02). We thank Prof, dr J.J.M. van Dongen
andd Prof. Dr. D. Roos for critical reading of the manuscript.
32 2


![BSANanoparticlesforsiRNADelivery:CoatingEffectson ...and immunoblotting techniques were used to evaluate and to identify eluted proteins as described previously [9]. All electrophoretic](https://img.pdfslide.us/doc/110x75/61079537837b0440fe77066e/bsananoparticlesforsirnadeliverycoatingeffectson-and-immunoblotting-techniques.jpg)