Embed Size (px)
Citation preview
UvA-DARE is a service provided by the library of the University of Amsterdam (http://dare.uva.nl)
UvA-DARE (Digital Academic Repository)
Phase contrast MRI in intracranial aneurysms
van Ooij, P.
Link to publication
Citation for published version (APA):van Ooij, P. (2012). Phase contrast MRI in intracranial aneurysms.
General rightsIt is not permitted to download or to forward/distribute the text or part of it without the consent of the author(s) and/or copyright holder(s),other than for strictly personal, individual use, unless the work is under an open content license (like Creative Commons).
Disclaimer/Complaints regulationsIf you believe that digital publication of certain material infringes any of your rights or (privacy) interests, please let the Library know, statingyour reasons. In case of a legitimate complaint, the Library will make the material inaccessible and/or remove it from the website. Please Askthe Library: https://uba.uva.nl/en/contact, or a letter to: Library of the University of Amsterdam, Secretariat, Singel 425, 1012 WP Amsterdam,The Netherlands. You will be contacted as soon as possible.
Download date: 06 Jan 2020

General Introduction
1.1 Intracranial aneurysms
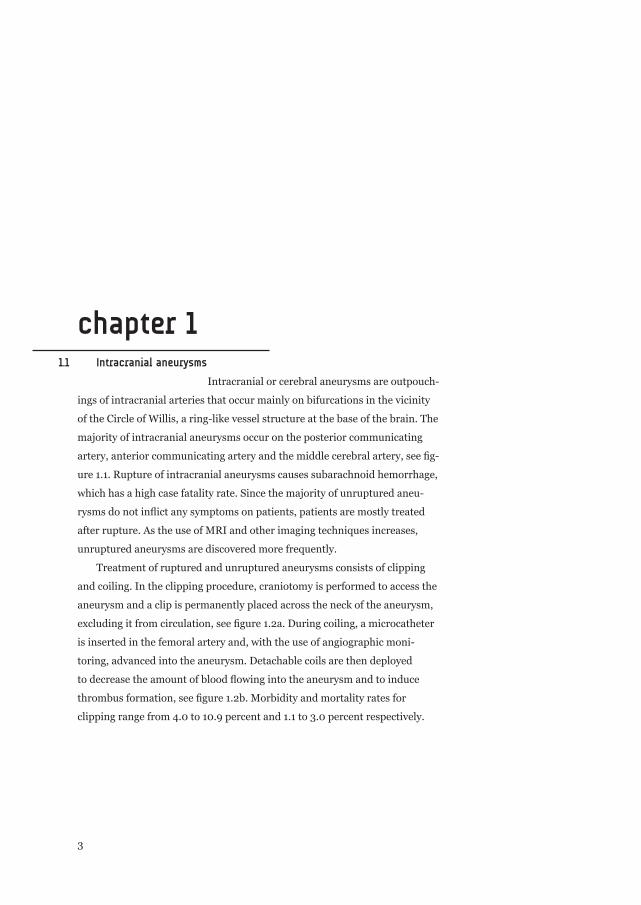
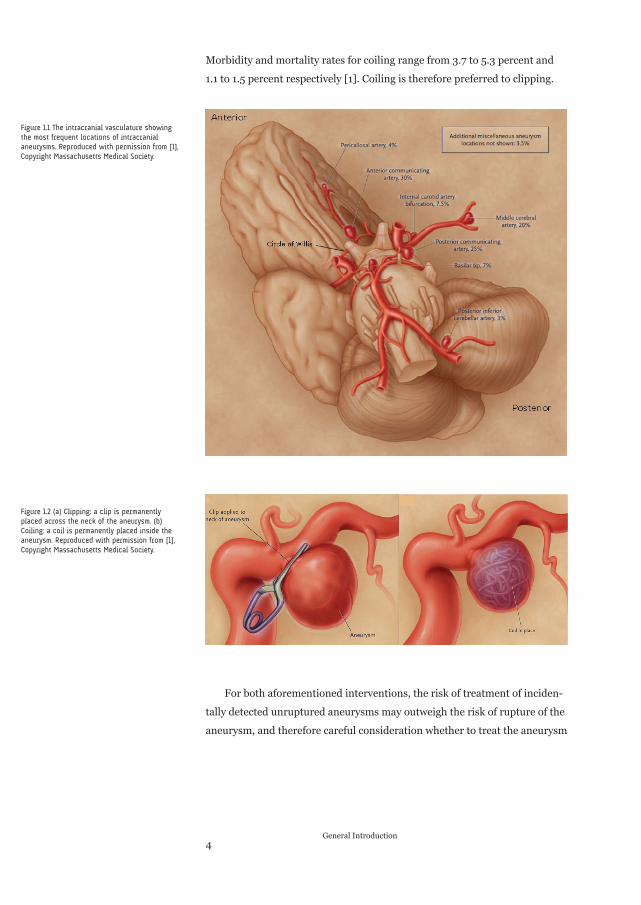
Intracranial or cerebral aneurysms are outpouch-
ings of intracranial arteries that occur mainly on bifurcations in the vicinity
of the Circle of Willis, a ring-like vessel structure at the base of the brain. The
majority of intracranial aneurysms occur on the posterior communicating
artery, anterior communicating artery and the middle cerebral artery, see fi g-
ure 1.1. Rupture of intracranial aneurysms causes subarachnoid hemorrhage,
which has a high case fatality rate. Since the majority of unruptured aneu-
rysms do not infl ict any symptoms on patients, patients are mostly treated
after rupture. As the use of MRI and other imaging techniques increases,
unruptured aneurysms are discovered more frequently.
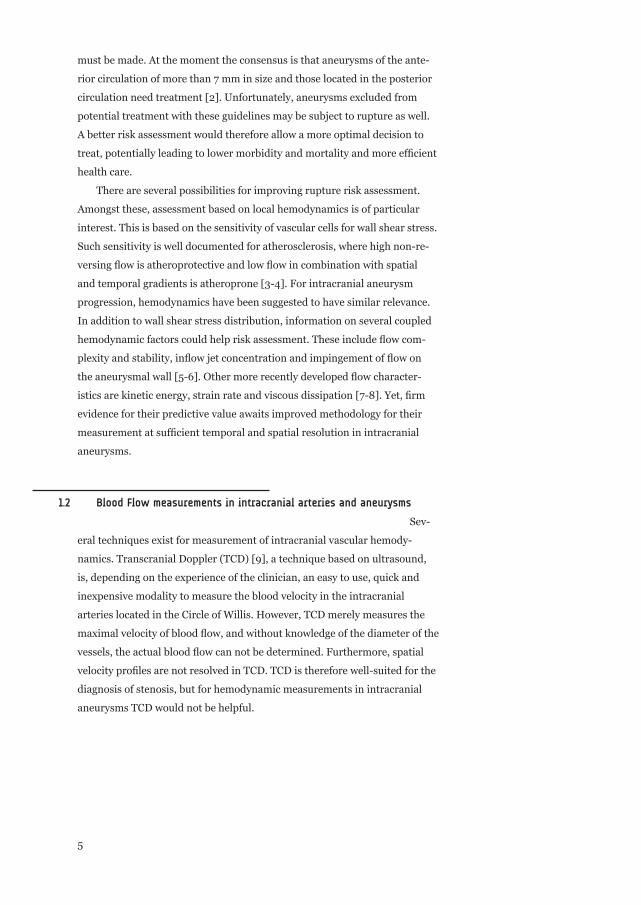
Treatment of ruptured and unruptured aneurysms consists of clipping
and coiling. In the clipping procedure, craniotomy is performed to access the
aneurysm and a clip is permanently placed across the neck of the aneurysm,
excluding it from circulation, see fi gure 1.2a. During coiling, a microcatheter
is inserted in the femoral artery and, with the use of angiographic moni-
toring, advanced into the aneurysm. Detachable coils are then deployed
to decrease the amount of blood fl owing into the aneurysm and to induce
thrombus formation, see fi gure 1.2b. Morbidity and mortality rates for
clipping range from 4.0 to 10.9 percent and 1.1 to 3.0 percent respectively.
chapter 1
3
Morbidity and mortality rates for coiling range from 3.7 to 5.3 percent and
1.1 to 1.5 percent respectively [1]. Coiling is therefore preferred to clipping.
For both aforementioned interventions, the risk of treatment of inciden-
tally detected unruptured aneurysms may outweigh the risk of rupture of the
aneurysm, and therefore careful consideration whether to treat the aneurysm
4General Introduction
Figure 1.1 The intracranial vasculature showing
the most frequent locations of intracranial
aneurysms. Reproduced with permission from [1],
Copyright Massachusetts Medical Society.
Figure 1.2 (a) Clipping: a clip is permanently
placed across the neck of the aneurysm. (b)
Coiling: a coil is permanently placed inside the
aneurysm. Reproduced with permission from [1],
Copyright Massachusetts Medical Society.
must be made. At the moment the consensus is that aneurysms of the ante-
rior circulation of more than 7 mm in size and those located in the posterior
circulation need treatment [2]. Unfortunately, aneurysms excluded from
potential treatment with these guidelines may be subject to rupture as well.
A better risk assessment would therefore allow a more optimal decision to
treat, potentially leading to lower morbidity and mortality and more effi cient
health care.
There are several possibilities for improving rupture risk assessment.
Amongst these, assessment based on local hemodynamics is of particular
interest. This is based on the sensitivity of vascular cells for wall shear stress.
Such sensitivity is well documented for atherosclerosis, where high non-re-
versing fl ow is atheroprotective and low fl ow in combination with spatial
and temporal gradients is atheroprone [3-4]. For intracranial aneurysm
progression, hemodynamics have been suggested to have similar relevance.
In addition to wall shear stress distribution, information on several coupled
hemodynamic factors could help risk assessment. These include fl ow com-
plexity and stability, infl ow jet concentration and impingement of fl ow on
the aneurysmal wall [5-6]. Other more recently developed fl ow character-
istics are kinetic energy, strain rate and viscous dissipation [7-8]. Yet, fi rm
evidence for their predictive value awaits improved methodology for their
measurement at suffi cient temporal and spatial resolution in intracranial
aneurysms.
1.2 Blood Flow measurements in intracranial arteries and aneurysms
Sev-
eral techniques exist for measurement of intracranial vascular hemody-
namics. Transcranial Doppler (TCD) [9], a technique based on ultrasound,
is, depending on the experience of the clinician, an easy to use, quick and
inexpensive modality to measure the blood velocity in the intracranial
arteries located in the Circle of Willis. However, TCD merely measures the
maximal velocity of blood fl ow, and without knowledge of the diameter of the
vessels, the actual blood fl ow can not be determined. Furthermore, spatial
velocity profi les are not resolved in TCD. TCD is therefore well-suited for the
diagnosis of stenosis, but for hemodynamic measurements in intracranial
aneurysms TCD would not be helpful.
5
Another relatively recent developed technique based on ultrasound com-
bining fl ow measurements and imaging of intracranial vessels is transcranial
colour-coded duplex sonography (TCCS) [10]. TCCS allows 2-dimensional
imaging of brain parenchyma and color-coded imaging of the vessels [11].
TCCS is well-suited for detecting intracerebral hemorrhages and vessel
occlusions. However, the technique is not able to resolve three-dimensional
fl ow patterns.
Ultrasound can also be used based on intravascular techniques. A few
studies have applied this in intracranial vessels and aneurysms, using either
fl ow wires [12] or combowires with combined Doppler and pressure sensors
[13] [14]. A drawback of using a Doppler wire is that it, again, merely mea-
sures the maximal velocity of the blood fl ow in vessel fi eld of interest and
that spatial velocity profi les are not resolved. They could however serve to
provide information on fl ow in the entrance and exit vessels.
With magnetic resonance imaging (MRI) it is possible to measure spatial
velocity profi les and quantify blood fl ow in the intracranial arteries and
aneurysms. This thesis will focus on time-resolved three-dimensional phase
contrast MRI (PC-MRI).
1.3 Phase Contrast MRI
Phase contrast MRI is based on the phenomenon
that the velocity of hydrogen nuclei (protons, hereafter called spins) in blood
moving along a magnetic fi eld gradient translates in the phase of the image.
To this end, a velocity-encoding gradient, which comprises two lobes of equal
area and opposite polarity, a so-called bipolar gradient [15], is added to a
gradient echo sequence. Because the net area of the bipolar gradient is zero,
it produces no net phase accumulation for stationary spins [16]. The bipolar
gradient is shown in fi gure 1.3. Since the phase of gradient echo images is
sensitive to B0 inhomogeneities, a second acquisition is performed with an
inverted bipolar gradient (toggling). By subtraction of the two images phase
errors are minimized.
6General Introduction
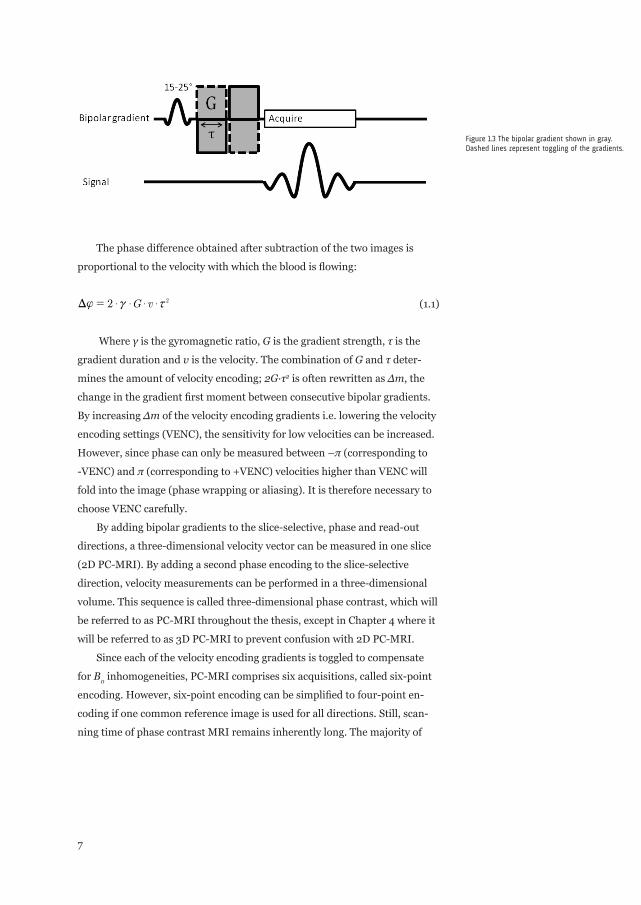
The phase difference obtained after subtraction of the two images is
proportional to the velocity with which the blood is fl owing:
G v2 2$ $ $ ${ c xD = (1.1)
Where γ is the gyromagnetic ratio, G is the gradient strength, τ is the
gradient duration and v is the velocity. The combination of G and τ deter-
mines the amount of velocity encoding; 2G∙τ2 is often rewritten as ∆m, the
change in the gradient fi rst moment between consecutive bipolar gradients.
By increasing ∆m of the velocity encoding gradients i.e. lowering the velocity
encoding settings (VENC), the sensitivity for low velocities can be increased.
However, since phase can only be measured between –π (corresponding to
-VENC) and π (corresponding to +VENC) velocities higher than VENC will
fold into the image (phase wrapping or aliasing). It is therefore necessary to
choose VENC carefully.
By adding bipolar gradients to the slice-selective, phase and read-out
directions, a three-dimensional velocity vector can be measured in one slice
(2D PC-MRI). By adding a second phase encoding to the slice-selective
direction, velocity measurements can be performed in a three-dimensional
volume. This sequence is called three-dimensional phase contrast, which will
be referred to as PC-MRI throughout the thesis, except in Chapter 4 where it
will be referred to as 3D PC-MRI to prevent confusion with 2D PC-MRI.
Since each of the velocity encoding gradients is toggled to compensate
for B0 inhomogeneities, PC-MRI comprises six acquisitions, called six-point
encoding. However, six-point encoding can be simplifi ed to four-point en-
coding if one common reference image is used for all directions. Still, scan-
ning time of phase contrast MRI remains inherently long. The majority of
7
Figure 1.3 The bipolar gradient shown in gray.
Dashed lines represent toggling of the gradients.
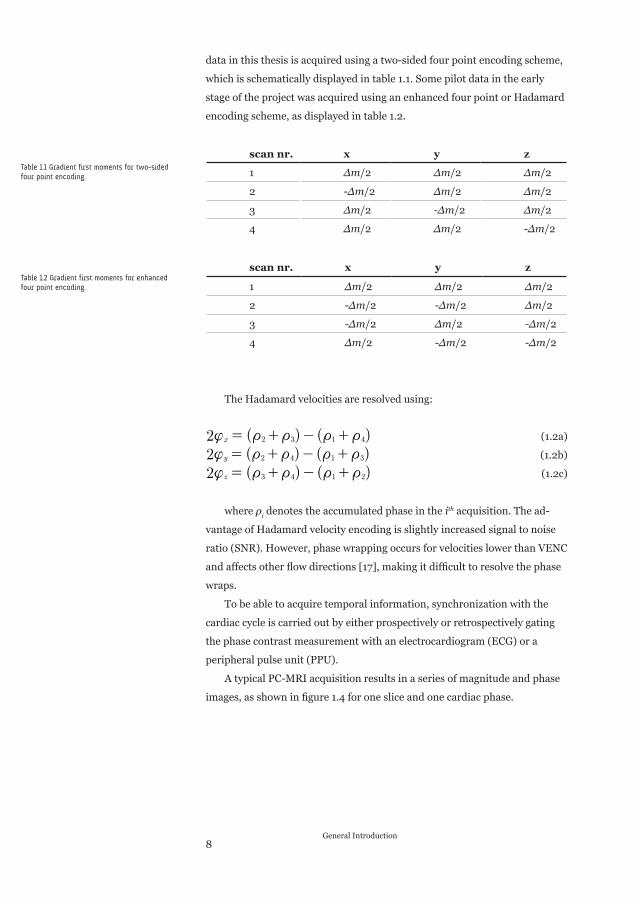
data in this thesis is acquired using a two-sided four point encoding scheme,
which is schematically displayed in table 1.1. Some pilot data in the early
stage of the project was acquired using an enhanced four point or Hadamard
encoding scheme, as displayed in table 1.2.
scan nr. x y z
1 ∆m/2 ∆m/2 ∆m/2
2 -∆m/2 ∆m/2 ∆m/2
3 ∆m/2 -∆m/2 ∆m/2
4 ∆m/2 ∆m/2 -∆m/2
scan nr. x y z
1 ∆m/2 ∆m/2 ∆m/2
2 -∆m/2 -∆m/2 ∆m/2
3 -∆m/2 ∆m/2 -∆m/2
4 ∆m/2 -∆m/2 -∆m/2
The Hadamard velocities are resolved using:
( ) ( )2 x 2 3 1 4{ t t t t= + - + (1.2a)
( ) ( )2 y 2 4 1 3{ t t t t= + - + (1.2b)
( ) ( )2 z 3 4 1 2{ t t t t= + - + (1.2c)
where ρi denotes the accumulated phase in the ith acquisition. The ad-
vantage of Hadamard velocity encoding is slightly increased signal to noise
ratio (SNR). However, phase wrapping occurs for velocities lower than VENC
and affects other fl ow directions [17], making it diffi cult to resolve the phase
wraps.
To be able to acquire temporal information, synchronization with the
cardiac cycle is carried out by either prospectively or retrospectively gating
the phase contrast measurement with an electrocardiogram (ECG) or a
peripheral pulse unit (PPU).
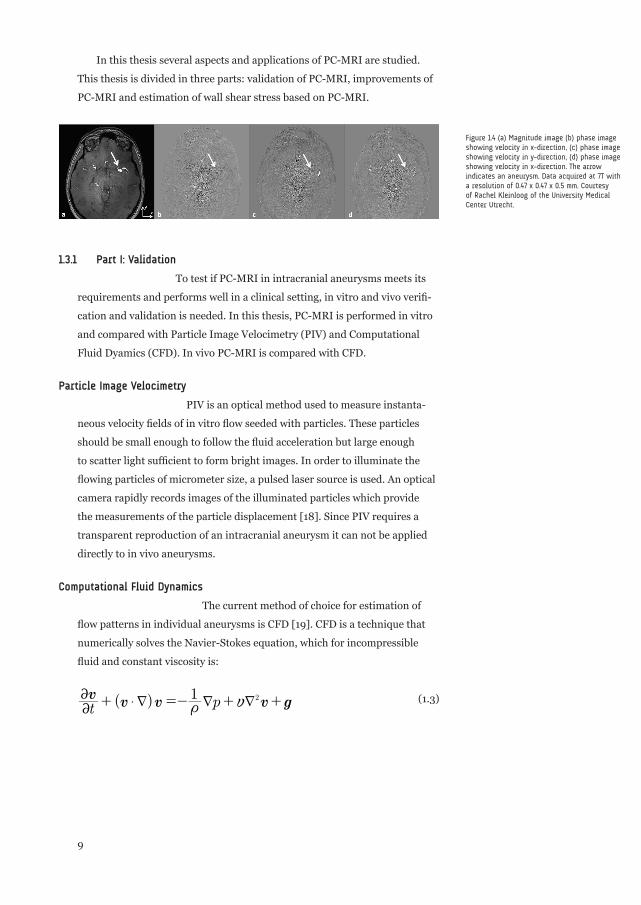
A typical PC-MRI acquisition results in a series of magnitude and phase
images, as shown in fi gure 1.4 for one slice and one cardiac phase.
8General Introduction
Table 1.1 Gradient first moments for two-sided
four point encoding.
Table 1.2 Gradient first moments for enhanced
four point encoding.
In this thesis several aspects and applications of PC-MRI are studied.
This thesis is divided in three parts: validation of PC-MRI, improvements of
PC-MRI and estimation of wall shear stress based on PC-MRI.
1.3.1 Part I: Validation
To test if PC-MRI in intracranial aneurysms meets its
requirements and performs well in a clinical setting, in vitro and vivo verifi -
cation and validation is needed. In this thesis, PC-MRI is performed in vitro
and compared with Particle Image Velocimetry (PIV) and Computational
Fluid Dyamics (CFD). In vivo PC-MRI is compared with CFD.
Particle Image Velocimetry
PIV is an optical method used to measure instanta-
neous velocity fi elds of in vitro fl ow seeded with particles. These particles
should be small enough to follow the fl uid acceleration but large enough
to scatter light suffi cient to form bright images. In order to illuminate the
fl owing particles of micrometer size, a pulsed laser source is used. An optical
camera rapidly records images of the illuminated particles which provide
the measurements of the particle displacement [18]. Since PIV requires a
transparent reproduction of an intracranial aneurysm it can not be applied
directly to in vivo aneurysms.
Computational Fluid Dynamics
The current method of choice for estimation of
fl ow patterns in individual aneurysms is CFD [19]. CFD is a technique that
numerically solves the Navier-Stokes equation, which for incompressible
fl uid and constant viscosity is:
( )t pv
v v v g1 2
$
2
2
t yd d d+ =- + + (1.3)
9
Figure 1.4 (a) Magnitude image (b) phase image
showing velocity in x-direction, (c) phase image
showing velocity in y-direction, (d) phase image
showing velocity in x-direction. The arrow
indicates an aneurysm. Data acquired at 7T with
a resolution of 0.47 x 0.47 x 0.5 mm. Courtesy
of Rachel Kleinloog of the University Medical
Center Utrecht.
where v is the velocity, t is the time, ρ is the density, p is the pressure,
ν is the kinematic viscosity and g represents the gravitational acceleration
constant. To perform such an approach in aneurysms, a few requirements
need to be fulfi lled. First, a patient-specifi c geometry of the aneurysm must
be created. The geometry can be obtained from high resolution imaging data,
e.g. three-dimensional rotational angiography (3D-RA), CT Angiography
or contrast-enhanced magnetic resonance angiography (CE-MRA). Second,
infl ow boundary conditions are needed. In the majority of studies, these are
not personalized but rather based on PC-MRI measurements in slices of
intracranial vessels obtained in a few volunteers without aneurysms. Two
ways of using these data have been described. First, based on these reference
data and using the Womersley solution, fully developed velocity profi les are
created and subsequently scaled by the area of the infl ow vessel to obtain a
mean wall shear stress of 15 dyne/cm2 [5, 7, 20]. Alternatively, uniform ve-
locities on extended infl ow vessels are applied [21-22]. These different infl ow
prescriptions in CFD would result in slightly different outcomes. However, in
either case the non-personalized boundary fl ows may cause deviations from
the true velocity profi les that may well be substantial. Disadvantages of CFD
are that CFD requires mesh generation, which is often strenuous manual
labor, and CFD suffers from long computation times. Another drawback is
the need for assumptions such as rigid walls and non-Newtonian fl uid prop-
erties. An important advantage of CFD is the ability to simulate blood fl ow
patterns at high spatial and temporal resolution. Therefore, CFD could allow
estimation of the hemodynamic factors mentioned above and help unravel-
ing their role in rupture risk.
1.3.2 Part II: Improvements
In PC-MRI different velocity values of fl owing
blood in one voxel are averaged. Therefore, the spatial resolution of PC-MRI
in intracranial aneurysms needs to be as high as possible. Generally in MRI,
increasing spatial resolution lowers SNR and increases scan time. Further-
more, since PC-MRI captures fl ow information over the heart cycle, the
temporal resolution needs to be as high as possible to measure fl ow close to
peak systole.
Our in vivo PC-MRI measurements in intracranial aneurysms are
performed with a resolution of 0.8 x 0.8 x 0.8 mm, measuring 10 cardiac
10General Introduction
phases. Normally such an acquisition would take around 30 minutes, which
would be too long since other imaging sequences are played out as well and
the total scan time is limited to 45 minutes per patient. Therefore, a parallel
imaging (SENSE [23]) acceleration factor of 3 is applied, with the disadvan-
tage of SNR degradation. In this thesis other possibilities to shorten scan
time or acquire images with more SNR are described.
1.3.3 Part III: Wall shear stress
The current consensus in literature is that wall
shear stress, the tangential force that blood exerts on the vessel wall, is an
important marker for aneurysm formation, growth [24] and rupture [25].
As stated above, wall shear stress can be calculated using CFD. Howev-
er, due to aforementioned drawbacks of CFD, alternative wall shear stress
estimation methods can considerably contribute to aneurysm rupture risk
assessment. In this thesis a novel method to calculate wall shear stress is
presented and applied to PC-MRI data measured in an in vitro and in vivo
aneurysm.
1.4 Outline of the thesis
Since PC-MRI is a relatively new technique for
velocity mapping in intracranial aneurysms, extensive validation is needed.
The general aim of this thesis is to validate and optimize PC-MRI. Validation
of PC-MRI is described in Part I, optimization in Part II. Furthermore, the
validation of wall shear stress calculated from PC-MRI data is described in
Part III. In Chapter 2 PC-MRI is applied in a rigid intracranial aneurysm
phantom with a size similar to in vivo aneurysms. These data are then
compared with PIV in the same phantom and with CFD in a geometry of the
phantom. In Chapter 3 a new technique to describe fl ow patterns, based on
multi-scale algorithms, is presented and applied to PC-MRI data. In Chapter
4 a second validation study is described that compared in vivo PC-MRI
in eight intracranial aneurysms with CFD. As previously noted, PC-MRI
suffers from fairly long scan times. Therefore, in Chapter 5, two acceleration
techniques to speed up the PC-MRI sequence are compared. In Chapter 6
the infl uence of higher fi eld strengths on PC-MRI in intracranial aneurysms
is described. A novel method to calculate wall shear stress PC-MRI data is
described and validated in Chapter 7. This method is applied to the aneu-
11
rysm phantom and an in vivo aneurysm; the results are presented in Chapter
8. Finally, the fi ndings of the studies and possible future work are discussed
in Chapter 9.
1.5 References
1 Brisman JL, Song JK, Newell DW. Cerebral aneurysms. New England Jour-
nal of Medicine 2006; 355:928-939.
2 Wiebers DO, Whisnant JP, Huston J, 3rd, Meissner I, Brown RD, Jr.,
Piepgras DG, Forbes GS, Thielen K, Nichols D, O’Fallon WM, Peacock J, Jae-
ger L, Kassell NF, Kongable-Beckman GL, Torner JC. Unruptured intracra-
nial aneurysms: natural history, clinical outcome, and risks of surgical and
endovascular treatment. Lancet 2003; 362:103-110.
3 Reneman RS, Arts T, Hoeks AP. Wall shear stress--an important determi-
nant of endothelial cell function and structure--in the arterial system in vivo.
Discrepancies with theory. Journal of Vascular Research 2006; 43:251-269.
4 Malek AM, Alper SL, Izumo S. Hemodynamic shear stress and its role in ath-
erosclerosis. Journal of the American Medical Association 1999; 282:2035-
2042.
5 Cebral JR, Mut F, Weir J, Putman CM. Association of hemodynamic
characteristics and cerebral aneurysm rupture. AJNR American Journal of
Neuroradiology 2011; 32:264-270.
6 Shojima M, Oshima M, Takagi K, Torii R, Nagata K, Shirouzu I, Morita A,
Kirino T. Role of the bloodstream impacting force and the local pressure
elevation in the rupture of cerebral aneurysms. Stroke 2005; 36:1933-1938.
7 Mut F, Lohner R, Chien A, Tateshima S, Vinuela F, Putman C, Cebral J.
Computational Hemodynamics Framework for the Analysis of Cerebral
Aneurysms. International Journal for Numerical Methods in Biomedical
Engineering 2011; 27:822-839.
12General Introduction

8 Cebral JR, Castro MA, Burgess JE, Pergolizzi RS, Sheridan MJ, Putman CM.
Characterization of cerebral aneurysms for assessing risk of rupture by using
patient-specifi c computational hemodynamics models. AJNR American
Journal of Neuroradiology 2005; 26:2550-2559.
9 Aaslid R, Markwalder TM, Nornes H. Noninvasive transcranial Doppler
ultrasound recording of fl ow velocity in basal cerebral arteries. Journal of
Neurosurgery 1982; 57:769-774.
10 Zipper SG, Stolz E. Clinical application of transcranial colour-coded duplex
sonography – a review. European Journal of Neurology 2002; 9:1-8.
11 Maurer M, Shambal S, Berg D, Woydt M, Hofmann E, Georgiadis D, Lindner
A, Becker G. Differentiation between intracerebral hemorrhage and isch-
emic stroke by transcranial color-coded duplex-sonography. Stroke 1998;
29:2563-2567.
12 Benndorf G, Wellnhofer E, Lanksch W, Felix R. Intraaneurysmal fl ow: evalu-
ation with Doppler guidewires. AJNR Am J Neuroradiol 1996; 17:1333-1337.
13 Ferns SP, Schneiders JJ, Siebes M, van den Berg R, van Bavel ET, Majoie
CB. Intracranial blood-fl ow velocity and pressure measurements using an
intra-arterial dual-sensor guidewire. AJNR American Journal of Neurora-
diology 2010; 31:324-326.
14 Schneiders JJ, Ferns SP, van Ooij P, Siebes M, Nederveen AJ, van den
Berg R, van Lieshout J, Jansen G, Vanbavel E, Majoie CB. Comparison of
Phase-Contrast MR Imaging and Endovascular Sonography for Intracranial
Blood Flow Velocity Measurements. AJNR American Journal of Neurora-
diology 2012.
15 Moran PR. A fl ow velocity zeugmatographic interlace for NMR imaging in
humans. Magnetic Resonance Imaging 1982; 1:197-203.
16 Bernstein MA, King KF, Zhou XJ: Handbook of MRI Pulse Sequences. Else-
vier Academic Press; 2004.
17 Pelc NJ, Bernstein MA, Shimakawa A, Glover GH. Encoding strategies for
three-direction phase-contrast MR imaging of fl ow. Journal of Magnetic
Resonance Imaging 1991; 1:405-413.
13
18 Adrian RJ, Westerweel J: Particle Imaging Velocimetry. Cambridge Univer-
sity Press; 2010.
19 Taylor CA, Hughes TJR, Zarins CK. Finite element modeling of blood fl ow in
arteries. Computer Methods in Applied Mechanics and Engineering 1998;
158:155-196.
20 Cebral JR, Mut F, Weir J, Putman C. Quantitative characterization of the
hemodynamic environment in ruptured and unruptured brain aneurysms.
AJNR American Journal of Neuroradiology 2011; 32:145-151.
21 Boussel L, Rayz V, Martin A, Acevedo-Bolton G, Lawton MT, Higashida R,
Smith WS, Young WL, Saloner D. Phase-contrast magnetic resonance imag-
ing measurements in intracranial aneurysms in vivo of fl ow patterns, velocity
fi elds, and wall shear stress: comparison with computational fl uid dynamics.
Magnetic Resonance in Medicine 2009; 61:409-417.
22 Rayz VL, Boussel L, Acevedo-Bolton G, Martin AJ, Young WL, Lawton MT,
Higashida R, Saloner D. Numerical simulations of fl ow in cerebral aneu-
rysms: comparison of CFD results and in vivo MRI measurements. Journal
of Biomechanical Engineering 2008; 130:051011.
23 Pruessmann KP, Weiger M, Scheidegger MB, Boesiger P. SENSE: sensitivity
encoding for fast MRI. Magnetic Resonance in Medicine 1999; 42:952-962.
24 Boussel L, Rayz V, McCulloch C, Martin A, Acevedo-Bolton G, Lawton M,
Higashida R, Smith WS, Young WL, Saloner D. Aneurysm growth occurs at
region of low wall shear stress: patient-specifi c correlation of hemodynamics
and growth in a longitudinal study. Stroke 2008; 39:2997-3002.
25 Castro MA, Putman CM, Sheridan MJ, Cebral JR. Hemodynamic patterns
of anterior communicating artery aneurysms: a possible association with
rupture. AJNR American Journal of Neuroradiology 2009; 30:297-302.
14General Introduction