Embed Size (px)
Citation preview
UvA-DARE is a service provided by the library of the University of Amsterdam (http://dare.uva.nl)
UvA-DARE (Digital Academic Repository)
Muscle contraction on the molecular level. Actin-myosin interaction studied in an in vitromotility assay
Hamelink, W.
Link to publication
Citation for published version (APA):Hamelink, W. (1999). Muscle contraction on the molecular level. Actin-myosin interaction studied in an in vitromotility assay.
General rightsIt is not permitted to download or to forward/distribute the text or part of it without the consent of the author(s) and/or copyright holder(s),other than for strictly personal, individual use, unless the work is under an open content license (like Creative Commons).
Disclaimer/Complaints regulationsIf you believe that digital publication of certain material infringes any of your rights or (privacy) interests, please let the Library know, statingyour reasons. In case of a legitimate complaint, the Library will make the material inaccessible and/or remove it from the website. Please Askthe Library: https://uba.uva.nl/en/contact, or a letter to: Library of the University of Amsterdam, Secretariat, Singel 425, 1012 WP Amsterdam,The Netherlands. You will be contacted as soon as possible.
Download date: 06 Aug 2020

3
Path reconstruction as a tool for actin filament speed determination in the in vitro motility assay
W. Hamelink, J.G. Zegers, B.W. Treijtel, T. Blangé
Published with minor revisions in Analytical Biochemistry 273, 1999,12-19.
Chapter 3
ABSTRACT
The in vitro motility assay is used to measure speed1 of actin filaments moving
over a glass surface coated with HMM. In this paper a new method, the path
reconstruction method, is presented to evaluate observed speeds. This method is
compared with the commonly used centroid method, in which the centroids of the
filaments are followed from frame to frame. Instead, in the path reconstruction method
speed is evaluated from determination of perimeters of the filaments in each frame and by
reconstruction of the traversed paths of the filaments over a number of frames. In the path
reconstruction method, biases in the determination of speed occurring in the centroid
method due to curvature of paths, video noise and Brownian motion are eliminated,
allowing measurement over a range of frame rates from 5 up till 25 per second. The path
reconstruction method results in a clear separation of motile and non-motile filaments
provided that filaments are analysed over at least 10 successive frames and allows easier
separation of uniform and non-uniform sliding behaviour.
1 In this chapter the word speed is used instead of velocity to emphasise that the measured speed
values are independent of direction.
38
Path reconstruction method
INTRODUCTION
The development of the motility assay by Kron and Spudich enables us to observe
the movement of individual actin filaments labelled with rhodamine-phalloidin over a
coated surface of immobilised myosin or heavy meromyosin [Kron and Spudich, 1986].
This assay allows greater control of the contractile protein composition and chemical
environment than is possible in studies of whole or (demembranated) single fibres.
Motion-generating events within the myosin molecule are believed to drive the actin
filament movement in the in vitro motility assay. This forms the basis for several
hypotheses concerning this molecular transduction process [Uyeda et al, 1991; Harada et
al, 1990; Warshaw et al, 1990; Tawada and Sekimoto, 1991]. Recordings of the moving
actin filaments may yield a very large amount of information about the force-producing
mechanism. Specifically, actin filament speed may be used to estimate the interaction
distance that a single myosin motor molecule induces the actin filament to travel per ATP
hydrolysed [Uyeda et al, 1991; Harada et al, 1990]. Filament speed is assumed to be
analogous to the unloaded shortening velocity measured in muscle fibre [Homsher et al,
1992]. To reveal more about this underlying molecular transduction process it is
important to determine the sliding speed of actin filaments derived from the actin-myosin
interaction. To measure filament speed a number of methods for manual and automated
tracking of filament movement have been devised [Homsher et al, 1996; Sheetz and
Spudich, 1983; Sheetz et al, 1986; Gelles et al, 1988; Marston et al, 1996; Work and
Warshaw, 1992].
In an in vitro motility assay not all detected motion is due to uniform sliding of
actin filaments. Occasionally, filaments halt and resume their movement; a behaviour also
described as hesitations. Buckling is a phenomenon in which smooth sliding of the
filaments is alternated with periods in which one end of the filament (front or back) is
moving somewhat faster than the other end. Also, filaments can (partially) wave due to
not being properly connected to the myosin layer or because of the absence of a myosin
monolayer. Brownian motion of the actin filaments and video system noise tend to
influence the determination of speed. Besides, filaments may cross each other, which
makes an automatic tracking procedure more difficult or even impossible. The
movements of actin filaments mentioned above imply that tracking procedures require
selection criteria for the analysis of actin filaments.
39
Chapter 3
The methodology used to track actin filament motion itself can be a source of
errors.
Nowadays speed is usually determined by tracking the centroids of the projections
of the filaments in successive video frames (from now on we will refer to it as the
'centroid method') [Homsher et al, 1992]. Two difficulties arise with the centroid
method. The first one is an underestimation of the speed when analysing filaments that
follow a curved path [Work and Warshaw, 1992]. In this case their centroid is off the
filament and, depending on the curvature and the total distance travelled with it, centroid
speed will underestimate the filament speed. A second difficulty is that filaments, which
do not slide, still show movement to some extent, due to Brownian motion or video noise.
In absence of ATP, this so called non-motile filament speed is reported to increase with
increasing frame rate and can lead to an overlap of speeds of non-motile and motile
filaments at higher frame rate [Homsher et al, 1992], Non-motile filament speeds also
occur when filaments halt their movement in the presence of ATP.
An error, which can possibly occur during tracking of centroids, is crossover.
Crossover can occur between filaments that are close to each other, when, for path
reconstruction, one centroid is connected to the nearest centroid in the previous frame.
This centroid can belong to another filament causing a 'jump' (crossover) to a
neighbouring filament.
In our lab, an alternative tracking method has been developed, in which perimeters
of filaments are determined from frame to frame. Using these perimeters from successive
frames, the overall path, which the filament has travelled, is reconstructed. We call this
method the 'path reconstruction method'.
In this paper we will compare the centroid method and the path reconstruction
method. We will show that the path reconstruction method will reduce the overestimation
of the non-motile speed and can therefore be used for measuring at higher frame rates.
Furthermore, by using the path reconstruction method, the determination of speed is not
sensitive to curving of filaments. Also, this method makes it easier to deal with crossing
filaments, facilitates the detection of waving and buckling of actin filaments and prevents
crossover during the analysis.
40
Path reconstruction method
MATERIALS AND METHODS
Protein preparations
Myosin and heavy meromyosin (HMM)
Skeletal muscle myosin was prepared according to the method of Margossian and
Lowey [1982]. The M. erector spinae was excised from a New Zealand White rabbit,
male, anaesthetised with Hypnorm (0.32 mg/ml fentanyl citrate and 10 mg/ml fluanisone,
intramuscular; Janssen Pharmaceuticals, Tilburg, The Netherlands). Heavy meromyosin
(HMM) was made according to Kron et al. [1991]. To inhibit TLCK-treated o>
Chymotrypsin, PMSF or Bowman-Birk inhibitor was used.
Myosin was stored at -25°C in 50% 7V glycerol or quickly frozen in liquid
nitrogen and stored at -80°C. HMM was stored at -80°C after quick freezing in liquid
nitrogen. Before use and after every 4 hours ATP-insensitive heads were removed from
an aliquot of HMM as described by Kron et al. [1991]. For this purpose, F-actin was
added to HMM in a 1:5 molar ratio and aliquot was centrifuged with 1 to 2 mM ATP for
10 minutes at 167,000 x g in a Beekman Airfuge at 4°C. See also Slide Preparation.
Actin
Globular actin (G-actin) was prepared from the M. erector spinae from a New
Zealand White rabbit, male, according to the procedure of Pardee and Spudich [1982] and
stored at -80°C after quick freezing in liquid nitrogen. Polymerisation to filamentous actin
(F-actin) was achieved by adding KCl (50mM) and ATP (ImM).
F-actin (2(̂ M) was labelled with 4p.M RhPh (rhodamine-phalloidin) [Kron et ah,
1991] in AB-buffer (see Solutions).
Protein concentrations were measured by absorption spectroscopy or by using a
protein assay (Bio-Rad). The molecular masses and extinction coefficients used to assay
myosin, HMM and actin concentration were 520 kDa and 0.55 cm"1, 260 kDa and 0.60
cm"1, and 42 kDa and 0.62 cm _1respectively.
ATPase activities were measured using the malachite green assay according to
Kodamae/a/. [1986].
Solutions [Kron et al, 1991]
The standard solution is an AB-buffer with pH 7.4, an ionic strength of 50 mM
and pCa 10. The AB-buffer contains 10 mM 3-(N-morpholino)propanesulfonic acid
41
Chapter 3
(MOPS; Sigma Chemical Co., St. Louis, MO), 1 mM EGTA, 2 mM Mg2+, 2 mM Creatine
Phosphate (Boehringer Mannheim, Germany) and 1 or 10 mM DTT. The ionic strength is
adjusted by adding KCl.
AB/ATP-buffer is an AB-buffer with 2 mM MgATP. Before use 35 U/ml Creatine
Kinase (Boehringer Mannheim, Germany) is added to the AB-buffer.
Scavenger solutions were used to minimise photo-oxidation and photo-bleaching.
To achieve this, 3 mg/ml glucose, 10-25 U/ml glucose oxidase (Sigma Chemical Co., St.
Louis, MO) and 200-500 U/ml catalase (Sigma Chemical Co., St. Louis, MO) were added
to AB-buffers containing RhPh-F-actin (see Slide preparation for use of this buffer) and
AB/ATP-buffers.
A computer program based on data of Fabiato and Fabiato [1979] was used to
calculate the composition of the solutions so as to maintain ionic strength.
Slide preparation
Flow cells were constructed from a no.l cover slip (24x40mm), two spacers (each
3x24mm) stuck together with grease and a top cover slip (24x24mm). Cover slips were
coated with a thin layer of nitrocellulose freshly diluted to 1% and used the same day
(Kron et al, 1991). The total chamber volume was typically 100 (il. First, 100-200 ug/ml
of HMM was added for 1 minute, followed by AB with 10 mM bovine serum albumin
(BSA) for 1 minute to block non-specific protein binding. After exposing the chamber to
AB containing 0.02 uM unlabelled F-actin for 1 minute the chamber was washed with
respectively AB containing 2 mM MgATP and two times AB with 10 mM BSA. This
procedure uses unlabelled F-actin to block ATP-insensitive heads on HMM that either
were not removed by centrifugation (see Myosin and Heavy Meromyosin Preparation) or
were formed when HMM binds to the nitrocellulose surface [Kron et al, 1991; Sellers et
al, 1993]. RhPh-F-actin (0.02 uM) in AB-buffer was added and washed with AB
containing the scavenger solutions after 1 minute. Finally, the slide was transferred to the
microscope stage. Adding the AB/ATP solution will induce the movement of the actin
filaments. All measurements have been performed at 22°C.
Recording
Actin filaments were observed through an inverted microscope (Nikon Diaphot
300) equipped with a HglOOW lamp and a Nikon fluorescence filter set (Omega Optical
42
Path reconstruction method
XF37; Xexc. = 546nm, beam splitter 560nm, A,em = 570nm). Actin filaments were imaged
with an intensified CCD camera (Photonic Science Limited Darkstar). The standard PAL
video signal from the camera, together with time/date/title signal (Blaupunkt) was
recorded on an S-VHS video recorder (VCR model GV 470 S VPT Grundig) for off-line
analysis.
Digitisation
To digitise the recorded images the video signal from the video recorder was fed
into the S-VHS input of the standard video device (VINO) of a Silicon Graphics Indy
workstation. Digitisation was controlled by a program (GetXgray), written by one of us
(JGZ), allowing to set sampling parameters such as number of frames to convert, frame
rate (frames/s) and to store data in files for further analysis. This resulted in frames of 768
pixels wide by 576 pixels tall with pixel intensity values ranging from 0 to 255. The
spatial resolution of the recording system was 123 nm/pixel using a 60x objective (Nikon
PlanApo,N.A. = 1.40il).
Analysis
To calculate the speeds of the actin filaments, the output files of GetXgray were
analysed with the program ActinFil. ActinFil was written (JGZ) for use on a Silicon
Graphics Indy workstation running the IRIX 5.3 operating system. The program has an
X-Windows user interface to display the images and to interactively set parameters.
Parameters were threshold, range of frames (length of sequence) to be analysed and
minimum filament size. The program allows to edit the image e.g. to delete pixels and
filaments (to separate crossing filaments or to measure in 'crowded' regions respectively),
and to measure background within a region of interest. Also, the selected range of frames
could be played back as a movie. Frames could either be analysed using the complete
image, or by dragging a rectangular area in the image with the computer mouse, a region
of interest could be selected. Next to the original video frame a black and white image
was shown, reflecting the threshold setting. After setting both the range of frames to be
analysed, the threshold (usually 10-20 pixel intensity values above the maximal
background intensity value measured in the first frame), the minimal filament size
(typically 15 pixels) and the region of interest in which to track filaments, ActinFil would
proceed to analyse the pre-set range of frames frame by frame. The tracking procedure is
43
Chapter 3
described in more detail in Appendix I. In this section an overview of the procedure will
be given.
The main feature of ActinFil is that frame to frame displacement and speed of the
actin filaments are determined during reconstruction of the paths travelled by the actin
filaments. Path reconstruction was accomplished by superposition of successive frames,
revealing the tracks of the filaments. In the first frame each filament was labelled with a
unique number. To completely restore the filament paths, the filaments had to overlap in
successive frames. Additionally, this helped to avoid crossover by searching for an
overlap between already labelled filaments in the overlay image (ImNew) and the not-yet-
labelled filaments in the next frame that had to be superimposed on the overlay image.
When an overlap was found, the filament was added to the existing path by labelling it
with the same number. The perimeter of each filament was calculated in each frame while
creating the contour of the filament and in ImNew after each superposition. With these
perimeters, frame to frame displacements and speed are calculated.
ActinFil also allowed determination of centroid displacement and speed by
following the centroid from frame to frame.
Total tracking procedure takes about 3 to 4 seconds per frame analysed. ActinFil
gives the output of displacement and speed in pixels and pixels per second respectively.
The output file is transferred into a spreadsheet in which these values are turned into SI
units using the known pixelsize (sPiX).
Selection of filaments
The ActinFil program rejects filaments from analysis when no overlap can be
found between adjacent frames and when filaments are smaller than the minimum
filament size given. Crossover to a neighbouring filament during filament tracking, which
can occur when connecting centroids for path reconstruction, is avoided because the
program looks for an overlap area between perimeters of a filament in successive frames
before path reconstruction. See also paragraph Analysis in Material and Methods.
Since the perimeter of a filament is measured in every frame, the value of the
standard deviation (SD) of the perimeter divided by the average perimeter over the frames
analysed, gives information about filaments that show waving and buckling and about
filaments that cross each other. This relative SD of the perimeter will be further denoted
as SD/mean perimeter. In addition, crossing filaments are recognised by the sudden
increase of the perimeter of one filament and from the disappearance of the perimeter of
44

Path reconstruction method
the other filament. Excessive local broadening of reconstructed paths of filaments is an
extra indication that a filament showed waving and that one part of the filament was not
attached to the surface. Filaments showing one of these kinds of non-uniform sliding,
hesitations included, have been separated from the uniformly sliding filaments. Only
uniformly sliding filaments have been used for further analysis.
RESULTS
Centroid method versus path reconstruction method
To compare the accuracy of the computer-assisted tracking by centroid method
with the path reconstruction method, we analysed the same data with both methods.
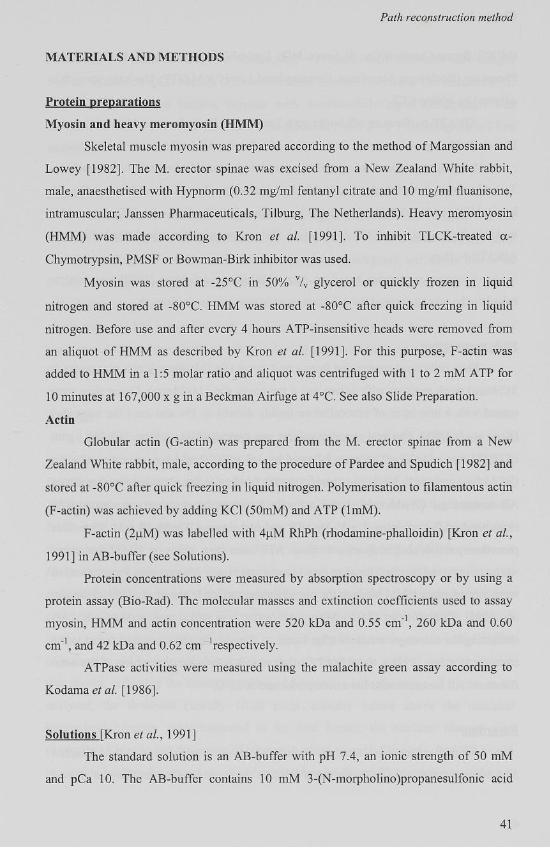
Figure 3.1 shows a speed distribution of actin filaments sliding over HMM on a coated
glass surface analysed using both the centroid method and the path reconstruction
method. The data is analysed at 5 frames/s. For each method the distribution clearly
consists of two populations of speeds, of which the populations with lower speeds
correspond to the non-motile filaments in the data set. To estimate average speed of the
two populations individually, the separation between non-motile and motile filaments was
set at 1.5 nm/s, the minimum in figure 3.1. The average speeds obtained in this way with
both methods are listed in table 3.1.
150
100
Wmrr^ 0 10 20 30 40 50 60 70 80 90
SD/m ean perim eter (%)
v ( | i m / s )
Figure 3.1. Speed histogram of actin filaments sliding over HMM on a coated
glass surface, analysed with the path reconstruction method (*) and with the
centroid method (o). The data set, resulting from at least 5 areas of each of the 3
assays used, was analysed at 5 frames/s using both methods.
45

Chapter 3
The inset in figure 3.1 shows the SD/mean perimeter distribution of this data set.
For further explanation of SD/mean perimeter, see the paragraph Selection of filaments in
Materials and Methods. A detailed survey of speed distributions using the speed values in
different categories of this SD/mean perimeter values has learned that there is no effect on
the shape of the speed distributions for speed values with SD/mean perimeter values
between 0 and 40%. Filament speeds with an SD/mean perimeter value over 40%
contribute to a total speed distribution, which is broadened, and show a less clear
minimum between non-motile and motile filament speeds. Detailed observations of
filaments with SD/mean >40% learned that these filaments indeed showed buckling or
waving or crossed each other. A selection criterion of an SD/mean perimeter smaller than
40% prevents biases of the speeds due to buckling and waving and rejects crossing
filaments from further analysis.
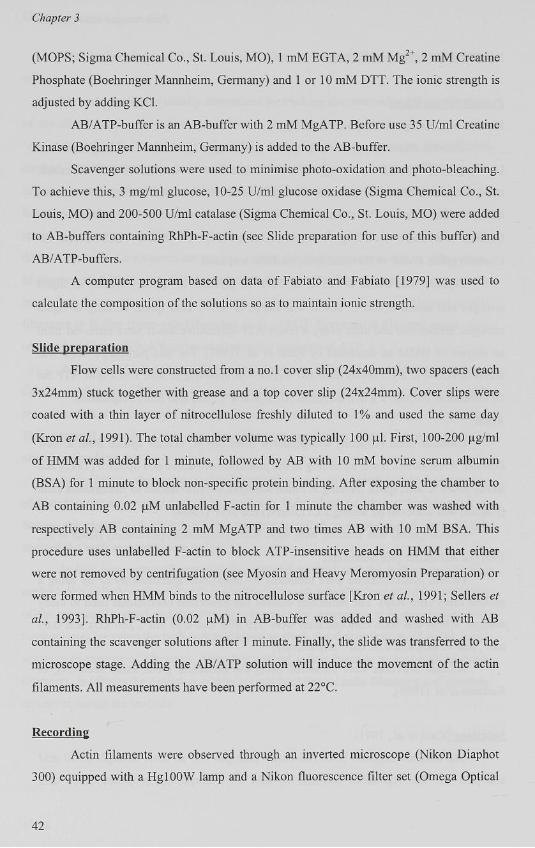
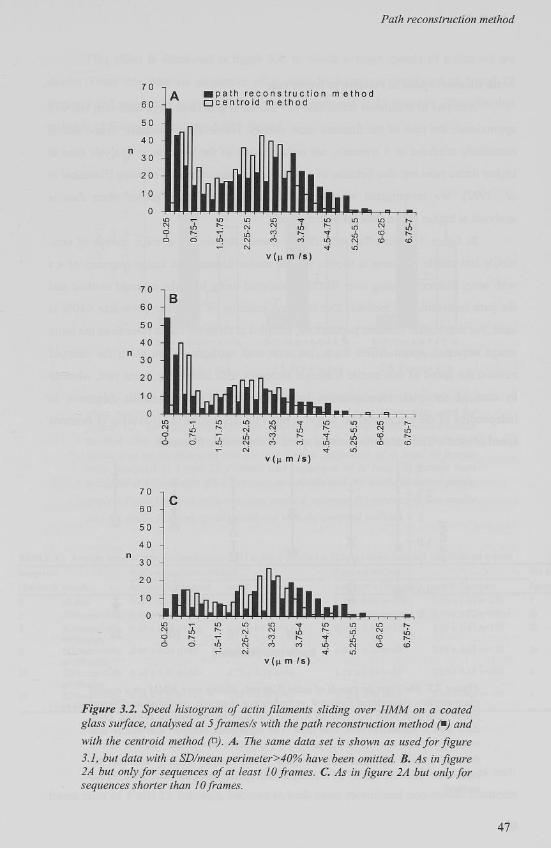
Effect of selection criteria and number of frames analysed
The selection criterion, involving a SD/mean perimeter of less than 40%, was
applied to the data of figure 3.1. Removal of filaments showing excessive behaviour in
this way resulted in the speed histogram shown in figure 3.2A.
Speeds of filaments were analysed from sequences of frames of different length
taken by means of random selection. Figure 3.2B shows the speed histogram for speeds
analysed from sequences of at least 10 successive frames, whereas figure 3.2C shows the
speed histogram for speeds analysed from sequences shorter than 10 successive frames.
Some of these sequences used for figure 3.2C might be part of a sequence used in figure
3.2B. In figure 3.2C the speed distribution, especially where the non-motile filaments are
concerned, is shifted to the right compared to the speed distribution in figure 3.2B. This
can be explained by an effect of lateral movement contributing to the overall speed. For
the path reconstruction method this shift to the right disappears when a minimum of 10
frames is used (see figure 3.2B and conclusion and discussion). For the centroid method
lateral movement contributes to the overall speed independent of the number of frames
analysed. The average speeds are listed in table 3.1.
46
Path reconstruction method
70 A H p a t h r e c o n s t r u c t i o n m e t h o d
3Q _| • c e n t r o i d m e t h o d
50
40
30
20
1 0 ILÉL. IS3 T -
v ( n m Is)
70
60
50
40
30
20
1 0
B
I (UlfttUttM >>Pi in ,n
* - CN
v ( n m /s)
70 60
50
40
30
20 -
1 0 ll...r.l[l^lll... r-- T -
v ( n m /s)
Figure 3.2. Speed histogram of actin filaments sliding over HMM on a coated glass surface, analysed at 5 frames/s with the path reconstruction method (*) and with the centroid method (o). A. The same data set is shown as used for figure 3.1, but data with a SD/mean perimeter>40% have been omitted. B. As in figure 2A but only for sequences of at least 10 frames. C. As in figure 2A but only for sequences shorter than 10 frames.
41
Chapter 3
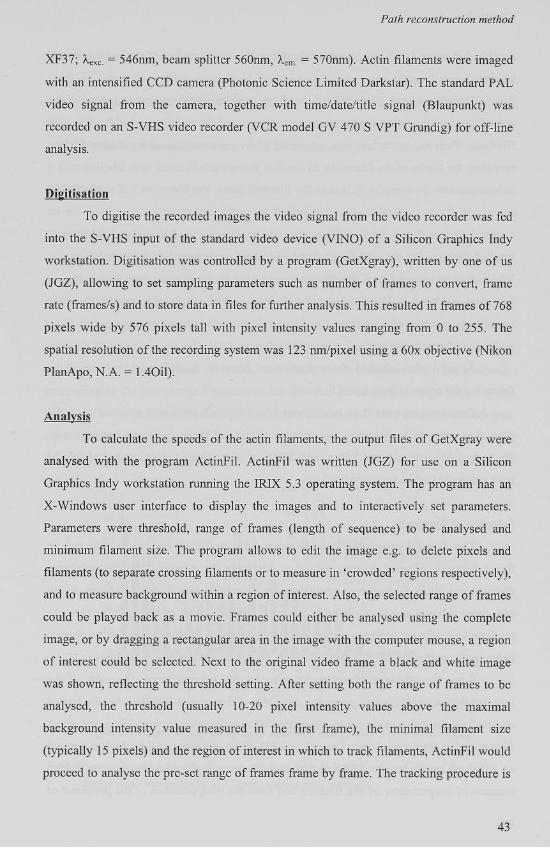
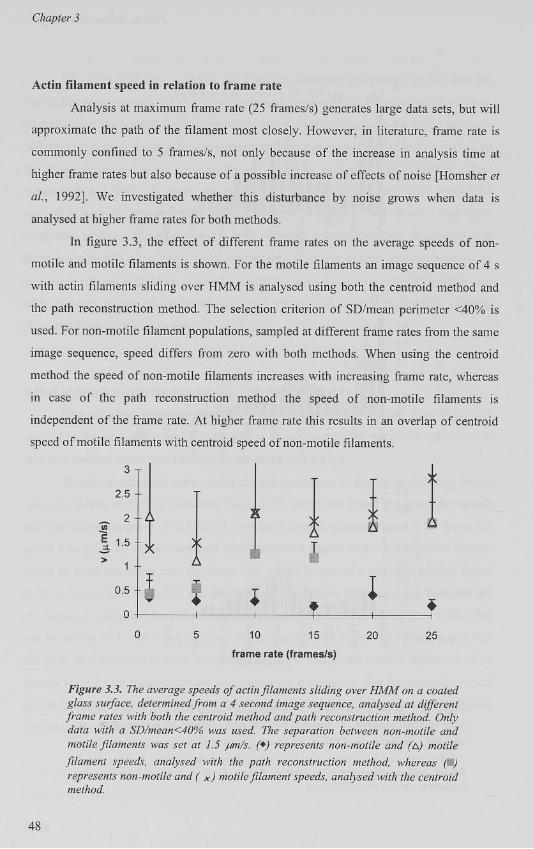
Actin filament speed in relation to frame rate
Analysis at maximum frame rate (25 frames/s) generates large data sets, but will
approximate the path of the filament most closely. However, in literature, frame rate is
commonly confined to 5 frames/s, not only because of the increase in analysis time at
higher frame rates but also because of a possible increase of effects of noise [Homsher et
al, 1992]. We investigated whether this disturbance by noise grows when data is
analysed at higher frame rates for both methods.
In figure 3.3, the effect of different frame rates on the average speeds of non-
motile and motile filaments is shown. For the motile filaments an image sequence of 4 s
with actin filaments sliding over HMM is analysed using both the centroid method and
the path reconstruction method. The selection criterion of SD/mean perimeter <40% is
used. For non-motile filament populations, sampled at different frame rates from the same
image sequence, speed differs from zero with both methods. When using the centroid
method the speed of non-motile filaments increases with increasing frame rate, whereas
in case of the path reconstruction method the speed of non-motile filaments is
independent of the frame rate. At higher frame rate this results in an overlap of centroid
speed of motile filaments with centroid speed of non-motile filaments.
3
2.5
2
1.5 +
1
0.5
0
A
X
• —i—
I o 10 15
frame rate (frames/s)
20 25
Figure 3.3. The average speeds of actin filaments sliding over HMM on a coated glass surface, determined from a 4 second image sequence, analysed at different frame rates with both the centroid method and path reconstruction method. Only data with a SD/mean<40% was used. The separation between non-motile and motile filaments was set at 1.5 /jm/s. (*) represents non-motile and (A) motile filament speeds, analysed with the path reconstruction method, whereas (U) represents non-motile and ( x) motile filament speeds, analysed with the centroid method.
48

Path reconstruction method
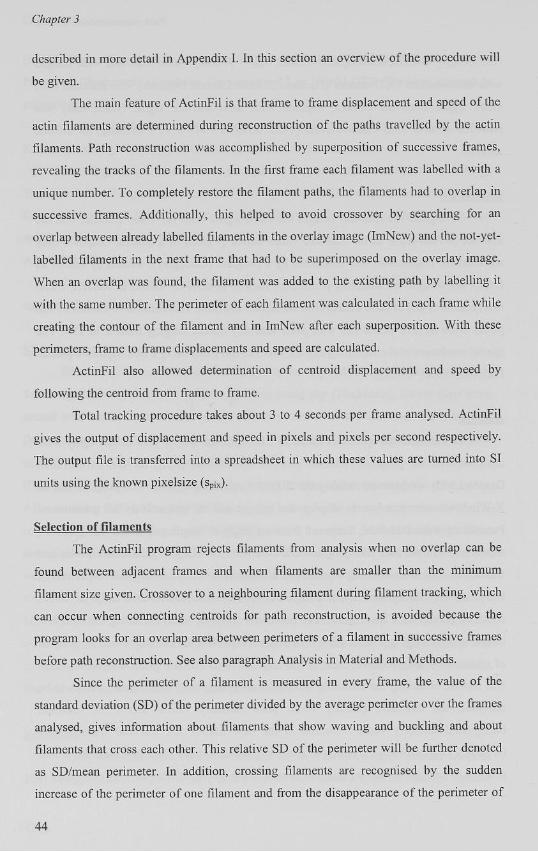
This effect is illustrated in figure 3.4, in which average speeds of a data set are
shown. From this data set sequences of at least 10 frames are analysed at 5 and 25
frames/s and sequences of at least 49 frames are analysed at 25 frames/s. The selection
criterion of SD/mean perimeter <40% is used.
3, >
4 . 5 -,
4 -
3 . 5 -
3 -
T 2 . 5 - 1 T 1 I 2 - 1 I 1 .5 - L
1 - rlL Jr 0 . 5 -
0 - ^ t% 0 . 5 -
0 -
S D / m e a n < 4 0 ° / o S D / m e a n < 4 0 % S D / m e a n < 4 0 %
n > 9 f r a m e s n > 9 f r a m e s n > 4 9 f ra m e s
5 f ra mes / s 25 f r a m e s / s 25 f r a m e s / s
Figure 3.4. The average speeds of actin filaments sliding over HMM on a coated glass surface, determined from a random selection of part of the data used for figure 3.2, analysed with both the centroid method and path reconstruction method. Only data with a SD/mean<40% was used. A separation between non-motile and motile filaments was set at 1.5 /m/s. Sequences of at least 10 frames were analysed at 5 and 25 frames/s and sequences of at least 50 frames were analysed at 25 frames/s. (B) represents non-motile and (*) motile filament speeds, analysed with the path reconstruction method, whereas (o) represents non-motile and (EP motile filament speeds, analysed with the centroid method.
TABLE 3.1 Average speed of actin filaments (mean ± SD in u.m/s) obtained at different frame rates and with different criteria
frame rate Path reconstruction method Centroid method See also
(frames/s) criteria non-motile filaments motile filaments non-motile filaments motile filaments figure
5 all data 0.47 ± 0.50 n= 173 3.41 ±1.12n=353 0.75 ± 0.36 n=168 2.90 ± 1.08n=358 1
5 SD/mean<40% 0.43 ± 0.48 n=161 3.29 ± 1.04n=287 0.73 ± 0.35 n=158 2.76 ± 0.77 n=291 2a
5 SD/mean<40% 0.34 ± 0.49 n=l 16 3.04±0.99n=131 0.66 ± 0.34 n=l 09 2.69 ± 0.87 n=l 39 2b n>9frames
5 SD/mean<40% 0.66 ± 0.34 n=45 3.50 ± 1.03n=156 0.88 ± 0.32 n=49 2.83 ± 0.65 n=l 52 2c n<10frames
25 SD/mean<40% 0.46 ± 0.30 n=240 2.76 ± 0.70 n=46 1.18 ± 0.24 n=83 2.35 ± 0.88 n=203 4 n>9frames
25 SD/mean<40% 0.33 ± 0.25 n=123 3.08 ± 0.46 n=17 1.29 ± 0.14 n=35 2.19 ± 0.65 n=105 4 n>49frames
It can be seen that the path reconstruction method yields good results at both
frame rates of 5 and 25 frames/s, because in both cases motile and non-motile filaments
49
Chapter 3
are well separated. In contrast, the centroid method, when using 25 frames/s shows a
considerable overlap of the speeds of motile and non-motile filaments. The results with
the path reconstruction method show that sequences of at least 10 successive frames are
needed to get a reliable speed determination, but that at higher frame rates the same
minimum time sequence is required as at lower frame rate to get the same result.
In table 3.1 the average speeds obtained with and without the use of the SD/mean
criterion and with and without the limitation in number of frames are summarised.
CONCLUSION AND DISCUSSION
Our goal in developing a method to determine filament motility has been to be
able to avoid biases in the estimation of the speed, easily introduced by the commonly
used centroid method, and to be more accurate in separating motile and non-motile
filaments.
Speed is nowadays usually determined by the centroid method, i.e. by tracking the
centroids of the filaments from frame to frame and averaging this frame to frame speed.
An important difficulty arising with this centroid method is an underestimation of the
speed when analysing filaments that follow a curved path [Work and Warshaw, 1992]. In
that case the centroid is off the filament and its path will to some extent cut short the path
followed by the filament depending on curvature relative to filament length and distance
travelled with this curvature. To avoid this error, one can choose to analyse only filaments
that travel along a straight path. Marston et al. [1996] showed that speed determination of
a large number of filaments, screened over a short time period, was indistinguishable
from speed determination of fewer filaments screened over a longer sequence of frames.
This led to the introduction of a simple and fast method that automatically determined
centroids. Work and Warshaw [1992] developed a computer algorithm that identifies the
filament centre, which is always located on the filament, rather than centroid. This
reduces the error associated with curving of filaments and allows the speed of longer
filaments over longer sequences of frames to be measured. The underestimation of motile
filament speed determined by centroid method is brought out in table 3.1, whereas it is
avoided by the path reconstruction method.
The non-motile filaments move at higher speed when analysed with the centroid
method than when analysed with the path reconstruction method. The path reconstruction
50
Path reconstruction method
method furthermore gives a better separation of the two populations (motile and non-
motile) of filaments. However, both methods detect movement of non-motile filaments.
One reason for the measured speed of non-motile filaments is that brightness of such
filaments may vary locally [Marston et al, 1996]. This leads to filaments that have pixels
changing from black to white from frame to frame. The effect of this virtual movement on
speed is more profound with non-motile filaments. With the centroid method it results in
a centroid moving in random directions from frame to frame. In the path reconstruction
method it results only in a limited increase in accumulated perimeter and the effect on
speed that disappears in time. In case of the path reconstruction method, the effect of
lateral movement contributing to the overall speed only appears when filaments are
followed during less than 10 frames at 5 frames/s. For the centroid method however, an
increase in the number of frames, during which a filament is followed, does not lead to a
decrease in the contribution of lateral movement to the overall speed (figure 3.2B and C).
This effect can be due to a wobbling of the centroid from frame to frame. However, in
case of the path reconstruction method, increase in number of frames contributes to a
smoothening of the contour of the total perimeter. If this movement of the non-motile
filaments is a slow process compared to frame rate, the same time sequence, and thus
more frames, are needed to eliminate the effect of lateral movement in the overall speed.
See also the data in table 3.1 analysed with 25 frames/s and analysed using at least 10
successive frames and analysed using at least 49 successive frames. Another reason for
the filaments to move with this non-motile speed may be Brownian motion [Marston et
al, 1996]. The centroid method does not distinguish between unidirectional movement
and oscillation around a fixed point, whereas the path reconstruction method does.
At higher frame rates an overlap of speeds of non-motile and motile filaments can
occur due to this overestimation of the measured speed of non-motile filaments [Homsher
et al, 1992]. The causes of this increase in speed at higher frame rate, are the same as for
the movement of non-motile filaments, as discussed before. Especially for the centroid
method, these oscillations of the centroid at higher frame rate will make speed
determination noisier. For the path reconstruction method the determination will be more
precise, as a result of the total perimeter estimation being more accurate. In the path
reconstruction method the speed of motile and non-motile filaments are independent of
frame rate (figure 3.3). Figure 3.4 illustrates this effect again. The path reconstruction
method performs well at 25 frames/s in contrast to the centroid method. As reported in
Homsher et al [1992], centroid speed determination at higher frame rates becomes
51
Chapter 3
noisier and, as shown by our data, motile and non-motile filaments can no longer be
clearly separated.
The centroid method gives a good estimation of filament speed at 5 frames/s, but
when filaments move at higher speeds or small differences need to be measured, analysis
at a higher frame rate is needed for satisfactory accuracy.
Waving and buckling may be due to inhomogeneities in the density of myosin
molecules on the coated surface or due to interactions of actin with non-functional
myosin motors. Therefore, filaments showing this should be removed or studied
separately. The path reconstruction method deals with this. The value for the SD/mean
value <40% sufficiently eliminates the waving filaments and the filaments that show
buckling. In this way, it prevents overestimation of speed due to broadening of the
perimeter or excessive displacements of the centroid perpendicular to the filament.
Hesitations of actin filaments during sliding do occur and are either biologically
important, given the experimental conditions, or simply due to inhomogeneities in the
myosin-coated surface. These hesitations should be studied separately and further
analysis of these filaments is therefore beyond the scope of this paper, as is other non
uniform sliding behaviour.
The path reconstruction method avoids crossover during analysis, whereas other
methods need elimination by a separate procedure afterwards.
The path reconstruction method so far enables us to analyse speed of uniform
sliding actin filaments. Motile and non-motile filament speeds form two distinct speed
populations at any frame rate. In addition non-uniform sliding filaments are easily
detected and sorted out.
52
Path reconstruction method
APPENDIX I
Analysis of the first frame (Fi)
To be able to calculate speeds of actin filaments, filaments first had to be
separated from the background in the successive frames. This paragraph describes this
action for the first frame. The objective was to find and label all actin filaments within the
region of interest in the first frame. The first step was to segment the image in actin
filaments and background, by thresholding the image at a previously set threshold value.
In the resulting binary image the background was black (pixel intensity value 0) and actin
filaments were white (pixel intensity value 255). To remove impulse noise a 3x3 median
filter was applied to the binary image [Gonzalez et al, 1992]. This also had a slightly
smoothing effect on the ragged edges of the actin filaments.
The next step was to detect, outline and label the actin filaments. To detect actin
filaments the image was searched line by line from the top left to the lower right for a
pixel intensity value of 255. Upon finding such a value, which had to be a pixel on the
edge of an actin filament, that edge was followed pixel by pixel to create a closed contour
of the filament. After the contour closed, the filament, denoted as fj, was labelled by
filling the contour as a whole with a fill value i (starting with i—1 for the first filament, 2
for the second filament and so on up till a maximum of 254). Searching for a pixel
intensity value of 255 was repeated until there was no pixel with value 255 found in the
image indicating that all filaments were processed. The result was an image with
background intensity 0 and filaments labelled 1, 2 and so on up to n, where n was the
number of filaments found in this first image. This image was copied to a new image,
ImNew. An example is shown in figure 3.5A.
Analysis of the successive frames Fk
Here, the purpose was to follow the labelled actin filaments that were found in the
first frame in the next frames. Therefore, filament detection in successive frames was
slightly different, where it concerned detecting, outlining and labelling of actin filaments.
To ensure that filament fj in ImNew was the same as a filament in the next frame (F2), an
overlap was searched for. Therefore pixel intensity values of coinciding coordinates in
ImNew and F2 were tested to be 255 in F2 and i in ImNew. Subsequently, to make sure
that the pixel was on the edge of the filament fj intensity values of pixels with increasing
x-coordinates were searched for until the intensity of the target pixel was 255 and its right
53

Chapter 3
neighbour had an intensity value of 0. Processing continued with outlining, filling f in F2
and labelling it with the value i. Then ImNew was superimposed with F2. This was
accomplished by replacing pixels with background value in ImNew with pixels from F2
that were labelled as belonging to filaments. This procedure as outlined for handling of F2
was repeated for successive frames Fk with k=2, 3, ..,n. With each frame superimposed
the projection of actin filaments grew longer, in this way reconstructing their filament
path. Each time ImNew was superimposed with a frame (F2, F3 etc.), the reconstructed
filament paths were searched for in ImNew. Detecting these filament paths in ImNew was
analogous to detection of filaments fj in frames F^ with a search for pixel intensity value i
(i=l to n) instead of 255. A typical filament path reconstruction obtained after several
superpositions is shown in figure 3.5B.
v - \ ;
Figure 3.5. Inverted image of an example of ImNew with (A) actin filaments after analysis of a first frame and (B) their reconstructed paths after analysis of several frames.
Calculations
While creating the contour of a filament in each frame the perimeter (P(fj)) was
calculated. For each horizontal or vertical pixel step 1 was added to the perimeter whereas
for each pixel step in a slanting direction A/2 was added. The area of the filament (A(f))
was determined during the filling of the outline by counting pixels that were changed to
the fill value and was therefore equal to the number of pixels (N) in the filament. From
the x,y coordinates of these pixels the centroid Q(x,y) off; was calculated for all i using
G(x,y) = (Xd,yd) (3.1)
54

Path reconstruction method
with
X c - ^ Z . X i a n d y ^ - X . y , (3.2)
Each time after ImNew was superimposed with a successive frame (F2, F3, etc.)
the reconstructed filament paths were searched for in ImNew and their perimeters
(P(fi)tot) were determined analogously to determination of this feature in each frame
described above.
Frame to frame centroid displacement (dd) of a filament was determined by
calculating the Euclidean distance between C;(x,y) in successive frames (F2-Fi, F3-F2,
etc.). Total centroid displacement (dCj)tot was determined by summation of the Euclidean
distances between Cj(x,y) in successive frames (F2-Fi, F3-F2, etc.). Frame to frame
perimeter displacement (dpj) was determined by subtraction of the perimeters P(fj) in
successive frames (F2-Fi, F3-F2, etc.). Total perimeter displacement (dpj)tot was equal to
the difference in perimeter of the filament in the first frame as compared to the perimeter
of the reconstructed filament path in ImNew after all frames were superimposed.
Frame to frame centroid speed (vCi<) was calculated from
d . x o . ci ^Jpix
At (3.3)
with s is pixelsize, At = , and frame rate is the number of frames per unit time. p frame rate F
Average centroid speed (vc) was calculated from
\dci)lo $»
with n being the number of frames analysed.
Frame to frame perimeter speed (vPk) was calculated from
Vpk = 2 A t (3.5)
Average perimeter speed (vP) was calculated from
V'~ 2At(n-l) ( 3-6)
55
Chapter 3
References
1. Fabiato, A. and Fabiato, F. (1979) Calculator programs for computing the composition of the solutions containing multiple metals and ligands used for experiments in skinned muscle cells J, Physiol. 75, 463-505.
2. Gelles, J., Schnapp, B.J., and Sheetz, M.P. (1988) Tracking kinesin-driven movements with nanometre-scale precision Nature 331, 450-453.
3. Gonzalez, R.C. and Woods, R.E. (1992) Digital Imaging Processing, Addison-Wesley Publishing Company, New York.
4. Harada, Y., Sakurada, K., Aoki, T., Thomas, D.D., and Yanagida, T. (1990) Mechanochemical coupling in actomyosin energy transduction studied by in vitro movement assay J. Mol. Biol. 216, 49-68.
5. Homsher, E., Wang, F., and Sellers, J.R. (1992) Factors affecting movement of F-actin filaments propelled by skeletal muscle heavy meromyosin. Am. J. Physiol. 262, C714-723.
6. Kodama, T., Fukui, K., and Kometani, K. (1986) The initial phosphate burst in ATP hydrolysis by myosin and sub fragment-1 as studied by a modified malachite green method for determination of inorganic phosphate. /. Biochem. 99, 1465-1472.
7. Kron, SJ. and Spudich, J.A. (1986) Fluorescent actin filaments move on myosin fixed to a glass surface Proc. Natl. Acad. Sei. USA 83, 6272-6276.
8. Kron, S.J., Toyoshima, Y.Y., Uyeda, T.Q.P., and Spudich, J.A. (1991) Assays for actin sliding movement over myosin-coated surfaces Methods in Enzymol. 196, 399-416.
9. Margossian, S.S. and Lowey, S. (1982) Preparation of myosin and its subfragments from rabbit skeletal muscle Methods in Enzymol. 85, 55-71.
10. Marston, S.B., Fraser, I.D., Bing, W., and Roper, G. (1996) A simple method for automatic tracking of actin filaments in the motility assay J. Muscle Res. Cell Mot. 17,497-506.
11. Pardee, J.D. and Spudich, JA. (1982) Purification of muscle actin Methods in Enzymol. 85, 164-181.
12. Sellers, J.R., Cuda, G., Wang, F., and Homsher, E. (1993) Myosin-specific adaptations of the motility assay Methods Cell Biol. 39, 23-49.
13. Sheetz, M.P. and Spudich, JA. (1983) Movement of myosin-coated fluorescent beads on actin cables in vitro Nature 303, 31-35.
14. Sheetz, M.P., Block, S.M., and Spudich, J.A. (1986) Myosin movement in vitro a quantitative assay using oriented actin cables from Nitella Methods in Enzymol. 134,531-544.
15. Tawada, K. and Sekimoto, K. (1991) A physical model of ATP-induced actin-myosin movement in vitro Biophys. J. 59, 343-356.
16. Uyeda, T.Q, Warrick, H.M., Kron, S.J., and Spudich, J.A. (1991) Quantized velocities at low myosin densities in an in vitro motility assay Nature 352, 307-311.
17. Warshaw, D.M., Desrosiers, J.M., Work, S.S., and Trybus, K.M. (1990) Smooth muscle myosin cross-bridge interactions modulate actin filament sliding velocity in vitro. J. Cell Biol. I l l , 453-463.
18. Work, S.S. and Warshaw, D.M. (1992) Computer-assisted tracking of actin filament motility. Anal. Biochem. 202, 275-285.
56