Embed Size (px)
Citation preview

UvA-DARE is a service provided by the library of the University of Amsterdam (http://dare.uva.nl)
UvA-DARE (Digital Academic Repository)
Mechanisms of Betulinic acid‐induced cell death
Potze, L.
Link to publication
Citation for published version (APA):Potze, L. (2015). Mechanisms of Betulinic acid‐induced cell death.
General rightsIt is not permitted to download or to forward/distribute the text or part of it without the consent of the author(s) and/or copyright holder(s),other than for strictly personal, individual use, unless the work is under an open content license (like Creative Commons).
Disclaimer/Complaints regulationsIf you believe that digital publication of certain material infringes any of your rights or (privacy) interests, please let the Library know, statingyour reasons. In case of a legitimate complaint, the Library will make the material inaccessible and/or remove it from the website. Please Askthe Library: https://uba.uva.nl/en/contact, or a letter to: Library of the University of Amsterdam, Secretariat, Singel 425, 1012 WP Amsterdam,The Netherlands. You will be contacted as soon as possible.
Download date: 06 Jan 2020

Chapter 2
Betulinic acid‐induced mitochrondria‐
dependent cell death is counter
balanced by an autophagic salvage
response
Lisette Potze, Franziska B. Mullauer, Selcuk Colak, Jan H. Kessler,
Jan Paul Medema
Cell Death and Disease 2014
"Tut, tut, child!" said the Duchess. "Every thing's got a moral, if only you can find it."
Lewis Carroll, Alice in Wonderland

Chapter 2
56
Abstract
Betulinic acid (BetA) is a plant‐derived pentacyclic triterpenoid that exerts potent anti‐
cancer effects in vitro and in vivo. It was shown to induce apoptosis via a direct effect on
mitochondria. This is largely independent of proapoptotic BAK and BAX, but can be inhibited
by cyclosporin A (CsA), an inhibitor of the permeability transition (PT) pore. Here we show
that blocking apoptosis with general caspase inhibitors did not prevent cell death, indicating
that alternative, caspase‐independent cell death pathways were activated. BetA did not
induce necroptosis, but we observed a strong induction of autophagy in several cancer cell
lines. Autophagy was functional as shown by enhanced flux and degradation of long‐lived
proteins. BetA‐induced autophagy could be blocked, just like apoptosis, with CsA,
suggesting that autophagy is activated as a response to the mitochondrial damage inflicted
by BetA. As both a survival and cell death role have been attributed to autophagy,
autophagy‐deficient tumor cells and mouse embryo fibroblasts were analyzed to determine
the role of autophagy in BetA‐induced cell death. This clearly established BetA‐induced
autophagy as a survival mechanism and indicates that BetA utilizes an as yet‐undefined
mechanism to kill cancer cells.

Betulinic acid induces a rescue autophagy response
57
Introduction
Betulinic acid (BetA) is a naturally occurring triterpenoid with potent cytotoxic effects on
cancer cells.1–4 It was initially proposed to have a direct effect on the mitochondria and to
induce apoptosis in a BCL‐2‐dependent fashion.5–7 However, BCL‐2 overexpression can only
provide short‐term protection and eventually these cells do succumb to apoptosis. In
addition, BAK/BAX double deficiency does not protect against BetA‐induced cell death,8
indicating that cell death ensues independently of the BCL‐2 family. Mitochondrial outer
membrane permeabilization (MOMP), however, is crucial as cyclosporin A (CsA) and
bongkrekic acid, both inhibitors of the permeability transition pore (PT‐pore), and as a
consequence MOMP were able to protect BetA‐treated cells from releasing cytochrome c
and subsequent apoptosis.7,8 Downstream of the mitochondria caspases are activated, but
direct inhibition of caspase activity with the pan‐caspase inhibitor zVAD.fmk (N‐
benzyloxycarbonyl‐Val‐Ala‐Asp‐fluoromethylketone) did not offer protection to BetA‐
induced cell death.4 Combined this indicates that BetA does induce apoptosis, but that
additional mechanisms must exist by which cell death is induced by the compound.
Alternative cell death pathways include necrosis, necroptosis, lysosomal membrane
permeabilization (LMP) and autophagy. Necrosis is a form of passive cell death that is
induced upon strong insults such as mechanical injury of cells. Typical features include
swelling, rupture of organelle membranes as well as the outer cell membrane and as a result
the cell contents are released, often causing inflammation in vivo.9 Necroptosis, a highly
regulated form of necrosis, can be induced by ligation of death receptors in the presence of
caspase inhibitors.10 Necroptosis is regulated by distinct complexes called the necrosome
or ripoptosome that include receptor interacting protein (RIP) kinases, FAS‐associated
death domain and caspase‐8.10,11 Necroptosis can be blocked by small molecules, such as
necrostatin‐1, that allosterically block the kinase activity of RIP1.12,13
Lysosomal cell death is induced by a destabilization of the lysosomal membrane.14 The cell
death depends on the leakage of lysosomal components into the cytoplasm, and the activity
of cathepsins that can induce a necrotic‐like or apoptotic cell death depending on the extent
of the leakage. As such the induction of cell death is clearly distinct from necrosis and
apoptosis; nevertheless, the execution phase is similar.
Autophagy is a highly conserved cellular proteolytic degradation process in which cytosolic
components are first encapsulated by a membrane and subsequently degraded in the
lysosome, thereby providing new building blocks for the cell. Autophagy is typically induced
upon nutrient starvation. However, autophagy also involves sequestration of damaged
cytoplasmic components and organelles, via induction of de novo double‐membrane
vesicles (autophagosomes) that surround the cargo. The autophagosome transports the

Chapter 2
58
cargo to the lysosome where fusion of the autophagosome and lysosome leads to
degradation of the cargo (autophagic flux).15 Autophagy, even though initially regarded as
a cell survival mechanism, has also been suggested to serve a role in inducing cell death. It
may therefore represent a balancing mechanism between cell survival and cell death.16–18
Autophagy can target cytosolic components specific for degradation, known as specific
autophagy. Specific autophagy can include ubiquitinated proteins, peroxisomes and
mitochondria.19–21 Mitophagy involves the selective degradation of mitochondria and is
among others used for clearance of damaged mitochondria.17,22 Previously, BetA and a
derivative of BetA, B10, have been shown to induce autophagosome formation in multiple
myeloma cells and glioblastoma cells.23,24 In these studies it was suggested that the
autophagic flux was prevented, leading to an accumulation of undigested autophagosomes.
Although both studies observed autophagy, the role of autophagy as a cell death
mechanism was not addressed for BetA.23,24
We hypothesized that autophagy/mitophagy is induced upon BetA treatment to clear the
damaged mitochondria. We show that autophagy is massively induced in various BetA‐
treated tumor cells, but is prevented by CsA, suggesting that autophagy occurs downstream
of the BetA‐induced mitochondrial damage. With the use of knockout and knockdown
studies of key regulators of the autophagy pathway, we demonstrate that autophagy serves
as a rescue pathway and is not responsible for the cell death induced by BetA.
Results
BetA‐induced cell death is independent of apoptosis.
BetA induced a very potent form of cell death in HeLa cells that displayed features like cell
membrane rupture (Figure 1a), apoptosis (Figures 1b and c) and mitochondrial
depolarization (Figures 1d and e). The effect of BetA was, as shown before, concentration
dependent, starting at 7.5 µg/ml and reaching a plateau at 10 µg/ml (Supplementary Figure
1). Previously we have shown, in Jurkat cells, that BetA‐induced apoptosis is blocked by co‐
treatment with zVAD.fmk, but that this pan‐caspase inhibitor does not prevent cell death
as measured by propidium iodide (PI) exclusion.4 Similarly, cell death induced by BetA in
HeLa cells was only partly blocked with a more potent caspase inhibitor Q‐VD‐OPh (Figure
1f), which did block apoptotic features like DNA fragmentation (results not shown). This
indicates that caspase inhibition was effective, but not sufficient to block the induction of
cell death. Thus, while apoptosis is induced by BetA, these findings indicate that alternative
cell death pathways are activated as well. To study whether necroptosis serves as an
alternative cell death mechanism induced by BetA, we made use of necrostatin, a specific
inhibitor of this cell death mechanism. Either necrostatin alone or in combination with
caspase inhibition failed to prevent cell death (Figure 1f). As a control for the action of
Betulinic acid induces a rescue autophagy response
59
necrostatin, U937 cells were used, which have been reported to undergo necroptosis upon
tumor necrosis factor‐α (TNF‐ α) treatment12 in the presence caspase inhibitors. In
accordance with literature12 this indeed led to a significant induction necroptosis, which was
prevented by necrostatin (Supplementary Figure 2). As this combination did not inhibit
BetA‐induced cell death, our data point to a cell death mechanism that is independent of
caspases and necroptosis.
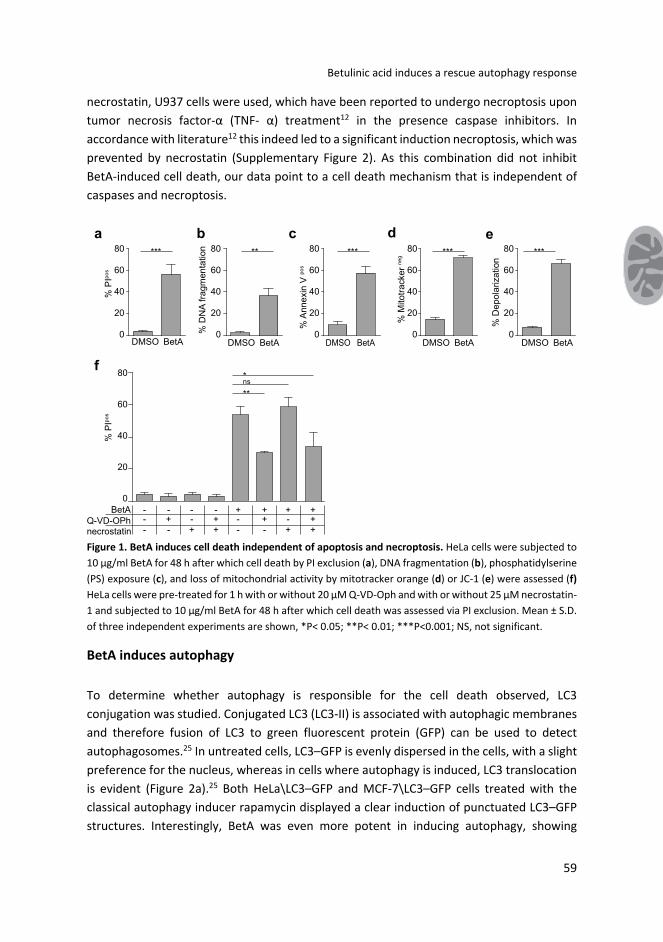
Figure 1. BetA induces cell death independent of apoptosis and necroptosis. HeLa cells were subjected to
10 µg/ml BetA for 48 h after which cell death by PI exclusion (a), DNA fragmentation (b), phosphatidylserine
(PS) exposure (c), and loss of mitochondrial activity by mitotracker orange (d) or JC‐1 (e) were assessed (f)
HeLa cells were pre‐treated for 1 h with or without 20 µM Q‐VD‐Oph and with or without 25 µM necrostatin‐
1 and subjected to 10 µg/ml BetA for 48 h after which cell death was assessed via PI exclusion. Mean ± S.D.
of three independent experiments are shown, *P< 0.05; **P< 0.01; ***P<0.001; NS, not significant.
BetA induces autophagy
To determine whether autophagy is responsible for the cell death observed, LC3
conjugation was studied. Conjugated LC3 (LC3‐II) is associated with autophagic membranes
and therefore fusion of LC3 to green fluorescent protein (GFP) can be used to detect
autophagosomes.25 In untreated cells, LC3–GFP is evenly dispersed in the cells, with a slight
preference for the nucleus, whereas in cells where autophagy is induced, LC3 translocation
is evident (Figure 2a).25 Both HeLa\LC3–GFP and MCF‐7\LC3–GFP cells treated with the
classical autophagy inducer rapamycin displayed a clear induction of punctuated LC3–GFP
structures. Interestingly, BetA was even more potent in inducing autophagy, showing
ba c d e
f
BetAQ-VD-OPh
--
-+
+- -
--+ +-
necrostatin - - - -+ ++
++
+++
***** *** *** ***
**
*ns
% P
Ipo
s
%A
nne
xin
Vp
os
% D
epo
lariz
atio
n
% M
itotr
acke
rn
eg
0
20
40
60
80
BetADMSO BetADMSO BetADMSO BetADMSO0
20
40
60
80
0
20
40
60
80
0
20
40
60
80
BetADMSO0
20
40
60
80
0
20
40
60
80
% D
NA
fra
gm
enta
tion
% P
Ipo
s

Chapter 2
60
enlarged punctae (Figure 2a). To validate that BetA indeed induced autophagy, a separate
measure to monitor the induction of autophagy was used, namely the processing of LC3‐I
to its PE‐conjugated LC3‐II using immunoblotting.26 Rapamycin treatment resulted in
enhanced LC3‐II levels in HeLa\LC3–GFP, A549, MCF‐7\LC3–GFP and SW480\LC3‐GFP cells
as compared with their DMSO‐treated counterparts (Figure 2b). Analyzing multiple
independent assays consistently revealed this induction, but due to the variation in
background levels of LC3‐II it only reached significance in HeLa and A549 cells (Figure 2c). In
contrast, BetA‐induced LC3‐II levels are significantly elevated in all cell lines and were clearly
more pronounced as compared with rapamycin (Figures 2b and c), similar to the
observations with LC3–GFP staining. The effect of BetA on autophagy occurs relatively rapid
upon BetA treatment and required concentrations that are also exerting a toxic effect (7.5–
10 µg/ml) (Supplementary Figures 3a and b).
Both detection of LC3‐II via immunoblotting and LC3–GFP translocation are measures for
the amount of autophagosomes present at a certain time point, but do not provide
information about the cause of this phenotype. It is possible that an increased number of
autophagosomes is caused by an inhibition of basal autophagic flux rather than by induction
of autophagy.27,28 Previously, it was reported that BetA in KM3 cells dose‐dependently
induces the expression of LC3‐II, but also of p62, a protein that is normally degraded during
autophagy. This study suggested that BetA rather inhibited autophagic flux instead of
inducing autophagy.24 To analyze the effect of BetA on p62 we studied its expression in HeLa
cells. This confirmed a strong induction of p62 upon BetA treatment (Supplementary Figure
3c). However, this is due to induction of de novo synthesis and could be blocked with the
addition of cycloheximide. The combination of cycloheximide and BetA did reveal
degradation of p62, pointing to a functional flux (Supplementary Figure 3c). To better
evaluate this autophagic flux, degradation of long‐lived proteins was measured, which
reportedly are at least in part degraded by autophagy.27–29 In agreement, rapamycin clearly
induced degradation of these long‐lived proteins after 14 h (Figure 2d). Moreover,
degradation continued after this time point as was evident from analyzing the release of
labeled amino acids in the time period between 14 and 20 h (Figure 2e). In contrast to the
finding of Yang et al.24 That BetA prevents autophagic flux, BetA clearly increased the
degradation of long‐lived proteins after 14 h and the following 6 h after medium change.
This was also more pronounced as compared to rapamycin‐induced degradation (Figures
2d and e). Because degradation of long‐lived proteins is not solely specific for autophagy
and cannot discriminate between proteasomal‐ and autophagosomal degradation more
specific assays using tandem RFP/eGFP‐tagged LC3 as well as a tandem mCherry/GFP‐
tagged p62 were used.30 As RFP and mCherry are pH stable, they remain fluorescent after
fusion of the autophagosomes with the lysosomal compartment, while eGFP fluorescence
is lost. This allows detection of autophagic flux by simply observing the formation of red
fluorescent lysosomes from green/red fluorescent autophagosomes. Using either LC3

Betulinic acid induces a rescue autophagy response
61
(Figure 2f) or p62 (Supplementary Figure 3d) we observed that rapamycin as well as BetA
induced a functional autophagic flux using. This confirms that BetA is a potent inducer of
autophagy resulting in an enhanced autophagic flux.
Figure 2. BetA induces autophagy (a) HeLa\LC3‐GFP cells and MCF‐7\LC3‐GFP cells were treated with 10
µg/ml BetA or 10 µM rapamycin and after 18 h cells were analyzed by confocal microscopy. Quantification
of LC3 punta was perfomed using Image J. Mean of positive pixels/total pixel cell (%) ± S.D. of three fields of
view per sample are shown. (b) HeLa\LC3‐GFP, A549, MCF‐7\LC3‐GFP and SW480\LC3‐GFP were treated
with 10 µg/ml BetA or 10 µM rapamycin for 18 h. LC3 processing was assessed via immunoblotting. Results
for endogenous LC3 are shown. LC3‐I (18 kDa) and LC3‐II (16 kDa). Tubulin is used as a control. (c) Band
intensity of western blot was quantified using Image J software. DMSO control is set to 1. Mean ± S.D. of
three indendent experiments are shown, *P < 0.05; **P< 0.01; ***P<0.001; n.s., not significant. (d) MCF7
cells were treated with the indicated concentrations of BetA or 1 µM rapamycin and after 14 h degradation
of long‐lived proteins was measured or (e) after 14 h medium was refreshed and degradation in the following
6 h was measured. Mean ± S.D. of triplicates are shown (f) HeLa and A549 cells with tandem fluorescent LC3
(mRFP‐eGFP‐LC3) were treated with 10 µg/ml BetA or 10 µM rapamycin and after 18 h cells were analyzed
by confocal microscopy. Quantification of red LC3 puncta was performed using Image J. Mean of positive
pixels/total pixel cell (%) ± S.D. of three fields of view per sample are shown.
DMSO rapamycinBetA
MC
F-7
\LC
3-G
FP
HeL
a\LC
3-G
FP
5.795 ±0.86
10.36 ±1.8 3.707 ±0.61
DMSO rapamycinBetA
1.452 ±2.1
a
d
0.5
1.0
1.5
2.0
Degra
dation (
ratio)
0 5 7.5 10 1µM
BetA (µg/ml) Rapa
0.5
1.0
1.5
2.0
0 5 7.5 10 1µMBetA (µg/ml) Rapa
De
gra
da
tio
n (
ratio
)
e
LC
3 I
I /
LC
3 I
0
2
4
6 ***
**
**ns
*ns
A549HeLa SW480MCF-7
0.042 ±0.04 8.415 ±2.8
0.16 ±0.2
c
He
La
0 µm 10 0 µm 10 0 µm 10
f
A5
49
0 µm 25 0 µm 25 0 µm 25
BetArapamycin
+- - - - - - - -+ + ++ + + + +-------
2.539 ±2.7 10.99 ±9.0 5.218 ±4.4
8.36 ±6.9 6.637 ±3.1
b
LC3 I
LC3 II
Tubulin
A549HeLa SW480MCF-7
BetArapamycin
+- - - - - - - -+ + ++ + + + +------

Chapter 2
62
Cyclosporin A blocks BetA‐induced autophagy.
Permeability transition pore (PT‐pore) opening results in membrane depolarization and
leads to cytochrome c release and subsequent caspase activation.31 The proposed structure
of the pore is formed by a voltage‐dependent anion channel, adenine nucleotide
translocator and cyclophilin D complex,32 and opening of the PT‐pore can be blocked by
inhibition of cyclophilin D using CsA.33 Previously we have shown that BetA‐induced
apoptosis and cytochrome c release proceeded in a PT‐pore‐dependent fashion.8 As CsA
inhibits BetA‐induced apoptotic features,8 the effect of CsA on BetA‐induced autophagy was
investigated. HeLa\LC3–GFP cells were treated with BetA alone or in combination with CsA
and analyzed via confocal microscopy. Autophagosome formation was clearly inhibited in
the presence of CsA (Figure 3a). A similar CsA dependency was observed in MCF‐7\LC3 cells
(Figure 3a). The effect of CsA was confirmed by immunoblotting for LC3 in BetA‐treated
HeLa, but also in other cancer lines (A549, MCF‐7 and SW480). In all tested cell lines, BetA‐
induced formation of lipidated LC3‐II was reduced when cells were pretreated with CsA
(Figures 3b and c). These data suggest that BetA‐induced autophagy is a consequence of
mitochondrial damage triggered by BetA and can be prevented by inhibition of PT‐pore
opening.
Autophagy serves as a rescue pathway, not as an alternative cell death pathway
in BetA‐treated cells.
Autophagy, even though initially regarded as a cell survival pathway, can play a role in dying
cells as well and has been suggested to serve as a balancing mechanism between cell
survival and cell death.16,17 Autophagy is detectable already at low BetA concentrations (7.5
µg/ml) and we reasoned that it is primarily induced as a rescue mechanism. However, it is
feasible that at higher BetA concentrations autophagy is induced beyond a certain
threshold, which shifts the balance from cell survival to cell death.17,34 To test this
hypothesis, we used cell lines with a deficiency in ATG5 or ATG7, which are crucial regulators
in the induction of autophagy.35,36 First we used retroviral shRNA against ATG5 in HeLa and
HeLa\LC3–GFP cells. ATG5 knockdown levels of 77 and 86% were obtained with shRNA
against ATG5 in HeLa and HeLa\LC3–GFP cells, respectively (Supplementary Figure 4a). The
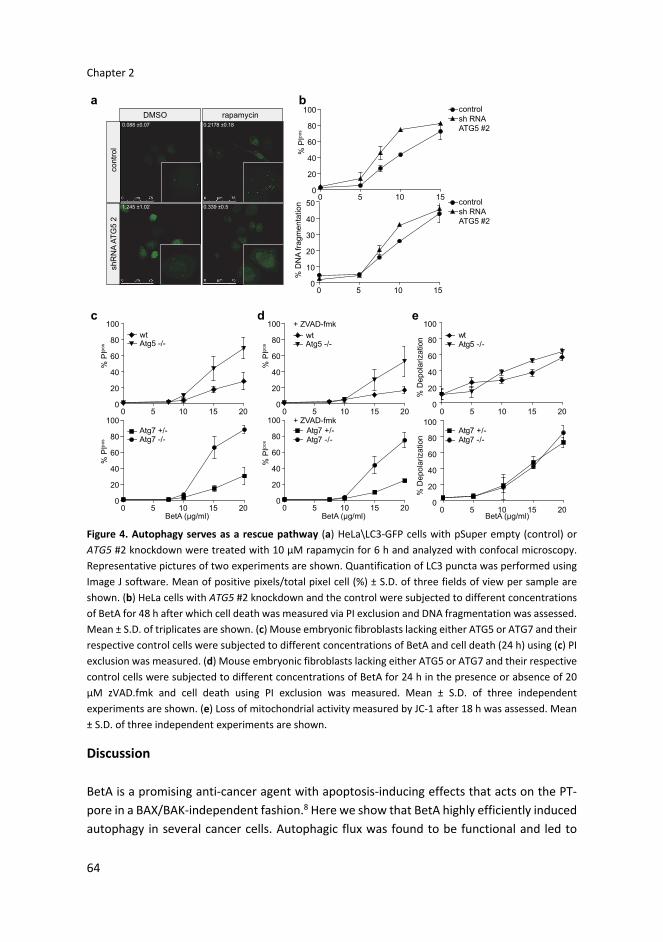
abrogation of autophagy in these cells was confirmed by confocal microscopy (Figure 4a).
Importantly, when analyzing BetA‐induced cell death in HeLa ATG5 knockdown cells, this
was found, if anything, to be enhanced as compared to the cell death induced in control
knockdown cells (Figure 4b). The increase in BetA‐induced cell death in autophagy‐impaired
cells was also observed in MCF‐7\LC3–GFP cells (Supplementary Figures 4a and b). To
formally confirm that impaired autophagy enhances BetA‐induced cell death, MEFs derived
from Atg5 or Atg7 knockout mice were used. While these cells are completely autophagy
deficient, they showed increased levels of BetA‐induced cell death (Figure 4c) and Annexin

Betulinic acid induces a rescue autophagy response
63
V exposure (Supplementary Figure 4c). Interestingly, caspase inhibition in these autophagy‐
deficient cells did not prevent cell death either (Figure 4d). However, both autophagy‐
proficient and –deficient cells displayed a similar increase in mitochondrial depolarization
(Figure 4e), suggesting that the initial mitochondrial insults are independent of the
induction of autophagy. Combined these data indicate that autophagy serves primarily as a
survival mechanism in BetA‐treated cells and that BetA‐induced cell death is independent
of autophagy, necroptosis and caspases and follows an as yet‐undefined pathway.
Figure 3. CsA inhibits BetA‐induced autophagy (a) HeLa\LC3‐GFP cells and MCF‐7\LC3‐GFP cells were pre‐
treated with 10 µg/ml CsA for one hour and subjected to 10 µg/ml BetA for 18 h and analyzed by confocal
microscopy. Quantification of LC3 puncta was performed using Image J. Mean of positive pixels/total pixel
cell (%) + S.D. of three fields of view per sample are shown. (b) HeLa\LC3‐GFP, A549, MCF‐7\LC3‐GFP and
SW480\LC3‐GFP were pre‐treated with 10 µg/ml CsA for one hour and subjected to 10 µg/ml BetA for 18 h.
LC3 processing was assessed via immunoblotting. Results for endogenous LC3 are shown; LC3‐I (18 kDa) and
LC3‐II (16 kDa). Tubulin is used as a control. (c) Band intensity of LC3 western blot was quantified using
Image J software. DMSO control is set to 1. Mean + S.D. of three independent experiments are shown, *P <
0.05; **P< 0.01; ***P<0.001; N.S., not significant.
a
b
LC3 ILC3 II
A549HeLa SW480MCF-7
BetACsA
+- - - - - - - -+ + + + + + ++ + + + + + + +- - - - - - - -
LC3
II / L
C3
I
Tubulin
0.0
2.5
5.0
7.5
10.0
A549HeLa SW480MCF-7
BetACsA
+- - - - - - - -+ + + + + + ++ + + + + + + +- - - - - - - -
c
DMSO BetA CsA BetA + CsA
MC
F-7
\LC
3-G
FP
He
La\L
C3
-GF
P
*** * * ns
1.09 ±1.1 6.152 ±0.48 0.664 ±0.53 1.192 ±1.5
1.152 ±0.99 4.611 ±1.39 0.869 ±1.1 1.56 ±0.69
Chapter 2
64
Figure 4. Autophagy serves as a rescue pathway (a) HeLa\LC3‐GFP cells with pSuper empty (control) or
ATG5 #2 knockdown were treated with 10 µM rapamycin for 6 h and analyzed with confocal microscopy.
Representative pictures of two experiments are shown. Quantification of LC3 puncta was performed using
Image J software. Mean of positive pixels/total pixel cell (%) ± S.D. of three fields of view per sample are
shown. (b) HeLa cells with ATG5 #2 knockdown and the control were subjected to different concentrations
of BetA for 48 h after which cell death was measured via PI exclusion and DNA fragmentation was assessed.
Mean ± S.D. of triplicates are shown. (c) Mouse embryonic fibroblasts lacking either ATG5 or ATG7 and their
respective control cells were subjected to different concentrations of BetA and cell death (24 h) using (c) PI
exclusion was measured. (d) Mouse embryonic fibroblasts lacking either ATG5 or ATG7 and their respective
control cells were subjected to different concentrations of BetA for 24 h in the presence or absence of 20
µM zVAD.fmk and cell death using PI exclusion was measured. Mean ± S.D. of three independent
experiments are shown. (e) Loss of mitochondrial activity measured by JC‐1 after 18 h was assessed. Mean
± S.D. of three independent experiments are shown.
Discussion
BetA is a promising anti‐cancer agent with apoptosis‐inducing effects that acts on the PT‐
pore in a BAX/BAK‐independent fashion.8 Here we show that BetA highly efficiently induced
autophagy in several cancer cells. Autophagic flux was found to be functional and led to
a
c
DMSOco
ntro
lsh
RN
AA
TG
5 2
rapamycin
d
0
10
20
30
40
50
% D
NA
frag
men
tatio
n0 5 10 15
controlsh RNAATG5 #2
0
20
40
60
80
100
% P
Ipo
s
0 5 10 15
bcontrolsh RNAATG5 #2
e
0.088 ±0.07 0.2178 ±0.18
1.245 ±1.02 0.339 ±0.5
+ ZVAD-fmk
+ ZVAD-fmk0 5 10 15 20
0
20
40
60
80
100
% P
Ipo
s
0 5 10 15 200
20
40
60
80
100
% P
Ipo
s
BetA (µg/ml)
wtAtg5 -/-
BetA (µg/ml)
wtAtg5 -/-
Atg7 -/-Atg7 +/-
0 5 10 15 200
20
40
60
80
100
% P
Ipo
s
BetA (µg/ml)0 5 10 15 20
0
20
40
60
80
100
% P
Ipo
s
Atg7 +/-Atg7 -/-
wtAtg5 -/-
Atg7 +/-Atg7 -/-
0
20
40
60
80
100
% D
epol
ariz
atio
n0 5 10 15 20
0
20
40
60
80
100%
Dep
olar
izat
ion
0 5 10 15 20

Betulinic acid induces a rescue autophagy response
65
enhanced degradation of long‐lived proteins and degradation of GFP in tandem fluorescent
LC3 and p62 proteins (Figure 2 and Supplementary Figure 3). Our observations are in
contrast to previous findings by Yang et al.24 reporting that BetA inhibits autophagic flux in
human multiple myeloma cells as measured by accumulation of p62 protein. Similar to BetA,
B10, a semi‐synthetic glycosylated derivative of BetA, induced cell death in both an
apoptosis‐dependent and apoptosis‐independent fashion. In response to B10 treatment,
LMP and subsequent release of lysosomal enzymes was observed in a human glioblastoma
cell line, impairing autophagy in later stages.23 LMP results in the release of lysosomal
hydrolases and cathepsins into the cytosol.37 Massive lysosomal leakage leads to
uncontrolled necrosis, whereas minor LMP can activate either the intrinsic caspase‐
dependent apoptosis pathway or caspase‐independent alternative cell death programs.38–
43 LMP could therefore also be a possible mechanism by which BetA induces cell death.
However, in contrast to B10, which disrupts the autophagic flux, our data show that
autophagy is enhanced after BetA treatment. It could well be that at later time points the
flux is halted, potentially due to an overload of cargo. This could explain the relatively large
LC3–GFP structures that are observed at later time points. Nevertheless, we show that the
initial enhanced autophagic flux also serves a protective function as it delays the execution
of cell death, while it does not appear to limit the mitochondrial depolarization. Blocking
autophagy completely is detrimental to the cells confirming that the observed increase in
autophagosomes and LC3‐II is not simply due to a block in the flux.
An interesting connection between BetA‐induced apoptosis and autophagy is the fact that
both are efficiently inhibited by CsA, an inhibitor of the PT‐pore8 (Figure 3) CsA has been
reported to block mitophagy induced by loss of MOMP in rat hepatocytes.44,45 Blocking of
apoptosis and autophagy by CsA hints to a scenario in which both pathways are triggered
by a common upstream event that is related to PT‐pore opening. How this is achieved by
BetA remains yet to be established. It is consistent though with the observations in
autophagy‐deficient cells, which do show a decrease in cell death, but not in mitochondrial
defects. This suggests that the primary insult is independent of autophagy, but that the
execution of cell death is dampened by an initial salvage response through the induction of
autophagy. The fact that autophagy occurs relatively rapid upon BetA treatment is also in
line with this notion.
Even though our results suggest that autophagy does not primarily serve as a cell death
mechanism, it is conceivable that it plays an indirect role in the toxicity exerted by BetA. At
higher concentration of BetA, autophagy may keep the balance up for a period of time, after
which either the mitochondrial damage is too massive to be counteracted by autophagy or
that lysosomal exhaustion occurs, which as a consequence will prevent further autophagic
flux. This may then result in release of cytochrome c, activation of caspases and subsequent
apoptosis. This is supported by the observations that BetA‐induced cell death is higher in

Chapter 2
66
autophagy‐deficient cells compared to control cells (Figure 4 and Supplementary Figure 4).
Nevertheless, even under these conditions caspase inactivation is not sufficient to rescue
the cells either, suggesting that the mitochondrial damage inflicted is not compatible with
cellular survival.
Taken together our findings show that BetA‐induced cell death is independent of caspases,
necroptosis and autophagy and, thus, alternative cell death mechanisms must be involved.
This potentially explains the high tumoricidal efficacy of BetA, as it induces cell death that
is not prevented by classical antiapoptotic mechanisms.
Materials and Methods
Chemicals/antibodies.
Betulinic acid (BioSolution Halle, Halle, Germany, (>99% purity) was dissolved in DMSO at 4
mg/ml and stored at ‐80 °C. PI and CsA were purchased from Sigma‐Aldrich (St. Louis, MO,
USA). Rapamycin was purchased from VWR (Amsterdam, The Netherlands) and C‐14 valine
(CFB75‐50 µCi) from Amersham Biosciences (Amersham, UK). Q‐VD‐OPh was purchased
from R&D Systems (Minneapolis, MN, USA). Necrostatin‐1 and TNF‐α were obtained from
Enzo Life Sciences (Farmingdale, NY, USA). Anti‐LC3 antibody (51520) was obtained from
Abcam (Cambridge, UK). Anti‐ATG5 antibody and anti‐ SQSTM1/p62 were from Cell
Signaling Technology (Danvers, MA, USA). Anti α Tubulin antibody was from Santa Cruz
Biotechnology (Dallas, TX, USA). Annexin V‐APC and 7‐AAD were from BD Biosciences
(Franklin Lakes, NJ, USA). Mitotracker Orange CMTMRos and JC‐1 were obtained from Life
Technologies (Carlsbad, CA, USA).
Cell culture.
HeLa cells, A549 cells, MCF‐7 cells, SW480 and U937 cells were obtained from the ATCC
(Manassas, VA, USA). MCF‐7 cells overexpressing LC3– GFP were generated as described.46
HeLa cells and SW480 cells overexpressing LC3‐GFP were made by stable transfection of
plasmid pEGFP‐C1‐LC3, which was a gift from G. Kroemer (Institut Gustave Roussy, Villejuif,
France). All LC3–GFP overexpressing cell lines were cultured with 500 µg/ml G418 in order
to select for LC3–GFP. ATG5 knockout and the corresponding control MEFs were kindly
provided by N Mizushima (Department of Cell Biology, Okazaki, Japan)25 and the ATG7
knockout and corresponding control MEFs were obtained from M Komatsu (Department of
Molecular Oncology, Tokyo, Japan).35
All cells were cultured in IMDM supplemented with 8% FCS, 2mM L‐glutamine, 40 U/ml
penicillin and 40 µg/ml streptomycin.
RNA interference.
Retroviral vectors pSuper ATG5 #2, pSuper ATG5 #3 and pSuper empty, a gift from S.W. Tait
(Beatson Institute, Institute of Cancer Sciences, Glasgow, UK),47 were transfected into

Betulinic acid induces a rescue autophagy response
67
Phoenix Amphothrophic cells using the standard Ca²+‐phosphate procedure. After 48 h, the
virus containing medium was centrifuged at 1200 r.p.m. to purify virus from cell debris and
supernatant was supplemented with 10 µg/ml polybrene. Target cells were plated at 70%
confluence and allowed to attach overnight in standard medium. For infections, the culture
medium was replaced with the virus containing medium and incubated for 8 h at 37 °C.
Transduced cell populations were subsequently selected with 1–2 µg/ml puromycin,
depending on cell type (2 µg/ml for HeLa cells and 1 µg/ml for MCF‐7 cells). After 1 week of
selection, expression of the targeted proteins was determined by western blot.
Cell death analysis.
Cell death was determined by PI exclusion. In short, 50 000 cells were plated in a 24‐well
plate and allowed to attach overnight. Cells were treated for 48 h and harvested. The cell
pellet was resuspended in 200 µl medium and stained with PI at 1 µg/ml just before
measuring by flow cytometry. Samples were analyzed using FlowJo software (Tree Star Inc.,
Ashland, OR, USA). For quantification of apoptotic DNA fragmentation (Nicoletti assay) cells
were resuspended in Nicoletti buffer48 supplemented with 50 µg/ml PI for 12 h, subsequent
flow cytometric measurement of PI‐stained nuclei was performed. Phosphatidylserine
exposure during apoptosis was detected by annexin V assay. In short, 50 000 cells were
plated in a 24‐well plate and allowed to attach overnight. Cells were treated for 48 h and
harvested. The cell pellet was stained with annexin V‐APC and 7‐AAD for 15 min at RT,
subsequently flow cytometric measurement of annexin V and 7‐AAD was performed.
Mitochondrial membrane potential analysis.
Mitochondrial activity was measured with Mitotracker Orange CMTMRos. Treated cells
were incubated for 30 min with 25 nM Mitotracker Orange at 37 °C. After staining, cells
were washed and 7‐AAD was added followed by cytometric analysis.
As a second mitochondrial membrane potential assay, JC‐1 staining was used. Cells were
stained for 30 min at RT with 4 µM JC‐1. Depolarization was measured in FITC and PE
channel by flow cytometry.
LC3 fluorescence microscopy.
HeLa and MCF‐7 cells overexpressing LC3–GFP were cultured on Poly‐D‐lysine‐coated 24
mm diameter glass coverslips in six‐well plates and treated with BetA, rapamycin and CsA
for indicated time points and concentrations. The glass coverslips were mounted into a
chamber of the microscope for live‐cell imaging and Z‐stack measurements and placed in a
Leica DMI 6000 (TCS SP8) microscope (with adaptive focus, Motorized XY‐Stage and SuperZ
Galvo) and a case incubator at 37 °C. Samples were analyzed using Leica Las AF software.
Quantification was performed with Image J49 generating a cut‐off for the basal dispersed
LC3 fluorescence, allowing for the quantification of fluorescence in the concentrated areas
(LC3–GFP‐associated autophagosomes).

Chapter 2
68
Tandem fluorescence microscopy.
HeLa and A549 cells were transiently transfected with tandem fluorescent LC3 (mRFP–
eGFP–LC3, kindly provided by T Yoshimori30 using polyethylenimine (PEI) transfection
(Brunschwig, The Netherlands). 24 h after transfection cells were treated with 10 µg/ml
BetA or 10 µM rapamycin for 18 h. HeLa cells were transiently transfected with tandem
fluoresecent p62 (pDest‐mCherry‐EGFP‐p62, kindly provided by E Reits, AMC, The
Netherlands), using PEI transfection. Twenty‐four hours after transfection, cells were
treated with 10 µg/ml BetA or 10 µM rapamycin for 12 h.
Degradation of long‐lived proteins.
MCF‐7 cells were seeded in 12‐well plates. The next day cells were labeled with C‐14 valine
(0.2 µCi/ml). After 24 h, a cold chase using cell culture medium only was performed before
adding BetA or rapamycin for various time points. Supernatants and cells were collected
separately and both were precipitated for 30 min on ice in 10% TCA (trichloroacetic acid).
Precipitates were collected via centrifugation for 10 min at 10 000 r.p.m. and subsequently
dissolved in 0.5M NaOH. Radioactivity in supernatant and cell samples was measured and
the ratio determined. The relative degradation ratio in the control cells was set to ‘one’ and
compared with the degradation ratios in BetA and rapamycin‐treated samples.
Western blot analysis.
Cells were lysed in 1x RIPA lysis buffer (Thermo Fisher Scientific, Waltham, MA, USA)
containing complete proteinase inhibitor (Roche, Penzberg, Germany) and subjected to
protein quantification using a BCA kit (Pierce, Thermo Fisher Scientific, Waltham, MA, USA).
A quantity of 25 µg protein per lane was applied for SDS‐PAGE. Subsequent blotting was
performed using a PVDF membrane (Amersham Biosciences, Amersham, UK). Membranes
were blocked in 5% milk (blocking buffer) in TRIS phosphate‐buffered saline solution
containing TWEEN 20 (0.2%) (TBST‐T) for 1 h at room temperature. Primary antibody
incubations were performed in 1% milk/TBS‐T (LC3 antibody, tubulin antibody) or 5%
BSA/TBS‐T (ATG5 antibody, p62 antibody and ERK1/2 antibody) overnight at 4°C.
Membranes were washed three times and incubated in blocking buffer for 1 h with a
secondary HRP (horseradish peroxidase)‐labeled antibody (anti‐rabbit IgG (H+L) or anti‐
mouse IgG (H+L); Southern Biotech, Birmingham, AL, USA). For chemiluminescent
visualization, Lumi‐Light plus substrate (Roche, Penzberg, Germany) was used. Blots were
analyzed by ImageQuant LAS4000. Band intensities were quantified using Image J software
(NIH, Bethesda, MD, USA).
Statistical analysis.
Statistical analyses were performed with Prism 5 (GraphPad Software, La Jolla, CA, USA)
applying Student’s t‐test. Differences were considered significant with P‐values <0.05 (*),
<0.01 (**) and <0.001 (***).

Betulinic acid induces a rescue autophagy response
69
Conflict of Interest
The authors declare no conflict of interest.
Acknowledgements
We would like to thank G Kroemer (Institut Gustave Roussy, Villejuif, France) for the LC3–
GFP construct, N Mizushima (Department of Cell Biology, Okazaki, Japan) and M Komatsu
(Department of Molecular Oncology, Tokyo, Japan) for providing MEFs, SW Tait (Beatson
Institute, Institute of Cancer Sciences Glasgow, UK) for the plasmids. The microscopy images
were taken at the core facility Cellular Imaging/LCAM‐AMC. We would like to thank DI
Picavet for technical assistance, furthermore MF Bijlsma for his valuable scientific input and
helpful discussions. This work was supported by a grant of the Stichting Nationaal Fonds
tegen Kanker (SNFK), Amsterdam, The Netherlands.

Chapter 2
70
References 1. Ehrhardt H, Fulda S, Fuhrer M, Debatin KM, Jeremias I. Betulinic acid‐induced apoptosis in leukemia cells. Leukemia 2004; 18: 1406–1412. 2. Rzeski W, Stepulak A, Szymanski M, Sifringer M, Kaczor J, Wejksza K et al. Betulinic acid decreases expression of bcl‐2 and cyclin D1, inhibits proliferation, migration and induces apoptosis in cancer cells. Naunyn Schmiedebergs Arch Pharmacol 2006; 374: 11–20. 3. Jung GR, Kim KJ, Choi CH, Lee TB, Han SI, Han HK et al. Effect of betulinic acid on anticancer drug‐resistant colon cancer cells. Basic Clin Pharmacol Toxicol 2007; 101: 277–285. 4. Kessler JH, Mullauer FB, de Roo GM, Medema JP. Broad in vitro efficacy of plant‐derived betulinic acid against cell lines derived from the most prevalent human cancer types. Cancer Lett 2007; 251: 132–145. 5. Fulda S, Friesen C, Los M, Scaffidi C, Mier W, Benedict M et al. Betulinic acid triggers CD95 (APO‐1/Fas)‐ and p53‐independent apoptosis via activation of caspases in neuroectodermal tumors. Cancer Res 1997; 57: 4956–4964. 6. Fulda S, Susin SA, Kroemer G, Debatin KM. Molecular ordering of apoptosis induced by anticancer drugs in neuroblastoma cells. Cancer Res 1998; 58: 4453–4460. 7. Fulda S, Scaffidi C, Susin SA, Krammer PH, Kroemer G, Peter ME et al. Activation of mitochondria and release of mitochondrial apoptogenic factors by betulinic acid. J Biol Chem 1998; 273: 33942–33948. 8. Mullauer FB, Kessler JH, Medema JP. Betulinic acid induces cytochrome c release and apoptosis in a Bax/Bak‐independent, permeability transition pore dependent fashion. Apoptosis 2009; 14: 191–202.
9. Vandenabeele P, Vanden Berghe T, Festjens N. Caspase inhibitors promote alternative cell death pathways. Sci STKE 2006; 2006: e44. 10. Vandenabeele P, Galluzzi L, Vanden Berghe T, Kroemer G. Molecular mechanisms of necroptosis: an ordered cellular explosion. Nat Rev Mol Cell Biol 2010; 11: 700–714. 11. Tenev T, Bianchi K, Darding M, Broemer M, Langlais C, Wallberg F et al. The Ripoptosome, a signaling platform that assembles in response to genotoxic stress and loss of IAPs. Mol Cell 2011; 43: 432–448. 12. Degterev A, Huang Z, Boyce M, Li Y, Jagtap P, Mizushima N et al. Chemical inhibitor of nonapoptotic cell death with therapeutic potential for ischemic brain injury. Nat Chem Biol 2005; 1: 112–119. 13. Degterev A, Hitomi J, Germscheid M, Ch’en IL, Korkina O, Teng X et al. Identification of RIP1 kinase as a specific cellular target of necrostatins. Nat Chem Biol 2008; 4: 313–321. 14. Aits S, Jaattela M. Lysosomal cell death at a glance. J Cell Sci 2013; 126(Pt 9): 1905–1912. 15. Parzych KR, Klionsky DJ. An Overview of Autophagy: Morphology, Mechanism, and Regulation. Antioxid Redox Signal 2014; 20: 460–473. 16. Saeki K, Yuo A, Okuma E, Yazaki Y, Susin SA, Kroemer G et al. Bcl‐2 down‐regulation causes autophagy in a caspase‐independent manner in human leukemic HL60 cells. Cell Death Differ 2000; 7: 1263–1269. 17. Baehrecke EH. Autophagy: dual roles in life and death? Nat Rev Mol Cell Biol 2005; 6: 505–510. 18. Chen N, Karantza V. Autophagy as a therapeutic target in cancer. Cancer Biol Ther 2011; 11: 157–168. 19. Weidberg H, Shvets E, Elazar Z. Biogenesis and cargo selectivity of autophagosomes. Annu Rev Biochem 2011; 80: 125–156.

Betulinic acid induces a rescue autophagy response
71
20. Lee J, Giordano S, Zhang J. Autophagy, mitochondria, and oxidative stress: cross‐talk and redox signalling. Biochem J 2012; 441: 523–540. 21. Till A, Lakhani R, Burnett SF, Subramani S. Pexophagy: the selective degradation of peroxisomes. Int J Cell Biol 2012; 2012: 512721. 22. Kim I, Rodriguez‐Enriquez S, Lemasters JJ. Selective degradation of mitochondria by mitophagy. Arch Biochem Biophys 2007; 462: 245–253. 23. Gonzalez P, Mader I, Tchoghandjian A, Enzenmuller S, Cristofanon S, Basit F et al. Impairment of lysosomal integrity by B10, a glycosylated derivative of betulinic acid, leads to lysosomal cell death and converts autophagy into a detrimental process. Cell Death Differ 2012; 19: 1337–1346. 24. Yang LJ, Chen Y, He J, Yi S, Wen L, Zhao J et al. Betulinic acid inhibits autophagic flux and induces apoptosis in human multiple myeloma cells in vitro. Acta Pharmacol Sin 2012; 33: 1542–1548. 25. Mizushima N. Methods for monitoring autophagy. Int J Biochem Cell Biol 2004; 36: 2491–2502. 26. Mizushima N, Yoshimori T. How to interpret LC3 immunoblotting. Autophagy 2007; 3: 542–545. 27. Klionsky DJ, Abeliovich H, Agostinis P, Agrawal DK, Aliev G, Askew DS et al. Guidelines for the use and interpretation of assays for monitoring autophagy in higher eukaryotes. Autophagy 2008; 4: 151–175. 28. Klionsky DJ, Abdalla FC, Abeliovich H, Abraham RT, Acevedo‐Arozena A, Adeli K et al. Guidelines for the use and interpretation of assays for monitoring autophagy. Autophagy 2012; 8: 445–544. 29. Mortimore GE, Poso AR. Intracellular protein catabolism and its control during
nutrient deprivation and supply. Annu Rev Nutr 1987; 7: 539–564. 30. Kimura S, Noda T, Yoshimori T. Dissection of the autophagosome maturation process by a novel reporter protein, tandem fluorescent‐tagged LC3. Autophagy 2007; 3: 452–460. 31. Scorrano L, Ashiya M, Buttle K, Weiler S, Oakes SA, Mannella CA et al. A distinct pathway remodels mitochondrial cristae and mobilizes cytochrome c during apoptosis. Dev Cel 2002; 2: 55–67. 32. Newmeyer DD, Ferguson‐Miller S. Mitochondria: releasing power for life and unleashing the machineries of death. Cell 2003; 112: 481–490. 33. Tsujimoto Y, Shimizu S. Role of the mitochondrial membrane permeability transition in cell death. Apoptosis 2007; 12: 835–840. 34. Galluzzi L, Vicencio JM, Kepp O, Tasdemir E, Maiuri MC, Kroemer G. To die or not to die:that is the autophagic question. Curr Mol Med 2008; 8: 78–91. 35. Komatsu M, Waguri S, Ueno T, Iwata J, Murata S, Tanida I et al. Impairment of starvationinduced and constitutive autophagy in Atg7‐deficient mice. J Cell Biol 2005; 169: 425–434. 36. Kuma A, Hatano M, Matsui M, Yamamoto A, Nakaya H, Yoshimori T et al. The role of autophagy during the early neonatal starvation period. Nature 2004; 432: 1032–1036. 37. Petersen NH, Olsen OD, Groth‐Pedersen L, Ellegaard AM, Bilgin M, Redmer S et al. Transformation‐associated changes in sphingolipid metabolism sensitize cells to lysosomal cell death induced by inhibitors of Acid sphingomyelinase. Cancer Cell 2013; 24: 379–393.

Chapter 2
72
38. Brunk UT, Neuzil J, Eaton JW. Lysosomal involvement in apoptosis. Redox Rep 2001; 6: 91–97. 39. Leist M, Jaattela M. Four deaths and a funeral: from caspases to alternative mechanisms. Nat Rev Mol Cell Biol 2001; 2: 589–598. 40. Guicciardi ME, Leist M, Gores GJ. Lysosomes in cell death. Oncogene 2004; 23: 2881–2890. 41. Kroemer G, Jaattela M. Lysosomes and autophagy in cell death control. Nat Rev Cancer 2005; 5: 886–897. 42. Boya P, Kroemer G. Lysosomal membrane permeabilization in cell death. Oncogene 2008; 27: 6434–6451. 43. Groth‐Pedersen L, Jaattela M. Combating apoptosis and multidrug resistant cancers by targeting lysosomes. Cancer Lett 2013; 332: 265–274. 44. Elmore SP, Qian T, Grissom SF, Lemasters JJ. The mitochondrial permeability transition initiates autophagy in rat hepatocytes. FASEB J 2001; 15: 2286–2287. 45. Rodriguez‐Enriquez S, He L, Lemasters JJ. Role of mitochondrial permeability transition pores in mitochondrial autophagy. Int J Biochem Cell Biol 2004; 36: 2463–2472. 46. Hoyer‐Hansen M, Bastholm L, Szyniarowski P, Campanella M, Szabadkai G, Farkas T et al Control ofmacroautophagy by calcium, calmodulin‐dependent kinase kinase‐beta, and Bcl‐2. Mol Cell 2007; 25: 193–205. 47. Colell A, Ricci JE, Tait S, Milasta S, Maurer U, Bouchier‐Hayes L et al. GAPDH and autophagy preserve survival after apoptotic cytochrome c release in the absence of caspase activation. Cell 2007; 129: 983–997. 48. Nicoletti I, Migliorati G, Pagliacci MC, Grignani F, Riccardi C. A rapid and simple
method for measuring thymocyte apoptosis by propidium iodide staining and flow cytometry. J Immunol Methods 1991; 139: 271–279. 49. Hoogendijk AJ, Roelofs JJ, Duitman J, van Lieshout MH, Blok DC, van der Poll T et al. R‐roscovitine reduces lung inflammation induced by lipoteichoic acid and Streptococcus pneumoniae. Mol Med 2012; 18: 1086–1095.

Betulinic acid induces a rescue autophagy response
73
Supplementary figures
Supplementary Figure 1. BetA induces cell death in a concentration dependent fashion. HeLa cells were
treated for 48 hours with indicated concentrations of BetA after which cell death was assessed by PI
exclusion.
Supplementary Figure 2. Necrostatin blocks TNF‐induced necroptosis. U937 cells were pre‐treated with or
without 10 µM zVAD.fmk and with or without 25 µM necrostatin‐1 for one hour and subjected to 40 ng/ml
TNF‐α for 48 h after which cell death was assessed through PI exclusion. Mean + S.D. of three indendent
experiments are shown, ***P<0.001.
0
20
40
60
80
100
% P
Ipos
0 5 7.5 10
μg/ml BetA
***
***%
PIpo
s
Q-VD-OPh--
-+
+
- --
-
necrostatin - - ++
++
++
TNF-α
***
0
20
40
60
+
***

Chapter 2
74
Supplementary Figure 3. BetA induces autophagy and autophagic flux. HeLa cells were treated with (a)
indicated concentrations of BetA for 18 hours or (b) indicated time points. LC3 processing was assessed via
immunoblotting. Results for endogenous LC3 are shown. LC3 I (18 kDa) and LC3 II (16 kDa). Tubulin is used
as a control. Band intensity of western blot was quantified using Image J software. Mean + S.D. of three
independent experiments are shown, *P < 0.05; **P< 0.01; ***P<0.001; n.s., not significant. (c) HeLa cells
were pre‐treated for 1 hour with 10 µg/ml cycloheximide followed by 48 h of BetA treatment. P62 levels
were determined via western blot. ERK1/2 is used as a control. Band intensity was quantified using Image J
software. Single experiment is shown. (d) HeLa cells and A549 cells with tandem fluorescent P62 (pDest‐
mCherry‐EGFP‐p62) were treated with 10 µg/ml BetA or 10 µM rapamycin and after 18 h cells were analyzed
by confocal microscopy. Representative pictures are shown of three experiments.
a
LC3 I
LC3 II
Tubulin
0 5 7.5 10 μg/ml BetA2.5 - + - + - + μg/ml BetA6h 12h 18h
b
LC3 I
LC3 II
Tubulin
0
1
2
3
LC
3 I
I /
LC
3 I
μg/ml BetA0 5 7.5 102.50
2.5
5
LC
3 I
I /
LC
3 I
- + - + - + μg/ml BetA6h 12h 18h
nsns
*****
ns * *
c
DMSO rapamycinBetA
0 µm 10 0 µm 10 0 µm 10
0 µm 10 0 µm 10 0 µm 10
0 25µm 0 25µm 0 25µm
HeL
aA
549
d
0
1
2
rel. p
62
p62
Erk1/2
rapamycin-- -
++
- --
-cycloheximide - -+
+ +
+BetA
+- -

Betulinic acid induces a rescue autophagy response
75
Supplementary Figure 4. ATG deficiency results in increased BetA‐induced cell death (a) Knockdown of
ATG5 in HeLa, HeLa\LC3‐GFP and MCF‐7\LC3‐GFP cells with shRNA control, shRNA ATG5 #1 and shRNA ATG5
#3 was assessed via immunoblotting. (b) MCF‐7\LC3‐GFP cells with ATG5 knockdown #1 and #2 and control
cells were subjected to different concentrations of BetA. After 48 h after cell death was measured via PI
exclusion and DNA fragmentation was assessed. Mean + S.D. of three independent experiments are shown.
(c) Mouse embryonic fibroblasts lacking either AtTG5 or ATG7 and their respective control cells were
subjected to different concentrations of BetA for 18 h and phosphatidylserine (PS) exposure was measured.
Mean + S.D. of three independent experiments are shown.
a
+
+-
-control
ATG5 #2
Atg5
level ATG5
ATG5 #1
+
++
+
--
- --
- -
- --
HeLaMCF-7LC3-GFP
HeLaLC3-GFP
+
++
-- -
- --
1.00 0.28 0.22 0.251.00 1.000.14 0.42 0.29
controlshRNAATG5 #1shRNAATG5 #2
0 5 10 150
20
40
60
80
100
BetA (µg/ml) BetA (µg/ml)0 5 10 15
0
10
20
30
40
50
% D
NA
fra
gmen
tatio
nb
c
% P
Ipos
BetA (µg/ml) BetA (µg/ml)
controlshRNAATG5 #1shRNAATG5 #2
0
20
40
60
80
100
% A
nnex
in V
pos
0 5 10 15 20 0 5 10 15 200
20
40
60
80
100
% A
nnex
in V
pos
wtAtg5 -/-
Atg7 +/-Atg7 -/-


![Autophagy Precedes Apoptosis in Angiotensin II-Induced ... · apoptosis [10, 11]. Many stimuli can cause simultaneous apoptosis and autophagy. Ang II induces autophagy, which is further](https://img.pdfslide.us/doc/110x75/5f027da77e708231d4048618/autophagy-precedes-apoptosis-in-angiotensin-ii-induced-apoptosis-10-11-many.jpg)