Embed Size (px)
Citation preview
UvA-DARE is a service provided by the library of the University of Amsterdam (http://dare.uva.nl)
UvA-DARE (Digital Academic Repository)
Functional and immunological studies in children with chronic renal failure: the effectsof uremia and dialysis treatmentBouts, A.H.M.
Link to publication
Citation for published version (APA):Bouts, A. H. M. (2001). Functional and immunological studies in children with chronic renal failure: the effects ofuremia and dialysis treatment
General rightsIt is not permitted to download or to forward/distribute the text or part of it without the consent of the author(s) and/or copyright holder(s),other than for strictly personal, individual use, unless the work is under an open content license (like Creative Commons).
Disclaimer/Complaints regulationsIf you believe that digital publication of certain material infringes any of your rights or (privacy) interests, please let the Library know, statingyour reasons. In case of a legitimate complaint, the Library will make the material inaccessible and/or remove it from the website. Please Askthe Library: http://uba.uva.nl/en/contact, or a letter to: Library of the University of Amsterdam, Secretariat, Singel 425, 1012 WP Amsterdam,The Netherlands. You will be contacted as soon as possible.
Download date: 02 Dec 2018
Chapterr 2
Standar dd peritonea l permeabilit y analysi s in children .
Antoniaa HM Bouts1, Jean-Claude Davin1, Jaap W Groothoff1, Sjoerdd Ploos van Amstel1, Machteld Zweers2, Raymond T Krediet2.
11 Emma Children's Hospital and2 Department of Nephrology, Academic Medical Center,, University of Amsterdam, Amsterdam, The Netherlands.
Journall of the American Society of Nephrology 2000; 11:943-950.
Chapterr 2
ABSTRAC T T Peritoneall transport characteristics in children on peritoneal dialysis (PD) has been
reportedd to be different compared to adults. However, various test methods can influence
thiss difference. Thirty-one standard peritoneal permeability analyses (SPA) were performed
inn 18 PD children with a median (range) age of 9.8 yr (2 to 19) and a median duration of PD
off 2.6 yr (0.19 to 6.8).
Thee median mass transfer area coefficient (MTAC) for creatinine was 9.6
ml/min/1.733 m2 (4.4 to 18.0), and for urea 17.3 ml/min/1.73 m2 (12.2 to 22.8). The median
dialysatee to plasma creatinine ratio (D/Pa) was 0.69 (0.44 to 0.92), the glucose absorption
59%% (23 to 75) and the D/DQ for glucose 0.38 (0.23 to 0.62). The median clearance of p2-
microglobulinn was 923 ul/min/1.73 m2 (366 to 1828), of albumin 103 ul/min/1.73 m2 (55 to
211),, of IgG 48 ul/min/1.73 m2 (20 to 105) and of a2-macroglobulin 12 ul/min/1.73 m2 (5 to
49).. No correlation was found between these results and age or PD time. The restriction
coefficientt for macromolecules indeed increased with duration of PD treatment (r = 0.38, P =
0.03).. The median transcapillary ultrafiltration rate was 1.2 ml/min/1.73 m2 (-0.01 to 2.8), the
nett ultrafiltration rate 0.2 ml/min/1.73 m2 (-1.97 to 1.82) and the effective lymphatic
absorptionn rate 1.04 ml/min/1.73 m2 (-0.06 to 2.91).
Whenn corrected for body surface area, no differences were found in peritoneal fluid
andd solute transport characteristics between children and adults. No effect of time on PD on
thee transport parameters was found in a cross-sectional analysis, except for an increase of
thee restriction coefficient to macromolecules. This finding is similar to observations in adults.
Therefore,, the present study showed no evidence for the common belief that the peritoneal
membranee in children is different from that in adult patients.
34 4
Peritoneall permeability
INTRODUCTION N
Thee assessment of peritoneal transport characteristics in children treated with chronicc peritoneal dialysis <PD) is mostly done by the peritoneal equilibration test (PET), developedd by Twardowski etal. [1]. Through standardization of this test, adult patients could bee categorized into low, low-average, high-average and high transporters according to their peritoneall solute transport results [2]. More recently, the standard peritoneal permeability analysiss (SPA) has been described by our group in adult patients [3]. In this modification and extensionn of the PET, the transport of low molecular weight solutes is expressed as mass transferr area coefficients (MTAC), instead of dialysate to plasma (D/P) ratios. Furthermore, peritoneall fluid kinetics during the dwell are determined using intraperitoneal^ administered dextrann 70, and the peritoneal clearances of various serum proteins are calculated. These aree used to compute the restriction coefficient (RC), which represents the intrinsic permeabilityy of the peritoneal membrane. It appeared that MTAC had a better discriminative powerr than D/P ratios, especially in the extreme ranges [3]. Furthermore, the MTAC was not influencedd by the tonicity of the dialysis fluids [4], and also not by the dialysate volume, e.g., 22 or 3 L [5]. Possible differences in peritoneal transport between children and adults have beenn discussed by many authors. Some authors described higher D/P ratios of small solutes duringg a PET in children than adults [6-8] and also higher D/P ratios in younger infants than inn older children [6,7]. However, others were not able to confirm this [9,10]. These conflicting resultss are likely to be caused by differences in standardization of the instilled volume, either perr kilogram body weight or per square meter body surface area [11]. The results of MTAC measurementss in children have not been reported frequently. Warady et al. found higher MTACC in younger infants compared to older children [9], but Geary et al. described the oppositee [12]. The aim of the present study was to establish normal values of the SPA in children,, to compare MTAC of low molecular weight solutes with D/P ratios, and to compare thee results obtained in children with those in adult peritoneal dialysis patients.
MATERIAL SS AND METHODS Thirty-onee SPA were performed in 18 children on PD. Their age ranged from 2
to199 yr with a median of 9.8 yr. The median length of duration of PD treatment was 2.6 yr (range,, 0.2 to 6.8). SPA were done routinely, every year, on a voluntary basis. The first SPA wass performed 2 to 6 months after the initiation of dialysis. In one patient, an extra test was donee because of electrolyte disturbances. In 9 children only one SPA was performed, in 6 two,, in 2 three and in 1 four tests (Table 1). None of the patients had peritonitis at the day of thee test or in the 4 preceeding weeks. The mean peritonitis incidence, defined as number of episodess per patient year, was 0.8 (Table 1). The results of 138 SPA performed in 86 adult patientss with a median age of 51 yr (range, 21 to 80 yr) and a median duration of PD treatmentt of 2.1 yr (range, 0.33 to13.5 yr) were used to compare with those in children.
35 5
Chapterr 2
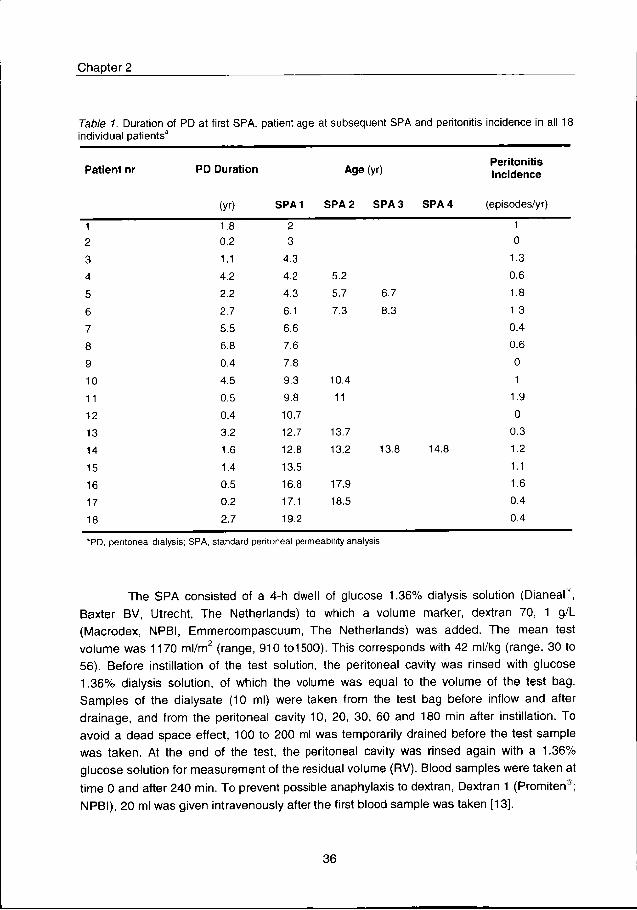
TableTable 1. Duration of PD at first SPA, patient age at subsequent SPA and peritonitis incidence in all 18 individuall patients*
Patien tt nr PDD Duratio n Agee (yr) Peritoniti s s Incidenc e e
(yr) ) SPA1 1 SPAA 2 SPA 3 SPA 4 (episodes/yr) )
1 1 2 2 3 3 4 4 5 5
6 6 7 7 8 8
9 9
10 0
11 1
12 2
13 3
14 4
15 5
16 6
17 7
18 8
1.8 8 0.2 2
1.1 1
4.2 2
2.2 2
2.7 7
5.5 5
6.8 8
0.4 4
4.5 5
0.5 5
0.4 4
3.2 2
1.6 6
1.4 4
0.5 5
0.2 2
2.7 7
2 2 3 3
4.3 3
4.2 2
4.3 3
6.1 1
6.6 6
7.6 6
7.8 8
9.3 3
9.8 8
10.7 7
12.7 7
12.8 8
13.5 5
16.8 8
17.1 1
19.2 2
5.2 2
5.7 7
7.3 3
10.4 4
11 1
13.7 7
13.2 2
17.9 9
18.5 5
6.7 7
8.3 3
13.É É 14.8 8
1 1
0 0
1.3 3 0.6 6 1.8 8 1.3 3 0.4 4 0.6 6 0 0 1 1
1.9 9 0 0
0.3 3 1.2 2 1.1 1 1.6 6 0.4 4 0.4 4
aPD,, peritoneal dialysis; SPA, standard peritoneal permeability analysis
Thee SPA consisted of a 4-h dwell of glucose 1.36% dialysis solution (DianeaP, Baxterr BV, Utrecht, The Netherlands) to which a volume marker, dextran 70, 1 g/L (Macrodex,, NPBI, Emmercompascuum, The Netherlands) was added. The mean test volumee was 1170 ml/m2 (range, 910 to1500). This corresponds with 42 ml/kg (range, 30 to 56).. Before instillation of the test solution, the peritoneal cavity was rinsed with glucose 1.36%% dialysis solution, of which the volume was equal to the volume of the test bag. Sampless of the dialysate (10 ml) were taken from the test bag before inflow and after drainage,, and from the peritoneal cavity 10, 20, 30, 60 and 180 min after instillation. To avoidd a dead space effect, 100 to 200 ml was temporarily drained before the test sample wass taken. At the end of the test, the peritoneal cavity was rinsed again with a 1.36% glucosee solution for measurement of the residual volume (RV). Blood samples were taken at timee 0 and after 240 min. To prevent possible anaphylaxis to dextran, Dextran 1 (Promiten®; NPBI),, 20 ml was given intravenously after the first blood sample was taken [13].
36 6
Peritoneall permeability
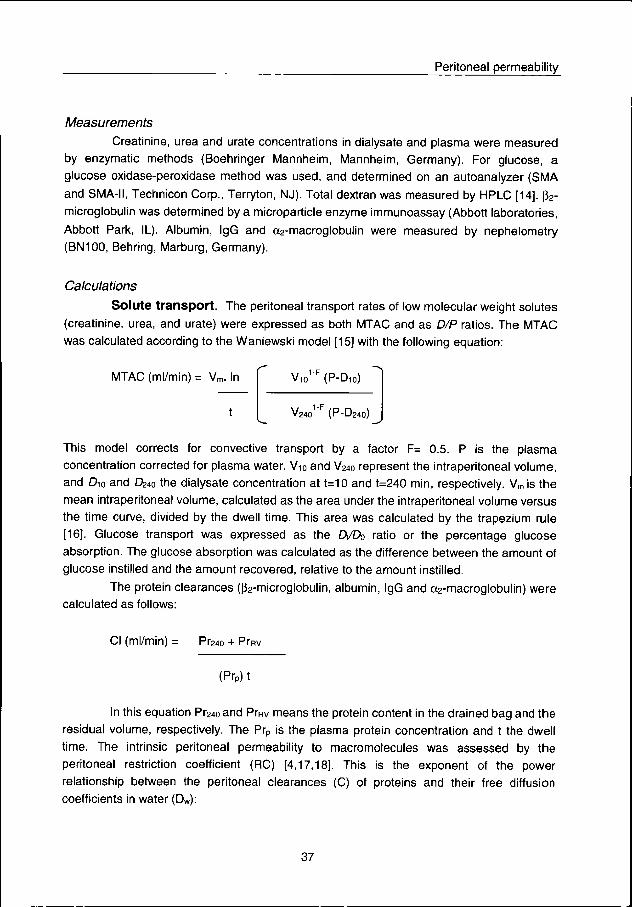
Measurements Measurements
Creatinine,, urea and urate concentrations in dialysate and plasma were measured
byy enzymatic methods (Boehringer Mannheim, Mannheim, Germany). For glucose, a
glucosee oxidase-peroxidase method was used, and determined on an autoanalyzer (SMA
andd SMA-II, Technicon Corp., Terryton, NJ). Total dextran was measured by HPLC [14]. pV
microglobulinn was determined by a microparticle enzyme immunoassay (Abbott laboratories,
Abbottt Park, IL). Albumin, IgG and a2-macroglobulin were measured by nephelometry
(BN100,, Behring, Marburg, Germany).
Calculations Calculations
Solut ee transport . The peritoneal transport rates of low molecular weight solutes (creatinine,, urea, and urate) were expressed as both MTAC and as D/P ratios. The MTAC wass calculated according to the Waniewski model [15] with the following equation:
MTACC (ml/min) = Vm. In
t t
Thiss model corrects for convective transport by a factor F= 0.5. P is the plasma concentrationn corrected for plasma water. V10 and V24o represent the intraperitoneal volume, andd D10 and Q240 the dialysate concentration at t=10 and t=240 min, respectively. Vm is the meann intraperitoneal volume, calculated as the area under the intraperitoneal volume versus thee time curve, divided by the dwell time. This area was calculated by the trapezium rule [16].. Glucose transport was expressed as the Dt/Do ratio or the percentage glucose absorption.. The glucose absorption was calculated as the difference between the amount of glucosee instilled and the amount recovered, relative to the amount instilled.
Thee protein clearances ^-microglobulin, albumin, IgG and oc2-macroglobulin) were calculatedd as follows:
CII (ml/min) = Pr24o + Ptev
(PrP)) t
Inn this equation Pr24oand PrRV means the protein content in the drained bag and the residuall volume, respectively. The Prp is the plasma protein concentration and t the dwell time.. The intrinsic peritoneal permeability to macromolecules was assessed by the peritoneall restriction coefficient (RC) [4,17,18]. This is the exponent of the power relationshipp between the peritoneal clearances (C) of proteins and their free diffusion coefficientss in water (Dw):
Vio1"FF (P-D10)
V24o1"FF (P-D240)
37 7
Chapterr 2
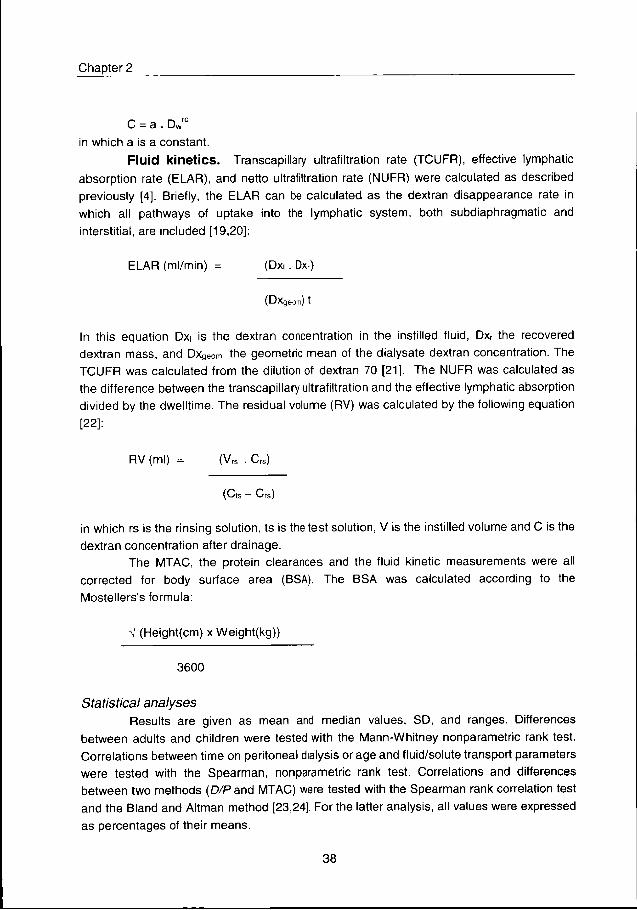
CC = a . Dwrc
inn which a is a constant.
Flui dd kinetics . Transcapillary ultrafiltration rate (TCUFR), effective lymphatic
absorptionn rate (ELAR), and netto ultrafiltration rate (NUFR) were calculated as described
previouslyy [4]. Briefly, the ELAR can be calculated as the dextran disappearance rate in
whichh all pathways of uptake into the lymphatic system, both subdiaphragmatic and
interstitial,, are included [19,20]:
ELARR (ml/min) = (Dxi . Dxr)
(UXgeom)) t
Inn this equation Dxi is the dextran concentration in the instilled fluid, Dxr the recovered
dextrann mass, and Dxge0m the geometric mean of the dialysate dextran concentration. The
TCUFRR was calculated from the dilution of dextran 70 [21]. The NUFR was calculated as
thee difference between the transcapillary ultrafiltration and the effective lymphatic absorption
dividedd by the dwelltime. The residual volume (RV) was calculated by the following equation
[22]: :
RVV (ml ) = (Vrs Crs)
(Ctss — Crs)
inn which rs is the rinsing solution, ts is the test solution, V is the instilled volume and C is the dextrann concentration after drainage.
Thee MTAC, the protein clearances and the fluid kinetic measurements were all correctedd for body surface area (BSA). The BSA was calculated according to the Mostellers'ss formula:
VV (Height(cm) x Weight(kg))
3600 0
StatisticalStatistical analyses Resultss are given as mean and median values, SD, and ranges. Differences
betweenn adults and children were tested with the Mann-Whitney nonparametric rank test. Correlationss between time on peritoneal dialysis or age and fluid/solute transport parameters weree tested with the Spearman, nonparametric rank test. Correlations and differences betweenn two methods {D/P and MTAC) were tested with the Spearman rank correlation test andd the Bland and Altman method [23,24], For the latter analysis, all values were expressed ass percentages of their means.
38 8
Peritoneall permeability
RESULTS S
SoluteSolute transport
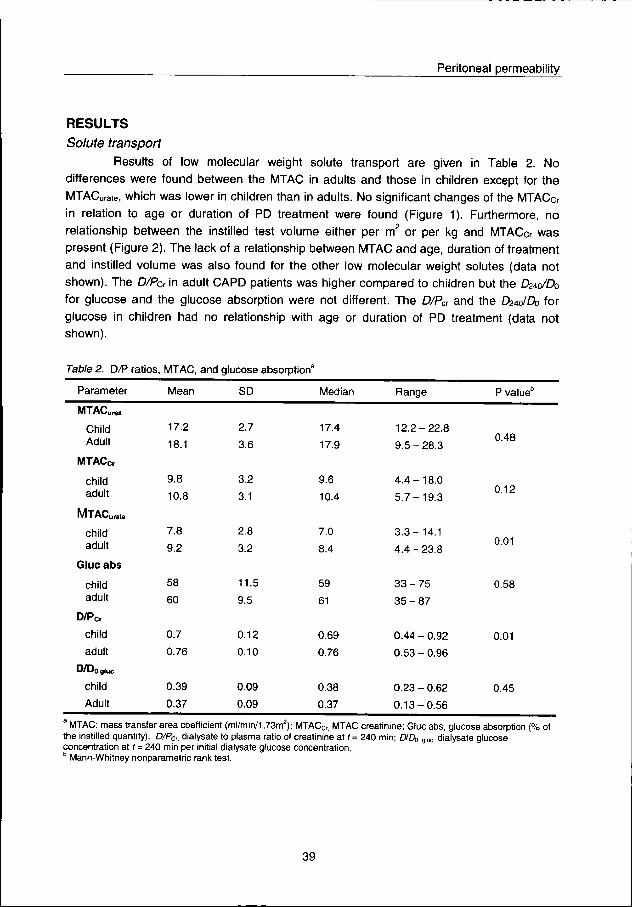
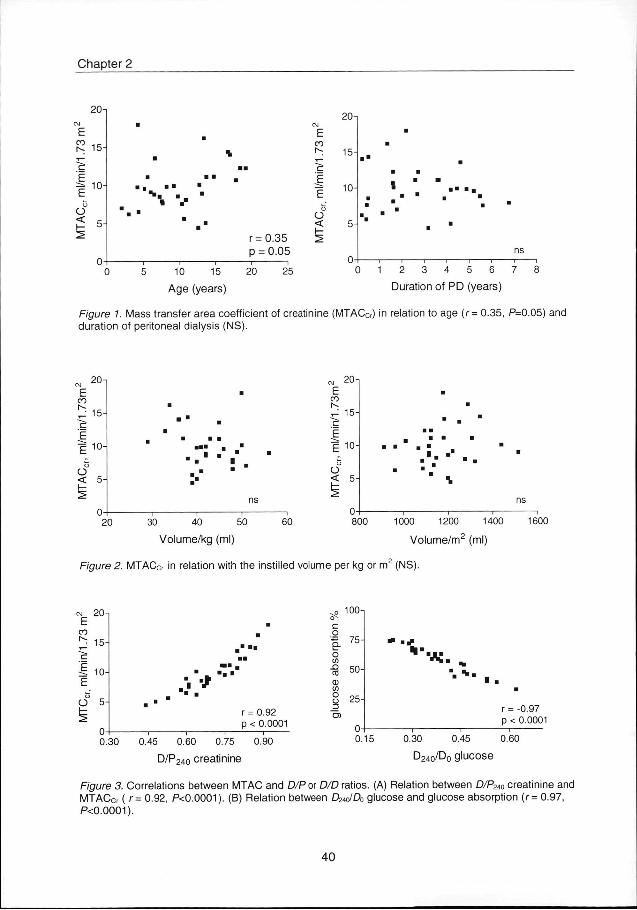
Resultss of low molecular weight solute transport are given in Table 2. No differencess were found between the MTAC in adults and those in children except for the MTACurate,, which was lower in children than in adults. No significant changes of the MTACcr inn relation to age or duration of PD treatment were found (Figure 1). Furthermore, no relationshipp between the instilled test volume either per m2 or per kg and MTACcr was presentt (Figure 2). The lack of a relationship between MTAC and age, duration of treatment andd instilled volume was also found for the other low molecular weight solutes (data not shown).. The D/Pcr in adult CAPD patients was higher compared to children but the CWDb forr glucose and the glucose absorption were not different. The D/Pcr and the DWDb for glucosee in children had no relationship with age or duration of PD treatment (data not shown). .
TableTable 2. D/P ratios, MTAC, and glucose absorption8
Parameter r
MTACur w w
Child d Adult t
MTACcr r
child d adult t
MTACurate e
child d adult t
Glu ee ab s
child d adult t
D/Pcr r
child d
adult t
D/D0glUc c
child d
Adult t
Mean n
17.2 2
18.1 1
9.8 8
10.8 8
7.8 8
9.2 2
58 8
60 0
0.7 7
0.76 6
0.39 9
0.37 7
SD D
2.7 7
3.6 6
3.2 2
3.1 1
2.8 8
3.2 2
11.5 5
9.5 5
0.12 2
0.10 0
0.09 9
0.09 9
Median n
17.4 4
17.9 9
9.6 6
10.4 4
7.0 0
8.4 4
59 9
61 1
0.69 9
0.76 6
0.38 8
0.37 7
Range e
1 2 . 2 - 2 2 . 8 8
9 . 5 - 2 8 . 3 3
4 . 4 - 1 8 . 0 0
5 . 7 - 1 9 . 3 3
3 . 3 - 1 4 . 1 1
4 . 4 - 2 3 . 8 8
3 3 - 7 5 5
3 5 - 8 7 7
0.444 - 0.92
0.533 - 0.96
0 . 2 3 - 0 . 6 2 2
0 . 1 3 - 0 . 5 6 6
PP value"
0.48 8
0.12 2
0.01 1
0.58 8
0.01 1
0.45 5
MTAC:: mass transfer area coefficient (ml/min/1,73m2); MTACCr, MTAC creatinine; Glue abs, glucose absorption (% of thee instilled quantity); D/PCr, dialysate to plasma ratio of creatinine at t = 240 min; D/D0 g iuc . dialysate glucose concentrationn at f = 240 min per initial dialysate glucose concentration. bb Mann-Whitney nonparametric rank test.
39 9
Chapterr 2
20 0
[ ^ 15 T T
c c
1 , 0 0
< < 5--
% %
100 15
Agee (years)
I B B
r=0.35 5 pp = 0.05
200 25
co o
E_ _ E E
< < h--2 2
20 0
15 5
^^ 10-
FigureFigure 1 duration n
22 3 4 5 6 7
Durationn of PD (years)
Masss transfer area coefficient of creatinine (MTACCr) in relation to age (r = 0.35, P=0.05) and off peritoneal dialysis (NS).
F F CO O
r*-- . -^^ IS -C' '
E E EE l u " c c
o o << 5-
^ ^ 0--
""
"" I .
ns s 11 1 1
200 30 40 50
Volume/kgg (ml)
60 0
E E CO O K K ^^ lo-ir r E E EE 10-
O O
o o << 5-
^ ^ 0--
.. -
"" i
ns s ii 1
8000 1000 1200 1400
Volume/m22 (ml)
1600 0
FigureFigure 2. MTACCr in relation with the instilled volume per kg or m (NS).
co o
1 1 Ö Ö
o o
u--
5--
0--
5--
0--
* * rr = 0.92 pp < 0.0001
oo 100
o o n n o o c/ l l
CO O (1) )
</) ) Ü Ü
_J J
lb-lb-
50--
25--
0.15 5
** # H" H"
0.30 0
" " * m ".. * .
0.45 5
rr = -0.97 pp < 0.0001
0.60 0
D24o/D00 glucose 0.300 0.45 0.60 0.75 0.90
D/P2400 creatinine
FigureFigure 3. Correlations between MTAC and D/P or D/D ratios. (A) Relation between D/P24o creatinine and MTACcrr ( r= 0.92, P<0.0001). (B) Relation between D24olD0 glucose and glucose absorption (r= 0.97, P<0.0001). .
40 0
Peritoneall permeability
ComparisonComparison of MTAC and D/P or D/D0 ratios
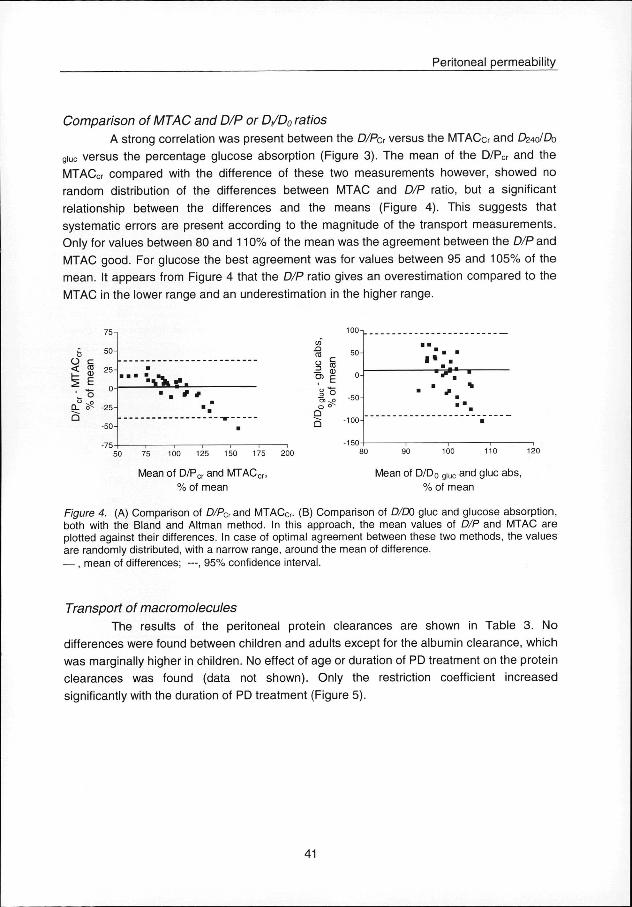
AA strong correlation was present between the D/Pcr versus the MTACcr and CWDo giucc versus the percentage glucose absorption (Figure 3). The mean of the D/PCr and the MTACcrr compared with the difference of these two measurements however, showed no randomm distribution of the differences between MTAC and D/P ratio, but a significant relationshipp between the differences and the means (Figure 4). This suggests that systematicc errors are present according to the magnitude of the transport measurements. Onlyy for values between 80 and 110% of the mean was the agreement between the D/P and MTACC good. For glucose the best agreement was for values between 95 and 105% of the mean.. It appears from Figure 4 that the D/P ratio gives an overestimation compared to the MTACC in the lower range and an underestimation in the higher range.
<< 03
ii E '' "o
„ ^CLL o^
755 n
50 0
25--
0 0
-25--
-50 0
-75 5
-
** *
to o
to o oo § —— tu O)) E
== "oo 5"
Q Q
-50 0
-100 0
I * *
^r ^r
50 0
Meann of D/Pcr and MTACC
%% of mean Meann of D/D0 g i u c and glue abs,
%% of mean
FigureFigure 4. (A) Comparison of D/PCr and MTACCr. (B) Comparison of D/D0 glue and glucose absorption, bothh with the Bland and Altman method. In this approach, the mean values of D/P and MTAC are plottedd against their differences. In case of optimal agreement between these two methods, the values aree randomly distributed, with a narrow range, around the mean of difference. —— , mean of differences; —, 95% confidence interval.
TransportTransport of macromolecules
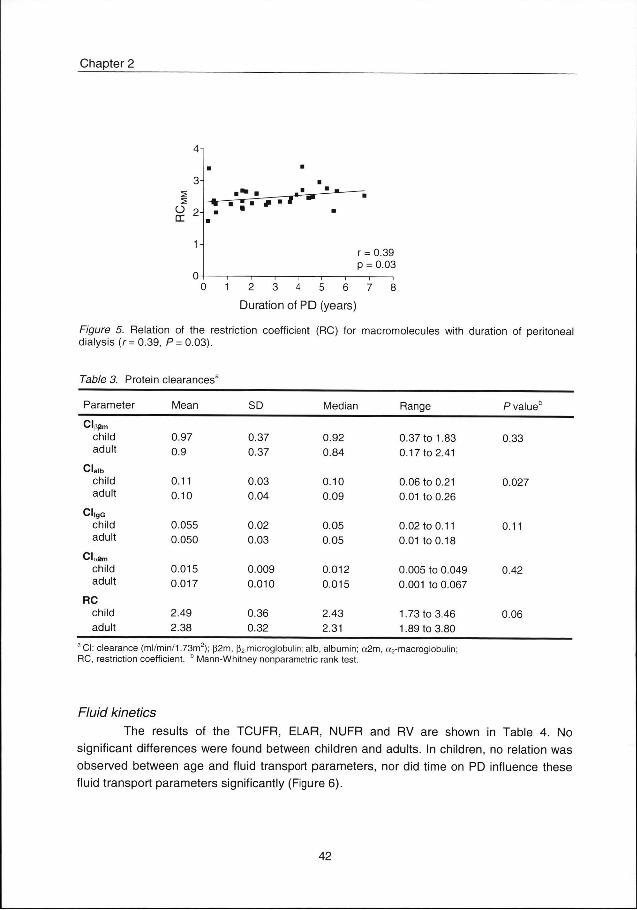
Thee results of the peritoneal protein clearances are shown in Table 3. No differencess were found between children and adults except for the albumin clearance, which wass marginally higher in children. No effect of age or duration of PD treatment on the protein clearancess was found (data not shown). Only the restriction coefficient increased significantlyy with the duration of PD treatment (Figure 5).
41 1
Chapterr 2
OO 2 -
rr = 0.39 pp = 0.03
0 1 2 3 4 5 6 7 8 8
Durat ionn of P D (years)
FigureFigure 5. Relation of the restriction coefficient (RC) for macromolecules with duration of peritoneal dialysiss (r= 0.39, P= 0.03).
TableTable 3. Protein clearances3
Parameter r
Cl(spm m
child d adult t
Clalb b child d adult t
CI|gG G child d adult t
Cloam m child d adult t
RC C child d adult t
Mean n
0.97 7 0.9 9
0.11 1 0.10 0
0.055 5 0.050 0
0.015 5 0.017 7
2.49 9 2.38 8
SD D Median n Range e PP value
0.37 7
0.37 7
0.03 3
0.04 4
0.02 2
0.03 3
0.009 9 0.010 0
0.36 6
0.32 2
0.92 2
0.84 4
0.10 0 0.09 9
0.05 5
0.05 5
0.012 2
0.015 5
2.43 3 2.31 1
0.377 to 1.83
0.177 to 2.41
0.066 to 0.21
0.011 to 0.26
0.022 to 0.11
0.011 to 0.18
0.0055 to 0.049
0.0011 to 0.067
1.733 to 3.46
1.899 to 3.80
0.33 3
0.027 7
0.11 1
0.42 2
0.06 6
aa CI: clearance (ml/min/1.73m2); p2m, [^.microglobulin; alb, albumin; a2m, a2-macroglobulin; RC,, restriction coefficient. b Mann-Whitney nonparametric rank test.
FluidFluid kinetics
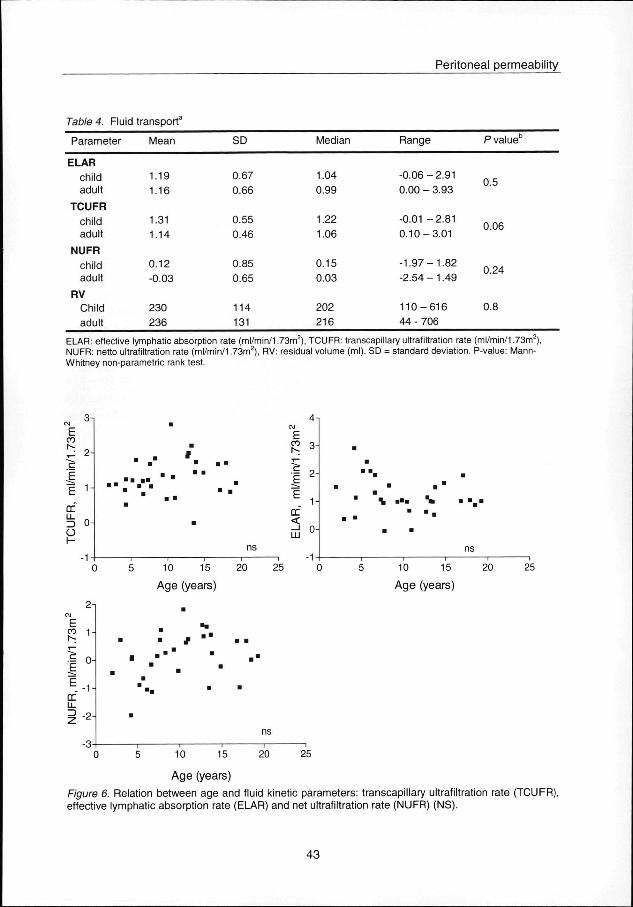
Thee results of the TCUFR, ELAR, NUFR and RV are shown in Table 4. No significantt differences were found between children and adults. In children, no relation was observedd between age and fluid transport parameters, nor did time on PD influence these fluidd transport parameters significantly (Figure 6).
42 2
Peritoneall permeability
TableTable 4. Fluid transport3
Parameter r Mean n SD D Median n Range e PP value
ELAR R child d adult t
TCUFR R child d adult t
NUFR R child d adult t
RV V Child d adult t
1.19 9 1.16 6
1.31 1 1.14 4
0.12 2 -0.03 3
230 0 236 6
0.67 7 0.66 6
0.55 5 0.46 6
0.85 5 0.65 5
114 4 131 1
1.04 4 0.99 9
1.22 2 1.06 6
0.15 5 0.03 3
202 2 216 6
-0.066 - 2.91 0.000 - 3.93
-0.011 -2.81 0.10-3.01 1
-1.97-1.82 2 -2.544 - 1.49
110-616 6 444 - 706
0.5 5
0.06 6
0.24 4
0.8 8
ELAR:: effective lymphatic absorption rate (ml/min/1.73m ), TCUFR: transcapillary ultrafiltration rate (ml/min/1.73m ), NUFR:: netto ultrafiltration rate (ml/min/1.73m2), RV: residual volume (ml). SD = standard deviation. P-value: Mann-Whitneyy non-parametric rank test.
,, 31 E E
n/1.
73 3
m
l/mi i
rr r Ü55 o-o o H H
( (
. "
. . -- " ' "
)) 5 10
1 1
ns s
155 20
Agee (years)
25 5
41 1 C\J J
E E COO Q_
r-- J
1* * DC C < <
33 -( (
\ . : *m
)) 5 10 15
Agee (years)
20 0 25 5
2 i i
E E
ss 1-^ ^ SS n-E E E . - 1 --rr r LL L
ii 2 -3--
#
'
— ii 1 — i i
ns s 11 1
10 0 15 5 20 0 25 5
FigureFigure 6. effective e
Ag ee (years)
Relationn between age and fluid kinetic parameters: transcapillary ultrafiltration rate (TCUFR), lymphaticc absorption rate (ELAR) and net ultrafiltration rate (NUFR) (NS).
4 3 3
Chapterr 2
DISCUSSION N Thee present study has shown that the results of the standard peritoneal
permeabilityy analysis in children were not essentially different from results obtained in adult patients.. The few exceptions, i.e., the lower MTACurate and the marginally higher albumin clearancee were most probably caused by the relatively large number of adult patients and/or thee narrow range of values resulting in statistically significant but clinically not relevant differences.. This is Illustrated by our finding that a significant difference for the albumin clearancee was not found when nest was used.
Thee MTAC and D/P ratios of low molecular weight solutes are dependent on the vascularr surface area of the peritoneum [25]. In adults, the peritoneal surface area ranges fromm 1.0 m2 [26] to 1.3 m2 [27], A newborn has a peritoneal surface area of 0.11 m2 [26]. Esperancaa and Collins have demonstrated that the ratio between peritoneal surface area andd body weight in newborns is about twice that of the adult [26]. Assuming that an adult hass a BSA of 1.73 m2 and a newborn 0.2 m2, the peritoneal surface area expressed per squaree meter body surface area is 0.6 m2 both in adults and infants. The BSA can be approximatedd by the weight and is relatively large in small children. Furthermore, BSA is a moree accurate predictor of drug dosage in infants and children because the clearance of a varietyy of drugs is greater in children than in adults when expressed in terms of total body weightt [28].
Inn the past, the PET in children was most often performed with a test volume in milliliterss per kilogram. When expressed per square meter this gives a relatively low volume, especiallyy in small children, and thus a more rapid equilibration of solutes resulting in higher D/PD/P ratios [29,30]. Therefore, it is likely that when the instilled volume is corrected for BSA, childrenn will not have enhanced peritoneal transport capacity compared to adults, as has beenn described previously [31-33]. MTAC are less influenced by the instilled test volume thann D/P ratios in the clinically relevant ranges in adult patients [5]. Warady et al. described noo difference in MTACCr using test volumes of 900 or 1100 ml/m2 but higher D/P ratios for creatininee in the lower test volumes [29]. Exceptionally low intraperitoneal volumes may resultt in low MTAC values because the peritoneal membrane surface area might not been usedd completely [34]. We used a test volume ranging between 900 and 1500 ml/m2 (30-55 ml/kg)) and could not find a relation between MTACcr and the instilled volume.
RelationshipRelationship between transport parameters and age
Noo significant changes in D/P ratios and MTAC were found according to age. Other studiess have demonstrated higher D/P ratios in small infants than in older children. This couldd result from the rapid peritoneal solute equilibration observed when a relatively low test volumee per square meter is used [6-10]. Furthermore, the age distribution in the children groupp can influence these results. In our study, five children were under the age of 5 yr. Waradyy et al. compared D/P and MTAC measurements in children with a test volume of 11000 ml/m and found no differences in DIP ratio for creatinine, urea and glucose according too age. However, they showed higher MTAC values (calculated according to the Pyle-
44 4
Peritoneall permeability
Popovichh method) for glucose and creatinine in younger infants than older children. The authorss suggested that this might be the result of maturational changes in the peritoneal membranee or differences in the effective peritoneal membrane surface area [9]. Geary era/, foundd an increase of the MTAC (calculated by the Garred formula) according to age but usedd lower test volumes 5 ml/kg) [12]. This could result from using only a part of the peritoneall surface area especially in the young children. Moreover, these authors expressed theirr MTAC values in ml/min. Reviewing their data makes it likely that no significant correlationn between age and MTAC would have been found with the MTAC expressed in ml/min/1.733 m2. The differences in test volumes we used did not influence the results betweenn MTAC and age significantly when tested with a partial rank correlation test (r = 0.33,, P = 0.09). The peritoneal protein clearances, i.e., |32-microglobulin, albumin, IgG and a2-macroglobulin,, did not change significantly according to age. Quan and Baum described ann inverse correlation between BSA and peritoneal protein loss expressed in mg/m2 per d andd suggested that the greater amount of protein loss may result from both a higher permeabilityy and a greater peritoneal surface area in children [35]. The protein clearances wee measured reflect the functional state of the peritoneum and cannot be extrapolated to 24-hh loss of proteins, because it is dependent on the dwell time and the number of bag exchanges.. During the first hour of the dwell time, the protein clearance is higher than the consecutivee hours, probably caused by vasodilation induced by the dialysis solution resultingg in an increase in effective peritoneal surface area [36]. However, from our results, especiallyy the similar values for the restriction coefficient to macromolecules, we cannot concludee that a higher peritoneal permeability in children would exist. No influence of age on thee fluid kinetic parameters was found when corrected for BSA. Similar findings have been describedd by Reddingius et at. [37].
ComparisonComparison of children with adults
Wee found a lower D/Pcr in children than in adults. This is contradictory to other studiess [6-10]. This is most likely the result of a lower average test volume per square meter usedd in the adult group which was 1000 ml/m2 [3]. MTAC were not different between childrenn and adults. Glucose transport was similar in both groups. The peritoneal protein clearancess in children and adults were also not different with the exception of the marginally higherr albumin clearance. We did not find changes in peritoneal fluid transport parameters betweenn children and adults when corrected for BSA in both groups. This is in agreement withh the study of Reddingius et al. [37]. The D/P ratios in children overestimated the MTAC inn the lower ranges and underestimated in the higher ranges. These results are similar to thosee found in adults [3]. This suggests that a different peritoneal transport category can be assignedd to the same patient when using either D/P ratio or MTAC.
RelationshipRelationship between transport parameters and duration of PD treatment
Thee MTAC of the low molecular weight solutes creatinine, glucose, and urate, as
welll as the D/P ratios did not change according to time on PD. The time on PD in our study
45 5
Chapterr 2
mayy have been too short for detecting changes in fluid transport. The median PD time was
2.66 yr, the maximum 6.7 yr. The first SPA test was not always performed in the first year of
treatment,, and in most cases only two tests per patient were done. Instead of a cross-
sectionall analysis, a more extensive longitudinal follow-up will clarify individual changes
accordingg to duration of PD treatment. The clearances of the high molecular weight proteins
didd not change significantly according to duration of PD treatment. However, an increase of
thee restriction coefficient for macromolecules occurred in relation to the duration of PD
treatment,, indicating an increased size selectivity or a reduced peritoneal permeability for
higherr molecular weight solutes. This has also been described in adults [38], but has not
beenn reported in children.
Inn summary, the SPA test is a good method to evaluate peritoneal transport
functionn in children. MTAC is preferred to D/P ratio because it is less influenced by dialysis
mechanicss since the MTAC is independent from exchange volumes and the dialysate
glucosee concentration. SPA results in children are similar to adults when corrected for BSA
inn both groups. No significant changes in peritoneal fluid and solute transport were found
accordingg to the duration of PD treatment with exception of an increase of the restriction
coefficientt for macromolecules.
A C K N O W L E D G M E N T T
Thiss study was supported by the Dutch Kidney Foundation (Grant C95.1464).
REFERENCES S
1.. Twardowski ZJ, Nolph KD, Khanna R, Prowant B.F., Ryan L.P., Moore HL, Nielsen MP: Peritoneall equilibration test. Perit Dial Bull 7:138-147, 1987
2.. Twardowski ZJ: Clinical value of standardized equilibration tests in CAPD patients. Blood Purif 7: 95-108,, 1989
3.. Pannekeet MM, Imholz AL, Struijk DG, Koomen GC, Langedijk MJ, Schouten N, de Waart R, Hiralalll J, Krediet RT: The standard peritoneal permeability analysis: a tool for the assessment of peritoneall permeability characteristics in CAPD patients. Kidney Int 48: 866-875, 1995
4.. Imholz AL, Koomen GC, Struijk DG, Arisz L, Krediet RT: Effect of dialysate osmolarity on the transportt of low-molecular weight solutes and proteins during CAPD. Kidney Int 43: 1339-1346, 1993 3
5.. Krediet RT, Boeschoten EW, Struijk DG, Arisz L: Differences in the peritoneal transport of water, solutess and proteins between dialysis with two- and with three-litre exchanges. Nephrol Dial Transplantt 3: 198-204, 1988
6.. Mendley SR, Majkowski NL: Peritoneal equilibration test results are different in infants, children, andd adults. J Am Soc Nephrol 6: 1309-1312, 1995
7.. Sliman GA, Klee KM, Gall-Holden B, Watkins SL: Peritoneal equilibration test curves and adequacyy of dialysis in children on automated peritoneal dialysis. Am J Kidney Dis 24: 813-818, 1994 4
8.. Edefonti A, Picca M, Galato R, Guez S, Giani M, Ghio L, Damiani B, Dal Col A, Santeramo C: Evaluationn of the peritoneal equilibration test in children on chronic peritoneal dialysis. Perit Dial Intt 13 Suppl 2: S260-262, 1993
46 6
Peritoneall permeability
9.. Warady BA, Alexander SR, Hossli S, Vonesh E, Geary D, Watkins S, Salusky IB, Kohaut EC: Peritoneall membrane transport function in children receiving long-term dialysis. J Am Soc Nephroll 7: 2385-2391, 1996
10.. Geary DF, Harvey EA, MacMillan JH, Goodman Y, Scott M, Balfe JW: The peritoneal equilibration testt in children. Kidney Int 42: 102-105, 1992
11.. de Boer AW, van Schaijk TC, Willems HL, Reddingius RE, Monnens LA, Schroder CH: The necessityy of adjusting dialysate volume to body surface area in pediatric peritoneal equilibration tests.. Perit Dial Int 17: 199-202, 1997
12.. Geary DF, Harvey EA, Balfe JW: Mass transfer area coefficients in children Perit Dial Int 14: 30-33,, 1994
13.. Renck H, Ljungström HG, Hedin H, Richter W: Prevention of dextran induced anaphylactic reactionreaction by hapten inhibition. Acta Chir Scan 149: 355-360, 1983
14.. Koomen GC, Krediet RT, Leegwater AC, Struijk DG, Arisz L, Hoek FJ: A fast reliable method for thee measurement of intraperitoneal dextran 70, used to calculate lymphatic absorption. Adv Peritoneall Dial 7: 10-14, 1991
15.. Waniewski J, Heimburger O, Werynski A, Lindholm B: Aqueous solute concentrations and evaluationn of mass transport coefficients in peritoneal dialysis. Nephrol Dial Transplant 7: 50-56, 1992 2
16.. Altman DG: Practical Statistics for Medical Research. London, 1991.
17.. Krediet RT, Zemel D, Imholz AL, Struijk DG: Impact of surface area and permeability on solute clearances.. Perit Dial Int 14 Suppl 3: S70-S77,1994
18.. Zemel D, Krediet RT, Koomen GC, Struijk DG, Arisz L: Day-to-day variability of protein transport usedd as a method for analyzing peritoneal permeability in CAPD. Perit Dial Int 11: 217-223,1991
19.. Krediet RT: Fluid absorption in the peritoneum-it is less simple than you thought. Nephrol Dial Transplantt 9: 341-343, 1994
20.. Struijk DG, Imholz AL, Krediet RT, Koomen GC, Arisz L: Use of the disappearance rate for the estimationn of lymphatic absorption during CAPD. Blood Purif 10: 182-188, 1992
21.. Krediet RT, Struijk DG, Koomen GC, Arisz L: Peritoneal fluid kinetics during CAPD measured with intraperitoneall dextran 70. ASAIO Trans 37: 662-667, 1991
22.. Imholz AL, Koomen GC, Struijk DG, Arisz L, Krediet RT: Residual volume measurements in CAPDD patients with exogenous and endogenous solutes. Adv Perit Dial 8: 33-38, 1992
23.. Bland JM, Altman DG: Statistical methods for assessing agreement between two methods of clinicall measurement. Lancet 1: 307-310, 1986
24.. Altman DG, Bland JM: Meaurement in Medicine: the analysis of method comparison studies. The Statisticiann 32: 307-317, 1983
25.. Krediet RT: Evaluation of peritoneal membrane integrity. J Nephrol 5: 238-244,1997
26.. Esperanca M, Collins D: Peritoneal dialysis efficiency in relation to body weight. J Pediatr Surg 1: 162-169,, 1966
27.. Pawlaczyk K, Kuzlan M, Wieczorowska-Tobis K, Pawlik-Juzków H, Breborowicz A, Knapowski J, Oreopouloss DG: Species-dependent topography of the peritoneum. Adv Perit Dial 12: 3-6, 1996
28.. Morgan DJ, Bray KM: Lean body mass as a predictor of drug dosage. Implications for drug therapy.. Clin Pharmacokinet 26: 292-307, 1994
29.. Warady BA, Alexander S, Hossli S, Vonesh E, Geary D, Kohaut E: The relationship between intraperitoneall volume and solute transport in pediatric patients. J Am Soc Nephrol 5: 1935-1939, 1995 5
47 7
Chapterr 2
30.. Kohaut EC, Waldo FB, Benfield MR: The effect of changes in dialysate volume on glucose and ureaa equilibration. Perit Dial Int 14: 236-239, 1994
31.. Morgenstern BZ: Equilibration testing: close, but not quite right. Pediatr Nephrol 7: 290-291, 1993
32.. Kohaut EC: The effect of dialysate volume on ultrafiltration in young patients treated with CAPD. J Pediatrr Nephrol 7: 13-16, 1986
33.. Fukuda M, Kawamura K, Kawahura K, Ohkawa T, Kamiyama Y, Honda M: Influence of instilled volumee on the peritoneal equilibration test. Perit Dial Int 14: 406-407, 1994
34.. Keshaviah P, Emerson PF, Vonesh EF, Brandes JC: Relationship between body size, fill volume, andd mass transfer area coefficient in peritoneal dialysis. J Am Soc Nephrol 4: 1820-1826, 1994
35.. Quan A, Baum M: Protein losses in children on continuous cycler peritoneal dialysis. Pediatr Nephroll 10:728-731, 1996
36.. Kagan A, Bar-Khayim, Schafer Z, Fainaru M: Kinetics of peritoneal protein loss during CAPD: I. Differentt characteristics for low and high molecular weight proteins. Kidney Int 37: 971-979, 1990
37.. Reddingius RE, Schroder CH, Willems JL, Lelivelt M, Kohier BE, Krediet RT, Monnens LA: Measurementt of peritoneal fluid handling in children on continuous ambulatory peritoneal dialysis usingg dextran 70. Nephrol Dial Transplant 10: 866-870, 1995
38.. Ho-Dac-Pannekeet MM, Koopmans JG, Struijk DG, Krediet RT: Restriction coefficients of low molecularr weight solutes and macromolecules during peritoneal dialysis. Adv Perit Dial 13: 72-76,, 1997
48 8