Embed Size (px)
Citation preview

UvA-DARE is a service provided by the library of the University of Amsterdam (http://dare.uva.nl)
UvA-DARE (Digital Academic Repository)
Carbon cycling in benthic diatom mats: Novel applications of LC/IRMS
Moerdijk-Poortvliet, T.C.W.
Link to publication
Citation for published version (APA):Moerdijk-Poortvliet, T. C. W. (2016). Carbon cycling in benthic diatom mats: Novel applications of LC/IRMS.
General rightsIt is not permitted to download or to forward/distribute the text or part of it without the consent of the author(s) and/or copyright holder(s),other than for strictly personal, individual use, unless the work is under an open content license (like Creative Commons).
Disclaimer/Complaints regulationsIf you believe that digital publication of certain material infringes any of your rights or (privacy) interests, please let the Library know, statingyour reasons. In case of a legitimate complaint, the Library will make the material inaccessible and/or remove it from the website. Please Askthe Library: https://uba.uva.nl/en/contact, or a letter to: Library of the University of Amsterdam, Secretariat, Singel 425, 1012 WP Amsterdam,The Netherlands. You will be contacted as soon as possible.
Download date: 01 Aug 2020

Carbon cycling in benthic diatom mats
Novel applications of LC/IRMS
Tanja C.W. Moerdijk-Poortvliet
Tanja C
.W. M
oerdijk-Poortvliet
Carbon cycling in benthic diatom
mats
2016


Moerdijk-Poortvliet T.C.W. 2016. Carbon cycling in benthic diatom mats-
Novel applications of LC/IRMS PhD thesis, University of Amsterdam
The research presented in this thesis was carried out at the Department of Marine Microbiology of the Royal Netherlands Institute for Sea Research
(NIOZ and Utrecht University) in Yerseke, the Netherlands.
ISBN: 978-94-91407-44-4
Design and editing: Erwin & Tanja Moerdijk Printed by: GVO drukkers & vormgevers B.V. Correspondence: [email protected]
Carbon cycling in benthic diatom mats
Novel applications of LC/IRMS
Tanja C.W. Moerdijk-Poortvliet

Carbon cycling in benthic diatom mats
Novel applications of LC/IRMS
ACADEMISCH PROEFSCHRIFT
ter verkrijging van de graad van doctor
aan de Universiteit van Amsterdam
op gezag van de Rector Magnificus
prof. dr. ir. K.I.J. Maex
ten overstaan van een door het College voor Promoties ingestelde
commissie, in het openbaar te verdedigen in de Agnietenkapel
op vrijdag 09 december 2016, te 14.00 uur
door
Tannetje Catharina Wilhelmina Poortvliet
geboren te Yerseke

PROMOTIECOMMISSIE:
Promotor: Prof. dr. L. J. Stal Universiteit van Amsterdam Copromotor: Dr. H. T. S. Boschker Koninklijk Nederlands Instituut
voor Onderzoek der Zee (NIOZ) Overige leden: Prof. dr. D.M. Paterson University of St Andrews Prof. dr. K. Sabbe Rijksuniversiteit Gent Dr. J.C. Kromkamp Koninklijk Nederlands Instituut
voor Onderzoek der Zee (NIOZ) Dr. H. Schierbeek Universiteit van Amsterdam Prof. dr. J. Huisman Universiteit van Amsterdam Prof. dr. G. Muijzer Universiteit van Amsterdam Prof. dr. C.P.D. Brussaard Universiteit van Amsterdam
Faculteit der Natuurwetenschappen, Wiskunde en Informatica


7
Contents CHAPTER 1. General introduction 9
PART 1. Stable isotope methodology
CHAPTER 2. A versatile method for stable carbon isotope analysis of carbohydrates by high-performance liquid chromatography/isotope ratio mass spectrometry 29
CHAPTER 3. A versatile method for simultaneous stable carbon isotope analysis of DNA and RNA nucleotides by liquid chromatography/isotope ratio mass spectrometry 49
CHAPTER 4. Comparison of gas chromatography/isotope ratio mass spectrometry and liquid chromatography/ isotope ratio mass spectrometry for carbon stable-isotope analysis of carbohydrates 73
PART 2. Carbon cycling in benthic diatom mats
CHAPTER 5. LC/IRMS analysis: A powerful technique to trace carbon flow in microphytobenthic communities in intertidal sediments 103
CHAPTER 6. Tracing carbon flow from microphytobenthos to major bacterial groups in an intertidal marine sediment by using an in-situ 13C pulse-chase method 123
CHAPTER 7. Seasonal changes in the biochemical fate of carbon fixed by benthic diatoms in intertidal sediments 151
CHAPTER 8. Seasonal changes in the production of extracellular polymeric substances and its fate to the heterotrophic bacterial community in an intertidal diatom mat 187
CHAPTER 9. General discussion 223
Summary 237
Samenvatting 243
References 249
Dankwoord - Acknowledgements 267

8

General introduction
1 C
hapt
er

Chapter 1
10
Thesis background
Marine microorganisms play a vital role in Earth’s biogeochemical cycles and are at the basis of most marine food webs. Life on our planet is carbon-based, thus the carbon cycle is essential. Understanding the functions of marine microorganisms and their involvement in the carbon cycle will enhance our knowledge of ecosystems and will be of great importance to predict effects of future environmental conditions (e.g. climate change and predicted sea level rise (Nicholls & Cazenave, 2010)). This study aims at investigating the carbon flow within communities of benthic diatoms, which are major primary producers in estuarine environments and important for the food web in marine intertidal sediments. Despite their importance little is known about the carbon flow within these communities. Carbon flow studies were hampered by the lack of techniques to track the production and fate of individual components in specific biochemical pools in these important ecosystems. Therefore, it is of great interest to biogeochemists, microbiologists and other biologists to open up new avenues and methodologies that enable carbon flow analysis in much greater detail. Benthic diatoms: tiny but mighty Estuaries are important ecosystems that are found all over the world. Estuaries are normally more or less influenced by the tides, which causes the physical and chemical environmental parameters such as light, temperature, and salinity to vary substantially over short time spans. Therefore, estuarine environments are more stressful to organisms than most other aquatic systems. Intertidal mudflats are submerged and exposed due to tidal water movement and are therefore an even harsher and constantly changing environment. With the tides the availability of water varies from air exposure at low tide (with occasionally exposure to near fresh water during rain) to full salinity seawater at high tide. Besides, organisms are exposed to a considerable physical impact from the waves, variability of light and temperature, and the risk of predation. Nevertheless, microorganisms living in and on the intertidal sediment are abundantly present with numbers as high as 109 per cm3 and develop complex consortia of both bacteria and archaea, as well as microbial eukaryotes like diatoms, protozoa, and fungi (Decho, 2000; Stal, 2010). In temperate intertidal mudflats, the community of microorganisms mainly consists of benthic diatoms and associated bacteria (Underwood et al., 2005). The diatoms may be present in high abundance and this biofilm is visible with the naked eye as a brown discoloration (Fig. 1.1. A, B, C).
1
General introduction
11
The benthic diatom biomass varies seasonally as a function of temperature, irradiance, nutrient concentrations, and grazer activity. Strong winds and water currents may cause erosion and decrease the biomass through resuspension. In general, benthic diatom biomass is highest at the end of winter and early spring and decreases during late spring and summer due to the appearance of grazers and bioturbators (Sahan et al., 2007). Inter annual changes in benthic diatom biomass are small relative to their seasonal dynamics (van der Wal et al., 2010). Throughout the year diatom species composition can be highly variable and the species size is strongly affected by the type of grazers, sediment type, light intensity, and temperature (Ysebaert et al., 2005; Forster et al., 2006; Sahan et al., 2007).
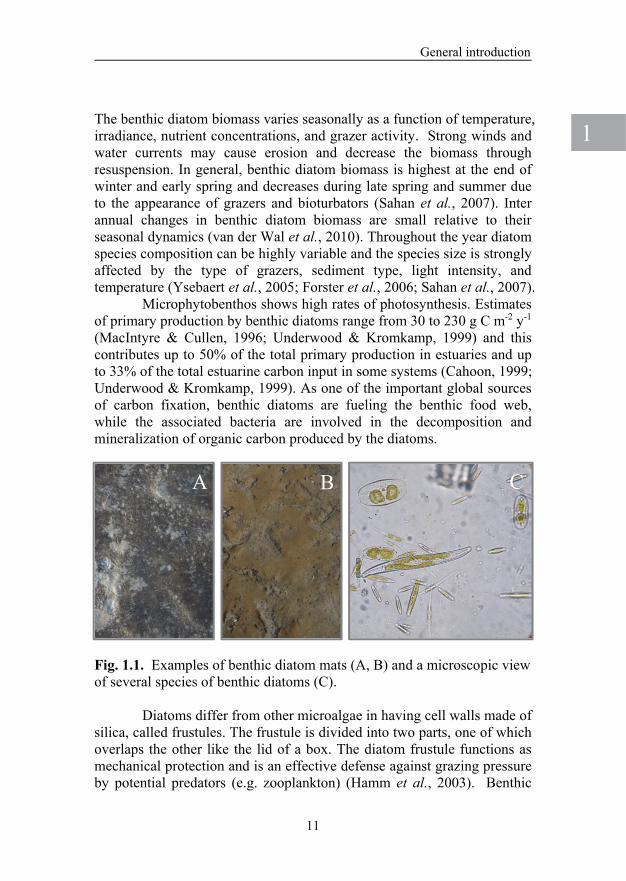
Microphytobenthos shows high rates of photosynthesis. Estimates of primary production by benthic diatoms range from 30 to 230 g C m-2 y-1 (MacIntyre & Cullen, 1996; Underwood & Kromkamp, 1999) and this contributes up to 50% of the total primary production in estuaries and up to 33% of the total estuarine carbon input in some systems (Cahoon, 1999; Underwood & Kromkamp, 1999). As one of the important global sources of carbon fixation, benthic diatoms are fueling the benthic food web, while the associated bacteria are involved in the decomposition and mineralization of organic carbon produced by the diatoms.
Fig. 1.1. Examples of benthic diatom mats (A, B) and a microscopic view of several species of benthic diatoms (C).
Diatoms differ from other microalgae in having cell walls made of silica, called frustules. The frustule is divided into two parts, one of which overlaps the other like the lid of a box. The diatom frustule functions as mechanical protection and is an effective defense against grazing pressure by potential predators (e.g. zooplankton) (Hamm et al., 2003). Benthic
A B C C
A B

Chapter 1
12
diatoms are divided in epipsammic (small species that are attached to sand grains) and epipelic (larger species that are highly motile) species. Part of carbon fixed by these diatoms is exuded as extracellular polymeric substances (EPS), which plays a role in the motility and attachment of the diatoms (Stal & Defarge, 2007). EPS cumulate in the surficial sediments where it together with diatom cells and the sediment forms a coherent structure that stabilizes the sediment surface and increases erosion threshold (Stal, 2010). Benthic diatoms are important inhabitants of mudflats, helping to protect coastal areas from the sea by decreasing mudflat erosion. In addition, their productivity supports a large population of wildlife because mudflats provide important feeding and nursery grounds for many bird species, fish, and shellfish (Heip et al., 1995; Stal, 2010). Extracellular polymeric substances (EPS) Motility driven by excreting EPS as found in diatoms is based on the secretion of mucilage through a slit, the raphe, in the surface of the silica frustule (Edgar & Pickett-Heaps, 1984). In the variable environment of a mudflat diatom migration is an important feature that allows efficient light capture, enables the organisms to survive burial and erosion events, and to avoid grazers (Consalvey et al., 2004). Epipelic diatoms migrate through the sediment at a high speed, reaching up to 20 µm/s (Cohn & Disparti, 1994). However, the motility of diatoms is not the only reason for exudating EPS. It can also be the result of unbalanced growth, which occurs when the availability of light and CO2 exceeds that of nutrients necessary for the synthesis of structural cell material. In this case excess fixed CO2 is diverted to polysaccharide excreted as EPS, rather than to protein or other structural compounds (Staats et al., 2000). This excess amount of EPS plays an important role in the ecology of the diatom mat. Besides that EPS stabilizes the sediment surface and avoids diatom re-suspension in the water (Stal, 2010), it can also protect diatoms from physical stress such as changes in temperature, salinity, nutrient availability, dehydration, and UV radiation (Hoagland et al., 1993; Underwood & Paterson, 2003). In addition, exuded EPS represents a carbon source for heterotrophic bacteria and other organisms living in intertidal sediments. Low molecular weight exudates excreted by diatoms can be directly utilized by the heterotrophic microbial community, whereas polymeric compounds such as EPS need to be first hydrolyzed by extracellular enzymes (Hunter et al., 2006).

1
General introduction
13
Diatom EPS extracted from sediments mainly consists of polysaccharides (Underwood & Paterson, 2003), but may also contain proteins, lipids, and nucleic acids (Flemming & Wingender, 2010). EPS vary greatly in their composition and hence in their chemical and physical properties. Some EPS are uncharged (neutral) and a few EPS may be cationic due to the presences of amino groups; however the majority of EPS are anionic due to the presences of carboxyl, phosphate or sulphate groups. (Sutherland, 2001; Staats et al., 1999). The different kinds of EPS show different physical properties and interactions with the environment (Decho, 2000). Sulfates present in EPS have the functionality of holding water and give the EPS matrix a gel-like structure (Wingender et al., 2012). High yields of uronic acids give a negative charge to the polymer resulting in interaction with the charged clay particles in the sediment and among the EPS molecules themselves, aided by bridging through divalent cations such as Ca2+ and Mg2+. This type of EPS gives stability to the EPS matrix and the sediment and is generally more difficult to decompose for bacteria (Decho, 2000; de Brouwer et al., 2002).
The EPS formation by benthic diatoms has been extensively studied, however thus far most studies were performed on pure cultures and/or focused on the measurement of the content of EPS fractions but neglecting effects of community interactions, production and turnover rates of these exudates in natural intertidal sediments (Smith & Underwood, 1998; Pierre et al., 2014). Considering its ecological relevance, more knowledge is required on the production, composition and dynamics of EPS in intertidal sediments. The fate of carbon fixed by benthic diatoms Carbon fixation by benthic diatoms initially results in the synthesis of glucose as one of the early products, which can be metabolically utilized for diatom growth. Besides carbon-rich compounds such as glucose, diatoms also depend on silica (Si) for synthesizing their frustules, and on nitrogen (N) to produce amino acids and chlorophyll, and on phosphorus (P) to produce lipids and nucleic acids. Varying nutrient availability between seasons will likely affect the fate of fixed carbon by benthic diatoms and consequently the way the diatom mat functions. Even variation in short-term nutrient availability as a consequence of diffusion limitation due to the high cell density of the mat might affect the fate of fixed carbon (Stewart, 2003). Because of the inherent connection between carbon, nitrogen and phosphorus metabolism, nutrient availability is expected to have an effect on the biochemical fate of fixed carbon in the diatom mats. For example, under nutrient replete conditions up to 40 % of

Chapter 1
14
the photosynthetically fixed carbon by diatoms can be directed towards the synthesis of amino acids (Armbrust et al., 2004; Levitan et al., 2015). However, under nitrogen deficiency or as a consequence of photo-oxidative stress or adverse environmental conditions, intermediate metabolism is altered and the fate of fixed carbon is directed to lipids (Hu et al., 2008; Hockin et al., 2012). Fortunately, diatoms are able to utilize a variety of inorganic nitrogen sources (e.g. nitrate; ammonium) and organic nitrogen sources (e.g. urea; amino acids) and adjust their nitrogen metabolism to the available nutrients that may be derived from both the sediment and the tidal water column (Bender et al., 2012). There are indications that the urea cycle in diatoms is involved in the recycling and biosynthesis of organic nitrogen compounds, and important for the exchange of nutrients between the cytoplasm and mitochondria (Allen et al., 2011; Prihoda et al., 2012). However, how the urea cycle is integrated in the diatom physiology and how it is involved in the diatom’s response to environmental change is not fully understood. Our knowledge on the effect of seasonal environmental variations and possible resulting metabolic anticipation of benthic diatoms on these variations is limited although important as their nutritional value might change for higher trophic levels. Changes in the nutritional value of the diatom mat may eventually affect the food web structure and consequently affect the whole ecosystem (Van Oevelen et al., 2006)
Although intertidal sediments and the benthic diatoms that inhabit them have been extensively studied, our knowledge on the carbon flow within these systems is limited and for a large part still unexplored. An important reason why our knowledge of carbon fixation by diatoms and its partitioning over the different metabolic pools is limited lies in the available methods and techniques. The majority of in-situ studies published has dealt with various aspects of the diatom lipid biochemistry using stable isotopes methods (Middelburg et al., 2000; Bouillon & Boschker, 2006; Evrard et al., 2008; Bellinger et al., 2009). However, in case of studying the carbon flow in greater detail it is crucial to include lipids as well as other carbon pools such as carbohydrates, amino acids, nucleic acids, and EPS. Stable isotope methodology The nucleus of each atom in the Earth’s biosphere contains both protons and neutrons. While the number of protons defines the element (e.g. carbon, nitrogen) and the sum of the protons and neutrons gives the atomic mass, the number of neutrons defines the isotope of that element. For example, most carbon (~99 %) has 6 protons and 6 neutrons and is

1
General introduction
15
written as 12C to reflect its atomic mass. However, about 1 % of the carbon has 6 protons and 7 neutrons (13C) representing the heavy stable isotope of this element. The chemical bonds of atoms with heavy stable isotopes are stronger than those in the lighter isotopes of an element. As a result, the heavier isotopes react slightly slowly than the lighter isotopes and the products of reactions to have different isotope ratios than the source materials (i.e. isotopic fractionation).
Stable isotopes can be used in ecology in two different ways, (i) at natural abundance level where the natural variation in stable isotope composition is used and (ii) by adding an isotopically enriched tracer. At natural abundance level the isotopic signature of an organism for instance provides insight into the nature of resources that were used by this organism, i.e. the stable carbon isotopic composition of organisms typically reflects that of their food source. An isotopically enriched tracer can be added to the system and its fate can be subsequently followed. This latter approach conveys important kinetic information on specific metabolic processes and can also be used to deduce metabolic pathways. Stable isotope techniques have been proven to be powerful in microbial ecology (Boschker & Middelburg, 2002; Fry, 2007; Middelburg, 2014). A major advantage of the application of stable isotopes labeling techniques is that they can be used directly in experimental setups and in field experiments without the restrictions that apply to radioactive (unstable) isotopes. The ability of using stable isotope tracers directly in field experiments provides data under relevant in-situ conditions within the complexity of natural ecosystems and minimizes the disturbance of the microbial system under investigation compared to experimental set ups in the laboratory. Instruments that measure stable isotope ratios Currently, the most precise and accurate method for stable isotope measurements is isotope ratio mass spectrometry (IRMS). Due to its design, the precision of the isotope ratio is a few parts per thousand (0.0001 – 0.0003%). Before a sample can be introduced into the IRMS instrument it must be converted to a gas (e.g. N2, CO2, H2 and SO2). This can be done by bulk combustion followed by separation of the produced gases, (i.e. elemental analysis; EA/IRMS) or by chromatographic separation of the components of interest followed by on-line conversion of each single component to the required gasses, which is called compound specific stable isotope analysis (CSIA). CSIA was the main approach used in this thesis to study the carbon flow within benthic diatom mats.

Chapter 1
16
GC/IRMS The first technique developed for CSIA was gas chromatography IRMS (GC/IRMS). The sample needs to be injected into the GC inlet where it is vaporized and applied onto a chromatographic column by the carrier gas (often helium). On the column the compounds of interest are separated by their interaction with the coating of the column (stationary phase) and the carrier gas (mobile phase). As illustrated in figure 1.2, carbon and nitrogen compounds pass through a combustion oven (an alumina tube containing oxidized Cu, Ni and Pt wires maintained at 940 oC) where they are subjected to oxidative combustion and converted to CO2, H2O and nitrogen oxide gases (NOx). Subsequently, NOx is converted to N2 after passage through a reduction reactor (an alumina tube containing three Cu wires maintained at 600 oC) that reduces nitrogen oxides to dinitrogen gas. This step is fundamental since N2O or NO2 might produce m/z 44, m/z 45 and m/z 46 in the ion source interfering with the measurement of 12CO2 and 13CO2 isotopic ratios. Water is removed in a separator by passing the gas stream through a nafion© tube. Finally, the sample is introduced into the ion source of the IRMS by an open split interface. The gases to be analyzed (CO2, H2, N2 or CO) are ionized by using electron ionization (EI). The ionized gases are separated in a single magnetic sector analyzer by virtue of their momentum and are detected by an array of Faraday cups, the output from which is used to calculate the final stable isotope ratio.
Fig. 1.2. Schematic view of a gas chromatograph linked to an isotopic ratio mass spectrometer (Thermo Fisher Scientific, Bremen, Germany)

1
General introduction
17
GC/IRMS can be used to determine the ratio of stable isotopes of carbon (13C/12C: m/z 44, 45, 46)), hydrogen (2H/1H), nitrogen (15N/14N) or oxygen (18O/16O). A prerequisite for GC/IRMS is that the compounds of interest are amenable to GC, which means they are suitably volatile and thermally stable. Some compounds such as carbohydrates and amino acids can only be analyzed by GC/IRMS after synthesizing chemical derivatives, which makes them more volatile and less polar. A drawback of this technique it that some prepared derivatives are unstable and also substantial corrections of the measured stable isotopic composition are necessary due to the additional carbon in the derivatized compound, adding uncertainties to the determination of the original isotopic ratios and decreasing accuracy and precision of the method (Rieley, 1994).
LC/IRMS Liquid chromatography (LC) eliminates one of the main drawbacks of GC because compounds of biological interest such as carbohydrates and amino acids can be analyzed directly without the need of derivatization avoiding laborious sample preparation and complex isotopic calibration. However, linking an LC to an IRMS is more complicated than the GC/IRMS coupling because the compounds of interest need to be separated from the liquid eluent before they can be introduced in the IRMS. After several less successful attempts (Caimi & Brenna, 1993; Teffera et al., 1993; McLean et al., 1996; Brenna et al., 1997; Abramson et al., 2001), a wet oxidation interface linking LC to IRMS was developed by Krummen et al. (2004).
Fig. 1.3. Schematic view of a liquid chromatograph linked to an isotopic ratio mass spectrometer (Thermo Fisher Scientific, Bremen, Germany)

Chapter 1
18
In LC/IRMS, compounds of interest are first separated by LC and then let into an oxidation interface. The interface is based on wet oxidation of organic molecules in aqueous solution to CO2 and is similar as described in the paper published by St-Jean (2003). This author described the coupling of a Total Organic Carbon (TOC) instrument to an IRMS. The main improvement of to the LC/IRMS coupling is the direct on-line measurement of CO2 and the absence of sequential oxidation steps. As illustrated in figure 1.3, the oxidation of the organic molecules to CO2 is performed in a heated reactor where acid (phosphoric acid), oxidant (sodium peroxydisulfate) and LC eluent are mixed. Via chemical oxidation all eluting compounds are converted to CO2, which is transferred from the eluent into a helium flow with a membrane separator. Finally, water vapor is removed and the purified CO2 flow is carried into the ion source of the mass spectrometer. Currently, there are two available interfaces: the Isolink (Thermo Fisher Scientific, Bremen, Germany) and the more recently developed LiquiFace (Isoprime, Cheadle Hulme, UK) (Krummen et al., 2004; Morrison et al., 2010).
The interface can also be used without a column separation. Via direct injection into the flow path of the interface bulk 13C values can be determined. In the literature this feature is referred to as flow injection analysis IRMS (FIA/IRMS) (McCullagh et al., 2011). The major advantage of FIA/IRMS over EA/IRMS is that FIA/IRMS requires a much lower amount of sample. Due to the more efficient sample transfer to the IRMS, typically 50-500 ng of carbon is required for FIA/IRMS analysis compared to a few µg for EA/IRMS in order to achieve a standard deviation lower than 0.3‰ (Godin et al., 2005). The direct injection technique has been used to analyzed 13C content in specific 16S ribosomal RNA’s extracted from marine sediment by magnetic bead capture hybridization (Miyatake et al., 2009). 16S rRNA, a component of the prokaryotic ribosome, is an excellent phylogenetic marker and the analysis of 13C in this molecule is an attractive approach to identify the groups of bacteria that utilize organic carbon released by benthic diatoms.
The design of the LC/IRMS interface involves a number of analytical constraints. The current LC/IRMS systems are not compatible with organic and other carbon-containing eluents, preventing the use of many of the traditional LC methods. Organic solvents cannot be used because the continuous oxidation in the reactor would create an extremely high CO2 background. The composition of the mobile phase is therefore restricted to inorganic acids, bases, and buffers dissolved in high-quality purified water. Furthermore, the selection of the right analytical column is important because column bleeding should be low, as the release of the

1
General introduction
19
bonded phase of the column during analysis also causes high and unstable background signals (Godin et al., 2007; McCullagh, 2010). These analytical constraints, together with the requirement of baseline separation of components in order to obtain accurate isotopic measurement of the compounds, are challenging the development of analytical methods. Fortunately, there is an increase in the development of columns that are suitable for separating components in aqueous solution such as mixed mode columns (McCullagh, 2010). Another limitation to take into account is that LC/IRMS is hitherto restricted to 13C analysis whereas GC/IRMS is able to measure multiple elements. Nevertheless, the introduction of the LC/IRMS technique has opened new avenues for the study of a broad range of biological compounds. Especially the analysis of carbohydrates, amino acids and nucleic acids provides major benefits from the use of LC/IRMS. Applications of CSIA techniques to study biochemical compounds and EPS in benthic diatom mats In order to understand the carbon flow in benthic diatom mats it is important to be able to measure stable carbon isotope ratios in the four major classes of biochemical compounds found in all biological materials (i.e. lipids, carbohydrates, amino acids, and nucleic acids) and also in EPS and short chain organic acids (SCOA) released as exudates by benthic diatoms. In the consecutive sections below I describe the function of each class of biochemical compound class, EPS, and SCOA, as well as the status of the development of CSIA techniques. Lipids The biological function of lipids in diatoms (as well as in other organisms) includes storing energy and acting as structural components of cell membranes. Lipids can be extracted from the sediment with a modified Bligh and Dyer extraction (Boschker et al., 1999). The lipid extract is fractionated on a silica column into different polarity classes by sequential eluting with chloroform, acetone, and methanol prior to conversion to fatty-acid methyl esters, which carbon content and isotopic composition can be measured by GC/IRMS (Middelburg et al., 2000). GC/IRMS analysis of fatty acids (FA) is a widely used, simple, and straightforward technique. The chloroform fraction contains mainly neutral lipid-derived FA (i.e. triglycerides, a storage product), while the acetone and methanol fractions contain polar lipid-derived FA (i.e. mainly glycolipid-derived FA and phospholipid-derived FA (PLFA) respectively), but this fraction also contains other lipids such as betaine lipids and sulfolipids)

Chapter 1
20
(Heinzelmann et al., 2014). PLFA are a structural component of microbial cellular membranes and can be used for estimation of the total biomass and to differentiate between the production of diatom and bacterial biomass (Middelburg et al., 2000; Dijkman et al., 2009). The advantage of using PLFA is that this biomarker represents living organisms because these compounds are rapidly decomposed after cell death (Boschker & Middelburg, 2002). Carbohydrates In diatoms, like in all organisms, carbohydrates serve as storage and structural compounds. However, diatoms contain relatively limited amounts of structural compounds as there cell wall is made of silica and not primarily of polysaccharides as in other microalgae. Because cellular and extracellular production of carbohydrates plays a central role in the functioning of a benthic diatom mat, stable carbon isotope analysis of these compounds is important for the identification of carbon sources, their turnover rate in the sediment, and tracing them in microbial biomass. Monosaccharides are found in many different forms including neutral carbohydrates, uronic acids, and amino sugars. Neutral carbohydrates play an important role in the storage (e.g. glucose) and structural components of the benthic diatoms and also in the majority of excreted EPS. Cabanero et al. (2006) developed a method to analyze carbohydrates by LC/IRMS, however they could only detect sucrose, glucose and fructose. An LC/IRMS method to analyze the most important monosaccharides in microorganisms was not available at the start of this thesis work (i.e. fucose, rhamnose, galactose, glucose, xylose, mannose, and uronic acids). Amino acids Amino acids are the building blocks of proteins, but can also be present as free metabolites and in EPS. Most proteins are enzymes that catalyze biochemical reactions or transport molecules from one location to another and are vital to metabolism. In addition, proteins have structural functions. Godin et al. (2005) developed an LC/IRMS method to analyze amino acids. This method was improved by McCullagh et al. (2006) and finally optimized by Smith et al. (2009), who were able to separate all biological amino acids such as those found in benthic diatom mats. Nucleic acids Nucleic acids, deoxyribonucleic acid (DNA) and ribonucleic acid (RNA), are important biopolymers that encode, transmit and express genetic information. A first attempt to analyze RNA nucleotides by LC/IRMS was
1
General introduction
21
made by MacGregor et al. (2004). McCullagh (2010) showed that polar molecules, such as a number of DNA-related nucleosides, can be retained and eluted from mixed-mode columns. However, a completely functional LC/IRMS method to perform CSIA for nucleic acids was not available at the start of this thesis work. Extracellular polymeric substances EPS consists of many types and is distributed over a range of size classes which discern in how they are bound to the cell (de Brouwer & Stal, 2001; Underwood & Paterson, 2003). Unfortunately, there is no agreement on the extraction method for EPS. Various EPS extraction procedures are used that yield different types of EPS. Therefore the extracted EPS fractions are always operationally defined and comparison of these operational fractions between studies may be difficult. Usually, a sequential extraction procedure is used and two or more operationally defined EPS fractions are obtained (Underwood et al., 1995; de Brouwer & Stal, 2001; Pierre et al., 2010). The term “colloidal” EPS is frequently used to define EPS extracted using water or saline extracts, and “bound” EPS denotes the EPS more tightly associated with the cell and extracted using EDTA or a cation-exchange resin. Because certain EPS types are interconnected by multivalent cations such as Ca2+ or Mg2+, addition of EDTA or a cation-exchange resin will remove the cation resulting in the release of this type of EPS.
Eventually, the obtained fractions can be further distinguished into low molecular weight molecules and larger polymeric molecules by ethanol precipitation or using ultrafiltration (de Brouwer & Stal, 2001; Underwood & Paterson, 2003). However, before the obtained EPS extracts can be applied to any kind of LC/IRMS analysis they need to meet the analytical constraints of the LC/IRMS technique (as described in the LC/IRMS section). For example, the metal-EDTA complexes formed during the EPS extraction step need to be removed from the EDTA EPS hydrolysates. If not, the complexes will be broken down under prevailing LC/IRMS interface conditions and the released metal will precipitate with the phosphoric acid and eventually clog the system. Short chain organic acids Short chain organic acids (SCOA) such as acetic acid play an important role in the metabolism of microphytobenthic mats. Acetate is a key metabolite in anaerobic metabolism and in the cycling of organic carbon in marine sediments. Acetate is produced by fermentation of organic matter and also by reduction of CO2 by acetogenic bacteria. Acetate and

Chapter 1
22
other SCOA are important substrates for heterotrophic bacteria (Sundh, 1992). Therefore, the measurement of SCOA could provide valuable information on the diatom-bacteria interactions. By sampling the pore water of the sediment, 10 different SCOA such as citrate, malate, succinate, acetate and lactate can be directly determined by using LC/IRMS (Heuer et al., 2006).
Aim and outline of this thesis The main aim of this thesis was to study in detail the carbon flow in benthic diatoms by following it in the major classes of biochemical compounds (i.e. lipids, carbohydrates, amino acids, and nucleic acids), and to investigate how benthic diatoms anticipate metabolically to seasonal changes. In addition, the role of EPS in the carbon flow from the benthic diatoms to the bacterial community was studied. In order to be able to analyze stable carbon isotope values in carbohydrates and nucleic acids, I had to develop and improve LC/IRMS methods. Subsequently, I used the newly developed and existing CSIA methods in an in-situ 13C pulse-chase labeling study where the fate of fixed carbon was traced for 5 consecutive days during different seasons. The thesis is divided in two parts: the first part contains 3 methodological papers on LC/IRMS, and the second part contains 4 experimental chapters describing studies on carbon cycling in benthic diatoms. PART 1. Stable isotope methodology
CHAPTER 2. A versatile method for stable carbon isotope analysis of carbohydrates by high-performance liquid chromatography/isotope ratio mass spectrometry An LC/IRMS method was developed that allowed measurement of stable carbon isotope ratios in a variety of carbohydrates. We were able to analyze 6 different neutral carbohydrates besides 3 acidic carbohydrates. The chromatographic method was based on ion-exchange chromatography in combination with low strength alkaline eluents. When separating acidic carbohydrates additional NaNO3 was used as pusher. The main advantage of this newly developed carbohydrate LC/IRMS method over traditional GC/IRMS based methods is that no derivatisation is needed resulting in simple sample treatment and improved accuracy and reproducibility.

1
General introduction
23
CHAPTER 3. A versatile method for simultaneous stable carbon isotope analysis of DNA and RNA nucleotides by liquid chromatography/isotope ratio mass spectrometry A LC/IRMS method was developed that allowed measurement of stable carbon isotope ratios in individual DNA and RNA nucleotides. Mixed-mode chromatography was applied to obtain the complete separation of nine nucleotides in a single analytical run (eight nucleotides originating from DNA and RNA, and one nucleotide (inosine monophosphate) that served as an internal standard). I also developed and validated a method for DNA and RNA extraction and an enzymatic hydrolysis protocol for marine sediment samples compatible with LC/IRMS analysis because it minimized the carbon blank. This new method allowed for the first time the study of DNA and RNA biosynthesis in benthic diatom mats. CHAPTER 4. Comparison of gas chromatography/ isotope ratio mass spectrometry and liquid chromatography/isotope ratio mass spectrometry for carbon stable-isotope analysis of carbohydrates In this chapter I compared the performance of GC/IRMS and LC/IRMS for the analysis of neutral carbohydrates. As expected for GC/IRMS measurements, both the derivatisation correction and problems with the conversion of carbohydrate-derivatives to CO2 had a considerable effect on the measured stable carbon isotope ratios and LC/IRMS proved to be superior to GC/IRMS concerning measurement precision of standards. However, the differences in the performance of GC/IRMS and LC/IRMS diminished when stable carbon isotope ratios were measured in natural samples because the chromatographic performance and background correction became critical factors, particularly for LC/IRMS. However, because LC/IRMS carbohydrate analysis is much easier since no laborious sample preparation and challenging system validation are required, this technique is still preferred for stable carbon isotope analysis of individual neutral carbohydrates. PART 2. Carbon cycling in benthic diatom mats CHAPTER 5. LC/IRMS analysis: A powerful technique to trace carbon flow in microphytobenthic communities in intertidal sediments In this chapter I present an overview of the possibilities and limitations of the LC/IRMS technique to study metabolic processes in microphytobenthic communities. With a preliminary in-situ study labeling experiment, I show that biosynthesis of carbohydrates and amino acids in

Chapter 1
24
EPS and total carbohydrate and amino acid pools can be determined by LC/IRMS. Water extractable EPS were composed predominantly of carbohydrates, whereas amino acids played a minor role, both in terms of concentration and production. CHAPTER 6. Tracing carbon flow from microphytobenthos to major bacterial groups in an intertidal marine sediment by using an in-situ 13C pulse-chase method In this chapter we describe the results of a study on the carbon flow from benthic primary producers to the heterotrophic microbial community. An in-situ 13C-labeling approach was used and label incorporation into carbohydrates, EPS, SCOA, and PLFA and rRNA biomarkers was traced for 5 consecutive days. By magnetic bead capture hybridization of 13C content in specific 16S ribosomal RNA’s extracted from the sediment, we were able to measure 13C-label incorporation in heterotropic bacteria that were identified to the family level. PLFA biomarkers only have a phylogenetic resolution that does not exceed the level of domain or kingdoms. Diatoms were the predominantly primary producers, and Gammaproteobacteria, Bacteroidetes, and Deltaproteobacteria were the major heterotrophic bacterial groups. Data suggest a fast transfer of label from diatoms to bacteria during the first 24h, which was probably due to the exudation of low-molecular-weight organic compounds by the diatoms such as SCOA that were directly consumed by the bacteria. After this initial fast transfer, labeling of bacteria proceeded at a slower rate, which coincided with the degradation of carbohydrates from water-extractable EPS produced by the diatoms. Water-extractable EPS proved to be a major intermediate in the carbon flow from the diatoms to the bacteria. Labeling in bacteria tracked labeling in the diatoms, suggesting a closely coupled system. The heterotrophic bacterial groups benefited equally from the organic matter released by the diatoms, suggesting limited specialization in this microbial food web. CHAPTER 7. Seasonal changes in the biochemical fate of carbon fixed by benthic diatoms in intertidal sediments In this chapter I describe a seasonal in-situ study of the carbon flow within a benthic diatom mat by following the 13C-labeling dynamics in various cellular compounds. At regular intervals of two months during a year the fate of fixed carbon was followed for 5 consecutive days and related to a number of environmental and photosynthetic parameters. In this way I was able to cover seasonal variations. The fixed carbon was recovered from carbohydrates, amino acids, fatty acids, and nucleic acids. The
1
General introduction
25
results indicated that the benthic diatom mat responded to seasonal environmental factors by a different distribution of photosynthetically fixed carbon over the various carbon pools that were measured. In summer the diatoms decreased carbon fixation and accumulated relatively more lipids compared to carbohydrates as storage compound. It seemed that the physiology of the diatoms changed during the summer. This distinct seasonal difference correlated significantly to fluctuations in light intensity and temperature. CHAPTER 8. Seasonal changes in the production of extracellular polymeric substances and its fate to the heterotrophic bacterial community in an intertidal diatom mat In this chapter the seasonal dynamics of EPS and SCOA exuded by benthic diatoms and the use of these exudates as a carbon source by heterotrophic bacteria are described. Throughout the year the EPS consisted mostly of carbohydrates with small contributions of amino acids. In order to compare our results with those of studies that use another operational defined fraction than we used in the present study (e.g. a cation-exchange resin instead of EDTA), a comparison of EPS extraction protocols was made. Although both methods extracted the same type of EPS, the EDTA was 4-fold more efficient in extraction of EPS compared to the cation-exchange resin. EPS production depended strongly on the season and correlated significantly to environmental and photosynthetic parameters. The seasonal variation of exudates produced by diatoms played an important role in shaping the community composition and diversity of the associated bacteria. CHAPTER 9. General discussion The research presented in this thesis is discussed and integrated to reach overall conclusions and recommendations for further research.

Chapter 1
26
2
3
4
27
PART 1. Stable isotope methodology
P
art
1

2
3
4
28

A versatile method for stable carbon-isotope analysis of carbohydrates by high-performance liquid chromatography - isotope ratio mass-spectrometry Published in Rapid Commun. Spectrom. 2008; 22: 3902-3908 H.T.S. Boschker, T.C.W. Moerdijk-Poortvliet, P. van Breugel, M. Houtekamer and J.J. Middelburg Netherlands Institute of Ecology (NIOO-KNAW), Centre for Estuarine and Marine Ecology, P.O. Box 140, 4400 AC Yerseke, The Netherlands
2 C
hapt
er

Part1 Chapter 2
30
Abstract
We developed a method to analyze stable carbon isotope (13C/12C) ratios in a variety of carbohydrates using high-performance liquid chromatography / isotope ratio mass-spectrometry (HPLC/IRMS). Chromatography is based on strong anion-exchange columns with low strength NaOH eluents. An eluent concentration of 1 mM resulted in low background signals and good separation of most of the typical plant neutral carbohydrates. We also show that more strongly bound carbohydrates such as acidic carbohydrates can be separated by inclusion of NO3
- as an inorganic pusher ion in the eluent. Analyses of neutral carbohydrate concentrations and their stable carbon isotope ratios are shown for plant materials and marine sediment samples both at natural abundance and for 13C-enriched samples. The main advantage of HPLC/IRMS analysis over traditional gas-chromatography based methods is that no derivatization is needed resulting in simple sample treatment and an improved accuracy and reproducibility.
2
Stable isotope analysis of carbohydrates
31
Introduction Carbohydrates in their various forms take a central place in the biosphere. They are the first compounds formed during photosynthesis and are major substrates for heterotrophic organisms. Carbohydrates are found in structural materials like in the lignocellulose of the plant cell wall and in storage products such as starch. In addition, they are excreted by many organisms as extracellular polysaccharides. The extracellular release of carbohydrates by diatom biofilms on coastal sediments has major consequences for food web functioning and sediment stability (de Brouwer & Stal, 2002). Carbohydrates are also a major part of soil, sediment and dissolved organic matter pools and as such play an important role in the carbon cycle by providing labile substrates for growth and respiration and refractory components for the accumulation of organic carbon (Moers et al., 1993; Amon et al., 2001; Derrien et al., 2004). Given their many functions and wide use, it is not surprising that many different forms of monomeric carbohydrates are found in natural systems, which include neutral sugars, sugar alcohols, uronic acids and amino sugars. Stable carbon isotope (13C/12C) analysis of carbohydrates has been very useful not only in studying sources of carbohydrates and their turnover in the environment (Moers et al., 1993; Derrien et al., 2004) but also to detect food adultery (Cabanero et al., 2006) and to trace microbial biomass dynamics (Glaser & Gross, 2005).
Gas chromatography combustion isotope ratio mass spectrometry (GC-c-IRMS) has been the principle method for compound specific isotope analysis and several methods are available for the isotopic analysis of carbohydrates (Moers et al., 1993; van Dongen et al., 2001; Derrien et al., 2003). Carbohydrates however need to be heavily derivatized before they are amendable to isotopic analysis by gas-chromatography, and substantial corrections have to be made for the carbon atoms added during derivatization and for the kinetic isotope effects associated with some methods (Macko et al., 1998; Teece & Fogel, 2007). These corrections decrease accuracy and reproducibility of the stable isotope analysis and stringent testing of analytical procedures is needed to determine correction factors which vary among carbohydrates and possibly also with sample matrix. Moreover, GC-c-IRMS methods have a limited analytical range and are only available for neutral sugars, sugar alcohols and amino sugars (Moers et al., 1993; Glaser & Gross, 2005).
High performance liquid chromatography based methods are used widely for the direct analysis of carbohydrates without derivatization (Quemener et al., 1997). Recently, the first commercially available high-
Part1 Chapter 2
32
performance liquid chromatography / isotope ratio mass-spectrometry (HPLC/IRMS) system was described by Krummen et al. (2004) that holds great promises for the stable isotope analysis of specific (biological) compounds that are water soluble such as carbohydrates. This system is based on wet chemical oxidation of all eluting compounds with peroxidisulfates under acidic conditions. The carbon dioxide released is removed from the eluent flow in a miniature membrane separator with a helium flow and carried into the IRMS after water vapor removal. Carbohydrate analysis with this HPLC/IRMS system has been shown (Krummen et al., 2004; Cabanero et al., 2006; Penning & Conrad, 2006), but the available methods have limited application in environmental and biological studies due to a rather narrow analytical range as separation of only glucose, fructose and sucrose has been shown. These methods cannot be used to separate the typical plant carbohydrates. A versatile and commonly used HPLC approach for analyzing carbohydrate concentrations is by anion exchange chromatography with strong alkaline eluents and sensitive pulsed-amperometric detection (HPAEC-PAD) (Johnson & Lacourse, 1990; Panagiotopoulos & Sempere, 2005). This method can be adapted for a wide range of carbohydrates by changing eluent composition. However, the chromatographic part of this method cannot be directly transferred to HPLC/IRMS, because the strong alkaline eluents generally result in high carbon backgrounds due to carbonate inclusion in the eluent and may also interfere with the acidic wet oxidation process. In addition, the commonly used organic sodium acetate pusher cannot be used in HPLC/IRMS to elute stronger binding carbohydrates such as uronic acids.
We have adapted the HPAEC method to make it applicable to HPLC/IRMS. Principle changes were the use of a narrow bore column to adapt to the low flow limits of the HPLC/IRMS and a low strength NaOH eluent. This significantly lowered carbon backgrounds and improved separation of the major neutral sugars without interfering with the wet oxidation process. We also investigated the use of nitrate (NO3
-) as an alternative pusher ion over the commonly used carbon-containing acetate to show the analysis of strongly bound carbohydrates like acidic sugars. The method yields accurate and reproducible δ13C and concentration data for a range of carbohydrates including the typical plant carbohydrates in natural samples with minimal sample preparation.

2
Stable isotope analysis of carbohydrates
33
Experimental Chemicals and reagents All reagents were of analytical grade and were purchased from Sigma (St. Louis, USA), except NaOH solution (50%) and D(+) galacturonic acid which were purchased from Fluka (Buchs, Switzerland). The carbohydrates standards used during this study are given in table 2.1. Freshly prepared Milli-Q water (18.2 MΩ, DOC free; Millipore, Bedford, USA) was used in all experiments. Table 2.1. Stable carbon isotope analysis of carbohydrate standards by EA-IRMS, µEA-IRMS and HPLC/IRMS. Stable isotope data are the averages and SD of five replicate analysis for EA-IRMS and μEA-IRMS (5 nmol carbohydrate injected with 50 µL loop). HPLC/IRMS data (N is 20 to 30 depending on compound) and based on replicate analysis of a concentration range from the detection limit to the maximum concentration used (20 nmol carbohydrate injected with 10 μL loop). Detection limits for HPLC/IRMS are amounts of carbohydrate injected at which reproducibility (SD) was better than 0.5 ‰ .
CarbohydrateDetection
limit (nmol)
Fucose -26.61 ± 0.04 -26.48 ± 0.09 -26.72 ± 0.23 0.5
Rhamnose -24.81 ± 0.05 -24.75 ± 0.04 -24.78 ± 0.38 0.5
Galactose -23.38 ± 0.17 -23.72 ± 0.07 -23.37 ± 0.47 0.5
Glucose -10.95 ± 0.17 -12.12 ± 0.16 -11.42 ± 0.41 0.5
Xylose -21.09 ± 0.03 -21.60 ± 0.16 -20.93 ± 0.36 1.0
Mannose -28.17 ± 0.03 -28.01 ± 0.07 -25.13 ± 1.73* 1.0
Fructose -24.85 ± 0.03 -24.96 ± 0.07 -25.83 ± 2.32* 2.0
Ribose -14.56 ± 0.10 -15.47 ± 0.16 -14.42 ± 1.44 2.0
Muramic acid -19.99 ± 0.38 -20.59 ± 0.29 -19.31 ± 0.56 0.5
Galacturonic acid -22.84 ± 0.16 -23.67 ± 0.16 -23.32 ± 0.70 0.5
Glucuronic acid -7.24 ± 0.19 -8.82 ± 0.15 -7.77 ± 0.30 1.0
EA-IRMS μEA-IRMS HPLC-IRMS
δ13C (‰) δ13C (‰) δ13C (‰)
*: Mannose and fructose were not completely separated at higher concentrations.

Part1 Chapter 2
34
HPLC/IRMS High performance anion-exchange chromatography was carried out on a Thermo Surveyor system consisting of an HPLC pump (MS Pump Plus) and autoinjector (Autosampler Plus; Thermo Electron, Bremen, Germany), fitted with a CarboPac PA20 guard and narrow-bore analytical column (3 × 150mm; Dionex Benelux, Amsterdam, the Netherlands) and eluted at 300 µL min-1 isocratically, either with 1 mM NaOH for analyzing neutral carbohydrates or with 1 mM NaOH and 2 mM NaNO3 for analyzing acidic carbohydrates. The column was regularly regenerated with 200 mM NaOH. All eluents were carefully degassed in an ultrasonic bath for 30 min before NaOH and NaNO3 were added and further degassed with helium during analysis. ‘No-Ox’ tubing (1/8” × 1.5” mm; Socochim, Lausanne, Switzerland) was used to connect the eluent bottles to the pump to prevent atmospheric gases to re-enter solvents. All pump heads were rinsed at least once a day to prevent crystallization. An in-line filter of 2 µm (Vici, Schmidlin Labor, Switzerland) was placed after the LC column to avoid any particles passing into the interface.
The HPLC system was coupled to the IRMS by an LC Isolink interface (Thermo Electron, Bremen, Germany) first described by Krummen et al. (2004). The technique of the Isolink interface is based on wet oxidation of organic analytes with peroxodisulfate under acidic conditions. The CO2 produced is subsequently separated from the mobile phase in a capillary gas exchanger flushed with helium gas, dried and enters the ion source of the mass spectrometer in a helium stream via an open split interface. The temperature of the oxidation reactor was set at 99.9 oC. The flow rates of the acid (1.5 M H3PO4) and oxidant reagents (0.7 M NaS2O6) were 50 µL min-1 each. Samples can also be injected directly on the LC Isolink interface, which then operates as a sensitive elemental analyzer IRMS (μEA-IRMS) (Krummen et al., 2004).
Isotopic ratio measurements were carried out on a Delta V Advantage IRMS (Thermo Electron, Bremen, Germany). The control of the HPLC/IRMS system and data collection was done using Isodat 2.5 SP 1.13 software. Baseline corrections were done by the basic algorithm provided by the Isodat software and manually optimized where necessary. To calibrate the system, two pulses of CO2 reference gas were admitted into the inlet of the IRMS for about 20 s each at the beginning of a run. The reference gas was regularly calibrated against phthalic acid (Schimmelmann, Bloomington, USA) with a δ13C value of -27.21 ± 0.02 ‰. Stable carbon isotope ratios are reported in the delta-notation: δ13C (‰) = (Rsample/RVPDB)-1) x 1000, where Rsample and RVPDB are the 13C/12C-ratio in the sample and international standard (Vienna Pee Dee

2
Stable isotope analysis of carbohydrates
35
Belemnite), respectively. Peak identification was based on retention times in comparison with external standards. Concentration measurements were based on peak areas of the separated compounds and calibrated against external standards. Samples Several typical coastal marine materials were collected and analyzed for their neutral carbohydrate and isotopic composition: a marine macroalgae, Ulva sp.; a C3 macrophyte, Festuca rubra; a C4 macrophyte, Spartina anglica, and an intertidal marine sediment, both natural and 13C-labeled. Ulva sp. and sediment cores (7 cm ID) were collected at a tidal flat in the Eastern Scheldt estuary (The Netherlands). The sediment was covered with a thin brown mat of benthic phototrophic microalgae mainly consisting of diatoms. One set of sediment cores was labeled with NaH13CO3 (99 % 13C, Isotec, the Netherlands) by adding 1 mL of a 10 mM solution in artificial seawater (Ca2+ and Mg2+ free) to the top of the sediment core and incubating the cores for 2 h at environmental temperature and light conditions. The upper 0.5 cm layers of the labeled and unlabeled sediment cores were subsequently sampled. Festuca rubra and Spartina spp. were archived samples collected at the Schiermonnikoog salt marsh (the Netherlands) from an earlier study (Bouillon & Boschker, 2006). All samples were stored frozen (-20 oC) until analysis. Prior to analysis the samples were lyophilized for 48 hours and grinded to a fine powder in a sample mill (MM 2000, Retsch, Germany). All samples were analyzed in triplicate.
Total organic carbon content and δ13C ratios were determined by elemental analyzer IRMS (EA-IRMS) consisting of a Flash EA 1112 Series elemental analyzer coupled via Conflo III interface to a Delta V Advantage IRMS (Thermo Electron, Bremen, Germany) (Bouillon & Boschker, 2006). Sample preparation For neutral carbohydrates, plant tissue (25 mg) and sediment (500 mg) were hydrolyzed under acidic conditions using the sulfuric acid method (Cowie & Hedges, 1984). Samples were stirred with 0.5 mL of 11 M H2SO4 at room temperature for 1 h. The solution was diluted to 1.1 M H2SO4 and hydrolyzed for 1 h at 120 oC. Samples were cooled in crushed ice. The hydrolysate was neutralized to pH 5.5-6.0 by adding BaCO3 and the BaSO4 precipitate was removed by centrifugation (15 min, 4000 g). The supernatant was collected and frozen overnight to further precipitate BaSO4. Finally the samples were filtered over a 0.22 µm filter (Millex-

Part1 Chapter 2
36
GV4; Millipore, Bedford, USA), placed into 1 ml glass vials and analyzed by HPLC/IRMS.

2
Stable isotope analysis of carbohydrates
37
Results and discussion
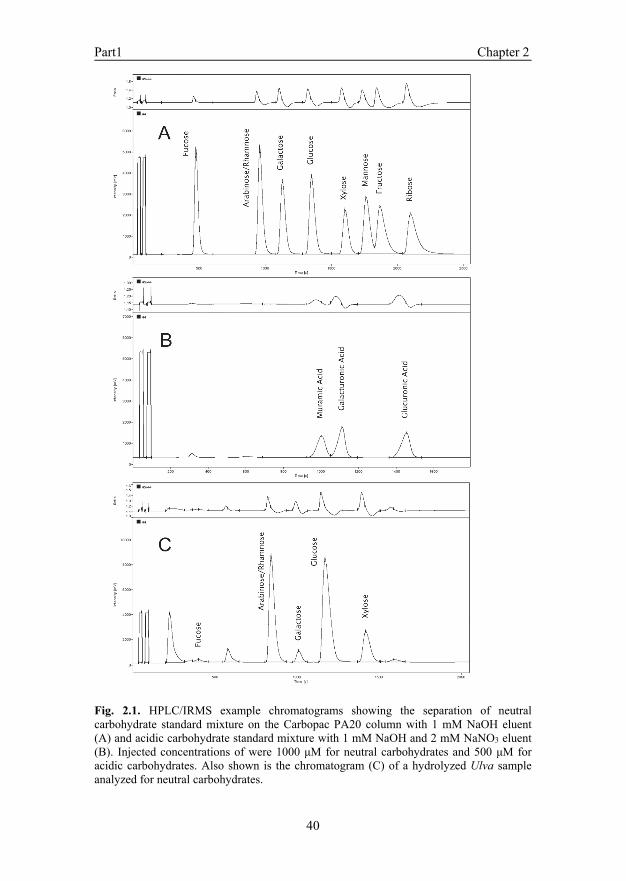
Since the description of the first commercial HPLC/IRMS system (Krummen et al., 2004), several well-designed methods have been described for 13C analysis of amino acids, peptides, and volatile fatty acids (Godin et al., 2005; Heuer et al., 2006; McCullagh et al., 2006; Penning & Conrad, 2006; Schierbeek et al., 2007). Although two published methods are available for carbohydrates analysis by an HPLC/IRMS (Cabanero et al., 2006; Penning & Conrad, 2006), these have a rather limited range of carbohydrates that can be separated and for which reliable isotope data can be obtained. We have adapted a commonly used method for carbohydrate analysis by HPLC, which is based on the use of strong ion exchange columns and relatively strong NaOH eluents typically in combination with pulsed-amperometric detection (Johnson & Lacourse, 1990). The main adaptation was the use of a weak NaOH eluent, which not only improved separation of neutral carbohydrates, but also lowered background levels. Chromatography A concentration of 1 mM NaOH was found to be optimal for the separation of more than seven commonly occurring plant neutral carbohydrates (Fig. 2.1A). Only arabinose and rhamnose eluted closely together and could not be resolved on the Carbopac PA20 column. This is a problem with this type of column and can be circumvented by using other available columns such as the Carbopac PA1 column (Dionex Benelux B.V., Amsterdam, the Netherlands) that show better separation of these two carbohydrates, but have the disadvantage of limited separation of xylose and mannose. Amino sugars, commonly found in minor amounts in sediments and mainly derived from microbial biomass and zooplankton remains, are also not separated and elute in the arabinose to galactose region (data not shown). However, amino sugars normally occur in relatively low concentrations in marine sediments (Dauwe & Middelburg, 1998) and can be removed easily with cation-exchange resins. There may also be a small overlap between mannose and fructose (Fig. 2.1A), especially at high sugar concentrations and when the analytical column needs to be regenerated.
A disadvantage of using low NaOH concentrations is that the analytical column slowly loses activity probably because stronger binding anions like carbonate from the eluent or salts in the injected samples are not completely washed out and compete with the carbohydrates for binding sites. This results in a gradual decrease in retention times (Fig.

Part1 Chapter 2
38
2.2) and a resulting decrease in separation. The column can be regenerated with 200 mM NaOH, and a 5 min regeneration step is sufficient after each run. However, it took about 30 min before IRMS background signals stabilized after regeneration, and our currently preferred, timesaving approach is to run the machine isocratically until separation deteriorates too far, which typically occurs after 15 to 25 runs with clean samples. The column is subsequently regenerated with 200 mM NaOH for 20 min followed by a 30 min equilibration at 1 mM NaOH. The shifting retention times cause little problems with identifications based on retention times as run-to-run shifts are mostly small and approximately linear with the number of injections (Fig. 2.2). In addition, chromatograms from samples are usually rather simple (e.g. Fig. 2.1C) and standards can be injected along with problematic samples.
Another major advantage when 1 mM NaOH was used as an eluent was a strong decrease in carbon dioxide background to about 200 mV (Fig. 2.1A and B), which is at the lower end of the reported range for other HPLC/IRMS methods (Cabanero et al., 2006; Heuer et al., 2006; Penning & Conrad, 2006). The commonly used 10 to 200 mM NaOH concentrations in combination with this type of analytic column, resulted in backgrounds of 1 to 3 V (data not shown) even though eluents were prepared with minimal carbonate impurities by carefully degassing freshly prepared MilliQ water before adding NaOH from a carbonate free 50% stock. Such high backgrounds would seriously affect detection limits and the reproducibility of the 13C analysis. The LC Isolink interface uses a wet oxidation method under acidic conditions and it has been suggested that HPLC/IRMS is therefore only possible with eluents having a pH lower than 8 (Krummen et al., 2004). However, we did not observe any problems with the efficiency of the wet oxidation process even with 200 mM NaOH eluents. The amounts of acid added in the interface are in principle sufficient to neutralize up to approximately 750 mM NaOH at a column flow of 300 μL min-1.
High concentrations of sodium acetate are commonly used as a pusher for compounds that are more strongly retained such as oligomeric and acidic carbohydrates. An organic pusher cannot be used in HPLC/IRMS due to the design of the interface and would lead to very high backgrounds. However, other weakly bound anions can also be used instead of sodium acetate (Wong & Jane, 1995). We tested NaNO3 as an alternative inorganic pusher and figure 2.1B shows the excellent separation of three common acidic carbohydrates namely muramic acid and two uronic acids in an isocratic run with 1 mM NaOH and 2 mM NaNO3. This finding widens the analytical window to all carbohydrates

2
Stable isotope analysis of carbohydrates
39
currently analyzed by HPLC-PAD including oligomeric carbohydrates and possibly also sulfated and phosphorilated carbohydrates by varying the NaNO3 concentration similarly as done with sodium acetate.
Part1 Chapter 2
40
Fig. 2.1. HPLC/IRMS example chromatograms showing the separation of neutral carbohydrate standard mixture on the Carbopac PA20 column with 1 mM NaOH eluent (A) and acidic carbohydrate standard mixture with 1 mM NaOH and 2 mM NaNO3 eluent (B). Injected concentrations of were 1000 μM for neutral carbohydrates and 500 μM for acidic carbohydrates. Also shown is the chromatogram (C) of a hydrolyzed Ulva sample analyzed for neutral carbohydrates.

2
Stable isotope analysis of carbohydrates
41
Fig. 2.2. Shift in retention time (Rt, seconds) of the glucose peak during consecutive runs. Other carbohydrates showed similar shifts. The arrow indicates column regeneration with 200 mM NaOH as described in the text.

Part1 Chapter 2
42
Stable carbon isotope analysis of carbohydrate standards We injected a range of concentrations of all different carbohydrates used in this study (Table 2.1; Fig. 2.1) to determine detection limits and linearity for both carbon isotopic ratios and peak area. Peak areas as a measure of carbohydrate concentration were highly linear at all concentrations tested (5 to 2000 μM (equals 50 pmol to 20 nmol carbohydrate injected with a 10 μL loop), R2 higher than 0.995, data not shown), showing that the method is also suited to determine carbohydrate concentrations. Stable carbon isotope ratios remained within acceptable limits (SD < 0.5 ‰) from about 500 pmol (36 ng C) carbohydrate injected for glucose to 2 nmol (150 ng C) for late eluenting carbohydrates and up to the highest concentrations tested (Table 2.1; Fig. 2.3). Typically a peak height of 500 mV or more was needed for accurate isotope ratio analysis, below which large deviations from the expected isotopic ratio occurred, possibly due to errors in baseline correction. When using a 10 μL injection loop, this translates to a detection limit of 50 to 200 μM. The sensitivity can be increased even further to 10 to 40 μM by using 50 μL injections providing ample scope for the carbon isotope analysis of carbohydrates in natural materials.
We compared δ13C ratios as analyzed by HPLC/IRMS, μEA-IRMS and traditional EA-IRMS for all carbohydrates to determine reliability of the HPLC/IRMS data (Table 2.1; Fig. 2.4). Carbon isotope ratios based on μEA-IRMS corresponded well with those based on conventional EA-IRMS (Table 2.1), but there was a tendency for a small negative bias for heavier isotope values (Fig. 2.4A). Carbohydrates were dissolved in milli-Q water when analyzed by μEA-IRMS and the observed offset is most likely due to a small isotopically-depleted carbon blank in the water. Unfortunately, the amount of carbon in this blank was too low (about 1.5 nmol C) for accurate δ13C ratio measurement and no corrections could accordingly be made. Reproducibility of HPLC/IRMS measurements was very good and HPLC/IRMS and EA-IRMS were in excellent agreement (Table 2.1; Fig. 2.4B), except for mannose and fructose which were not always completely separated at higher concentrations and the late eluting ribose. The small bias observed with μEA-IRMS was not observed with HPLC/IRMS, because HPLC separated the blank contamination from the sugars. It should be noticed that the HPLC/IRMS data were based on a range of concentrations from the detection limit of 50 μM to 200 μM, depending on carbohydrate analyzed, to the maximum concentration of 2000 μM. Our assessment therefore represents a worst case scenario. As expected, standard deviations of isotope measurements were lower if samples were analyzed

2
Stable isotope analysis of carbohydrates
43
over a more restricted range of concentrations (Table 2.2). A 13C-enriched glucose (IAEA-309A, certified at δ13C = 93.9 ± 1.0 ‰) was also analyzed by HPLC/IRMS using a two point calibration with our un-labeled laboratory glucose reference (δ13C = -10.95 ± 0.17 ‰) and the international glucose reference IAEA-309B (δ13C = 535 ± 5 ‰). The IAEA-309A glucose reference gave an isotope ratio of 90.8 ± 1.8 ‰ (N=5, AVG ± SD) when analyzed in this way, which is close to the certified value. These results show that stable isotope ratios both at natural abundance and enriched in 13C of more than nine commonly observed carbohydrates can be analyzed reproducibly and accurately by HPLC/IRMS if complete separation of the compounds of interest can be achieved.
Fig. 2.3. Effect of injected amount of carbohydrate on the stable isotopic ratio of glucose and galactose. A 10 μl injection loop was used and other carbohydrates showed similar results if they were fully separated from other components.

Part1 Chapter 2
44
Fig. 2.4. Comparison of stable isotope ratios of individual carbohydrates as by μEA-IRMS versus traditional EA-IRMS (A) and HPLC/IRMS versus traditional EA-IRMS (B). Mannose and fructose were not completely separated and are indicated separately in figure 2.4B, as is ribose the latest eluting compound. The 1:1 line is also indicated in both figures. Stable isotope analysis of carbohydrates in environmental materials We analyzed several typical materials from coastal marine environments for neutral carbohydrate stable isotope content (Table 2.2) and concentrations (Table 2.3). The H2SO4 method was used to hydrolyze the samples as it is a commonly used for environmental samples (Cowie & Hedges, 1984) and the neutralized hydrolyzates could be directly analyzed by HPLC/IRMS without further sample treatment even for salt-containing marine sediments. This suggests that salt concentrations were sufficiently low probably as a result of the tenfold dilution during the second step of the hydrolysis with 1.1 M sulfuric acid. Carbohydrate standards dissolved in seawater could only be analyzed without a collapse of chromatography when diluted to a similar extent. The H2SO4 method cannot be used for the analysis of acidic carbohydrates as they are lost during hydrolysis or during subsequent neutralization with BaCO3. Two other methods of hydrolysis were therefore also tested namely using trifluoracetic acid (TFA) alone or in combination with methanolysis (de Ruiter et al., 1992). These hydrolysis methods yield higher recoveries for some types of carbohydrates such as uronic acids and sample neutralization is easier as

2
Stable isotope analysis of carbohydrates
45
TFA can be removed by evaporation. However, we found that these two hydrolysis methods were incompatible with HPLC/IRMS as chromatography degraded completely even when samples were diluted similarly as with the H2SO4 method. This collapse in chromatography is probably due to either higher inorganic salt concentrations as some anions are not removed with BaCO3 precipitation or possibly the presence of organic ions like amino acids in the TFA hydrolysates. Further sample treatment will therefore be essential for TFA and probably also HCl based hydrolysis procedures. Fortunately, impurities disturbing chromatography were apparently removed in the H2SO4 method either during sample neutralization with BaCO3 or diluted far enough enabling a very simple and fast sample treatment.
Stable isotope ratios for the individual neutral carbohydrates in the plant materials typically showed standard deviations of 0.4 ‰ or less (Table 2.2). Data for the unlabeled sediment sample appeared somewhat more variable though standard deviations were still low. This higher variability is probably a result of natural variability as three different sediment cores were used as replicates. Natural variation in the stable isotope ratios of sediment carbohydrates was apparently higher than our analytical precision. Results from the 13C-labeled sediment cores were also more variable. Again this can be attributed to small differences in carbohydrate synthesis rates in the individual sediment cores incubated. This pilot experiment clearly shows that our technique provides large potential to trace carbohydrate dynamics in natural ecosystems. Individual carbohydrates were typically enriched in 13C-ratio in comparison with bulk organic carbon ratios in unlabeled samples (Table 2.2) and enrichment levels fall well within the range reported for the individual carbohydrates (Macko et al., 1990; Moers et al., 1993; van Dongen et al., 2002; Teece & Fogel, 2007). In fact, isotopic enrichment factors in four out of five carbohydrates were rather similar for the two macrophytes analyzed and much less variable among samples (Fig. 2.5) than previously reported (Moers et al., 1993; van Dongen et al., 2002; Teece & Fogel, 2007). This could be due to the similarity in growth conditions of the macrophytes as both plant species were sampled from the same salt marsh at the same time. In addition, the results for the macroalgae Ulva were mostly in line with the macrophyte data except for the combined arabinose/rhamnose peak, which may be due a dominance of the pentose arabinose in macrophytes (Cowie & Hedges, 1984) whereas the hexose rhamnose is more abundant than arabinose in Ulva (Lahaye & Jegou, 1993). The hexoses glucose and galactose were isotopically lighter than the pentoses arabinose and xylose for the two macrophyte samples, as has

Part1 Chapter 2
46
Sample
Spartina 18 ± 1 213 ± 21* 76 ± 8 832 ± 52 703 ± 35 nd
Festuca 41 ± 5 175 ± 26* 74 ± 11 849 ± 115 634 ± 89 nd
Ulva 3.8 ± 0.2 373 ± 46 38 ± 5 493 ± 63 169 ± 20 nd
Sediment 0.37 ± 0.07 0.61 ± 0.21 1.26 ± 0.15 3.42 ± 0.06 0.67 ± 0.19 1.03 ± 0.31
Sediment 13
C labeled
0.36 ± 0.09 0.71 ± 0.03 1.01 ± 0.08 3.06 ± 0.22 0.70 ± 0.06 0.41 ± 0.04
concentration (μmol/g DW)
Fucose Rham./Arab. Galactose Glucose Xylose Mannose
been shown before (van Dongen et al., 2002; Teece & Fogel, 2007). The sediment labeling experiment showed major differences in 13C-labeling of individual carbohydrates suggesting that they were synthesized at different rates. Labeling was especially high in glucose, which is not surprising as it is the first sugar that is synthesized during photosynthesis and glucose in the form of chrysolaminaran is also a major storage compound in diatoms (Granum et al., 2002). The other carbohydrates were far less labeled and are mainly found in cell walls and extracellular polysaccharides (de Brouwer & Stal, 2002; Granum et al., 2002), which are apparently synthesized at lower rates during the short incubation time used in this initial study.
Table 2.2. Stable carbon isotope compositions of neutral carbohydrates as detected in H2SO4 hydrolyzates of typical coastal marine materials. Stable isotope data are the average and SD of three replicate samples.
*: Predominantly arabinose, as rhamnose concentrations are generally low in higher plants Table 2.3. Neutral carbohydrates concentrations as detected in H2SO4 hydrolyzates of typical coastal marine materials. Concentration data are the average and SD of three replicate samples.
*: Predominantly arabinose, as rhamnose concentrations are generally low in higher plants
Sample
Spartina -9.8 ± ± 0.1*
-12.6 ± 0.1 -11.3 ± 0.2 -8.0 ± 0.2 nd -14.1 ± 0.0
Festuca -16.9 ± ± 0.2* -25.6 ± 0.1 -24.5 ± 0.0 -21.8 ± 0.2 nd -26.1 ± 0.0
Ulva -12.4 ± ± 0.1 -13.9 ± 0.2 -12.4 ± 0.2 -9.7 ± 0.4 nd -13.4 ± 0.1
Sediment -20.2 ± ± 0.8 -19.9 ± 0.3 -17.3 ± 0.4 -15.9 ± 0.4 -18.2 ± 0.3 -20.0 ± 0.2
Sediment 13
C labeled
48.1 ± ± 2.1 51.1 ± 8.2 796.6 ± 16.2 3.5 ± 0.7 8.9 ± 3.0 -4.7 ± 1.74.6 -1.3
0.6 -18.2
0.3 -12.4
0.4 -20.3
TOC
0.3 -7.2
Fucose Rham./Arab. Galactose Glucose Xylose Mannose
δ13C (‰)

2
Stable isotope analysis of carbohydrates
47
Fig. 2.5. The difference (Δδ13C) in δ13C ratios of neutral carbohydrates and bulk TOC (Table 2.1) for the three plant materials analyzed. Shown are averages ± SD for 3 replicates.

Part1 Chapter 2
48
Conclusions
We successfully developed a method to analyze stable carbon isotope ratios in carbohydrates by HPLC/IRMS using the LC Isolink interface that is based on ion exchange chromatography in combination with low strength alkaline eluents. We show the separation of a variety of neutral and acidic carbohydrates. The analytical window of the method can probably be easily extended to oligomeric carbohydrates and sulfate- or phosphorous-bound carbohydrates by varying the concentration of the NaNO3 pusher. We successfully analyzed neutral plant carbohydrate in typical marine materials both at the natural 13C-abundance level and for 13C-labeled material to study carbohydrate synthesis. Further applications of the method include the use of muramic acid as a biomarker to study bacterial dynamics, physiological studies on carbohydrate metabolism such as fermentation research and the use of carbohydrate substrates by various organisms, biogeochemical studies to determine the sources and fate of carbohydrates in natural ecosystems and food adultery studies.
Acknowledgements This research was partly funded by the Netherlands Organization for Scientific Research (NWO) VIDI grant to HTSB. We thank Cees Bruggink of Dionex Benelux BV, Amsterdam, the Netherlands for advice on chromatographic conditions and the editor and two anonymous reviewers for constructive feedback. This is publication number 4391 of the Netherlands Institute of Ecology (NIOO-KNAW).

A versatile method for simultaneous stable carbon isotope analysis of DNA and RNA nucleotides by liquid chromatography/isotope ratio mass spectrometry Published in Rapid Commun. Spectrom. 2014, 28: 1401-1411 Tanja C.W. Moerdijk-Poortvliet1, Jurian Brasser1, Gerjan de Ruiter1, Marco Houtekamer1, Henk Bolhuis1, Lucas J. Stal1,2, Henricus T.S. Boschker1 1Royal Netherlands Institute for Sea Research (NIOZ), PO Box 140, 4401 AC Yerseke, the Netherlands. 2University of Amsterdam, Department of Aquatic Microbiology, PO Box 94248, 1090 GE Amsterdam, The Netherland
3 C
hapt
er

Part1 Chapter 3
50
Abstract Liquid chromatography/isotope ratio mass spectrometry (LC/IRMS) is currently the most accurate and precise technique to measure compound specific stable carbon isotope (13C/12C) ratios in biological metabolites, which can be assayed at the level of their natural abundance. However, until now this technique could not be applied for the analysis of nucleic acids, the building blocks of the carriers of genetic information in living cells and viruses, DNA and RNA.
Mixed-mode chromatography (MMC) was applied to obtain the complete separation of nine nucleotides (eight originating from DNA/RNA and one nucleotide (Inosine monophosphate) that may serve as internal standard) in a single run using LC/IRMS. We also developed and validated a method for DNA and RNA extraction and an enzymatic hydrolysis protocol for natural samples, which is compatible with LC/IRMS analysis as it minimizes carbon blank. The method was used to measure the concentration and stable carbon isotope ratio of DNA and RNA nucleotides in marine sediment and in the common marine macro alga (Ulva sp.) at natural abundance levels as well as for 13C enriched samples.
The detection limit of the LC/IRMS method varied between 1.0 nmol for most nucleotides to 2.0 nmol for late eluting compounds. The intraday and interday reproducibility of nucleotide concentration measurements was better than respectively 4.1 % and 8.9 % and for δ13C measurements better than respectively 0.3 ‰ and 0.5 ‰. The obtained nucleic acid concentrations and nucleic acid synthesis rates were in good agreement with values reported in the literature.
This new method gives reproducible results for the concentration and δ13C values of nine nucleotides. This solvent-free chromatographic method may also be used for other purposes as for instance to determine nucleotide concentrations using spectrophotometric detection. This sensitive method offers a new avenue for the study of DNA and RNA biosynthesis that can be applied in various fields of research.

3
Stable isotope analysis of DNA and RNA nucleotides
51
Introduction The nucleic acids, deoxyribonucleic acid (DNA) and ribonucleic acid (RNA) are both essential for all forms of life. Nucleic acids are among the most important biopolymers together with proteins and carbohydrates and are abundantly present in all organisms, where they serve to encode, transmit and express genetic information (McKee & McKee, 2009). Nucleic acids are composed of nucleotide monomers, which consist of a phosphate group, a pentose sugar and a purine or pyrimidine base. The genetic information is contained in the sequence of these nucleotides (Watson & Crick, 1953). Besides being the building blocks of DNA and RNA, nucleotides are also crucial components of metabolic processes for instance in the form of ATP, which serves as the major energy carrier in organisms (Boyer, 1998). Nucleic acids are also essential intermediates in the global carbon cycle (Falkowski et al., 2000).
Compound specific stable isotope techniques are state-of-the-art for the study of the carbon cycle, because they provide information about concentrations and source and turnover rates of the compounds of interest (Peterson & Fry, 1987). The most common approach to determine natural abundance and low enrichment 13C/12C ratios in specific metabolites is compound specific stable isotope analysis (CSIA) by isotope ratio mass spectrometry (IRMS) (Jochmann & Schmidt, 2012). The main advantage of this technique is that the various compounds are separated before analysis without interference from impurities. Separation of the compounds can be done either by gas chromatography (GC) or liquid chromatography (LC). However, many of the components of interest in biological systems such as RNA and DNA nucleotides are polar and/or polymeric and therefore LC is the preferred chromatographic separation method.
The determination of DNA synthesis rates by using stable isotopes in combination with LC and Chemical Reaction Interface Mass Spectrometry (CRIMS) has been described in the literature (Lecchi & Abramson, 1999; Abramson, 2003). Auclair and coworkers (2012) developed a method that uses a liquid chromatograph coupled to a quadrupole mass spectrometer in order to measure the 13C enrichment of thymine incorporated into DNA. However, because of the relatively low accuracy at low enrichment of conventional mass spectrometry (MS) highly enriched compounds are required for reliable measurement of isotope ratios (Abramson, 2003; Godin et al., 2007). In addition, extensive

Part1 Chapter 3
52
incorporation of the labeled substrate is needed, eventually leading to excessive incubation times. The results obtained with this approach may therefore not reflect the actual environmental metabolism and hampers the accurate monitoring of 13C incorporation in DNA or RNA. Chen and Abramson (1998) described a method to determine DNA synthesis by analyzing 13C incorporation into the corresponding nucleosides based on the use of high performance liquid chromatography chemical reaction interface IRMS (HPLC/CRI/IRMS). Although this approach is highly sensitive for measuring isotopic enrichment, it involves complex instrumentation, which is not commercially available.
LC/IRMS is a promising technique for compound specific 13C analysis of DNA and RNA, because its ability to measure δ13C values at natural abundance as well as after isotope labeling in selected metabolites. For instance, methods for carbohydrate, amino acid and short chain organic acid analysis have been successfully implemented and used to study carbon cycling in microphytobentic communities in intertidal sediments and provided valuable information on bacteria-diatom interactions (Moerdijk-Poortvliet et al., 2013). Also in other research fields, a substantial number of applications to study metabolites have been published, emphasizing the power and robustness of LC/IRMS (Godin et al., 2005; Heuer et al., 2006; Schierbeek et al., 2007; Boschker et al., 2008; Godin et al., 2008; McCullagh et al., 2008; Smith et al., 2009; Cabanero et al., 2010).
The design of the LC/IRMS interface involves a number of analytical constraints (Krummen et al., 2004; Moerdijk-Poortvliet et al., 2013). The current design is not compatible with organic and other carbon-containing eluents, as the continuous oxidation of the eluent in the reactor unit would create a very high CO2 background. Bleeding of the analytical column should also be minimal for the same reason. In addition, to obtain accurate isotopic measurements, the components should be baseline separated. Considering all restrictions, the main challenge to perform CSIA of DNA and RNA nucleotides by LC/IRMS is to select a suitable column and the right conditions to separate all eight DNA and RNA nucleotides in one single run. Subsequently, a commonly used method to extract simultaneously DNA and RNA in conjunction with a method to hydrolyze the extracted nucleic acids to nucleotides had to be adapted to determine concentration and δ13C by LC/IRMS. All adaptations were to comply with the analytical constraints of the design of the LC/IRMS interface.

3
Stable isotope analysis of DNA and RNA nucleotides
53
A first attempt to analyze RNA nucleotides by LC/IRMS was made by MacGregor et al. (2004). McCullagh (2010) showed that polar molecules, such as a number of DNA-related nucleosides can be retained and eluted from mixed mode columns. However, a complete developed LC/IRMS method to perform CSIA for nucleic acids was not available. The aim of the present study was to develop a method to simultaneously measure the concentration and δ13C value in DNA and RNA nucleotides and to demonstrate its applicability for the study of DNA and RNA synthesis in intertidal marine sediments as well as in a macro alga.

Part1 Chapter 3
54
Experimental
Chemicals and standards Deoxyadenosine monophosphate was purchased from MP Biomedicals (Eindhoven, the Netherlands). All other reagents were purchased from Sigma (St, Louis, MO, USA) and were of analytical grade except for the nucleotide standards (purity > 95 %). Detailed information, such as name abbreviations, structural formulas, extinction coefficients, carbon content and molecular weights for all nucleotides is listed in table 3.1. Nuclease P1, obtained as a lyophilized powder, was dissolved in 50 mM potassium phosphate buffer, pH 5.8 and stored at 4 oC for a maximum of three weeks. Freshly prepared Milli-Q water (18.2 MΩ, DOC free; Millipore, Bedford, MA, USA) was used in all experiments.
The exact molecular mass of the purchased nucleotide standards was not known since they contained unspecified amounts of crystalline water and sodium. Hydrous molecular masses were calculated by two methods: (i) the carbon content of the individual nucleotides was analyzed by elemental analyzer/isotope ratio mass spectrometry (EA/IRMS) and (ii) the concentration of individual prepared stock solutions was determined via ultraviolet absorption spectrophotometric analysis (UV-VIS).
The carbon content was determined by a Flash EA 1112 Series elemental analyzer (EA) coupled via a Conflo III interface to a Delta V Advantage isotope ratio mass spectrometer (all Thermo Fisher Scientific, Bremen, Germany) (Boschker et al., 1999). The molecular mass (MM) of the nucleotide (g mol-1) was defined as MM NTD = MM CNTD *100 / C %, where MM CNTD denotes the molecular mass of carbon in the nucleotide as derived from the formulas in table 3.1 and C % is the carbon content determined by EA/IRMS.
UV-VIS, using Beer’s Law in combination with extinction coefficients (published by Cavaluzzi and Borer (2004) and Clonis and Lowe (1980)), was used as an alternative way to determine the hydrous molecular mass of the purchased nucleotide standards. Stock solutions (~10 mM in Milli-Q water) of the individual nucleotide standards were prepared, and subsequently diluted (in 100 mM sodium phosphate buffer, pH 7.0) to obtain an absorbance that is within the linear range of the spectrophotometer (absorbance unit <1.5), resulting in a series of 5 different nucleotide concentrations in the range of 0-100 µM. Each individual nucleotide concentration was measured in triplicate. The

3
Stable isotope analysis of DNA and RNA nucleotides
55
ε260
(pH
7)
Diff
eren
ce
Nuc
leot
ide
Form
ula
MM
* *
**%
CM
M
g/m
ol L
/mm
ol /c
m**
**SD
g/m
olSD
CV
%g/
mol
SDC
V%
%
Cyt
idin
e m
onop
hosp
hate
CM
PC
9H
12N
3Na 2
O8P.
yH20
367.
27.
0721
.60.
050
11
0.2
504
50.
90.
5
Ade
nosi
ne m
onop
hosp
hate
AM
PC
10H
12N
5N
a 2O
7P.
yH2O
391.
215
.02
23.8
0.0
504
10.
251
82
0.4
2.6
Gua
nosi
ne m
onop
hosp
hate
GM
PC
10H
12N
5N
a 2O
8P.
yH2O
407.
212
.08
22.2
0.2
541
61.
153
86
1.0
0.6
Urid
ine
mon
opho
spha
teU
MP
C9H
11N
2Na 2
O9P
368.
29.
6621
.80.
149
62
0.4
504
81.
61.
7
Deo
xycy
tidin
e m
onop
hosp
hate
dCM
PC
9H
12N
3Na 2
O7P
.yH
2O35
1.2
7.10
21.9
0.2
494
51.
046
36
1.2
6.6
Deo
xyad
enos
ine
mon
opho
spha
tedA
MP
C1
0H
12N
5N
a 2O
6P.
yH2O
375.
215
.06
26.6
0.2
451
40.
947
05
1.0
3.9
Deo
xygu
anos
ine
mon
opho
spha
tedG
MP
C1
0H
14N
5O
7P.
xNa.
yH2O
347.
2**
12.1
824
.40.
149
32
0.5
506
40.
82.
7
Deo
xyth
ymid
ine
mon
opho
spha
tedT
MP
C1
0H
13N
2N
a 2O
8P.
yH2O
366.
28.
5627
.40.
143
82
0.4
447
61.
31.
9
Inos
ine
mon
opho
spha
teIM
PC
10H
11N
4N
a 2O
8P.
yH20
392.
212
.3
22.1
0.1
544
30.
656
34
0.6
3.4
(250
nm)
*
an
hydr
ous
base
d
**
fre
e ac
id b
ased
****
det
erm
ined
via
EA
/IR
MS
anal
ysis
of t
he h
ydra
ted
com
poun
d
***
(C
aval
uzzi
and
Bor
er, 2
004
; Clo
nis
and
Low
e, 1
980)
Cal
cula
ted
Mol
ecul
ar M
asse
s (h
ydro
us)
MM
via
EA
/IR
MS
MM
via
UV
-VIS
molecular mass of each individual nucleotide was calculated from the measured concentration and the weight of the stock solution.
Tab
le 3
.1. C
hara
cter
isti
cs o
f pu
rcha
sed
DN
A a
nd R
NA
nuc
leot
ides
. Cal
cula
ted
hydr
ous
mol
ecul
ar m
asse
s an
d %
C
data
are
bas
ed o
n tr
ipli
cate
ana
lysi
s. C
oeff
icie
nts
of v
aria
tion
(C
V)
are
expr
esse
d in
%.
Part1 Chapter 3
56
LC/IRMS analysis of DNA and RNA nucleotides High performance liquid chromatography (HPLC) was carried out on a Surveyor system consisting of a HPLC pump (MS Pump Plus) and an autoinjector (Autosampler Plus) (all Thermo Fisher Scientific, Bremen, Germany), fitted with a PrimeSep D guard and mixed mode analytical column (4.6 x 150 mm, particle size 5μm, 100Å; Sielc, Prospect Heights, Il, USA) and eluted at 500 µL min-1 isocratically with 10 mM H2SO4, pH 2. The eluent was degassed in an ultrasonic bath for 15 min and further degassed with helium during analysis. ‘No-Ox’ tubing (1/8”x1.5” mm; Socochim, Lausanne, Switzerland) was used to connect the eluent bottles to the pump to prevent atmospheric gases from re-entering the solvents. All pump heads were rinsed at least once a day. An in-line filter of 2μm (Vici, Schmidlin Labor, Neuheim, Switzerland) was placed after the LC column to prevent particles from entering the interface. The HPLC system was coupled to the IRMS instrument by a LC isolink interface (Thermo Fisher Scientific, Bremen, Germany) first described by Krummen et al. (2004). The technique of the Isolink interface is based on wet oxidation of organic compounds with peroxodisulfate under acidic conditions. The CO2 that is produced from the oxidation was separated from the mobile phase in a capillary gas exchanger flushed with helium gas, dried, and subsequently entered the ion source of the mass spectrometer in a helium stream via an open split interface. The temperature of the oxidation reactor was set at 99.9 oC. The flow rates of the acid (1.5 M H3PO4) and oxidant reagent (0.7 M Na2S2O8) were each 50 μL min-1.
Isotopic ratio measurements were carried out on a Delta V Advantage isotope ratio mass spectrometer (Thermo Fisher Scientific, Bremen, Germany). The LC/IRMS system and data collection were controlled using Isodat 2.5 SP 1.13 software (Thermo Fisher Scientific, Bremen, Germany). To calibrate the system, two pulses of about 20s each of CO2 reference gas were admitted into the inlet of the isotope ratio mass spectrometer at the beginning of a run. The reference gas was regularly calibrated against phthalic acid (Schimmelman, Bloomington, IN, USA) with a δ13C value of -27.21 ± 0.02 ‰.
Peak identification was based on retention times obtained from external standards. Concentration measurements were based on peak areas of the separated compounds and calibrated against external standards. Injection volume was 50 µL for sediment samples and 10 µL for samples
3
Stable isotope analysis of DNA and RNA nucleotides
57
from the macro alga. Intraday (within a day) and interday (between days) reproducibility of the determination of nucleotide concentration and δ13C values by LC/IRMS were assessed by replicate analysis (n=8 for intraday precision and n=3 for interday precision) of the peak areas and δ13C values of all standards (1000 µM) on respectively one day and three different days in a four week time period.
Carbon content and isotopic composition of total organic carbon (TOC) were analyzed by using EA/IRMS. All samples were analyzed in triplicate.
Determination of carbon isotopic composition of standards The carbon isotopic composition of individual nucleotide standards was determined by three different techniques. First, the δ13C values were determined by using an EA/IRMS. Second, the δ13C values were determined by flow injection analysis IRMS (FIA/IRMS). Via direct injection into the flow path of the interface of the LC/IRMS system, the isotopic composition of individual nucleotides can be determined without using column separation (Godin et al., 2005). Like EA/IRMS, FIA/IRMS measures bulk δ13C values. The difference between the two techniques is that for FIA/IRMS the nucleotides need to be dissolved in Milli-Q while for EA/IRMS they are applied in solid form. Third, the δ13C values were determined by LC/IRMS. All values for each technique were determined in triplicate. Environmental samples Intertidal marine sediment and the marine macro alga, Ulva sp. were collected from the Eastern Scheldt estuary (the Netherlands) and analyzed for their DNA/ RNA nucleotide isotopic composition. Six sediment cores (7 cm i.d.) were collected. The sediment was covered with a thin brown mat of microalgae mainly composed of diatoms. Three sediment cores were labeled by adding 1 mL of a 10 mM NaH13CO3 (99 % 13C, Isotec, Stein, the Netherlands) solution to the surface of the sediment and were incubated for 4 h at ambient conditions of temperature and light. The NaH13CO3 solution was prepared in in artificial seawater (Ca2+- and Mg2+
-free) with a salinity of 30 ‰. Triplicate unlabeled cores were also processed. Subsequently, the upper 1.5 cm layer of the labeled and unlabeled sediment cores was sampled and thoroughly mixed. Ulva sp. was labeled under the same conditions. All samples were directly frozen and stored at -80 oC until analysis.

Part1 Chapter 3
58
Sample preparation DNA/RNA extraction DNA and RNA were co-extracted from the samples according to Griffiths et al. (2000) and Hurt et al. (2001), with modifications. Briefly, 5-10 g (wet weight) of sediment sample and 1 g (wet weight) of Ulva was added to 3 mL denaturing solution (4 M guanidine isothiocyanate, 10 mM Tris-HCl (pH 7.0), 1.0 mM EDTA, 0.5 % w/v 2-mercaptoethanol), vortexed for 3 min, followed by addition of 20 mL extraction buffer (100 mM sodium phosphate (pH 7.0), 100 mM Tris-HCl (pH 7.0), 0.1 mM EDTA (pH 8.0), 1.5 M NaCl, 1 % w/v hexadecyltrimethylammonium bromide (CTAB) and 2 % N-Lauroyl-Sarcosine), incubated at 65 oC for 30 min with gently manual mixing every 10 min and centrifuged at 1,800 × g for 10 min at 4 oC. The supernatants were transferred into a 50 mL tube on ice containing 20 mL aliquots of phenol/chloroform/isoamylalcohol (25:24:1, pH 6.7), manually mixed for 10 min and centrifuged at 5,000 × g for 30 min at 4 oC. The aqueous phase was recovered and residual phenol was removed by an equal volume (approximately 20 mL) of chloroform/isoamylalcohol (24:1) followed by centrifugation at 5,000 × g for 20 min at 4 oC. Subsequently, nucleic acids were precipitated from the aqueous layer with 1 volume of PEG-8000, 10 % w/v incubated 12 h at 4 oC, followed by centrifugation at 5,000 × g for 20 min at 4 oC. Pelleted nucleic acids were washed at least 4 times with ice-cold 70% (v/v) ethanol and air dried prior to dissolution in 60 μL Milli-Q water. The extracts were stored at -80 oC until analysis. DNA and RNA purity and approximate quantity were determined by a NanoDrop ND-1000 spectrophotometer (NanoDrop Technologies, Wilmington, Delaware, USA). Hydrolysis of DNA/RNA The extracted DNA and RNA were hydrolyzed by Nuclease P1, which cleaves both RNA and single stranded DNA into 5’-mononucleotides. The protocol was a modification of the method of Shimelis and Giese (2006). DNA/RNA (60 μL, 19-50 μg total DNA/RNA) was denatured at 95 oC for 15 min and treated with 80 μL, 50 mM potassium phosphate (pH 5.8), 20 μL, 30 U mL-1 Nuclease P1 (in 50 mM potassium phosphate buffer, pH 5.8), and 30 μL of Milli-Q water. The sample tube was capped and kept for 1 h at 37 oC. By centrifugal ultrafiltration (NanoSep, 3 kDa, Pall Life

3
Stable isotope analysis of DNA and RNA nucleotides
59
Sciences, Ann Arbor, MI, USA) the enzyme was removed from the sample. Shortly before use the applied filters were washed 8 times with 200 μL Milli-Q water and centrifuged at 10,000 × g for 5 min. Subsequently, together with the sample a known amount of internal standard (10 µL, 10 mM IMP) was applied in order to determine the recovery of the ultrafiltration step. All data were corrected for recovery. After centrifugal ultrafiltration of the sample (10,000 × g for 5 min) the filter was rinsed with 2 aliquots of 50 µL Milli-Q water. The sample and the rinse filtrate was pooled, freeze-dried and dissolved in 100 µL Milli-Q water before LC/IRMS analysis. Calculations Stable carbon isotope ratios are reported in the delta-notation:
δ13C (‰) = (Rsample/RVPDB)-1) x 1000 where Rsample and RVPDB denote the 13C/12C ratio in the sample and the international standard, Vienna Pee Dee Belemnite (for carbon RVPDB = 0.0111802 ± 0.0000009), respectively.
For metabolic studies it is more convenient to calculate the absolute amount of 13C incorporated into different carbon pools above background. This value is expressed as excess 13C and is calculated from δ13C sample as:
Excess 13C (mol 13C g-1 DW) =
( )( )
( )( ) sample
stbackground13
stbackground13
stsample13
stsample13
C1R11000/Cδ
R11000/Cδ
1R11000/Cδ
R11000/Cδ×
+×+
×+−
+×+
×+
where δ13Cbackground denotes the δ13C value of the unlabeled sample and Csample denotes the pool size in mol of carbon per gram of dry weight sample (mol C g-1 DW).
Synthesis rates of DNA and RNA are expressed in pmol 13C h-1 g-1
DW and calculated by the sum of the excess values of the individual nucleotides, divided by the incubation time (4 h).
Part1 Chapter 3
60
Results and discussion Chromatography Mixed-mode chromatography (MMC) was applied in order to obtain complete separation of the nine nucleotides (eight originating from DNA/RNA and IMP that was used as internal standard). The advantage of the MMC phase compared to other stationary phases is that interactions on the column are multiple controllable and effective under fully aqueous conditions and therefore lends itself very well to the chromatographic niche created by the constraints of the current design of the liquid interface of the LC/IRMS (McCullagh, 2010).
The applied Primesep D column is a bimodal column using two retention mechanisms: reversed phase and anion-exchange separation. The retention time of the analytes was controlled by ion-exchange interaction and ionization state of the stationairy phase (which can be adjusted by changing the pH of the mobile phase) and hydrophobic interactions of the nucleotide and the stationairy phase. Ten mM H2SO4 (pH 2) was found to be optimal for the separation of the eight nucleotides of DNA and RNA and the internal standard (IMP) (Fig. 3.1A). All nucleotides were completely baseline separated. In addition, the chromatograms from extracted and hydrolyzed sediment samples are straightforward and simple (e.g. Fig. 3.1B), showing excellent separation of the compounds of interest with minimal impurities. An impurity, originating from the filter used at the hydrolysis step, elutes at the beginning of the chromatogram. The concentration of this impurity is low and it does not interfere with the nucleotide analysis.
Although the chromatographic method was developed to separate nucleotides using LC/IRMS, it has also been applied successfully by us in traditional high performance LC (HPLC) using UV spectrophotometric detection at 260 nm to analyze nucleotide concentrations with the advantage of a water-based, solvent-free method (data not shown).
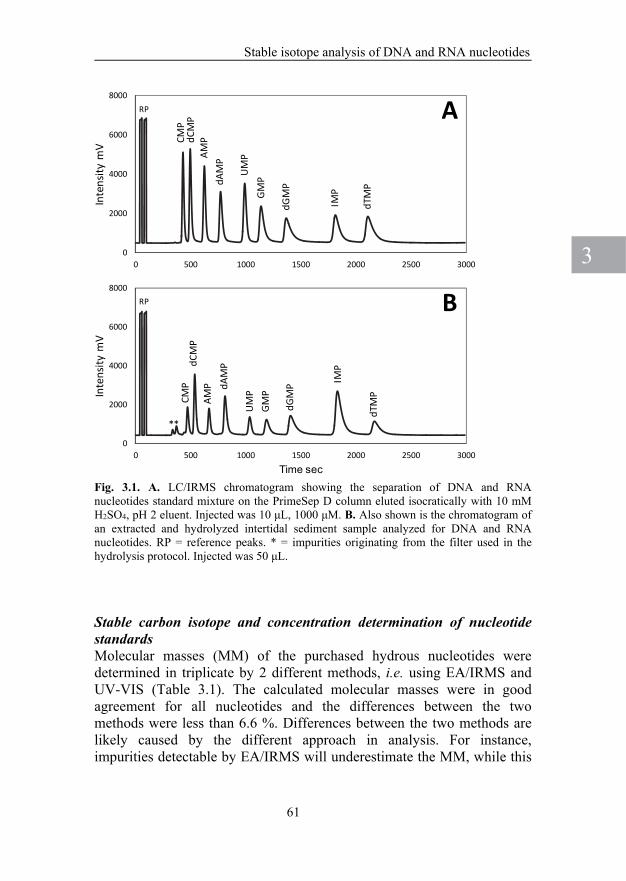
3
Stable isotope analysis of DNA and RNA nucleotides
61
*
0
2000
4000
6000
8000
0 500 1000 1500 2000 2500 3000
Inte
nsity
mV
.
CMP
dCM
PAM
PdA
MP
UM
PGM
P
dGM
P
IMP
dTM
P
RP A
0
2000
4000
6000
8000
0 500 1000 1500 2000 2500 3000
Inte
nsity
mV
Time sec
CMP
dCM
PAM
P dAM
P
UM
PGM
P
dGM
P IMP
dTM
P
RP
**
B
Fig. 3.1. A. LC/IRMS chromatogram showing the separation of DNA and RNA nucleotides standard mixture on the PrimeSep D column eluted isocratically with 10 mM H2SO4, pH 2 eluent. Injected was 10 μL, 1000 μM. B. Also shown is the chromatogram of an extracted and hydrolyzed intertidal sediment sample analyzed for DNA and RNA nucleotides. RP = reference peaks. * = impurities originating from the filter used in the hydrolysis protocol. Injected was 50 μL. Stable carbon isotope and concentration determination of nucleotide standards Molecular masses (MM) of the purchased hydrous nucleotides were determined in triplicate by 2 different methods, i.e. using EA/IRMS and UV-VIS (Table 3.1). The calculated molecular masses were in good agreement for all nucleotides and the differences between the two methods were less than 6.6 %. Differences between the two methods are likely caused by the different approach in analysis. For instance, impurities detectable by EA/IRMS will underestimate the MM, while this

Part1 Chapter 3
62
same impurity may not detectable by UV/VIS and has no effect on the UV/VIS determined MM and vice versa. Although the EA/IRMS method may be slightly more precise, we conclude that both methods determine the MM of the individual nucleotides accurately and may be used to prepare the calibration standard stock solutions.
A range of concentrations of nine standard nucleotides was injected to determine detection limits and linearity. Peak areas were highly linear with all concentrations tested (20 to 4,000 μM (equals 200 pmol to 40 nmol nucleotide injected with a 10 μL loop) with an R2 higher than 0.9994 (data not shown), indicating that the method is suitable to determine nucleotide concentrations. Over the same concentration range the stable carbon isotope ratios remained within acceptable limits (standard deviation (SD) between replicate δ13C values <0.5 ‰) between 1.0 nmol (110 ng C) nucleotide injected for most components to 2.0 nmol (250 ng C) for late-eluting nucleotides (GMP, dGMP and dTMP) and up to the highest concentrations (40 nmol) tested for all nucleotides. Figure 3.2 depicts the effect of the injected amount of two nucleotides (GMP and UMP) on the determined δ13C value. Other nucleotides gave similar results. Typically, a peak height of 500 mV or more was required for accurate isotope ratio analysis. Below 500 mV substantial deviations from the expected isotopic ratio were found, which could presumably be attributed to problems with the baseline correction. With a 10 μL loop a detection limit of 100 to 200 μM could be reached. By using a 50 μL loop the sensitivity could be increased and a detection limit of 20 to 40 μM could be reached, providing ample scope for the carbon isotope analysis of nucleotides in natural materials.
As illustrated in table 3.2, the intraday and interday precision measured on respectively one day (n=8) and on three different days in a 4-week period (n=3) was good for concentration measurements and excellent for the isotopic analysis of all nucleotide standards. For concentration measurements the intraday precision was better than 4.1 % and the interday precision was better than 8.9 %. For δ13C measurements the intraday and interday precision was better than 0.3 ‰ and 0.5 ‰, respectively. Moreover, the column was stable and we analyzed numerous standards and samples for more than a year without loss of performance.

3
Stable isotope analysis of DNA and RNA nucleotides
63
Intraday variability Interday variability Intraday variability Interday variability
NTD Area SD CV% Area SD CV% δ 13C ‰ SD δ 13C ‰ SD
CMP 90.3 1.9 2.1 88.9 2.0 2.3 -11.5 0.1 -11.5 0.0AMP 104.5 2.8 2.7 99.6 6.6 6.6 -8.9 0.1 -8.9 0.1GMP 94.7 1.6 1.7 96.0 4.0 4.2 -24.7 0.3 -24.8 0.3UMP 101.2 4.2 4.1 101.0 5.3 5.2 -10.7 0.2 -10.3 0.1
dCMP 107.3 3.4 3.1 101.4 6.8 6.7 -18.4 0.1 -18.2 0.1dAMP 90.0 2.6 2.9 88.7 4.9 5.5 -17.7 0.3 -17.8 0.3dGMP 90.5 2.5 2.8 93.5 4.3 4.6 -21.1 0.3 -20.8 0.5dTMP 107.8 3.5 3.3 106.8 7.7 7.2 -19.1 0.2 -19.4 0.4
IMP 93.8 1.9 2.0 86.7 7.7 8.9 -14.9 0.3 -14.9 0.4
Fig. 3.2. Effect of injected amount (0.2 – 40 nmol) of nucleotide on the stable isotope ratio of guanosine monophosphate (GMP) and uridine monophosphate (UMP). A 10 μL injection loop was used. Other nucleotides gave similar results. Table 3.2. Intraday and interday variability (precision) of concentration measurements (1000 µM, 10 µL injection) and δ13C values of DNA and RNA nucleotides and one internal standard (IMP) analyzed by LC/IRMS. Values are the mean, standard deviation (SD) and coefficients of variation (CV) of replicate measurements (n=8) of peak areas and δ13C values. The intraday variability is the mean of eight replicates measured in one day. The interday precision was determined by the average of three replicate measurements averaged for three different days (day 1, 5, and 30) within the period of a month.

Part1 Chapter 3
64
Unfortunately, we were unable to determine the absolute accuracy of the δ13C nucleotide analysis since there are no certified standards available. Therefore, we compared the δ13C values as analysed by LC/IRMS, FIA/IRMS and traditional EA/IRMS for all nucleotide standards in order to determine the reliability of the LC/IRMS data (Fig. 3.3). Carbon isotope ratios determined by FIA/IRMS generally corresponded well with the data obtained from EA/IRMS analyses, but for some nucleotides there was a small offset (Fig. 3.3A). Nucleotides were dissolved in Milli-Q water when analysed by FIA/IRMS and the observed offset could probably be attributed to a 13C-depleted carbon blank in the Milli-Q water. Unfortunately, the amount of carbon in this blank was too low (about 1 nmol C) for accurate δ13C value measurements and as a result no blank corrections could be made to the FIA/IRMS data. Subsequently, carbon isotope ratios determined by LC/IRMS were plotted against values determined by EA/IRMS determined δ13C values of individual nucleotides (Fig. 3.3B). More than half of the δ13C nucleotide values determined by LC/IRMS showed a positive offset. This was most likely because the commercial nucleotide standards contained a 13C-depleted impurity leading to an offset as the EA/IRMS method is not compound specific. To conclude, concentrations and stable isotope ratios of the nine nucleotides (of which eight representing DNA and RNA) were analysed reproducible and accurately by LC/IRMS. Fig. 3.3. Comparison of stable isotope ratios of individual nucleotides by FIA/IRMS versus traditional EA/IRMS (A) and LC/IRMS versus traditional EA/IRMS (B). The y=x line is indicated in both figures. Stable isotope data are the average of three replicate analyses

3
Stable isotope analysis of DNA and RNA nucleotides
65
Testing the sample preparation protocol The phenol-chloroform extraction method was adapted in order to simultaneously extract DNA and RNA from environmental samples (Griffiths et al., 2000; Hurt et al., 2001). The ratio of absorbance at 260 and 280 nm as measured by the Nanodrop spectrophotometer was used to determine the purity of DNA and RNA (data not shown). A ratio (260/280) of ~1.8 indicates a high purity of the nucleic acids and implies a successful isolation of nucleic acids (ND-1000 user manual, Nanodrop Technologies, Wilmington, Delaware, USA). A lower ratio indicates the presence of impurities such as protein, phenol or other contaminants that absorb strongly near 280 nm and could influence the LC/IRMS δ13C determination. The 260/280 ratio of the extracted nucleic acids from the sediment samples and the Ulva sp. were 1.98 ± 0.06 and 2.17 ± 0.05, respectively and therefore considered adequate. It was determined experimentally that the amount of extracted sediment in this protocol should not exceed 10 g otherwise the purity of the extracted DNA and RNA decreased (data not shown). Additional rinsing of the DNA/RNA pellet with 70 % ethanol and subsequently freeze-drying was necessary to avoid interference from residual carbon containing organics. Usually, water treated with diethylpyrocarbonate (DEPC) is used for handling RNA in order to decrease the risk of RNA degradation by RNAse. However, DEPC treatment contributes approximately 20 ng C to the protocol blank (MacGregor et al., 2002). Therefore we decided to use freshly prepared Milli-Q instead.
In order to decrease the protocol carbon blank the original hydrolysis method of Shimelis and Giese (2006) was modified in two ways: the buffers (TRIS and acetate) were replaced by phosphate buffers and zinc chloride was replaced by potassium chloride. The first modification was done in order to decrease the protocol carbon blank. The second modification was introduced because zinc precipitates with phosphate or with phosphoric acid in the LC/IRMS interface, which would clog the LC/IRMS system. Nuclease P1 is a zinc depending enzyme, but it is possible to replace zinc by potassium (Guo-Qing et al., 2006). Whereas zinc chloride increases the activity of Nuclease P1 by 248 %, potassium chloride results in an increase of 172 % (Guo-Qing et al., 2006). The optimum amount of enzyme and incubation times was tested using calf thymus DNA. An incubation time of more than 60 minutes was necessary to digest > 88 % of the DNA to its nucleotides and 20 μL (30 U mL-1) Nuclease P1 was optimal (Fig. 3.4A, B). Long

Part1 Chapter 3
66
incubation times should be avoided because Nuclease P1 may digest the nucleotides (Shimelis & Giese, 2006). However, incubation for up to 240 min, as applied here, showed no evidence of nucleotide losses (Fig. 3.4A). Using more than 20 μL, 30 U mL-1 Nuclease P1 resulted in a decrease of the amount of nucleotides, which may have been caused by the digestion of the nucleotides by the excess nuclease (Fig. 3.4B). In order to prevent these undesirable digestions, the DNA/RNA to enzyme ratio was kept constant and after the hydrolysis reaction Nuclease P1 was immediately removed by centrifugal ultrafiltration. The ultrafiltration filters had to be washed with Milli-Q water in order to obtain a blank that was acceptable (see figure 3.1B; peak intensity of impurities at retention time ~ 350 sec < 1000 mV) and that did not interfere with the nucleotide analysis. Nuclease P1 solution stored at 4 oC is stable for 3 weeks. When required, Nuclease P1 can be made stable for a longer period of time by immobilization on chitosan nanoparticles (Ying et al., 2007). For a batch of samples, the quality of Nuclease P1 was always checked by its ability to digest calf thymus DNA. We found a G-C and A-T content of calf thymus DNA of 41.6 ± 0.1 mole % and 58.4 ± 0.1 mole % (n=3), respectively, which is in agreement with published values (41.9 mole % G-C and 58.1 mole % A-T (Marmur & Doty, 1962)). The recovery of the Nuclease P1 digested DNA was 88 ± 5 % for an incubation time of 60 min. The recovery after the freeze-drying and centrifugal ultrafiltration steps was 96.7 ± 0.7 % for the freeze-dry treatment and a recovery of 70.0 ± 0.9 % for the ultrafiltration treatment. There are various other methods to hydrolyze DNA but they were not considered because severe hydrolysis conditions used in combination with long incubation times may result in the deamination of nucleotides and other undesirable side-effects (Swarts et al., 1996). We conclude that the enzymatic hydrolysis with Nuclease P1 is a practical and reliable method for simultaneous digesting of nucleic acids into quantifiable nucleotides.
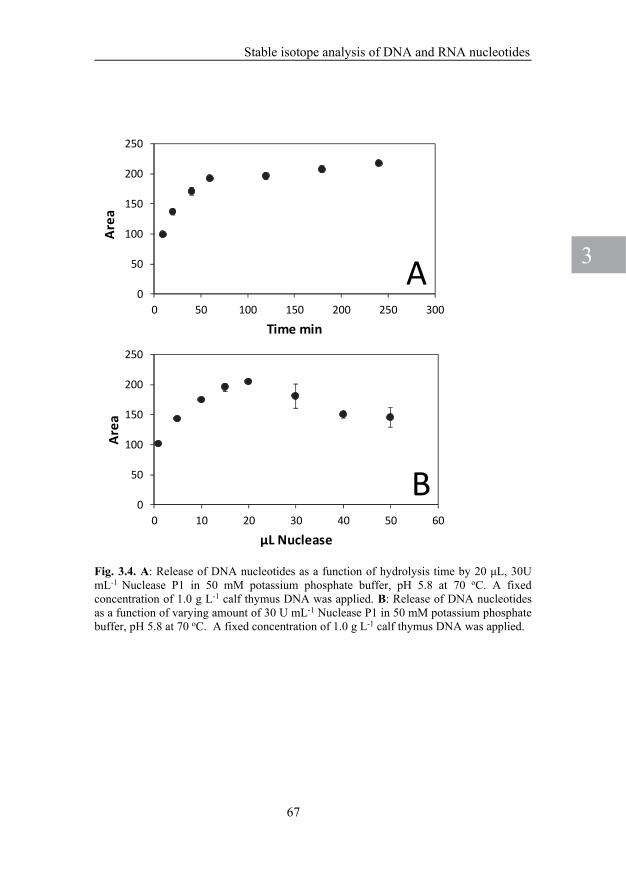
3
Stable isotope analysis of DNA and RNA nucleotides
67
0
50
100
150
200
250
0 50 100 150 200 250 300
Area
Time min
A
0
50
100
150
200
250
0 10 20 30 40 50 60
Area
µL Nuclease
B
Fig. 3.4. A: Release of DNA nucleotides as a function of hydrolysis time by 20 μL, 30U mL-1 Nuclease P1 in 50 mM potassium phosphate buffer, pH 5.8 at 70 oC. A fixed concentration of 1.0 g L-1 calf thymus DNA was applied. B: Release of DNA nucleotides as a function of varying amount of 30 U mL-1 Nuclease P1 in 50 mM potassium phosphate buffer, pH 5.8 at 70 oC. A fixed concentration of 1.0 g L-1 calf thymus DNA was applied.

Part1 Chapter 3
68
Stable carbon isotope analysis of DNA and RNA in environmental samples We analyzed a diatom mat from an intertidal mudflat and a macro alga for DNA and RNA nucleotide concentrations (Table 3.3) and stable carbon isotope composition (Table 3.4). The measured concentrations of DNA and RNA (CV better than 26 %) in the studied samples were in good agreement with values found in literature (Shivji et al., 1992; Créach et al., 2006; Miyatake et al., 2009). During the 4 h of Ulva sp. labeling the DNA concentration decreased by 50%, which was likely caused by the length of air exposure which desiccated the Ulva sp. and became prone to partial sun bleaching. The reproducibility of the measurement of stable isotope ratios for the individual nucleotides in the sediment and in Ulva sp. was excellent at natural abundance (better than SD ± 0.7 ‰ (n=3)). For the sediment, individual nucleotides were enriched in 13C/12C-ratio in comparison with total organic carbon ratios (Table 3.4). In the case of Ulva sp., δ13C values for DNA nucleotides were typically depleted whereas RNA nucleotides were typically enriched in comparison with total organic carbon. An exception is the Ulva sp. DNA nucleotide dGMP, which was enriched in comparison with total organic carbon. The variation in individual δ13C nucleotide values is considerably. Pool size averages of δ13C values for DNA and RNA nucleotides are respectively -13.8 ± 0.1 and -11.3 ± 0.1 ‰ for the marine sediment and -16.2 ± 0.2 and -11.5 ± 0.2 ‰ for Ulva sp. Both sediment and Ulva sp. RNA δ13C values were more enriched than DNA δ13C values. There is not a straightforward explanation, but isotopic discrimination by the biosynthetic pathways could be considered to explain these results. The difference in δ13C value between the nucleic acids and total organic carbon of the sediment is on average approximately 7 ‰, which can be explained by nucleic acids in the sediment originating from isotopically heavy benthic diatom biomass typically having a δ13C value between -11 and -18 ‰ (Abramson, 2003).
The labeling experiments with the benthic diatom community and Ulva sp. indicated a faster 13C labeling of the RNA nucleotides compared to those of DNA. Hence, we conclude that RNA had a higher turnover than the DNA, which was expected as RNA is constantly synthesized and broken down. The synthesis rate of DNA in the diatom mat (5.8 ± 0.5 pmol 13C g-1 DW h-1) was in the same order of magnitude as reported in literature (Craven & Karl, 1984; Novitsky & MacSween, 1989). Synthesis rates of RNA in similar marine sediments as reported in the literature were somewhat higher than in our samples (39 ±9 pmol 13C g-1 DW h-1) but it is

3
Stable isotope analysis of DNA and RNA nucleotides
69
well-known that the rate of RNA synthesis depends on the cell cycle and environmental conditions and is therefore variable (Olson et al., 1986). The synthesis rate of RNA in Ulva sp. was high (2,732 ± 524 pmol 13C g-1 DW h-1). Although RNA nucleotide concentrations were similar, the production of AMP and GMP was a factor 10 higher compared to CMP and UMP. The asymmetric distribution of the production of RNA nucleotides may be explained as the pathway that is used for the synthesis of the purine nucleotides (CMP and GMP) differs from that of the pyrimidine nucleotides (AMP and UMP). While the synthesis of the purine nucleotides starts with glucose, the synthesis of the pyrimidine nucleotides starts with the combination of carbamoyl phosphate and aspartate (Abramson, 2003). Since 13C is incorporated by photosynthesis with glucose as initial product, this will be the first cell compound enriched in 13C. Due to the short incubation time (4 h) the 13C labeling of the purine nucleotides will be initially faster than that of the pyrimidines.
This pilot experiment demonstrates that the technique described in this paper has a high potential for tracing DNA and RNA dynamics in organisms and natural ecosystems, and to determine natural abundance δ13C values for source studies (Coffin et al., 1990; Creach et al., 1997; Créach et al., 1999).

Part1 Chapter 3
70
Sam
ple
CM
PA
MP
GM
PU
MP
dCM
PdA
MP
dGM
PdT
MP
RN
AD
NA
RN
A/D
NA
TO
C
Sedi
men
tnm
olC
g-1
DW
7558
6341
9813
513
984
237
456
0.53
2877
51
SD16
510
419
1318
87
550.
0835
76
CV
%22
916
1119
1013
103
1215
1
Sedi
men
t lab
eled
nmol
C g
-1 D
W81
6660
4510
314
214
365
252
448
0.61
2872
86
SD13
1612
710
117
1248
190.
0612
045
CV
%16
2420
1710
112
1819
410
4
Ulv
anm
olC
g-1
DW
5102
5689
6458
4374
330
282
318
190
2162
311
0822
1907
6505
SD15
0716
8514
8810
5716
1670
2457
2214
19
1028
85
CV
%30
3023
245
622
1226
1340
1
Ulv
a la
bele
dnm
olC
g-1
DW
5830
6678
7474
5136
163
131
138
104
2511
953
647
1651
2437
SD11
0113
4514
7610
3632
87
2749
5662
811
2378
1
CV
%19
2020
2020
65
2620
1217
7
RN
A n
ucle
otid
esD
NA
nuc
leot
ides
Tab
le 3
.3.
DN
A a
nd R
NA
nuc
leot
ide
conc
entr
atio
ns a
s de
tect
ed b
y L
C/I
RM
S i
n in
tert
idal
mar
ine
sedi
men
t an
d in
a m
acro
alg
a (U
lva
sp.)
in
isol
ated
DN
A a
nd R
NA
, hy
drol
yzed
enz
ymat
ical
ly b
y N
ucle
ase
P1.
Tot
al o
rgan
ic c
arbo
n (T
OC
) co
nten
t w
as
dete
rmin
ed b
y E
A/I
RM
S.
DN
A a
nd R
NA
nuc
leot
ide
conc
entr
atio
ns a
nd s
tand
ard
devi
atio
n (S
D)
are
the
aver
age
of t
hree
re
plic
ate
sam
ples
. Coe
ffic
ient
s of
var
iati
on (
CV
) ar
e ex
pres
sed
in %
.

3
Stable isotope analysis of DNA and RNA nucleotides
71
Sam
ple
CM
PA
MP
GM
PU
MP
dCM
PdA
MP
dGM
PdT
MP
TO
CR
NA
DN
A
Sedi
men
tδ13
C ‰
-13.
6-8
.0-1
0.8
-12.
4-1
4.3
-12.
2-1
1.7
-19.
3-1
9.3
SD0.
70.
20.
30.
40.
60.
20.
30.
40.
1
Sedi
men
t lab
eled
δ13C
‰25
.654
.851
.860
.0-8
.8-7
.0-7
.5-1
2.1
45.1
SD5.
04.
95.
45.
21.
31.
41.
30.
38.
4
Ulv
aδ13
C ‰
-13.
5-9
.3-1
0.6
-13.
3-1
8.3
-18.
5-1
1.2
-17.
1-1
3.3
SD0.
30.
40.
10.
20.
40.
20.
40.
40.
1
Ulv
a la
bele
dδ13
C ‰
-7.5
64.8
41.8
1.9
-8.7
7.4
-8.1
-13.
354
5.7
SD1.
10.
60.
90.
30.
80.
81.
20.
711
.1
Sedi
men
t lab
eled
Exce
ss p
mol
13C
g-1
DW
34.9
45.4
41.4
35.4
6.2
8.1
5.5
5.1
2018
0039
5.8
SD6.
711
.910
.37.
81.
82.
51.
81.
317
500
90.
5
Ulv
a la
bele
dEx
cess
pm
ol 13
C g
-1 D
W0.
385.
424.
280.
860.
017
0.03
70.
005
0.00
510
0567
2732
15.8
SD0.
041.
090.
800.
190.
003
0.00
30.
002
0.00
288
0652
42.
1
RN
A n
ucle
otid
esD
NA
nuc
leot
ides
Synt
hesi
s ra
tes
pmol
13 C
h-1
g-1
DW
T
able
3.4
. S
tabl
e is
otop
e co
mpo
siti
ons
of R
NA
and
DN
A n
ucle
otid
es i
n in
tert
idal
mar
ine
sedi
men
t an
d in
a m
acro
alg
a (U
lva
sp.)
as
dete
cted
by
LC
/IR
MS
in
isol
ated
RN
A a
nd D
NA
, hy
drol
yzed
enz
ymat
ical
ly b
y N
ucle
ase
P1.
Iso
topi
c co
mpo
siti
on o
f to
tal
orga
nic
carb
on (
TO
C)
was
det
erm
ined
by
EA
/IR
MS
. E
xces
s va
lues
are
the
abs
olut
e va
lues
of
prod
uced
car
bon
wit
hin
the
corr
espo
ndin
g nu
cleo
tide
s an
d nu
clei
c ac
ids
per
four
hou
rs.
Sta
ble
isot
ope
data
and
sta
ndar
d de
viat
ion
(SD
) ar
e th
e av
erag
e of
th
ree
repl
icat
e sa
mpl
es.

Part1 Chapter 3
72
Conclusions We developed a method to analyze stable carbon isotope ratios in DNA and RNA nucleotides in a single analytical run by LC/IRMS using mixed-mode chromatography. The solvent-free chromatographic method is not limited to the LC/IRMS application but can also be used to quantify nucleotides by traditional HPLC, for instance in combination with spectrophotometric detection. The method gave reproducible results for the determination of the δ13C in nine nucleotides and their concentrations. The advantage over other methods is that there is no need for extensive incorporation of labeled substrate and excessive incubation times, allowing accurate DNA and RNA synthesis rate determination. This method can be used for the study of metabolic processes in many different research areas. We demonstrated the applicability of the method for the analysis of DNA and RNA nucleotides in marine samples containing micro- and macro algae at natural 13C abundance level as well as for 13C labeled material at relatively low enrichments. We show that the method has a high potential for the study of DNA and RNA dynamics in natural environments or organisms. This new method is an attractive addition to the already existing protocols for the measurement of carbohydrates and amino acids by LC/IRMS. For lipid analysis GC/IRMS remains the preferred method. Other structural components, such as proteins, polysaccharides and nucleic acids, can now be studied by LC/IRMS.
Acknowledgements We thank Peter van Breugel for the support and assistance in the laboratory, and two anonymous reviewers for their thorough evaluation of the paper.

Comparison of gas chromatography/isotope ratio mass spectrometry and liquid chromatography/isotope ratio mass spectrometry for carbon stable-isotope analysis of carbohydrates Published in Rapid Commun. Spectrom. 2015, 29: 1205-1214 Tanja C.W. Moerdijk-Poortvliet1, Henk Schierbeek2,3, Marco Houtekamer1, Tom van Engeland1, Delphine Derrien4, Lucas J. Stal1,5, Henricus T.S. Boschker1 1Royal Netherlands Institute for Sea Research (NIOZ), Korringaweg 7, 4401 NT Yerseke, The Netherlands. 2Department of Pediatrics, AMC - Emma Children’s Hospital, University of Amsterdam, Amsterdam, The Netherlands 3Department of Pediatrics, VU, University Medical Centre, Amsterdam, The Netherlands 4Inra, Biogéochimie des Ecosystèmes Forestiers, UR1138, Champenoux, F-54280, France 5Department of Aquatic Microbiology, IBED, University of Amsterdam, The Netherlands
4 C
hapt
er

Part1 Chapter 4
74
Abstract
We compared gas chromatography isotope ratio mass spectrometry (GC/IRMS) and liquid chromatography isotope ratio mass spectrometry (LC/IRMS) for the measurement of δ13C in carbohydrates. Contrary to GC/IRMS, no derivatisation is needed for LC/IRMS analysis of carbohydrates. Hence, LC/IRMS is expected to be more accurate and precise, but no direct comparison has been reported.
GC/IRMS with the aldonitrile penta acetate (ANPA) derivatisation method was compared to LC/IRMS without derivatisation. A large number of glucose standards and a variety of natural samples were analysed for five neutral carbohydrates at natural abundance as well as at 13C-enriched levels. Gas chromatography/mass spectrometry-chemical ionization (GC/MS-CI) was applied to check for incomplete derivatisation of the carbohydrate, which would impair the accuracy of the GC/IRMS method.
The LC/IRMS technique provided excellent precision (±0.08 ‰ and ±3.1 ‰ at natural abundance and enrichment levels, respectively) for the glucose standards and this technique proved to be superior to GC/IRMS (±0.62 ‰ and ±19.8 ‰ at natural abundance and enrichment levels, respectively). For GC/IRMS measurements the derivatisation correction and the conversion of carbohydrates to CO2 had a considerable effect on the measured δ13C values. However, we did not find any significant differences in the accuracy of both techniques over the full range of natural δ13C abundances and 13C labeled glucose. The difference in the performance of GC/IRMS and LC/IRMS diminished when the δ13C values were measured in natural samples, because the chromatographic performance and background correction became critical factors, particularly for LC/IRMS. The derivatisation of carbohydrates for the GC/IRMS method was complete.
Even though both LC/IRMS and GC/IRMS are reliable techniques for compound specific stable carbon isotope analysis of carbohydrates (provided that derivatisation is complete and the calibration requirements are met), LC/IRMS is the technique of choice. The reasons for this are the improved precision, simpler sample preparation, and straightforward isotopic calibration.

4
Comparison of LC/IRMS and GC/IRMS
75
Introduction Carbohydrates are the most abundant organic substances in the biosphere and play an important role in the functioning of organisms. Carbohydrates are used as energy storage (e.g., glycogen, starch, chrysolaminaran), as structural components (e.g., in cell walls, cellulose, chitin), components of coenzymes (e.g., ATP) and as backbone of nucleic acids. In addition, carbohydrates may form outer cell layers (such as glycolipids) or are exuded as extracellular polymeric substances (EPS). Therefore, carbohydrates are important as a component of soil or sediment, and occur as dissolved organic matter in natural waters. As such, carbohydrates play an important role in the global carbon cycle. Compound specific stable carbon isotope (13C/12C) analysis of carbohydrates has proven to be a powerful technique in understanding of biological processes. In addition to the possibility to study the source of carbohydrates and their turnover in the environment (Moers et al., 1993; Derrien et al., 2004), the compound specific stable carbon isotope analysis can be used to trace microbial biomass (Glaser, 2005), detecting food adulteration (Cabanero et al., 2006) or in nutritional studies (Eelderink et al., 2012).
Until recently, GC/IRMS has been the most commonly used technique for compound specific stable isotope analysis of carbohydrates and several analytical methods have been described (Moers et al., 1993; van Dongen et al., 2001; Derrien et al., 2003). However, carbohydrates need to be derivatised to make them volatile for GC/IRMS analysis. Due to the addition of carbon atoms from the derivatisation reagents the 13C/12C ratio of the carbohydrate is altered and may lead to additional kinetic isotopic effects (Macko et al., 1998; Docherty et al., 2001; Derrien et al., 2003), and hence, this requires substantial corrections. Such corrections inherently decrease the accuracy and reproducibility of the measurements, and stringent testing of the analytical procedures is needed to determine the proper correction factors. Over the years GC/IRMS carbohydrate derivatisation methods have been developed that aimed at minimizing carbon addition and this led to improved accuracy and precision (van Dongen et al., 2001; Gross & Glaser, 2004; Ruiz-Matute et al., 2011).
In 2008, a method was published to determine δ13C values of carbohydrates using liquid chromatography isotopic ratio mass spectrometry (LC/IRMS) (Boschker et al., 2008). Contrary to GC/IRMS, LC/IRMS does not require derivatisation of the carbohydrates, avoiding laborious sample preparation and potential errors, and therefore leads to an improved precision and accuracy of the stable carbon isotope analysis.

Part1 Chapter 4
76
Hitherto no comparison of carbohydrate analysis by LC/IRMS and GC/IRMS has been reported.
The aim of this study was to compare the commonly used GC/IRMS technique and the recently developed LC/IRMS technique for the measurement of δ13C in the most important neutral carbohydrates at natural abundance and 13C-enriched levels. Because the accuracy and reproducibility of the stable isotope analysis of the two techniques can vary between sample matrixes and individual carbohydrates, we analysed a variety of natural samples as well as a range of glucose standards. For the GC/IRMS analysis, carbohydrates were measured as their aldonitrile penta acetates (ANPA) (Zhang et al., 2007) (Supplementary Fig. 4.S1, Supporting Information). Acetylation is a commonly used derivatisation method in various research fields (Zhang & Amelung, 1996; Cogo et al., 2009; Schierbeek et al., 2012).
In the literature incomplete derivatisation has been reported for some derivatisation methods caused by the potential steric hindrance of the added carbon (Meier-Augenstein, 1999; Derrien et al., 2003). This would seriously affect the correction factor to be applied. The completeness of derivatisation was therefore checked by gas chromatography/mass spectrometry - chemical ionisation (GC/MS-CI).
4
Comparison of LC/IRMS and GC/IRMS
77
Experimental Chemicals and reagents All reagents were of analytical grade. Sodium hydroxide solution (50 % w/v) and sodium peroxodisulfate were purchased from Fluka (Buchs, Switzerland). Perchloric acid (70 % v/v), potassium hydroxide, Na2HPO4 and H3PO4 were purchased from Merck (Darmstadt, Germany) and hydroxylamine hydrochloride, pyridine and acetic anhydride were purchase from Pierce Chemical Company (Rockford, IL, USA). Delta 13C reference materials, i.e. IAEA-309A, IAEA-309B, IAEA-CH-6, USGS 40 and USGS 41 were purchased from the International Atomic Energy Agency (IAEA, Vienna, Austria). Supplementary reference materials, i.e. acetanilide, a C15 n-alkane and a C16 n-alkane, were purchased from Schimmelman (Indiana University, Bloomington, IN, USA). Glucose with a δ13C = -27.02 ± 0.18 ‰ was isolated from potato starch and kindly donated by Avebe (Veendam, the Netherlands). Unlabeled glucose and 99 % 13C enriched glucose (Euriso-top, CEA, Saint-Aubin Cedex, France) were mixed to make 3159 ± 2 ‰ and 4662 ± 19 ‰ glucose standards. All other chemicals were purchased from Sigma (St. Louis, MO, USA). Freshly prepared milli-Q water (18.2 MΩ, DOC free, Millipore, Bedford, MA, USA) was used throughout.
A series of glucose standards with δ13C values between -27 and 0.9 ‰ (the natural abundance level) was prepared by mixing various volumes of 2 mM solutions of IAEA certified glucose (93.3 ‰) and Avebe glucose (-27.0 ‰). For 13C-enriched values, a δ13C range between 0 and 4662 ‰ was prepared from a variety of mixed volumes of 2 mM, 3159.0 ‰, 4662.4 ‰, and -27.02 ‰ (all EA/IRMS determined) glucose solutions. The volumes (varying from 0.05 - 1 mL) were pipetted with accuracy better than 1 % and a precision better than 0.6 %. Sample preparation Several marine and terrestrial samples were analysed for their neutral carbohydrate isotopic compositions at natural abundance levels: a marine macroalga, Ulva sp.; two C3 macrophytes, Festuca rubra and Elymus sp., two C4 macrophytes Spartina anglica and the leaves and roots of Zea mays, an intertidal marine sediment and a soil sample. A 13C-enriched intertidal marine sediment and soil sample were also analysed. The marine materials were archived samples collected at a tidal flat in the Eastern Scheldt estuary and the Schiermonnikoog salt marsh (the Netherlands) (Bouillon & Boschker, 2006; Boschker et al., 2008); the Zea mays and

Part1 Chapter 4
78
soil samples were also from earlier studies (Derrien et al., 2003; Derrien et al., 2007).
Prior to analysis, the samples were lyophilised and ground to a fine powder in a sample mill (MM 2000; Retsch GmbH, Haan, Germany). Neutral carbohydrates were extracted and hydrolysed from plant tissue (25 mg) and sediment/soil (500 mg) using a modified sulfuric acid method (Moerdijk-Poortvliet et al., 2014; Cowie & Hedges, 1984).
For LC/IRMS analysis an aliquot of the supernatant was transferred into a 1 mL glass vial for direct analysis. For GC/IRMS analysis a supernatant aliquot of 50 µL for plant tissue samples and 200 µL for sediment/soil samples was taken to prepare the ANPA derivatives.
Each sample was extracted in duplicate and each extract was analysed in triplicate by LC/IRMS and GC/IRMS. Only δ13C values of carbohydrates showing complete baseline separation and having minimum peak height of respectively 500 mV for natural abundance samples and 300 mV for enriched samples were used. Derivatisation Preparation of aldonitrile penta acetate derivatives: An aliquot of 100 µL of a 2 % solution (w/v) of hydroxylamine-HCl in pyridine was added to the dried sample hydrolysates and heated at 90 °C for 30 min. After cooling, 50 µL of acetic anhydride was added and heated at 90 °C for another 30 min. Finally, the samples were taken to complete dryness under a flow of nitrogen and dissolved in 50 µL of ethyl acetate. Analytical methods LC/IRMS High performance liquid chromatography (HPLC) was carried out on a Surveyor system consisting of a HPLC pump (MS Pump Plus) and an Autosampler Plus autoinjector (all from Thermo Fisher Scientific, Bremen, Germany), fitted with a CarboPac PA20 guard and anion exchange analytical column (3 × 150 mm; Dionex Benelux, Breda, The Netherlands) and eluted at 300 µL min-1 isocratically with 1 mM NaOH at a temperature of 25 oC (Boschker et al., 2008). Injection volume was 10 µL for standards and plant tissue samples and 50 µL for soil and sediment samples.
Isotopic ratio measurements were carried out on a Delta V Advantage isotope ratio mass spectrometer (Thermo Fisher Scientific). The LC system was coupled to the IRMS instrument by an Isolink interface (Thermo Fisher Scientific). Peak identification was based on
4
Comparison of LC/IRMS and GC/IRMS
79
retention times in comparison with external standards. The LC/IRMS system and data collection were controlled using Isodat 2.5 software (Thermo Fisher Scientific). GC/IRMS A Delta-XP isotope ratio mass spectrometer coupled online with a Trace gas chromatograph and a Combustion interface type 3 (all from Thermo Fisher Scientific) was used. The carbohydrate derivatives were introduced to the GC system with a CTC PAL auto sampler (CTC, Zwingen, Switzerland) in splitless mode. The injector temperature was set at 250 °C and the oven temperature program was 160 °C for 1 min to 230 °C at 5 °C min-1 and held at 230 °C for 5 min (Schierbeek et al., 2009) . Chromatographic separation was performed on a CP-Sil 24 CB lowbleed/MS capillary column (Varian, Middelburg, the Netherlands) of 30 m length, an internal diameter of 0.25 mm and a helium carrier gas flow of 1 mL min-1. After separation, the carbohydrate derivatives were online combusted at 940 °C and NOx formed by incomplete oxidation was converted to N2 by a reduction reactor operating at 650 °C, which also removed O2 bleed from the oxidation oven. Water was removed by an online nafion capillary. The GC/IRMS system and data collection were controlled using the Isodat 2.0 software (Thermo Fisher Scientific).
Because δ13C values of individual components can depend on the injected sample amount, we injected standard and sample in the same absolute amount to eliminate amount dependent isotopic fractionation during the carbohydrate measurements (Glaser & Amelung, 2002; Schmitt et al., 2003) . Each sample was analysed in triplicate (0.5 µL injection). Peak identification was based on retention times obtained from external standards. During sample analysis the oxidation oven was re-oxidized for 8 h after every measurement cycle of a 10 h period (representing 16 injections). The performance of the system was validated using in-house external standards after every three samples to guarantee precise and accurate isotope analysis. GC/MS-CI Gas chromatography/ mass spectrometry - chemical ionisation (GC/MS-CI) analysis was performed with pure NH3 to obtain soft ionization. Other chemical ionization gasses such as pure methane or 95/5 mixture methane/NH3 are not suitable to reveal the molecular mass of the derivatised carbohydrates. Analysis was performed on a 7890A gas chromatograph coupled to a 5975C MSD (Agilent Technologies, Wilmington, NC, USA). The carbohydrate derivatives were introduced into

Part1 Chapter 4
80
the GC system by a MPS2 autosampler equipped with a Cis 4 PTV-injector (Gerstel, Mulheim an der Ruhr, Germany). The flow was set at a constant rate of 1.5 mL min-1 and 1 to 10 µL of the sample extracts were introduced in PTV solvent vent mode. Mass scan range was set from m/z 50 to m/z 650. A ZB5-MS 60 m long capillary column (Phenomenex, Utrecht, the Netherlands) with an internal diameter of 0.32 mm and 0.25 µm film was used for chromatographic separation. The PTV injector temperature programme was set at 60 °C for 0.5 min, then 16°C s-1 to 150 °C for 0 min and then 12°C s-1 to 280 °C for 5 min. The oven temperature program was set at 60 °C for 2 min, then 60 °C min-1 to 120 °C for 1 min, then 5 °C min-1 to 280 °C for 5 min and then 20 °C min-1 to 300 °C for 3 min. EA/IRMS The total organic carbon (TOC) δ13C values of the individual carbohydrate standards as well as bulk δ13C values of samples were determined by elemental analysis IRMS (EA/IRMS) using a Flash EA 1112 Series elemental analyzer coupled via a Conflo III interface to a Delta V Advantage isotope ratio mass spectrometer (Thermo Fisher Scientific) (Boschker et al., 1999). Each sample was analysed in triplicate. Calibration, correction and isotopic calculation Stable carbon isotope ratios are given in the delta-notation: δ13C (‰) = (Rsample/RVPDB)-1) (1) where Rsample and RVPDB denote the 13C/12C ratio in the sample and the international standard Vienna Pee Dee Belemnite (RVPDB = 0.0112372), respectively.
EA/IRMS measured 13C natural abundance values were scale calibrated to VPDB based on 2-point normalization using international reference materials obtained from the International Atomic Energy Agency (IAEA, Vienna, Austria): IAEA-CH-6 (δ13CVPDB = -10.45 ± 0.03 ‰) and USGS-40 (δ13CVPDB = -26.39 ± 0.04 ‰) in conjunction with acetanilide (δ13CVPDB = -29.53 ± 0.01 ‰) (Schimmelman, Indiana University, Bloomington, IN, USA) as a quality control (Coplen et al., 2006; Coplen, 2011; Brand et al., 2014). For EA/IRMS measured 13C enriched values USGS-41 (δ13CVPDB = 37.63 ± 0.05 ‰) instead of USGS-40 was used as anchor combined with IAEA-CH-6. In addition, the δ13C values of the in-house standards were determined in triplicate by EA/IRMS; i.e. glucose (δ13CVPDB = -10.95 ± 0.17 ‰), glucose (Avebe) (δ13CVPDB = -27.02 ± 0.18 ‰), galactose (δ13CVPDB = -23.38 ± 0.17 ‰),

4
Comparison of LC/IRMS and GC/IRMS
81
fucose (δ13CVPDB = -26.61 ± 0.04 ‰), xylose (δ13CVPDB = -21.09 ± 0.03 ‰), mannose (δ13CVPDB = -28.17 ± 0.03 ‰) and two δ13C enriched glucoses; i.e. glucose3159 (δ13CVPDB = 3159 ± 2 ‰) and glucose4662 (δ13CVPDB = 4662 ± 19 ‰).
LC/IRMS measured 13C natural abundance values were scale calibrated to VPDB based on a 2-point normalization using one international reference material, IAEA-CH-6 (δ13CVPDB = -10.45 ± 0.03 ‰) and one in-house standard, Avebe glucose ((δ13CVPDB = -27.0 ± 0.1 ‰). LC/IRMS measured 13C enriched values were scale calibrated to VPDB based on a 2-point normalization using IAEA-309A ((δ13CVPDB = 93.9 ± 1.0 ‰) and IAEA-309B ((δ13CVPDB = 535.3 ± 5.0 ‰). GC/IRMS measured δ13C values were scale calibrated to VPDB using a C15 n-alkane ((δ13CVPDB = -29.25 ± 0.01 ‰) and a C16 n-alkane ((δ13CVPDB = -34.55 ± 0.02 ‰) (both supplied by Schimmelman, Indiana University, Bloomington, IN, USA) in conjunction with in-house standards, i.e. a C15 n-alkane ((δ13CVPDB = -25.75 ± 0.09 ‰) and a C16 n-alkane ((δ13CVPDB = -31.63 ± 0.10 ‰) as a regular control.
In addition, the GC/IRMS determined δ13C values of the analysed carbohydrate derivatives were corrected for the contribution of derivative carbon added. According to Rieley (1994) and Hayes (1983), the exogenous carbon at natural abundance level for a derivatisation reaction can be corrected for by utilising the following generic mass balance: δ13Ccd * ncd = δ13Cc* nc + δ13Cd* nd (2) where δ13Ccd denotes the measured δ13C value of the derivatised compound; δ13Cc denotes the δ13C value of the underivatised compound; δ13Cd is the δ13C value of the derivatisation reagents; ncd the total number of carbon atoms of the derivatised compound; nd the number of carbon atoms coming from the applied derivatives and nc the number of carbons of the underivatised compound. However, this mass balance is not applicable as such for the derivatisation reaction applied in this paper, as a kinetic isotopic effect (KIE) occurs for ANPA derivatisation (Docherty et al., 2001). Fortunately, the effective stable isotope composition of the derivative carbon introduced during derivatisation, taking into account the KIE, can be corrected for with the use of a ‘correction factor’. The correction factors for the individual carbohydrates for ANPA derivatisation can be empirical determined by measuring the δ13C value of an underivatised standard carbohydrate (by EA/IRMS) and the δ13C value of this standard after derivatisation (by GC/IRMS). By rearranging equation (2) the term δ13Cd can be replaced with the empirical correction

Part1 Chapter 4
82
factor (δ13Ccorr). In order to calculate the original carbohydrate δ13C value of a sample the following equation (3) for ANPA derivatization can be used(Docherty et al., 2001): δ13Cc = (δ13Ccd* ncd - δ13Ccorr* nd)/nc (3)
The correction procedure described above was used for natural abundance data. For each analysed carbohydrate derivative, in-house carbohydrate standards whose δ13C values were determined via EA/IRMS were used to determine correction factors as described above. For labeled carbohydrates (δ13C > 0), the mass balance using fractional isotopic abundances instead of δ13C values must be applied. It is therefore more practical to measure a standard glucose curve of known isotopic enrichments simultaneously with the samples. The slope of the measured13C enriched value versus the expected 13C enriched value was used to correct the δ13C values of the various carbohydrates of the labeled samples. For the pentose xylose the lower number of carbon atoms in the carbohydrate was taken into account.

4
Comparison of LC/IRMS and GC/IRMS
83
Statistical analysis Method performance was investigated with glucose standards (cf. Section “Chemicals and reagents”) for the LC/IRMS and GC/IRMS (ANPA derivatisation) techniques using linear models. Regression analyses of the measurements obtained by the respective techniques versus the expected values (as determined with EA/IRMS) were performed to assess precision and potential bias for a range of glucose δ13C values. Natural abundance and 13C enriched levels were treated in separate regression models. In order to investigate potential differences in regression coefficients between the two techniques, analysis of covariance (ANCOVA) was used. Residuals were checked for skewness and unequal variances. Only for the latter, corrections were necessary based on a variance function. In addition, Bland-Altman plots were made to evaluate the mean differences between the expected δ13C glucose values and the determined δ13C glucose values and the 95 % limits of agreement (±1.96 standard deviation (SD)).
The results of the environmental samples were checked by analysis of variance (ANOVA). Again, different analyses were performed for samples with natural isotope abundance and 13C enriched samples. Unequal variance per method was corrected for in the statistical models by means of variance function. No deviations from normality in the residuals were detected.

Part1 Chapter 4
84
Results Standards Glucose standards with a wide range of δ13C values were analysed by LC/IRMS and GC/IRMS in order to compare the accuracy and precision of the techniques (Fig. 4.1). The results for the natural abundance range (δ13C between -27 and 0.9 ‰ VPDB) and for the labeling range (δ13C between 0 and 4662 ‰ VPDB) are presented separately because they represent different approaches.
For the natural abundance series, a linear relationship was obtained between δ13C values measured by respectively LC/IRMS and GC/IRMS and their expected values (Fig. 4.1(A) and 4.1(B)). For the replicate measurements of the data points, the LC/IRMS data showed less variability and a better precision when compared to the GC/IRMS data (Fig. 4.1(A) and 4.1(B); Table 4.1). This was also indicated by the Bland-Altman plots (Fig. 4.2(A) and 4.2(B)) that gave better limits of agreement for the LC/IRMS (-0.09 to 0.38) than the GC/IRMS (-2.09 to 0.85). Calculated accuracy was better for LC/IRMS when compared to the GC/IRMS (Table 4.1). However, small but significant offsets (non-zero intercepts) were found for both GC/IRMS and LC/IRMS for natural abundance measurements (Simple linear regression analyses: value = -0.85, T = -2.1, p = 0.01 and value = 0.22, T = 5.1, p<0.001 for GC/IRMS and LC/IRMS, respectively). In contrast to the significant difference between these offsets (ANCOVA: F1,32 =18.74, p< 0.001), the corresponding slopes (0.98 and 1.006 for GC/IRMS and LC/IRMS, resp.) were not significantly different from one another.
For the 13C labeling series, a linear relationship was also obtained between δ13C values measured by LC/IRMS and GC/IRMS (Fig. 4.1(C) and 1(D)). Whereas for the GC/IRMS measurements the intercept was not significant (Simple linear regression: value = -21.81, T = -0.98, p = 0.34) a significant intercept was found for the LC/IRMS measurements (Simple linear regression: value = -30.55, T = -3.36, p = 0.003). The seemingly bigger offset of the LC/IRMS measurements may in part be attributable to the higher accuracy of this method. Indeed, a covariance analysis could not detect a significant difference in intercept (F1,32 = 0.85, p = 0.36), nor in slope (F1,32= 2.14, p = 0.15). A better precision and accuracy was obtained for the labeling series measured by LC/IRMS when compared to GC/IRMS (Table 4.1). The Bland Altman plots (Fig. 4.2(C) and 4.2(D)) also indicated a better reproducibility for LC/IRMS (limits of agreement -83.8 to 25.5) than for GC/IRMS (limits of agreement -177.4 to 88.6).
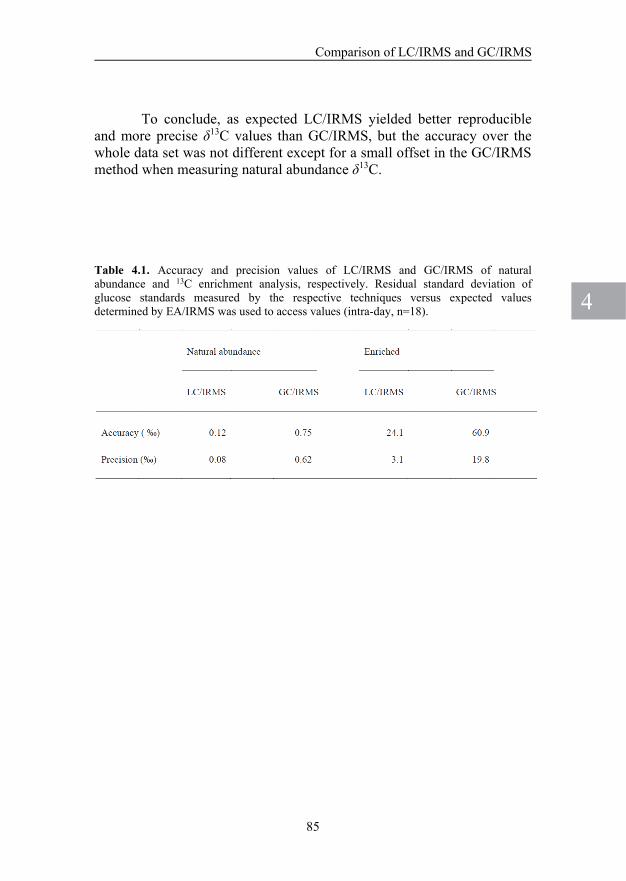
4
Comparison of LC/IRMS and GC/IRMS
85
To conclude, as expected LC/IRMS yielded better reproducible and more precise δ13C values than GC/IRMS, but the accuracy over the whole data set was not different except for a small offset in the GC/IRMS method when measuring natural abundance δ13C.
Table 4.1. Accuracy and precision values of LC/IRMS and GC/IRMS of natural abundance and 13C enrichment analysis, respectively. Residual standard deviation of glucose standards measured by the respective techniques versus expected values determined by EA/IRMS was used to access values (intra-day, n=18).

Part1 Chapter 4
86
y = 0.983x - 0.853R² = 0.994
-30
-25
-20
-15
-10
-5
0
5-30-25-20-15-10-505
y = 1.006x + 0.226R² = 1.000
-30
-25
-20
-15
-10
-5
0
5-30-25-20-15-10-505
y = 1.000x - 30.554R² = 1.000
0
1000
2000
3000
4000
5000
0 1000 2000 3000 4000 5000
y = 0.986x - 21.813R² = 0.998
0
1000
2000
3000
4000
5000
0 1000 2000 3000 4000 5000
A B
C D
δ13C glc expected value (‰)
δ13C
glc
mea
sure
dL
C/I
RM
S(‰
)
δ13C glc expected value (‰)
δ13C glc expected value (‰)δ13C glc expected value (‰)
δ13C
glc
mea
sure
dG
C/I
RM
S(‰
)
δ13 C
glc
mea
sure
dL
C/I
RM
S(‰
)
δ13 C
glc
mea
sure
dG
C/I
RM
S(‰
)
Fig. 4.1. Measured versus expected δ13C values of the glucose standard series values in 13C natural abundance range (between -27 and 0.9 ‰ VPDB) (A, B) and enriched range (between 93.9 and 4662 ‰ VPDB) (C, D) based on the LC/IRMS (A, C) and GC/IRMS method (B, D). All analyses were performed in triplicate. The measured values of the natural abundance glucose derivatives were corrected as described in the calibration, correction and isotopic calculation paragraph. The open dots denote the 2 calibration points; the closed dots denote the calculated points.
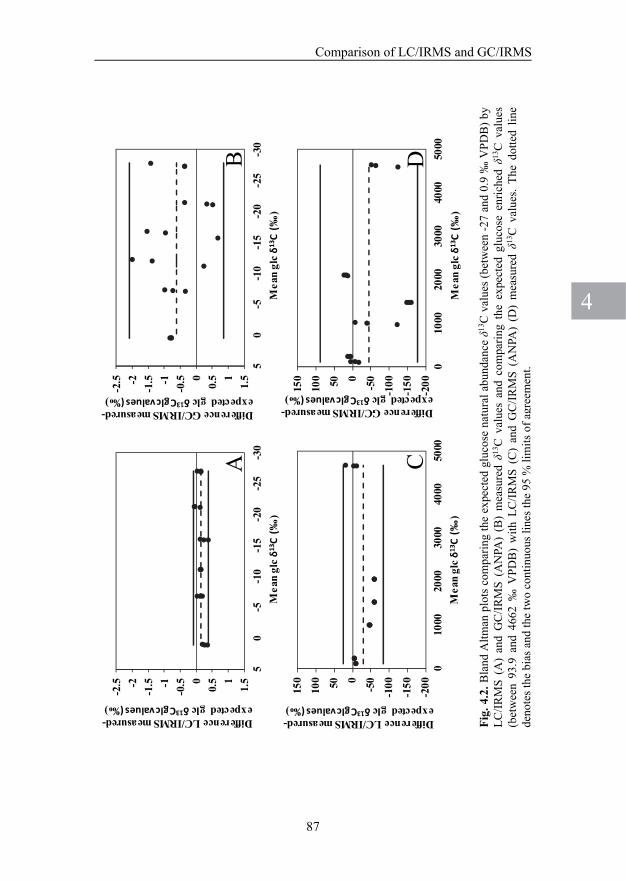
4
Comparison of LC/IRMS and GC/IRMS
87
-2.5 -2
-1.5 -1
-0.5 0
0.5 1
1.5
-30
-25
-20
-15
-10
-50
5
-2.5 -2
-1.5 -1
-0.5 0
0.5 1
1.5
-30
-25
-20
-15
-10
-50
5
-200
-150
-100-50050100
150
010
0020
0030
0040
0050
00-2
00
-150
-100-50050100
150
010
0020
0030
0040
0050
00
AB
CD
Difference LC/IRMS measured-expected glc δ13C glc values (‰)
Difference LC/IRMS measured-expected glc δ13C glc values (‰)
Mea
ngl
c δ1
3 C (
‰)
Mea
ngl
c δ1
3 C (
‰)
Difference GC/IRMS measured-expected glc δ13C glc values (‰)
Difference GC/IRMS measured-expected glc δ13C glc values (‰)
Mea
ngl
c δ1
3 C (
‰)
Mea
ngl
c δ1
3 C (
‰)
Fig
. 4.2
. Bla
nd A
ltm
an p
lots
com
pari
ng th
e ex
pect
ed g
luco
se n
atur
al a
bund
ance
δ13
C v
alue
s (b
etw
een
-27
and
0.9
‰ V
PD
B)
by
LC
/IR
MS
(A
) an
d G
C/I
RM
S (
AN
PA)
(B)
mea
sure
d δ1
3 C v
alue
s an
d co
mpa
ring
the
exp
ecte
d gl
ucos
e en
rich
ed δ
13C
val
ues
(bet
wee
n 93
.9 a
nd 4
662
‰ V
PD
B)
wit
h L
C/I
RM
S (
C)
and
GC
/IR
MS
(A
NPA
) (D
) m
easu
red δ1
3 C v
alue
s. T
he d
otte
d li
ne
deno
tes
the
bias
and
the
two
cont
inuo
us li
nes
the
95 %
lim
its
of a
gree
men
t.

Part1 Chapter 4
88
Natural abundance and enriched samples To study the effect of the various sample matrixes on the
carbohydrate measurement, several marine and terrestrial samples were analysed by LC/IRMS and GC/IRMS for their neutral carbohydrate isotopic composition. Carbohydrates are only listed when they were well separated from other components or impurities and with a peak height of 500 mV or higher (determined by Isodat software). Glucose gave always the highest peak, followed by galactose and xylose. For natural abundance samples, LC/IRMS and GC/IRMS analysis of these three most abundant carbohydrates showed good agreement (Fig. 4.3(A), 4.3(B) and 4.3(C)). Fucose analysis was restricted for a number of samples due to co-elution of impurities at the beginning of the LC/IRMS chromatogram. The concentration of mannose was low in all samples and detected in only one sample by both techniques.
As for the standards, natural abundance analysis of samples by LC/IRMS resulted in a lower average standard deviation of δ13C and, hence, a more precise determination of δ13C when compared to GC/IRMS, except for mannose that gave equal average standard deviations for both techniques (Fig. 4.3, Supplementary Table 4.S1, Supporting Information). No statistically significant differences of natural abundance δ13C values were found between LC/IRMS and GC/IRMS analyses for any of the carbohydrates (Table 4.2). In addition, carbohydrate fractionation Δδ values gave in general consistent results for LC/IRMS and GC/IRMS and most carbohydrates were 13C enriched relative to TOC. Table 4.2. Analysis of variance (ANOVA) table for natural abundance δ13C values of natural samples. Values determined by the LC/IRMS technique were compared by values determined by the GC/IRMS technique (Supplementary Table 4.S1), nd=not detectable.

4
Comparison of LC/IRMS and GC/IRMS
89
-100
900
1900
2900
3900
-100 900 1900 2900 3900
-35
-25
-15
-5
-35-25-15-5
-35
-25
-15
-5
-35-25-15-5
-35
-25
-15
-5
-35-25-15-5
A B
C D
Glc∆ Gal Fuc◊ Xyl˟ Man
Xyl
Glc Gal
δ13 C
GC
/IR
MS
(‰
)
δ13 C
GC
/IR
MS
(‰
)
δ13 C
GC
/IR
MS
(‰
)
δ13 C
GC
/IR
MS
(‰
)δ13C LC/IRMS (‰)
δ13C LC/IRMS (‰) δ13C LC/IRMS (‰)
δ13C LC/IRMS (‰)
Fig. 4.3. δ13C values of natural abundance (A, B and C) and enriched samples (D) measured by LC/IRMS were plotted against GC/IRMS values for listed carbohydrates. All samples were extracted in duplicate and analysed in triplicate (Supplementary Table 4.S1 and 4.S2) In panel D closed symbols represent the sediment sample, while open symbols represent the soil sample. The y = x line is indicated in all panels as a dotted line.
Part1 Chapter 4
90
The reproducibility of natural abundance δ13C values determined by LC/IRMS was clearly more influenced by the various sample matrixes than for GC/IRMS, since the average standard deviations of the δ13C of the samples (values between 0.3 and 3.1) were much higher than for the glucose standard analysis (i.e. 0.08). GC/IRMS standard deviation of the δ13C of the samples (values between 0.5 and 3.1) were on average also higher than the standard deviation determined via standard analysis (i.e. 0.62), however the increase was not as much as for the LC/IRMS measurements (Supplementary Table 4.S1, Supporting Information).
A soil and a sediment sample were 13C-enriched and analysed for their δ13C of the carbohydrates. For both samples, glucose was the most 13C-enriched carbohydrate. For the sediment sample all carbohydrates except glucose were low in 13C enrichment, whereas they were all higher labeled in the soil sample. The δ13C values of glucose, galactose, xylose and mannose were in good agreement for both techniques. In contrast, the δ13C fucose values varied substantially between techniques (Fig. 4.3(D); Supplementary Table 4.S2, Supporting Information). As was the case with the results of the natural abundance samples, the 13C enriched values of glucose and galactose analysed by LC/IRMS resulted in lower average standard deviations and, hence, more precise determination when compared to GC/IRMS. However, the average standard deviations of the δ13C values of fucose, xylose and mannose for the LC/IRMS measurements were higher compared to GC/IRMS (Supplementary Table 4.S2, Supporting Information). Again, as observed for natural abundance samples, LC/IRMS precision was more influenced by the sample matrixes than GC/IRMS precision (Supplementary Table 4.S2, Supporting Information).

4
Comparison of LC/IRMS and GC/IRMS
91
Drift of the δ13C value observed by GC/IRMS analysis On several occasions we observed drift of the δ13C value when
analysing ANPA derivatives by GC/IRMS. To study this effect in more detail, we repeatedly injected various components. First, a mixture of all ANPA-derivatised carbohydrates was repeatedly analysed (n=43, representing 27 h). Prior to analysis, the combustion oven was re-oxidised completely. On the one hand a decrease of δ13C in time of 0.013 ‰, 0.013 ‰, and 0.007 ‰ per injection was observed for glucose, galactose and fucose, respectively (Fig. 4.4(A)). On the other hand, an increase of δ13C in time of 0.007 ‰ and 0.014 ‰ per injection was observed for xylose and mannose, respectively (Fig. 4.4(A)). Drift appeared to be dependent on the compound analysed because repeated analysis of a C15 n-alkane, (n=70, representing 44 h) showed only -0.004 ‰ drift per injection (Fig. 4.4(B)).
A much larger drift was observed when analysing samples. To examine this effect, the ANPA-derivatised glucose standard was repeatedly injected over a period of 24 h (Fig. 4.4(C)) after the combustion oven was re-oxidised. During the first 8 h after re-oxidation of the combustion oven, representing 14 injections, the δ13C value of the ANPA-derivatised glucose standard was determined at -36.1 (± 0.4) ‰. Subsequently, 14 randomly chosen derivatised samples were injected, followed by 14 repetitive injections of the ANPA-derivatised glucose standard. After sample injections, the δ13C of the ANPA-derivatised glucose standard decreased on average by 0.18 ‰ per injection. After this the δ13C stabilized at a lower value of -37.1 (± 0.8) ‰.
No drift was observed during 24 h LC/IRMS analysis and all carbohydrate δ13C values remained within 0.3 ‰ of the EA/IRMS determined δ13C values (data not shown). Completeness of derivatisation
To check for complete derivatisation of the functional groups of the carbohydrates, GC/MS-CI was applied to determine the molecular masses for ANPA derivatives. The measured molecular masses for glucose, galactose, fucose, mannose and xylose ANPA derivatives were in agreement with the calculated masses confirming the complete derivatisation of the carbohydrates (data not shown).

Part1 Chapter 4
92
-1.5
-1
-0.5
0
0.5
1
1.5
0 10 20 30 40 50
Δδ1
3C
‰
Number of injections
Glc Gal Fuc Xyl Man
-1.5
-1
-0.5
0
0.5
1
1.5
0 20 40 60 80 100
∆δ1
3C
‰
Number of injections
n C15 alkane
-40
-39
-38
-37
-36
-35
0 10 20 30 40 50
δ13 C
glc
AN
PA d
eriv
ativ
e (‰
)
Number of injections
Glc
samples
A
B
C
Fig. 4.4. Delta13C drift observed by repetitive measurement of δ13C values of derivatised carbohydrates, caused by gradually decreased efficiency of the combustion oven. The ∆δ13C value calculated relative to the determined δ13C value of the carbohydrate upon the first injection is plotted (A). Delta13C drift observed by repetitive measurement of δ13C values of a non-derivatised substance, a C15 n-Alkane, caused by gradually decreased efficiency of the combustion oven. The ∆δ13C value calculated relative to the defined δ13C value (EA/IRMS determined) of the n-Alkane is plotted (B). Delta13C drift observed by repetitive measurement of uncorrected values of the same ANPA glucose standard derivative in combination with sample injections, caused by impairment of the combustion oven (C). For all three plots the GC/IRMS combustion oven was re-oxidized before start of the measurements.

4
Comparison of LC/IRMS and GC/IRMS
93
Discussion The performance of two techniques, LC/IRMS and GC/IRMS, was studied to analyse compound specific stable carbon isotope analysis of carbohydrates. We discuss the outcome and consequence of our findings for standard and sample stable carbon isotope analysis of carbohydrates. Moreover, we discuss the possible sources of error and the considerations to be taken into account in order to obtain reliable results. Accuracy and precision of δ13C carbohydrate measurements As expected, compared to the GC/IRMS, LC/IRMS proved to be more precise for the analysis of δ13C of carbohydrates, both at their natural abundance and upon enrichment. The precision of LC/IRMS of standard compounds was 6-8 times better than for the GC/IRMS. This is mainly due to the variation by correction for the added carbon during derivatisation in the latter method. The imprecision depends on how excessive derivative carbon is added to the original compound. When low molecular compounds such as carbohydrates are subject of studies the imprecision is considerable (Rieley, 1994; Docherty et al., 2001). However, when the whole dataset is considered, differences in accuracy between the two techniques were statistically not significant. This suggests that both techniques can be used for reliable stable carbon isotope analysis of carbohydrates. Nevertheless, for a reproducible analysis with minimal variability the LC/IRMS technique is evidently superior compared to the GC/IRMS and therefore the former should be the technique of choice. Likewise, Godin et al. (2008) showed no statistical difference when comparing LC/IRMS and GC/IRMS for the analysis of the amino acid valine and they preferred LC/IRMS because no derivatisation is needed for this technique. Sources of error for compound specific stable carbon isotope analysis of carbohydrates Chromatography and sample clean up. Controlling the chromatographic conditions is an important issue for both LC/IRMS and GC/IRMS (McCullagh, 2010). For both techniques, complex sample matrixes have a negative effect on the chromatographic separation of carbohydrates (i.e. it affects the co-elution of the overlapping compounds) and on baseline stability (i.e. increased level and variation in CO2 background signal). These effects vary with the carbohydrate being analysed and is reflected by the deteriorated reproducibility of δ13C measurements both at the natural abundance level

Part1 Chapter 4
94
and at enriched level. However, the effect was typically stronger for LC/IRMS than for GC/IRMS. This is because LC/IRMS peaks are broader than those of GC/IRMS. Peak broadening affects the signal-to-noise ratio and especially at low concentrations background subtraction is more critical (Krummen et al., 2004; McCullagh, 2010; Godin & McCullagh, 2011). Background subtraction was likely the cause of diminished precision for the late eluting xylose and mannose in LC/IRMS analysis (Supplementary Table 4.S2, Supporting Information). In addition, co-elution of compounds with substantial different δ13C values result in inaccurate measurements. This is especially relevant when 13C enriched compounds are studied and this probably happened in the case of LC/IRMS analysis of fucose. A potential solution to improve chromatographic separation would be to remove the impurities by utilising sample cleaning procedures (Mopper, 1977; Boschker et al., 1995).
Despite the decrease in reproducibility of δ13C for samples, LC/IRMS still showed the highest precision for natural abundance as well as for the 13C enriched carbohydrates, glucose and galactose, which are the two most abundant. For the less abundant carbohydrates fucose, xylose and mannose, LC/IRMS also showed a better reproducibility for natural abundance samples, although a better reproducibility was obtained using GC/IRMS for the 13C-enriched samples.
Conversion of carbohydrates to CO2
The critical step in the LC/IRMS and GC/IRMS techniques is the continuous and quantitative conversion of organic molecules to CO2. In the LC/IRMS interface this conversion occurs with an excess oxidation reagent at low temperature (99.9 °C) (Krummen et al., 2004). This appears more robust than the conversion in the GC/IRMS technique in which the combustion of the organic molecule is catalysed by CuO/NiO wires at high temperature (940 °C). GC/IRMS requires regular regeneration of the combustion oven in order to assure a stable oxidation capacity (Sessions, 2006). When combustion performance is suboptimal and causes incomplete oxidation of the organic compounds, the oven needs to be immediately re-oxidised in order to prevent a deteriorated precision of the δ13C analysis as was observed in Fig. 4.4(C). Sessions (2006) observed a similar offset of up to 2 ‰ δ13C. The frequency of re-oxidation of the oven depended on the number of injections, sample type and sample matrix (Fig. 4.4(A), 4.4(B) and 4.4(C)).
The state of the combustion oven affects the measurement precision through gradual decreased oxidation efficiency as was observed

4
Comparison of LC/IRMS and GC/IRMS
95
in figure 4.4(A) and 4.4(B). This bias is known and inherent to GC/IRMS analysis and reflects the state of the oxidation capacity of the combustion oven (Macko et al., 1998). In contrast with the incomplete oxidation by the combustion oven observed in figure 4.4(C), the gradual decreased oxidation efficiency (Fig. 4.4(A) and 4.4(B)) is acceptable within the observed limits (± 0.4 ‰).
Due to the LC/IRMS robust conversion of organic molecules to CO2 there was a minimum of routine maintenance to its conversion unit (i.e. oxidation oven). The only caution to be taken was the maintenance of the capillaries transporting the eluent through the interface. These capillaries were sensitive to flow obstruction, however when the manufacturer instructions were followed (i.e. applying a continuous flow through the system; even if the LC/IRMS is not being used for analysis) minimized blockage of capillaries. On average we had to maintain the system only once a year, which is excellent comparing to the regeneration interval required for GC/IRMS combustion (after every 16th sample analysis).
System validation and calibration.
At present, no agreed guidelines exist for the re-oxidation of the combustion oven and the strategy to use in order to obtain reliable GC/IRMS results. However, in the literature several options have been suggested for obtaining the highest possible precision and accuracy of δ13C GC/IRMS measurements (Merritt et al., 1995; Meier-Augenstein, 1999; Sessions, 2006). This involves comparing sample and standard within the same chromatogram or exposed to exact similar combustion conditions. Since we confirmed complete derivatisation of all related functional groups of the carbohydrates, incomplete derivatisation of the carbohydrates was disregarded as a possible cause of inferior GC/IRMS precision. Our strategy was to validate the performance of the system with in-house external standards to guarantee optimal GC/IRMS accuracy after every three samples. In this way we were able to compensate for deterioration of the capacity of the combustion oven and to check if regeneration of the combustion oven was needed.
Preferably, one should apply a continuous validation of the system by using an internal standard. It is unfortunate that a suitable internal standard was not found as this may enhance analytical performance. Myo-inisitol, which is often used as internal carbohydrate standard could not be applied because environmental samples may contain it (Pierre et al., 2010).
The δ13C values for all enriched carbohydrate derivatives

Part1 Chapter 4
96
measured by GC/IRMS were, due to the lack of corresponding certified 13C labeled carbohydrate standards, corrected by using a glucose calibration line as a reference (see ‘calibration, correction and isotopic calculation’ section). It was assumed that all carbohydrates (i.e. hexose, pentose (after correction for the number of carbon atoms in the carbohydrate) and deoxyhexose) have a similar behaviour as glucose (i.e. a hexose), As the applied calibration line correction depends on the type of carbohydrate (Baumann et al., 2012), the use of a carbohydrate other than the same is not ideal and did not contribute to optimal calibration condition. Therefore, we recommend to use the same carbohydrate derivative for the calibration line as being analysed in the sample in order to guarantee correct and reliable results.

4
Comparison of LC/IRMS and GC/IRMS
97
Conclusion LC/IRMS and GC/IRMS are both reliable techniques for stable carbon isotope analyses of carbohydrates, providing that all conditions are met for the latter (i.e. acceptable chromatographic performance and reproducible and justified back calculation of derivatisation) and for the former (i.e. acceptable chromatographic performance). However, because LC/IRMS carbohydrate analysis is much easier since no laborious sample preparation and challenging system validation are required, this is the technique of choice for stable carbon isotope analyses of individual neutral carbohydrates. LC/IRMS also achieved the highest precision in most samples. GC/IRMS methods are limited because they are only available for neutral sugars, sugar alcohols and amino sugars. With LC/IRMS it is possible to analyse a much broader range of acidic-, oligomer- and sulphate carbohydrates (Boschker et al., 2008; Bodé et al., 2009).
Acknowledgements The authors thank Peter van Breugel for his assistance analysing the bulk total organic carbon δ13C values and his advice on LC/IRMS, and three anonymous reviewers for their thorough evaluation of the paper.

Part1 Chapter 4, Supporting information
98
Supporting information
Supplementary Fig. 4.S1. Reaction scheme of aldonitrile penta acetate (ANPA) derivatisation of glucose

4
Comparison of LC/IRMS and GC/IRMS
99
NATURAL ABUNDANCE
Sample Component δ 13C ‰ SD Δδ δ 13C ‰ SD Δδ δ 13C ‰ SD
Ulva glc -14.1 0.4 -0.7 -14.1 1.2 -0.7 -13.4 0.1Elymus glc -33.3 0.6 1.4 -32.4 0.1 2.3 -34.7 0.0Festuca glc -24.5 0.3 1.6 -23.9 0.5 2.2 -26.1 0.0Spartina glc -11.7 0.2 0.8 -12.0 0.3 0.5 -12.5 0.0Maize lea f glc -11.8 0.4 0.8 -12.0 0.5 0.7 -12.7 0.2Maize root glc -10.8 0.2 1.0 -11.4 0.1 0.4 -11.8 0.1Soil glc -25.5 0.3 0.8 -26.7 0.3 -0.4 -26.3 0.0Sediment glc -16.2 0.4 4.2 -17.3 1.0 3.1 -20.4 0.3
Average SD 0.3 0.5
Ulva gal -13.6 0.7 -0.2 -14.0 1.1 -0.6 -13.4 0.1Elymus gal -33.1 0.7 1.6 -29.2 2.8 5.5 -34.7 0.0Festuca gal -24.9 0.8 1.2 -22.1 2.2 4.0 -26.1 0.0Spartina gal -11.8 0.6 0.7 -14.2 1.8 -1.7 -12.5 0.0Maize lea f gal -11.9 0.9 0.8 nd nd nd -12.7 0.2Maize root gal -9.4 0.0 2.5 -8.0 0.8 3.9 -11.8 0.1Soil gal -25.7 0.3 0.5 -28.2 0.4 -2.0 -26.3 0.0Sediment gal -18.9 0.2 1.4 -21.3 1.3 -0.9 -20.4 0.3
Average SD 0.5 1.5
Ulva fuc -12.9 1.5 0.5 nd nd nd -13.4 0.1Elymus fuc nd nd nd nd nd nd -34.7 0.0Festuca fuc nd nd nd -18.3 0.9 7.8 -26.1 0.0Spartina fuc -10.4 0.9 2.1 -11.8 1.9 0.7 -12.5 0.0Maize lea f fuc -9.8 0.4 2.9 nd nd nd -12.7 0.2Maize root fuc nd nd nd nd nd nd -11.8 0.1Soil fuc nd nd nd -20.7 1.0 5.5 -26.3 0.0Sediment fuc -17.1 0.6 3.2 nd nd nd -20.4 0.3
Average SD 0.8 1.3
Ulva xyl -9.6 0.7 3.8 -9.6 2.0 3.8 -13.4 0.1Elymus xyl -29.8 0.9 4.9 -29.4 1.2 5.3 -34.7 0.0Festuca xyl -21.1 0.8 5.0 -23.7 1.0 2.4 -26.1 0.0Spartina xyl -7.9 0.4 4.6 -5.3 1.5 7.2 -12.5 0.0Maize lea f xyl -8.5 0.2 4.2 -11.0 1.6 1.7 -12.7 0.2Maize root xyl -7.6 0.2 4.2 -5.5 0.2 6.3 -11.8 0.1Soil xyl nd nd nd nd nd nd -26.3 0.0Sediment xyl nd nd nd nd nd nd -20.4 0.3
Average SD 0.5 1.3
Ulva man nd nd nd nd nd nd -13.4 0.1Elymus man nd nd nd nd nd nd -34.7 0.0Festuca man nd nd nd nd nd nd -26.1 0.0Spartina man nd nd nd nd nd nd -12.5 0.0Maize lea f man nd nd nd nd nd nd -12.7 0.2Maize root man nd nd nd nd nd nd -11.8 0.1Soil man -26.9 3.1 -0.6 nd nd nd -26.3 0.0Sediment man nd nd nd -8.8 3.1 11.5 -20.4 0.3
Average SD 3.1 3.1
EA/IRMS (TOC)GC/IRMSLC/IRMS
Supplementary Table 4.S1. Samples at natural abundance δ13C level were extracted in duplicate and analysed for carbohydrates in triplicate by LC/IRMS and GC/IRMS (ANPA derivatives). Delta13C values and standard deviations (SD) are the average of the 6 measurements. Five different carbohydrates were determined: glucose (glc), galactose (gal), fucose (fuc), xylose (xyl) and mannose (man), nd=not detectable. Fractionation Δδ values represent the difference between the δ13C EA/IRMS bulk value of total organic carbon (TOC) and the δ13C individual carbohydrate value measured by LC/IRMS and GC/IRMS.

Part1 Chapter 4, Supporting information
100
ENRICHED
Sample Component δ 13C ‰ SD δ 13C ‰ SD δ 13C ‰ SD
Sediment glc 212.3 5.6 258.7 2.9 -6.6 1.1Soil glc 3346.8 11.8 3335.2 43.5 880.0 10.0
Average SD 8.7 23.2
Sediment gal -4.3 1.0 -30.7 7.9 -6.6 1.1Soil gal 1902.4 10.5 2249.1 26.3 880.0 10.0
Average SD 5.8 17.1
Sediment fuc 2.0 4.5 -14.5 6.1 -6.6 1.1Soil fuc 1291.5 47.6 686.3 15.7 880.0 10.0
Average SD 26.0 10.9
Sediment xyl 1.5 5.0 -10.4 1.8 -6.6 1.1Soil xyl 591.2 39.0 896.6 23.0 880.0 10.0
Average SD 22.0 12.4
Sediment man -3.5 6.3 -2.4 5.8 -6.6 1.1Soil man 2074.4 56.7 2462.7 48.1 880.0 10.0
Average SD 31.5 27.0
EA/IRMS (TOC)LC/IRMS GC/IRMS
Supplementary Table 4.S2. Samples enriched in 13C were extracted in duplicate and analysed for carbohydrates in triplicate by LC/IRMS and GC/IRMS (ANPA derivatives). Delta13C values and standard deviations (SD) are the average of 6 measurements. Five different carbohydrates were determined: glucose (glc), galactose (gal), fucose (fuc), xylose (xyl) and mannose (man). The total organic carbon (TOC) δ13C value is the bulk δ13C value measured by EA/IRMS.

5
6
7
8
101
PART 2. Carbon cycling in benthic diatom mats
Par
t
2

5
6
7
8
102

LC/IRMS analysis: A powerful technique to trace carbon flow in microphytobenthic communities in intertidal sediments Published in Journal of Sea Research 92 (2014) 19-25 Tanja C.W. Moerdijk-Poortvliet, Lucas J. Stal , Henricus T.S. Boschker Royal Netherlands Institute for Sea Research (NIOZ), Korringaweg 7, 4401 NT Yerseke, The Netherlands.
5 C
hapt
er

Part 2 Chapter 5
104
Abstract
Microphytobenthic communities are important for primary production in intertidal marine sediments. Extracellular polymeric substances (EPS), comprising polysaccharides and proteins, play a key role in the structure and functioning of microphytobenthic biofilms and allow interactions between the benthic microalgae and the associated heterotrophic bacteria. The use of stable isotopes has provided major insights into the functioning of these microbial ecosystems. Until recently, gas chromatography - isotope ratio mass spectrometry (GC/IRMS) was the principal method for compound specific stable isotope analysis in these studies. Liquid chromatography linked to IRMS (LC/IRMS) is a more recently developed technique that broadens the range of compounds that can be targeted, in particular enabling the analysis of 13C in non-volatile, aqueous soluble organic compounds, such as carbohydrates and amino acids. In this paper we present an overview of the possibilities and limitations of the LC/IRMS technique to study metabolic processes in microphytobenthic biofilms consisting of mainly diatoms. With a preliminary in-situ labeling experiment, we show that the biosynthesis of carbohydrates and amino acids in EPS and total carbohydrate and amino acid pools can be determined by LC/IRMS. Water-extractable EPS were composed predominantly of carbohydrates, whereas amino acids played a minor role, both in terms of content and production. By using LC/IRMS, we will be able to quantify the biosynthesis of metabolites and, hence, to unravel in detail the metabolic pathways of the transfer of carbon from the diatoms via EPS to the bacteria.

5
LC/IRMS to trace carbon flow
105
Introduction Coastal zones and estuaries play an important role in the global carbon cycle (Gattuso et al., 1998). Intertidal mudflats that are abundantly present in estuaries are amongst the most productive systems on earth providing feeding and nursery grounds for many species of birds, fish and shellfish. For a large part, these higher trophic level organisms depend on the primary production by microphytobenthos (MPB). During emersion, MPB form a temporary biofilm on the sediment surface and supply organic matter by photosynthesis (Underwood et al., 2005). It has been calculated that MPB may contribute up to 50 % of the total primary production within estuaries (Cahoon, 1999; Underwood & Kromkamp, 1999). A large number of studies endorse the complexity of the functioning of the microphytobenthic biofilm (Du et al., 2009; Hicks et al., 2011; Jesus et al., 2009; Kromkamp et al., 2006; Mouget et al., 2008; Paterson & Hagerthey, 2001; Stal, 2010; Vieira et al., 2011; Walters & Moriarty, 1993).
In temperate regions, MPB biofilms mainly consist of diatoms and associated bacteria, interacting with each other via extracellular polymeric substances (EPS) (Underwood et al., 2005). EPS are therefore important compounds in microphytobenthic biofilms and play a major role in the structure and functioning of the community (Stal, 2010). Recent studies have shown the importance of EPS exudation for the development of the biofilm (Bruckner et al., 2011). These authors showed that diatom growth and EPS production is influenced by the presence of certain heterotrophic bacteria. It has even been suggested that microphytobenthic biofilms are only formed in the presence of such bacteria (Bruckner et al., 2008).
EPS may occur in a range of different size classes (De Brouwer & Stal, 2001; Underwood and Paterson, 2003). Beside polysaccharides, EPS may also contain proteins, lipids and nucleic acids (Flemming & Wingender, 2010). Intracellular and extracellular carbohydrates (CHO) and amino acids (AA) play a central role in the functioning of MPB and their interaction with the bacterial community. During photosynthesis, glucose is produced and initially stored as an intracellular β-glucan, and subsequently further metabolized for the synthesis of amino acids and proteins and other structural cell materials of the diatoms. In addition, CHO and AA may both be exuded as EPS that then becomes available to the microbial community and finds its way further into the food web. EPS can be distinguished in two operationally defined fractions, water- and EDTA-extractable EPS (described in detail by de Brouwer & Stal (2001)). These fractions differ substantially in their composition and their

Part 2 Chapter 5
106
production seems to be under a different metabolic control. Water extractable EPS are probably intimately associated with the diatoms and can be readily used by heterotrophic bacteria, whereas EDTA-extractable EPS seem to be tightly bound to the sediment (Stal, 2003), and are more recalcitrant to microbial degradation (Domozych et al., 2005). Thus far, most studies focused on the measurement of the content of EPS fractions in the sediment but thereby neglecting production and turnover rates of these exudates.
At present, stable isotopes (SI) techniques are the state-of-the-art for the study of the carbon cycle in microphytobenthic biofilms. Stable isotope analysis can be used in two different ways for the study of MPB. First, at natural abundance level, the isotopic signature of an organism provides insight into the nature of the carbon sources that were used by comparing the isotopic signature of the organism with that of the available sources. For instance, Bouillion and Boschker (2006) collected natural abundance data of δ13C bacterial biomarker phospholipid-derived fatty acid (PLFA) to study bacterial carbon sources in a range of coastal sediments. A reanalysis of their data for bare intertidal areas showed that the bacteria present in intertidal marine sediments strongly depend on carbon derived from benthic diatoms (Fig. 5.1). Secondly, an isotopically enriched tracer compound can be added to the sediment surface and its fate can be subsequently followed in different carbon pools. This approach conveys important kinetic information of specific metabolic processes. The rate of incorporation of the isotopic label in a compound gives information on the synthesis. Similarly, the subsequent decay of the label provides information on the absorption and the rate of degradation of the same compound. By following the evolution of the label in a number of important pools, one can also deduce the pathway of carbon flow. A major benefit of the use of stable isotopes in environmental experiments is the ability to use them directly in the field, which yields more relevant in-situ information on the functioning of MPB. In order to understand the complex carbon flow in microphytobenthic biofilms it is important to be able to measure the stable isotopes in specific metabolic intermediates of the intracellular and extracellular pathways.

5
LC/IRMS to trace carbon flow
107
Fig. 5.1. Natural abundance δ13C ratios of bacterial phospholipid-derived fatty acid (PLFA) in non-vegetated intertidal marine sediments. Results show that the sediment bacteria depend to a large extend on carbon derived from benthic diatoms as their enriched isotopic signal is more related to benthic diatoms than to phytoplankton derived material. Results are based on a reanalysis of the data presented in Bouillon and Boschker (2006).
Until recently, GC/IRMS was the principal technique to perform compound specific SI analysis (CSIA). The majority of SI studies published have dealt with various aspects of lipid biochemistry, such as the metabolism of free saturated and unsaturated fatty acids (Bellinger et al., 2009; Bouillon and Boschker, 2006; Evrard et al., 2012; Evrard et al., 2008; Oakes et al., 2012). GC/IRMS analysis of fatty acids is a simple and straightforward technique. Fatty acids are extracted prior to esterification to form fatty methyl esters (FAMEs) that makes them suitable for GC/IRMS analysis. Carbohydrates and amino acids can only be analyzed by GC/IRMS after heavy derivatisation, which makes them more volatile and less polar. A drawback of this technique is that some derivatives of CHO and AA are unstable and also substantial corrections of the measured stable isotopic composition are necessary because a large amount of extra carbon is added during derivatisation. Moreover, some protocols such as acetylation cause additional kinetic fractionation (Rieley, 1994). Fortunately, both carbon dilution and fractionation are reproducible and therefore recalculation to the original isotopic composition is possible. However, these corrections add uncertainties to the determination of the original isotopic ratios, decreasing accuracy and precision of the method. The need of derivatisation for CHO and AA analysis by GC/IRMS also substantially increases the complexity of the analytical procedures. This
Part 2 Chapter 5
108
combination of drawbacks and restrictions may be the reason that only a few studies have been published that directly traced carbon flow from diatoms to bacteria (Bellinger et al., 2009; Evrard et al., 2008).
Liquid chromatography (LC) eliminates many of the drawbacks of GC because compounds can be analyzed directly without the need of derivatisation. However, it was not until 2004 that an interface that coupled LC to IRMS became commercially available and the first applications of LC/IRMS were developed (Krummen et al., 2004). In the past years, a substantial number of applications to study metabolites have been published emphasizing the power and robustness of LC/IRMS for the analysis of amino acids, peptides, carbohydrates, fatty acids and nucleic acids (Boschker et al., 2008; Cabanero et al., 2010; Godin et al., 2008; Godin et al., 2005; Heuer et al., 2006; McCullagh et al., 2008; Schierbeek et al., 2007; Smith et al., 2009). Especially analysis of carbohydrates, amino acids and nucleic acids experience major benefits from the use of LC/IRMS because it is not necessary to make derivatives, avoiding laborious sample preparation. This all leads to more accurate results.
The aim of this paper was to provide an overview of the possibilities of the use of LC/IRMS for the study of metabolic processes in microphytobenthic biofilms. We also present a preliminary in-situ study on EPS dynamics in microphytobenthic biofilms by using LC/IRMS.

5
LC/IRMS to trace carbon flow
109
Analytical techniques
Isotope Ratio Mass Spectrometry Currently, the most precise and accurate method for stable isotope
analysis is isotope ratio mass spectrometry (IRMS). Due to this design, the precision of the isotope ratio is a few parts per thousand (0.0001 – 0.0003 %). Before a sample can be introduced into an IRMS it must be converted to a gas (N2, CO2, H2, SO2). This can be done by bulk combustion followed by separation of the produced gasses, or by chromatographic separation of the components of interest followed by on-line conversion of each single component to the required gasses, which is called compound specific stable isotope analysis (CSIA).
In the past, the measurement of the stable isotope 13C was performed with a manual procedure to convert the sample into CO2 gas. Now it is possible to connect an IRMS to different preparation and separation instruments such as an elemental analyzer (EA) providing bulk data, and a gas chromatograph (GC) providing compound specific data. In 1988 the first commercially GC/IRMS system became available (Brand et al., 1989; Hayes et al., 1989). Middelburg et al. (2000) were the first to use in-situ 13C labeling to study the transfer of carbon from MPB to heterotrophic bacteria by using GC/IRMS analysis of biomarker PLFA.
LC/IRMS
Linking a GC directly to an IRMS system is possible because all compounds leave the separation column in the gaseous phase in an inert helium flow. The gas can be combusted and introduced into the IRMS after the removal of water. However, connecting an LC to an IRMS is more complicated because the compounds of interest need to be separated from the liquid eluent before being introduced in the IRMS. After several less successful attempts (Abramson et al., 2001; Brenna et al., 1997; Caimi & Brenna, 1993; McLean et al., 1996; Teffera et al., 1993), a wet oxidation interface linking LC to IRMS was developed by (Krummen et al., 2004). As illustrated in figure 5.2, the oxidation of the organic molecules into carbon dioxide (CO2) gas is performed in a heated reactor where acid (phosphoric acid), oxidant (sodium peroxidisulfate) and LC eluent are mixed. Via chemical oxidation all eluting compounds are converted to CO2, which is transferred from the eluent into a helium flow with a membrane separator. Finally, water vapor is removed and the purified CO2 flow is carried into the ion source of the mass spectrometer. Currently, there are two available interfaces: the Isolink (Thermo Fisher,

Part 2 Chapter 5
110
Bremen, Germany) and the LiquiFace, a more recent development (Isoprime, Cheadle Hulme, UK (Morrison et al., 2010)).
The design of the LC/IRMS interface involves a number of analytical constraints. The current LC/IRMS systems are not compatible with organic and other carbon-containing eluents, preventing the use of many of the traditional LC methods. Organic solvents cannot be used because the continuous oxidation in the reactor unit would create an extremely high CO2 background. The composition of the mobile phase is therefore restricted to inorganic acids, bases and buffers dissolved in high-quality Milli-Q water. Furthermore, the selection of the analytical column is important because column bleeding should be low, as the release of the bonded phase of the column during analysis also causes high and unstable background signals (Godin et al., 2007; McCullagh, 2010). These analytical constraints, together with the requirement of baseline separation of components in order to obtain accurate isotopic measurement of the compounds, are challenging the development of analytical methods. Fortunately there is an increase in the development of columns suitable for separating components in aqueous solutions such as mixed mode columns (McCullagh, 2010). Another limitation to take into account is that LC/IRMS is hitherto restricted to 13C analysis whereas GC/IRMS is able to measure multiple elements, such as 15N/14N, 18O/16O and 3H/2H, isotope ratios in addition to 13C/12C. Nevertheless, the introduction of the LC/IRMS technique has opened a new avenue for the study of a broad range of biological compounds.
The LC/IRMS system can also be used without column separation and via direct injection into the flow path of the system, bulk δ13C values can be determined. This feature is called flow injection analysis IRMS (FIA/IRMS) (McCullagh et al., 2011). The major advantage of FIA/IRMS over EA/IRMS is that it requires a lower amount of sample. Due to the more efficient sample transfer to the IRMS, typically 50-500 ng of carbon is required for FIA/IRMS compared to a few µg for EA/IRMS, to achieve a standard deviation lower than 0.3 ‰ (Boschker et al., 2008; Godin et al., 2005).

5
LC/IRMS to trace carbon flow
111
Fig
. 5.
2. P
rinc
iple
s of
the
LC
/IR
MS
int
erfa
ce. C
ompo
unds
sep
arat
ed b
y L
C a
re c
onve
rted
to C
O2
by w
et-c
hem
ical
oxi
dati
on. I
n th
e se
para
tion
uni
t, th
is C
O2
is t
rans
ferr
ed f
rom
the
liq
uid
elue
nt i
nto
a he
lium
flo
w.
Bef
ore
the
CO
2 fl
ow i
s ca
rrie
d in
to t
he
isot
opic
mas
s sp
ectr
omet
er (
IRM
S) th
e w
ater
vap
or is
rem
oved
(K
rum
men
et a
l., 2
004)
.

Part 2 Chapter 5
112
Applications of LC/IRMS in metabolic studies
Carbohydrates In organisms, polysaccharides have a primary function as structural components and as storage compounds. Because cellular and extracellular production of carbohydrates (CHO) plays a central role in the functioning of microphytobenthic biofilms, stable carbon isotope analyses of these compounds are important for the identification of carbon sources, their turnover rate in the sediment and tracing them into microbial biomass. Monomeric carbohydrates are found in many different forms including neutral carbohydrates, uronic acids and amino sugars. Neutral carbohydrates play an important role in the bulk CHO and in the MQ extracted EPS fraction, whereas uronic acids play an important role in the EDTA extractable EPS fraction (de Brouwer and Stal, 2001).
The carbohydrate polymers can be hydrolyzed to monomers (details see Material and Methods section). Cabanero et al. (2006) developed a method to analyze carbohydrates by LC/IRMS. They detected a limited number of sugars, i.e. sucrose, glucose and fructose. Boschker et al. (2008) extended the separation of carbohydrates by LC/IRMS to the most important monosaccharides and uronic acids that play a role in microphytobenthic biofilms. This method was applied to follow 13C labeling of carbohydrates in sediments by Oakes et al., 2010. Amino acids Similar to the case for carbohydrates, amino acids are equally important compounds in microphytobenthic biofilms. Amino acids are key building blocks of proteins but can also be present as free metabolites and in EPS. Godin et al. (2005) developed an LC/IRMS method to analyze amino acids. This method was improved by McCullagh et al. (2006) and finally optimized by Smith et al. (2009), who were able to separate all biological amino acids such as those found in microphytobenthic biofilms.
Short chain organic acids Short chain organic acids (SCOA) such as acetic acid play an important role in the central metabolism of MPB mats. Acetate is a key metabolite in anaerobic metabolism and in the cycling of organic carbon in marine sediments. Acetate is produced by fermentation of organic matter and also by reduction of CO2 by acetogenic bacteria. Concentrations in the pore water of surface sediments tend to be low, around 10 μM, because of rapid turnover (Heuer et al., 2009). In addition, various SCOA are important intermediates in the central metabolism of all organisms and are known to

5
LC/IRMS to trace carbon flow
113
be important as exudates of plant roots (Carvalhais et al., 2011). Acetate and other SCOA are important substrates for heterotrophic bacteria (Sundh, 1992). Therefore, the measurements of these compounds could provide valuable information on the diatom-bacteria interaction. By sampling the pore water of the sediment, 10 different SCOA such as citrate, malate, succinate, acetate and lactate can be directly determined by using LC/IRMS (Heuer et al., 2006).
Applications of FIA/IRMS As mentioned above, the LC/IRMS interface can also be used to measure bulk carbon isotope ratio determination by injecting off-line extracted compounds directly into a continuous flow of the mobile phase. An example is the extraction of specific 16S ribosomal RNA from marine sediment by magnetic bead capture hybridization (Miyatake et al., 2009). 16S rRNA, a component of the prokaryotic ribosome, is an excellent phylogenetic marker and the analysis of 13C in this molecule is an attractive approach to identify the groups of bacteria that are involved in the coupling of carbon flow between benthic diatoms and heterotrophic bacteria.
The FIA mode of the LC/IRMS can also be used to analyze δ13C of dissolved organic carbon (DOC) in aqueous solutions (Alberic, 2011). Thus far, this analysis is restricted to samples with salinities lower than 1 ‰ because at higher salinity the samples are incompletely oxidized by the interface.

Part 2 Chapter 5
114
Materials and Methods
Field site In February 2011, an in-situ 13C-labeling experiment was performed at the Zandkreek mudflat situated along the southern shore of the Oosterschelde estuary in the South-West of the Netherlands (51°32'41”N, 3°53'22”E). The sampling site was located 0.15 m below the mean tidal level and the exposed period was approximately 6 h per tidal cycle. Salinity and sediment temperature were 28.5 and 4.5 oC, respectively. During the experiment a diatom biofilm was present on the surface, varying in density depending on the time of the day, probably because of migration of the diatoms. 13C labeling and sampling The experiment was started shortly after the immersion period. Two 50 × 50 cm stainless steel frames were pushed into the sediment to a depth of 8 cm in order to define the labeling and the sampling area. The two frames were treated as duplicates. Initially, unlabeled control samples were taken just outside the frames as described below. The in-situ labeling experiment was started by spraying the surface of the sediment within each frame with 200 mL of [13C] sodium bicarbonate (99 % 13C; Cambridge Isotope Laboratories, Andover, USA) with ambient salinity to obtain a final concentration of 1 g 13C m-2 (Middelburg et al., 2000) .
Label incorporation was measured in samples taken 4 h after the label was sprayed on the sediment. The top 1.5 cm of the sediment was sampled by pushing a core liner (inside diameter 10 cm) into the sediment and sampling the top of the sediment with a spatula. Samples were collected and mixed from two randomly chosen positions within the sampling grid of each frame. Sediment samples were divided in portions of approximately 10 g wet weight each. Samples for TOC, bulk carbohydrate and bulk amino acid analysis were directly frozen in liquid N2 and after lyophilization stored at -20 oC prior to analysis. Sediment samples for EPS carbohydrate extraction and EPS amino acid extraction were immediately transferred to the laboratory and within 30 minutes after sampling processed as described by de Brouwer and Stal (2001). Two operationally defined EPS fractions were distinguished: EPS MQ and EPS EDTA, and were analyzed for both carbohydrates and amino acids. Analytical procedures Carbon content and isotopic composition of TOC were analyzed by using an elemental analyzer/isotope ratio mass spectrometer (EA/IRMS)

5
LC/IRMS to trace carbon flow
115
(Boschker et al., 1999). Carbon content and isotopic composition of carbohydrates and amino acids in bulk sediment, EPS MQ and EPS EDTA fractions were analyzed by LC/IRMS (Boschker et al., 2008; McCullagh et al., 2006). For carbohydrates, freeze dried sediment (500 mg, for bulk analysis) and MQ and EDTA EPS extracts (4 mL) were hydrolyzed to monosaccharides under acidic conditions using a modified method according to Cowie and Hedges (1984). Instead of neutralizing the hydrolysates with barium carbonate, the samples were neutralized with strontium carbonate, which resulted in an increase yield of the extract. EDTA was removed from the EDTA EPS hydrolysate with an onGuard IIA cartridge (Dionex, Breda, the Netherlands) brought into the chloride form. After applying 1 mL of sample, the column was washed with 20 mL MQ. Both volumes were combined, freeze-dried and finally dissolved in 750 μL of MQ before injection into the LC/IRMS. For amino acids, freeze dried sediment (700 mg, for bulk analysis) and MQ and EDTA EPS extracts (4 mL) were hydrolyzed with 6 M HCl for 20 h at 110 oC and were purified by cation exchange chromatography (Veuger et al., 2005) before they were analyzed by LC/IRMS.
Liquid chromatography was carried out using a Surveyor liquid chromatograph connected to an LC Isolink interface and a Delta V Advantage IRMS (all from Thermo Fisher, Bremen, Germany). Isodat 3.0 software was used to control the LC/IRMS system. Samples were injected with an autosampler using partial loop injection. Carbohydrate concentrations and isotope ratios were analyzed by LC/IRMS equipped with a CarboPac PA20 column (Dionex, Breda, the Netherlands). The eluent was 1 mM sodium hydroxide at a flow rate of 0.3 mL min-1. The carbohydrate method has been described in detail by Boschker et al. (2008). Amino acid separation was done on a Primesep A column (4.6 mm × 250 mm, particle size 5 μm (SIELC technologies, Prospect Heights, IL, USA). Elution was by a linear gradient containing two mobile phases: MQ and 0.2 % sulfuric acid at a flow rate of 700 μL min-1. The amino acid method is described in detail by McCullagh et al. (2006).
Calculations The isotopic abundance of a sample was calculated relative to a reference. At the level of the natural abundance the variation in the isotopic ratio is so small that it is convenient to express the variation of isotopic ratio, the δ13C value, in per mill (‰). The practical advantage of using the δ13C (‰) notation instead of the 13C/12C ratio notation is that small variations of the digits after the decimal point are easier to handle.

Part 2 Chapter 5
116
The delta ‰ notation is defined as δ 13C sample (‰)= [(Rs / Rst) – 1] × 1000
,where Rs is the ratio of 13C/12C in the sample and Rst is the ratio of the international standard used (for carbon Rst = 0.0111802 ± 0.0000009). For metabolic studies it is more convenient to calculate the absolute amount of 13C incorporated into different carbon pools over the background. This value is expressed as excess 13C and is calculated from δ 13C sample as:
Excess 13C (mol 13C g-1 DW) =
( )( )
( )( ) sample
stbackground13
stbackground13
stsample13
stsample13
C1R11000/Cδ
R11000/Cδ
1R11000/Cδ
R11000/Cδ×
+×+
×+−
+×+
×+
where δ13Cbackground is the δ13C value of the unlabeled sample and
Csample is the pool size in mol of carbon per gram of dry weight sediment (mol C g-1 DW).

5
LC/IRMS to trace carbon flow
117
Results and Discussion
We successfully applied the available methods analyzing 13C in carbohydrates and amino acids to study carbon flows in microphytobenthic mats. The chromatograms demonstrated a satisfactory separation of CHO and AA in the bulk, MQ extractable EPS and EDTA extractable EPS (Fig. 5.3 A, B). Although peak areas of EPS MQ and EPS EDTA were low, they were sufficient to determine 13C labeling (Godin et al., 2005). Peak areas for bulk CHO and bulk AA were considerably higher. In general the Δδ values after 4 h of labeling were on average not higher than 500 ‰.
All carbohydrates were baseline separated except fucose, which elutes at the end of the slope of a large peak in the beginning of the chromatogram originating from mainly amino acids. In order to improve the baseline separation of fucose, the intensity of the AA peak can be decreased by cation exchange purification as described in the materials and methods section. Glucose, the isotopic most enriched carbohydrate in the bulk fraction, is a key component of intra- and extracellular polysaccharides produced by MPB. Glucose is also the most important component of the EPS MQ fraction in terms of content and production. The EPS EDTA fraction was more diverse in terms of both carbohydrate content and production (Table 5.1). These findings are in line with other published data (Bellinger et al., 2009; de Brouwer & Stal, 2001; Underwood & Paterson, 2003).
For amino acids, 8 of the 14 eluting components were baseline separated. Optionally up to 21 components could be baseline separated utilizing the chromatographic conditions described by Smith et al. (2009), but this would more than double the runtime to 4 hours. Proline was the most important component in the EPS MQ fraction both in terms of content and production. In the EPS EDTA fraction methionine dominated in terms of content followed by threonine, which dominated in terms of production.

Part 2 Chapter 5
118
Fig. 5.3. Examples of LC/IRMS chromatograms demonstrating the separation of extracellular carbohydrates (A) and amino acids (B) in the MQ extractable EPS fraction obtained from an enriched intertidal mudflat sediment. Label incorporation for each component is shown in excess 13C (nmol 13C g-1 DW) for samples taken 4 h after the label was sprayed on the sediment. Shown is the analysis of 6 different carbohydrates and 14 amino acids (i.e. alanine (ala), arginine (arg), asparic acid (asp), glycine (gly), histine (his), isoleucine (ile), leucine (leu), lysine (lys), phenylalanine (phe), proline (pro), serine (ser), tyrosine (tyr), valine (val), hydroxyproline (hyp)), *=unknown, RP=reference pulses.

5
LC/IRMS to trace carbon flow
119
EPS
MQ
EPS
ED
TA
Con
cent
ratio
nPr
oduc
tion
Con
cent
ratio
nPr
oduc
tion
nmol
C g
-1 D
Wsd
evnm
ol 1
3C
g-1
DW
sdev
nmol
C g
-1 D
Wsd
evnm
ol 1
3C
g-1
DW
sdev
CH
OFu
c20
133
1.4
0.8
375
621.
00.
2
Rha
212
431.
81.
932
362
0.5
0.1
Gal
310
613.
20.
245
667
3.2
2.1
Glc
1017
261
38.8
17.3
323
612.
80.
2
Xyl
131
271.
30.
015
626
0.4
0.2
Man
192
461.
40.
120
035
0.4
0.1
AA
Asp
2.2
0.6
0.01
0.00
ndnd
ndnd
Hyp
1.5
0.5
0.01
0.00
ndnd
ndnd
Ser
1.7
0.6
0.01
0.00
4.5
1.3
0.01
0.00
Gly
6.1
3.0
0.07
0.01
ndnd
ndnd
Pro
27.8
12.8
1.21
0.60
ndnd
ndnd
Thr
ndnd
ndnd
17.9
8.4
0.39
0.30
Ala
7.3
2.9
0.01
0.00
ndnd
ndnd
Val
9.3
3.5
0.05
0.01
13.2
5.0
0.15
0.10
Met
ndnd
ndnd
25.2
14.4
0.03
0.00
Ile8.
53.
70.
010.
0011
.43.
20.
030.
00
Leu
10.5
4.9
0.02
0.01
16.2
6.1
0.04
0.01
Tyr
13.1
6.5
0.30
0.06
ndnd
ndnd
Lys
16.4
8.2
0.02
0.00
ndnd
ndnd
His
10.0
4.2
0.01
0.00
4.9
2.3
0.01
0.00
Phe
10.2
4.1
0.04
0.02
ndnd
ndnd
Arg
13.2
9.3
0.05
0.02
12.5
3.5
0.10
0.03
Tab
le 5
.1.
Car
bohy
drat
e (C
HO
) an
d am
ino
acid
(A
A)
cont
ent a
nd p
rodu
ctio
n in
MQ
and
ED
TA
ext
ract
able
EP
S e
xtra
cted
fro
m
an i
nter
tidal
mar
ine
sedi
men
t af
ter
4h in
-situ
13C
lab
elin
g. L
C/I
RM
S d
ata
is g
iven
of
6 di
ffer
ent
carb
ohyd
rate
s (i.
e. f
ucos
e (f
uc),
rh
amno
se (
rha)
, gal
acto
se (
gal)
, glu
cose
(gl
c), x
ylos
e (x
yl),
and
man
nose
(m
an))
and
14
amin
o ac
ids
(i.e.
ala
nine
(al
a), a
rgin
ine
(arg
), a
spar
ic a
cid
(asp
), g
lyci
ne (
gly)
, his
tine
(hi
s), h
ydro
xypr
olin
e (h
yp),
iso
leuc
ine
(ile
), le
ucin
e (l
eu),
lysi
ne (
lys)
, met
hion
ine
(met
), p
heny
lala
nine
(ph
e), p
roli
ne (
pro)
, ser
ine
(ser
), th
reon
ine
(thr
), ty
rosi
ne (
tyr)
, val
ine
(val
)), n
d =
not
det
ecta
ble.

Part 2 Chapter 5
120
In order to reconstruct the fate of carbon, we analyzed
concentrations and 13C label incorporation in bulk sediment (TOC), bulk CHO and bulk AA (Fig. 5.4). CHO and AA explained only 9 % and 5 % of the TOC content, respectively. However, CHO were much more important for the carbon processing as they explained 42 % of the total carbon fixation. The absolute amount and incorporation of C in the different pools varied between the duplicate frames due to the spatial heterogeneity of MPB. However, the relative distribution between the different pools of carbohydrate was more or less equal.
Both EPS fractions consisted mainly of CHO, while AA were only present in low amounts (Fig. 5.5 A, B). More than 80 % of the EPS production could be explained by MQ extractable CHO and this fraction therefore presented the most important and dynamic pool within the EPS. AA were only produced in small quantities. These results show that production and turnover rates yield further insight into EPS dynamics and provide a broader view than concentrations alone.
In this study, label incorporation was measured 4 h after the label was sprayed on the sediment. It would be interesting to follow the label for a longer period of time providing kinetic information on label distribution in the various metabolic pools. Further study of lipid 13C biomarkers will lead to the unraveling of the transfer of carbon from MPB to the heterotrophic communities in intertidal mudflat sediments.
Previous studies found rapid transfer of carbon from MPB into the heterotrophic community (Evrard et al., 2008; Middelburg et al., 2000). Others found that EPS-derived carbohydrates were major intermediates in the transfer of carbon between the MPB and bacteria (Bellinger et al., 2009). The fate of organic matter in the benthic food web (including meio- and macro fauna) was studied by Evrard et al. (2012) and Oakes et al. (2012).

5
LC/IRMS to trace carbon flow
121
Fig. 5.4. Amount and production of bulk Total Organic Carbon (TOC), Carbohydrates (CHO) and amino acids (AA) in an intertidal marine sediment after 4 h in-situ 13C labeling incorporation. Amount is expressed in μmol C g-1 DW and production is expressed in nmol 13C g-1 dry weight (DW). Fig. 5.5. Carbohydrate (CHO) and amino acid (AA) content (A) and production (B) in MQ and EDTA extractable EPS extracted from an intertidal marine sediment after 4 h in-situ 13C labeling. Amount is expressed in μmol C g-1 DW, whereas production is given in nmol 13C g-1 dry weight (DW).

Part 2 Chapter 5
122
Concluding remarks In this study, we show that MQ extractable EPS is the major component produced by MPB and that it mainly consists of glucose with minor contributions from other carbohydrates and amino acids.
The introduction of LC/IRMS was a major step towards the unraveling of metabolic processes in the coupling of the transfer of carbon from the diatoms via EPS to heterotrophic bacteria. This innovation allows direct measurement of carbon isotopes in a wide range of low molecular weight compounds and macromolecules both for natural abundance and isotopic enrichment studies. The strength of this method lies in the straightforward analysis of compounds without the need for derivatisation. As LC/IRMS can be used to quantify the biosynthesis of metabolites and shows the direct distribution of the applied 13C tracer in various carbon pools it is also a valuable tool for biology in general.
A major innovation in LC/IRMS would be the capability of measuring nitrogen isotopes, which would open up new avenues to study the nitrogen cycle. The development of new stationary phases such as mixed mode phases and the emergent application of high temperature chromatography may also provide new opportunities (Godin et al., 2008). Improvements in the sensitivity and robustness of another mass spectrometry technique, LC/MS/MS, have opened new possibilities for studying macromolecules (Zhang et al., 2007). However, the precision of the LC/MS/MS technique for the determination of low levels of enrichments at or close to natural abundance is insufficient and this hampers its use in in-situ labeling studies,
Acknowledgements We thank the NIOZ analytical lab in Yerseke, especially Peter van Breugel, for the support and assistance in the laboratory, and three anonymous reviewers for their thorough evaluation of the paper.

Tracing carbon flow from microphytobenthos to major bacterial groups in an intertidal marine sediment by using an in-situ 13C pulse-chase method Published in Limnol. Oceanogr. 59(4), 2014, 1275-1287. Tetsuro Miyatake1, Tanja C. W. Moerdijk-Poortvliet1, Lucas J. Stal1,2 and Henricus T. S. Boschker1 1Royal Netherlands Institute for Sea Research (NIOZ), Yerseke, The Netherlands 2Department of Aquatic Microbiology, Institute for Biodiversity and Ecosystem Dynamics, University of Amsterdam, Amsterdam, The Netherlands
6 C
hapt
er
Part 2 Chapter 6
124
Abstract
Carbon flow from benthic diatoms to the heterotrophic bacterial community was traced in a marine intertidal sediment for five consecutive days. An in-situ pulse-chase experiment was done in which 13C-labeled bicarbonate was sprayed onto the sediment surface during low tide and 13C-label incorporation in major carbon pools, intermediate metabolites, and biomarkers were monitored. Phospholipid-derived fatty acid (PLFA) and ribosomal ribonucleic acid (rRNA) were used as biomarkers to identify the responsible members of the microbial community at class and family phylogenetic resolution. Diatoms were the predominant primary producers, and Gammaproteobacteria, Bacteroidetes, and Deltaproteobacteria (21 %, 8 %, and 7 % of 16S rRNA-derived clone library) were the major heterotrophic bacterial groups. Both 13C-PLFA and 13C-rRNA data suggest that there was a fast transfer of label from diatoms (60 nmol 13C g-1 dry weight (dry wt) to heterotrophic bacteria (7 nmol 13C g-1 dry wt) during the first 24 hours of the experiment, which was probably due to the exudation of low-molecular weight organic compounds by diatoms that could be directly utilized by heterotrophic bacteria. After this initial fast transfer of organic carbon, labeling of the heterotrophic bacteria proceeded at a slower rate to 13 nmol 13C g-1 dry wt on the third day of the experiment, which coincided with the degradation of carbohydrates in water-extractable extracellular polymeric substances (EPS) initially produced by the diatoms. Water-extractable EPS (primarily as glucose) was a major intermediate and its turnover explained 75 % of the total carbohydrate processing in the sediment. Labeling in the heterotrophic bacteria tracked labeling in the diatoms suggesting a closely coupled system. The heterotrophic bacterial groups benefited equally from the organic matter released by the diatoms suggesting limited specialization in this microbial food web.

6
Tracing carbon flow in a diatom mat
125
Introduction Marine intertidal areas are highly productive ecosystems, and microphytobenthos contributes importantly to the total primary production of estuaries and other shallow water coastal ecosystems (MacIntyre et al., 1996; Underwood & Kromkamp, 1999). Benthic diatoms are typically the dominant microphytobenthos in marine intertidal sediments from temperate regions (Underwood & Paterson, 2003), and they are known to exude large amounts of carbohydrates such as extracellular polymeric substances (EPS). Some, but not all, of the EPS is released as a consequence of the motility of the diatoms and their migration through the sediment. As a result of the EPS production, diatoms stabilize the sediment surface and avoid their resuspension in the water column (Paterson & Black, 1999). Hence, diatoms provide a major carbon source to the benthic food web which includes heterotrophic bacteria in marine intertidal sediments (Smith & Underwood, 1998; van Oevelen et al., 2006).
Diatoms exude different types of carbohydrates which vary in structure and composition depending on the environmental conditions and the nutrient status (Smith & Underwood, 2000; de Brouwer & Stal, 2001). Low-molecular-weight compounds released by diatoms can be directly utilized by the heterotrophic microbial community (Sundh, 1992), whereas high-molecular-weight compounds such as EPS first need to be hydrolyzed by extracellular enzymes produced by microorganisms (Fuchs et al., 1998; Hunter et al., 2006). The microbial community composition of intertidal sediments has been extensively studied (Rusch et al., 2003; Bühring et al., 2005; Hunter et al., 2006) as is the case for the EPS formation by benthic diatoms (Smith & Underwood, 1998; Haynes et al., 2007). However, there are only a limited number of studies that link in- situ carbon flow from diatoms directly to heterotrophic microbes and also identify in detail the responsible microorganisms (Taylor et al., 2013).
Middelburg et al. (2000) and Evrard et al. (2008) have reported rapid transfer of carbon from microphytobenthos to bacterial biomass by combining in-situ 13C pulse-chase labeling and phospholipid-derived fatty acid (PLFA) biomarker analysis in order to differentiate between labeling in algae and heterotrophic bacteria. Previous studies suggested that EPS-derived carbohydrates were major intermediates in the transfer of organic matter between benthic diatoms and heterotrophic bacteria (Bellinger et al., 2009; Oakes et al., 2010; Taylor et al., 2013). Although it is possible to estimate the biomass based on the abundance of distinctive PLFAs (Middelburg et al., 2000), the phylogenetic resolution of these biomarkers

Part 2 Chapter 6
126
is limited and the bacteria utilizing the organic matter produced by the benthic diatoms cannot be identified to sufficient detail (Boschker & Middelburg, 2002). In general, 16S ribosomal ribonucleic acid (rRNA) provides a much higher phylogenetic resolution than is possible with PLFA, and it is widely used to identify microbial communities in natural environments. MacGregor et al. (2002) developed a method where 16S rRNA from defined phylogenetic groups was isolated by using specific oligonucleotide probes attached to paramagnetic beads for subsequent stable isotope analysis. Miyatake et al. (2009; 2013) further improved the stable isotope probing with magnetic bead capture hybridization (Mag-SIP) and demonstrated the utilization of organic substrates in marine sediments by certain microbial groups at the family level.
The in-situ 13C pulse-chase method was used to trace the carbon flow in an intertidal benthic diatom mat for five days. In-situ stable-isotope labeling approaches have the advantage over laboratory based incubations that environmental conditions such as waves, tidal currents, sediment mixing, and pore water flow are not disturbed (Middelburg et al., 2000). However, the inevitable loss of label that occurs in an open system could complicate quantitative interpretation of the data. We used 16S rRNA (Mag-SIP) and PLFA biomarkers for the identification of the major active microbial groups involved in the carbon transfer and to quantify their 13C-label incorporation rates. Furthermore, we used liquid chromatography combined with isotope ratio mass spectrometry (LC/IRMS) to trace 13C in intermediate metabolites such as the total carbohydrates in the sediment (bulk carbohydrates), water- and ethylenediamine-tetra-acetate (EDTA)-extractable carbohydrates, and short-chain organic acids (SCOA) including volatile fatty acids. Although other extraction schemes for carbohydrate exist (Underwood et al., 1995), we studied bulk carbohydrates as well as water- and EDTA-extractable carbohydrates, which are two fractions that are commonly used to characterize loosely- and stronger-bound extracellular carbohydrates, respectively, in benthic diatom mats (Underwood et al., 1995; de Brouwer & Stal, 2001). A clone library derived from reverse-transcribed 16S rRNA was also constructed in order to determine the metabolically active microorganisms and relate this to the specific oligonucleotide probe set used in the Mag-SIP protocol.
In the present study, we followed the carbon flow through intermediates produced by the diatoms and identify water-extractable carbohydrates as a major intermediate. We also show that all members of the heterotrophic bacterial community that we took into account in our analyses appeared to be equally involved in the assimilation of organic

6
Tracing carbon flow in a diatom mat
127
matter produced by the diatoms suggesting little specialization at the taxonomic level of this study.

Part 2 Chapter 6
128
Methods Study site, in-situ 13C labeling, and sampling From 14 to 19 April 2009, an in-situ 13C-labeling experiment was performed at an intertidal flat in the Zandkreek area (51°33'N, 3°53'E) of the Oosterschelde bay (The Netherlands). The sampling site was located 0.15 m below the mean tidal level, and the exposed period was ~6 h per tidal cycle (Fig. 6.1A). The sediment contained 6.8 % silt (<63 µm particle size) and was covered by a diatom mat. Salinity and water temperature were 28.5 and 15 °C, respectively, and were constant during the experimental period. The weather was mostly sunny with high light levels (photon irradiance up to 1500 μmol m-2 s-1; Fig. 6.1A) and an average mean air temperature of 16.2 °C. Almost no rainfall occurred during the experimental period except for some minor drizzle on the third day.
During the first day of the experiment, shortly after the exposure of the site at low tide, two 50 × 50 cm stainless frames were inserted into the sediment to a depth of 8 cm in order to constrain the labeling and sampling area (the top rim of the frames was flush with the sediment surface). Initially, unlabeled control sediment and pore water (n = 2) were taken from just outside the frames as described below. The in-situ labeling experiment was started by spraying the surface of the sediment within each frame with 250 mL of [13C] sodium bicarbonate (99 % 13C; Cambridge Isotope Laboratories). The label solution was at the ambient salinity and contained 1 g L-1 of [13C] sodium bicarbonate (equaled to 1 g [13C] sodium bicarbonate m-2; Middelburg et al., 2000). The frames were divided in a 10 × 10 cm sampling grid. The first sampling of the labeled sediment was performed after 4 h at the end of the same exposed period (the pulse-labeling period), and the two frames were sampled in a time-course of 12 h, 1 day, 2 days, 3 days, and 5 days (the chase period).
The two frames were treated as duplicates (n = 2). At each sampling time, pore water and sediment samples were collected and mixed from two randomly chosen positions within the sampling grid of each frame. Pore water (two times 1 mL) was sampled with porous polymer sippers (Rhizon Soil Moisture Sampler; Eijkelkamp Agrisearch Equipment) inserted into the upper 1.5 cm of the sediment. For 13C-DIC analysis, 1 mL of mixed pore water sample per frame was dispensed into air-tight headspace vials. The remainder of the pore water sample was used for 13C-SCOA analysis. Subsequently, sediment was sampled by inserting a corer (inside diameter 10 cm) to a depth of 5 cm, and the top 1.5 cm of the sediment was collected. The sampling hole was filled with

6
Tracing carbon flow in a diatom mat
129
unlabeled sediment collected just outside the sampling frames and the corer was removed. The two sediment samples taken from each frame were homogenized, and divided in the field into 8 samples of 20-25 g wet weight (wet wt) each for Mag-SIP analysis, one 45 g wet wt sample for the measurement of total organic carbon (TOC), PLFA and bulk carbohydrates, and a 5 g wet wt sample for pigment analysis. Additionally, approximately 2 g wet wt of the homogenized sediment was directly processed for water-extractable carbohydrates by adding it to 4.5 mL Milli-Q water as described in De Brouwer and Stal (2001). The samples were immediately transferred on ice to the laboratory. In the laboratory, samples for water-extractable carbohydrates were shaken for 1 h at 30 °C and the supernatant was collected after centrifugation at 4000 ×g for 15 min and stored for carbohydrate analysis. The sediment pellet was re-extracted with 4.5 mL of 0.1 mol L-1 EDTA by shaking for 4 h at room temperature. The supernatant was collected after centrifugation at 4000 ×g for 15 min, and stored for EDTA-extractable carbohydrate analysis. Sediment samples for Mag-SIP and pigment analysis were stored at -80 °C while the other samples were stored at -20 °C.
To study dark fixation by chemoautotrophic and heterotrophic bacteria, two cores (7 cm internal diameter) were taken outside the frames and incubated in the dark for 4 hours with the same amount of 13C-label (per m2) added to the top of the sediment as in the field. The top 1.5 cm of these cores was sampled and analyzed for PLFA labeling.

Part 2 Chapter 6
130
Fig. 6.1. (A) Light irradiance during the experiment period. Shaded part is indicating submerged period of the sampling site. Sampling times are indicated by arrows. Average values of excess 13C in (B) DIC and (C) TOC are shown as a function of time (n = 2). Error bars show the range in the duplicate data.

6
Tracing carbon flow in a diatom mat
131
Analytical procedures Sediment samples for PLFA, TOC, pigment, and bulk carbohydrate analysis were freeze-dried. Lipids were extracted from 3 g of freeze-dried sediment using a modified Bligh and Dyer extraction (Boschker et al., 1999) from which the PLFA fraction was separated on a silica column. The PLFA fraction was converted to fatty-acid methyl esters and the carbon content and isotopic composition of these derivatives were measured by gas chromatography–combustion-isotope ratio mass spectrometry (Middelburg et al., 2000). The carbon content and isotopic composition of TOC was analyzed by using an elemental analyzer/isotope ratio mass spectrometer (EA/IRMS) after the removal of carbonate with hydrochloric acid (Boschker et al., 1999). For DIC analysis, pore water samples were acidified by adding 0.1 mL of 19 mol L-1 phosphoric acid (Miyajima et al., 1995), and headspace gas was injected into EA/IRMS in order to determine the concentration and isotopic composition of DIC. Pigments were extracted from freeze-dried sediment with acetone (90 %, buffered with 5 % ammonium acetate), and analyzed by reverse-phase HPLC (Dijkman & Kromkamp, 2006).
Carbon content and isotopic composition of SCOA were analyzed by LC/IRMS (Isolink interface and DELTA V Advantage IRMS; Thermo Fisher Scientific) equipped with an Aminex HPX-87H cation-exchange column (Bio-Rad). The eluent was 8 mmol L-1 sulfuric acid at a flow rate of 0.4 mL min-1 (Krumbock & Conrad, 1991).
The monosaccharide composition of bulk, water-extractable, and EDTA-extractable carbohydrates was determined by LC/IRMS (Boschker et al., 2008). Freeze-dried sediment and carbohydrate extracts were hydrolyzed with 1.1 mol L-1 sulfuric acid for 1 h at 120 °C. The hydrolyzed carbohydrates were neutralized with strontium carbonate, and the precipitate was removed by centrifugation. Carbohydrate concentrations and isotope ratios were measured by LC/IRMS (see above) equipped with a Carbopac PA20 (Dionex Benelux). The eluent was 1 mmol L-1 sodium hydroxide at a flow rate of 0.3 mL min-1.
Concentration or 13C-labeling of compounds above was expressed as mole of carbon per gram of dry weight sediment (C or 13C g-1 dry wt) in order to directly compare the size of each pool and to trace label transfer. Water content of the sediment was constant through the experiment at 0.32 ± 0.02 g per gram of sediment wet weight.

Part 2 Chapter 6
132
Mag-SIP analysis and clone library construction A nested set of oligonucleotide probes was used for the Mag-SIP
protocol (Table 6.1; Miyatake et al., 2013). The probes EUB338 (Amann et al., 1990) and DELTA495a (Loy et al., 2002) were used for most Bacteria and Deltaproteobacteria, respectively, even though they do not target all genera in these domains. The DELTA495a probe was used in combination with a competitor probe, cDELTA495a (Macalady et al., 2006), to avoid capture of Gammaproteobacteria, which have only one different base in the target region of DELTA495a. The family Desulfobacteraceae was covered with the probe Dbact653 (Miyatake et al., 2009) and the probe BG553 was used for Gammaproteobacteria (Miyatake et al., 2013). Both the Dbact653 and BG553 probes were used in combination with unlabeled helper probes complementary to the consensus sequence upstream and downstream of the probe target in order to increase yield (Fuchs et al., 2000; MacGregor et al., 2002). The probe CYA361 (Schönhuber et al., 1999) was used for Cyanobacteria and chloroplasts.
Hybridization of 16S rRNA with oligonucleotide probes and the isotope analysis of captured 16S rRNA were done as described in Miyatake et al., (2009). In short, total RNA was extracted from the sediment with the chloroform-phenol method and 20-40 µg total RNA was hybridized with biotin-labeled probes. The 16S rRNA-probe hybrids were captured with streptavidin-coated hydrophobic paramagnetic beads (Dynabeads MyOne Streptavidin T1; Invitrogen). Captured 16S rRNA was released from the beads by heat, and approximately 500 ng of this rRNA was used for stable isotope measurement by using flow injection analysis (FIA: Isolink interface with DELTA V Advantage IRMS; Thermo Fisher Scientific). Samples (in 50 µL) were directly injected into this FIA/IRMS operating in bulk injection mode. The carbon blank was also determined by performing the Mag-SIP protocol but without the RNA extract.
In order to identify active members of the microbial community and determine the specificity of the oligonucleotide probes used in the Mag-SIP protocol, clone libraries derived from total RNA and captured 16S rRNA were constructed. The total RNA extracted from the sediment with the chloroform-phenol method (0 h sample) and captured 16S rRNA were reverse transcribed with reverse primer DXR518 (Nogales et al., 1999). The reverse transcripts were amplified by PCR using primers 27F-DXR518 (Martinez et al., 2006; Mills et al., 2005). The PCR products were ligated into pGEM T-easy vector (Promega) and transformed into Escherichia coli JM109 competent cells following the manufacturer’s

6
Tracing carbon flow in a diatom mat
133
%
FA*
EUB338 GCT GCC TCC CGT AGG AGT 25 most BacteriaAmann et al. , 1990
most Deltaproteobacteria andmost Gemmatimonadetes
cDELTA495a AGT TAG CCG GTG CTT CTT 45 mompetitor of DELTA495aMacalady
et al. , 2006
Dbact653 TTC CCT CTC CCA TAC TCA 25 most Desulfobacteraceae Miyatake et al. , 2009
Dbact653_up_help CCC CGG AAG TGC AYT TGA WAC 25 helper probe for Dbact653Miyatake et
al. , 2009
Dbact653_down_help GTG GAA TTC CTG GTG TAG AGG 25 helper probe for Dbact653Miyatake et
al. , 2009
most Cyanobacteria andmany chloroplast
most Betaproteobacteria andGammaproteobacteria
BG553_up_help AAC CGC CTR CGN RCG CTT TA 60 helper probe for BG553Miyatake et
al. , 2013
BG553_down_help AAC GCT YGC ACC CTM CTG ATT 60 helper probe for BG553Miyatake et
al. , 2013*Percent formamide (FA) in hybridization buffer for hybridizations at 20°C
Probe Sequence (5'-3') Specificity Reference
DELTA495a AGT TAG CCG GTG CTT CCT 45Loy et al. ,
2002
CYA361 CCC ATT GCG GAA AAT TCC 20Schönhuber et al. , 1999
BG553 CGC CCA GTA ATT CCG ATT 60Miyatake et
al. , 2013
instructions. Positive clones were re-amplified with M13 primers, and sequenced with the 27F primer on an ABI PRISM 3130 Genetic Analyzer (Applied Biosystems). Sequence chromatographs were manually checked using the Chromas Lite software (http://www.technelysium.com.au/chromas_lite.html). Phylogenetic analysis was performed by using the fast aligner and treeing tools implemented in the ARB program package (Ludwig et al., 2004). Phylogenetic relationships were determined by inserting sequences from this study into an ARB tree composed of the Greengenes database (http://greengenes.lbl.gov/) to which additional Deltaproteobacteria clone sequences from marine environments had been added. Nucleotide sequences obtained in this study have been deposited in GenBank under accession numbers GU215079-GU215169. Table 6.1. 16S rRNA-targeted oligonucleotide probes used in this study.
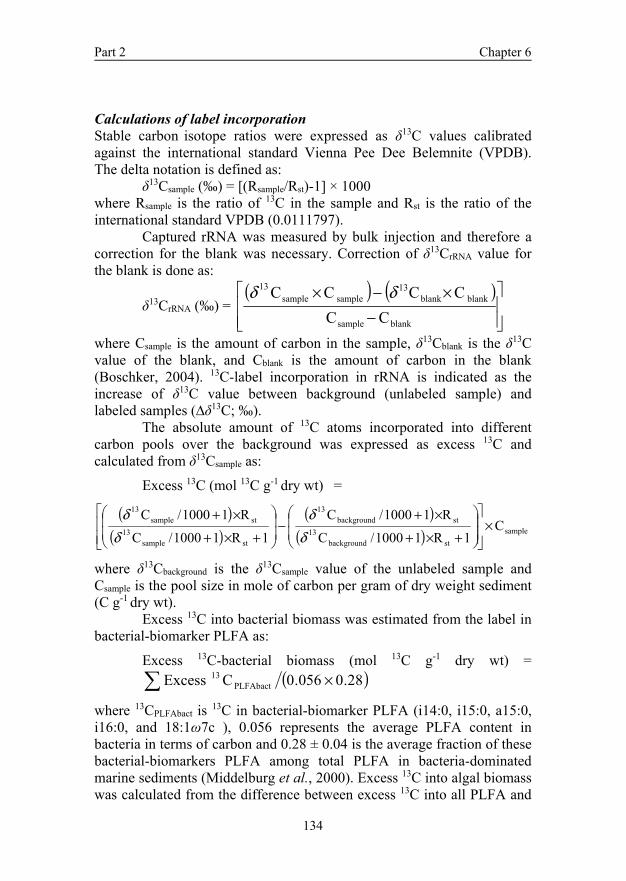
Part 2 Chapter 6
134
Calculations of label incorporation Stable carbon isotope ratios were expressed as δ13C values calibrated against the international standard Vienna Pee Dee Belemnite (VPDB). The delta notation is defined as: δ13Csample (‰) = [(Rsample/Rst)-1] × 1000 where Rsample is the ratio of 13C in the sample and Rst is the ratio of the international standard VPDB (0.0111797).
Captured rRNA was measured by bulk injection and therefore a correction for the blank was necessary. Correction of δ13CrRNA value for the blank is done as:
δ13CrRNA (‰) = ( ) )(
−×−×
blanksample
blankblank13
samplesample13
CC
CCCC δδ
where Csample is the amount of carbon in the sample, δ13Cblank is the δ13C value of the blank, and Cblank is the amount of carbon in the blank (Boschker, 2004). 13C-label incorporation in rRNA is indicated as the increase of δ13C value between background (unlabeled sample) and labeled samples (∆δ13C; ‰).
The absolute amount of 13C atoms incorporated into different carbon pools over the background was expressed as excess 13C and calculated from δ13Csample as:
Excess 13C (mol 13C g-1 dry wt) =
( )( )
( )( ) sample
stbackground13
stbackground13
stsample13
stsample13
C1R11000/C
R11000/C
1R11000/C
R11000/C×
+×+
×+−
+×+
×+
δδ
δδ
where δ13Cbackground is the δ13Csample value of the unlabeled sample and Csample is the pool size in mole of carbon per gram of dry weight sediment (C g-1 dry wt).
Excess 13C into bacterial biomass was estimated from the label in bacterial-biomarker PLFA as:
Excess 13C-bacterial biomass (mol 13C g-1 dry wt) =( ) × 28.0056.0CExcess PLFAbact
13
where 13CPLFAbact is 13C in bacterial-biomarker PLFA (i14:0, i15:0, a15:0, i16:0, and 18:1ω7c ), 0.056 represents the average PLFA content in bacteria in terms of carbon and 0.28 ± 0.04 is the average fraction of these bacterial-biomarkers PLFA among total PLFA in bacteria-dominated marine sediments (Middelburg et al., 2000). Excess 13C into algal biomass was calculated from the difference between excess 13C into all PLFA and

6
Tracing carbon flow in a diatom mat
135
excess 13C into bacterial-biomarker PLFA and also corrected for the typical PLFA content of diatoms:
Excess 13C-algal biomass (mol 13C g-1 dry wt) = ( ) 0.035CExcessCExcess PLFAbact
13PLFAall
13 −
where 13CPLFAall is 13C in all individual PLFA measured in this study and 0.035 represents the average PLFA content of diatoms (Middelburg et al., 2000). Algal and bacterial biomass was calculated as above in terms of carbon per gram of dry weight sediment using the biomarker PLFA concentrations instead of excess 13C.

Part 2 Chapter 6
136
Results Incorporation of 13C in major carbon pools and intermediate metabolites Concentrations of DIC and TOC in the sediment were 1.2 ± 0.1µmol C g-1 dry wt and 309 ± 20 µmol C g-1 dry wt, respectively, throughout the experimental period. Label recovered in the DIC after 4 h (25 nmol 13C g-1 dry wt, Fig. 6.1B) was already substantially lower than expected from the total amount of DIC-label that was initially added (600 nmol 13C g-1 dry wt), which was the result of photosynthesis by diatoms and probably also exchange with the atmosphere in this open system. DIC 13C-labeling further decreased sharply during the first day of the experiment followed by more gradual decrease until the end of the experiment when almost no 13C label remained (Fig. 6.1B). Label incorporation in TOC increased sharply during the first low tide and remained approximately constant at 200 nmol 13C g-1 dry wt during the first 3 days of the experiment, except for a small peak after 12 h. Finally, the label in TOC decreased to 120 nmol 13C g-1 dry wt on day 5 (Fig. 6.1C). These data suggest a rapid incorporation of the 13C-DIC label by the benthic primary producers during the pulse-labeling period followed by minimal losses for the remainder of the experiment until day 5.
The bulk carbohydrates content was 27.1 ± 1.7 µmol C g-1 dry wt throughout the experimental period and showed little variation (Fig. 6.2A). Glucose and galactose were the two major components and their contributions remained constant (approximately 30 % and 15 %, respectively). Water-extractable carbohydrates accounted for approximately 10 % of the bulk carbohydrates and varied substantially during the experiment (Fig. 6.2B). The concentration of water-extractable carbohydrates was lower for the 12 h and day 3 samplings. The concentration of EDTA-extractable carbohydrates was approximately 2-3 times lower than the water-extractable carbohydrates and remained approximately constant during the experiment except on the day 3 when values decreased by a factor of 2 to 3 (Fig. 6.2C). Glucose was the main carbohydrate in both the water-extractable EPS and EDTA-extractable fractions explaining between 30 - 70 % of the total carbohydrates.
The limited turnover of the 13C-label in the TOC pool during the experimental period was not seen in the bulk and water-extractable carbohydrates. Excess 13C in bulk, water-extractable, and EDTA-extractable carbohydrates were highest between 4 and 12 h after labeling and decreased with time (Fig. 6.2D-F). More than 90 % of 13C labeling was recovered in glucose in the three analyzed pools. Initially, 13C content in the water-extractable carbohydrates explained about half of the 13C

6
Tracing carbon flow in a diatom mat
137
label of the bulk carbohydrates. Labeling of the EDTA-extractable carbohydrates was substantially lower (one order of magnitude) than of the water-extractable carbohydrates. The label decreased faster in the water-extractable carbohydrates than in the bulk and EDTA-extractable carbohydrates, and had almost disappeared at the end of the experiment. Label incorporation in carbohydrates other than glucose was much lower and remained more-or-less constant. Hence, the decrease in 13C-label incorporation in bulk carbohydrates between 4 h and day 5 was mainly due (by about 75 %) to the decrease of 13C-label in glucose from water-extractable carbohydrates and to a much lesser extend by the EDTA-extractable carbohydrates.
SCOA in the pore water were the most dynamic pool of metabolites analyzed during this experiment. SCOA detected in this study were formate, acetate, oxalate, malate, lactate, and succinate. Lactate and succinate could not be separated sufficiently by our HPLC protocol and are therefore reported together. The propionate peak overlapped with an unknown peak. Significant changes in the concentrations of lactate+succinate and acetate were observed. Other SCOA detected in this study had low and constant concentrations during the experiment (20-30 nmol C g-1 dry wt) and showed limited labeling; hence only lactate+succinate and acetate are depicted in figure 6.3. Concentrations of lactate+succinate and acetate were similar at the start of the experiment but lactate+succinate was higher than acetate after addition of the tracer and increased again on day 3. The concentration of acetate was highest at 0 h followed by sharp decrease at 4 h, then gradually increased to day 5. Porewater concentrations of acetate (range 100 to 1200 nmol C mL-1) and lactate+succinate (range 750 to 2300 nmol C mL-1) were high. 13C-label incorporation was only detected for lactate+succinate and acetate, and was higher in lactate+succinate than in acetate (Fig. 6.3B). Excess 13C in lactate+succinate and acetate was highest at 4 h then significantly decreased at 12 h followed by gradual increase before diminishing at day 5.

Part 2 Chapter 6
138
Fig. 6.2. Monosaccharide composition and concentrations of (A) bulk, (B) water-extractable, and (C) EDTA-extractable carbohydrates are shown together with excess 13C in (D) bulk, (E) water-extractable, and (F) EDTA-extractable carbohydrates. Average values (n = 2) are shown for individual carbohydrate data and error bars indicate the range in the summed data.

6
Tracing carbon flow in a diatom mat
139
Fig. 6.3. (A) Average concentration and (B) excess 13C of short-chain organic acids (SCOA: lactate+succinate and acetate) in the pore water (n = 2). Error bars show the range in the duplicate data.

Part 2 Chapter 6
140
Microbial community composition Throughout the 5 days of the experiment, the sediment was covered by a diatom mat. Chlorophyll a content was 17.2 ± 0.9 µg g-1 dry wt, and the content of fucoxanthin, a marker for diatoms (Dijkman & Kromkamp, 2006; Wright & Jeffrey, 1987), was 6.1 ± 0.3 µg g-1 dry wt throughout the experiment, indicating a high proportion of diatom biomass. The 16S rRNA clone library derived from total RNA reflects the metabolically active community and confirmed the dominance of benthic diatoms (44 % of the sequences belonged to chloroplasts of benthic diatoms) whereas cyanobacterial clones were fewer (6 %; Fig. 6.4). Moreover, the content of specific biomarkers PLFA for diatoms was much higher (86.5 ± 9.3 and 495.5 ± 110.4 nmol C g-1 dry wt for 16 PUFA and 20:5ω3, respectively) than for Cyanobacteria (51.8 ± 10.1 and 30.9 ± 5.5 nmol C g-1 dry wt for 18 PUFA and 18:2ω6c, respectively), and hence, Cyanobacteria contributed much less to the microphytobenthic biomass than diatoms (Fig. 6.5). The 16S rRNA clone library showed that Gammaproteobacteria (21 % of the sequences), Bacteroidetes (8 %), and Deltaproteobacteria (7 %) were the major groups in the bacterial community in addition to the Cyanobacteria (Fig. 6.4). EUB338 was used as a general bacterial probe in this study and it covered most of the Bacteria detected in the clone library and only missed the Planctomycetes. The combination of the other specific probes covered 77 % of the 16S rRNA targeted by the EUB338 probe but did not include the Bacteroidetes. The specificity of each oligonucleotide probe used with Mag-SIP was more than 90 %.

6
Tracing carbon flow in a diatom mat
141
Fig. 6.4. Proportion of clones affiliated with major phylogenetic groups in the clone library derived from reversed-transcribed 16S rRNA. Total numbers of clones sequenced are indicated as n.
Fig. 6.5. Average concentration of individual PLFA in unlabeled sediment (0 h, n = 2). Error bars indicate the range in the duplicate data.
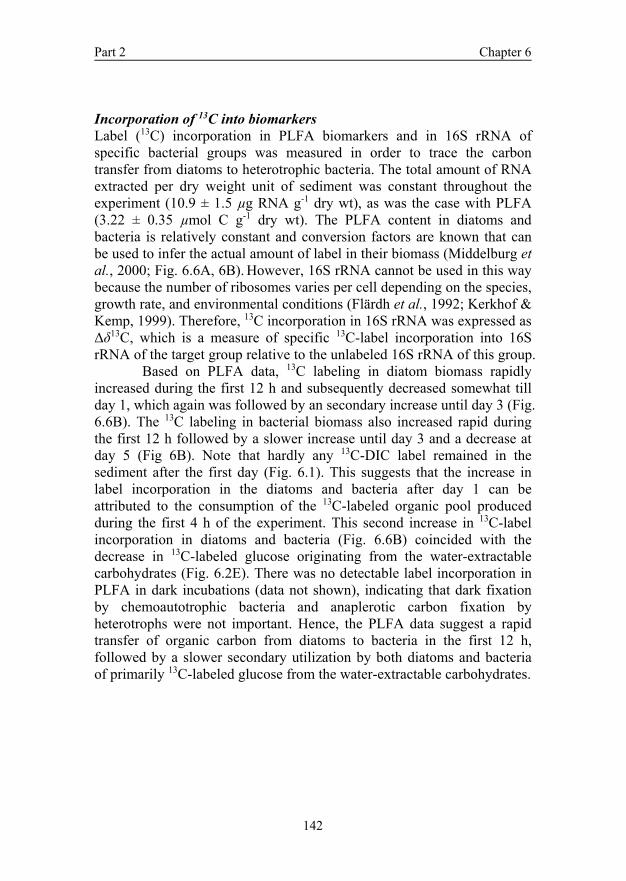
Part 2 Chapter 6
142
Incorporation of 13C into biomarkers Label (13C) incorporation in PLFA biomarkers and in 16S rRNA of specific bacterial groups was measured in order to trace the carbon transfer from diatoms to heterotrophic bacteria. The total amount of RNA extracted per dry weight unit of sediment was constant throughout the experiment (10.9 ± 1.5 µg RNA g-1 dry wt), as was the case with PLFA (3.22 ± 0.35 µmol C g-1 dry wt). The PLFA content in diatoms and bacteria is relatively constant and conversion factors are known that can be used to infer the actual amount of label in their biomass (Middelburg et al., 2000; Fig. 6.6A, 6B). However, 16S rRNA cannot be used in this way because the number of ribosomes varies per cell depending on the species, growth rate, and environmental conditions (Flärdh et al., 1992; Kerkhof & Kemp, 1999). Therefore, 13C incorporation in 16S rRNA was expressed as Δδ13C, which is a measure of specific 13C-label incorporation into 16S rRNA of the target group relative to the unlabeled 16S rRNA of this group.
Based on PLFA data, 13C labeling in diatom biomass rapidly increased during the first 12 h and subsequently decreased somewhat till day 1, which again was followed by an secondary increase until day 3 (Fig. 6.6B). The 13C labeling in bacterial biomass also increased rapid during the first 12 h followed by a slower increase until day 3 and a decrease at day 5 (Fig 6B). Note that hardly any 13C-DIC label remained in the sediment after the first day (Fig. 6.1). This suggests that the increase in label incorporation in the diatoms and bacteria after day 1 can be attributed to the consumption of the 13C-labeled organic pool produced during the first 4 h of the experiment. This second increase in 13C-label incorporation in diatoms and bacteria (Fig. 6.6B) coincided with the decrease in 13C-labeled glucose originating from the water-extractable carbohydrates (Fig. 6.2E). There was no detectable label incorporation in PLFA in dark incubations (data not shown), indicating that dark fixation by chemoautotrophic bacteria and anaplerotic carbon fixation by heterotrophs were not important. Hence, the PLFA data suggest a rapid transfer of organic carbon from diatoms to bacteria in the first 12 h, followed by a slower secondary utilization by both diatoms and bacteria of primarily 13C-labeled glucose from the water-extractable carbohydrates.

6
Tracing carbon flow in a diatom mat
143
Fig. 6.6. (A) Average concentration of biomass carbon and (B) excess 13C in diatoms and in bacteria calculated from concentrations of biomarker PLFA and 13C-label incorporated into PLFA, respectively (n = 2). The bacterial-biomarker PLFA used are i14:0, i15:0, a15:0, i16:0, and 18:1ω7c. Biomass carbon and 13C-label incorporation of diatoms were calculated from the difference between total PLFA and bacterial PLFA. Error bars show the range in the duplicate data.
Label incorporation in 16S rRNA that was captured with group-specific oligonucleotide probes also showed two maxima, the first on day 1 and the second on day 3 (Fig. 6.7A). Unlabeled controls of 16S rRNA possessed δ13C values between -15 ‰ and -20 ‰, which is within the typical range for marine benthic diatoms and bacteria (Coffin et al., 1990; Boschker & Middelburg, 2002). The Δδ13C value of diatom and Cyanobacteria 16S rRNA represents primarily the label incorporation by diatoms because the Cyanobacteria biomass was low. Remarkably, Δδ13C

Part 2 Chapter 6
144
ratios of all captured 16S rRNA fractions were similar and showed the same trend during the experiment. For instance, the difference in the Δδ13C pattern of the total bacteria (EUB338-captured 16S rRNA) and of the family Desulfobacteraceae (Dbact653-captured 16S rRNA), which comprised only 3 % of the clone library, was small. Only Deltaproteobacteria 16S rRNA showed a delay in accumulating label during the second part of the experiment. On day 3 the label in Deltaproteobacteria 16S rRNA was less than in the other captured 16S rRNAs and reached a maximum only on day 5 at the end of the experiment.
In order to compare the label incorporation in 16S rRNA and PLFA, the Δδ13C values of several representative biomarker PLFAs for microphytobenthos (16 PUFA, 18 PUFA, 18:2ω6c, and 20:5ω3) and biomarker PLFAs for heterotrophic bacteria (i14:0, i15:0, a15:0, i16:0, and 18:1ω7c) are depicted in figure 6.7B, C. Biomarker PLFA Δδ13C values for diatoms (16 PUFA and 20:5ω3) and Cyanobacteria (18 PUFA and 18:2ω6c) showed different trends (Fig. 6.7B). Labeling in biomarker PLFA for Cyanobacteria initially increased sharply followed by a gradual decrease until the end of the experiment. In contrast, diatom biomarker PLFA labeling showed a fast increase until 12 hours followed by a more gradual increase until day 3 and then decreased slightly. Although Δδ13C values of biomarker PLFA for Cyanobacteria were higher than for diatoms, excess 13C in diatom PLFA was much higher because diatoms were the dominant primary producers at the study site. Representative biomarker PLFA for bacteria showed similar labeling patterns as biomarker PLFA for diatoms (16 PUFA and 20:5ω3) with a fast increase during the first day of the experiment followed by a slower labeling until a maximum on day 3 (Fig. 6.7C). Furthermore, the highest Δδ13C values in the different captured 16S rRNA and biomarker PLFAs were at a similar range (50-100 ‰) except for cyanobacterial biomarker PLFAs which was, however, only a minor part of the microbial community. To summarize, the combined results of the biomarker labeling suggest that carbon fixed by diatoms was rapidly and evenly utilized by the heterotrophic bacterial community.

6
Tracing carbon flow in a diatom mat
145
Fig. 6.7. Δδ13C values of (A) rRNA captured with the nested set of oligonucleotide probes used in the Mag-SIP method, (B) representative biomarker PLFA for microphytobenthos (diatoms; 16 PUFA and 20:5ω3: Cyanobacteria; 18 PUFA and 18:2ω6c), and (C) representative biomarker PLFA for heterotrophic bacteria. Only average values are shown (n = 2). Error bars are not included for clarity; however differences between duplicates were generally low and maximum 31 % and 34 % of mean for 16S rRNA and PLFA, respectively.

Part 2 Chapter 6
146
Discussion
In this study, the transfer of carbon from benthic diatoms to the heterotrophic bacterial community was traced by following the 13C-labeling dynamics in different biologically derived compounds and major groups within the microbial community. We demonstrated that Mag-SIP can be used to trace carbon flow in a benthic diatom mat and we measured the 13C-label incorporation in heterotrophic bacteria that were identified to the family level. Other in-situ 13C-labeling studies used PLFA (Middelburg et al., 2000; Evrard et al., 2008; Oakes et al., 2012) and D-alanine (Veuger et al., 2006) as biomarkers, but these have a phylogenetic resolution that does not exceed the level of domains or kingdoms. In addition, we also measured 13C-labeling in bulk, water-extractable, and EDTA-extractable carbohydrates as well as SCOA in pore water using recently developed LC/IRMS methods to determine which intermediates were important in the transfer of organic matter from diatoms to heterotrophic bacteria. Although the relationship between diatom carbohydrates exudates and the heterotrophic bacterial community have been studied in intertidal sediments (Hanlon et al., 2006; Haynes et al., 2007; Bellinger et al., 2009; Oakes et al., 2012; Taylor et al., 2013), we included SCOA as important intermediates in the anaerobic degradation of diatom material (McKew et al., 2013). The results were used to construct a conceptual model of the transfer of carbon in the diatom mat (Fig. 6.8A) and are summarized in a 13C-budget (Fig. 6.8B). We propose two main events during which organic carbon was transferred from benthic diatoms to heterotrophic bacteria, which operated on different time scales.

6
Tracing carbon flow in a diatom mat
147
Water-extractable EPS carbohydrates (glucose)
Low-molecular-weightexudates
DIC Diatoms BacteriaSCOA0-12 h
0-12 h
0-12 h
1-3 d
0-1 d0-1 d
1-3 d
0-1 d
1-3 d
1-3 d
A
B
Time (h)
0 20 40 60 80 100 120 140
Exc
ess
13C
(nm
ol 13
C g
-1 d
ry w
t)
0
100
200
300
Diatom
Bacteria
wEPS
EDTA-EPS
SCOA
Not explained
Fig. 6.8. (A) Conceptual model of carbon flow in the diatom mat based on 13C-labeling data. Organisms are indicated by oval boxes and substances by square boxes. Solid arrows indicate the short-term carbon flow and dotted arrows indicate long-term carbon flow. Numbers correspond to the time after labeling. SCOA stands for short-chain organic acids. (B) 13C-budget at the different sampling points of the experiment. ‘Not explained’ is the fraction of the 13C TOC labeling not explained by the sum of the labeling in the individual pools. Average data of the individual pools are shown (n = 2), and error bars indicate the range in the summed data.
The 13C-label incorporation in PLFA and 16S rRNA biomarkers suggested that there was a fast transfer of organic substrates from diatoms to heterotrophic bacteria already during the first day of the experiment (Figs. 6.6, 6.7, 6.8B). This initial fast transfer was probably the result of the utilization of low-molecular-weight (˂ 800 Da) organic compounds exuded by diatoms that could be directly utilized by heterotrophic bacteria. These low-molecular-weight exudates may include a wide range of different compounds including monomeric carbohydrates, amino acids and organic acids, some of which may be difficult to track with the
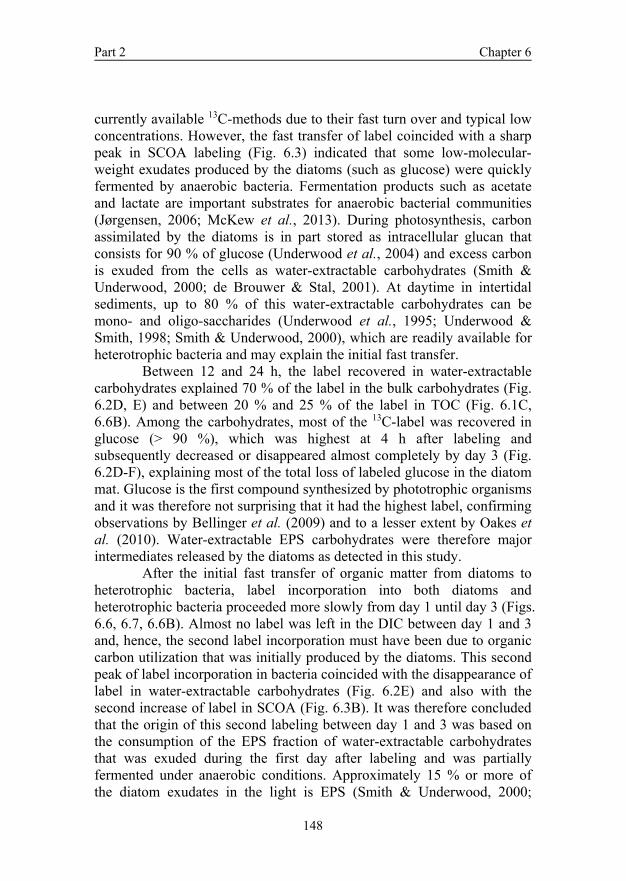
Part 2 Chapter 6
148
currently available 13C-methods due to their fast turn over and typical low concentrations. However, the fast transfer of label coincided with a sharp peak in SCOA labeling (Fig. 6.3) indicated that some low-molecular-weight exudates produced by the diatoms (such as glucose) were quickly fermented by anaerobic bacteria. Fermentation products such as acetate and lactate are important substrates for anaerobic bacterial communities (Jørgensen, 2006; McKew et al., 2013). During photosynthesis, carbon assimilated by the diatoms is in part stored as intracellular glucan that consists for 90 % of glucose (Underwood et al., 2004) and excess carbon is exuded from the cells as water-extractable carbohydrates (Smith & Underwood, 2000; de Brouwer & Stal, 2001). At daytime in intertidal sediments, up to 80 % of this water-extractable carbohydrates can be mono- and oligo-saccharides (Underwood et al., 1995; Underwood & Smith, 1998; Smith & Underwood, 2000), which are readily available for heterotrophic bacteria and may explain the initial fast transfer.
Between 12 and 24 h, the label recovered in water-extractable carbohydrates explained 70 % of the label in the bulk carbohydrates (Fig. 6.2D, E) and between 20 % and 25 % of the label in TOC (Fig. 6.1C, 6.6B). Among the carbohydrates, most of the 13C-label was recovered in glucose (˃ 90 %), which was highest at 4 h after labeling and subsequently decreased or disappeared almost completely by day 3 (Fig. 6.2D-F), explaining most of the total loss of labeled glucose in the diatom mat. Glucose is the first compound synthesized by phototrophic organisms and it was therefore not surprising that it had the highest label, confirming observations by Bellinger et al. (2009) and to a lesser extent by Oakes et al. (2010). Water-extractable EPS carbohydrates were therefore major intermediates released by the diatoms as detected in this study.
After the initial fast transfer of organic matter from diatoms to heterotrophic bacteria, label incorporation into both diatoms and heterotrophic bacteria proceeded more slowly from day 1 until day 3 (Figs. 6.6, 6.7, 6.6B). Almost no label was left in the DIC between day 1 and 3 and, hence, the second label incorporation must have been due to organic carbon utilization that was initially produced by the diatoms. This second peak of label incorporation in bacteria coincided with the disappearance of label in water-extractable carbohydrates (Fig. 6.2E) and also with the second increase of label in SCOA (Fig. 6.3B). It was therefore concluded that the origin of this second labeling between day 1 and 3 was based on the consumption of the EPS fraction of water-extractable carbohydrates that was exuded during the first day after labeling and was partially fermented under anaerobic conditions. Approximately 15 % or more of the diatom exudates in the light is EPS (Smith & Underwood, 2000;

6
Tracing carbon flow in a diatom mat
149
Underwood & Paterson, 2003). The chemical properties of EPS make them more recalcitrant to degradation in contrast to the low-molecular-weight exudates. Bacteria can utilize high-molecular-weight compounds such as EPS only after extracellular enzymatic hydrolysis to low-molecular-weight compounds (Fuchs et al., 1998; Hunter et al., 2006), which would explain the slower labeling rate of bacterial PLFA and 16S rRNA between day 1 and 3 (Fig. 6.7A, C). Surprisingly, we also detected this secondary labeling in the diatoms, which may be attributed to the heterotrophic metabolism of these organisms as hardly any DIC 13C-label was left. This second labeling coincided with the decrease of labeling in carbohydrates, which suggested that the diatoms used EPS as an external carbon storage as has been shown for pure cultures of diatoms (Staats et al., 2000; de Brouwer & Stal, 2001) and for slurry incubation to which diatom derived EPS was added (Taylor et al., 2013). Miyatake et al. (2013) recently showed that benthic diatoms in coastal sediment incorporated a variety of organic substrates and active heterotrophic growth of diatom cultures on glucose is well known (Lewin & Hellebust, 1976; Admiraal & Peletier, 1979). Alternatively, it is also possible that diatoms gradually re-incorporated intracellular storage glucans into cell materials. This was not specifically investigated in our study but it is well known that diatoms utilize these reserve carbohydrates during the dark (Smith & Underwood, 2000). For instance, Smith and Underwood (2000) reported that pure cultures of diatoms produced EPS in the dark from intracellular glucan during up to 3 days, which agrees with the second peak of label incorporation of diatoms that we observed.
We used both PLFA analyses and Mag-SIP to determine the labeling dynamics of major microbial groups in the diatom mat. Labeling levels and timing were mostly similar, although labeling of 16S rRNA seemed to be more dynamic than that of PLFA (Fig. 6.7). The highest Δδ13C values of diatom PLFA and bacterial PLFA were in the same range at 50-100 ‰ in this study. This is consistent with the study of Bellinger et al. (2009) but disagrees with those of Middelburg et al. (2000) and Evrard et al. (2008), who reported an approximately five-fold higher labeling in terms of Δδ13C values in diatom PLFA than in bacterial PLFA. Another difference is that Middelburg et al. (2000) and Evrard et al. (2008) reported a much faster decay of total labeling stocks. A possible reason for these differences is that our experiment and that of Bellinger et al. (2009) were done early in spring when thick diatom mats are present, whereas the other studies were done later in the season. In our study, macrofauna had not yet fully developed and therefore the grazing pressure was low. Hence, the diatom mat was at a climax with high biomass and
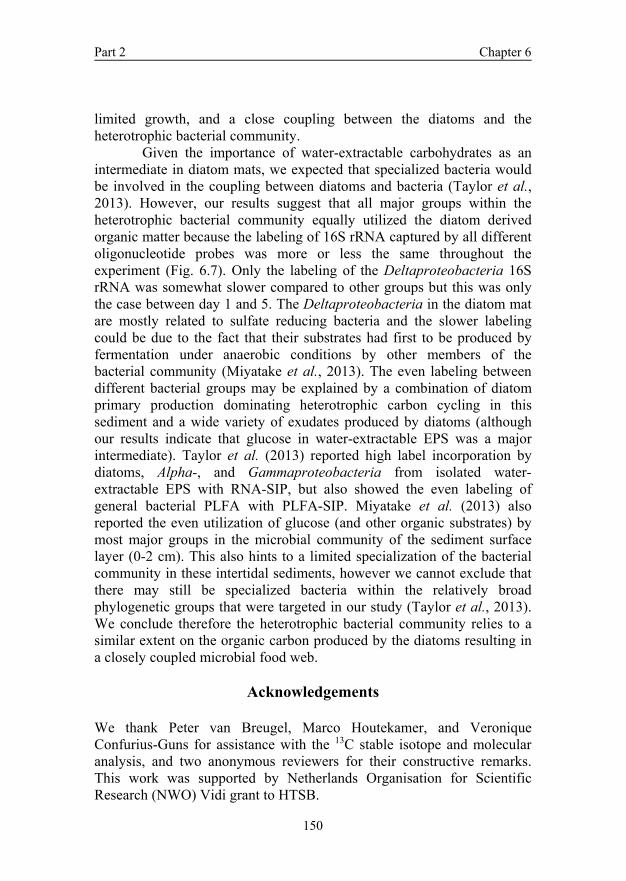
Part 2 Chapter 6
150
limited growth, and a close coupling between the diatoms and the heterotrophic bacterial community.
Given the importance of water-extractable carbohydrates as an intermediate in diatom mats, we expected that specialized bacteria would be involved in the coupling between diatoms and bacteria (Taylor et al., 2013). However, our results suggest that all major groups within the heterotrophic bacterial community equally utilized the diatom derived organic matter because the labeling of 16S rRNA captured by all different oligonucleotide probes was more or less the same throughout the experiment (Fig. 6.7). Only the labeling of the Deltaproteobacteria 16S rRNA was somewhat slower compared to other groups but this was only the case between day 1 and 5. The Deltaproteobacteria in the diatom mat are mostly related to sulfate reducing bacteria and the slower labeling could be due to the fact that their substrates had first to be produced by fermentation under anaerobic conditions by other members of the bacterial community (Miyatake et al., 2013). The even labeling between different bacterial groups may be explained by a combination of diatom primary production dominating heterotrophic carbon cycling in this sediment and a wide variety of exudates produced by diatoms (although our results indicate that glucose in water-extractable EPS was a major intermediate). Taylor et al. (2013) reported high label incorporation by diatoms, Alpha-, and Gammaproteobacteria from isolated water-extractable EPS with RNA-SIP, but also showed the even labeling of general bacterial PLFA with PLFA-SIP. Miyatake et al. (2013) also reported the even utilization of glucose (and other organic substrates) by most major groups in the microbial community of the sediment surface layer (0-2 cm). This also hints to a limited specialization of the bacterial community in these intertidal sediments, however we cannot exclude that there may still be specialized bacteria within the relatively broad phylogenetic groups that were targeted in our study (Taylor et al., 2013). We conclude therefore the heterotrophic bacterial community relies to a similar extent on the organic carbon produced by the diatoms resulting in a closely coupled microbial food web.
Acknowledgements
We thank Peter van Breugel, Marco Houtekamer, and Veronique Confurius-Guns for assistance with the 13C stable isotope and molecular analysis, and two anonymous reviewers for their constructive remarks. This work was supported by Netherlands Organisation for Scientific Research (NWO) Vidi grant to HTSB.

Seasonal changes in the biochemical fate of carbon fixed by benthic diatoms in intertidal sediments In preparation for Limnology and Oceanography
Tanja C.W. Moerdijk-Poortvliet1, Peter van Breugel1, Koen Sabbe2, Olivier Beauchard1, Lucas J. Stal1,3, Henricus T.S. Boschker1 1NIOZ Royal Institute for Sea Research and Utrecht University, PO Box 140, 4401 AC Yerseke, the Netherlands. 2Ghent University, Biology Department, Laboratory of Prostistology and Aquatic Ecology, Krijgslaan 281/S8, 9000 Gent, Belgium 3University of Amsterdam, Department of Aquatic Microbiology, PO Box 94248, 1090 GE Amsterdam, The Netherlands
7 C
hapt
er
Part 2 Chapter 7
152
Abstract Benthic diatoms are important primary producers in intertidal marine sediments and form the basis of the food web in these ecosystems. Despite the importance of this microphytobenthos, little is known about the carbon flow within diatom mats. In order to investigate this flow of carbon we performed in-situ 13C pulse-chase labeling experiments and followed the detailed biochemical fate of carbon fixed by the diatoms for 5 consecutive days. These labeling experiments were done at approximately 2-monthly intervals during one year in order to cover seasonal variations. The fixed carbon was recovered in individual carbohydrates, amino acids, fatty acids and nucleic acid bases. In addition, we assessed a variety of environmental parameters and photosynthetic characteristics. The fixed carbon was initially mainly stored as carbohydrate (glucose) while nitrogen-rich compounds (e.g. amino acids and RNA/DNA) were produced more slowly. Over the year the diatoms distributed the photosynthetically fixed carbon differently over the various carbon pools that were measured. In summer the diatoms decreased carbon fixation and accumulated relatively more lipid as storage compound (27 ± 2 % versus 12 ± 5 % in other seasons). Lipids may serve as storage of carbon and energy, and as electron sink that could protect them from oxidative stress. In addition, due to the presence of bioturbating organisms and grazers, urea produced by this fauna could be an important nitrogen source during the summer months and affecting the diatom’s metabolism. The percentage of fixed carbon that was excreted as extracellular polymeric substances (EPS) was lower in summer compared to other seasons, respectively 9 ± 4 % and 21 ± 6 %. Hence, it seemed that the physiology of the microphytobenthos was different during the summer. This distinct seasonal difference correlated significantly to fluctuations in light intensity and temperature.

7
Seasonal changes in the biochemical fate of carbon fixed by diatoms
153
Introduction
Microphytobenthos on intertidal mudflats may contribute up to 50 % of the total primary production within estuaries (Cahoon, 1999, Underwood & Kromkamp, 1999). In temperate regions, diatoms are the dominant group in microphytobenthic communities and can form dense mats at the sediment surface (Admiraal et al., 1984; MacIntyre & Cullen, 1996). These mats provide a major source of carbon for the successive trophic levels, including microbes (Herman et al., 2000; Como et al., 2014; Taylor et al., 2013).
Benthic diatoms achieve high rates of photosynthesis. Depending on the nutrient status of the diatom mats the initially produced glucose can be used for the biosynthesis of cellular compounds such as other carbohydrates, amino acids, fatty acids and nucleic acids. For example, under nutrient replete conditions up to 40 % of the photosynthetically fixed carbon may be directed toward the synthesis of amino acids (Armbrust et al., 2004; Levitan et al., 2015). However, as available nutrients can be very limited in compact diatom mats, fixed carbon may be initially stored as the reserve polymer chrysolaminaran (1,3-D-glucan) that may be converted into other cellular components once nutrients become available. Moreover, under strong nitrogen deficiency (or as a consequence photo-oxidative stress) or adverse environmental conditions, the intermediate metabolism is altered and the fate of fixed carbon is directed to triglycerides, another storage compound (Hu et al., 2008; Hockin et al., 2012). However, obviously space for intracellular storage of reserve compounds is limited and therefore excess fixed carbon can also be exuded as EPS, which may explain up to 73 % of the carbon fixation (Goto et al., 1999; Smith & Underwood, 2000; Underwood & Paterson, 2003).
Diatoms are able to utilize a variety of inorganic nitrogen sources (e.g. nitrate, ammonium) and organic nitrogen sources (e.g. urea, amino acids) and adjust their nitrogen metabolism according to the available nutrients, which may either be supplied from the sediment or from the water during high tide (Bender et al., 2012). The presence of a metazoan-like urea cycle in the genome of diatoms came as a surprise (Armbrust et al., 2004). Although the functioning of the urea cycle in diatoms is not completely understood, it is assumed to be involved in the recycling and biosynthesis of organic nitrogen compounds, and important for the exchange of nutrients between the mitochondria and the cytoplasm (Allen et al., 2011; Prihoda et al., 2012). The urea cycle may therefore play a role in the metabolic response of diatoms to nutrient availability. The fate

Part 2 Chapter 7
154
of carbon fixed by benthic diatoms may change as the result of seasonal variation in environmental conditions (e.g. nutrient availability, temperature and light intensity) and this could affect the overall functioning of the diatom mat. Moreover, when diatoms experience stress due to low nutrient availability or high light intensities and react by storing carbon in the form of chrysolaminaran and/or triglycerides (i.e. compounds rich in carbon, but lacking nitrogen or phosphorus) the nutritional value of the diatoms will decline for higher trophic levels. Eventually food web structure might be affected which as a result will have an effect on the whole ecosystem (Van Oevelen et al., 2006).
Stable isotope labeling techniques are a valuable tool to study the carbon cycle in intertidal mudflats. With these techniques, organic carbon cycling and the classical food web have been well studied (Herman et al., 1999; Degré et al., 2006; Van Oevelen et al., 2006). However, only a few studies focused on carbon flows within diatom mats. The majority of studies dealt with various aspects of lipid biochemistry because of the inability of established techniques to study other metabolites (Middelburg et al., 2000; Bouillon & Boschker, 2006; Evrard et al., 2008; Bellinger et al., 2009). The development of a new compound specific stable isotope technique enabled the unraveling of metabolic pathways of photosynthetically acquired carbon in benthic diatoms (Moerdijk-Poortvliet et al., 2013). Liquid Chromatography Isotope Ratio Mass Spectrometry (LC/IRMS) was applied to study carbohydrate metabolism in diatom mats by Oakes et al. (2010) and by Miyatake et al. (2014). The development of additional LC/IRMS methods for amino acids and nucleic acids allowed the study of all major classes of biological compounds, which improved our insight in the functioning of diatom mats (Boschker et al., 2008; Moerdijk-Poortvliet et al., 2013; Moerdijk-Poortvliet et al., 2014).
Because environmental conditions such as temperature, light intensity and nutrient availability will vary between seasons, we hypothesized that during the course of a year the physiology of benthic diatoms is different and the partitioning of fixed carbon between the major metabolic pools (i.e. carbohydrates, fatty acids, amino acids and nucleic acids) changes. To test this hypothesis, six in-situ 13C pulse-chase experiments were carried out in order to trace the carbon flow in an intertidal diatom mat for 5 days at intervals of approximately 2 months during one year. We also monitored a variety of environmental parameters, such as light, temperature and nutrient concentrations, and measured photosynthetic parameters. This approach provided information on the rate of biosynthesis of the different carbon compounds and the subsequent

7
Seasonal changes in the biochemical fate of carbon fixed by diatoms
155
turnover due to transfer between the different carbon pools as well as losses from the system in relation to environmental conditions.
Methods Study site and in-situ 13C labeling experiments In 2011, six in-situ 13C-labeling experiments were carried out every 2 months at the Zandkreek intertidal mudflat, which is situated along the southern shore of the Oosterschelde estuary in the Southwest of the Netherlands (51°32'41”N, 3°53'22”E). The sampling site was located 0.15 m below the mean tidal level and the emersion period was approximately 6 h per tidal cycle. The silt content of the sediment (fraction <0.63 µm particle size) was 26 ± 3 % and the median grain size was 103 ± 8 µm, which did not change during the year. Also the water content of the sediment did not change during the year and varied between 29 and 34 %. Seasonal changes in the average temperature in the top 15 mm of the sediment during labeling and the photosynthetic active radiation (PAR) are shown in figure 7.1.
Sediment organic carbon content showed small differences during the year and varied between 4,844 ± 120 and 6,588 ± 37 mmol m-2. Bioturbating fauna such as the amphipod shrimp Corphium volutator and the hydrobiid snail Peringia ulvae developed in late spring (June) presumably resulting in higher grazing rates and a more mixed sediment top layer during summer.
Experiments were started immediately after emersion of the mudflat. Two 500 × 500 mm stainless steel frames were pushed into the sediment to a depth of 80 mm in order to constrain the labeling and sampling area. The two frames were treated as duplicates (n =2) and were divided in a 100 ×100 mm sampling grid. Unlabeled control samples were taken just outside the frames as described below. The in-situ labeling experiment was started by spraying the surface of the sediment within each frame with 200 mL of [13C] sodium bicarbonate (99 % 13C; Cambridge Isotope Laboratories, Andover, USA) with ambient salinity (30 ‰) to obtain a final concentration of 1 g 13C m-2 (Middelburg et al., 2000) .

Part 2 Chapter 7
156
-5
0
5
10
15
20
25
30
0
100
200
300
400
500
600
700
800
Jan-11 Feb-11 Mar-11 Apr-11 May-11 Jun-11 Jul-11 Aug-11 Sep-11 Oct-11 Nov-11 Dec-11
Aver
age
PAR
day v
alue
s µE
/m2 .s
PAR T air oC T sediment oC /sampling period oC
Average air Temperature day values oC
Feb Apr Jun Aug Oct Dec
Fig. 7.1. Annual photosynthetically active radiation (PAR) and air temperature. The position of the bars indicates the sampling period and the height indicates the average sediment temperature during the pulse-labeling period.
The labeled sediment was sampled 2 and 4 h after label addition during the first low tide (the pulse-labeling period), and subsequently at 12h, 1 d, 2 d, 3 d, and 5 d exactly at low tide (the chase period). At each sampling time, approximately 5 mL pore-water was collected and mixed from two randomly chosen positions within the sampling grid of each frame with porous polymer sippers (Rhizon Soil Moisture Sampler; Eijkelkamp Agrisearch Equipment) inserted into the upper 1.5 cm of the sediment. One mL of the mixed pore-water sample per frame was dispensed into airtight headspace vials and analyzed for 13C-DIC (dissolved inorganic carbon) and the remainder was used for inorganic nutrient analysis. Water column nutrient data are from the NIOZ monitoring program from a station 500 m away from the diatom mat that was sampled every month.
Sediment samples were collected and mixed from the two randomly chosen positions within the sampling grid of each frame. The top 15 mm of the sediment was collected by pushing a core liner (inside diameter 10 cm) into the sediment to a depth of 50 mm and subsequently the top 15 mm of the sediment was sampled with a spatula (Middelburg et al., 2000). The sampling hole was filled with unlabeled sediment collected just outside the sampling frames and the core liner was removed. The two sediment samples taken from each frame were homogenized and subsampled for the different analysis. Samples for total organic carbon

7
Seasonal changes in the biochemical fate of carbon fixed by diatoms
157
(TOC), carbohydrate (CHO), amino acid (AA) and fatty acid (FA) analysis were directly frozen in liquid nitrogen and subsequently lyophilized and stored at -20 °C prior to analysis. Samples for pigment and nucleic acid analysis were also frozen in liquid nitrogen, and were stored at -80 °C prior to analysis. Sediment samples for extracellular polymeric substances (EPS) extraction were extracted within 30 minutes after sampling as described in Miyatake et al. (2014). Two operationally defined EPS fractions were distinguished: EPS extracted by MQ and EPS extracted by EDTA (de Brouwer & Stal, 2001).
To study dark fixation by chemoautotrophic and heterotrophic bacteria, two cores (70 mm internal diameter) were taken outside the frames in a separate experiment and incubated in the dark for 4h with the same amount of 13C label (per m2) as in the field added to the top of the sediment. The top 15 mm of these cores was sampled and analyzed for PLFA labeling.
A miniaturized pulse amplitude modulated fluorimeter (Mini-PAM, Walz GmbH, Effeltrich, Germany) was used to monitor photosynthetic parameters. Intact sediment cores of the diatom mat were taken in duplicate. Rapid light curves (RLCs) were recorded simultaneously with the pulse-labeling period. Prior to RLCs recording, samples were dark adapted for 15 minutes to relax non-photochemical quenching. Subsequently, RLCs were recorded with 12 incremental irradiance steps of 20 s. From these data the relative maximum photosynthetic electron transport rate, the light affinity coefficient (alpha), and the light saturation irradiance were determined (Serôdio et al., 2005).
During the 13C label incorporation and RLCs recordings, PAR (400-700 nm) was measured on site every 15 min by a Li-cor light meter (LI-250A) connected to a quantum sensor (Li-cor, Lincoln, NE, USA). Throughout the year a PAR sensor (Li-cor, LI 191) connected to a data logger (Licor, LI-1000), located 10 km from the study area, measured PAR values every minute; data was averaged and logged hourly.
During winter (February) and summer (August) the species composition of the diatom mat was determined. Samples for diatom identification were taken in duplicate by scraping a few gram sediment of the surface to a depth of 5 mm. Subsequently, the sample was fixed in 1 % glutaraldehyde/formaldehyde in artificial seawater (30 ‰) and stored at 4 °C. For diatom identification, frustules were cleaned by concentrated hydrogen peroxide oxidation and about 200 valves per sample were identified by light microscopy (Sabbe et al., 1995). Relative cell numbers were converted into relative contributions to total biovolume using the equations of Hillebrand et al. (1999). Taxa were divided into three
Part 2 Chapter 7
158
growth forms, i.e. epipelic (motile), epipsammic (non-motile) and tychoplanktonic (see Barnett et al. (2015) for more details).
Analytical procedures The carbon content and isotopic composition of TOC were analyzed by elemental analyzer/isotope ratio mass spectrometer (EA/IRMS) after the removal of carbonate with hydrochloric acid (Boschker et al., 1999). For DIC analysis, pore-water samples were acidified by adding 0.1 mL of 19 mol L-1 phosphoric acid (Miyajima et al., 1995) and headspace gas was injected into an EA/IRMS in order to determine the concentration and isotopic composition of DIC.
Carbon content and isotopic composition of carbohydrates, amino acids and nucleic acids in bulk sediment were analyzed by LC/IRMS. Likewise, EPS was analyzed by LC/IRMS for carbohydrate carbon content and isotopic composition. For carbohydrates, 500 mg freeze dried sediment and 4 mL MQ EPS and EDTA EPS extracts were hydrolyzed to monosaccharides under acidic conditions using a modified method according to Cowie and Hedges (1984). Instead of neutralizing the hydrolysates with barium carbonate, the samples were neutralized with strontium carbonate, which resulted in an increase yield of the extract. EDTA was removed from the EDTA EPS hydrolysate as described in Moerdijk-Poortvliet et al. (2013) and samples were analyzed by LC/IRMS as described in Boschker et al. (2008). For amino acids, 700 mg freeze dried sediment was hydrolyzed with 6 M HCl for 20 h at 110 °C and subsequently purified by cation-exchange chromatography (Veuger et al., 2005) and analyzed by LC/IRMS as described in McCullagh et al. (2006). For nucleic acids, desoxyribonucleic acid (DNA) and ribonucleic acid (RNA) were co-extracted from fresh sediment samples (5-10 g), enzymatically hydrolyzed to 5’-mononucleotides and analyzed by LC/IRMS as described in Moerdijk-Poortvliet et al. (2014). Liquid chromatography was carried out using a Surveyor liquid chromatograph connected to an LC Isolink interface and a Delta V Advantage IRMS (all from Thermo Fisher, Bremen, Germany).
Lipids were extracted from 4 g dry weight of sediment with a modified Bligh and Dyer extraction (Boschker et al., 1999). The lipid extract was fractionated on silicic acid (60, Merck) into different polarity classes by sequential eluting with chloroform, acetone and methanol. The chloroform fraction contained mainly neutral lipid-derived FA (NL), while the acetone and methanol fraction contained polar lipids-derived FA (i.e. mainly glycolipids-derived FA and phospho-lipids-derived FA respectively, but both fractions also contained other lipids such as betaine

7
Seasonal changes in the biochemical fate of carbon fixed by diatoms
159
lipids and sulfolipids) (Heinzelmann et al., 2014). The acetone and the methanol fraction were denoted as respectively polar lipid 1 (PL1) and polar lipid 2 (PL 2). All fractions were converted into fatty-acid methyl esters and the carbon content and isotopic composition of these derivatives were measured by GC/IRMS (Middelburg et al., 2000).
Pigments were extracted with acetone (90%, buffered with 5% ammonium acetate) from freeze-dried sediment, and analyzed by reverse-phase high-performance liquid chromatography (Dijkman & Kromkamp, 2006).
Nutrient concentrations in pore-water samples were analyzed using a segmented continuous flow analyzer (SEAL QuAAtro XY-2 autoanalyzer, Bran and Luebbe, Norderstedt, Germany), according to the instructions provided by the manufacturer.
Data analyses Benthic diatom biomass (expressed as mmol C m-2) was calculated from the difference between total PL 2 and the bacteria-specific PL 2 pool (i.e. i14:0, i15:0, a15:0, i16:0, and 18:1ω7c), as benthic diatom biomass = (ΣPL2total – ΣPL2bacteria)/a, where a is the average PL2 concentration in benthic diatoms (0.053 mmol of C PL2 per mmol biomass benthic diatoms) (Evrard et al., 2008). Alternatively benthic diatom biomass was calculated from chlorophyll a concentrations assuming a carbon to chlorophyll a ratio of 40 (De Jonge, 1980; Middelburg et al., 2000).
In order to provide insight and overview of obtained data, carbon pools were divided into storage and structural compounds. Storage carbon pools were defined as the sum of glucose and NL. Structural carbon pools were defined as the sum of structural carbohydrates (CHO structural, i.e. fucose, rhamnose, galactose, mannose and xylose), PL 1, PL 2, AA, DNA and RNA. Amino acids were further divided into subgroups based on the number of nitrogen atoms in these compounds (i.e. amino acids containing one nitrogen atom (AA-1N): aspartine (aps), hydroxyproline (hyp), serine (ser), threonine (thr), glutamine (glu), glycine (gly), alanine (ala), proline (pro), valine (val), methionine (met), isoleucine (ile), leucine (leu), tyrosine (tyr), and phenylalanine (phe); one amino acid containing two nitrogen atoms (AA-2N): lysine (lys); one amino acid containing three nitrogen atoms (AA-3N): histine (his) and one amino acid containing four nitrogen atoms (AA-4N): arginine (arg)) and the three polarity classes of fatty acids (i.e. NL, PL1, and PL2) into saturated fatty acids (SFA), mono-unsaturated fatty acids (MUFA) and poly-unsaturated fatty acids (PUFA). The data of the two operationally defined EPS fractions, analyzed for carbohydrates, were combined and referred to as EPS.

Part 2 Chapter 7
160
For the carbon pool production measurements the absolute amount of 13C incorporated into different carbon pools over the background was displayed. This value is expressed as excess 13C and is calculated from δ13C sample as:
Excess 13C (mol 13C m-2) =
( )( )
( )( ) sample
stbackground13
stbackground13
stsample13
stsample13
C1R11000/Cδ
R11000/Cδ
1R11000/Cδ
R11000/Cδ×
+×+
×+−
+×+
×+
where δ13Cbackground denotes the δ13C value of the unlabeled sample, Csample denotes the pool size in mol of carbon per square meter sediment (mol C m-2) and Rst denotes the 13C/12C ratio of the international standard Vienna Pee Dee Belemnite (Rst=0.0112372). Carbon fixation rates of various carbon pools of the diatom mat were quantified by calculating the regression slope from sample data (at 0, 2, and 4 h) (expressed in µmol 13C m-2 h-1).
The relative photosynthetic electron transport rate (rETR) was calculated by multiplying the Mini PAM measured quantum yield (i.e. ‘efficiency’ of photosynthesis) and the applied irradiance (E) during the recording of the RLCs (Kromkamp & Forster, 2003). From the RLCs the relative maximum photosynthetic electron transport rate (ETRmax), the light affinity coefficient in the light limited region of the rapid light curve (alpha), and the light saturating irradiance (Ek= ETRmax/alpha) were determined by fitting the RLCs to a modified version of the equation of Eilers and Peeters (1988): rETR=E/aE2 + bE + c), where a=(alpha ×Ek
2)-1 -2 × (alpha × Ek)-1; c=alpha-1.
The relationship between production rates of the various carbon pools and environmental, photosynthetic, and pigment parameters (i.e. explanatory variables) were analyzed by Co-inertia Analysis (Dolédec & Chessel, 1994); this data table coupling technique is especially adapted to tables composed of a relatively high number of variables (Dray et al., 2003) as in our study. Production and explanatory data were processed by normalized Principal Component Analysis (PCA). These two PCAs were then combined in a Co-Inertia Analysis (CoIA) in order to highlight the common information between explanatory and production measurements (Dolédec & Chessel, 1994; Dray et al., 2003). The correlation between the explanatory and production data set was assessed by the Rv coefficient (Escoufier, 1973) and its significance was tested by a randomization procedure of 9999 permutations of table lines (Heo & Ruben Gabriel, 1998). Similarly, the 13C excess data table of the various carbon pools

7
Seasonal changes in the biochemical fate of carbon fixed by diatoms
161
after 3 days was also processed by a normalised PCA and its relationship with explanatory variables were analysed by Co-inertia Analysis. Time-point ‘day 3’ was chosen, because from that time-point on label distributions remained relatively similar. Multivariate analyses and associated graphical representations were run with “ade4” package (Chessel et al., 2004) in R version 3.2.3 (Team, 2015).

Part 2 Chapter 7
162
0
500
1000
1500
2000
FEB APR JUN AUG OCT DEC
Biom
ass
mm
ol C
m-2
based on chlorophyll a based on PLFA
Epipelon 80%
Epipelon 60%
Tycho 3%
Tycho 5%
Epipsammic 15 %
Epipsammic 35%
AUG
FEB
Results
Seasonal development of the diatom mat Benthic diatoms were visible on the sediment surface during the whole year but varied in density, depending on the time of the year and the time of the day. Trends in benthic diatom biomass estimated from chlorophyll a and fatty acids biomarker data were in good agreement with each other (Fig. 7.2). Fig. 7.2. Diatom biomass based on respectively chlorophyll a and PL2-derived FA (assumed to be mainly phospholipid-derived fatty acids (PLFA)). Bars denote winter and summer community composition of the diatom mat. The benthic diatom biomass was highest in winter and lowest during June and August. The decrease in biomass coincided with the activity of bioturbating fauna that grazed the diatom mat. The species composition of the diatom mat was determined in winter (February) and summer (August). On average 40 ± 3 different diatom species were observed. In terms of biovolume, epipelic diatoms dominated the community in both months and the proportion of epipsammic diatoms was highest in February. The proportion of tychoplanktonic diatoms was always low (Fig. 7.2). Epipelic diatoms were dominated by Entomoneis sp. (comprising 47 and 35 biovolume (BV) % of this group in winter and summer, respectively), tychoplanktonic diatoms were dominated by Cymatosira belgica
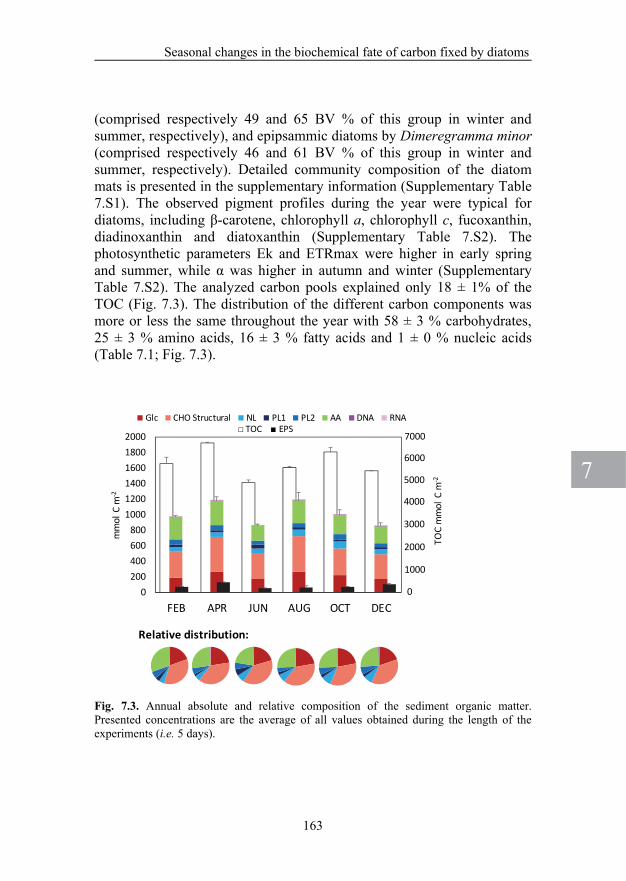
7
Seasonal changes in the biochemical fate of carbon fixed by diatoms
163
Relative distribution:
0200400600800
100012001400160018002000
FEB APR JUN AUG OCT DEC
mm
ol C
m-2
Concentration Carbon poolsGlc CHO Structural NL PL1 PL2 AA DNA RNA
TOC EPS 7000
0
TOC
mm
olC
m-2
1000
2000
3000
4000
5000
6000
(comprised respectively 49 and 65 BV % of this group in winter and summer, respectively), and epipsammic diatoms by Dimeregramma minor (comprised respectively 46 and 61 BV % of this group in winter and summer, respectively). Detailed community composition of the diatom mats is presented in the supplementary information (Supplementary Table 7.S1). The observed pigment profiles during the year were typical for diatoms, including β-carotene, chlorophyll a, chlorophyll c, fucoxanthin, diadinoxanthin and diatoxanthin (Supplementary Table 7.S2). The photosynthetic parameters Ek and ETRmax were higher in early spring and summer, while α was higher in autumn and winter (Supplementary Table 7.S2). The analyzed carbon pools explained only 18 ± 1% of the TOC (Fig. 7.3). The distribution of the different carbon components was more or less the same throughout the year with 58 ± 3 % carbohydrates, 25 ± 3 % amino acids, 16 ± 3 % fatty acids and 1 ± 0 % nucleic acids (Table 7.1; Fig. 7.3). Fig. 7.3. Annual absolute and relative composition of the sediment organic matter. Presented concentrations are the average of all values obtained during the length of the experiments (i.e. 5 days).

Part 2 Chapter 7
164
Pulse period: initial production of carbon pools The total carbon fixation and the production of the individual carbon pools during the first 4 hours of the in-situ labeling experiments showed a strong seasonal pattern. February and April were the most productive months and October and December the least productive (Fig. 7.4A). Of the total determined carbon pools production, the production of storage carbon (glucose and NL) was much more important than the production of structural carbon, with respectively 81 ± 5 % and 19 ± 1 % (Table 7.1).
Glucose strongly dominated storage carbon production throughout the year. The 13C label distribution in the analyzed carbon pools was rather similar in February, April, October, and December. In the summer months the 13C label distribution was different as NL became more important than in other seasons (27 ± 2 % in summer versus 12 ± 5 % in other seasons, Table 7.1; Fig. 7.4A). For structural carbon, a relative low amino acid production was found in summer compared to other seasons respectively 14 ± 1% versus 27 ± 6%. This is in contrast to the relatively higher PL1 production in summer (24 ± 6%) compared to other seasons (10 ± 4%) (Table 7.1). The RNA production was higher than DNA production, irrespective of the month of sampling. However, the DNA production was relatively more important in summer than in other seasons (33 ± 6% versus 14 ± 8% of the total nucleic acids, Table 7.1; Fig. 7.4B). For the production of PL2 and the structural CHO we did not observe a seasonal effect (Table 7.1). The percentage of fixed carbohydrate excreted as EPS was lower in summer than in other months, respectively 9 ± 4% and 21 ± 6% (Table 7.1). Therefore, the main seasonal differences were that during summer the diatom mat showed relatively higher growth (i.e. higher production of DNA and PL1-derived fatty acids), a larger part of the fixed carbon was redirected to storage lipids instead of to glucose and the percentage of fixed carbohydrate excreted as EPS was lower.

7
Seasonal changes in the biochemical fate of carbon fixed by diatoms
165
Relative distribution:
Relative distribution:
0.00.20.40.60.81.01.21.41.61.8
FEB APR JUN AUG OCT DEC
µmol
13C
m-2
h-1
DNA RNA
A
B
0
500
1000
1500
2000
2500
3000
3500
FEB APR JUN AUG OCT DEC
µmol
13C
m-2
h-1
pGlc CHO Structural NL PL1 PL2 AA DNA RNA
TOC EPS Fig 7.4. Annual absolute and relative distribution of determined carbon production rates (A) and DNA and RNA production rates of the diatom mat (B).
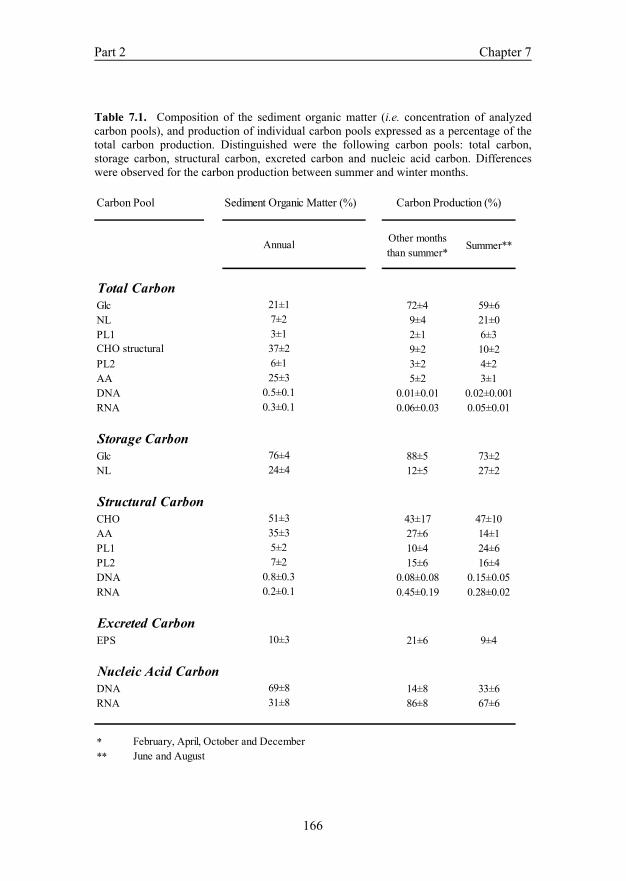
Part 2 Chapter 7
166
Other months than summer*
Summer**
Glc 72±4 59±6NL 9±4 21±0PL1 2±1 6±3
9±2 10±2PL2 3±2 4±2AA 5±2 3±1DNA 0.01±0.01 0.02±0.001RNA 0.06±0.03 0.05±0.01
Glc 88±5 73±2NL 12±5 27±2
CHO 43±17 47±10AA 27±6 14±1PL1 10±4 24±6PL2 15±6 16±4DNA 0.08±0.08 0.15±0.05RNA 0.45±0.19 0.28±0.02
EPS 21±6 9±4
DNA 14±8 33±6RNA 86±8 67±6
*** June and August
February, April, October and December
69±831±8
10±3
Nucleic Acid Carbon
0.2±0.1
Excreted Carbon
5±27±2
0.8±0.3
Structural Carbon51±335±3
76±424±4
0.3±0.1
Storage Carbon
6±125±3
0.5±0.1
7±23±1
CHO structural 37±2
Total Carbon21±1
Annual
Carbon Pool Sediment Organic Matter (%) Carbon Production (%)
Table 7.1. Composition of the sediment organic matter (i.e. concentration of analyzed carbon pools), and production of individual carbon pools expressed as a percentage of the total carbon production. Distinguished were the following carbon pools: total carbon, storage carbon, structural carbon, excreted carbon and nucleic acid carbon. Differences were observed for the carbon production between summer and winter months.
7
Seasonal changes in the biochemical fate of carbon fixed by diatoms
167
Substantial 13C label was incorporated in the TOC pool during the initial 4 h labeling period (Fig. 7.4A). The analyzed carbon pools explained on average 55 ± 7 % of the 13C label incorporated in the TOC, however a substantial fraction (~45 %) was therefore not accounted for (Fig. 7.4A). For most months the maximum amount of incorporated 13C label was reached at t = 4h where after excess 13C substrate was washed away due to immersion. However, in June 13C bicarbonate label incorporation continued after t = 4 h and reached a maximum at t = 12h (Fig. 7.5C). Presumably, bioturbation of the sediment resulted in a deeper burial of the 13C bicarbonate label and resulted in an increased label residence time in the pore-water. This, in combination with prolonged day lengths, might be the cause of ongoing label incorporation between t = 4h and t = 12h. Fixation of 13C label in the dark, as was determined in separate sediment core experiments, indicated that CO2 fixation by chemoautotrophic bacteria or through anaplerotic carbon fixation by heterotrophs was not important as also found by Miyatake et al. (2014). Chase period: loss and redistribution of incorporated 13C label. By studying the chase period (12 h – 5 d) we gained insight in the dynamics of the various produced carbon pools after bicarbonate label was washed away by the tides (Fig. 7.5). On average only 1.7 ± 0.9 % of initially applied 13C-DIC remained in the sediment pore-water after 12h of the start of experiment, confirming that most of it was washed away (or exchanged with the atmosphere). Both storage carbon in the form of glucose and neutral lipids, and EPS showed a steep decrease in 13C labeling during the first 20 hours of the chase period (Fig. 7.5 and Fig. 7.6 A1-F1). Most structural compounds like AA, structural CHO, PL1 and PL2 showed a more gradual loss of 13C label (Fig. 7.6 A2-F2), while the DNA and RNA pools showed hardly any label loss, but instead increased the labeling during the course of the experiment in particular for DNA (Fig. 7.6 A3-F3)). The main difference between storage and structural compounds was that the turnover of storage compounds was fast whereas the turnover of structural compounds, especially for DNA and RNA, was slow.

Part 2 Chapter 7
168
0
500
1000
1500
2000
2500
3000
3500
4h 12h 1d 2d 3d 5d
µmol
13
C/m
2
DECEMBER
0
1000
2000
3000
4000
5000
6000
7000
4h 12h 1d 2d 3d 5d
µmol
13
C/m
2AUGUST
0
2000
4000
6000
8000
10000
12000
14000
4h 12h 1d 2d 3d 5d
µmol
13
C/m
2
APRIL
0
2000
4000
6000
8000
10000
12000
14000
4h 12h 1d 2d 3d 5d
µmol
13C
m-2
FEBRUARY
0
1000
2000
3000
4000
5000
6000
7000
4h 12h 1d 2d 3d 5d
µmol
13C
m-2
JUNE
0
500
1000
1500
2000
2500
3000
3500
4h 12h 1d 2d 3d 5d
µmol
13C
m-2
OCTOBER
m2
Glc Structural CHO NL PL1 PL2 AA DNA RNA TOC EPS
Fig. 7.5. Seasonal dynamics of 13C label content and relative13C label distribution of all analyzed carbon pools during the label chase-period of the experiment.

7
Seasonal changes in the biochemical fate of carbon fixed by diatoms
169
Net label loss was studied by comparing the amount of incorporated 13C label at t= 4h with the 13C label remainder after 3 days. For both storage and structural carbon the highest loss of incorporated 13C label was observed in the months February and April (respectively 89 ± 2 % and 48 ± 8 %, Fig. 7.6 A1; 7.6A2 and 7.6 B1; 7.6 B2) while in the other seasons it was lower (respectively 76 ± 3 % and 9 ± 14 %, Fig. 7.6 C1 - 7.6 F1 and 7.6 C2 -7.6 F2). Throughout the year glucose accounted for most of the loss of 13C label of storage compounds (86 ± 12 %), but in summer also NL contributed to this loss (27 ± 2 %). Throughout the year the loss of structural carbon was mainly attributed to the loss of 13C label from the structural CHO and AA pools, while the 13C label content in other structural pools, such as PL1 and PL2, moderately decreased or remained constant (Fig 7.6 A2 - 7.6 F2).
It should be noted that the percentage of TOC explained by the 13C label incorporated in the biochemical carbon pools decreased from 55 ± 7 % at t = 4h to 33 ± 10 % at day 3 (Fig. 7.5). This suggested transfer of a substantial amount of label to an unknown carbon pool within the TOC. The label transfer to the unknown carbon pool was lowest during summer (15 ± 3 % compared to 27 ± 3 % during the rest of the year).

Part 2 Chapter 7
170
0
200
400
600
800
1000
1200
4h 12h 1d 2d 3d 5d
µm
ol 13
C m
-2
0123456789
4h 12h 1d 2d 3d 5d
µm
ol 13
C m
-2
0
2
4
6
8
10
12
4h 12h 1d 2d 3d 5d
µm
ol 13
C m
-2
0500
1000150020002500300035004000
4h 12h 1d 2d 3d 5d
µm
ol 13
C m
-2
0200400600800
10001200140016001800
4h 12h 1d 2d 3d 5d
µm
ol 13
C m
-2
050
100150200250300350400450
4h 12h 1d 2d 3d 5d
µm
ol 13
C m
-2
m2
Glc Structural CHO NL PL1 PL2 AA DNA RNA TOC EPS
0200400600800
1000120014001600
4h 12h 1d 2d 3d 5d
µm
ol 13
C m
-2
0123456789
4h 12h 1d 2d 3d 5d
µm
ol 13
C m
-2
0
1000
2000
3000
4000
5000
6000
4h 12h 1d 2d 3d 5d
µm
ol 13
C m
-2
0
200
400
600
800
1000
1200
1400
4h 12h 1d 2d 3d 5d
µm
ol 13
C m
-2
0
200
400
600
800
1000
1200
4h 12h 1d 2d 3d 5d
µm
ol 13
C m
-2
0.0
1.0
2.0
3.0
4.0
5.0
6.0
4h 12h 1d 2d 3d 5d
µm
ol 13
C m
-2
0
500
1000
1500
2000
2500
3000
3500
4h 12h 1d 2d 3d 5d
µm
ol 13
C m
-2
0
100
200
300
400
500
600
4h 12h 1d 2d 3d 5d
µm
ol 13
C m
-2
0
20
40
60
80
100
120
140
4h 12h 1d 2d 3d 5d
µm
ol 13
C m
-2
0.0
0.5
1.0
1.5
2.0
2.5
4h 12h 1d 2d 3d 5d
µm
ol 13
C m
-2
050
100150200250300350400450
4h 12h 1d 2d 3d 5d
µm
ol 13
C m
-2
0
1
2
3
4
5
6
7
8
4h 12h 1d 2d 3d 5d
µm
ol 13
C m
-2
Febr
uary
April
June
Augu
stO
ctob
erDe
cem
ber
Storage compounds Structural compounds
A1 A2 A3
B1 B2 B3
C1 C2 C3
D1 D2 D3
E1 E2 E3
F1 F2 F3
Fig. 7.6. Seasonal dynamics of 13C label content of storage and structural carbon pools during the label chase-period of the experiment.

7
Seasonal changes in the biochemical fate of carbon fixed by diatoms
171
Environmental parameters Pore-water nutrient concentrations were always higher than nutrient concentrations in the water column above the sediment (during immersion) (Supplementary Table 7.S2). Inorganic nitrogen was predominantly present as ammonium in the pore water and nitrate in the overlying water. Average pore water inorganic nitrogen concentrations were lower in summer (June and August) compared to the rest of the year (respectively 27.9 ± 0.1 and 72 ± 27 µmol L-1). N:P ratios above Redfield (i.e. 16) were observed from February until June (26 ± 5). In August and October N:P ratios were below Redfield (7 ± 1) and in December near Redfield (17 ± 1) ( Supplementary Table 7.S2). Likewise, inorganic nitrogen concentrations in the overlying water were lower in summer (June and August) compared to the rest of the year (respectively 14 ± 3 and 38 ± 16 µmol L-1). The seasonal trend of nutrient N:P ratios in the overlying water was similar as in the pore water and were above Redfield from February until June and in December (46 ± 30) and below Redfield in August and October (12 ± 2) (Supplementary Table 7.S2). The exact nutrient concentrations in the thin diatom mat could not be determined and are therefore unknown. The concentration of organic nutrients like urea was not measured. PAR values correlated to sediment temperatures and were higher in summer than in winter. The average temperature and integrated photon irradiance during the 4 h of 13C labeling of the diatom mat were the lowest in February (3.7 oC and 1314 µmol photons m-2 and the highest in August (20.5 oC and 7492 µmol photons m-2) (Supplementary Table 7.S2).
Co-inertia Analysis Co-inertia Analysis was first performed on 13C labeling data set at the end of the pulse period (4h) and explanatory variables (e.g. environmental, pigment and photosynthetic parameters). It revealed a strong and highly significant co-structure between the PCAs of the initial label incorporation (4h) and explanatory variables (Rv = 0.56; p = 0.004). Two main axes summarized the variance common to both data sets (bar diagram Fig. 7.7A); both axes determined 92 % of the variances of initial label incorporation and explanatory variables. The third axis is not discussed since it represented a basic thermal gradient accounting for only a small part of the variance. The two first axes expressed the major dynamics among three seasonal clusters.
The first axis opposed high productivity months (February and April) to lower productivity months (June, August, October, and December), whereas the second axis opposed summer/spring (April, June,

Part 2 Chapter 7
172
and August) to winter/autumn (February, October, and December) (Fig. 7.7A). The February/April cluster had the highest synthesis rates of all determined carbon pools, except those of Arg-4N, DNA, PL1-MUFA, NL-MUFA, PL1-SFA and NL-SFA. These latter groups were relatively independent of the first axis and characterised the highest synthesis rates in June/August in opposition to low synthesis rates in October/December along the second axis (Fig. 7.7A; 7.7E). The highest synthesis rates encountered in February/April were consistently associated to high concentrations of light harvesting pigments, a well-functioning photosynthetic apparatus (higher Ek and ETRmax), and higher inorganic nutrient contents. The second axis was strongly positively related to temperature and PAR, ETRmax and Ek, and negatively from June/August to October/December with alpha (i.e. the photosynthetic parameter for affinity to light), β-carotene content, phosphate concentrations and ammonium concentration in the overlying water (Fig. 7.7C).
The second Co-inertia Analysis was done between the determined 13C labeling data at day 3, when label distribution had more or less stabilized, and explanatory variables, and was also significant (Rv = 0.53; p = 0.009). The two first Co-inertia axes explained 95 % and 91 % of the variances of explanatory variables and day 3 compounds respectively. The general pattern after 3 d was rather similar to the 4 h analysis, except for arginine and PL1-PUFA (Fig 7.7). Although the trends in these two compounds remained relatively independent in both data sets, their positions swap between the first (t = 4h; Fig 7.7E) to the second analysis (t=3 days; Fig. 7.7F). Complementary, and in contrast with other compounds, arginine and PL1-PUFA 13C loss dynamics during summer were different than in other seasons. Figure 7.8 shows that more 13C label was found in arginine in summer and suggested a fast production followed by limited turnover, whereas during other months arginine production proceeded till day 3. PL1-PUFA showed a reverse trend compared to arginine (Fig. 7.8; Supplementary Tables 7.S3 and 7.S4).

7
Seasonal changes in the biochemical fate of carbon fixed by diatoms
173
Fig.7.7. Results of the Co-Inertia Analysis; A, C, and E, relationships between production (13C label incorporation between 0 and 4h) and explanatory variables; B, D, and F, relationships between the 13C label content at day 3 and explanatory variables. A. Co-structure between the patterns of production (black dots) and explanatory variables (arrow tip); arrow length indicates the lack of fitting. Pearson's correlation coefficients between the coordinates (black dot versus their respective arrow tip) on the first axis: r = 0.89, p <

Part 2 Chapter 7
174
00
10
20
30
40
50
FEB APR JUN AUG OCT DEC
% o
f tot
al P
L1
4 h DAY 30
5
10
15
FEB APR JUN AUG OCT DEC
% o
f tot
al a
min
o ac
ids
4h DAY 3
Arginine
PL1 PUFA
0.001. On the second axis: r = 0.73, p = 0.007. B. Co-structure between day 3 and explanatory variables (Axis 1, r = 0.85, p < 0.001; Axis 2, r = 0.72, p = 0.008). Eigenvalue diagrams (bars represent axis variances): A. axis 1 (horizontal) and 2 (vertical), 74 % and 18 % respectively; B. axis 1 (horizontal) and 2 (vertical), 69 % and 25 % respectively. C and E, production and day 3 variables respectively. D and F, explanatory variables. “d” indicates the grid scale. The notation of the various parameters is explained in table 7.2. Fig. 7.8. Relative arginine and PL1-PUFA 13C label incorporation at respectively t = 4h and t = day3. Both arginine and PL1-PUFA dynamics were different in summer compared to other seasons.

7
Seasonal changes in the biochemical fate of carbon fixed by diatoms
175
Exp
lana
tory
var
iabl
esP
rodu
ctio
n pa
ram
eter
s
PA
RP
hoto
synt
hetic
ally
Act
ive
Rad
iatio
n (4
00-7
00 n
m)
durin
g la
belin
gCa
rboh
ydra
tes
Tse
dSe
dim
ent T
empe
ratu
reG
LC
Glu
cose
; Sto
rage
Car
bohy
drat
eC
HO
str
ucSt
ruct
ural
Car
bohy
drat
esPh
otos
ynth
etic
Par
amet
ers
ET
RM
axR
elat
ive
max
imum
rea
ched
Ele
ctro
n T
rans
port
rat
eE
PS
Ext
race
llula
r P
olym
eric
Sub
stan
ces
αL
ight
aff
inity
coe
ffic
ient
in th
e lig
ht li
mite
d re
gion
of
the
rapi
d lig
ht c
urve
Ek
(min
imum
) L
ight
sat
urat
ion
irrad
ianc
eAm
ino
Acid
sA
A-1
NA
min
o A
cids
con
tain
ing
one
Nitr
ogen
ato
mPi
gmen
tsL
ys-2
NA
min
o A
cids
(L
ysin
e) c
onta
inin
g 2
Nitr
ogen
ato
ms
β-C
AR
Oβ-
Car
oten
eH
is-3
NA
min
o A
cids
(H
istid
ine)
con
tain
ing
3 N
itrog
en a
tom
sC
LA
Chl
orof
yll a
Arg
-4N
Am
ino
Aci
ds (
Arg
inin
e) c
onta
inin
g 4
Nitr
ogen
ato
ms
CL
C
Chl
orof
yll c
DIA
DD
iadi
noxa
nthi
nNe
utra
l Lip
id-d
eriv
ed F
atty
Aci
dsD
IAT
Dia
toxa
nthi
nN
L-S
FA
Neu
tral
Lip
id-d
eriv
ed S
atur
ated
Fat
ty A
cids
PH
OR
Phe
opho
rbid
eN
L-M
UF
AN
eutr
al L
ipid
-der
ived
Mon
o U
nsat
urat
ed F
atty
Aci
dsF
UC
O
Fuco
xant
hin
NL
-PU
FA
Neu
tral
Lip
id-d
eriv
ed P
oly
Uns
atur
ated
Fat
ty A
cids
PH
YT
Phe
ophy
tinPo
lar L
ipid
-der
ived
Fat
ty A
cids
Nutri
ents
PL
1-SF
AP
olar
Lip
id 1
-der
ived
Sat
urat
ed F
atty
Aci
dsw
-NH
4W
ater
col
umn
Am
mon
ium
P
L1-
MU
FA
Pol
ar L
ipid
1-d
eriv
ed M
ono
Uns
atur
ated
Fat
ty A
cids
w-N
O2
Wat
er c
olum
n N
itrite
P
L1-
PU
FA
Pol
ar L
ipid
1-d
eriv
ed P
oly
Uns
atur
ated
Fat
ty A
cids
w-N
O3
Wat
er c
olum
n N
itrat
eP
L2-
SFA
Pol
ar L
ipid
2-d
eriv
ed S
atur
ated
Fat
ty A
cids
w-P
O4
Wat
er c
olum
n P
hosp
hate
PL
2-M
UF
AP
olar
Lip
id 2
-der
ived
Mon
o U
nsat
urat
ed F
atty
Aci
dsw
-Si
Wat
er c
olum
n Si
licat
eP
L2-
PU
FA
Pol
ar L
ipid
2-d
eriv
ed P
oly
Uns
atur
ated
Fat
ty A
cids
pw-N
H4
Por
e w
ater
Am
mon
ium
pw
-NO
2P
ore
wat
er N
itrite
Nu
clei
c Ac
ids
pw-N
O3
Por
e w
ater
Nitr
ate
DN
AD
esox
yrib
onuc
leic
aci
dpw
-PO
4P
ore
wat
er P
hosp
hate
RN
AR
ibon
ucle
ic a
cid
pw-S
iP
ore
wat
er S
ilica
te
Table 7.2. Explanatory and production parameter notation

Part 2 Chapter 7
176
Discussion In this in-situ study the carbon flow within a benthic diatom mat was investigated by following the 13C-labeling dynamics in various cellular compounds. At regular intervals of two months during one year the fate of carbon fixation was followed and related to a number of environmental and photosynthetic parameters. The high isotopic enrichment of glucose indicated that the majority of photosynthetically fixed carbon was initially invested into intracellular chrysolaminaran, and to a lesser extent into storage lipids that however also gained substantial label especially in summer. The incorporated 13C label in storage compounds disappeared quickly and was partially used for the production of structural cell material. Our data suggest that most of the incorporated 13C label was probably lost, either through diatom respiration directly or through EPS secretion followed by EPS loss to the overlying water or degradation by bacteria (Goto et al., 2001; Hanlon et al., 2006). Unfortunately, due to our in-situ experimental design, loss processes such as respiration and exchange with the overlying water, could neither be determined nor distinguished. The strong initial enrichment of storage compounds in combination with the low labeling of structural compounds suggested that the dense diatom mat was unable to acquire enough nutrients for the synthesis of N or P containing structural cell material during the period of photosynthesis and hence that the fixed carbon was mainly stored as reserve material or excreted as EPS. It appeared that the transport of nutrients in the dense diatom mat was diffusion limited resulting in limited production of structural compounds (Stewart, 2003). However, benthic diatoms were able to produce structural compounds such as DNA and RNA during the chase period either by taking up nutrients from the overlying water during immersion or by migrating deeper into the sediment where nutrients are available in higher concentrations. Hence, it seems that photosynthesis and synthesis of structural cell components in the diatom mat were temporally separated (Mitbavkar & Anil, 2004; Underwood et al., 2005). As the production of non-nitrogenous carbohydrates predominated in all seasons, resulting in a high C:N ratio of the diatom mat, the nutritional value of the diatom mat for higher trophic levels may have been low (Brown et al., 1997; Jones & Flynn, 2005) .
The diatom mat partitioned the fixed carbon between the measured carbon pools in a way that was remarkably different in summer compared to the rest of the year. In the summer months June and August more neutral storage lipids were synthesized, which could hint to a stress situation for the diatom mat (Guschina & Harwood, 2006). The co-inertia

7
Seasonal changes in the biochemical fate of carbon fixed by diatoms
177
analysis revealed that the observed metabolic change of the fate of carbon fixed by benthic diatoms in summer significantly correlated to low inorganic nutrient availability and high temperature and PAR. This is in line with the general conception that under unfavorable environmental conditions such as desiccation, nutrient deficiency, high light intensity and/or high temperature, algae can alter their lipid biosynthetic pathways towards the formation and accumulation of neutral lipids, mainly in the form of triacylglycerides (TAGs) (Guschina & Harwood, 2006; Fields et al., 2014; Levitan et al., 2015). Both temperature and PAR can fluctuate immense at the sediment surface especially during the summer season (Ser & Catarino, 1999). Produced TAGs do not perform a role as structural compound, but primarily serve as a storage form of carbon and energy (Hu et al., 2008). In addition, there is evidence suggesting that TAG synthesis plays a more active role in stress response of diatoms and may serve as an electron sink. Under stress conditions excess electrons that accumulated in the photosynthetic electron transport chain may induce excess of reactive oxygen species, which may in turn inhibit photosynthesis and cause damage to membrane lipids, protein and other macromolecules (Hu et al., 2008). For instance, the formation of a C18 fatty acid consumes approximately twice the NADPH derived from the electron transport chain that is required for the synthesis of a similar mass of carbohydrate or protein (Hu et al., 2008). In addition, accumulation of lipids may be more advantageous during summer because lipids contain twice the energy stored per carbon atoms than that of carbohydrates and lipids save intracellular storage space due to their relative compactness (Rawat et al., 2013). The observed DNA/RNA ratios were high in summer and suggested a higher cell division rate (i.e. growth) of the diatoms than in other seasons. It seems unlikely that the higher DNA synthesis rates in summer are related to the exposure of high irradiance levels (possible in combination with high ultraviolet irradiance (Buma et al., 1996)), because Peletier et al. (1996) found that, in contrast to pelagic species, benthic diatoms are adapted to high irradiance levels and cell division rates are not influenced. However, the combination of higher DNA synthesis rates and suggested experienced environmental stress factors (e.g. observed low inorganic nutrient concentrations) seems contradictory. The DNA synthesis in summer suggested at least nutrient replete conditions. However, it is known that besides inorganic nitrogen there are several possible sources of organic nutrients that can be utilized by diatoms (Berman & Bronk, 2003). For example, urea can be an important nitrogen source for microphytobenthos (Veuger & Middelburg, 2007). Although

Part 2 Chapter 7
178
we did not determine urea concentration, faunal exuded urea is likely to be important and may serve as a nitrogen source in summer, as C. volutator and P. ulvae were present in high numbers (Therkildsen & Lomstein, 1994). Urea is a highly polar molecule and cannot freely diffuse across cell membranes (Levin et al., 2009). Moreover, urease, which is required for metabolizing urea, is localized in the mitochondria. This implies that exogenous urea must be transported not only across the plasma membrane of the diatom but also across the mitochondrial membrane through active urea transporters (Oakley, 2010). If faunal excreted urea would be an important organic nutrient in summer, it would explain the observed increase of PL1-SFA and PL1-MUFA during summer months at the cost of lower PL1-PUFA synthesis. These lipid-derived fatty acids might play a role as part (or precursor) of urea transporters, also called ‘lipid rafts’ (Chen, 2013). Lipid rafts are specialized regions of the cell membrane that are enriched of lipids with a high degree of saturation that are involved in the transport of urea across the cell membrane (Chen, 2013). In addition, we observed higher synthesis rates of arginine during summer. Arginine is an intermediate of the urea cycle (Armbrust et al., 2004) suggesting again that urea may be an important nitrogen source in summer (Allen et al., 2011; Prihoda et al., 2012). Most likely, the use of urea as nitrogen source and the stressful fluctuations in temperature and PAR are the main factors responsible for the observed metabolic changes of the diatom mat during summer.
During high rates of carbon fixation (i.e. in February/April) a large part of the photo-assimilated carbon is excreted as EPS. Stal (2010) hypothesized that EPS are produced as the result of unbalanced growth (i.e. when fixed CO2 is converted to intracellular storage carbohydrate, but the capacity of storage is limited and the excess carbon fixation is exuded). Especially during the highly productive months of February and April, EPS production might function as outlet valve for excess energy. Subsequently, EPS production decreased during lower productive months in June, August, October and December, which confirms a close coupling between EPS production and photosynthesis and agrees with other reports (Pierre et al., 2014). A different function of excreted EPS between summer and other seasons could be hypothesized. The reason to exude carbon in February and April is presumably due to the above suggested nutrient diffusion limitation of the dense diatom mat and subsequent unbalanced growth. However, in summer the reason to exude carbon might be more related to motility as the diatom mat has to overcome the effects of bioturbation (e.g. sediment burial) and to avoid stressful conditions like high light levels in the very top of the sediment (Consalvey

7
Seasonal changes in the biochemical fate of carbon fixed by diatoms
179
et al., 2004). EPS is an important factor in sediment stabilization (Stal, 2010). Visual observations confirmed that cohesive sediment structures were obtained when a high percentage of the fixed carbon was excreted as EPS (i.e. in February, April, October, and December); by contrast in summer less cohesive structures were obtained. The high EPS loss that occurs within a day after the start of the experiment suggests that EPS was either consumed by bacteria (Goto et al., 2001), re-absorbed by the benthic diatoms (Miyatake et al., 2014), or washed away by tidal immersion (Hanlon et al., 2006).
The relative 13C carbon pool proportioning of the diatom mat in October and December was similar as in February and April, however the synthesis rate of all determined carbon pools was much lower. The high content of β-carotene and the increased light affinity coefficient (α) suggested that the diatom mat was limited by light due to the shortening day lengths and the decreased irradiance at the end of the year. In addition, the low light angle of the sun would have reflected much of the light during these months of the year (Pinckney & Zingmark, 1991). In combination with chlorophyll the higher content of β-carotene extended the wavelength range of usable light to photosynthesize (Kuczynska et al., 2015). Chlorophyll a is the primary pigment for photosynthesis in diatoms, but the range of light absorption can be extended by inter alia β-carotene which increases the efficiency of photosynthesis by absorbing blue-green light and transferring this energy to chlorophyll (that absorbs mainly red-blue light) (Telfer, 2002). In winter and especially in February, PUFA synthesis of the NL, PL1 and PL2 pools was important. We hypothesize that this served to maintain cell membrane fluidity and flexibility at lower temperatures (Jiang & Gao, 2004; Sakthivel, 2011).
The diatom mat in this study was a compact and complex conglomerate up to 40 diatom taxa varying between seasons in species composition, size, motility and productivity. Pigment signatures confirmed diatoms were the dominant microphytobenthic species. The visually observed variation in diatom density during the day and between months is probably due to daily migrations of the diatoms and biomass differences between months respectively. It is known that the diatom community composition changes as a result of seasonal and multiannual variability in environmental conditions (Underwood & Barnett, 2006). In this study, grazing could have been an important factor for the overall observed decrease of biomass in summer. Also seasonality in nutrient availability could have affected the composition of diatom assemblages as the growth rate of certain species are more affected by the available nitrogen source than others (Thornton et al., 2002; Litchman et al., 2009).

Part 2 Chapter 7
180
Although this study determined four major classes of organic compounds, there were still many compounds outside the applied analytical window, such as amino sugars, lectins, acidic carbohydrates, pigments, and quinones. In addition, recovery losses and analytical limitations of the determination of the major classes of biopolymers may have added to the unexplained part of the 13C TOC labeling (Lee et al., 2004). The biochemical composition of the sediment organic matter suggested that major amounts of detritus were present in the sediment and that therefore only a fraction was derived from living organisms. However, by combining the latest compound specific stable isotope techniques with in-situ labeling this study succeeded to detect the major classes of organic compounds directly derived from living organisms and in this way contributed to the unraveling of the metabolic pathways of photosynthetic acquired carbon within a diatom mat and there metabolic responses to changing condition through the year.
Acknowledgements
We thank Erwin Moerdijk, Wanda Moerdijk, Jelle Moerdijk, Jurian Brasser and Gerjan de Ruiter for assisting in the field sample collection and processing of samples in the laboratory.
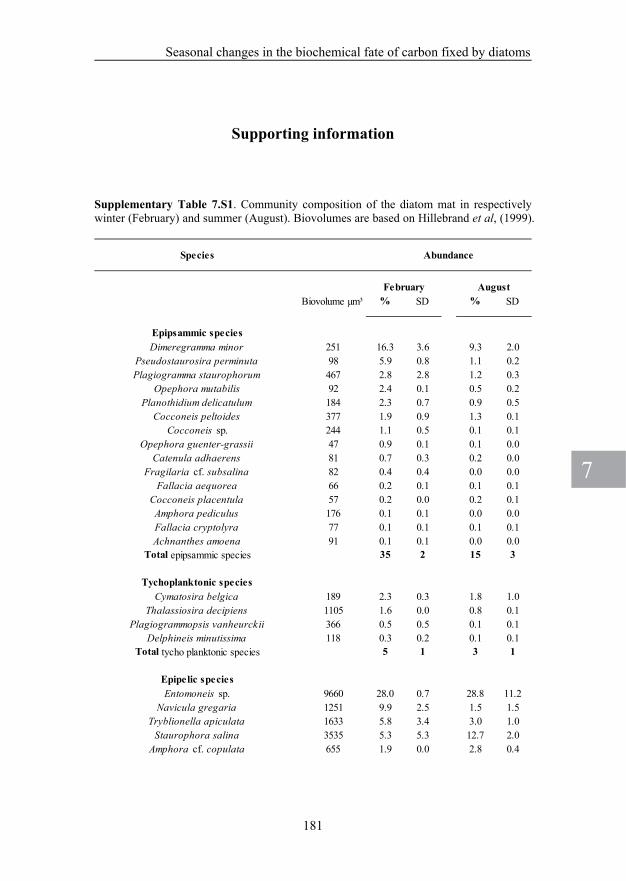
7
Seasonal changes in the biochemical fate of carbon fixed by diatoms
181
Species
Biovolume µm³ % SD % SD
Epipsammic speciesDimeregramma minor 251 16.3 3.6 9.3 2.0
Pseudostaurosira perminuta 98 5.9 0.8 1.1 0.2Plagiogramma staurophorum 467 2.8 2.8 1.2 0.3
Opephora mutabilis 92 2.4 0.1 0.5 0.2Planothidium delicatulum 184 2.3 0.7 0.9 0.5
Cocconeis peltoides 377 1.9 0.9 1.3 0.1Cocconeis sp. 244 1.1 0.5 0.1 0.1
Opephora guenter-grassii 47 0.9 0.1 0.1 0.0Catenula adhaerens 81 0.7 0.3 0.2 0.0
Fragilaria cf. subsalina 82 0.4 0.4 0.0 0.0Fallacia aequorea 66 0.2 0.1 0.1 0.1
Cocconeis placentula 57 0.2 0.0 0.2 0.1Amphora pediculus 176 0.1 0.1 0.0 0.0Fallacia cryptolyra 77 0.1 0.1 0.1 0.1Achnanthes amoena 91 0.1 0.1 0.0 0.0
Total epipsammic species 35 2 15 3
Tychoplanktonic speciesCymatosira belgica 189 2.3 0.3 1.8 1.0
Thalassiosira decipiens 1105 1.6 0.0 0.8 0.1Plagiogrammopsis vanheurckii 366 0.5 0.5 0.1 0.1
Delphineis minutissima 118 0.3 0.2 0.1 0.1Total tycho planktonic species 5 1 3 1
Epipelic speciesEntomoneis sp. 9660 28.0 0.7 28.8 11.2
Navicula gregaria 1251 9.9 2.5 1.5 1.5Tryblionella apiculata 1633 5.8 3.4 3.0 1.0
Staurophora salina 3535 5.3 5.3 12.7 2.0Amphora cf. copulata 655 1.9 0.0 2.8 0.4
Abundance
February August
Supporting information Supplementary Table 7.S1. Community composition of the diatom mat in respectively winter (February) and summer (August). Biovolumes are based on Hillebrand et al, (1999).

Part 2 Chapter 7, Supporting information
182
Species
Biovolume µm³ % SD % SD
Navicula arenaria var. rostellata 2227 1.7 1.7 1.4 1.4Amphora laevis var. laevissima 564 1.6 0.0 0.5 0.5
Amphora coffeaeformis 1837 1.3 1.3 3.0 1.5Cosmioneis sp. 1251 0.9 0.9 0.0 0.0
Navicula phyllepta 451 0.7 0.0 4.1 0.3Navicula sp. 1 276 0.6 0.6 0.8 0.8
Navicula flanatica 679 0.5 0.5 0.0 0.0Haslea sp. 679 0.5 0.5 0.0 0.0
Navicula perminuta 84 0.4 0.1 0.2 0.0Seminavis sp. 524 0.4 0.4 0.2 0.2
Diploneis aestuarii 251 0.4 0.4 0.0 0.0Navicula microdigitoradiata 432 0.3 0.3 2.3 0.2
Fallacia clamans 77 0.1 0.1 0.0 0.0Incertae sedis 1 451 0.0 0.0 2.1 0.6
Nitzschia cf. dissipata 318 0.0 0.0 0.1 0.1Fallacia pygmaea 2225 0.0 0.0 6.1 0.6
Psammodictyon panduriforme var. delicatulum 596 0.0 0.0 0.2 0.2Fallacia forcipata 1301 0.0 0.0 1.2 1.2
Amphora sp. 2 180 0.0 0.0 0.4 0.1Delphineis surirella 1131 0.0 0.0 0.3 0.3
Tryblionella coarctata 2969 0.0 0.0 0.9 0.9Amphora lineolata 1837 0.0 0.0 1.1 1.1
Gyrosigma sp. 3 8863 0.0 0.0 8.1 8.1Amphora sp. 1 564 0.0 0.0 0.2 0.2
Total epipelic species 9 1 33 4
Abundance
February August

7
Seasonal changes in the biochemical fate of carbon fixed by diatoms
183
Exp
lana
tory
var
iabl
es
Sam
ple
Sam
ple
Dat
eL
ow T
ide
pw-N
H4
pw-N
O2
pw-N
O3
pw-P
O4
pw-S
ipw
-N:P
h
FE
B A
21-F
eb-1
111
:40
491.
316
476
18A
PR
A4-
Apr
-11
11:0
610
60.
87
472
17JU
N A
14-J
un-1
18:
4624
0.2
11
3940
AU
G A
15-A
ug-1
111
:36
220.
51
391
26O
CT
A10
-Oct
-11
9:24
670.
56
1511
98
DE
C A
12-D
ec-1
110
:25
360.
812
344
16
FE
B B
21-F
eb-1
111
:40
450.
918
240
18A
PR
B4-
Apr
-11
11:0
610
10.
57
379
24JU
N B
14-J
un-1
18:
4629
0.2
11
4036
AU
G B
15-A
ug-1
111
:36
310.
41
478
21O
CT
B10
-Oct
-11
9:24
480.
57
910
112
DE
C B
12-D
ec-1
110
:25
390.
910
343
14
µm
ol L
-1
Nut
rien
ts p
ore
wat
er
Exp
lana
tory
var
iabl
es
Sam
ple
Sam
ple
Dat
eL
ow T
ide
PA
R
Tse
dβ-
CA
RO
CL
AC
LC
D
IAD
DIA
TP
HO
RFU
CO
P
HY
TE
TR
Max
αE
kw
-NH
4w
-NO
2w
-NO
3w
-PO
4w
-Si
w-N
:P
hµ
E m
-2 s
-1ºC
µE
m-2
s-1
FE
B A
21-F
eb-1
111
:40
1314
3.3
2258
657
4416
4321
944
800.
5614
29
1.7
481.
131
54A
PR
A4-
Apr
-11
11:0
652
778.
716
608
5941
2152
226
1725
70.
4162
13
0.8
380.
510
86JU
N A
14-J
un-1
18:
4658
9115
.614
365
4518
1015
124
818
20.
5533
410
0.9
60.
86
23A
UG
A15
-Aug
-11
11:3
674
9219
.718
465
4218
1828
139
825
50.
5843
77
0.9
41.
29
10O
CT
A10
-Oct
-11
9:24
2484
12.5
2655
550
2023
3215
914
880.
6014
78
1.4
101.
410
14D
EC
A12
-Dec
-11
10:2
513
926.
427
460
5423
1830
139
3092
0.66
139
91.
320
1.3
2022
FE
B B
21-F
eb-1
111
:40
1314
4.1
2361
060
4716
4422
747
153
0.74
205
91.
748
1.1
3154
AP
R B
4-A
pr-1
111
:06
5277
9.7
1457
754
3820
5321
215
299
0.39
776
30.
838
0.5
1086
JUN
B14
-Jun
-11
8:46
5891
16.4
1437
945
1812
1712
98
198
0.55
360
100.
96
0.8
623
AU
G B
15-A
ug-1
111
:36
7492
21.2
1545
642
1815
2414
910
230
0.58
395
70.
94
1.2
910
OC
T B
10-O
ct-1
19:
2424
8412
.825
512
4617
2130
149
1482
0.62
132
81.
410
1.4
1014
DE
C B
12-D
ec-1
110
:25
1392
7.0
2642
349
2114
2713
326
990.
6614
99
1.3
201.
320
22
mg
m-2
µm
ol L
-1
Fie
ldP
igm
ents
PA
MN
utri
ents
wat
er
Supplementary Table 7.S2. Explanatory variables Co-inertia analysis

Part 2 Chapter 7, Supporting information
184
Pro
duct
ion
vari
able
s
Sam
ple
Sam
ple
Dat
eL
ow T
ide
PL
1-SF
AP
L1-
MU
FA
PL
1-P
UF
AP
L2-
SFA
PL
2-M
UF
AP
L2-
PU
FA
DN
AR
NA
hµ
mol
13C
m-2
h-1
FE
B A
21-F
eb-1
111
:40
94
610
106
0.04
0.26
AP
R A
4-A
pr-1
111
:06
143
812
810
0.15
1.43
JUN
A14
-Jun
-11
8:46
1510
25
43
0.09
0.22
AU
G A
15-A
ug-1
111
:36
146
27
43
0.29
0.53
OC
T A
10-O
ct-1
19:
241
10.
22
11
0.02
0.13
DE
C A
12-D
ec-1
110
:25
21
22
32
0.02
0.17
FE
B B
21-F
eb-1
111
:40
217
1016
138
0.07
0.55
AP
R B
4-A
pr-1
111
:06
92
69
65
0.13
0.99
JUN
B14
-Jun
-11
8:46
199
27
64
0.07
0.22
AU
G B
15-A
ug-1
111
:36
187
38
64
0.17
0.21
OC
T B
10-O
ct-1
19:
241
10.
32
22
0.07
0.13
DE
C B
12-D
ec-1
110
:25
42
24
43
0.02
0.16
µm
ol 13
C m
-2 h
-1µ
mol
13C
m-2
h-1
Pol
ar F
atty
Aci
dsN
ucle
ic A
cids
Pro
duct
ion
vari
able
s
Sam
ple
Sam
ple
Dat
eL
ow T
ide
GL
CC
HO
str
ucE
PS
AA
-1N
Lys
-2N
His
-3N
Arg
-4N
NL
-SF
AN
L-M
UF
AN
L-P
UF
A
h
FE
B A
21-F
eb-1
111
:40
800
4125
310
34.
761.
360.
8592
6055
AP
R A
4-A
pr-1
111
:06
1572
144
218
716.
011.
590.
3673
2376
JUN
A14
-Jun
-11
8:46
161
1313
101.
050.
660.
6341
292
AU
G A
15-A
ug-1
111
:36
581
6413
922
2.17
1.15
2.01
138
637
OC
T A
10-O
ct-1
19:
2468
531
70.
480.
180.
022.
72.
40.
2D
EC
A12
-Dec
-11
10:2
515
28
617
0.43
0.19
0.03
1511
8
FE
B B
21-F
eb-1
111
:40
958
6820
691
5.50
1.47
1.25
5731
35A
PR
B4-
Apr
-11
11:0
688
974
181
403.
891.
000.
2027
1024
JUN
B14
-Jun
-11
8:46
213
5614
151.
371.
890.
6649
293
AU
G B
15-A
ug-1
111
:36
434
5052
101.
680.
671.
3511
553
6O
CT
B10
-Oct
-11
9:24
778
256
0.52
0.20
0.20
3.8
3.4
0.3
DE
C B
12-D
ec-1
110
:25
207
1659
120.
680.
290.
1519
149
Car
bohy
drat
esA
min
o A
cids
Neu
tral
Fat
ty A
cids
µm
ol 13
C m
-2 h
-1µ
mol
13C
m-2
h-1
µm
ol 13
C m
-2 h
-1Supplementary Table 7.S3. Production parameters (0-4 h) used in the Co-inertia analysis

7
Seasonal changes in the biochemical fate of carbon fixed by diatoms
185
Day
3 v
aria
bles
Sam
ple
Sam
ple
Dat
eP
L1-
SFA
PL
1-M
UF
AP
L1-
PU
FA
PL
2-SF
AP
L2-
MU
FA
PL
2-P
UF
AD
NA
RN
A
FE
B A
24-F
eb-1
18
107
4934
761.
483.
17A
PR
A7-
Apr
-11
88
721
1322
3.20
7.19
JUN
A17
-Jun
-11
2017
914
1213
2.07
1.13
AU
G A
18-A
ug-1
116
149
2018
194.
003.
93O
CT
A13
-Oct
-11
1313
97
66
0.56
0.67
DE
C A
15-D
ec-1
19
97
43
70.
271.
16
FE
B B
24-F
eb-1
16
65
2011
181.
271.
08A
PR
B7-
Apr
-11
1110
925
1631
3.25
4.84
JUN
B17
-Jun
-11
2019
1110
1010
0.77
0.49
AU
G B
18-A
ug-1
113
117
2118
201.
892.
09O
CT
B13
-Oct
-11
1212
64
34
0.40
0.50
DE
C B
15-D
ec-1
18
75
1411
291.
144.
71
µm
ol 13
C m
-2µ
mol
13C
m-2
µm
ol 13
C m
-2
Pol
ar F
atty
Aci
dsN
ucle
ic A
cids
Day
3 v
aria
bles
Sam
ple
Sam
ple
Dat
eG
LC
CH
O s
truc
EP
SA
A-1
NL
ys-2
NH
is-3
NA
rg-4
NN
L-S
FA
NL
-MU
FA
NL
-PU
FA
FE
B A
24-F
eb-1
138
223
616
021
527
827
2037
8A
PR
A7-
Apr
-11
399
9219
412
018
513
2935
12JU
N A
17-J
un-1
118
616
920
335
44
5435
4A
UG
A18
-Aug
-11
725
186
7973
124
793
648
OC
T A
13-O
ct-1
187
5315
445
23
2115
1D
EC
A15
-Dec
-11
5810
3611
21
16
112
FE
B B
24-F
eb-1
126
218
017
711
313
49
35.1
31.6
5.3
AP
R B
7-A
pr-1
124
410
420
112
717
615
2023
5JU
N B
17-J
un-1
114
917
717
173
22
3427
3A
UG
B18
-Aug
-11
378
121
2384
135
886
568
OC
T B
13-O
ct-1
127
2440
456
34
44
0D
EC
B15
-Dec
-11
232
128
5141
73
517
385
µm
ol 13
C m
-2
µm
ol 13
C m
-2
µm
ol 13
C m
-2
Car
bohy
drat
esA
min
o A
cids
Neu
tral
Fat
ty A
cids
Supplementary Table 7.S4. Day 3 labeling parameters as used in the Co-inertia analysis

Part 2 Chapter 7, Supporting information
186

Seasonal changes in the production of extracellular polymeric substances and its fate to the heterotrophic bacterial community in an intertidal diatom mat In preparation for Limnology and Oceanography Tanja C.W. Moerdijk-Poortvliet1, Olivier Beauchard1, Lucas J. Stal1,2, Henricus T.S. Boschker1 1NIOZ Royal Institute for Sea Research and Utrecht University, PO Box 140, 4401 AC Yerseke, the Netherlands. 2University of Amsterdam, Department of Aquatic Microbiology, PO Box 94248, 1090 GE Amsterdam, The Netherland
8 C
hapt
er

Part 2 Chapter 8
188
Abstract
In this in-situ study, the seasonal dynamics of extracellular polymeric substances (EPS) and short chain organic acids (SCOA) exuded by benthic diatoms and the use of these exudates as a carbon source by heterotrophic bacteria were investigated. By using an in-situ 13C pulse-chase method the fate of EPS was followed for 5 consecutive days. These labeling experiments were done at 2-month intervals during one year. The EPS were recovered from the sediment as two operational defined fractions (i.e. water-extractable and EDTA-extractable EPS). In addition, a variety of environmental parameters and photosynthetic characteristics was measured. The EPS consisted mostly of carbohydrates with a small contribution from amino acids. The production rates of the carbohydrates and amino acids in the EPS fractions were remarkably different between seasons. This resulted in a more heterogeneous composition of the EPS in spring and summer when compared to the rest of the year and suggested a different function for these exopolymers. The seasonal differences of EPS production correlated to differences in light intensity and temperature. The role of the extracellular amino acids was conceived as to interconnect polysaccharide chains in the EPS and hence forms a structure that is important for adhesion of the diatom cell and for defense against grazing. In order to compare our results with other studies that use another operational defined fraction (e.g. the artificial seawater/DOWEX cation-exchange protocol), a comparison of EPS extraction protocols was made. No difference was found between water-extractions using Milli-Q or artificial seawater, however large differences were found between EDTA and DOWEX extractions. Although both methods extracted the same type of EPS in terms of composition, the EDTA extraction was 4-fold more efficient compared to the DOWEX agent. From February until June the biomass and production of diatoms and bacteria were closely coupled. It was concluded that SCOA were the most important substrates for the bacteria. Especially sulfate reducing bacteria (SRB) benefited from associating with SCOA-releasing diatoms. From August on, the coupling of biomass and production of diatoms and bacteria became less strong and was almost lost in December. During the period of August until December, EPS produced by diatoms promoted the growth of other bacterial taxa rather than SRB, and the production of SCOA was low. The seasonal variation of exudates produced by diatoms therefore played an important role in shaping the community composition and diversity of the associated bacteria.

8
Seasonal changes in the production and fate of EPS
189
Introduction
Intertidal sediments support extensive and diverse populations of microorganisms, which develop complex microbial communities. In temperate regions benthic diatoms are the dominant organisms of the microphytobenthic communities and they contribute a major part of the total autotrophic production in these intertidal benthic ecosystems (Admiraal et al., 1984; MacIntyre & Cullen, 1996; Underwood & Kromkamp, 1999). Diatoms may be abundantly present and the biofilms they produce color the sediment surface brown. These benthic diatom mats exhibit high rates of photosynthesis and a substantial proportion of the inorganic carbon they fix may be exuded into the environment as extracellular polymeric substances (EPS) or short chain organic acids (SCOA) (Mc Kew et al., 2013; Underwood & Paterson, 2003). EPS and SCOA-releasing diatoms stimulate bacterial growth and the variety of compounds produced likely plays a role in generating and maintaining bacterial diversity (Amin, 2012).
EPS are exuded as a mechanism to allow motility of diatoms, which is essential for epipelic species because it enables them to migrate in and out the photic zone, following the tides (Consalvey et al., 2004). However, EPS are also exuded through other mechanisms and play an important role in the ecology of diatom mats (Edgar & Pickett-Heaps, 1984). EPS are sometimes produced as the result of unbalanced growth (i.e. growth that does not lead into proportional synthesis of the cell’s structural components because the essential nutrients (e.g. nitrogen, phosphorus, sulfur and iron) are lacking or limiting and components are synthesized that lack these nutrients (e.g. carbohydrates and lipids)) (Stal, 2010). Because the cell’s storage capacity is limited, excess fixed carbon is exuded as EPS. After exudation, EPS cumulate in the surficial sediments where they can be degraded by bacteria, or washed away during tidal immersion and/or become part of the sediment structure (Yallop et al., 1994; Stal, 2010; Taylor et al., 2013). Depending on environmental conditions and the nutrient concentrations, EPS are low-molecular dissolved compounds or consist of more complex colloidal or gel-like material, such as mucilage. The diatoms and this mucilage form together with the sediment particles a coherent structure - the biofilm or mat - that stabilizes the sediment surface and avoids re-suspension of the diatoms. In addition, the EPS may act as a protector of the diatoms from environmental stresses, such as changes in temperature, salinity, nutrient availability, desiccation and UV radiation (Hoagland et al., 1993; Underwood & Paterson, 2003). EPS does provide a carbon source to the

Part 2 Chapter 8
190
benthic food web, which includes heterotrophic bacteria (Middelburg et al., 2000).
There is no universal EPS extraction method available and many different protocols have been published in the literature. Extracted EPS should therefore be considered as operationally defined and results between studies that used different protocols are therefore difficult to compare. In this study, water- and ethylenediaminetetraacetic acid (EDTA) extraction protocols were used. These extracts differ considerably in their composition and their production seems to be under a different metabolic control (Miyatake et al., 2014). Water-extractable EPS (in literature also referred to as colloidal EPS) are thought to be intimately associated with the diatoms or occur as colloid material in the (pore) water and are probably readily used by heterotrophic bacteria. EDTA-extractable EPS (in literature also referred to as bound EPS) are tightly bound to the sediment, and are thought to be more recalcitrant to microbial degradation (Stal, 2003). The EDTA-extractable EPS contain acid moieties such as uronic acids and sulfate-groups that interconnect the polymers by multivalent cations such as Ca2+. The addition of EDTA to the samples removes these cations and the cation bridges, resulting in the release of this type of EPS. Another protocol uses a cation-exchange resin as a substitute for EDTA (Takahashi et al., 2010) and was applied in-situ by Pierre et al. (2010, 2012, 2014).
The EPS formation by benthic diatoms has been extensively studied, however, thus far most studies were done in pure cultures and/or focused on the measurement of the content of EPS fractions thereby neglecting effects of community interactions, production and turnover rates of these exudates (Smith & Underwood, 1998; Pierre et al., 2014). Most research has been carried out on the dominant carbohydrate component of these exudates, which is undoubtedly important in sediment carbon cycling (Bellinger et al., 2009; Oakes et al., 2010; Taylor et al., 2013). However, EPS may also contain proteins, lipids, nucleic acids and other biopolymers such as humic substances (Flemming & Wingender, 2010). Carbohydrates are known to be major intermediates in the rapid transfer of carbon between diatoms and heterotrophic bacteria (Middelburg et al., 2000; Evrard et al., 2008; Bellinger et al., 2009; Taylor et al., 2013). Besides gaining knowledge on EPS dynamics, understanding interactions between diatoms and heterotrophic bacteria is important as they modify each other’s behavior and eventually impact biogeochemical cycles (Bruckner et al., 2011; Amin et al., 2012).
The aim of this study was to characterize the biochemical composition and production patterns of EPS from an intertidal benthic

8
Seasonal changes in the production and fate of EPS
191
diatom mat through their carbohydrate and amino acid content, and to trace the carbon flow to the heterotrophic bacteria in-situ and follow the seasonal changes of these processes. By using an in-situ 13C pulse-chase method (Middelburg et al., 2000) in combination with liquid chromatography isotope ratio mass spectrometry (LC/IRMS) it was possible to follow the fate of the applied 13C label from carbon fixation to EPS and SCOA excretion and subsequent utilization by heterotrophic bacteria (Moerdijk-Poortvliet et al., 2013). Phospholipid-derived fatty acid (PLFA) biomarker analysis was used to differentiate between benthic diatoms and different groups of heterotrophic bacteria.

Part 2 Chapter 8
192
Methods
Study site and in situ 13C labeling experiments In 2011, in-situ 13C-labeling experiments were carried out at approximately 2 months intervals at the Zandkreek intertidal mudflat, which is situated along the southern shore of the Oosterschelde estuary in the Southwest of the Netherlands (51°32'41”N, 3°53'22”E). The sampling site was located 0.15 m below the mean tidal level and the emersion period was approximately 6 h per tidal cycle. Bioturbating fauna such as the amphipod shrimp Corophium volutator and the hydrobiid snail Peringia ulvae became active starting late spring (June) gaining higher grazing rates resulting in a more mixed sediment top layer during summer. Detailed information on the study site and its sampling is described in chapter 7.
Experiments started immediately after emersion of the mudflat. Two 500×500 mm stainless steel frames were pushed into the sediment to a depth of 80 mm in order to constrain the labeling and the sampling area. The two frames were treated as duplicates (n =2) and were divided in a 100×100 mm sampling grid. Unlabeled control samples were taken just outside the frames as described below. The in-situ labeling experiment started by spraying the surface of the sediment within each frame with 200 mL of [13C] sodium bicarbonate (99 % 13C; Cambridge Isotope Laboratories, Andover, USA) with ambient salinity (30 ‰) to obtain a final concentration of 1 g 13C m-2 (Middelburg et al., 2000) .
The labeled sediment was sampled 2 and 4 h after label addition during the first low tide (the pulse-labeling period), and subsequently at 12h, 1 d, 2 d, 3 d, and 5 d exactly at low tide (the chase period). At each sampling time, pore water was collected from two randomly chosen positions within the sampling grid of each stainless steel frame using porous polymer sippers (Rhizon Soil Moisture Sampler; Eijkelkamp Agrisearch Equipment) inserted into the upper 15 mm of the sediment and these two samples were combined (total ~5 ml). For each stainless steel frame, 1 mL of pore water was injected into airtight headspace vials and analyzed for 13C-DIC (dissolved inorganic carbon) and the remainder was used for inorganic nutrient analysis and short chain organic acid (SCOA) analysis. Water column nutrient data were obtained from the NIOZ monitoring program from a station 500 m away from our experimental site.
Sediment samples were collected and mixed from two randomly chosen positions within the sampling grid of each steel frame. The top 15 mm of the sediment was collected by pushing a core liner (inside diameter

8
Seasonal changes in the production and fate of EPS
193
10 cm) into the sediment to a depth of 50 mm and subsequently the top 15 mm of the sediment was sampled with a spatula (Middelburg et al., 2000). The corer was removed and the sampling hole was filled with unlabeled sediment collected just outside the experimental area. The two sediment samples taken from each steel frame area were homogenized and subsampled for the various analyses. Samples for fatty acids (FA) were directly frozen in liquid nitrogen and subsequently lyophilized and stored at -20 oC until analysis. Pigment samples were also directly frozen in liquid nitrogen and were subsequently stored at -80 oC prior to analysis. Sediment samples for EPS extraction were transported to the laboratory and processed as described in Miyatake et al. (2014) within 30 min after sampling. For all experiments, two operationally defined EPS were extracted: water-extractable EPS (EPS MQ) using freshly prepared Milli-Q water (MQ, 18.2 MΩ, DOC free, Millipore, Bedford, MA, USA) and EDTA-extractable EPS (EPS EDTA). To ~4 g wet weight of the homogenized sample 4.5 mL Milli-Q water was added for EPS MQ extraction as described in de Brouwer and Stal (2001). Samples were shaken for 1 h at 30 oC in the dark and the supernatant was collected after centrifugation at 4,000 × g for 15 min and stored at -20 oC. The sediment pellet was re-extracted with 4.5 mL of 0.1 M EDTA by shaking for 4 h in the dark at room temperature. The supernatant was collected after centrifugation at 4000 × g for 15 min and stored at -20 oC. Both extracts were analyzed for carbohydrates (CHO) and amino acids (AA). In total four operationally defined EPS fractions were distinguished: CHO MQ, CHO EDTA, AA MQ and AA EDTA.
In order to compare our results with those of studies that use the DOWEX cation-exchange resin instead of EDTA, a comparison of both EPS extraction protocols was made. Hence, an additional 13C in-situ labeling experiment was performed in May 2012. Two experimental areas were treated with labeled substrate and were divided in a 100 × 100 mm sampling grid. Initially, unlabeled control samples were taken just outside the stainless steel frames (t = 0 h). Sampling of the labeled sediment was 24 h after label exposure. Sediment samples were collected and mixed from two randomly chosen positions within the sampling grid in decuple (n = 10). Samples were extracted for EPS according the method described above and in addition according to the method described in Pierre et al. (2010). For the latter method, ~4 g wet weight of the homogenized sample was extracted by adding 4.5 mL artificial seawater (ASW, salinity 30). Samples were shaken in the dark for 1 h at 4 oC and the supernatant was collected after centrifugation at 4,000 × g for 15 min and stored at -20 oC. The sediment pellet was re-extracted with 4.5 mL of ASW and 1 g of

Part 2 Chapter 8
194
activated Dowex Marathon C (cations exchange resin, activated in phosphate buffered saline (PBS) for 1 h in the dark), and shaken for 1 h in the dark at 4 oC. The supernatant was collected after centrifugation at 4,000 × g for 15 min and stored at -20 oC. The carbon content and isotopic composition of carbohydrates of the EPS fractions were analyzed by LC/IRMS (Boschker et al., 2008). Four operationally defined EPS fractions were obtained: EPS MQ, EPS EDTA, EPS extracted by artificial seawater (EPS ASW) and EPS extracted by activated Dowex Marathon C resin (EPS DOWEX). EPS MQ and EPS ASW were considered to represent the EPS that is associated with diatoms and loosely bound to the sediment and which can be readily used by heterotrophic bacteria. EPS EDTA and EPS DOWEX were considered to represent EPS that is tightly bound to the sediment and is to some extend recalcitrant to microbial degradation. Because the two EPS extraction protocols applied different temperatures, for comparison the extractions were done at 4 oC as well as at 30 oC.
In order to study dark fixation by chemoautotrophic and heterotrophic bacteria, two cores (70 mm inner diameter) were taken outside the experimental area and incubated in the dark for 4 h with the same amount of 13C-label (per m2) as used in the experimental area added to the top of the sediment. The top 15 mm of these cores was sampled and analyzed for PLFA labeling.
Miniaturized pulse amplitude modulated (PAM) fluorimetry (Mini-PAM, Walz GmbH, Effeltrich, Germany) was used to measure photosynthetic parameters. Intact sediment cores of the diatom mat were taken in duplicate. Rapid light curves (RLCs) were recorded simultaneously with the pulse-labeling period. Prior to RLCs recording, samples were dark adapted for 15 min to relax photochemical quenching. Subsequently, RLCs were recorded with 12 incremental irradiance steps of 20 s. From these data the relative maximum photosynthetic electron transport, the light affinity coefficient (alpha), and the light saturation irradiance were determined (Serôdio et al., 2005).
During the 13C label incorporation and RLCs recordings, PAR (400-700 nm) was measured on site every 15 min by a LICOR light meter (LI-250A) connected to a quantum sensor (Li-cor, Lincoln, NE, USA). Throughout the year a PAR sensor (Licor, LI 191) connected to a data logger (Licor, LI-1000), located 10 km from the study area, measured PAR values every minute; data were averaged and logged hourly.
8
Seasonal changes in the production and fate of EPS
195
Analytical procedures For DIC analysis, pore water samples were acidified by adding 0.1 mL of 19 M phosphoric acid (Miyajima et al., 1995) and headspace gas was analyzed by elemental analyzer/isotope ratio mass spectrometry (EA/IRMS) in order to determine the concentration and isotopic composition of DIC (Boschker et al., 1999).
Carbon content and isotopic composition of EPS and SCOA were analyzed by LC/IRMS. For carbohydrates, 4 mL EPS extract were hydrolyzed to monosaccharides under acidic conditions using a modified method according to Cowie and Hedges (1984). The method was modified by neutralizing the hydrolyzed samples with barium carbonate instead of strontium carbonate, which resulted in an increased yield of the extract. For the EPS EDTA extracts the EDTA was removed from the hydrolyzed samples as described in Moerdijk-Poortvliet et al. (2013). Carbohydrates were analyzed by LC/IRMS as described in Boschker et al. (2008). For amino acids, 4 mL EPS extract were hydrolyzed with 6 M HCl for 20 h at 110 oC and subsequently purified by cation exchange chromatography (Veuger et al., 2005) and analyzed by LC/IRMS as described in McCullagh et al. (2006). SCOA were analyzed without additional sample preparation and analyzed by LC/IRMS equipped with an Aminex HPX-87H cation exchange column (Bio-Rad Laboratories, Hercules, USA). The eluent was 8 mM sulfuric acid at a flow rate of 0.4 mL min-1 (Krumback & Conrad, 1991). Liquid chromatography was carried out using a Surveyor liquid chromatograph connected to an LC Isolink interface and a Delta V Advantage IRMS (all from Thermo Fisher Scientific, Bremen, Germany).
Lipids were extracted from 4 g dry weight of sediment with a modified Bligh and Dyer extraction (Boschker et al., 1999). The lipid extract was fractionated on silicic acid (60, Merck) into different polarity classes by sequential eluting with chloroform, acetone and methanol. The chloroform fraction contained mainly neutral lipid-derived fatty acids, while the acetone and methanol fraction contained polar lipids-derived fatty acids (i.e. mainly glycolipids-derived fatty acids and phospho-lipid-derived fatty acids (PLFA), respectively, but both fractions also contained other lipids such as betaine lipids and sulfolipids) (Heinzelmann et al., 2014). The methanol fraction was denoted as the PLFA fraction and converted into fatty-acid methyl esters, and the carbon content and isotopic composition of these derivatives were measured by gas chromatography isotope ratio mass spectrometry (Middelburg et al., 2000; Boschker, 2004).

Part 2 Chapter 8
196
Pigments were extracted with acetone (90 %, buffered with 5 % ammonium acetate) from freeze-dried sediment and analyzed by reverse-phase high-performance liquid chromatography (Dijkman & Kromkamp, 2006).
Nutrients were measured using a segmented continuous flow analyzer (SEAL QuAAtro XY-2 autoanalyzer, Bran and Luebbe, Norderstedt, Germany) according to the instructions provided by the manufacturer.
Data analysis The absolute amount of 13C incorporated into EPS fractions, SCOA and PLFA in excess of the background was displayed. This value is expressed as excess 13C and is calculated from δ 13Csample as:
Excess 13C (mol 13C m-2) =
where δ13Cbackground denotes the δ13C value of the unlabeled sample and Csample denotes the pool size in mol of carbon per square meter sediment (mol C m-2). Production rates of various EPS fractions and PLFA biomarkers were quantified by calculating the regression slope from sample data (at 0, 2, and 4 h) (expressed in µmol 13C m-2 h-1).
Excess 13C into bacterial biomass was estimated from the label incorporated in bacterial-biomarker PLFA as excess 13C-bacterial biomass (mol 13C m-2) = Σ excess 13C PLFAbact/(0.056 × 0.23), where 13C PLFAbact
is 13C in bacterial-biomarker PLFA (i.e. i14:0, i15:0, ai15:0, i17:0, 17:1ω6c, cy-19:0, i17:1ω7c, 10Me16:0, and i17:1ω5c), 0.056 represents the average PLFA content in bacteria in terms of carbon and 0.23 ± 0.06 is the average fraction of these bacterial PLFA among total PLFA in bacteria-dominated marine sediments (Middelburg et al., 2000). Excess 13C into diatom biomass was calculated from the difference between excess 13C into all PLFA and excess 13C into bacterial PLFA and was also corrected for the typical PLFA content of diatoms: excess 13C-diatom biomass (mol13C m-2) = (Σ excess 13C PLFAall-Σ excess13C PLFAbact)/0.035, where 13C PLFAall is 13C in all individual PLFA measured and 0.035 represents the average PLFA content of diatoms (Middelburg et al., 2000). Diatom and bacterial biomass were calculated as above in terms of carbon per m2 sediment using the PLFA concentrations instead of excess 13C values.
( )( )
( )( ) sample
stbackground13
stbackground13
stsample13
stsample13
C1R11000/Cδ
R11000/Cδ
1R11000/Cδ
R11000/Cδ×
+×+
×+−
+×+
×+

8
Seasonal changes in the production and fate of EPS
197
The relative photosynthetic electron transport rate (rETR) was calculated by multiplying the Mini PAM measured quantum yield (i.e. ‘efficiency’ of photosynthesis) and the applied irradiance (E) during the recording of the RLCs (Kromkamp & Forster, 2003). From the RLCs the relative maximum photosynthetic electron transport rate (ETRmax), the light affinity coefficient in the light limited region of the rapid light curve (alpha), and the light saturating irradiance (Ek= ETRmax/alpha) were determined by fitting the RLCs to a modified version of the equation of Eilers and Peeters (1988): rETR=E/aE2 + bE + c), where a=(alpha ×Ek
2)-1 -2 × (alpha × Ek)-1; c=alpha-1.
A multivariate statistic method was applied in order to identify the relationships between environmental, photosynthetic, and pigment parameters (i.e. explanatory variables; Supplementary Table 8.S1) and production rates of the EPS fractions (Supplementary Table 8.S2). The various EPS fractions might originate from different processes and were correlated to the explanatory variables in such a way that the variables of the EPS fractions were kept in separate tables (samples x variables). The relationships between the explanatory variables and the different EPS fractions were explored by Concordance Analysis (Lafosse & Hanafi, 1997). This approach is an extension of Co-Inertia analysis (Dolédec & Chessel, 1994) that matches one table to several others. The inherent logics of Co-Inertia enables to proceed with a large number of variables (Dray et al., 2003). Concordance Analysis searches combinations of variables in each EPS fraction that co-vary and vary with combinations of explanatory variables. The number of variables does not affect the strength of the correlation because the tables are weighted by the inverse of their respective inertia. Prior to Concordance Analysis, the correlation between the explanatory variables and each EPS fraction was assessed by the Rv coefficient (Robert & Escoufier, 1976). The significance was tested by a randomization procedure of 9999 permutations of table lines (Heo & Ruben Gabriel, 1998). Hence, only the significantly correlated part of EPS to explanatory variables was considered in the Concordance Analysis. In the case of a single significantly correlated EPS table, the Concordance analysis was a simple Co-Inertia analysis. Concordance Analyses were run with ADE-4 software (Thioulouse et al., 1997) and associated graphical representations were made with the “ade4” package (Chessel et al., 2004) in R version 3.2.3 (Team, 2015).
One-way Anova was used to test whether the determined concentration and excess values between EPS MQ and EPS ASW fractions on the one hand and EPS EDTA and EPS DOWEX fractions on the other hand showed significant differences (significance levels p<0.05).

Part 2 Chapter 8
198
Results Seasonal dynamics of exudation and heterotrophic consumption of EPS and SCOA An overview of the 13C label dynamics of determined excreted carbon pools by benthic diatoms, i.e. EPS and SCOA, is given (Fig. 8.1). In the two operational defined EPS extracts (i.e. EPS MQ and EPS EDTA) carbohydrates (CHO) and amino acids (AA) were detectable resulting in four EPS fractions are depicted (CHO MQ, CHO EDTA, AA MQ an AA EDTA). We also show the 13C labeling of bacteria (through the analysis of PLFA biomarkers) that originates from the heterotrophic consumption of the extracellular carbon compounds released by diatoms.
For all excreted carbon compounds, different 13C labeling patterns were observed. Most of the 13C label was recovered in CHO MQ, followed by CHO EDTA, AA MQ, AA EDTA and SCOA. The highest amount of 13C label in all pools was observed in February and April (Fig. 8.1). Especially in February and April an initial steep increase of 13C label was observed in excreted carbon compounds followed by a steep decrease. EPS and SCOA were exuded and consumed at lower rates during the rest of the year. During all months the amount of 13C label incorporated into the EPS and SCOA was highest between 4 - 12 h and disappeared to a large extent during the course of the experiment (Fig. 8.1). Although the number of sampling time points was limited, the data suggest that the initial release of exudates was followed by a second release (between 24 - 48 h) and in some cases by a third release (between 48 - 72 h). Labeling in bacterial PLFA increased sharply during the first 4 h of the experiment and was followed by a more gradual and alternating decrease and increase during the course of the experiment. The increases of 13C label in bacterial biomarkers coincided to a greater or lesser extent with the release of EPS and SCOA.

8
Seasonal changes in the production and fate of EPS
199
0
250
500
750
1000
1250
1500
µm
ol 13
C m
-2
February
0
250
500
750
1000
1250
1500
April
0
100
200
300
400
500
June
0
100
200
300
400
500
August
0
100
200
300
400
500
October
0
100
200
300
400
500
December
0
50
100
150
200
250
300
µm
ol 13
C m
-2
0
50
100
150
200
250
300
0
20
40
60
80
100
0
20
40
60
80
100
0
20
40
60
80
100
0
20
40
60
80
100
0
10
20
30
40
50
µm
ol 13
C m
-2
0
5
10
15
20
25
30
0
5
10
15
20
25
30
0
5
10
15
20
25
30
0
5
10
15
20
25
30
0
5
10
15
20
25
µm
ol 13
C m
-2
0
5
10
15
20
25
0
1
2
3
4
5
0
1
2
3
4
5
0
1
2
3
4
5
0
1
2
3
4
5
0
2
4
6
8
10
0 50 100 150
µm
ol 13
C m
-2
Time h
0
5
10
15
20
25
30
0
1
2
3
4
5
0 50 100 150
Time h
0
1
2
3
4
5
0 50 100 150
Time h
0
1
2
3
4
5
0 50 100 150
Time h
0
1
2
3
4
5
0 50 100 150
Time h
CHO
MQ
CHO
EDTA
AA M
QAA
EDT
ABA
CTER
IAL
PLFA
0,0
0,5
1,0
1,5
2,0
2,5
3,0
0 50 100 150
µm
ol 13
C m
-2
0,0
0,1
0,2
0,3
0,4
0,5
0,6
0,7
0 50 100 1500,00
0,05
0,10
0,15
0,20
0,25
0 50 100 1500,00
0,05
0,10
0,15
0,20
0,25
0 50 100 1500,00
0,05
0,10
0,15
0,20
0,25
0 50 100 1500,00
0,05
0,10
0,15
0,20
0,25
0 50 100 150
SCO
A
0
2
4
6
8
10
0 50 100 150
Time h
Figure 8.1. An overview of 13C label dynamics of excreted carbon pools (i.e. EPS and SCOA) and bacteria derived from heterotrophic consumption of these excreted carbon pools. In the two operational defined EPS extracts (i.e. EPS MQ and EPS EDTA) carbohydrates and amino acids were detectable.
Exudation and fate of carbohydrates and amino acids originating from EPS and SCOA In figure 8.2 the results of the carbohydrates and amino acids originating from the two EPS extracts are depicted. Throughout the year, carbohydrates formed the main component of the extracellular fractions while amino acids represented a minor component (Fig. 8.2A). Carbohydrates also explained most of production rate of EPS (Fig. 8.2B). In contrast to the EPS content of the sediment, EPS production was strongly seasonal. EPS production reflects the actual metabolic activity

Part 2 Chapter 8
200
020406080
100120140
FEB APR JUN AUG OCT DEC
mm
ol C
m-2
CHO MQ CHO EDTA AA MQ AA EDTA
0
50
100
150
200
250
300
FEB APR JUN AUG OCT DEC
µm
ol 13
C m
-2h-1
CHO MQ CHO EDTA AA MQ AA EDTA
Relative distribution: Relative distribution:
A B
and therefore emphasis was put on the seasonal variation of EPS production. Figure 8.2. Annual carbohydrate and amino acid (A) concentrations and (B) productions originated from EPS MQ and EPS EDTA.
In figure 8.3 details of the carbohydrates and amino acids
originating from EPS MQ and EPS EDTA extracts are presented after initial 13C label incorporation (t = 4 h) (Fig. 8.3A, B, C, D), and how this 13C label was distributed after 3 days (Fig. 8.3E, F, G, H). Time-point day 3 was chosen, because from day 3 onwards 13C label distribution remained more or less the same. For carbohydrate as well as for amino acids, the relative 13C label distribution in the monomers of the extracted EPS was different. For the CHO MQ fraction most of the 13C label was incorporated into glucose (80±11 %) while in the CHO EDTA the 13C label was more evenly distributed between the monomeric carbohydrates (Fig. 8.3A, B). For the AA MQ fraction most of the 13C label was incorporated into proline (54±11 %) while for the AA EDTA the 13C label incorporation was varying depending on the season and the highest amounts of 13C label were found in threonine, serine and valine (Fig. 8.3C, D). Due to the elution of an unknown impurity in the chromatogram of the AA EDTA fraction (which was substantial and chromatically comprised a wide elution area), the amino acids glycine, proline and alanine could not be determined. Despite this limitation, it was ascertained that the AA EDTA fraction contained aspartate, serine, threonine and methionine, which were not retrieved in the AA MQ fraction. Similarly, the AA MQ fraction contained phenylalanine, lysine and tyrosine, which were absent in the AA EDTA fraction. Besides the variation of monomers in the different EPS fractions, also the 13C label distribution in the monomers of the EPS fractions varied seasonally (Fig 8.3A, B, C, D, pie charts).

8
Seasonal changes in the production and fate of EPS
201
0
5
10
15
20
25
30
0
200
400
600
800
1000
1200
FEB APR JUN AUG OCT DEC
% E
PS e
xcre
ted
µmol
13C
m-2
MAN
XYL
GLC
GAL
RHA
FUC
%EPS
CHO MQ - 4h
0
20
40
60
80
100
120
140
160
0
200
400
600
800
1000
1200
FEB APR JUN AUG OCT DEC
% E
PS re
mai
ned
µmol
13C
m-2
MAN
XYL
GLC
GAL
RHA
FUC
%EPS
CHO MQ - d3
0
5
10
15
20
0
50
100
150
200
250
300
FEB APR JUN AUG OCT DEC
% E
PS e
xcre
ted
µmol
13C
m-2
MAN
XYL
GLC
GAL
RHA
FUC
%EPS
CHO EDTA - 4h
0
20
40
60
80
100
120
140
160
0
50
100
150
200
250
300
FEB APR JUN AUG OCT DEC
% E
PS re
mai
ned
µmol
13C
m-2
MAN
XYL
GLC
GAL
RHA
FUC
%EPS
CHO EDTA - d3
0
10
20
30
40
50
60
70
0
10
20
30
40
50
60
70
FEB APR JUN AUG OCT DEC
% E
PS e
xcre
ted
µmol
13Cm
-2
Arg
Phe
His
Lys
Tyr
Leu
Ile
Val
Ala
Pro
Gly
% EPS
020406080100120140160180
0
10
20
30
40
50
60
70
FEB APR JUN AUG OCT DEC
% E
PS re
mai
ned
µmol
13C
m-2
ArgPheHisLysTyrLeuIleValAlaProGly% EPS
0
2
4
6
8
10
0
5
10
15
20
FEB APR JUN AUG OCT DEC
% E
PS e
xcre
ted
µmol
13C
m-2
Arg
His
Leu
Ile
Met
Val
Thr
Ser
Asp
% EPS050100150200250300350400450
0
5
10
15
20
FEB APR JUN AUG OCT DEC
% E
PS re
mai
ned
µmol
13C
m-2
Arg
His
Leu
Ile
Met
Val
Thr
Ser
Asp
% EPS
AA MQ - 4h
AA EDTA - 4h AA EDTA - d3
AA MQ - d3
A E
B F
C G
D H
Figure 8.3. Annual monomeric carbohydrate and amino acid details of 13C label content of EPS MQ and EPS EDTA fractions. Details of 13C label are presented for respectively 4 h (i.e. after initial 13C label incorporation) and d3 (i.e. 13C label distribution after 3 days). For panel A, B, C and D the dotted line represents the percentage of carbon initially fixed as respectively carbohydrate and amino acids and excreted as EPS. For panel E, F, G and H the dotted line represents the percentage of 13C label remained in EPS after 3 days compared to the amount of 13C label incorporated at t = 4h.

Part 2 Chapter 8
202
Up to 23±4 % of the total fixed carbon in the carbohydrate pool was exuded as EPS MQ and up to 6±1 % as EPS EDTA. Similarly, most of the total fixed carbon in the amino acid pool was exuded as EPS MQ rather than as EPS EDTA (46±25 % and 7±2 %, respectively). The percentage of carbon that was initially fixed as carbohydrate and amino acid and subsequently exuded as EPS was in general lowest in June (on average 3±2 %) (Fig 8.3A, B, C, D, dotted line).
The 13C label incorporated into the EPS during the first 4 h of the experiment disappeared to a large extent during the course of the experiment (Fig. 8.3E, F, G, H). This was particularly the case for CHO MQ in which only 20±9 % of the 13C label remained after 3 days (Fig. 8.3E). For CHO EDTA and AA MQ the decrease of 13C label after 3 days was less (59±21 % and 75±32 % of the incorporated 13C label remained, respectively). For AA EDTA 39.3 ±19.2 % remained after 3 days, except in December when a substantial net label increase was found (Fig. 8.3H). For EPS MQ and EPS EDTA an increase in the proportioning of deoxy-sugars (fucose and rhamnose) was found while glucose decreased (Fig. 8.3E, F). Similarly, a shift in the distribution of amino acids was observed.
Seasonal differences were observed for the 13C label loss of the different EPS fractions. For CHO MQ and AA MQ more label remained after 3 days in April and June compared to other months (Fig. 8.3E, G, dotted line). For CHO EDTA less 13C label remained 3 days after the start of the experiment in February and April, whereas for the AA EDTA fraction less 13C label remained in February and August compared to other months.
SCOA in the pore water included formate, acetate, oxalate, malate, lactate and succinate. Lactate and succinate could not be separated sufficiently by the applied LC protocol and are therefore reported as the sum of both. Considerable seasonal changes in the 13C labeling of succinate/lactate, formate and acetate were observed. Other SCOA were below the detection limit; hence, only succinate+lactate, formate and acetate are depicted in figure 8.4. Pore water concentrations of succinate+lactate (range 2.7-5.7 µM, formate (range 3.7-13.6 µM), and acetate (range 1.0-5.8 µM) were high. Labeling of succinate/lactate, formate and acetate were highest in February and gradually decreased during the year. By contrast, the percentage of 13C label that remained after 3 days in all SCOA increased during the year and ranged from 5 % in February to 42 % in December.
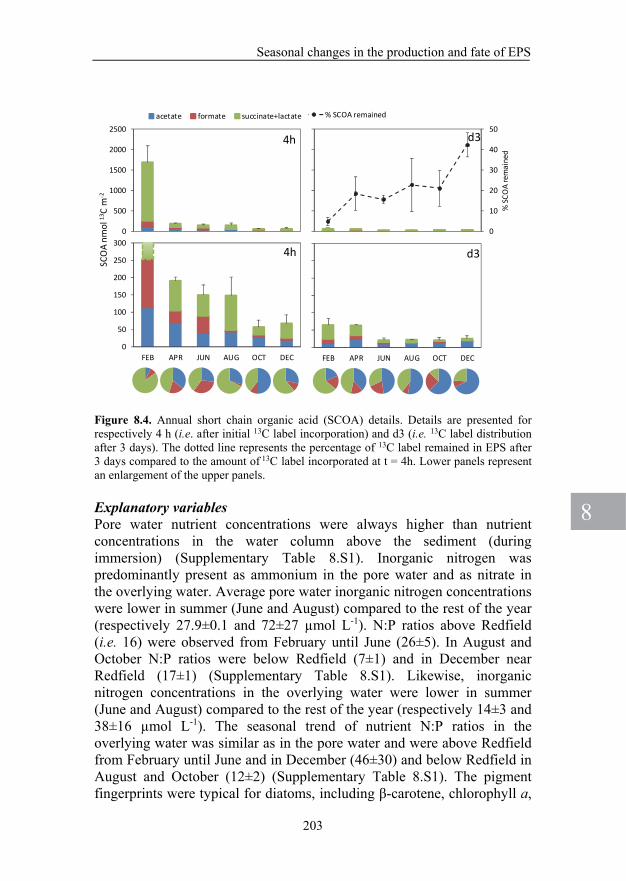
8
Seasonal changes in the production and fate of EPS
203
0
50
100
150
200
250
300
FEB APR JUN AUG OCT DEC
Series1 Series2 Series3 0
10
20
30
40
50
0
500
1000
1500
2000
2500
% S
COA
rem
aine
d
Axis
Title
% SCOA remained
0
50
100
150
200
250
300
FEB APR JUN AUG OCT DEC
Series1 Series2 Series30
500
1000
1500
2000
2500acetate formate succinate+lactate
SCO
A nm
ol 13
C m
-2
4h
4h
d3
d3
Figure 8.4. Annual short chain organic acid (SCOA) details. Details are presented for respectively 4 h (i.e. after initial 13C label incorporation) and d3 (i.e. 13C label distribution after 3 days). The dotted line represents the percentage of 13C label remained in EPS after 3 days compared to the amount of 13C label incorporated at t = 4h. Lower panels represent an enlargement of the upper panels. Explanatory variables Pore water nutrient concentrations were always higher than nutrient concentrations in the water column above the sediment (during immersion) (Supplementary Table 8.S1). Inorganic nitrogen was predominantly present as ammonium in the pore water and as nitrate in the overlying water. Average pore water inorganic nitrogen concentrations were lower in summer (June and August) compared to the rest of the year (respectively 27.9±0.1 and 72±27 µmol L-1). N:P ratios above Redfield (i.e. 16) were observed from February until June (26±5). In August and October N:P ratios were below Redfield (7±1) and in December near Redfield (17±1) (Supplementary Table 8.S1). Likewise, inorganic nitrogen concentrations in the overlying water were lower in summer (June and August) compared to the rest of the year (respectively 14±3 and 38±16 µmol L-1). The seasonal trend of nutrient N:P ratios in the overlying water was similar as in the pore water and were above Redfield from February until June and in December (46±30) and below Redfield in August and October (12±2) (Supplementary Table 8.S1). The pigment fingerprints were typical for diatoms, including β-carotene, chlorophyll a,

Part 2 Chapter 8
204
EPS fraction Explanatory vs Explanatory vs
Production EPS13
C label day 3 EPS
CHO MQ 0.41 0.41CHO EDTA 0.66 0.56
AA MQ 0.72 0.80AA EDTA 0.73 0.52
chlorophyll c, fucoxanthin, diadinoxanthin and diatoxanthin (Supplementary Table 8.S1). The photosynthetic parameters Ek and ETRmax were higher in spring and summer, while α was higher in autumn and winter (Supplementary Table 8.S1). PAR values correlated to sediment temperatures and were higher in summer than in winter. The average temperature and integrated photon irradiance during the 4 h of 13C labeling of the diatom mat were the lowest in February (3.7 oC and 1314 µmol photons m-2 and the highest in August (20.5 oC and 7492 µmol photons m-2) (Supplementary Table 8.S1).
Production and fate of EPS in relation to explanatory variables Concordance analysis was performed on the dataset of 13C label incorporation rate of monomeric carbohydrates and monomeric amino acids originating from the EPS extracts (i.e. CHO MQ, CHO EDTA, AA MQ and AA EDTA) (Supplementary Table 8.S2) and explanatory variables (Supplementary Table 8.S1). The Rv coefficients between the explanatory variables and the four EPS fractions were significant (Table 8.1). Results from the concordance analysis are displayed in figure 8.5. The two first axes expressed the major dynamics among four seasonal clusters (i.e. February, April, June/August and October/December).
For all four EPS fractions (i.e. CHO MQ, CHO EDTA, AA MQ, and AA EDTA), the first axis of the concordance analysis opposed autumn and winter months (i.e. October, December and February) from spring and summer months (i.e. April, June and August), whereas the second axis opposed months having a high EPS production (i.e. February and April) to months with a lower EPS production (i.e. June, August, October and December) (Fig. 8.4). The predominant monomeric carbohydrates and amino acids characterized the seasonal clusters (Fig. 8.4).
Table 8.1. Rv coefficients between the explanatory table and each EPS table. Bold values indicate significance at the rejection level α = 0.05.

8
Seasonal changes in the production and fate of EPS
205
Figure 8.5. Concordance analysis of explanatory data and production details of both carbohydrates and amino acids originated from EPS MQ and EPS EDTA extracts. Bar diagram, Eigenvalues: axis 1 (horizontal), 63 %; axis 2 (vertical), 30 %. The first two rows of the graph display the variable interplays of the different EPS fractions. The second row displays the positions of months; black dots, reference ordination of months induced by explanatory variables (bottom graph); arrow tips, positions induced by EPS variables; arrow lengths indicate the lack of fitting. “d” indicates the grid scale. The notation of the various parameters is explained in table 8.2.
Along the first axis of the concordance analysis, the carbohydrates
originating from the exuded EPS (i.e. CHO MQ and CHO EDTA) in spring and summer (April, June, and August) had higher production rates of fucose, rhamnose, xylose, and mannose, relative to a lower production rate of glucose (and for CHO EDTA also a lower rate of galactose production) (Fig. 8.5; panel CHO MQ and CHO EDTA). In contrast, in autumn and winter (October, December, and February) high production rates of glucose (and for the CHO EDTA fraction also a high rate of galactose production) and low production rates of fucose, rhamnose,
CHO MQ
CHO MQ CHO EDTA
CHO EDTA
Part 2 Chapter 8
206
xylose, and mannose were observed (Fig. 8.5; panel CHO MQ and CHO EDTA). Along the second axis, months with a high EPS production (i.e. February and April) show a high rhamnose and a low galactose production for the CHO MQ fraction and a high fucose and a low mannose production for the CHO EDTA fraction (Fig. 8.5; panel CHO MQ and CHO EDTA). The months with a low EPS production (i.e. June, August, October, and December) show a high galactose and a low rhamnose production for the CHO MQ fraction and high mannose and a low fucose production for the CHO EDTA fraction (Fig. 8.5; panel CHO MQ and CHO EDTA).
Similar as was found for the exuded carbohydrates, along the first axis of the concordance analysis the excreted AA MQ showed a higher production rate in spring and summer for most of the amino acids in contrast to a lower production rate of glycine and proline (Fig. 8.5; panel AA MQ). Along the first axis, autumn and winter showed a high production rate of glycine and proline and a low production rate of all other measured amino acids (Fig. 8.5; panel AA MQ). Along the second axis a high production rate of tyrosine and a low production rate of valine were observed (Fig. 8.5; panel AA MQ). Different than for the CHO MQ, CHO EDTA and AA MQ fractions, the AA EDTA fraction showed a high production rate for most amino acids during June, August, October, and December (i.e. when the production of EPS was low) except for threonine (Fig. 8.5; panel AA EDTA). Threonine production rates were high in February and April (i.e. when EPS production was high).
The first axis of the concordance analysis was strongly characterised by temperature and positively associated to PAR, ETRmax, and Ek (Fig. 8.5; panel explanatory variables). Subsequently, these parameters decreased from June/August to October/December with associated increases in alpha (i.e. the photosynthetic parameter that represents the affinity for light), β-carotene content, phosphate concentrations and ammonium concentration in the overlying water (Fig. 8.5; panel explanatory variables). Along the first axis the increased synthesis rates of the majority of monomeric carbohydrates and amino acids for the CHO MQ, CHO EDTA, and AA MQ fractions were mainly covariant with the high light intensity and, to a lesser extent, with the high sediment temperature, Ek and ETRmax (Fig. 8.5). In contrast, along the second axis increased synthesis rates of amino acids were observed in the AA EDTA fraction. These increased synthesis rates were consistently associated with a low content of light-harvesting pigments and possibly with insufficient ammonium in the pore water or nitrate in the water column (Fig. 8.5). Moreover, the high rates of EPS production in February

8
Seasonal changes in the production and fate of EPS
207
Explanatory variables EPS parameters
PAR Photosynthetically Active Radiation (400-700 nm) Extracellular Polymeric Substances (EPS) Amino Acids (AA)during labeling EPS MQ Water-extractable EPS Asp aspartine
Tsed Sediment Temperature EPS EDTA EDTA-extractable EPS Ser serineThr threonine
Photosynthetic Parameters Operational defined EPS fractions Gly glycineETRMax Relative maximum reached Electron Transport rate Pro prolineα Light affinity coefficient in the light limited region CHO MQ Water-extractable Carbohydrates Ala alanine
of the rapid light curve CHO EDTA EDTA-extractable Carbohydrates Val valineEk (minimum) Light saturation irradiance AA MQ Water-extractable Amino Acids Met methionine
AA EDTA EDTA-extractable Amino Acids Ile isoleucinePigments Leu leucineβ-CARO β-Carotene M Water-extractable Tyr tyrosineCLA Chlorophyll a E EDTA-extractable Lys lysineCLC Chlorophyll c His histineDIAD Diadinoxanthine Carbohydrates (CHO) Phe phenylalanineDIAT Diatoxanthine FUC fucose Arg argininePHOR Pheophorbide RHA rhamnoseFUCO Fucoxanthine GAL galactosePHYT Pheophytine GLC glucose
XYL xyloseNutrients MAN mannosew-NH4 Water column Ammonium w-NO2 Water column Nitrite w-NO3 Water column Nitratew-PO4 Water column Phosphatew-Si Water column Silicatepw-NH4 Pore water Ammonium pw-NO2 Pore water Nitrite pw-NO3 Pore water Nitratepw-PO4 Pore water Phosphatepw-Si Pore water Silicate
and April were consistently associated to a high content of light harvesting pigments and high concentrations of ammonium in the pore water or nitrate in the water column (Fig. 8.5).
Table 8.2. Explanatory variables and EPS parameter notation
At day 3, the relationship between the proportioning of 13C label in the CHO EDTA, AA MQ, and AA EDTA fractions (Supplementary Table 8.S3) and explanatory variables (Supplementary Table 8.S1) were significant (Table 8.1). The pattern resulting from the concordance analysis was expressed along two main axes (Fig. 8.6). There was no relationship between the 13C label proportioning of the CHO MQ fraction at day 3 and explanatory variables. For the CHO EDTA, AA MQ, and AA EDTA fractions the 13C label distribution pattern at day 3 was similar to the one for the distribution pattern at t = 4h (Fig. 8.5), except for serine and tyrosine for the AA MQ fraction and leucine, methionine, isoleucine and valine for the AA EDTA fraction (Fig. 8.6; panel AA MQ and AA EDTA). At t = 4h those amino acids were positioned in respectively the

Part 2 Chapter 8
208
June/August and October/December cluster of the concordance plot (Fig. 8.5; panel AA MQ and AA EDTA). At day 3 those amino acids were positioned in the February and April clusters (Fig. 8.6; panel AA MQ and AA EDTA). This implies that serine and tyrosine (AA MQ fraction), and leucine, methionine, isoleucine and valine (AA EDTA fraction) 13C label dynamics were different than for the other amino acids and 13C label loss of these amino acids in February and April was low.
Figure 8.6. Concordance analysis of explanatory data and details of 13C label content of carbohydrates and amino acids originated from EPS MQ and EPS EDTA at t = 3 days. Eigenvalue diagram: axis 1 (horizontal), 92 %; axis 2 (vertical), 8 %. See figure 8.4 for complementary explanations. The notation of the various parameters is explained in table 8.2.
CHO EDTA
CHO EDTA

8
Seasonal changes in the production and fate of EPS
209
Comparison of EPS extraction methods The carbohydrate content of EPS MQ and EPS ASW was similar (Table 8.3) (Anova, p>0.05). However, the carbohydrate yield was on average 22±6 % higher when extracted at 30 oC than at 4 oC. No significant differences were found in natural abundance δ13C values of the carbohydrate monomers of EPS MQ and EPS ASW (Anova, p>0.05) (Table 8.3). Similarly, no significant differences of Δδ13C values and excess 13C values were found between the EPS MQ (extracted at 30 oC) and EPS ASW (extracted at 4 oC) fractions (Anova, p>0.05) except for galactose (Anova, p<0.05).
Large and significant differences were found in the carbohydrate concentration and excess 13C values between the EPS EDTA and EPS DOWEX fractions (Table 8.3). The carbohydrate content and excess 13C values of EPS EDTA were on average 4 times higher than those of EPS DOWEX. No significant differences were found in natural abundance δ13C values of the carbohydrate monomers of EPS EDTA and EPS DOWEX (Anova, p>0.05) (Table 8.3). However, in most cases Δδ13C values were significantly higher for DOWEX extracted carbohydrates than for those extracted by EDTA (Anova, p<0.05) (Table 8.3). Extraction temperature had no significant effect, neither on the carbohydrate content derived from EPS extracted by DOWEX, nor on that of EPS extracted by EDTA, except in the case of galactose and xylose extracted by EDTA (Anova, p<0.05). For these carbohydrates the yield at 30 oC was on average 24±5 % higher compared to the yield at 4 oC.

Part 2 Chapter 8
210
Com
pone
nt
met
hod
TC
once
ntra
tion
sdδ13
Csd
Δδ13
Csd
Exce
sssd
met
hod
TC
once
ntra
tion
sdδ13
Csd
Δδ13
Csd
Exce
sssd
o C
mm
ol m
-2‰
‰µm
ol 1
3C
m-2
o C
mm
ol m
-2‰
‰µm
ol 13
C m
-2
fuco
seM
Q4
163
-13.
12.
415
43
0.8
EDT
A4
146
35-1
5.6
0.9
34
62.
6A
SW4
195
-14.
24.
318
74
1.1
DO
WEX
420
4-1
4.7
2.0
175
41.
4M
Q30
214
-13.
70.
715
44
1.4
EDT
A25
148
15-1
5.2
1.4
62
114.
4A
SW30
233
-14.
51.
216
44
1.1
DO
WEX
2519
4-1
5.2
0.5
166
31.
3
rham
nose
MQ
414
2-1
4.8
3.6
137
21.
2ED
TA
474
26-1
5.9
1.4
86
53.
5A
SW4
143
-15.
24.
121
73
1.2
DO
WEX
419
3-1
6.6
2.4
187
41.
3M
Q30
192
-15.
82.
618
64
1.3
EDT
A25
706
-16.
00.
711
39
2.5
ASW
3018
3-1
5.2
2.1
175
31.
4D
OW
EX25
183
-16.
32.
316
43
1.0
gala
ctos
eM
Q4
173
-15.
03.
349
89
2.5
EDT
A4
859
-16.
00.
833
1430
12A
SW4
162
-15.
02.
536
96
1.3
DO
WEX
422
3-1
5.0
1.2
338
82
MQ
3022
3-1
5.6
2.4
447
112.
8ED
TA
2510
98
-15.
51.
331
737
12A
SW30
214
-16.
01.
131
87
2.6
DO
WEX
2522
2-1
6.1
1.4
264
61
gluc
ose
MQ
421
5-1
3.9
2.1
141
3834
15.1
EDT
A4
7515
-14.
91.
411
529
9324
ASW
420
5-1
5.5
3.8
140
3631
8.7
DO
WEX
419
5-1
4.5
1.4
148
4830
13M
Q30
246
-13.
71.
714
525
3915
.1ED
TA
2578
8-1
5.0
2.9
8018
6722
ASW
3025
5-1
3.9
1.5
112
3830
11.3
DO
WEX
2517
4-1
4.5
1.7
9626
1810
xylo
seM
Q4
71
-14.
94.
632
112
0.7
EDT
A4
365
-11.
82.
317
27
1.6
ASW
47
2-1
2.3
3.4
305
20.
5D
OW
EX4
116
-13.
57.
528
82
0.7
MQ
3010
1-1
2.7
4.0
2911
31.
3ED
TA
2543
4-1
0.7
3.1
166
71.
4A
SW30
117
-12.
03.
335
356
12.4
DO
WEX
259
1-1
5.5
7.1
2113
21.
2
man
nose
MQ
49
2-1
9.4
5.7
4012
41.
6ED
TA
439
8-1
7.8
2.2
358
154.
3A
SW4
92
-18.
06.
243
104
0.7
DO
WEX
49
2-1
6.6
7.7
3510
31.
4M
Q30
122
-15.
14.
934
124
2.2
EDT
A25
444
-17.
52.
329
514
2.8
ASW
3010
3-1
6.9
7.2
3511
31.
0D
OW
EX25
92
-16.
36.
930
153
1.6
EP
S M
Q/A
SW
EP
S E
DT
A/D
OW
EX
Table 8.3. Data comparison EPS extraction methods. Analyses were performed in decuple (n=10). ‘sd’ denotes standard deviation

8
Seasonal changes in the production and fate of EPS
211
Seasonal development of the diatom mat Benthic diatoms were visible at the sediment surface during the whole year but varied in density, depending on the time of the year and the time of the day. Both the biomass of benthic diatoms and benthic bacteria as estimated from fatty acids biomarker data were lower during the summer (June and August) (Fig. 8.7A). The decrease in biomass coincided with the activity of bioturbating fauna that grazed and disturbed the diatom mat. The annual ratio of diatoms and bacteria remained constant at 82±1 % and 18±1 %, respectively, of the total biomass (Fig. 8.7A). The production rate of diatoms and bacteria decreased during the year and was lowest in October and December (Fig. 8.7B). During February, April, and June the biomass of diatoms and bacteria seemed to be coupled, as seemed to be the case for the productivity of both groups of organisms. From August on the coupling of the growth of diatoms and bacteria deteriorated and almost disappeared in December (Fig. 8.7B). This pattern was retained until day 3 of the experiment (Fig. 8.7C). On average only 1.7±0.9 % of the initially applied 13C-DIC remained 12 h after the start of the experiment, confirming that most of it was washed out (or exchanged with the atmosphere). In addition, dark fixation of 13C label, as was determined in separate sediment core experiments, indicated that CO2 fixation by chemoautotrophic bacteria or through anaplerotic carbon fixation by heterotrophs was not important and confirmed the conclusions of Miyatake et al. (2014). Hence, the 13C label incorporation in heterotrophic bacteria in this study was mainly due to the transfer of organic matter between diatoms and bacteria.

Part 2 Chapter 8
212
0
100
200
300
400
500
0
1000
2000
3000
4000
5000
FEB APR JUN AUG OCT DEC
Labe
ling
4h b
acte
rial b
iom
ass
13C
µmol
m-2
Labe
ling
4h d
iato
m b
iom
ass
13C
µm
ol m
-2
Diatoms Bacteria
0
100
200
300
400
500
0
500
1000
1500
2000
FEB APR JUN AUG OCT DEC
Bact
eria
l bio
mas
s m
mol
m-2
Diat
om b
iom
ass
mm
ol m
-2Diatom Bacterial
A
B
0
100
200
300
400
500
0
1000
2000
3000
4000
5000
FEB APR JUN AUG OCT DEC
Labe
ling
3d b
acte
rial b
iom
ass
13C
µmol
m-2
Labe
ling
3d d
iato
m b
iom
ass
13C
µm
ol m
-2
Diatom Bacteria
C
Figure 8.7. Annual diatom and bacterial biomass (expressed in mmol C m-2) (A), their 13C labeling content at 4 h (expressed in µmol 13C m-2) (B) and their 13C labeling content at day 3 (expressed in in µmol 13C m-2) (C) calculated from their respective specific phospholipid-derived fatty acids (PLFA).

8
Seasonal changes in the production and fate of EPS
213
0
200
400
600
800
1000
1200
1400
0,0
1,0
2,0
3,0
4,0
5,0
6,0
FEB APR JUN AUG OCT DEC
µmol
13C
m-2
iC14:0 iC15:0 aiC15:0iC17:0 C17:1ω6c cy-C19:0
0
1
2
3
4
5
6
FEB APR JUN AUG OCT DEC
µmol
13C
m-2
iC14:0 iC15:0 aiC15:0iC17:0 C17:1ω6c cy-C19:0
iC14:0 iC15:0 aiC15:0 iC17:0 C17:1ω6ccy-C19:0 iC17:1ω7c 10MeC16:0 iC17:1ω5c % 13C
% b
acte
rial P
LFA
rem
aine
d4h d3
The production and fate of PLFA bacterial biomarkers The 13C label incorporation in bacterial biomarkers was high at the beginning of the year and gradually decreased towards the end of the year (Fig. 8.8, panel 4h). In the first half of the year (i.e. February, April, and June) 13C incorporation was dominated by the iC17:ω7c, 10MeC16:0 and iC17:1ω5c biomarkers, whereas in the second half of the year (i.e. August, October, and December) other PLFA biomarkers took over (Fig. 8.8, panel 4h, pie charts).
During the year the 13C incorporated in the bacterial biomarkers iC17:ω7c, 10MeC16:0 and iC17:1ω5c decreased after 3 days (Fig. 8.8 4h, d3). This was in contrast to other PLFA, which increased their label content (Fig. 8.8A, B). During February, April, and June on average 77±15 % of the initially incorporated 13C label remained after 3 days (Fig. 8.6B, dotted line). This was in contrast to the months August, October, and December when a net gain of label 13C was observed. On average 459±207 % of label was gained compared to the amount of incorporated 13C label at t = 4h (Fig. 8.8 d3, dotted line).
Figure 8.8. Annual distribution of 13C label in bacterial PLFA biomarkers. Details of 13C label are presented for (4h) 4 hours (i.e. after initial 13C incorporation) and (d3) after 3 days of 13C label distribution. The dotted line represents the percentage of 13C label remaining in bacterial specific PLFA after 3 days compared to the amount of 13C label incorporated at t=4h.

Part 2 Chapter 8
214
Discussion Production and fate of carbohydrates and amino acids originated from EPS by benthic diatoms The EPS composition and EPS degradation by microorganisms are complex processes that are largely unexplored. The exuded EPS consisted mainly of carbohydrate although amino acids were a consistent component, which is common for diatom dominated biofilms (Granum et al., 2002). In contrast, bacterial biofilm assemblages are dominated by proteins rather than by polymeric carbohydrates (Flemming et al., 2000). The composition of distinguished EPS extracts (EPS MQ and EPS EDTA) was different with respect to the carbohydrates and amino acids. This suggested that their synthesis is under different metabolic control. The carbohydrate composition of EPS MQ was rich in glucose and it was produced faster than the other fractions, suggesting a direct relationship with photosynthesis (de Brouwer & Stal, 2001). Moreover, glucose can be directly incorporated from chrysolaminaran, while other carbohydrates need to be synthesized first from glucose and hence would take longer to exude (Underwood & Paterson, 2003). In general, exudates with high glucose content are a source of easy degradable carbon for microorganisms. In contrast to EPS MQ, EPS EDTA was rich in deoxysugars (e.g. fucose and rhamnose) and pentose (e.g. xylose). Deoxysugars and pentoses contribute to the adhesive properties of EPS (Underwood & Paterson, 2003) and are more refractory towards degradation (Giroldo et al., 2003).
Although amino acids are a minor component of exuded EPS in benthic diatom mats, they can play an important role in maintaining EPS functionality. It is known that lectins (i.e. carbohydrate-binding proteins) link and stabilize polysaccharides in EPS and may be essential for the biofilm structure, adhesion, and stability (Dugdale et al., 2006). For example, it has been suggested that EPS-proline and EPS-glycine cause adhesion between organisms in soils and give elasticity to the EPS matrix (Redmile-Gordon et al., 2015). The amino acid proline is known to be multifunctional and its enhanced synthesis is an important factor in stress acclimation (e.g. salt- and oxidative stress) and plays a role as osmolyte (Van Bergeijk et al., 2003; Szabados & Savoure, 2010). In addition, under extreme cold, such as under polar circumstances, extracellular proline may serve as an anti-freeze allowing the presence of liquid water (Wiencke, 2011). We conceived that similar functions might be ascribed to proline and glycine in diatom mats, particularly because the synthesis of proline and glycine is enhanced in autumn and winter. EPS with a high

8
Seasonal changes in the production and fate of EPS
215
content of proline and glycine may play an important role as anti-freeze and could support elasticity of the EPS matrix of the diatom mat. In this study, we also observed that threonine (in the AA EDTA fraction) was a distinctive and characteristic amino acid because of its high synthesis rate in February and April; i.e. when EPS was produced at high rates. Threonine is known to be associated with algal defense (Buhmann et al., 2016) and therefore might play a role in controlling bacterial activity during the period of high EPS productivity in February and April. Although knowledge about the functionality of the substances exuded by diatoms is limited and needs further study, it is conceived that the exudation of carbohydrates serves mainly to balancing energy and motility of the diatoms. At the ecosystem level these exudations represent the carbon- and energy source. Extracellular amino acids are known to be important to interconnect polysaccharides and form the tertiary structure. In addition, extracellular amino acids are part of enzymes, nutritious polymers or serve as signaling molecules that play a role in diatom cell adhesion and defense processes (Buhmann et al., 2016).
EPS production often changes with the growth phase of the organism, with the level of irradiance or nutrients, or may be linked to endogenous cell rhythms (Underwood & Paterson, 2003). The carbon fixed by the benthic diatoms in the present study was exuded rapidly (within 2 h), which agrees with the idea of EPS exudation during photosynthesis as has been suggested by Underwood and Paterson (2003). We observed that a substantial proportion (between 9 and 21 %) of the fixed carbon was exuded in the environment as EPS. Other authors reported that this range of fixed carbon released as exudates may be even larger: i.e. between 1.7 to 73 %, with a median value between 30-40 % (Underwood & Paterson, 2003).
EPS exudation followed a seasonal pattern with lower percentages of fixed carbon exuded in summer compared to the rest of the year and showed a significant relation with explanatory variables such as light intensity, temperature and nutrient concentrations. We conceive that the function of EPS exudation may be different depending on the season. A dense diatom mat rapidly depletes the nutrients in the small volume of pore water. A lack of nutrients during photosynthesis makes a balanced synthesis of structural cell material impossible. This will result in a situation of unbalanced growth during which the product of photosynthesis is diverted to carbohydrate. Eventually, when the intracellular pool of the storage carbohydrate chrysolaminaran is filled up, the excess carbohydrate is exuded as EPS (Stal, 2010). Especially in February and April (i.e. high productivity months and a dense diatom mat),
Part 2 Chapter 8
216
the production of EPS should be intimately related with the rate of photosynthesis (de Brouwer & Stal, 2001) and EPS exudation served as an overflow valve for excess energy (Stal, 2010). In June and August the diatom mat was less dense and EPS production might be the result of motility because the diatoms are forced to migrate because of sediment burial due to bioturbation and/or in order to escape high light intensities (Consalvey et al., 2004). During the summer the diatoms are exposed to a higher faunal grazing pressure (Pinckney et al., 2003). In October and December bioturbation and grazing are much less and overflow metabolism takes over again. In addition, the produced EPS in summer suggested an increase of heterogeneity because higher synthesis rates of the majority of monomeric carbohydrates as well as monomeric amino acids were observed. Therefore, we conceived that the produced EPS in summer was, besides being more related to motility, different in structure than in other seasons and as consequence the physicochemical properties of the exuded EPS may likely be different. This change in physicochemical properties could result in a different EPS functionality (e.g. hydrophobicity and degradability by heterotrophic bacteria) (Giroldo et al., 2003). For example, an increase in heterogeneity of EPS in terms of monomeric carbohydrates and monomeric amino acids could lead to a more complex structure and a higher recalcitrance to microbial degradation.
The 13C label dynamics of CHO MQ indicated a high turnover. The high loss of CHO MQ can be partially explained by the washout during tidal inundation, which may account for up to 60 % of the EPS loss from the sediment (Underwood & Smith, 1998; Hanlon et al., 2006). However, heterotrophic bacteria can also consume EPS. This was supported by the enrichment of in 13C of bacterial specific PLFA biomarkers coinciding the loss of CHO MQ and this agrees with other studies. (Goto et al., 2001, Miyatake et al., 2014). EPS EDTA was less influenced by tidal washout and was more refractory against bacterial consumption, which explained its slower turnover. This is consistent with previous studies reporting that deoxy-sugar rich EPS are more resistant for bacterial degradation, while hexose-rich polymers are more rapidly degraded (de Brouwer & Stal, 2001; Giroldo et al., 2003; Hanlon et al., 2006). However, despite the losses, continued isotopic enrichment of EPS indicated new production at the expense of another enriched compound. This enriched compound may be an intracellular carbon source such as chrysolaminaran or an extracellular carbon source such as material derived from degradation of more refractory EPS. Chiovitti et al. (2003) suggested the appearance of a pathway by which EPS EDTA becomes
8
Seasonal changes in the production and fate of EPS
217
available in the EPS MQ pool by bacterial degradation. For instance, by selective consumption of glucose-rich parts of EPS MQ the remaining more refractory parts could became available in the EPS EDTA pool. Also Stal (2010) suggests that EPS EDTA might have been derived from initially exuded EPS MQ. These hypotheses are supported by the results of our present study. We observed an increase in the deoxy-sugars of EPS as well as an increase in the isotopic enrichment of EPS EDTA between 12 h and 120 h. The transition from one EPS fraction to the other is probably also depending on the amount of divalent cations present in the sediment, such as Ca2+ and Mg2+, which interact with the EPS (Stal, 2010). The binding capacity of these cations enables part of EPS MQ to eventually be transformed into EPS EDTA. In this study we found seasonal differences within the production and fate of monomeric carbohydrates and monomeric amino acids originating from EPS, however it is more study is needed in order to draw further detailed conclusions about the results.
Comparison of EPS extraction protocols Different protocols for the extraction of EPS from intertidal sediments were compared, namely two water extractions (i.e. EPS MQ versus EPS ASW), and were followed by a second extraction using EDTA (i.e. EPS EDTA) and compared to an extraction method using a cation-exchange resin (i.e. EPS DOWEX). The yield of the water-extracted EPS was mainly influenced by temperature, which is consistent with previous research (Underwood et al., 1995, de Brouwer et al., 2002). The differences in yield for the bound EPS extractions methods were temperature independent and were most likely explained by the difference in extraction efficiency between both extraction agents. Whereas EDTA is strongly chelating divalent cations, the resin works only partly chemical (removal of divalent cations) and partly mechanical (due to applied shear) (Comte et al., 2006). We found a 4-fold lower yield using DOWEX when compared to EDTA and this has also been reported in the literature (Comte et al., 2006). The nature of the extracted EPS using either method seems to be similar because we did not find significant differences in the δ13C natural abundance values of the monomeric carbohydrates, neither in the biochemical monomeric carbohydrate composition. The observed yield difference between the EDTA and DOWEX fraction is unlikely to be the result of cell lysis, which is occasionally suggested as a side effect of EDTA extraction (Takahashi et al., 2010). The observed higher Δδ13C values for DOWEX extracted carbohydrates than for those extracted by EDTA suggests that DOWEX EPS exist more of material formed during

Part 2 Chapter 8
218
the experiment and that the EDTA extracted carbohydrates are to a larger extend derived from sediment bound older, and therefore unlabeled material.
EPS and SCOA as carbon source for bacteria Heterotrophic bacteria are omnipresent in diatom mats and utilize organic carbon produced by diatoms (Middelburg et al., 2000, Bellinger et al., 2009). Especially during the first couple of months (February, April and June), the bacterial PLFA biomarkers showed an initial fast uptake of 13C label, which was probably the result of the utilization of low-molecular-weight EPS AND SCOA exuded by diatoms. Exudates were preferentially used by various groups of bacteria as was evidenced by differences in the level of 13C excess values between PLFA biomarkers. The PLFA i17:1ω7c, i17:1ω5c and 10Me16:0 are known to be specific for sulfate reducing bacteria (SRB) (Boschker et al., 1998; Boschker & Middelburg, 2002). From February until June the biomass and production of diatoms and bacteria were coupled. It was concluded that during these months SCOA were the most important substrates for the bacteria. Especially sulfate reducing bacteria (SRB) benefited from associating with SCOA-releasing diatoms. From August on, the coupling of biomass and production of diatoms and bacteria became less strong and was almost lost in December. During the period of August until December, EPS produced by diatoms promoted the growth of other bacterial taxa rather than SRB, and the production of SCOA was low. It seems likely that SRB utilizing SCOA dominated the community the first half the year (i.e. February, April, and June) and had a higher turnover than other bacteria which dominated the community the second half of the year (i.e. August, October, and December). The seasonal variation of exudates produced by diatoms played an important role in shaping the community composition and diversity of the associated bacteria.
With regard to EPS, CHO MQ rather than CHO EDTA appeared to be the most important intermediate in the initial transfer of carbon between diatoms and bacteria, while the amino acids originating from EPS were probably more important in the longer term. We observed after the initial fast transfer of carbon from diatoms to heterotrophic bacteria, a second peak of 13C label incorporation in bacteria coincided with on the one hand the disappearance of 13C label in EPS MQ and on the other hand the second release of 13C label in EPS MQ and EPS EDTA. It was therefore concluded that this second peak of labeling was due to prolonged consumption of EPS MQ, but also probably due to consumption of more recalcitrant EPS (after enzymatic hydrolysis to low-

8
Seasonal changes in the production and fate of EPS
219
molecular-weight compounds) in the long term (Hunter et al., 2006). Degrading complex EPS is slow and the entire process might take as long as a month (Giroldo et al., 2003). CHO EDTA seems a less favorable carbon source for heterotrophic bacteria, which is consistent with other studies (Giroldo et al., 2003).
Acknowledgements
We thank Erwin Moerdijk, Wanda Moerdijk, Jelle Moerdijk, Jurian Brasser and Gerjan de Ruiter for assisting in the field sample collection and processing of samples in the laboratory.

Part 2 Chapter 8, Supporting information
220
Exp
lana
tory
var
iabl
es
Sam
ple
Sam
ple
Dat
eL
ow T
ide
PA
R
Tse
dβ-
CA
RO
CL
AC
LC
D
IAD
DIA
TP
HO
RFU
CO
P
HY
TE
TR
Max
αE
kw
-NH
4w
-NO
2w
-NO
3w
-PO
4w
-Si
w-N
:P
hµ
E m
-2 s
-1ºC
µE
m-2
s-1
FE
B A
21-F
eb-1
111
:40
1314
3.3
2258
657
4416
4321
944
800.
5614
29
1.7
481.
131
54A
PR
A4-
Apr
-11
11:0
652
778.
716
608
5941
2152
226
1725
70.
4162
13
0.8
380.
510
86JU
N A
14-J
un-1
18:
4658
9115
.614
365
4518
1015
124
818
20.
5533
410
0.9
60.
86
23A
UG
A15
-Aug
-11
11:3
674
9219
.718
465
4218
1828
139
825
50.
5843
77
0.9
41.
29
10O
CT
A10
-Oct
-11
9:24
2484
12.5
2655
550
2023
3215
914
880.
6014
78
1.4
101.
410
14D
EC
A12
-Dec
-11
10:2
513
926.
427
460
5423
1830
139
3092
0.66
139
91.
320
1.3
2022
FE
B B
21-F
eb-1
111
:40
1314
4.1
2361
060
4716
4422
747
153
0.74
205
91.
748
1.1
3154
AP
R B
4-A
pr-1
111
:06
5277
9.7
1457
754
3820
5321
215
299
0.39
776
30.
838
0.5
1086
JUN
B14
-Jun
-11
8:46
5891
16.4
1437
945
1812
1712
98
198
0.55
360
100.
96
0.8
623
AU
G B
15-A
ug-1
111
:36
7492
21.2
1545
642
1815
2414
910
230
0.58
395
70.
94
1.2
910
OC
T B
10-O
ct-1
19:
2424
8412
.825
512
4617
2130
149
1482
0.62
132
81.
410
1.4
1014
DE
C B
12-D
ec-1
110
:25
1392
7.0
2642
349
2114
2713
326
990.
6614
99
1.3
201.
320
22
mg
m-2
µm
ol L
-1
Fie
ldP
igm
ents
PA
MN
utri
ents
wat
er
Exp
lana
tory
var
iabl
es
Sam
ple
Sam
ple
Dat
eL
ow T
ide
pw-N
H4
pw-N
O2
pw-N
O3
pw-P
O4
pw-S
ipw
-N:P
h
FE
B A
21-F
eb-1
111
:40
491.
316
476
18A
PR
A4-
Apr
-11
11:0
610
60.
87
472
17JU
N A
14-J
un-1
18:
4624
0.2
11
3940
AU
G A
15-A
ug-1
111
:36
220.
51
391
26O
CT
A10
-Oct
-11
9:24
670.
56
1511
98
DE
C A
12-D
ec-1
110
:25
360.
812
344
16
FE
B B
21-F
eb-1
111
:40
450.
918
240
18A
PR
B4-
Apr
-11
11:0
610
10.
57
379
24JU
N B
14-J
un-1
18:
4629
0.2
11
4036
AU
G B
15-A
ug-1
111
:36
310.
41
478
21O
CT
B10
-Oct
-11
9:24
480.
57
910
112
DE
C B
12-D
ec-1
110
:25
390.
910
343
14
µm
ol L
-1
Nut
rien
ts p
ore
wat
er
Supporting information
Supplementary Table 8.S1. Explanatory variables Co-inertia analysis
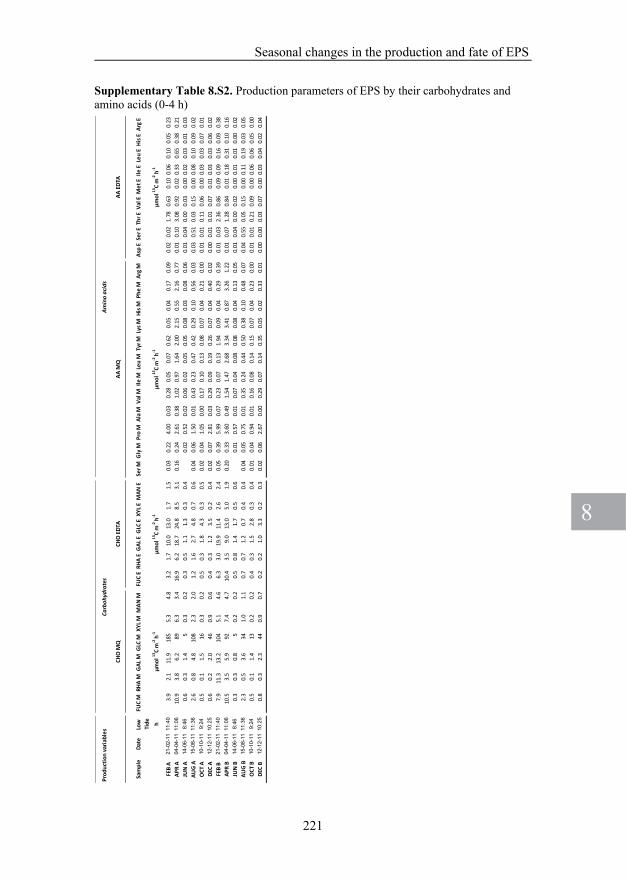
8
Seasonal changes in the production and fate of EPS
221
Prod
uctio
n va
riabl
es
Sam
ple
Date
Low
FU
C M
RHA
MG
AL M
GLC
MXY
L MM
AN M
FUC
ERH
A E
GAL
EG
LC E
XYL E
MAN
ESe
r MG
ly M
Pro
MAl
a M
Val M
Ile M
Leu
MTy
r MLy
s MHi
s MPh
e M
Arg
MAs
p E
Ser E
Thr E
Val E
Met
EIle
ELe
u E
His E
Arg
ETi
de h
FEB
A21
-02-
1111
:40
3.9
2.1
11.9
185
5.3
4.8
3.2
1.7
10.0
13.0
1.7
1.5
0.03
0.22
4.00
0.03
0.28
0.05
0.07
0.62
0.05
0.04
0.17
0.09
0.02
0.02
1.78
0.63
0.10
0.06
0.10
0.05
0.23
APR
A04
-04-
1111
:06
10.9
3.8
6.2
896.
33.
416
.96.
218
.724
.88.
53.
10.
160.
242.
610.
381.
020.
971.
642.
002.
150.
552.
160.
770.
010.
103.
080.
920.
020.
330.
650.
380.
21JU
N A
14-0
6-11
8:46
0.6
0.3
1.4
50.
30.
20.
30.
51.
11.
30.
30.
40.
020.
520.
020.
060.
020.
050.
050.
080.
030.
080.
060.
010.
040.
000.
030.
000.
020.
030.
010.
03AU
G A
15-0
8-11
11:3
62.
60.
84.
810
82.
32.
01.
21.
62.
74.
80.
70.
60.
040.
061.
500.
010.
430.
230.
470.
420.
290.
100.
560.
030.
030.
510.
030.
150.
000.
080.
100.
090.
02O
CT A
10-1
0-11
9:24
0.5
0.1
1.5
160.
30.
20.
50.
31.
84.
30.
30.
50.
020.
041.
050.
000.
170.
100.
130.
080.
070.
040.
210.
000.
010.
010.
110.
060.
000.
030.
030.
070.
01DE
C A
12-1
2-11
10:2
50.
60.
22.
046
0.9
0.6
0.4
0.3
1.2
3.5
0.2
0.4
0.02
0.07
2.81
0.03
0.29
0.09
0.19
0.26
0.07
0.04
0.40
0.02
0.00
0.01
0.01
0.07
0.01
0.03
0.03
0.06
0.02
FEB
B21
-02-
1111
:40
7.9
11.3
13.2
104
5.1
4.6
6.3
3.0
19.9
11.4
2.6
2.4
0.05
0.39
5.99
0.07
0.23
0.07
0.13
1.94
0.09
0.04
0.29
0.39
0.01
0.03
2.36
0.86
0.09
0.09
0.16
0.09
0.38
APR
B04
-04-
1111
:06
10.5
3.5
5.9
927.
44.
710
.43.
59.
013
.05.
01.
90.
200.
333.
600.
491.
541.
472.
683.
343.
410.
873.
261.
220.
010.
071.
280.
840.
010.
180.
310.
100.
16JU
N B
14-0
6-11
8:46
0.3
0.3
0.8
50.
20.
20.
50.
81.
41.
70.
50.
60.
010.
570.
010.
070.
040.
080.
080.
080.
040.
130.
050.
010.
040.
000.
020.
000.
010.
010.
000.
02AU
G B
15-0
8-11
11:3
62.
30.
53.
634
1.0
1.1
0.7
0.7
1.2
0.7
0.4
0.4
0.04
0.05
0.75
0.01
0.35
0.24
0.44
0.50
0.38
0.10
0.48
0.07
0.04
0.55
0.05
0.15
0.00
0.11
0.19
0.03
0.05
OCT
B10
-10-
119:
240.
50.
11.
413
0.2
0.2
0.4
0.3
1.5
2.8
0.3
0.4
0.01
0.04
0.94
0.01
0.16
0.08
0.14
0.15
0.07
0.04
0.23
0.00
0.01
0.01
0.21
0.09
0.00
0.06
0.06
0.05
0.00
DEC
B12
-12-
1110
:25
0.8
0.3
2.3
440.
90.
70.
20.
21.
03.
30.
20.
30.
020.
062.
670.
000.
290.
070.
140.
350.
050.
020.
330.
010.
000.
000.
030.
070.
000.
030.
040.
020.
04
Carb
ohyd
rate
sAm
ino
acid
s
µmol
13C
m-2
h-1
µmol
13C
m-2
h-1
µmol
13C
m-2
h-1
µmol
13C
m-2
h-1
AA M
QAA
EDT
ACH
O M
QCH
O E
DTA
Supplementary Table 8.S2. Production parameters of EPS by their carbohydrates and amino acids (0-4 h)

Part 2 Chapter 8, Supporting information
222
Day
3 va
riabl
es
Sam
ple
Date
FUC
MRH
A M
GAL
MG
LC M
XYL M
MAN
MFU
C E
RHA
EG
AL E
GLC
EXY
L EM
AN E
Ser M
Gly
MPr
o M
Ala
MVa
l MIle
MLe
u M
Tyr M
Lys M
His M
Phe
MAr
g M
Asp
ESe
r ETh
r EVa
l EM
et E
Ile E
Leu
EHi
s EAr
g E
FEB
A24
-02-
1119
.610
.219
.244
.18.
06.
410
.86.
021
.93.
85.
74.
40.
100.
251.
740.
140.
430.
240.
290.
930.
430.
250.
350.
500.
070.
090.
660.
510.
180.
350.
350.
110.
53AP
R A
07-0
4-11
22.1
8.3
14.6
76.0
9.7
7.7
17.2
6.1
13.8
6.6
8.1
3.6
0.17
0.21
3.12
0.05
0.90
0.77
1.03
1.38
1.31
0.37
1.43
0.46
0.06
0.28
0.87
1.58
0.05
0.95
1.13
0.37
0.58
JUN
A17
-06-
110.
40.
61.
93.
50.
00.
32.
12.
54.
01.
61.
51.
50.
060.
470.
030.
240.
230.
380.
250.
620.
180.
430.
210.
000.
030.
000.
050.
000.
030.
030.
170.
07AU
G A
18-0
8-11
1.8
1.4
2.7
21.4
1.1
1.3
2.1
3.3
4.3
0.6
1.9
1.9
0.11
0.19
1.99
0.40
0.85
0.95
1.30
1.63
1.87
0.72
1.63
0.74
0.14
0.29
0.06
0.16
0.04
0.09
0.07
0.14
0.17
OCT
A13
-10-
110.
60.
51.
68.
40.
40.
30.
60.
40.
90.
70.
30.
30.
070.
101.
530.
080.
440.
360.
530.
850.
700.
470.
580.
110.
030.
030.
140.
060.
010.
030.
030.
460.
04DE
C A
15-1
2-11
0.7
0.3
1.3
4.9
0.3
0.3
3.5
4.0
6.0
4.4
3.1
2.6
0.05
0.07
1.09
0.08
0.38
0.19
0.40
0.54
0.55
0.20
0.56
0.10
0.00
0.26
0.05
-0.0
20.
040.
100.
140.
060.
06FE
B B
24-0
2-11
14.1
7.0
23.7
78.4
8.3
7.0
9.0
4.2
15.7
2.7
4.1
3.1
0.06
0.12
1.31
0.06
0.23
0.14
0.20
0.52
0.37
0.14
0.16
0.29
0.00
0.07
0.57
0.71
0.04
0.23
0.33
0.07
0.24
APR
B07
-04-
1121
.510
.015
.982
.910
.07.
415
.85.
913
.77.
07.
63.
50.
610.
7915
.46
0.27
4.94
3.89
7.50
10.1
27.
761.
797.
991.
850.
560.
121.
001.
570.
030.
810.
990.
000.
39JU
N B
17-0
6-11
0.5
0.6
1.4
2.5
0.3
0.4
1.7
2.0
3.5
1.5
1.2
1.2
0.07
0.36
0.06
0.29
0.26
0.49
0.67
0.61
0.19
0.71
0.25
0.00
0.00
0.00
0.00
0.01
0.03
0.03
0.03
0.07
AUG
B18
-08-
111.
41.
32.
510
.91.
11.
33.
34.
24.
30.
62.
72.
70.
050.
080.
470.
060.
290.
270.
520.
450.
670.
240.
800.
300.
010.
080.
050.
06-0
.03
0.03
0.03
0.00
0.06
OCT
B13
-10-
110.
40.
30.
93.
90.
20.
36.
03.
311
.84.
94.
03.
60.
060.
050.
600.
080.
200.
170.
290.
320.
280.
100.
340.
040.
030.
030.
110.
060.
000.
040.
030.
240.
04DE
C B
15-1
2-11
1.3
0.8
2.4
8.2
0.8
0.4
0.8
1.0
1.6
1.6
1.1
1.2
0.30
0.23
5.72
0.32
2.14
1.48
2.59
3.39
4.07
1.11
3.60
1.00
0.01
0.17
0.59
-0.0
90.
020.
620.
970.
180.
43
µmol
13C
m-2
µmol
13C
m-2
µm
ol 13
C m
-2
µmol
13C
m-2
Carb
ohyd
rate
sAm
ino
acid
s
CHO
MQ
CHO
EDT
AAA
MQ
AA E
DTA
Supplementary Table 8.S3. Day 3 13C label content of EPS in their carbohydrate and amino acid components

General discussion
9 C
hapt
er
Chapter 9
224
General discussion The introduction of the liquid chromatography/isotope ratio mass spectrometry (LC/IRMS) technique opened new avenues for enabling carbon flow analysis in biology in much greater detail than what was possible previously. In this thesis I show that the LC/IRMS technique is an important step forward to unravel the fate of carbon fixed by benthic diatoms and to couple the transfer of carbon from diatoms via extracellular polymeric substances (EPS) to heterotrophic bacteria. Here I discuss the performance of the techniques that are available to implement compound specific stable isotope analysis (CSIA) and to point out the limitations and perceptivity of techniques. Subsequently, I discuss the relation of excreted carbon by the diatoms to the heterotrophic microbial community. And finally, I discuss the carbon flow within an intertidal benthic diatom mat and its seasonal variation, and the dynamics of production of various biochemical carbon pools in relation to a broad range of environmental and photosynthetic parameters. Part 1. Stable isotope methodology Carbohydrate stable carbon isotope analysis by LC/IRMS LC//IRMS method development lies to the challenge to meet the analytical constraints of the LC/IRMS interface, which prohibits the use of carbon-containing eluents and columns displaying too high carbon bleeding, and therefore prevents the use of many traditional LC methods. The two published methods that were available until now for carbohydrate analysis by LC/IRMS have a limited number of carbohydrates that can be separated (Cabanero et al., 2006; Penning & Conrad, 2006). In order to achieve chromatographic separation of a wider range of carbohydrates that can be analysed, a commonly used high performance liquid chromatography (HPLC) method was adapted (Chapter 2). This method is based on the use of ion-exchange columns and strong NaOH eluents, which are typically applied in combination with pulsed-amperometric detection (Johnson et al., 1993). However, when this strong alkaline eluent was applied for LC/IRMS it resulted in a high background due to carbonate inclusion in the eluent. For the same reason, the commonly used organic sodium acetate pusher could not be used to elute stronger binding carbohydrates such as acidic acids. The most important methodical changes that were implemented were the use of a narrow-bore ion-exchange column (i.e. CarboPac PA20 column, Thermo Scientific Dionex, Breda, the Netherlands) to adapt to the low flow limits of the

9
General discussion
225
LC/IRMS system and a low strength NaOH eluent (1 mM). The adaptations greatly lowered the carbon background and improved the separation of the major neutral carbohydrates (i.e. fucose, rhamnose/arabinose, galactose, glucose, xylose, mannose, fructose and ribose) without interfering with the wet oxidation process required for IRMS. Only rhamnose and arabinose eluted closely together, but this can be circumvented by using another column such as the CarboPac PA1 (Thermo Scientific Dionex, Breda, the Netherlands). However, this column has the disadvantage of a limited separation of xylose and mannose. Amino sugars, commonly found in minor amounts in marine sediments and mainly derived from microbial biomass and zooplankton remains, are also not separated and elute in the rhamnose to galactose region. However, amino sugars normally occur in low concentrations in marine sediments and can be removed easily with cation-exchange resins (Dauwe & Middelburg, 1998). The use of nitrate (NO3
-) was applied as an alternative pusher ion over the commonly used carbon-containing acetate for the analysis of strongly bound carbohydrates (e.g. uronic acids). This protocol did not give any problems, the method shows an excellent separation of the three common acidic carbohydrates (i.e. muramic acid, galacturonic acid and glucuronic acid). The analytical window of the method can probably be extended to oligomeric carbohydrates and sulfate- or phosphorus-bound carbohydrates by varying the concentration of NO3
-. A disadvantage of using a low NaOH concentration was that the
analytical column slowly lost activity probably because stronger binding anions like carbonate from the eluent or because the salts in the injected samples are not completely washed out and compete with the carbohydrates for binding sites. This results in a gradual decrease in retention times and consequently a decrease in separation efficiency. However, the column can be regenerated with a high concentration of NaOH (200 mM). The best option was to run the instrument isocratically until the separation deteriorated too far, which typically occurs after 15 to 25 runs, and subsequently regenerate the column. The shifting retention times hardly cause problems with identifications based on retention times as run-to-run shifts are mostly small and approximately linear with the number of injections and the chromatograms are usually simple.
Acidic hydrolysis (using the H2SO4 method (Cowie & Hedges, 1984)) was used to extract neutral carbohydrates from environmental samples and neutralized hydrolysates could be directly analyzed by LC/IRMS without further sample treatment even for salt-containing marine sediments. Unfortunately, the H2SO4 method cannot be used for

Chapter 9
226
the analysis of acidic carbohydrates as they precipitate during hydrolysis or during subsequent neutralization. Two other hydrolysis methods were also tested (i.e. trifluoroacetic acid (TFA) alone and TFA in combination with methanolysis), however these methods appeared to be incompatible with LC/IRMS as the chromatographic separation deteriorated completely. This collapse in chromatography is probably due to either higher inorganic salt concentration or the presence of organic ions such as amino acids in the TFA hydrolysates. Further sample treatment is therefore essential for sample hydrolysis procedures in order to enable acidic carbohydrate analysis.
The carbohydrate LC/IRMS method developed during this study yields accurate and reproducible δ13C and concentration data for a large number of carbohydrates including typical plant carbohydrates in natural samples and this all with minimal sample preparation. This method opens up opportunities for the study of carbohydrate metabolism in microphytobenthic research. By including the use of muramic acid as a biomarker bacterial dynamics can be studied as well. The method also has potential in physiological studies on carbohydrate metabolism such as fermentation research and the use of carbohydrate substrates by various organisms, biogeochemical studies to determine the sources and fate of carbohydrates in natural ecosystems and food adulteration studies.
DNA and RNA nucleotides stable carbon isotope analysis by LC/IRMS The main challenge to perform CSIA of DNA and RNA nucleotides by LC/IRMS was to select a suitable column and the right conditions to separate all eight DNA and RNA nucleotides in one single run. Therefore, I also had to develop a method that is compatible with LC/IRMS to simultaneously extract DNA and RNA and to hydrolyse the extracted nucleic acids to their nucleotides (Chapter 3). Mixed-mode chromatography using two retention mechanisms (i.e. reversed-phase and anion-exchange) lead itself very well to the chromatographic niche created by the constraints of the current design of the interface of the LC/IRMS system. The retention time of the analytes was controlled by ion-exchange interaction and the ionization state of the stationary phase (which can be adjusted by changing the pH of the mobile phase) and in combination with hydrophobic interactions of the nucleotides and the stationary phase. The advantage of the mixed-mode stationary phase over other phases is that interactions on the column are multiple controllable and effective under fully aqueous conditions.
A phenol/chloroform method was adapted in order to simultaneously extract DNA and RNA from environmental samples

9
General discussion
227
(Griffiths et al., 2000; Hurt et al., 2001). Additional rinsing of the RNA/DNA pellet with 70 % ethanol and subsequent freeze-drying were necessary to avoid interference from residual carbon-containing organics. Usually, water treated with diethylpyrocarbonate (DEPC) is used for handling RNA, in order to avoid RNA degradation by RNAse. However, DEPC treatment contributes to the protocol blank and therefore it was decided to use freshly prepared Milli-Q instead. The original hydrolysis method (Shimelis & Giese, 2006) was modified in two ways: the buffers (TRIS and acetate) were replaced by phosphate buffer and zinc chloride was replaced by potassium chloride. The first modification was made in order to decrease the protocol blank. The second modification was made because zinc precipitates with the phosphate buffer or with the phosphoric acid in the LC/IRMS interface, and this would cause clogging of the system. The nuclease used (i.e. Nuclease P1) is zinc-dependent but it is possible to replace zinc by potassium (Guo-Qing et al., 2006). There are various other methods to hydrolyse nucleic acids but they were not considered because of the severe conditions in combination with long incubation times. These may result in the deamination of nucleotides and other undesirable side effects (Swarts et al., 1996).
The developed LC/IRMS method yields reproducible data for the δ13C and for the concentration of nine nucleotides. Hence, the method opens a new avenue for the study of DNA and RNA biosynthesis in various fields of research. The advantage over other methods is that there is no need for extensive incorporation of labeled substrate and excessive incubation times, allowing the determination of accurate rates of DNA and RNA synthesis. The applicability of the method was demonstrated for the analysis of DNA and RNA nucleotides in marine samples containing micro- and macroalgae at natural 13C abundance level as well as for 13C-labeled material at relatively low enrichments. The method has a high potential for the study of DNA and RNA dynamics in natural environments or in microorganisms. Although the chromatographic method was developed to separate nucleotides using LC/IRMS, we also applied it successfully for traditional HPLC using UV spectrophotometric detection to analyse nucleotide concentrations that has the advantage of being a water-based, solvent-free method.
Chapter 9
228
Performance of CSIA (e.g. LC/IRMS and GC/IRMS) for carbon stable isotope analysis: limitations and perspectives LC/IRMS and GC/IRMS are both reliable techniques to perform compound specific stable isotope analysis (CSIA) in life science (Chapter 4). However, both techniques have pros and cons. Because most biological compounds are polar and non-volatile, the vast majority of compounds can only be analysed by GC/IRMS after derivatisation. A main drawback of this chemical modification is that one needs to correct for the added carbon during derivatisation. Such corrections inherently decrease the accuracy and reproducibility of the measurements and stringent testing of the analytical procedures is needed to determine the proper correction factors. The degree of correction depends on how much excess derivative carbon is added to the original compound. For low molecular compounds such as carbohydrate the level of imprecision can be considerable (Rieley, 1994; Docherty et al., 2001). Various GC/IRMS methods have been developed to make carbohydrate derivatives that minimized carbon addition (van Dongen et al., 2001; Gross & Glaser, 2004; Ruiz-Matute et al., 2011). Although the precision for LC/IRMS was better than for GC/IRMS, this difference diminished for δ13C measured in natural samples.
For LC/IRMS and GC/IRMS complex sample matrices have a negative effect on the chromatographic separation of carbohydrates and on baseline stability. These effects are reflected by the deteriorated reproducibility of δ13C measurements at natural abundance as well as when enrichments were used. The effect varied with the type of carbohydrate analyzed and was typically stronger for LC/IRMS than for GC/IRMS. This is because the chromatographic peaks were broader for LC/IRMS than for GC/IRMS. Peak broadening affects the signal-to-noise ratio and especially at low concentrations the background subtraction becomes more critical (Krummen et al., 2004; McCullagh, 2010; Godin & McCullagh, 2011). A potential solution to improve chromatographic separation would be to remove the impurities by utilizing sample cleaning procedures (Mopper, 1977; Boschker et al., 1995).
The most critical step for LC/IRMS and GC/IRMS is the continuous and quantitative conversion of organic molecules into CO2. The LC/IRMS interface converts the organic molecules by using excess oxidation reagent at low temperature (99.9 °C). This conversion appeared more robust than the conversion in GC/IRMS that combust the organic molecule catalyzed by CuO/NiO wires at high temperature (940 °C). GC/IRMS requires regular regeneration of the combustion oven in order to assure a stable oxidation capacity. In the case of LC/IRMS a minimum

9
General discussion
229
of routine maintenance to its conversion unit (i.e. oxidation oven) was necessary. The only precaution to be taken was the maintenance of the capillaries transporting the eluent through the interface. These capillaries are sensitive to flow obstruction. However, when the manufacturer’s instructions were followed (i.e. applying a continuous flow through the system, even when the LC/IRMS is not in use for analysis), blockage of the capillaries was minimized. As a rule, maintenance of the system was required only once a year. This compares favourably with the regeneration interval required for GC/IRMS combustion (after every 16th sample analysis).
The introduction of LC/IRMS has opened new avenues for the study of a broad range of biological compounds. Especially the analysis of carbohydrates, amino acids and nucleic acids benefits from the use of LC/IRMS. Nevertheless, for lipid analysis GC/IRMS remains the technique of choice. A limitation to take into account for LC/IRMS is that is hitherto restricted to 13C analysis, whereas with GC/IRMS several other elements can be measured. A major innovation for LC/IRMS would be the capability of measuring nitrogen isotopes, which would open up new avenues to study the nitrogen cycle. Recently, Federherr et al. (2016) developed a novel LC/IRMS interface based on high-temperature combustion of both δ13C and δ15N CSIA. However, the sensitivity of this interface is low (for carbon 10 times lower than existing techniques) and the interface is not commercial available. Improvements in the sensitivity and robustness of another mass spectrometry technique, LC/MS/MS, have opened new possibilities for studying macromolecules (Zhang et al., 2007). However, the precision of the LC/MS/MS technique for the determination of low levels of enrichments at or close to natural abundance is insufficient and this hampers its use in in-situ labeling studies.

Chapter 9
230
Part 2. Carbon cycling in benthic diatom mats Carbon pathways from diatom to the heterotrophic microbial community In a pilot study part of the available LC/IRMS methods were for the first time applied (Chapter 5) and the carbon flow from benthic diatoms to the heterotrophic microbial community was traced in marine intertidal sediment for five consecutive days (Chapter 6). Although the relationship between diatom carbohydrates exudates and the heterotrophic bacterial community have been studied in intertidal sediments (Hanlon et al., 2006; Haynes et al., 2007; Bellinger et al., 2009; Oakes et al., 2012; Taylor et al., 2013), in this study short-chain organic acids (SCOA) were included as important intermediates in the anaerobic degradation of diatom material (McKew et al., 2013).
Diatoms were the predominant primary producers, and Gammaproteobacteria, Bacteroidetes, and Deltaproteobacteria were major heterotrophic bacterial groups. Carbohydrates were much more important than amino acids for the carbon processing. The exuded EPS consisted mainly of carbohydrate while amino acids were a minor but consistent component, which is common for diatom dominated biofilms (Granum et al., 2002). More than 80 % of the EPS production could be explained by water-extractable EPS (which consisted mainly of glucose) and it appeared to be a major intermediate pool in the transfer of organic matter from diatoms to heterotrophic bacteria. This study conceived there were two main events during which organic carbon was transferred from benthic diatoms to heterotrophic bacteria, which operated on different time scales. Both 13C-label incorporation in PLFA and rRNA biomarkers suggested that there was a fast transfer (within a day) of organic substrates from the diatoms to heterotrophic bacteria. This fast transfer was probably the result of the utilization of low-molecular-weight (<800 Da) organic compounds exuded by diatoms that could be directly assimilated by heterotrophic bacteria. These low-molecular-weight exudates may include a wide range of different compounds including monomeric carbohydrates, amino acids and organic acids, some of which may be difficult to track with the currently available 13C-methods due to their fast turnover and typical low concentrations. However, fast transfer of label coincided with a sharp peak in short chain organic acid (SCOA) labeling, which indicated that some low-molecular-weight exudates produced by the diatoms (such as glucose) were quickly fermented by anaerobic bacteria. Fermentation products such as acetate and lactate are important substrates for anaerobic bacteria communities (Jørgensen, 2000; McKew et al., 2013). After this

9
General discussion
231
initial fast transfer of organic matter from diatoms to heterotrophic bacteria, labeling of the heterotrophic bacteria proceeded at a slower rate, coinciding with the degradation of water-extractable EPS produced by the diatoms and also with a second increase of 13C label in SCOA. It was conceived that the origin of this second peak of label incorporation in bacteria was based on the consumption of water-extractable EPS that was exuded during the first day after labeling and was partially fermented under anaerobic conditions. Surprisingly also a secondary labeling was detected in the diatoms, which may be attributed to the heterotrophic metabolism of these organisms, because hardly any 13C labeled inorganic carbon was left. This second labeling coincided with the decrease of labeling in carbohydrates, which suggested that the diatoms used EPS as external carbon storage as has been shown for pure cultures of diatoms (Staats et al., 2000; de Brouwer & Stal, 2001) and for slurry incubation to which diatom-derived EPS was added (Taylor et al., 2013).
Given the importance of water-extractable carbohydrates as an intermediate in diatom mats, it was expected that specialized bacteria would be involved in the coupling between diatoms and bacteria (Taylor et al., 2013). However, all heterotrophic bacterial groups benefited equally from the organic matter released by the diatoms suggesting limited specialization. This even utilization may be explained by a combination of diatom primary production being the dominant carbon source for heterotrophic carbon cycling in this sediment and a wide variety of exudates produced by diatoms (although this study indicates that glucose in water-extractable EPS was a major intermediate). However, it could not be excluded that there may still be specialized bacteria within the relatively broad phylogenetic groups that were targeted in this study (Taylor et al., 2013). Therefore we conceived that the heterotrophic bacterial community relies to a similar extent on the organic carbon produced by the diatoms, resulting in a closely coupled microbial food web.
Seasonal changes in the biochemical fate of carbon fixation by benthic diatoms An in-situ seasonal study of the carbon flow within a benthic diatom mat demonstrated whatever the seasons a strong initial enrichment of storage compounds in combination with the low labeling of structural compounds. This indicated that the dense diatom mat was unable to acquire enough nutrients for the synthesis of N or P containing structural cell material during the period of photosynthesis and, hence, the fixed carbon was mainly stored as reserve material or exuded as EPS (Chapter 7). However,

Chapter 9
232
the benthic diatoms produced structural cell compounds such as DNA and RNA during the chase period of the experiment. The nutrients were probably obtained either from the overlying water during immersion or by migrating deeper into the sediment where the supply of nutrients is higher. Hence, photosynthesis and synthesis of structural cell components in the diatom mat appeared to be temporally separated (Mitbavkar & Anil, 2004; Underwood et al., 2005). The production of non-nitrogenous carbohydrates predominated in all seasons, which resulted in a high C:N ratio of the diatom mat. The nutritional value of the diatom mat for higher trophic levels is therefore considered to be low (Brown et al., 1997; Jones & Flynn, 2005).
The diatom mat partitioned the fixed carbon between the measured carbon pools in a way that was remarkably different in summer compared to the rest of the year, and also the percentage of fixed carbon that was excreted as EPS was lower in summer compared to other seasons, respectively 9 ± 4 % and 21 ± 6 % In the summer months June and August more neutral storage lipids were synthesized, which significantly correlated to low inorganic nutrient availability and high temperature and PAR, and could hint to a stress situation for the diatom mat (Guschina & Harwood, 2006). This is in line with the general idea that under unfavorable environmental conditions such as desiccation, nutrient deficiency, high light intensity and/or high temperature, algae can alter their lipid biosynthetic pathways towards the formation and accumulation of neutral lipids, mainly in the form of triacylglycerides (TAGs) (Guschina & Harwood, 2006; Fields et al., 2014; Levitan et al., 2015). TAGs are not structural compounds but primarily serve as a storage of carbon and energy (Hu et al., 2008). In addition, there is evidence suggesting that TAG synthesis plays a more active role in stress response of diatoms and may serve as an electron sink. Under stress conditions excess electrons that accumulated in the photosynthetic electron transport chain may induce excess of reactive oxygen species, which may in turn inhibit photosynthesis and cause damage to membrane lipids, protein and other macromolecules (Hu et al., 2008). The observed DNA/RNA ratios were high in summer and suggested a higher cell division rate (i.e. growth) of the diatoms than in other seasons. It is known that besides inorganic nitrogen there are several possible sources of organic nutrients that can be utilized by diatoms (Berman & Bronk, 2003). For example, urea can be an important nitrogen source for microphytobenthos (Veuger & Middelburg, 2007). Although we did not determine urea concentration, faunal exuded urea is likely to be important and may serve as a nitrogen source in summer, as C. volutator and P.
9
General discussion
233
ulvae were present in high numbers (Therkildsen & Lomstein, 1994). Most likely, the use of urea as nitrogen source and the stressful fluctuations in temperature and PAR are the main factors responsible for the observed metabolic changes of the diatom mat during summer.
Seasonal changes in the production and fate of EPS In addition, the results obtained from the in-situ seasonal study suggested that although the amino acids are a minor component of exuded EPS in benthic diatoms, they can play an important role in maintaining EPS functionality (Chapter 8). For example, it has been suggested that EPS-proline and EPS-glycine cause adhesion between organisms in soils and give elasticity to the EPS matrix (Redmile-Gordon et al., 2015). The amino acid proline is known to be multifunctional and its enhanced synthesis is an important factor in stress acclimation (e.g. salt- and oxidative stress) and plays a role as osmolyte (Van Bergeijk et al., 2003; Szabados & Savoure, 2010). In addition, under extreme cold, such as under polar circumstances, extracellular proline may serve as an anti-freeze allowing the presence of liquid water (Wiencke, 2011). We conceived that similar functions might be ascribed to proline and glycine in diatom mats, particularly because the synthesis of proline and glycine is enhanced in autumn and winter. EPS with a high content of proline and glycine may play an important role as anti-freeze and could support elasticity of the EPS matrix of the diatom mat. Threonine is known to be associated with algal defense (Buhmann et al., 2016) and therefore might play a role in controlling bacterial activity during the period of high EPS productivity in February and April. Although knowledge about the functionality of the substances exuded by diatoms is limited and needs further study, it is conceived that the exudation of carbohydrates serves mainly to balancing energy and motility of the diatoms. At the ecosystem level these exudations represent the carbon- and energy source. Extracellular amino acids are known to be important to interconnect polysaccharides and form the tertiary structure. In addition, extracellular amino acids are part of enzymes, nutritious polymers or serve as signaling molecules that play a role in diatom cell adhesion and defense processes (Buhmann et al., 2016).
The function of EPS exudation may be different depending on the season. A dense diatom mat rapidly depletes the nutrients in the small volume of pore water inside the mat. A lack of nutrients during photosynthesis makes a balanced synthesis of structural cell material impossible. This will result in a situation of unbalanced growth during which the product of photosynthesis is diverted to carbon rich storage

Chapter 9
234
compounds such as carbohydrates. Eventually, when the intracellular pool of the storage carbohydrate chrysolaminaran is filled up, the excess carbohydrate is exuded as EPS (Stal, 2010). Especially when EPS production is high and the diatom mat is dense (in February and April), the production of EPS should be intimately related with the rate of photosynthesis (de Brouwer & Stal, 2001) and EPS exudation serves as an overflow valve for excess energy (Stal, 2010). In June and August the diatom mat was less dense and EPS production might be the result of motility because the diatoms are forced to migrate to counter sediment burial due to bioturbation and/or in order to escape high light intensities (Consalvey et al., 2004). During the summer the diatoms are exposed to a higher faunal grazing pressure (Pinckney et al., 2003). In October and December bioturbation and grazing are much less and overflow metabolism takes over again.
We conceived that the produced EPS in summer was, besides being more related to motility, different in structure than in other seasons and as consequence the physicochemical properties of the exuded EPS may likely be different. This change in physicochemical properties could result in a different EPS functionality (e.g. hydrophobicity and degradability by heterotrophic bacteria) (Giroldo et al., 2003). For example, an increase in heterogeneity of EPS in terms of monomeric carbohydrates and monomeric amino acids could lead to a more complex structure and a higher recalcitrance to microbial degradation.
Different protocols for the extraction of EPS from intertidal sediments were compared, namely a water extractions using Milli-Q (i.e. EPS MQ) versus a water extraction using artificial seawater (i.e. EPS ASW), and were followed by a second extraction using EDTA (i.e. EPS EDTA) and compared to an extraction method using a cation-exchange resin (i.e. EPS DOWEX). The yield of the water-extracted EPS was mainly influenced by temperature, which is consistent with previous research (Underwood, et al., 1995, de Brouwer, et al., 2002). The differences in yield for the bound EPS extraction methods were temperature independent and were most likely explained by the difference in extraction efficiency between both extraction agents. We found a 4-fold lower yield using DOWEX when compared to EDTA and this has also been reported in the literature (Comte, et al., 2006). The observed yield difference between the EDTA and DOWEX fraction is unlikely to be the result of cell lysis, which is occasionally suggested as a side effect of EDTA extraction (Takahashi, et al., 2010), because we did not find significant differences in the δ13C natural abundance values of the

9
General discussion
235
monomeric carbohydrates and in the biochemical monomeric carbohydrate composition.
The seasonal variation of exudates produced by diatoms played an important role in shaping the community composition and diversity of the associated bacteria. Especially during the first couple of months, the bacterial PLFA biomarkers showed an initial fast uptake of 13C label, which was probably the result of the utilization of low-molecular-weight EPS and SCOA exuded by diatoms. Exudates were preferentially used by specific groups of bacteria as was evidenced by differences in the level of 13C excess values between PLFA biomarkers. The highly labeled PLFA i17:1ω7c, i17:1ω5c and 10Me16:0 are known to be specific for sulfate reducing bacteria (SRB) (Boschker et al., 1998; Boschker & Middelburg, 2002). It was concluded that during these months SCOA were the most important substrates for the bacteria and that especially sulfate reducing bacteria (SRB) benefited from associating with SCOA-releasing diatoms. From August on, the coupling of biomass and production of diatoms and bacteria became less strong, and EPS produced by diatoms promoted the growth of other bacterial taxa rather than SRB, and the production of SCOA was low. With regard to EPS, carbohydrates originated from EPS MQ rather than EPS EDTA appeared to be the most important intermediate in the initial transfer of carbon between diatoms and bacteria. EPS EDTA seems a less favorable carbon source for heterotrophic bacteria, which is consistent with other studies (Giroldo, et al., 2003). Recommendations Although this study determined the major classes of organic compounds, there are still many compounds outside the applied analytical window, such as amino sugars, acidic carbohydrates, pigments and quinones. For example, uronic acids are important components of EPS, because they serve in crosslinking of polymer chains and bind sediment particles (Decho, 2000; Stal, 2003). Insight in the dynamics of uronic acids would give knowledge on the functionality of EPS. In addition, by including muramic acid as a biomarker bacterial dynamics could be studied. It was shown in Chapter 2 that three acidic acids (i.e. 2 uronic acids and muramic acid) could be analysed by LC/IRMS. However, further development of sample treatment is necessary for the hydrolysis procedure to enable acidic carbohydrate analysis in samples.
For future studies of carbon cycling in benthic diatom mats, application of shorter sampling intervals and prolonged follow-up of label decay is recommended. A higher number of data points would offer the

Chapter 9
236
opportunity to determine rates of loss of 13C from the biochemical carbon pools (e.g. carbohydrates and EPS) by fitting data using for example a 2-G model (Westrich & Berner, 1984). The ratio between the rate of 13C incorporation and the overall rate of loss of 13C provides insight into the turnover ratios of relevant carbon pools, and gives insight in the degradation of carbon pools in the sediment (Oakes et al., 2010).
LC/IRMS not only provides the opportunity to study important processes in microbial ecology, such as carbon cycling in coastal sediments, but also to study carbon transfer between trophic levels (food web studies). The study of carbon transfer between microorganisms and between higher trophic levels will provide further insight in the mudflats productivity and the extensive populations of organisms living there.

Summary
S
umm
ary

Summary
238
Summary
This study aimed at investigating the carbon flow within communities of benthic diatoms, which are major primary producers in estuarine environments and important for the food web in marine intertidal sediments. Although intertidal sediments and their benthic diatom inhabitants have been extensively studied, our knowledge on the carbon flow in these ecosystems is limited and for a large part still unexplored. One important reason for this limited research was the incapability of the available methods and techniques for tracking the production and fate of the individual components in specific pools of biochemical macromolecules. The majority of in-situ studies that has been published dealt with various aspects of the diatom lipid composition using stable isotope techniques. However, in order to study the carbon flow in greater detail it is crucial to include other carbon pools such as carbohydrates, amino acids, nucleic acids, and extracellular polymeric substances (EPS) in addition to lipids.
For a long time compound specific stable isotope analysis (CSIA) of carbon was restricted to the established technique of gas chromatography/isotope ratio mass spectrometry (GC/IRMS). Because most biological compounds are polar and non-volatile, the vast majority of compounds can only be analysed by GC/IRMS after derivatisation (i.e. a chemical modification to increase volatility, but has the disadvantage that it also alters the 13C/12C ratio of the compounds and hence needs substantial correction, which may affect the accuracy and reproducibility of the measurement). Another drawback of GC/IRMS analysis is the requirement of time consuming stringent testing of the analytical procedures in order to determine the proper correction factors. Moreover, not all biological compounds can be analysed by GC/IRMS.
The introduction of liquid chromatography / isotope ratio mass spectrometry (LC/IRMS) has opened new avenues for the analysis of 13C in non-volatile, aqueous soluble organic compounds and enables the study of metabolic pathways for a much broader range of biological compounds. Especially the analysis of carbohydrates, amino acids and nucleic acids benefit importantly from the use of LC/IRMS because the synthesis of derivatives is not required. However, the challenge of LC/IRMS method development is to meet the analytical constraints of the LC/IRMS interface, which prohibits the use of carbon-containing eluents and columns displaying carbon bleeding. Hence, this prevents the use of most existing traditional LC methods.

Sum
mar
y
239
This thesis is divided in two parts: (1) Stable isotope methodology (Chapter 2-4) and (2) Carbon cycling in benthic diatom mats (Chapter 5-8). Part 1 highlights the development of novel analytical procedures to perform LC/IRMS stable 13C analysis of individual components in specific biochemical pools. Chapter 2 discusses the development of an LC/IRMS method to analyze stable carbon isotope ratios in the most important carbohydrates in microorganisms. Subsequently, Chapter 3 presents an LC/IRMS method for analyzing stable carbon isotope ratios in DNA and RNA nucleotides. In addition, a method for DNA and RNA extraction was developed and validated and an enzymatic hydrolysis protocol was designed to the study DNA and RNA biosynthesis in benthic diatom mats. An LC/IRMS method was already available for the separation of all amino acids as are encountered in benthic diatoms, as well as a method to separate short chain organic acids (SCOA) including volatile fatty acids. For lipid analysis, GC/IRMS remains the technique of choice. Finally, the performance of GC/IRMS and LC/IRMS CSIA analysis was tested by the measurement of δ13C values in carbohydrates (Chapter 4). In general, LC/IRMS achieved the highest precision and a broader range carbohydrates could be analyzed using this technique. LC/IRMS analysis is much easier to carry out and is less time consuming, because laborious sample preparation and challenging system validation are not required. In conclusion, LC/IRMS can be used to quantify the biosynthesis of metabolites and can be applied both for natural 13C-abundance as well as for the analysis of 13C-labeled material. The developed LC/IRMS methods are not restricted to study carbon flow in communities of benthic diatom, but can also be used to study metabolic processed in many other research areas.
Part 2 reports of the study of the fate of carbon fixed by communities of benthic diatoms. The established methods of GC/IRMS and the newly developed LC/IRMS methods were combined to trace 13C into carbohydrates, amino acids, fatty acids, EPS (i.e. water-extractable and EDTA-extractable EPS) and in SCOA. With a preliminary in-situ 13C bicarbonate labeling experiment, the successful application of LC/IRMS was demonstrated in the study of carbon flow in communities of benthic diatoms. It was also concluded that this technique could be a valuable tool for other biological studies (Chapter 5). Water-extractable EPS was the major component produced and consisted mainly of glucose with minor contributions from other carbohydrates and amino acids. Diatoms were the predominantly primary producers in this study. Gammaproteobacteria, Bacteroides, and Deltaproteobacteria were the major heterotrophic bacterial groups (Chapter 6). The exudation of low-molecular weight

Summary
240
organic compounds (such as SCOA) by diatoms was most probably responsible for the initial fast transfer of organic carbon to the heterotrophic bacteria. The transfer of organic carbon from the diatoms to the heterotrophic bacteria through water-extractable EPS was slower but the turnover of this EPS explained 75% of the total carbohydrate processing in the sediment. The different groups of heterotrophic bacteria benefited equally from the organic matter that was released by the diatoms suggesting a limited specialization in this microbial food web.
In Chapter 7, the carbon flow within the diatom mats was investigated during one year in order to cover seasonal variations. The inorganic carbon fixed by the diatoms was recovered in carbohydrates, amino acids, fatty acids and nucleic acids. Independent on the season, fixed carbon was initially stored as carbohydrate (glucose), while nitrogen- and or phosphorus-rich compounds (e.g. amino acids and RNA/DNA) were synthesized more slowly. It seemed that the dense diatom mat was unable to acquire sufficient nutrients for the synthesis of nitrogen- or phosphorus- containing structural cell material during the period of photosynthesis and, hence, that the fixed carbon was mainly stored as reserve material or exuded as EPS. In summer, a change in the fate of carbon fixed by benthic diatoms was observed and more neutral storage lipids were synthesized, which could hint to stress for the diatom mat. The lipids may serve as storage of carbon and energy. The lipids may also serve as an electron sink that could protect the diatoms from oxidative stress, which is induced by high photosynthetically active radiation (PAR) and high temperature. In addition, due to the presence of bioturbating organisms and grazers, urea produced by this fauna could be an important nitrogen source during the summer months and affecting the diatom’s metabolism.
In Chapter 8, the seasonal dynamics of EPS and SCOA exuded by benthic diatoms and the use of these exudates as a carbon source by heterotrophic bacteria were investigated. The production rates of the carbohydrates and amino acids that originated from EPS were remarkably different between seasons. This resulted in a more heterogeneous composition of the EPS in spring and summer when compared to the rest of the year and suggested a different function for these exopolymers. It was conceived that the exudation of carbohydrates served mainly to balancing energy and motility of diatoms. The role of the extracellular amino acids was conceived as to interconnect polysaccharide chains in the EPS and hence forms a structure that is important for adhesion of the diatom cell and for defense against grazing. In order to compare our results with other studies that use other operational defined fractions to

Sum
mar
y
241
extract EPS, we compared two water-extractions (Milli-Q and artificial seawater) and the extraction of EDTA and a cation-exchange (DOWEX) protocol. No difference was found between water-extractions, however although it seemed that the EDTA and DOWEX protocol extracted the same type of EPS in terms of composition, the EDTA extraction was 4-fold more efficient compared to the DOWEX agent. From February until June the biomass and production of diatoms and bacteria were closely coupled and especially sulfate reducing bacteria (SRB) benefited from associating with SCOA-releasing diatoms. From August on, the coupling of biomass and production of diatoms and bacteria became less strong and EPS produced by diatoms promoted the growth of other bacterial taxa rather than SRB. The seasonal variation of exudates produced by diatoms therefore played an important role in shaping the community composition and diversity of the associated bacteria.

Summary
242

Samenvatting
S
amen
vatt
ing
Samenvatting
244
Samenvatting
Deze studie richtte zich op het onderzoeken van de koolstof stromen in gemeenschappen van benthische (op de bodem levende) kiezelwieren. Deze kiezelwieren (ook wel diatomeeën genoemd) zijn belangrijke primaire producenten in estuaria en staan aan de basis van het voedselweb in het mariene getijdengebied. Alhoewel deze getijdengebieden en de daarin levende benthische diatomeeën uitgebreid zijn onderzocht, is onze kennis over de koolstofstromen in dit ecosysteem nog steeds beperkt en voor een belangrijk deel onontgonnen. De reden daarvoor was dat de tot nu toe beschikbare methoden en technieken niet in staat waren om de productie en het lot van de afzonderlijke componenten in specifieke macromoleculen te traceren. Het meeste in-situ onderzoek richtte zich op de verschillende aspecten van de samenstelling van lipiden van diatomeeën met behulp van stabiele isotopen technieken. Echter, om de koolstofstromen in groter detail te bestuderen is het cruciaal om naast lipiden ook andere componenten zoals koolhydraten, aminozuren, nucleïnezuren, en extracellulaire polymere substanties (EPS) in het onderzoek te integreren. Tot voor kort beperkte de component specifieke stabiele isotopen analyse (CSIA) van koolstof zich tot de gaschromatografie/isotoop ratio massaspectrometrie (GC/IRMS). Omdat de meeste biologische verbindingen polair en niet-vluchtig zijn, kunnen de deze alleen door GC/IRMS geanalyseerd worden nadat een derivaat van het te analyseren product gesynthetiseerd is (doormiddel van een chemische modificatie wordt de vluchtigheid van de stof verhoogd, maar het nadeel is dat het eveneens de 13C/12C koolstofisotopen ratio wijzigt. Daarom moeten er aanzienlijke correcties gemaakt worden, hetgeen de nauwkeurigheid en reproduceerbaarheid van de meting nadelig beïnvloedt). Een ander nadeel van de GC/IRMS analyse is dat het bepalen van de juiste correctiefactoren tijdrovend is. Het is een vereiste dat de analytische procedures uitvoerig getest worden. Ook kunnen niet alle stoffen doormiddel van GC/IRMS geanalyseerd worden.
De introductie van de vloeistof chromatografie/isotoop ratio massaspectrometrie (LC/IRMS) maakte het mogelijk om 13C te analyseren in niet-vluchtige, water oplosbare organische verbindingen en stelt ons in staat om de stofwisseling voor een veel breder scala aan biologische verbindingen te bestuderen. Vooral de analyse van koolhydraten, aminozuren en nucleïnezuren profiteert van de voordelen van het gebruik van LC/IRMS omdat het niet nodig is eerst derivaten van deze stoffen te

Sam
enva
ttin
g
245
synthetiseren. Het ontwikkelen van LC/IRMS methodes is uitdagend vanwege de analytische beperkingen die de interface tussen beide apparaten met zich meebrengt, en die het gebruik verhindert van koolstofhoudende elutievloeistoffen en van analytische kolommen die koolstof lekken. Daarom is de toepassing van de meeste traditionele LC methoden niet mogelijk.
Dit proefschrift bestaat uit twee delen: (1) Stabiele isotopen methodologie (hoofdstukken 2-4) en (2) De koolstofcyclus in gemeenschappen van benthische diatomeeën (hoofdstukken 5-8). Deel 1 beschrijft de ontwikkeling van nieuwe procedures om met behulp van LC/IRMS het stabiele isotoop (13C) in afzonderlijke bestanddelen van specifieke biochemische stoffen te analyseren. Hoofdstuk 2 beschrijft de ontwikkeling van een LC/IRMS methode om de verhouding van de stabiele koolstofisotopen in de belangrijkste koolhydraten in micro-organismen te analyseren. Vervolgens wordt in hoofdstuk 3 een LC/IRMS methode gepresenteerd om de verhouding van de stabiele koolstofisotopen in de nucleotiden van DNA en RNA te analyseren. Verder werd een DNA en RNA extractiemethode ontwikkeld en gevalideerd en werd een enzymatisch hydrolyse protocol ontworpen om de DNA en RNA biosynthese in benthische diatomeeën matten te bestuderen. Er was al een LC/IRMS methode beschikbaar om aminozuren afkomstig uit benthische diatomeeën te scheiden, evenals een methode om kleine organische zuren (SCOA) en vluchtige vetzuren te scheiden. Maar GC/IRMS blijft de meest geschikte techniek om lipiden te analyseren. Tenslotte werden GC/IRMS en LC/IRMS getest en met elkaar vergeleken met betrekking tot de CSIA analyse van δ13C waarden van koolhydraten (hoofdstuk 4). LC/IRMS bleek de hoogste precisie te halen en met deze techniek kon een breder scala koolhydraten geanalyseerd worden. Bovendien is de LC/IRMS analyse eenvoudiger uit te voeren en is het minder tijdrovend omdat complexe monstervoorbereiding en systeemvalidatie niet nodig zijn. Concluderend kan gezegd worden dat LC/IRMS gebruikt kan worden om de biosynthese van stofwisselingsproducten te analyseren. De techniek kan worden toegepast voor zowel natuurlijke 13C-abundantie als ook voor de analyse van 13C-gelabeld materiaal. De in dit proefschrift ontwikkelde LC/IRMS methodes kunnen niet alleen de koolstofstromen in gemeenschappen van benthische diatomeeën meten, maar kunnen ook worden toegepast om de stofwisseling van andere organismen te bestuderen.
Deel 2 van dit proefschrift beschrijft het onderzoek naar het lot van koolstof in gemeenschappen van benthische diatomeeën. Door GC/IRMS en de in dit proefschrift nieuw ontwikkelde LC/IRMS

Samenvatting
246
methoden te combineren kon 13C in koolhydraten, aminozuren, vetzuren, EPS, en SCOA worden getraceerd. Doormiddel van een preliminair in-situ experiment met 13C bicarbonaat kon LC/IRMS succesvol worden toegepast om de koolstofstromen in gemeenschappen van benthische diatomeeën in kaart te brengen (hoofdstuk 5). Deze techniek zal naar verwachting tevens waardevol voor andere biologische studies blijken. De belangrijkste stof die de benthische diatomeeën produceerden was water-extraheerbaar EPS dat hoofdzakelijk uit glucose bestond en in mindere mate uit andere koolhydraten en aminozuren. De primaire producenten in deze studie waren overwegend diatomeeën. Gammaproteobacteria, Bacteroides en Deltaproteobacteria waren de belangrijkste heterotrofe bacteriën (hoofdstuk 6). De uitscheiding van organische verbindingen met een lage moleculaire massa (zoals SCOA) door diatomeeën is waarschijnlijk de reden voor de initiële snelle transfer van organische koolstof naar de heterotrofe bacteriën. De transfer van organische koolstof van de diatomeeën naar de heterotrofe bacteriën via water-extraheerbare EPS was trager, maar de turnover van dit EPS verklaarde wel 75% van de totale omzetting van koolhydraten in het sediment. De verschillende groepen heterotrofe bacteriën profiteerden in gelijke mate van het organische materiaal dat door de diatomeeën werd uitgescheiden en dit suggereert een beperkte specialisatie in dit microbiële voedselweb.
De seizoensvariatie in de koolstofstromen in gemeenschappen van benthische diatomeeën werd gedurende een heel jaar onderzocht (hoofdstuk 7). De anorganische koolstof die door de diatomeeën gefixeerd werd, werd teruggevonden in koolhydraten, aminozuren, vetzuren en nucleïnezuren. Onafhankelijk van het seizoen werd de gefixeerde koolstof in de eerste instantie opgeslagen als koolhydraat (glucose), terwijl stikstof- en fosforrijke verbindingen (bijvoorbeeld aminozuren en RNA / DNA) langzamer gesynthetiseerd werden. Het leek erop dat door de hoge biomassa dichtheid de diatomeeënmat niet in staat was om tijdens de fotosynthese voldoende voedingsstoffen te verwerven voor de synthese van stikstof- of fosfor- bevattende structurele cel componenten. Vandaar dat het gefixeerde koolstof voornamelijk als reserve materiaal werd opgeslagen dan wel als EPS werd uitgescheiden. In de zomer werd een verandering van het lot van het door de benthische diatomeeën gefixeerde koolstof waargenomen. Er werden meer neutrale vetten opgeslagen, hetgeen kan wijzen op stress in de diatomeeënmat. Deze neutrale vetten kunnen dienen als opslag van koolstof en energie, maar ze kunnen ook fungeren als elektronenacceptor en de diatomeeën beschermen tegen oxidatieve stress. Dat laatste wordt veroorzaakt door hoge fotosynthetisch actieve straling (PAR) en een hoge temperatuur. Bovendien kan tijdens de

Sam
enva
ttin
g
247
zomermaanden als gevolg van de aanwezigheid van organismen die het sediment omwoelen en van grazers, het door deze fauna geproduceerde ureum een belangrijke stikstofbron vormen hetgeen de stofwisseling van de diatomeeën zal beïnvloeden.
Hoofdstuk 8 beschrijft het onderzoek naar de seizoenafhankelijke dynamiek van de door de benthische diatomeeën uitgescheiden EPS en SCOA en het gebruik als koolstofbron door heterotrofe bacteriën. De productiesnelheden van koolhydraten en aminozuren afkomstig van de EPS waren opmerkelijk verschillend gedurende de verschillende seizoenen. Deze verschillen resulteerden in een meer heterogene samenstelling van de EPS in de lente en zomer in vergelijking met de rest van het jaar en suggereerde dat er een andere functie aan deze exopolymeren kan worden toegeschreven. Mogelijk dient de uitscheiding van koolhydraten voornamelijk om de energiebalans in evenwicht te houden, maar het dient ook de beweging van de diatomeeën. Extracellulaire aminozuren daarentegen spelen een rol bij de binding van de polysaccharide ketens in de EPS en zijn daarom belangrijk voor de hechting van diatomeeën aan het sedimentoppervlak en ook voor de verdediging tegen grazers. Om de resultaten van dit werk te kunnen vergelijken met andere studies die andere operationele gedefinieerde fracties gebruikten om EPS te extraheren, werden twee water-extracties (zuiver water en synthetisch zeewater) en de extractie met behulp van EDTA en de kation-uitwisselaar DOWEX met elkaar vegeleken. Er werd geen verschil gevonden tussen de twee water extracties, maar de EDTA extractie bleek vier keer efficiënter dan de DOWEX extractie, hoewel de samenstelling van de EPS dezelfde was. Van februari tot juni was de biomassa en de productie van diatomeeën en bacteriën nauw aan elkaar gekoppeld en vooral sulfaat reducerende bacteriën (SRB) profiteerden van de door de diatomeeën geproduceerde SCOA. Vanaf augustus werd de koppeling van biomassa en productie van diatomeeën en bacteriën minder sterk en de door de diatomeeën geproduceerde EPS bevorderde de groei van andere bacteriële taxa dan SRB. De seizoenvariatie in productie van de door diatomeeën uitgescheiden stoffen speelt dan ook een belangrijke rol bij het vormgeven van de samenstelling van de microbiële gemeenschap en de diversiteit van de geassocieerde bacteriën.

Samenvatting
248

References
R
efer
ence
s

References
250
Abramson FP, Black GE & Lecchi P (2001) Application of high-performance liquid chromatography with isotope-ratio mass spectrometry for measuring low levels of enrichment of underivatized materials. Journal of Chromatography A 913: 269-273.
Abramson FP (2003) Measuring DNA synthesis rates with stable isotopes. Analytical Chemistry 75: 56-63.
Admiraal W & Peletier H (1979) Influence of organic compounds and light limitation on the growth rate of estuarine benthic diatoms. British Phycological Journal. 14: 197-206.
Admiraal W, Peletier H & Brouwer T (1984) The seasonal succession patterns of diatom species on an intertidal mudflat: an experimental analysis. Oikos 42: 30-40.
Alberic P (2011) Liquid chromatography/mass spectrometry stable isotope analysis of dissolved organic carbon in stream and soil waters. Rapid Communications in Mass Spectrometry 25: 3012-3018.
Allen AE, Dupont CL, Oborník M, Horák A, Nunes-Nesi A, McCrow JP, Zheng H, Johnson DA, Hu H, Fernie AR & Bowler C (2011) Evolution and metabolic significance of the urea cycle in photosynthetic diatoms. Nature 473: 203-207.
Amann RI, Binder BJ, Olson RJ, Chisholm SW, Devereux R & Stahl DA (1990) Combination of 16S rRNA-targeted oligonucleotide probes with flow cytometry for analyzing mixed microbial populations. Applied Environmental Microbiology 56: 1919-1925.
Amin SA, Parker MS & Armbrust EV (2012) Interactions between diatom and bacteria. Microbiology and Molecular Biology Reviews 76: 667-684.
Amon RMW, Fitznar HP & Benner R (2001) Linkages among the bioreactivity, chemical composition, and diagenetic state of marine dissolved organic matter. Limnology and Oceanography 46: 287-297.
Armbrust EV, Berges JA, Bowler C et al. (2004) The genome of the diatom Thalassiosira pseudonana: ecology, evolution, and metabolism. Science 306: 79-86.
Auclair J, Lépine F & Villemur R (2012) A liquid chromatography–mass spectrometry method to measure 13C-isotope enrichment for DNA stable-isotope probing. Canadian Journal of Microbiology 58: 287-292.
Barnett A, Méléder V, Blommaert L, Lepetit B, Gaudin P, Vyverman W, Sabbe K, Dupuy C & Lavaud J (2015) Growth form defines physiological photoprotective capacity in intertidal benthic diatoms. The ISME Journal 9: 32-45.
Baumann K, Dignac MF, Bardoux G & Rumpel C (2012) Effect of 13C enrichment and sugar type on analysis of sugars by gas chromatography/combustion/isotope ratio mass spectrometry. Rapid Communications in Mass Spectrometry 26: 1934-1940.
Bellinger BJ, Abdullahi AS, Gretz MR & Underwood GJC (2005) Biofilm polymers: relationship between carbohydrate biopolymers from estuarine mudflats and unialgal cultures of benthic diatoms. Aquatic Microbial Ecology 38:169-180.
Bellinger BJ, Underwood GJC, Ziegler SE & Gretz MR (2009) Significance of diatom-derived polymers in carbon flow dynamics within estuarine biofilms determined through isotopic enrichment. Aquatic Microbial Ecology 55: 169-187.
Bender SJ, Parker MS & Armbrust EV (2012) Coupled effects of light and nitrogen source on the urea cycle and nitrogen metabolism over a diel cycle in the marine diatom Thalassiosira pseudonana. Protist 163: 232-251.
Berman T & Bronk DA (2003) Dissolved organic nitrogen: a dynamic participant in aquatic ecosystems. Aquatic Microbial Ecology 31: 279-305.
Bodé S, Denef K & Boeckx P (2009) Development and evaluation of a high‐performance liquid chromatography/isotope ratio mass spectrometry methodology for δ13C

Ref
eren
ces
251
analyses of amino sugars in soil. Rapid Communications in Mass Spectrometry 23: 2519-2526.
Boschker H, Bertilsson S, Dekkers E & Cappenberg T (1995) An inhibitor-based method to measure initial decomposition of naturally occurring polysaccharides in sediments. Applied and environmental microbiology 61: 2186-2192.
Boschker HTS (2004) Linking microbial community structure and functioning: stable isotope (13C) labeling in combination with PLFA analysis. In: Molecular Microbial Ecology. Ed. Kluwer Academic Publishers, Dordrecht, the Netherlands, manual II: 1673-1688.
Boschker HTS & Middelburg JJ (2002) Stable isotopes and biomarkers in microbial ecology. Fems Microbiology Ecology 40: 85-95.
Boschker HTS, de Brouwer JFC & Cappenberg TE (1999) The contribution of macrophyte-derived organic matter to microbial biomass in salt-marsh sediments: Stable carbon isotope analysis of microbial biomarkers. Limnology and Oceanography 44: 309-319.
Boschker HTS, Moerdijk-Poortvliet TCW, van Breugel P, Houtekamer M & Middelburg JJ (2008) A versatile method for stable carbon isotope analysis of carbohydrates by high-performance liquid chromatography/isotope ratio mass spectrometry. Rapid Communications in Mass Spectrometry 22: 3902-3908.
Boschker HTS, Nold SC, Wellsbury P, Bos D, de Graaf W, Pel R, Parkes RJ & Cappenberg TE (1998) Direct linking of microbial populations to specific biogeochemical processes by 13C-labelling of biomarkers. Nature 392: 801-805.
Bouillon S & Boschker HTS (2006) Bacterial carbon sources in coastal sediments: a cross-system analysis based on stable isotope data of biomarkers. Biogeosciences 3: 175-185.
Boyer PD (1998) Energy, life, and ATP. Bioscience Reports 18: 97-117. Brand W, Habfast K & Ricci M (1998) On-line combustion and high precision isotope
ratio monitoring of organic compounds. In: Advances in Mass Spectrometry. Ed. Heyden and Son, London, 11B: 1800-1811.
Brand WA, Coplen TB, Vogl J, Rosner M & Prohaska T (2014) Assessment of international reference materials for isotope-ratio analysis (IUPAC technical report). Pure and Applied Chemistry 86: 425-467.
Brenna JT, Corso TN, Tobias HJ & Caimi RJ (1997) High-precision continuous-flow isotope ratio mass spectrometry. Mass Spectrometry Reviews 16: 382-382.
Brown M, Jeffrey S, Volkman J & Dunstan G (1997) Nutritional properties of microalgae for mariculture. Aquaculture 151: 315-331.
Bruckner CG, Rehm C, Grossart HP & Kroth PG (2011) Growth and release of extracellular organic compounds by benthic diatoms depend on interactions with bacteria. Environmental Microbiology 13: 1052-1063.
Bruckner CG, Bahulikar R, Rahalkar M, Schink B & Kroth PG (2008) Bacteria associated with benthic diatoms from Lake Constance: Phylogeny and influences on diatom growth and secretion of extracellular polymeric substances. Applied and Environmental Microbiology 74: 7740-7749.
Buhmann MT, Schulze B, Förderer A, Schleheck D & Kroth PG (2016) Bacteria may induce the secretion of mucin-like proteins by the diatom Phaeodactylum tricornutum. Journal of Phycology 52: 463-474.
Bühring SI, Elvert M & Witte U (2005) The microbial community structure of different permeable sandy sediments characterized by the investigation of bacterial fatty acids and fluorescence in situ hybridization. Environmental Microbiology 7: 281-293.

References
252
Buma AG, Van Hannen E, Veldhuis MJ & Gieskes WW (1996) UV-B induces DNA damage and DNA synthesis delay in the marine diatom Cyclotella sp. Scientia Marina 60: 101-106.
Cabanero AI, Recio JL & Ruperez M (2006) Liquid chromatography coupled to isotope ratio mass spectrometry: A new perspective on honey adulteration detection. Journal of Agricultural and Food Chemistry 54: 9719-9727.
Cabanero AI, Recio JL & Ruperez M (2010) Simultaneous stable carbon isotopic analysis of wine glycerol and ethanol by liquid chromatography coupled to isotope ratio mass spectrometry. Journal of Agricultural and Food Chemistry 58: 722-728.
Cahoon LB (1999) The role of benthic microalgae in neritic ecosystems. Oceanography and Marine Biology: An Annual Review 37: 47-86
Caimi RJ & Brenna JT (1993) High-precision liquid chromatography-combustion isotope ratio mass-spectrometry. Analytical Chemistry 65: 3497-3500.
Carvalhais LC, Dennis PG, Fedoseyenko D, Hajirezaei MR, Borriss R & von Wirén N (2011) Root exudation of sugars, amino acids, and organic acids by maize as affected by nitrogen, phosphorus, potassium, and iron deficiency. Journal of Plant Nutrition and Soil Science 174: 3-11.
Cavaluzzi MJ & Borer PN (2004) Revised UV extinction coefficients for nucleoside-5’-monophosphates and unpaired DNA and RNA. Nucleic Acids Research 32: 1-9.
Chen G (2013) New advances in urea transporter UT-A1 membrane trafficking. International journal of molecular sciences 14: 10674-10682.
Chen P & Abramson FP (1998) Measuring DNA synthesis rates with [1-13C] glycine. Analytical Chemistry 70: 1664-1669.
Chessel D, Dufour A & Thioulouse J (2004) The ade4 package. I. One-table methods. R News 4: 5–10.
Chiovitti A, Bacic A, Burke J & Wetherbee R (2003) Heterogeneous xylose-rich glycans are associated with extracellular glycoproteins from the biofouling diatom Craspedostauros australis (Bacillariophyceae). European Journal of Phycology 38: 351-360.
Clonis YD & Lowe CR (1980) Affinity chromatography on immobilised nucleotides. European Journal of Biochemistry 110: 279-288.
Coffin RB, Velinsky D, Devereux R, Price W & Cifuentes L (1990) Stable carbon isotope analysis of nucleic acids to trace sources of dissolved substrates used by estuarine bacteria. Applied and Environmental Microbiology 56: 2012-2020.
Cogo PE, Ori C, Simonato M, Verlato G, Isak I, Hamvas A & Carnielli VP (2009) Metabolic precursors of surfactant disaturated-phosphatidylcholine in preterms with respiratory distress. Journal of Lipid Research 50: 2324-2331.
Cohn SA & Disparti NC (1994) Environmental factors influencing diatom cell motility. Journal of Phycology 30: 818-828.
Como S, Lefrancois C, Maggi E, Antognarelli F & Dupuy C (2014) Behavioral responses of juvenile golden gray mullet Liza aurata to changes in coastal temperatures and consequences for benthic food resources. Journal of Sea Research 92: 66-73.
Comte S, Guibaud G & Baudu M (2006) Relations between extraction protocols for activated sludge extracellular polymeric substances (EPS) and EPS complexation properties: Part I. Comparison of the efficiency of eight EPS extraction methods. Enzyme and Microbial Technology 38: 237-245.
Consalvey M, Paterson DM & Underwood GJ (2004) The ups and downs of life in a benthic biofilm: migration of benthic diatoms. Diatom Research 19: 181-202.

Ref
eren
ces
253
Coplen TB (2011) Guidelines and recommended terms for expression of stable‐isotope‐ratio and gas‐ratio measurement results. Rapid Communications in Mass Spectrometry 25: 2538-2560.
Coplen TB, Brand WA, Gehre M, Gröning M, Meijer HA, Toman B & Verkouteren RM (2006) New guidelines for δ13C measurements. Analytical Chemistry 78: 2439-2441.
Cowie GL & Hedges JI (1984) Determination of neutral sugars in plankton, sediments, and wood by capillary gas-chromatography of equilibrated isomeric mixtures. Analytical Chemistry 56: 497-504.
Craven D & Karl D (1984) Microbial RNA and DNA synthesis in marine sediments. Marine Biology 83: 129-139.
Creach V, Schricke M, Bertru G & Mariotti A (1997) Stable isotopes and gut analyses to determine feeding relationships in saltmarsh macroconsumers. Estuarine, Coastal and Shelf Science 44: 599-611.
Créach V, Lucas F, Deleu C, Bertru G & Mariotti A (1999) Combination of biomolecular and stable isotope techniques to determine the origin of organic matter used by bacterial communities: application to sediment. Journal of Microbiological Methods 38: 43-52.
Créach V, Ernst A, Sabbe K, Vanelslander B, Vyverman W & Stal LJ (2006) Using quantitative PCR to determine the distribution of a semicryptic benthic diatom, navicula phyllepta (bacillariophyceae). Journal of Phycology 42: 1142-1154.
Dauwe B & Middelburg JJ (1998) Amino acids and hexosamines as indicators of organic matter degradation state in North Sea sediments. Limnology and Oceanography 43: 782-798.
De Brouwer JFC & Stal LJ (2001) Short-term dynamics in microphytobenthos distribution and associated extracellular carbohydrates in surface sediments of an intertidal mudflat. Marine Ecology-Progress Series 218: 33-44.
De Brouwer JFC & Stal LJ (2002) Daily fluctuations of exopolymers in cultures of the benthic diatoms Cylindrotheca closterium and Nitzschia sp. (Bacillariophyceae). Journal of Phycology 38: 464-472.
De Brouwer JFC, Ruddy GK, Jones TER & Stal LJ (2002) Sorption of EPS to sediment particles and the effect on the rheology of sediment slurries. Biogeochemistry 61: 57-71.
De Brouwer JFC, Wolfstein K & Stal LJ (2002) Physical characterization and diel dynamics of different fractions of extracellular polysaccharides in an axenic culture of a benthic diatom. European Journal of Phycology 37: 37-44.
De Jonge V (1980) Fluctuations in the organic carbon to chlorophyll a ratios for estuarine benthic diatom populations. Marine Ecology-Progress Series 2: 345-353.
De Ruiter GA, Schols HA, Voragen AGJ & Rombouts FM (1992) Carbohydrate analysis of water-soluble uronic acid-containing polysaccharides with high-performance anion-exchange chromatography using methanolysis combined with TFA hydrolysis is superior to 4 other methods. Analytical Biochemistry 207: 176-185.
Decho AW (2000) Microbial biofilms in intertidal systems: an overview. Continental Shelf Research 20: 1257-1273.
Degré D, Leguerrier D, Armynot du Chatelet E et al. (2006) Comparative analysis of the food webs of two intertidal mudflats during two seasons using inverse modelling: Aiguillon Cove and Brouage Mudflat, France. Estuarine, Coastal and Shelf Science 69: 107-124.
Derrien D, Marol C & Balesdent J (2004) The dynamics of neutral sugars in the rhizosphere of wheat. An approach by 13C pulse-labelling and GC/C/IRMS. Plant and soil 267: 243-253.

References
254
Derrien D, Marol C & Balesdent J (2007) Microbial biosyntheses of individual neutral sugars among sets of substrates and soils. Geoderma 139: 190-198.
Derrien D, Balesdent J, Marol C & Santaella C (2003) Measurement of the 13C/12C ratio of soil‐plant individual sugars by gas chromatography/combustion/isotope‐ratio mass spectrometry of silylated derivatives. Rapid Communications in Mass Spectrometry 17: 2626-2631.
Dijkman NA & Kromkamp JC (2006) Phospholipid-derived fatty acids as chemotaxonomic markers for phytoplankton: application for inferring phytoplankton composition. Marine Ecology Progress Series 324: 113-125.
Dijkman NA, Boschker HTS, Middelburg JJ & Kromkamp JC (2009) Group-specific primary production based on stable-isotope labeling of phospholipid-derived fatty acids. Limnology and Oceanography-Methods 7: 612-625.
Docherty G, Jones V & Evershed RP (2001) Practical and theoretical considerations in the gas chromatography/combustion/isotope ratio mass spectrometry δ13C analysis of small polyfunctional compounds. Rapid Communications in Mass Spectrometry 15: 730-738.
Dolédec S & Chessel D (1994) Co-inertia analysis: an alternative method for studying species-environment relationships. Freshwater biology 31: 277-294.
Domozych D, Kort S, Benton S & Yu T (2005) The extracellular polymeric substance of the green alga Penium margaritaceum and its role in biofilm formation. Biofilms 2: 129-144.
Dray S, Chessel D & Thioulouse J (2003) Co-inertia analysis and the linking of ecological data tables. Ecology 84: 3078-3089.
Du GY, Son M, Yun M, An S & Chung IK (2009) Microphytobenthic biomass and species composition in intertidal flats of the Nakdong River estuary, Korea. Estuarine, Coastal and Shelf Science 82: 663-672.
Dugdale TM, Willis A & Wetherbee R (2006) Adhesive modular proteins occur in the extracellular mucilage of the motile, pennate diatom Phaeodactylum tricornutum. Biophysical journal 90: 58-60.
Edgar LA & Pickett-Heaps JD (1984) Diatom locomotion. Progress in Phycological Research 3: 47-88.
Eelderink C, Moerdijk-Poortvliet TCW, Wang H, Schepers M, Preston T, Vonk RJ, Schierbeek H & Priebe MG (2012) The glycemic response does not reflect the in vivo starch digestibility of fiber-rich wheat products in healthy men. The Journal of Nutrition 142: 258-263.
Eilers P & Peeters J (1988) A model for the relationship between light intensity and the rate of photosynthesis in phytoplankton. Ecological Modelling 42: 199-215.
Escoufier Y (1973) Le traitement des variables vectorielles. Biometrics 751-760. Evrard V, Cook PLM, Veuger B, Huettel M & Middelburg JJ (2008) Tracing carbon and
nitrogen incorporation and pathways in the microbial community of a photic subtidal sand. Aquatic Microbial Ecology 53: 257-269.
Evrard V, Huettel M, Cook PLM, Soetaert K, Heip CHR & Middelburg JJ (2012) Importance of phytodetritus and microphytobenthos for heterotrophs in a shallow subtidal sandy sediment. Marine Ecology-Progress Series 455: 13-31.
Falkowski P, Scholes R, Boyle E et al. (2000) The global carbon cycle: a test of our knowledge of earth as a system. Science 290: 291-296.
Federherr E, Willach S, Roos N, Lange L, Molt K & Schmidt TC (2016) A novel high-temperature combustion interface for compound-specific stable isotope analysis of carbon and nitrogen via high-performance liquid chromatography/isotope ratio mass spectrometry. Rapid Communications in Mass Spectrometry 30: 944-952.
Ref
eren
ces
255
Fields MW, Hise A, Lohman EJ, Bell T, Gardener RD, Corredor L, Moll K, Peyton BM, Characklis GW & Gerlach R (2014) Sources and resources: importance of nutrients, resource allocation, and ecology in microalgal cultivation for lipid accumulation. Applied Microbiology and Biotechnology 98: 4805-4816.
Flärdh K, Cohen PS & Kjelleberg S (1992) Ribosomes exist in large excess over the apparent demand for protein synthesis during carbon starvation in marine Vibrio sp. strain CCUG 15956. Journal of Bacteriology 174: 6780-6788.
Flemming HC, Wingender J, Mayer C, Korstgens V & Borchard W (2000) Cohesiveness in biofilm matrix polymers. In: Community structure and cooperation in biofilms. Ed. Cambridge University Press, Cambridge, 87-106.
Flemming HC & Wingender J (2010) The biofilm matrix. Nature Reviews Microbiology 8: 623-633.
Forster R, Créach V, Sabbe K, Vyverman W & Stal L (2006) Biodiversity-ecosystem function relationship in microphytobenthic diatoms of the Westerschelde estuary. Marine Ecology-Progress Series 311: 191-201.
Fry B (2007) Stable isotope ecology. Ed. Springer Science & Business Media, New York, 1-295.
Fuchs BM, Glöckner FO, Wulf J & Amann R (2000) Unlabeled helper oligonucleotides increase the in situ accessibility to 16S rRNA of fluorescently labeled oligonucleotide probes. Applied Environmental Microbiology 66: 3603-3607.
Fuchs BM, Wallner G, Beisker W, Schwippl I, Ludwig W & Amann R (1998) Flow cytometric analysis of the in situ accessibility of Escherichia coli 16S rRNA for fluorescently labeled oligonucleotide probes. Applied Environmental Microbiology. 64: 4973-4982.
Gattuso JP, Frankignoulle M & Wollast R (1998) Carbon and carbonate metabolism in coastal aquatic ecosystems. Annual Review of Ecology and Systematics. 29: 405-434.
Giroldo D, Vieira AAH & Paulsen BS (2003) Relative increase of deoxy sugars during microbial degradation of an extracellular polysaccharide released by a tropical freshwater Thalassiosira sp.(bacillariophyceae). Journal of Phycology 39: 1109-1115.
Glaser B (2005) Compound-specific stable-isotope (δ13C) analysis in soil science. Journal of Plant Nutrition and Soil Science 168: 633-648.
Glaser B & Amelung W (2002) Determination of 13C natural abundance of amino acid enantiomers in soil: methodological considerations and first results. Rapid Communications in Mass Spectrometry 16: 891-898.
Glaser B & Gross S (2005) Compound-specific δ13C analysis of individual amino sugars - a tool to quantify timing and amount of soil microbial residue stabilization. Rapid Communications in Mass Spectrometry 19: 1409-1416.
Godin JP & McCullagh JSO (2011) Review: Current applications and challenges for liquid chromatography coupled to isotope ratio mass spectrometry (LC/IRMS). Rapid Communications in Mass Spectrometry 25: 3019-3028.
Godin JP, Fay LB & Hopfgartner G (2007) Liquid chromatography combined with mass spectrometry for 13C isotopic analysis in life science research. Mass Spectrometry Reviews 26: 751-774.
Godin JP, Hopfgartner G & Fay L (2008) Temperature-programmed high-performance liquid chromatography coupled to isotope ratio mass spectrometry. Analytical Chemistry 80: 7144-7152.

References
256
Godin JP, Hau J, Fay LB & Hopfgartner G (2005) Isotope ratio monitoring of small molecules and macromolecules by liquid chromatography coupled to isotope ratio mass spectrometry. Rapid Communications in Mass Spectrometry 19: 2689-2698.
Godin JP, Faure M, Breuille D, Hopfgartner G & Fay LB (2007) Determination of 13C isotopic enrichment of valine and threonine by GC-C-IRMS after formation of the N(O,S)-ethoxycarbonyl ethyl ester derivatives of the amino acids. Analytical and Bioanalytical Chemistry 388: 909-918.
Godin JP, Breuille D, Obled C, Papet I, Schierbeek H, Hopfgartner G & Fay LB (2008) Liquid and gas chromatography coupled to isotope ratio mass spectrometry for the determination of 13C-valine isotopic ratios in complex biological samples. Journal of Mass Spectrometry 43: 1334-1343.
Goto N, Mitamura O & Terai H (2001) Biodegradation of photosynthetically produced extracellular organic carbon from intertidal benthic algae. Journal of Experimental Marine Biology and Ecology 257: 73-86.
Goto N, Kawamura T, Mitamura O & Terai H (1999) Importance of extracellular organic carbon production in the total primary production by tidal-flat diatoms in comparison to phytoplankton. Marine Ecology-Progress series 190: 289-295.
Granum E, Kirkvold S & Myklestad SM (2002) Cellular and extracellular production of carbohydrates and amino acids by the marine diatom Skeletonema costatum: diel variations and effects of N depletion. Marine Ecology-Progress Series 242: 83-94.
Griffiths RI, Whiteley AS, O'Donnell AG & Bailey MJ (2000) Rapid method for coextraction of DNA and RNA from natural environments for analysis of ribosomal DNA-and rRNA-based microbial community composition. Applied and Environmental Microbiology 66: 5488-5491.
Gross S & Glaser B (2004) Minimization of carbon addition during derivatization of monosaccharides for compound-specific δ13C analysis in environmental research. Rapid Communications in Mass Spectrometry 18: 2753-2764.
Guo-Qing Y, Shi L-E, Yu Y, Zhen-Xing T & Jian-Shu C (2006) Production, purification and characterization of Nuclease P1 from Penicillium citrinum. Process Biochemistry 41: 1276-1281.
Guschina IA & Harwood JL (2006) Lipids and lipid metabolism in eukaryotic algae. Progress in Lipid Research 45: 160-186.
Hamm CE, Merkel R, Springer O, Jurkojc P, Maier C, Prechtel K & Smetacek V (2003) Architecture and material properties of diatom shells provide effective mechanical protection. Nature 421: 841-843.
Hanlon A, Bellinger B, Haynes K et al. (2006) Dynamics of extracellular polymeric substance (EPS) production and loss in an estuarine, diatom-dominated, microalgal biofilm over a tidal emersion-immersion period. Limnology and Oceanography 51: 79-93.
Hayes J, Freeman K, Ricci M et al. (1989) A new approach to isotope-ratio-monitoring gas chromatography mass spectrometry. In: Advances in Mass Spectrometry. Ed. Heyden and Son, London, B11: 1808-1809.
Hayes JM (1983) Practice and principles of isotopic measurements in organic geochemistry. In: Organic geochemistry of contemporaneous and ancient sediments. Ed. W.G. Meinschein, Society for Economic Paleontologists and Mineralogists, Bloomington, Indiana, 1-25
Haynes K, Hofmann TA, Smith CJ, Ball AS, Underwood GJC & Osborn AM (2007) Diatom-derived carbohydrates as factors affecting bacterial community composition in estuarine sediments. Applied Environmental Microbiology 73: 6112-6124.

Ref
eren
ces
257
Heinzelmann SM, Bale NJ, Hopmans EC, Damsté JSS, Schouten S & van der Meer MT (2014) Critical assessment of glyco-and phospholipid separation by using silica chromatography. Applied and Environmental Microbiology 80: 360-365.
Heip CH, Goosen N, Herman P, Kromkamp J, Middelburg J & Soetaert K (1995) Production and consumption of biological particles in temperate tidal estuaries. Oceanography and Marine Biology: An Annual Review 33: 1-149
Heo M & Ruben Gabriel K (1998) A permutation test of association between configurations by means of the RV coefficient. Communications in Statistics-Simulation and Computation 27: 843-856.
Herman P, Middelburg J, Van de Koppel J & Heip C (1999) Ecology of estuarine macrobenthos. Advances in Ecological Research 29: 195-240.
Herman PM, Middelburg JJ, Widdows J, Lucas C & Heip CH (2000) Stable isotopes as trophic tracers: combining field sampling and manipulative labelling of food resources for macrobenthos. Marine Ecology-Progress Series 204: 79-92.
Heuer V, Elvert M, Tille S, Krummen M, Mollar XP, Hmelo LR & Hinrichs KU (2006) Online δ13C analysis of volatile fatty acids in sediment/porewater systems by liquid chromatography-isotope ratio mass spectrometry. Limnology and Oceanography-Methods 4: 346-357.
Heuer VB, Pohlman JW, Torres ME, Elvert M & Hinrichs KU (2009) The stable carbon isotope biogeochemistry of acetate and other dissolved carbon species in deep subseafloor sediments at the northern Cascadia Margin. Geochimica Et Cosmochimica Acta 73: 3323-3336.
Hicks N, Bulling MT, Solan M, Raffaelli D, White PCL & Paterson DM (2011) Impact of biodiversity-climate futures on primary production and metabolism in a model benthic estuarine system. BMC Ecology 11: 7-15.
Hillebrand H, Dürselen CD, Kirschtel D, Pollingher U & Zohary T (1999) Biovolume calculation for pelagic and benthic microalgae. Journal of Phycology 35: 403-424.
Hoagland KD, Rosowski JR, Gretz MR & Roemer SC (1993) Diatom extracellular polymeric substances: function, fine structure, chemistry, and physiology. Journal of Phycology 29: 537-566.
Hockin NL, Mock T, Mulholland F, Kopriva S & Malin G (2012) The response of diatom central carbon metabolism to nitrogen starvation is different from that of green algae and higher plants. Plant Physiology 158: 299-312.
Hu Q, Sommerfeld M, Jarvis E, Ghirardi M, Posewitz M, Seibert M & Darzins A (2008) Microalgal triacylglycerols as feedstocks for biofuel production: perspectives and advances. The Plant Journal 54: 621-639.
Hunter EM, Mills HJ & Kostka JE (2006) Microbial community diversity associated with carbon and nitrogen cycling in permeable shelf sediments. Applied and Environmental Microbiology 72: 5689-5701.
Hurt RA, Qiu X, Wu L, Roh Y, Palumbo A, Tiedje J & Zhou J (2001) Simultaneous recovery of RNA and DNA from soils and sediments. Applied and Environmental Microbiology 67: 4495-4503.
Jachlewski S, Jachlewski WD, Linne U, Bräsen C, Wingender J & Siebers B (2015) Isolation of extracellular polymeric substances from biofilms of the thermoacidophilic archaeon Sulfolobus acidocaldarius. Frontiers in bioengineering and biotechnology 3: 1-11.
Jesus B, Brotas V, Ribeiro L, Mendes C, Cartaxana P & Paterson D (2009) Adaptations of microphytobenthos assemblages to sediment type and tidal position. Continental Shelf Research 29: 1624-1634.

References
258
Jiang H & Gao K (2004) Effects of lowering temperature during culture on the production of polyunsaturated fatty acids in the marine diatom Phaeodactylum tricornutum (bacillariophyceae). Journal of Phycology 40: 651-654.
Jochmann M & Schmidt T (2012) Compound-Specific Stable Isotope Analysis. Ed. Royal Society of Chemistry Publishing, Cambridge, 1-376.
Johnson DC, Dobberpuhl D, Roberts R & Vandeberg P (1993) Pulsed amperometric detection of carbohydrates, amines and sulfur species in ion chromatography – the current state of research. Journal of Chromatography A 640: 79-96.
Johnson DC & Lacourse WR (1990) Liquid-Chromatography with Pulsed Electrochemical Detection at Gold and Platinum-Electrodes. Analytical Chemistry 62: 589-597.
Jones RH & Flynn KJ (2005) Nutritional status and diet composition affect the value of diatoms as copepod prey. Science 307: 1457-1459.
Jørgensen BB (2000) Bacteria and Marine Biogeochemistry. In: Marine Geochemistry. Ed. Schulz HD & Zabel M, Springer Berlin Heidelberg, Berlin, 169-206.
Kerkhof L & Kemp P (1999) Small ribosomal RNA content in marine Proteobacteria during non-steady-state growth. FEMS Microbiology Ecology 30: 253-260.
Kromkamp J, De Brouwer JFC, Blanchard G, Forster RM & Créach V (2006) Functioning of microphytobenthos in estuaries: Proceedings of the Colloquium, Amsterdam, August 2003. Ed. J. Kromkamp, Royal Netherlands Academy of Arts and Sciences, Amsterdam, 1-262.
Kromkamp JC & Forster RM (2003) The use of variable fluorescence measurements in aquatic ecosystems: differences between multiple and single turnover measuring protocols and suggested terminology. European Journal of Phycology 38: 103-112.
Krumbock M & Conrad R (1991) Metabolism of position-labeled glucose in anoxic methanogenic paddy soil and lake sediment. FEMS Microbiology Ecology 85: 247-256.
Krummen M, Hilkert AW, Juchelka D, Duhr A, Schluter HJ & Pesch R (2004) A new concept for isotope ratio monitoring liquid chromatography/mass spectrometry. Rapid Communications in Mass Spectrometry 18: 2260-2266.
Kuczynska P, Jemiola-Rzeminska M & Strzalka K (2015) Photosynthetic pigments in diatoms. Marine Drugs 13: 5847-5881.
Lafosse R & Hanafi M (1997) Concordance d'un tableau avec K tableaux: définition de K+ 1 uples synthétiques. Revue de statistique appliquée 45: 111-126.
Lahaye M & Jegou D (1993) Chemical and physical-chemical characteristics of dietary fibres from Ulva lactuca (L.) Thuret and Enteromorpha compressa (L.) Grev. Journal of Applied Phycology 5: 195-200.
Lecchi P & Abramson FP (1999) Size exclusion chromatography-chemical reaction interface mass spectrometry: “a perfect match”. Analytical Chemistry 71: 2951-2955.
Lee C, Wakeham S & Arnosti C (2004) Particulate organic matter in the sea: the composition conundrum. AMBIO: A Journal of the Human Environment 33: 565-575.
Levin EJ, Quick M & Zhou M (2009) Crystal structure of a bacterial homologue of the kidney urea transporter. Nature 462: 757-761.
Levitan O, Dinamarca J, Zelzion E et al. (2015) Remodeling of intermediate metabolism in the diatom Phaeodactylum tricornutum under nitrogen stress. Proceedings of the National Academy of Sciences 112: 412-417.
Lewin J & Hellebust JA (1976) Heterotrophic nutrition of the marine pennate diatom Nitzschia angularis var. affinis. Marine Biology 36: 313-320.

Ref
eren
ces
259
Litchman E, Klausmeier C & Yoshiyama K (2009) Contrasting size evolution in marine and freshwater diatoms. Proceedings of the National Academy of Sciences 106: 2665-2670.
Loy A, Lehner A, Lee N et al. (2002) Oligonucleotide microarray for 16S rRNA gene-based detection of all recognized lineages of sulfate-reducing prokaryotes in the environment. Applied Environmental Microbiology 68: 5064-5081.
Ludwig W, Strunk O, Westram R et al. (2004) ARB: A software environment for sequence data. Nucleic Acids Research 32: 1363-1371.
Macalady JL, Lyon EH, Koffman B, Albertson LK, Meyer K, Galdenzi S & Mariani S (2006) Dominant microbial populations in limestone-corroding stream biofilms, Frasassi cave system, Italy. Applied Environmental Microbiology 72: 5596-5609.
MacGregor BJ, Friedman A & Juchelka D (2004) irm-LC/MS: δ13C analysis of RNA. Thermo Scientific Application Note 30055.
MacGregor BJ, Brüchert V, Fleischer S & Amann R (2002) Isolation of small-subunit rRNA for stable isotopic characterization. Environmental Microbiology 4: 451-464.
MacIntyre HL & Cullen JJ (1996) Primary production by suspended and benthic microalgae in a turbid estuary: Time-scales of variability in San Antonio Bay, Texas. Marine Ecology-Progress Series 145: 245-268.
MacIntyre HL, Geider RJ & Miller DC (1996) Microphytobenthos: The ecological role of the ''secret garden'' of unvegetated, shallow-water marine habitats. I. Distribution, abundance and primary production. Estuaries 19: 186-201.
Macko S, Ryan M & Engel M (1998) Stable isotopic analysis of individual carbohydrates by gas chromatographic/combustion/isotope ratio mass spectrometry. Chemical Geology 152: 205-210.
Macko SA, Helleur R, Hartley G & Jackman P (1990) Diagenesis of organic-matter - a study using stable isotopes of individual carbohydrates. Organic Geochemistry 16: 1129-1137.
Marmur J & Doty P (1962) Determination of the base composition of deoxyribonucleic acid from its thermal denaturation temperature. Journal of Molecular Biology 5: 109-118.
Martinez RJ, Mills HJ, Story S & Sobecky PA (2006) Prokaryotic diversity and metabolically active microbial populations in sediments from an active mud volcano in the Gulf of Mexico. Environmental Microbiology 8: 1783-1796.
McCullagh J, Gaye-Siessegger J & Focken U (2008) Determination of underivatized amino acid delta 13C by liquid chromatography/isotope ratio mass spectrometry for nutritional studies: the effect of dietary non-essential amino acid profile on the isotopic signature of individual amino acids in fish. Rapid Communications in Mass Spectrometry 22: 1817-1822.
McCullagh J, Godin JP, Schierbeek H & Preston T (2011) Liquid Chromatography‐Isotope Ratio Mass Spectrometry Users Meeting, November 23–24, 2010, University of Oxford, UK. Rapid Communications in Mass Spectrometry 25: 2969-2970.
McCullagh JSO (2010) Mixed-mode chromatography/isotope ratio mass spectrometry. Rapid Communications in Mass Spectrometry 24: 483-494.
McCullagh JSO, Juchelka D & Hedges REM (2006) Analysis of amino acid 13C abundance from human and faunal bone collagen using liquid chromatography/isotope ratio mass spectrometry. Rapid Communications in Mass Spectrometry 20: 2761-2768.
McKee T & McKee JR (2009) Biochemistry: the molecular basis of life. Ed. Oxford University Press, Oxford, UK, 1-880.

References
260
McKew BA, Dumbrell AJ, Taylor JD, McGenity TJ & Underwood GJC (2013) Differences between aerobic and anaerobic degradation of microphytobenthic biofilm-derived organic matter within intertidal sediments. FEMS Microbiology Ecology 84: 495-509.
McLean M, Vestal ML, Teffera Y & Abramson FP (1996) Element- and isotope-specific detection for high-performance liquid chromatography using chemical reaction interface mass spectrometry. Journal of Chromatography A 732: 189-199.
Meier-Augenstein W (1999) Applied gas chromatography coupled to isotope ratio mass spectrometry. Journal of Chromatography A 842: 351-371.
Merritt DA, Freeman KH, Ricci MP, Studley SA & Hayes J (1995) Performance and optimization of a combustion interface for isotope ratio monitoring gas chromatography/mass spectrometry. Analytical Chemistry 67: 2461-2473.
Middelburg J (2014) Stable isotopes dissect aquatic food webs from the top to the bottom. Biogeosciences 11: 2357-2371.
Middelburg JJ, Barranguet C, Boschker HTS, Herman PMJ, Moens T & Heip CHR (2000) The fate of intertidal microphytobenthos carbon: An in situ 13C-labeling study. Limnology and Oceanography 45: 1224-1234.
Mills HJ, Martinez RJ, Story S & Sobecky PA (2005) Characterization of microbial community structure in Gulf of Mexico gas hydrates: Comparative analysis of DNA- and RNA-derived clone libraries. Applied Environmental Microbiology 71: 3235-3247.
Mitbavkar S & Anil A (2004) Vertical migratory rhythms of benthic diatoms in a tropical intertidal sand flat: influence of irradiance and tides. Marine Biology 145: 9-20.
Miyajima T, Yamada Y, Hanba YT, Yoshii K, Koitabashi T & Wada E (1995) Determining the stable isotope ratio of total dissolved inorganic carbon in lakewater by GC/C/IRMS. Limnology and Oceanography 40: 994-1000.
Miyatake T, MacGregor BJ & Boschker HTS (2009) Linking microbial community function to phylogeny of sulfate-reducing Deltaproteobacteria in marine sediments by combining stable isotope probing with magnetic-bead capture hybridization of 16S rRNA. Applied and Environmental Microbiology 75: 4927-4935.
Miyatake T, MacGregor BJ & Boschker HTS (2013) Depth-related differences in organic substrate utilization by major microbial groups in intertidal marine sediment. Applied and Environmental Microbiology 79: 389-392.
Miyatake T, Moerdijk-Poortvliet TCW, Stal LJ & Boschker HTS (2014) Tracing carbon flow from microphytobenthos to major bacterial groups in an intertidal marine sediment by using an in situ 13C pulse-chase method. Limnology and Oceanography 59: 1275-1287.
Moerdijk-Poortvliet TCW, Brasser J, Ruiter G, Houtekamer M, Bolhuis H, Stal LJ & Boschker HTS (2014) A versatile method for simultaneous stable carbon isotope analysis of DNA and RNA nucleotides by liquid chromatography/isotope ratio mass spectrometry. Rapid Communications in Mass Spectrometry 28: 1401-1411.
Moerdijk-Poortvliet TCW, Stal LJ & Boschker HTS (2014) LC/IRMS analysis: A powerful technique to trace carbon flow in microphytobenthic communities in intertidal sediments. Journal of Sea Research 92: 19-25.
Moers M, Jones D, Eakin P, Fallick A, Griffiths H & Larter S (1993) Carbohydrate diagenesis in hypersaline environments: application of GC-IRMS to the stable isotope analysis of derivatized saccharides from surficial and buried sediments. Organic Geochemistry 20: 927-933.
Mopper K (1977) Sugars and uronic acids in sediment and water from the Black Sea and North Sea with emphasis on analytical techniques. Marine Chemistry 5: 585-603.

Ref
eren
ces
261
Morrison DJ, Taylor K & Preston T (2010) Strong anion-exchange liquid chromatography coupled with isotope ratio mass spectrometry using a Liquiface interface. Rapid Communications in Mass Spectrometry 24: 1755-1762.
Mouget JL, Perkins R, Consalvey M & Lefebvre S (2008) Migration or photoacclimation to prevent high irradiance and UV-B damage in marine microphytobenthic communities. Aquatic Microbial Ecology 52: 223-232.
Nicholls RJ & Cazenave A (2010) Sea-level rise and its impact on coastal zones. Science 328: 1517-1520.
Nogales B, Moore ERB, Abraham WR & Timmis KN (1999) Identification of the metabolically active members of a bacterial community in a polychlorinated biphenyl-polluted moorland soil. Environmental Microbiology 1: 199-212.
Noordkamp D, Gieskes W, Gottschal J, Forney L & Van Rijssel M (2000) Acrylate in Phaeocystis colonies does not affect the surrounding bacteria. Journal of Sea Research 43: 287-296.
Novitsky JA & MacSween MC (1989) Microbiology of a high energy beach sediment: Evidence for an active and growing community. Marine Ecology-Progress Series 52: 71-75.
Oakes JM, Eyre BD & Middelburg JJ (2012) Transformation and fate of microphytobenthos carbon in subtropical shallow subtidal sands: A 13C-labeling study. Limnology and Oceanography 57: 1846-1856.
Oakes JM, Eyre BD, Middelburg JJ & Boschker HTS (2010) Composition, production, and loss of carbohydrates in subtropical shallow subtidal sandy sediments: Rapid processing and long-term retention revealed by 13C-labeling. Limnology and Oceanography 55: 2126-2138.
Oakley KE (2010) Molecular mechanisms of urea uptake in marine diatoms. (Doctoral dissertation, 89 pg), Retrieved from UC San Diego Electronic Theses and Dissertations (Local Identifier b6870133).
Olson RJ, Vaulot D & Chisholm SW (1986) Effects of environmental stresses on the cell cycle of two marine phytoplankton species. Plant Physiology 80: 918-925.
Panagiotopoulos C & Sempere R (2005) Analytical methods for the determination of sugars in marine samples: A historical perspective and future directions. Limnology and Oceanography-Methods 3: 419-454.
Paterson D & Hagerthey S (2001) Microphytobenthos in constrasting coastal ecosystems: Biology and dynamics. In: Ecological Comparisons of Sedimentary Shores. Ed. Springer Science & Business Media, New York, 105-125.
Paterson DM & Black KS (1999) Water flow, sediment dynamics and benthic biology. Advanced Ecology Research 29: 155-193.
Peletier H, Gieskes W & Buma A (1996) Ultraviolet-B radiation resistance of benthic diatoms isolated from tidal flats in the Dutch Wadden Sea. Marine Ecology-Progress Series 135: 163-168.
Penning H & Conrad R (2006) Carbon isotope effects associated with mixed-acid fermentation of saccharides by Clostridium papyrosolvens. Geochimica Et Cosmochimica Acta 70: 2283-2297.
Peterson BJ & Fry B (1987) Stable isotopes in ecosystem studies. Annual Review of Ecology and Systematics 18: 293-320.
Pierre G, Graber M, Orvain F, Dupuy C & Maugard T (2010) Biochemical characterization of extracellular polymeric substances extracted from an intertidal mudflat using a cation exchange resin. Biochemical Systematics and Ecology 38: 917-923.

References
262
Pierre G, Graber M, Rafiliposon BA, Dupuy C, Orvain F, De Crignis M & Maugard T (2012) Biochemical composition and changes of extracellular polysaccharides (ECPS) produced during microphytobenthic biofilm development (Marennes-Oléron, France). Microbial ecology 63: 157-169.
Pierre G, Zhao J-M, Orvain F, Dupuy C, Klein GL, Graber M & Maugard T (2014) Seasonal dynamics of extracellular polymeric substances (EPS) in surface sediments of a diatom-dominated intertidal mudflat (Marennes–Oléron, France). Journal of Sea Research 92: 26-35.
Pinckney JL & Zingmark R (1991) Effects of tidal stage and sun angles on intertidal benthic microalgal productivity. Marine Ecology-Progress Series 76: 81-89.
Prihoda J, Tanaka A, de Paula WB, Allen JF, Tirichine L & Bowler C (2012) Chloroplast-mitochondria cross-talk in diatoms. Journal of Experimental Botany 63: 1543-1557.
Quemener B, Lahaye M & BobinDubigeon C (1997) Sugar determination in ulvans by a chemical-enzymatic method coupled to high performance anion exchange chromatography. Journal of Applied Phycology 9: 179-188.
Rawat I, Kumar RR, Mutanda T & Bux F (2013) Biodiesel from microalgae: a critical evaluation from laboratory to large scale production. Applied Energy 103: 444-467.
Redmile-Gordon M, Evershed R, Hirsch P, White R & Goulding K (2015) Soil organic matter and the extracellular microbial matrix show contrasting responses to C and N availability. Soil Biology and Biochemistry 88: 257-267.
Rieley G (1994) Derivatization of organic-compounds prior to gas-chromatographic combustion-isotope ratio mass-spectromic analysis - identification of isotope fractionation processes. Analyst 119: 915-919.
Robert P & Escoufier Y (1976) A unifying tool for linear multivariate statistical methods: the RV-coefficient. Applied statistics 257-265.
Ruiz-Matute AI, Hernandez-Hernandez O, Rodríguez-Sánchez S, Sanz ML & Martínez-Castro I (2011) Derivatization of carbohydrates for GC and GC–MS analyses. Journal of Chromatography B 879: 1226-1240.
Rusch A, Huettel M, Reimers CE, Taghon GL & Fuller CM (2003) Activity and distribution of bacterial populations in Middle Atlantic Bight shelf sands. FEMS Microbiology Ecology 44: 89-100.
Sabbe K, Witkowski A & Vyverman W (1995) Taxonomy, morphology and ecology of Biremis lucens comb. Nov.(Bacillariophyta): A brackish-marine, benthic diatom species comprising different morphological types. Botanica marina 38: 379-392.
Sahan E, Sabbe K, Creach V, Hernandez-Raquet G, Vyverman W, Stal LJ & Muyzer G (2007) Community structure and seasonal dynamics of diatom biofilms and associated grazers in intertidal mudflats. Aquatic Microbial Ecology 47: 253-266.
Sakthivel R (2011) Microalgae lipid research, past, present: a critical review for biodiesel production, in the future. Journal of Experimental Sciences 2: 29-49.
Schierbeek H, van den Akker CH, Fay LB & van Goudoever JB (2012) High-precision mass spectrometric analysis using stable isotopes in studies of children. Mass Spectrometry Reviews 31: 312-330.
Schierbeek H, Braakel FT, Godin JP, Fay LB & van Goudoever JB (2007) Novel method for measurement of glutathione kinetics in neonates using liquid chromatography coupled to isotope ratio mass spectrometry. Rapid Communications in Mass Spectrometry 21: 2805-2812.
Schierbeek H, Moerdijk-Poortvliet TCW, van den Akker CHP, te Braake FWJ, Boschker HTS & van Goudoever JB (2009) Analysis of [U-13C6] glucose in human plasma using liquid chromatography/isotope ratio mass spectrometry compared with two
Ref
eren
ces
263
other mass spectrometry techniques. Rapid Communications in Mass Spectrometry 23: 3824-3830.
Schmitt J, Glaser B & Zech W (2003) Amount-dependent isotopic fractionation during compound-specific isotope analysis. Rapid Communications in Mass Spectrometry 17: 970-977.
Schönhuber W, Zarda B, Eix S, Rippka R, Herdman M, Ludwig W & Amann R (1999) In situ identification of cyanobacteria with horseradish peroxidase-labeled, rRNA-targeted oligonucleotide probes. Applied Environmental Microbiology 65: 1259-1267.
Serôdio J & Catarino F (1999) Fortnightly light and temperature variability in estuarine intertidal sediments and implications for microphytobenthos primary productivity. Aquatic Ecology 33: 235-241.
Serôdio J, Vieira S, Cruz S & Barroso F (2005) Short-term variability in the photosynthetic activity of microphytobenthos as detected by measuring rapid light curves using variable fluorescence. Marine Biology 146: 903-914.
Sessions AL (2006) Isotope-ratio detection for gas chromatography. Journal of Separation Science 29: 1946-1961.
Shimelis O & Giese RW (2006) Nuclease P1 digestion/high-performance liquid chromatography, a practical method for DNA quantitation. Journal of Chromatography A 1117: 132-136.
Shivji M, Rogers S & Stanhope M (1992) Rapid isolation of high molecular weight DNA from marine macroalgae. Marine Ecology-Progress Series 84: 197-203.
Smith CI, Fuller BT, Choy K & Richards MP (2009) A three-phase liquid chromatographic method for δ13C analysis of amino acids from biological protein hydrolysates using liquid chromatography-isotope ratio mass spectrometry. Analytical Biochemistry 390: 165-172.
Smith DJ & Underwood GJC (1998) Exopolymer production by intertidal epipelic diatoms. Limnology and Oceanography 43: 1578-1591.
Smith DJ & Underwood GJ (2000) The production of extracellular carbohydrates by estuarine benthic diatoms: the effects of growth phase and light and dark treatment. Journal of Phycology 36: 321-333.
St-Jean G (2003) Automated quantitative and isotopic (13C) analysis of dissolved inorganic carbon and dissolved organic carbon in continuous‐flow using a total organic carbon analyser. Rapid Communications in Mass Spectrometry 17: 419-428.
Staats N, Stal LJ & Mur LR (2000) Exopolysaccharide production by the epipelic diatom Cylindrotheca closterium: effects of nutrient conditions. Journal of Experimental Marine Biology and Ecology 249: 13-27.
Staats N, De Winder B, Stal L & Mur L (1999) Isolation and characterization of extracellular polysaccharides from the epipelic diatoms Cylindrotheca closterium and Navicula salinarum. European Journal of Phycology 34: 161-169.
Staats N, Stal LJ, de Winder B & Mur LR (2000) Oxygenic photosynthesis as driving process in exopolysaccharide production of benthic diatoms. Marine Ecology-Progress Series 193: 261-269.
Stal LJ (2003) Microphytobenthos, their extracellular polymeric substances, and the morphogenesis of intertidal sediments. Geomicrobiology Journal 20: 463-478.
Stal LJ (2010) Microphytobenthos as a biogeomorphological force in intertidal sediment stabilization. Ecological Engineering 36: 236-245.
Stal LJ & Defarge C (2007) Structure and dynamics of exopolymers in an intertidal diatom biofilm. Geomicrobiology Journal 24: 77-77.
Stewart PS (2003) Diffusion in biofilms. Journal of Bacteriology 185: 1485-1491.

References
264
Sundh I (1992) Biochemical composition of dissolved organic carbon derived from phytoplankton and used by heterotrophic bacteria. Applied Environmental Microbiology 58: 2938-2947.
Sundh I (1992) Biochemical-composition of dissolved organic-carbon derived from phytoplankton and used by heterotrophic bacteria. Applied and Environmental Microbiology 58: 2938-2947.
Sutherland IW (2001) Biofilm exopolysaccharides: a strong and sticky framework. Microbiology 147: 3-9.
Swarts SG, Smith GS, Miao L & Wheeler KT (1996) Effects of formic acid hydrolysis on the quantitative analysis of radiation-induced DNA base damage products assayed by gas chromatography/mass spectrometry. Radiation and Environmental Biophysics 35: 41-53.
Szabados L & Savoure A (2010) Proline: a multifunctional amino acid. Trends in plant science 15: 89-97.
Takahashi E, Ledauphin J, Goux D & Orvain F (2010) Optimising extraction of extracellular polymeric substances (EPS) from benthic diatoms: comparison of the efficiency of six EPS extraction methods. Marine and Freshwater Research 60: 1201-1210.
Taylor JD, McKew BA, Kuhl A, McGenity TJ & Underwood GJC (2013) Microphytobenthic extracellular polymeric substances (EPS) in intertidal sediments fuel both generalist and specialist EPS-degrading bacteria. Limnology and Oceanography 58: 1463-1480.
Team RC (2015) R: A language and environment for statistical computing. R Foundation for Statistical Computing, Vienna, Austria.
Teece MA & Fogel ML (2007) Stable carbon isotope biogeochemistry of monosaccharides in aquatic organisms and terrestrial plants. Organic Geochemistry 38: 458-473.
Teffera Y, Abramson FP, McLean M & Vestal M (1993) Development of an isotope-selective high-performance liquid-chromatography detector using chemical-reaction-interface mass-spectrometry - application to deuterated cortisol metabolites in urine. Journal of Chromatography-Biomedical Applications 620: 89-96.
Telfer A (2002) What is β–carotene doing in the photosystem II reaction centre? Philosophical Transactions of the Royal Society B: Biological Sciences 357: 1431-1440.
Therkildsen MS & Lomstein BA (1994) Seasonal variation in sediment urea turn-over in a shallow estuary. Marine Ecology-Progress Series 109: 77-77.
Thioulouse J, Chessel D, Dole S & Olivier JM (1997) ADE-4: a multivariate analysis and graphical display software. Statistics and computing 7: 75-83.
Thornton DC, Dong LF, Underwood GJ & Nedwell DB (2002) Factors affecting microphytobenthic biomass, species composition and production in the Colne Estuary (UK). Aquatic Microbial Ecology 27: 285-300.
Underwood G & Kromkamp J (1999) Primary production by phytoplankton and microphytobenthos in estuaries. Advances in Ecological Research 29: 93-153.
Underwood G & Barnett M (2006) What determines species composition in microphytobenthic biofilms? In: Functioning of Microphytobenthos in Estuaries. Proceedings of the Microphytobenthos Symposium, Amsterdam, the Netherlands, August 2003. Ed. J. Kromkamp. Royal Netherlands Academy of Arts and Sciences, Amsterdam, 121-138.
Underwood GJC & Smith DJ (1998) Predicting epipelic diatom exopolymer concentrations in intertidal sediments from sediment chlorophyll a. Microbiology Ecology 35: 116-125.

Ref
eren
ces
265
Underwood GJC & Kromkamp J (1999) Primary production by phytoplankton and microphytobenthos in estuaries. Advances in Ecological Research 29: 93-153.
Underwood GJC & Paterson DM (2003) The importance of extracellular carbohydrate productionby marine epipelic diatoms. Advances in Botanical research 40: 183-240.
Underwood GJC, Paterson DM & Parkes RJ (1995) The measurement of microbial carbohydrate exopolymers from intertidal sediments. Limnology and Oceanography 40: 1243-1253.
Underwood GJC, Boulcott M, Raines CA & Waldron K (2004) Environmental effects on exopolymer production by marine benthic diatoms: Dynamics, changes in composition, and pathways of production. Journal of Phycology 40: 293-304.
Underwood GJC, Perkins RG, Consalvey MC, Hanlon ARM, Oxborough K, Baker NR & Paterson DM (2005) Patterns in microphytobenthic primary productivity: Species-specific variation in migratory rhythms and photosynthetic efficiency in mixed-species biofilms. Limnology and Oceanography 50: 755-767.
Van Bergeijk SA, Van der Zee C & Stal LJ (2003) Uptake and excretion of dimethylsulphoniopropionate is driven by salinity changes in the marine benthic diatom Cylindrotheca closterium. European Journal of Phycology 38: 341-349.
van Bergeijk SA, Wollenzien U, Schonefeldt K & Stal LJ (2006) Seasonal variation in dimethylsuffoniopropionate related to microphytobenthos composition in intertidal estuarine sediments. Marine Ecology-Progress Series 320: 55-63.
Van der Wal D, Wielemaker-van den Dool A & Herman PM (2010) Spatial synchrony in intertidal benthic algal biomass in temperate coastal and estuarine ecosystems. Ecosystems 13: 338-351.
Van Dongen BE, Schouten S & Sinninghe Damsté JS (2001) Gas chromatography/combustion/isotope-ratio-monitoring mass spectrometric analysis of methylboronic derivatives of monosaccharides: a new method for determining natural 13C abundances of carbohydrates. Rapid Communications in Mass Spectrometry 15: 496-500.
Van Dongen BE, Schouten S & Sinninghe Damsté JS (2002) Carbon isotope variability in monosaccharides and lipids of aquatic algae and terrestrial plants. Marine Ecology-Progress Series 232: 83-92.
Van Oevelen D, Middelburg JJ, Soetaert K & Moodley L (2006) The fate of bacterial carbon in an intertidal sediment: Modeling an in situ isotope tracer experiment. Limnology and Oceanography 51: 1302-1314.
Van Oevelen D, Soetaert K, Middelburg JJ, Herman PMJ, Moodley L, Hamels I, Moens T & Heip C (2006) Carbon flows through a benthic food web: Integrating biomass, isotope and tracer data. Journal of Marine Research 64: 453-482.
Veuger B & Middelburg JJ (2007) Incorporation of nitrogen from amino acids and urea by benthic microbes: role of bacteria versus algae and coupled incorporation of carbon. Aquatic Microbial Ecology 48: 35-46.
Veuger B, Middelburg JJ, Boschker HTS & Houtekamer M (2005) Analysis of 15N incorporation into D-alanine: A new method for tracing nitrogen uptake by bacteria. Limnology and Oceanography-Methods 3: 230-240.
Veuger B, van Oevelen D, Boschker HTS & Middelburg JJ (2006) Fate of peptidoglycan in an intertidal sediment: An in situ 13C-labeling study. Limnolology and Oceanography 51: 1572-1580.
Vieira S, Utkin AB, Lavrov A, Santos NM, Vilar R, Marques da Silva J & Cartaxana P (2011) Effects of intertidal microphytobenthos migration on biomass determination via laser-induced fluorescence. Marine Ecology-Progress Series 432: 45-52.

References
266
Walters K & Moriarty D (1993) The effects of complex trophic interactions on a marine microbenthic community. Ecology 1475-1489.
Watson JD & Crick FH (1953) Molecular structure of nucleic acids. Nature 171: 737-738. Westrich JT & Berner RA (1984) The role of sedimentary organic matter in bacterial
sulfate reduction: The G model tested. Limnology and Oceanography 29: 236-249. Wiencke C (2010) Biology of polar benthic algae. Ed. Walter de Gruyter, Berlin, 1-329. Wingender J, Neu TR & Flemming HC (2012) Microbial extracellular polymeric
substances: characterization, structure and function. Ed. Springer Science & Business Media, New York, 1-247.
Wong KS & Jane J (1995) Effects of pushing agents on the separation and detection of debranched amylopectin by high-performance anion-exchange chromatography with pulsed amperometric detection. Journal of Liquid Chromatography 18: 63-80.
Wright SW & Jeffrey SW (1987) Fucoxanthin pigment markers of marine-phytoplankton analyzed by HPLC and HPTLC. Marine Ecology-Progress Series 38: 259-266.
Yallop ML, Dewinder B, Paterson DM & Stal LJ (1994) Comparative structure, primairy production and biogenic stabilization of cohesive and noncohesive marine-sediments inhabited by microphytobenthos. Estuarine Coastal and Shelf Science 39: 565-582.
Ying Q-Q, Shi L-E, Zhang X-Y, Chen W & Yi Y (2007) Characterization of immobilized Nuclease P1. Applied Biochemistry and Biotechnology 136: 119-126.
Ysebaert T, Fettweis M, Meire P & Sas M (2005) Benthic variability in intertidal soft-sediments in the mesohaline part of the Schelde estuary. Hydrobiologia 540: 197-216.
Zelles L (1999) Fatty acid patterns of phospholipids and lipopolysaccharides in the characterisation of microbial communities in soil: a review. Biology and Fertility of Soils 29: 111-129.
Zhang G, Lin J, Srinivasan K, Kavetskaia O & Duncan JN (2007) Strategies for bioanalysis of an oligonucleotide class macromolecule from rat plasma using liquid chromatography-tandem mass spectrometry. Analytical Chemistry 79: 3416-3424.
Zhang W, He H & Zhang X (2007) Determination of neutral sugars in soil by capillary gas chromatography after derivatization to aldononitrile acetates. Soil Biology and Biochemistry 39: 2665-2669.
Zhang X & Amelung W (1996) Gas chromatographic determination of muramic acid, glucosamine, mannosamine, and galactosamine in soils. Soil Biology and Biochemistry 28: 1201-1206.

Dankwoord - Acknowledgements
D
ankw
oord
- A
ckno
wle
dgem
ents

Dankwoord - Acknowledgements
268
Het schrijven van dit dankwoord betekent dat de verdediging van mijn proefschrift en daarmee de afsluiting van een bijzondere en intensieve periode als promovendus dichtbij is. Het eindresulaat, het uiteindelijke proefschrift, ligt voor u. Aan de totstandkoming van dit proefschrift hebben velen bijgedragen en zonder hen zou dit proefschrift niet zijn geworden tot wat het nu is.
De belangrijkste ondersteuning voor het schrijven van mijn proefschrift kwam uiteraard van mijn promotor en co-promoter: Prof. dr. L.J. Stal en dr. ir. H.T.S. Boschker. Lucas, ik ben je dankbaar voor het vertrouwen dat je me gaf en al de mogelijkheden die je me schonk om mezelf te ontwikkelen tijdens mijn promotietraject. Eric, als geen ander wist je me op weg te helpen met het nadenken over relevante onderzoeksvragen, wist je het pad te ontwaren in de schijnbare wanorde van de duizenden analyse resultaten en hielp je me een helder kader te scheppen voor de grote lijn in dit proefschrift.
I would like to sincerely thank the other members of the doctoral committee, prof. dr. D. M. Paterson, prof. dr. K. Sabbe, dr. J.C. Kromkamp, dr. H. Schierbeek, prof. dr. J. Huisman, prof. dr. G. Muijzer and prof. dr. C.P.D. Brussaard, for their willingness to review my thesis.
My thanks and appreciation to my co-authors for their collaboration, support and advice during the research, the writing of this thesis and the publication of the individual chapters. Marco Houtekamer en Peter van Breugel, dank voor het delen van jullie kennis en analytische ondersteuning. Tom van Engeland and Olivier Beauchard, ‘merci beaucoup’ for your help with the statistical approach of my research results. Delphine Derrien, ‘merci beaucoup’ for your collaboration on ‘the comparison paper’. Henk Bolhuis, dank voor het meedenken voor het vinden van een enzymatische methode om nucleïnezuren kwantitatief af te breken tot nucleotiden en dank voor nog veel meer. Henk Schierbeek, jij was degene die me wegwijs maakte in de wereld van massaspectrometrie. Dank voor het delen van je ervaring en je innovatieve manier van denken. Koen Sabbe, dank voor het determineren van de in de onderzochte diatomeeënmat voorkomende diatomeeën. Ik heb bewondering voor de finesses van je taxonomische kennis van marine diatomeeën en je bereidheid om mij te helpen ondanks je drukke werkzaamheden. Ook wil ik bedanken, de helaas veel te vroeg overleden Tetsuro Miyatake. Tetsuro was een positief mens met het vermogen om breed visionair te denken. Hij was de pionier van het onderzoek beschreven in dit proefschrift. Helaas heeft hij het slot van mijn promotie periode niet meer mee mogen maken.
Dan
kwoo
rd
269
Mijn man, Erwin Moerdijk, en mijn kinderen Wanda en Jelle Moerdijk wil ik danken voor hun hulp en ondersteuning tijdens het uitvoeren van de veldexperimenten, de bemonstering, de monsterverwerking en de uiteindelijke analyses die veelal in de avonduren of zelfs in de nachtelijke uren en in de weekenden plaatsvonden. Erwin, ook oneindig veel dank voor je hulp tijdens het maken van de lay-out en het samenstellen van dit boekje. Ik ben heel dankbaar dat we een aantal jaren terug als gezin dit promotie-avontuur zijn aangegaan en nu heel trots hoe we dit samen volbracht hebben. Wanda en Jelle, fijn dat jullie als paranimf aan mijn zijde zullen staan bij de verdediging van dit proefschrift.
Mijn studenten Jurian Brasser, Gerjan de Ruiter en Sjors van Veen wil ik danken voor de keuze om hun afstudeerperiode deel te laten zijn van mijn PhD project. Mede dankzij jullie inzet kan de δ13C waarde in DNA en RNA nucleotiden gemeten worden en zijn vele monsters voorbewerkt ter analyse.
My colleagues and former colleagues of the department Marine Microbiology, Anita Wijnholds, Veronique Confurius, Michele Grego, Julia Grosse, Diana Vasquez Cardenas, Juliette Ly, Silvia Cretoiu, Christine Hörnlein, Haoxin Fan, Tadao Kunihiro, Maxime Gommeaux, Sven Quatschkopf, Lara Pozzato, Akiko Tomitani, Jeanine Geelhoed, Clara Cardoso, Jetta Vlaming and Jethro Waanders: thank you all for participating in discussions and helping me to get and to keep on track.
Aan wie ik ook dank verschuldigd ben is mijn voormalige collega Peter Herman en mijn collega Dick van Oevelen. Peter, dank voor het meedenken over de uitkomsten van mijn onderzoek en de keren dat je me een hart onder de riem stak om door te gaan met mijn PhD project. Dick, dank voor je hulp met de try-out om mijn data te fitten in een zogenaamd 2-G model. Helaas bleek mijn data niet geschikt.
Furthermore, I am grateful to the many international colleagues I visited and/or met at international conferences, dr. J.P. Godin, prof. dr. G.J.C. Underwood, prof. dr. T. Preston, dr. D. Morrison, prof. dr. ir. P. Boeckx, dr. S. Bodé, dr. C. Bruggink, prof. dr. C. Dupuy, dr. H. Agogué and dr. C. G. Bruckner. All of you, each in your own way were important to inspire me during this PhD track. The exchange of knowledge and ideas was crucial to motivate me to finalize this dissertation and make it into what it is now.
Verder wil ik degene die indirect een bijdrage geleverd hebben aan de totstandkoming van dit proefschrift bedanken: Christine van der Jagt, Elly van Hulsteijn, Joke van Houte, Anneke van der Endt en Bert Sinke.

Dankwoord - Acknowledgements
270
Tevens wil ik mijn ouders, Jan en Willie Poortvliet, en mijn zus Carina Poortvliet bedanken. Jullie steunen me al mijn hele leven; zonder jullie had ik nooit dit punt bereikt. Addie Danker, jij bent heel bijzonder voor me. Op je eigen manier heb ook jij meegeholpen aan dit proefschrift: dankjewel Addie! Oma Danker overleed aan het eind van mijn veldwerkjaar. Ook zij heeft het volbrengen van mijn promotietraject niet meer mee kunnen maken. Daarom ben ik extra dankbaar voor het feit dat mijn ouders, Carina en Addie deze mijlpaal nog wel mee kunnen maken.
Als laatste wil ik mijn nieuwe HZ collega’s en studenten bedanken. Nog voor het afronden van dit proefschrift kreeg ik het vertrouwen van de HZ University of Applied Sciences en gaf de Academie voor Technologie en Innovatie mij de kans om als ‘lecturer’ de door mij opgedane kennis toe te passen in het curriculum van de afdeling Chemie. Met name dank aan Frank Bordui en Geert Mol. Ook dank aan alle andere collega’s werkzaam binnen de afdeling Chemie en het lectoraat Marine Biobased Specialties: Simona Popovici, Marcel van den Berge, Truus Biskop, José de Winter, Kas Wannee, Sandra de Reu, Arjen Pouwer, Frederiek Stols, Riaan Lous en Dorien Derksen, voor het creëren van een inspirerende werkomgeving en de warme manier waarop jullie me hebben opgenomen in het team. Tenslotte, dank aan al mijn HZ studenten die mij scherp en kritisch houden. Juist jullie gaven me de energie voor de eindsprint ter afronding van dit proefschrift. Tanja Moerdijk-Poortvliet 22-10-2016

Life on our planet is based on carbon and this life-sustaining element is essential in order to live, grow and reproduce. The cycling of carbon from the atmosphere, land and ocean into organisms, and back again needs to be in balance. If not, serious consequences, such as global climate disruption, may result. Benthic diatoms are main-contributors to the carbon cycle in coastal zones, and provide the basis of the marine food web and fix large amounts of the greenhouse gas CO2. Understanding the function of benthic diatoms and their involvement in the carbon cycle will enhance
our knowledge of ecosystems, and it will be important to predict effects of future environmental conditions (e.g. predicted sea level rise). Hence, the development of analytical methods to enable the study of carbon cycling in marine ecosystems in a detailed way is crucial.
Is there a methodology to track the production and fate of carbon fixed by benthic diatoms in specific biochemical pools (e.g. carbohydrates, amino acids, lipids, and nucleic acids)? Are there seasonal changes that affect the physiology of diatoms by a different partitioning of fixed carbon between major biochemical pools? Do associated heterotrophic bacteria benefit from the organic matter released by the diatoms? Does the seasonal variation of diatom exudates play a role in shaping the composition of the community of the associated heterotrophic bacteria? These questions and others are addressed in this PhD thesis.
The atmospheric CO2 concentration has risen in the past century (mostly due to the use of fossil fuels) and the carbon cycle became unbalanced: climate disruption is a fact. In order to prevent worse, the society has to search for alternatives for fossil fuels and a sustainable use of natural resources. My wish is that this PhD thesis inspires to combine fundamental and applied research to develop sustainable alternatives. Marine microorganisms produce a huge diversity of molecules and even unique compounds (e.g. essential lipids and amino acids, enzymes, raw materials for polymers, and many others). Therefore, multidisciplinary research is urgently required in order to uncover marine organism specialties: the hidden treasures of the sea!