Embed Size (px)
Citation preview
UV-induced porosity using photogenerated acids to catalyze thedecomposition of sacrificial polymers templated in dielectric films
Jassem Abdallah, Marshall Silver,{ Sue Ann Bidstrup Allen and Paul A. Kohl*
Received 8th May 2006, Accepted 16th November 2006
First published as an Advance Article on the web 8th December 2006
DOI: 10.1039/b606438h
A UV-initiated process for selective incorporation of porosity and tuning of refractive index in a
dielectric film is presented. The formation of porosity via radiation offers the advantages of lower
processing temperatures and shorter processing times than most processes that rely on thermally-
induced porosity. The ability to pattern porosity via the use of a photomask allows structures such
as porous direct-write waveguides to be made. The direct-write process presented here used UV-
generated acids to catalyze the decomposition of sacrificial polymers templated in a crosslinked
matrix, resulting in the formation of porosity and decrease of refractive index and dielectric
constant after subsequent removal of the generated acid. In unexposed areas, no acid molecules
were generated, thus these areas remained non-porous and their refractive index remained
relatively high compared to porous regions. Base-catalyzed gelation was used to crosslink the
matrix at temperatures well below the glass transition temperature of the matrix in order to avoid
thermal activation of the photoacid generators (PAGs) in the direct-write formulation. After
crosslinking the matrix, deep ultraviolet (DUV) radiation was used to initiate the direct-write
reactions thus creating a refractive index profile within the film. Neutralization or volatilization of
the photogenerated acid was used to deactivate the system. The lowest interline dielectric constant
achieved by direct-written films was 2.36 after the volatilization step compared to a value of 2.29
for porous films formed via the traditional template process. At optimum conditions, the average
amount of UV-induced porosity was estimated to be as high as 21%. Transmission electron
microscopy (TEM) imaging showed that elongated mesopores (10 nm by about 20–30 nm) and
elongated macropores (100 nm by about 200 nm in size) were produced within the internal
structure of direct-written films. The porous films formed via the traditional template technique
had internal structures with large collections of spherical mesopores (5–10 nm) located in close
proximity to one another due to phase segregation of the polymer at high temperatures.
Introduction
The incorporation of porosity in a material potentially results
in the lowering of its dielectric constant, the enhancement of
its flexibility and crack-resistance, and the lowering of its
refractive index and has generated much interest both in
academia and in the microelectronics industry.1–22 The final
physical properties of porous films are dependent on the final
pore structure characteristics, such as the total amount of
porosity; the pore sizes and pore size distribution; the presence
or absence of pore interconnectivity, among other para-
meters.1–4,6,7,9,16–19,22–24 The differences in the morphologies
of the final pore structures result from variations in physical
conditions used when fabricating porous films; important
factors include the type of porogen (thermally decomposable
polymer or volatile solvent) used, the porogen loading, the
presence or absence of phase segregation of porogen during
processing, the processing temperatures required, and other
physical conditions.2,6,9,23 The traditional template technique
for fabricating a porous thin film makes use of a porogen
distributed in a crosslinkable matrix.2 During processing, the
matrix is cured to instill mechanical integrity, before the film is
heated to high temperatures to decompose and volatilize the
templated polymer. As the decomposition by-products diffuse
out of the films, air diffuses in to replace the porogen, resulting
in the formation of air pockets in place of the sacrificial
polymer chains. The total processing time for the template
technique may be several hours because of the necessity of
thermally setting the matrix as well as decomposing the
polymer via a slow ramp in temperature to the decomposition
point of the porogen and a dwell time to ensure the removal of
all of the porogen.2–8 Additionally films must be allowed to
cool slowly prior to removal from furnaces otherwise there will
be formation of cracks due to internal stress resulting from the
thermal shock of exposing the very hot films to ambient
conditions. An additional disadvantage of thermally decom-
posing a porogen to produce porosity is that many organic
materials cannot be used as substrates owing to their
degradation at the high temperatures required to decompose
the templated polymers. Finally, the high temperatures
required to thermally decompose polymers encourage phase
segregation and agglomeration of the macromolecules prior
School of Chemical and Biomolecular Engineering, Georgia Institute ofTechnology, Atlanta, GA, 30332, USA.E-mail: [email protected]; Fax: +1-404-894-2866;Tel: +1-404-894-2893{ Present address: Department of Chemical Engineering, TheUniversity of Texas at Austin, Austin, TX 78712, USA.
PAPER www.rsc.org/materials | Journal of Materials Chemistry
This journal is � The Royal Society of Chemistry 2007 J. Mater. Chem., 2007, 17, 873–885 | 873
to decomposition thus producing large, non-uniformly dis-
persed pores that may produce undesirable final properties in
the porous films.6,7
The development of a direct-write method for producing
porosity whereby photodefinable polymers are either directly
or indirectly decomposed via radiation would decrease the
temperature required to decompose the polymer chains and
may also lead to a decrease in the overall processing time. The
lower temperatures may potentially allow organic substrates to
be used as well as reduce the tendency for polymers to phase
segregate during the procedure. Furthermore, UV-induced
decomposition enables the lateral patterning of porosity, which
may be used to make interesting devices in which functionality
is dependent on the level of porosity present (e.g. phase masks,
or lateral confinement in waveguides due to a refractive index
profile).25,26 Recently, researchers have made use of the
photocleavable nature of Si–Si bonds in the structure of
polysilanes to UV-induce porosity in hybrid films composed of
methacrylate–polysilane copolymers (MPS) chemically bonded
to inorganic sol–gel matrix materials.25,27–35 Miura et al.
reported that when an MPS–titania film with a 50 wt% MPS
ratio was exposed for 10 seconds to 248 nm (deep UV or
DUV) radiation having an intensity of 105 mW cm22, the
refractive index of the film dropped by 0.18 while a MPS–silica
film with a 50 wt% MPS ratio had a refractive index drop of
0.16.29 These decreases in refractive indices were due to the
incorporation of air within the matrix materials since air has a
refractive index of only 1.0003 and thus will lower the aggre-
gate refractive index of a material. While investigating the use
of poly(methyl phenylsilane) (PMPS) films in the formation of
phase masks, Nagayama et al. reported that 0.3 mm PMPS
films exposed to 308 nm light had a refractive index drop from
1.70 to 1.63 while films exposed to 254 nm light showed a drop
in refractive index from 1.70 to 1.58 due to photodecomposi-
tion of the PMPS.25 Mimura et al. reported that when a MPS–
silica (24 wt% MPS) hybrid film was exposed to UV radiation,
the refractive index of the film dropped from 1.60 to 1.53
before rinsing with hexane, and dropped further to 1.40 after
the hexane rinse leading them to conclude that all of the
polysilane had decomposed.28
The polysilane-based photobleaching system described
above relies on the direct photosensitivity of polysilane and
will only work for polymers that can be directly decomposed
by radiation. As opposed to polysilanes, polycarbonates,
although not directly photocleavable, may be indirectly
decomposed via UV radiation due to their vulnerability to
acidolysis.36,37 By mixing polycarbonate films with photo-
initiators that release acids upon irradiation, i.e. photoacid
generators (PAGs), the polymers molecules may be selectively
decomposed via photogeneration of acids under a photomask
thus enabling their use as positive-tone resist materials.38–49
The mechanism for the acid-catalyzed depolymerization of
both aromatic and aliphatic polycarbonates has been pre-
sented by Frechet et al. and Jayachandran et al.36,37 The direct-
write process presented here relies on the PAG–polycarbonate
chemistry and it is an extension of the resist system in that both
PAG and polycarbonate molecules are templated within a
crosslinkable spin-on-glass (SOG) matrix. Prior to decomposi-
tion of the polycarbonate, the matrix is hardened to allow it to
mechanically support porosity. UV exposure and a post-
exposure bake (PEB) are used to drive acidolysis of the
sacrificial polymer, resulting in the production of porosity and
the lowering of the refractive index. By performing irradiation
through a photomask, one may laterally pattern porous
regions (cladding) and non-porous regions (cores) to create
refractive index profiles within the processed film. To prevent
acid-catalyzed decomposition of the polycarbonate molecules
in non-porous regions, a blanket UV-irradiation is used to
generate acids before their neutralization via the diffusion of a
basic gas through the film. As an alternative to using a basic
gas to neutralize the acid molecules, a vacuum environment or
a high purge flow-rate may be used to sweep away volatile acid
molecules after their photogeneration.
Experimental
The SOG matrix material was a resin of hydrogen silsesquiox-
ane (HSQ) dissolved in methyl isobutyl ketone (MIBK) solvent
and sold under the tradename FOx1 by Dow Corning Corp.
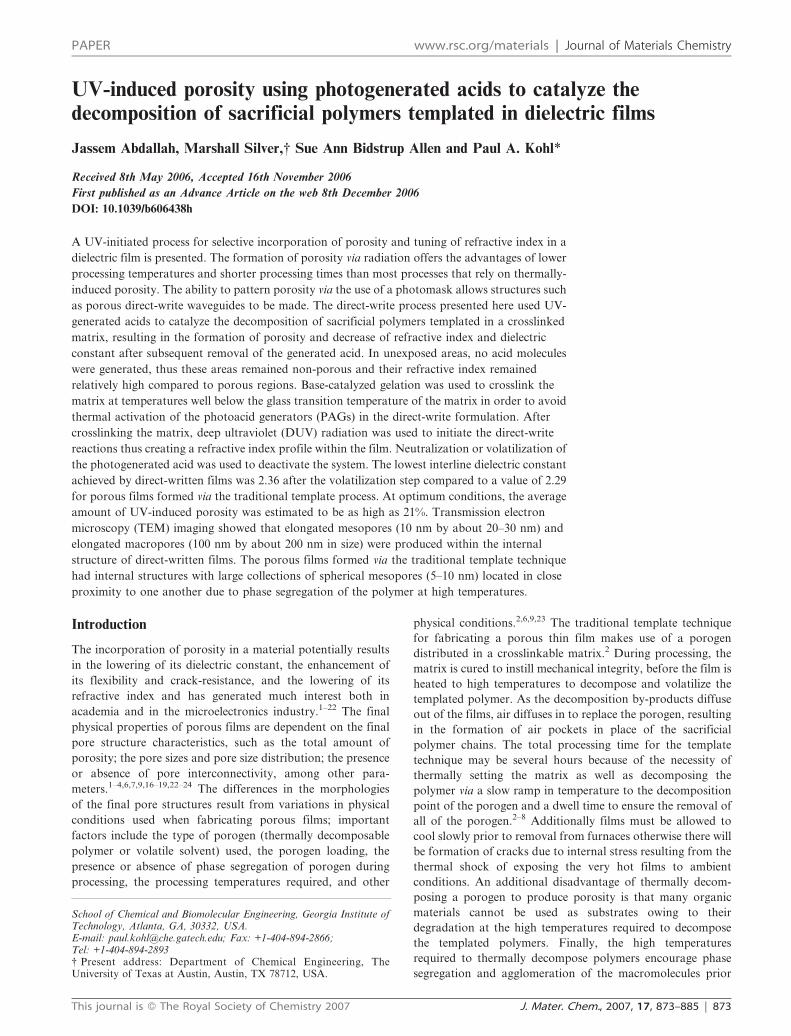
The sacrificial polymer used was poly(norbornene carbonate)
or PNC which has the macromolecular structure 1, shown in
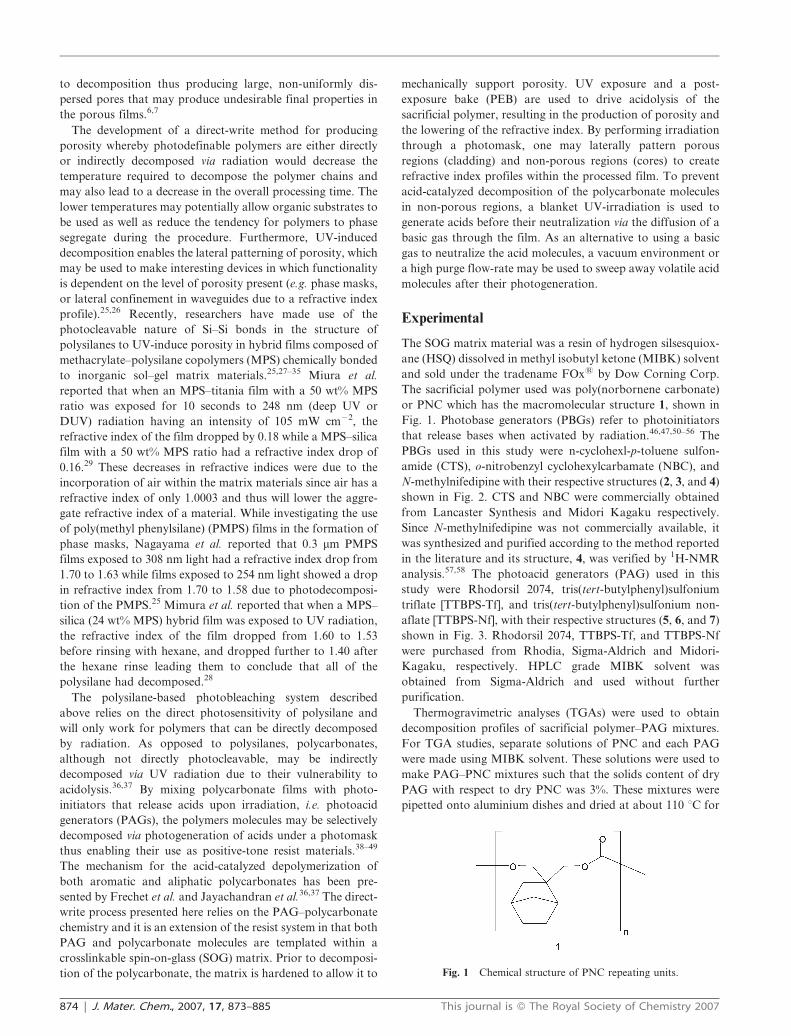
Fig. 1. Photobase generators (PBGs) refer to photoinitiators
that release bases when activated by radiation.46,47,50–56 The
PBGs used in this study were n-cyclohexl-p-toluene sulfon-
amide (CTS), o-nitrobenzyl cyclohexylcarbamate (NBC), and
N-methylnifedipine with their respective structures (2, 3, and 4)
shown in Fig. 2. CTS and NBC were commercially obtained
from Lancaster Synthesis and Midori Kagaku respectively.
Since N-methylnifedipine was not commercially available, it
was synthesized and purified according to the method reported
in the literature and its structure, 4, was verified by 1H-NMR
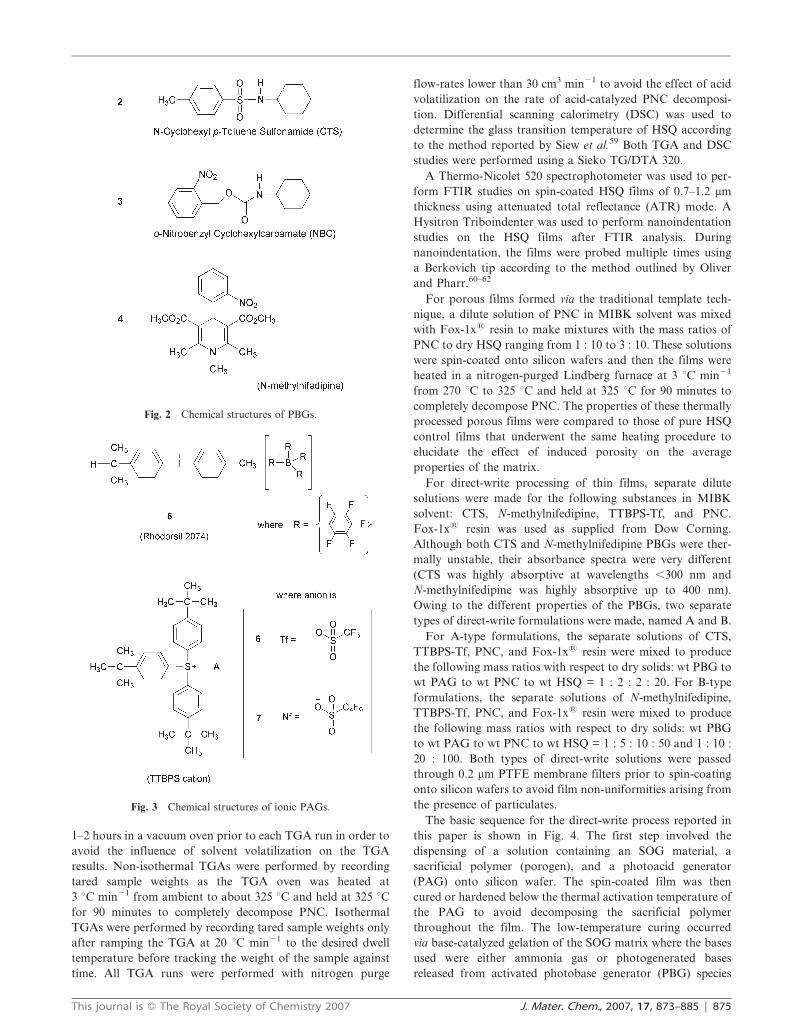
analysis.57,58 The photoacid generators (PAG) used in this
study were Rhodorsil 2074, tris(tert-butylphenyl)sulfonium
triflate [TTBPS-Tf], and tris(tert-butylphenyl)sulfonium non-
aflate [TTBPS-Nf], with their respective structures (5, 6, and 7)
shown in Fig. 3. Rhodorsil 2074, TTBPS-Tf, and TTBPS-Nf
were purchased from Rhodia, Sigma-Aldrich and Midori-
Kagaku, respectively. HPLC grade MIBK solvent was
obtained from Sigma-Aldrich and used without further
purification.
Thermogravimetric analyses (TGAs) were used to obtain
decomposition profiles of sacrificial polymer–PAG mixtures.
For TGA studies, separate solutions of PNC and each PAG
were made using MIBK solvent. These solutions were used to
make PAG–PNC mixtures such that the solids content of dry
PAG with respect to dry PNC was 3%. These mixtures were
pipetted onto aluminium dishes and dried at about 110 uC for
Fig. 1 Chemical structure of PNC repeating units.
874 | J. Mater. Chem., 2007, 17, 873–885 This journal is � The Royal Society of Chemistry 2007
1–2 hours in a vacuum oven prior to each TGA run in order to
avoid the influence of solvent volatilization on the TGA
results. Non-isothermal TGAs were performed by recording
tared sample weights as the TGA oven was heated at
3 uC min21 from ambient to about 325 uC and held at 325 uCfor 90 minutes to completely decompose PNC. Isothermal
TGAs were performed by recording tared sample weights only
after ramping the TGA at 20 uC min21 to the desired dwell
temperature before tracking the weight of the sample against
time. All TGA runs were performed with nitrogen purge
flow-rates lower than 30 cm3 min21 to avoid the effect of acid
volatilization on the rate of acid-catalyzed PNC decomposi-
tion. Differential scanning calorimetry (DSC) was used to
determine the glass transition temperature of HSQ according
to the method reported by Siew et al.59 Both TGA and DSC
studies were performed using a Sieko TG/DTA 320.
A Thermo-Nicolet 520 spectrophotometer was used to per-
form FTIR studies on spin-coated HSQ films of 0.7–1.2 mm
thickness using attenuated total reflectance (ATR) mode. A
Hysitron Triboindenter was used to perform nanoindentation
studies on the HSQ films after FTIR analysis. During
nanoindentation, the films were probed multiple times using
a Berkovich tip according to the method outlined by Oliver
and Pharr.60–62
For porous films formed via the traditional template tech-
nique, a dilute solution of PNC in MIBK solvent was mixed
with Fox-1x1 resin to make mixtures with the mass ratios of
PNC to dry HSQ ranging from 1 : 10 to 3 : 10. These solutions
were spin-coated onto silicon wafers and then the films were
heated in a nitrogen-purged Lindberg furnace at 3 uC min21
from 270 uC to 325 uC and held at 325 uC for 90 minutes to
completely decompose PNC. The properties of these thermally
processed porous films were compared to those of pure HSQ
control films that underwent the same heating procedure to
elucidate the effect of induced porosity on the average
properties of the matrix.
For direct-write processing of thin films, separate dilute
solutions were made for the following substances in MIBK
solvent: CTS, N-methylnifedipine, TTBPS-Tf, and PNC.
Fox-1x1 resin was used as supplied from Dow Corning.
Although both CTS and N-methylnifedipine PBGs were ther-
mally unstable, their absorbance spectra were very different
(CTS was highly absorptive at wavelengths ,300 nm and
N-methylnifedipine was highly absorptive up to 400 nm).
Owing to the different properties of the PBGs, two separate
types of direct-write formulations were made, named A and B.
For A-type formulations, the separate solutions of CTS,
TTBPS-Tf, PNC, and Fox-1x1 resin were mixed to produce
the following mass ratios with respect to dry solids: wt PBG to
wt PAG to wt PNC to wt HSQ = 1 : 2 : 2 : 20. For B-type
formulations, the separate solutions of N-methylnifedipine,
TTBPS-Tf, PNC, and Fox-1x1 resin were mixed to produce
the following mass ratios with respect to dry solids: wt PBG
to wt PAG to wt PNC to wt HSQ = 1 : 5 : 10 : 50 and 1 : 10 :
20 : 100. Both types of direct-write solutions were passed
through 0.2 mm PTFE membrane filters prior to spin-coating
onto silicon wafers to avoid film non-uniformities arising from
the presence of particulates.
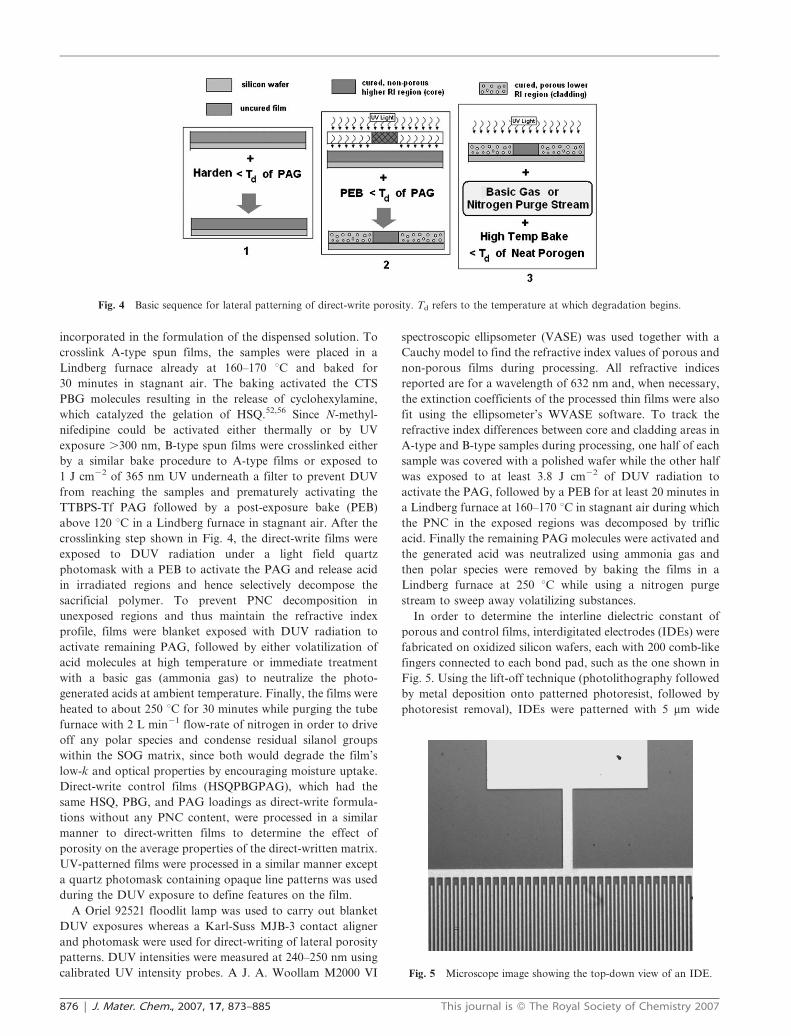
The basic sequence for the direct-write process reported in
this paper is shown in Fig. 4. The first step involved the
dispensing of a solution containing an SOG material, a
sacrificial polymer (porogen), and a photoacid generator
(PAG) onto silicon wafer. The spin-coated film was then
cured or hardened below the thermal activation temperature of
the PAG to avoid decomposing the sacrificial polymer
throughout the film. The low-temperature curing occurred
via base-catalyzed gelation of the SOG matrix where the bases
used were either ammonia gas or photogenerated bases
released from activated photobase generator (PBG) species
Fig. 3 Chemical structures of ionic PAGs.
Fig. 2 Chemical structures of PBGs.
This journal is � The Royal Society of Chemistry 2007 J. Mater. Chem., 2007, 17, 873–885 | 875
incorporated in the formulation of the dispensed solution. To
crosslink A-type spun films, the samples were placed in a
Lindberg furnace already at 160–170 uC and baked for
30 minutes in stagnant air. The baking activated the CTS
PBG molecules resulting in the release of cyclohexylamine,
which catalyzed the gelation of HSQ.52,56 Since N-methyl-
nifedipine could be activated either thermally or by UV
exposure .300 nm, B-type spun films were crosslinked either
by a similar bake procedure to A-type films or exposed to
1 J cm22 of 365 nm UV underneath a filter to prevent DUV
from reaching the samples and prematurely activating the
TTBPS-Tf PAG followed by a post-exposure bake (PEB)
above 120 uC in a Lindberg furnace in stagnant air. After the
crosslinking step shown in Fig. 4, the direct-write films were
exposed to DUV radiation under a light field quartz
photomask with a PEB to activate the PAG and release acid
in irradiated regions and hence selectively decompose the
sacrificial polymer. To prevent PNC decomposition in
unexposed regions and thus maintain the refractive index
profile, films were blanket exposed with DUV radiation to
activate remaining PAG, followed by either volatilization of
acid molecules at high temperature or immediate treatment
with a basic gas (ammonia gas) to neutralize the photo-
generated acids at ambient temperature. Finally, the films were
heated to about 250 uC for 30 minutes while purging the tube
furnace with 2 L min21 flow-rate of nitrogen in order to drive
off any polar species and condense residual silanol groups
within the SOG matrix, since both would degrade the film’s
low-k and optical properties by encouraging moisture uptake.
Direct-write control films (HSQPBGPAG), which had the
same HSQ, PBG, and PAG loadings as direct-write formula-
tions without any PNC content, were processed in a similar
manner to direct-written films to determine the effect of
porosity on the average properties of the direct-written matrix.
UV-patterned films were processed in a similar manner except
a quartz photomask containing opaque line patterns was used
during the DUV exposure to define features on the film.
A Oriel 92521 floodlit lamp was used to carry out blanket
DUV exposures whereas a Karl-Suss MJB-3 contact aligner
and photomask were used for direct-writing of lateral porosity
patterns. DUV intensities were measured at 240–250 nm using
calibrated UV intensity probes. A J. A. Woollam M2000 VI
spectroscopic ellipsometer (VASE) was used together with a
Cauchy model to find the refractive index values of porous and
non-porous films during processing. All refractive indices
reported are for a wavelength of 632 nm and, when necessary,
the extinction coefficients of the processed thin films were also
fit using the ellipsometer’s WVASE software. To track the
refractive index differences between core and cladding areas in
A-type and B-type samples during processing, one half of each
sample was covered with a polished wafer while the other half
was exposed to at least 3.8 J cm22 of DUV radiation to
activate the PAG, followed by a PEB for at least 20 minutes in
a Lindberg furnace at 160–170 uC in stagnant air during which
the PNC in the exposed regions was decomposed by triflic
acid. Finally the remaining PAG molecules were activated and
the generated acid was neutralized using ammonia gas and
then polar species were removed by baking the films in a
Lindberg furnace at 250 uC while using a nitrogen purge
stream to sweep away volatilizing substances.
In order to determine the interline dielectric constant of
porous and control films, interdigitated electrodes (IDEs) were
fabricated on oxidized silicon wafers, each with 200 comb-like
fingers connected to each bond pad, such as the one shown in
Fig. 5. Using the lift-off technique (photolithography followed
by metal deposition onto patterned photoresist, followed by
photoresist removal), IDEs were patterned with 5 mm wide
Fig. 4 Basic sequence for lateral patterning of direct-write porosity. Td refers to the temperature at which degradation begins.
Fig. 5 Microscope image showing the top-down view of an IDE.
876 | J. Mater. Chem., 2007, 17, 873–885 This journal is � The Royal Society of Chemistry 2007
metal lines and 5 mm wide gap spacing between each metal line.
An e-beam evaporator was used to deposit 10–15 nm of
titanium followed by 200 nm of gold at high vacuum onto at
least 10 mm thick plasma-enhanced chemical vapor deposition
(PECVD) silicon dioxide. A Tencor KLA profilometer and
calibrated microscope were used to measure the actual
dimensions of the IDEs and a Nanospec refractometer was
used to measure the thickness of the PECVD oxide layer. An
HP 4253 LCR meter and Karl Suss PM5 probe system were
used to measure the capacitances of multiple IDEs at a
frequency of 100 kHz both before and after spin-coating the
silicon wafers with films. After spin-coating films onto the
IDEs, portions of the films were scraped to allow thickness
measurements after each processing step using the profil-
ometer. The thicknesses of the coated films ranged from
280 nm to 430 nm and the capacitances of the coated IDEs
were remeasured after each processing step. Using the mea-
sured dimensions of the IDEs, and the measured thicknesses of
the oxide and coated films, electrostatic simulations (Ansoft’s
Maxwell software) were used to accurately model the
capacitances of the IDEs and thus empirically determine the
interline dielectric constant of the films.
Atomic force microscope (AFM) scans were performed
using a Veeco Dimension 3100 scanning probe microscope. In
order to characterize the pore structure of porous films,
focused gallium ion beams (FIB) were used to prepare thin
cross-sections of samples after first sputtering these films with
protective gold and platinum layers to prevent gallium
implantation during milling. These thin cross-sections were
then analyzed using a Hitachi HF-2000 high resolution TEM
operated using an accelerating voltage of 200 keV.
Results and discussion
The selective decomposition of sacrificial polymer in the direct-
write process depicted in Fig. 4 relied on the ability of the
sacrificial polymer to be selectively decomposed by photo-
generated acids, i.e. it was photodefinable. The mechanism by
which photogenerated acids catalyzed the decomposition of
polycarbonate-based sacrificial polymers has been discussed
in the literature.36,37 According to the reported mechanism,
protons from the acid attack the carbonyl group of a poly-
carbonate, such as the one shown in Fig. 1, resulting in main
chain scission of the sacrificial polymer and the evolution of
volatile decomposition products. Researchers have used TGA
studies of sacrificial polymer–PAG mixtures to study the acid-
catalyzed decomposition of polycarbonate-based poly-
mers.36,37 The larger the temperature difference between the
onset of the photolytic decomposition (irradiated PAG) TGA
curve and the thermolytic decomposition (PAG heated only)
TGA curve for a polymer–PAG mixture, the wider the tem-
perature window for the PEB, i.e. the higher the likelihood of
decomposing most or even all of the polymer in the exposed
region without decomposing any of the PNC in the unexposed
region of the wafer. Thus PAG–PNC mixtures with the largest
differences between thermolytic and photolytic TGA curves
were deemed optimal for use in the PAG–polycarbonate direct-
write formulations since they could be used for producing both
blanket as well as patterned porosity within films.
Numerous PAGs that produce strong acids were tested for
their thermal stability, possessing the chemical structures
shown in Fig. 3.37 In order for a PAG to be compatible with
selective decomposition of the photodefinable polymer, it must
have a high thermal stability. Otherwise, direct-written
refractive index profiles in a film will be destroyed upon
heating the film to moderate temperatures due to the thermal
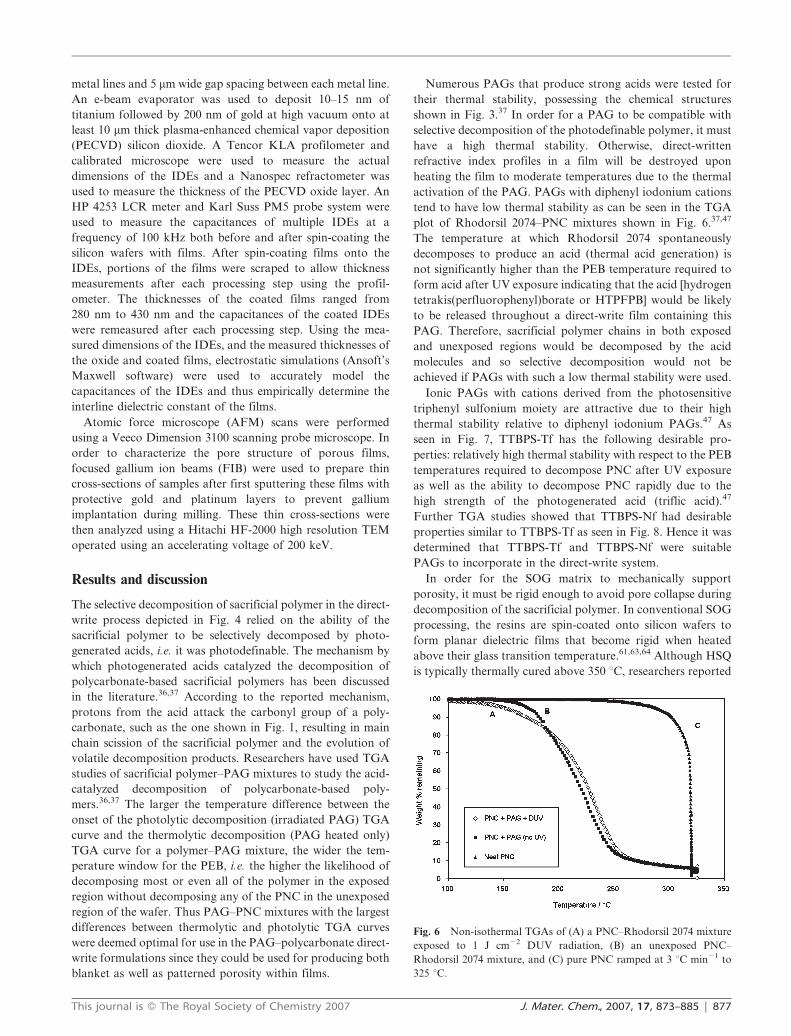
activation of the PAG. PAGs with diphenyl iodonium cations
tend to have low thermal stability as can be seen in the TGA
plot of Rhodorsil 2074–PNC mixtures shown in Fig. 6.37,47
The temperature at which Rhodorsil 2074 spontaneously
decomposes to produce an acid (thermal acid generation) is
not significantly higher than the PEB temperature required to
form acid after UV exposure indicating that the acid [hydrogen
tetrakis(perfluorophenyl)borate or HTPFPB] would be likely
to be released throughout a direct-write film containing this
PAG. Therefore, sacrificial polymer chains in both exposed
and unexposed regions would be decomposed by the acid
molecules and so selective decomposition would not be
achieved if PAGs with such a low thermal stability were used.
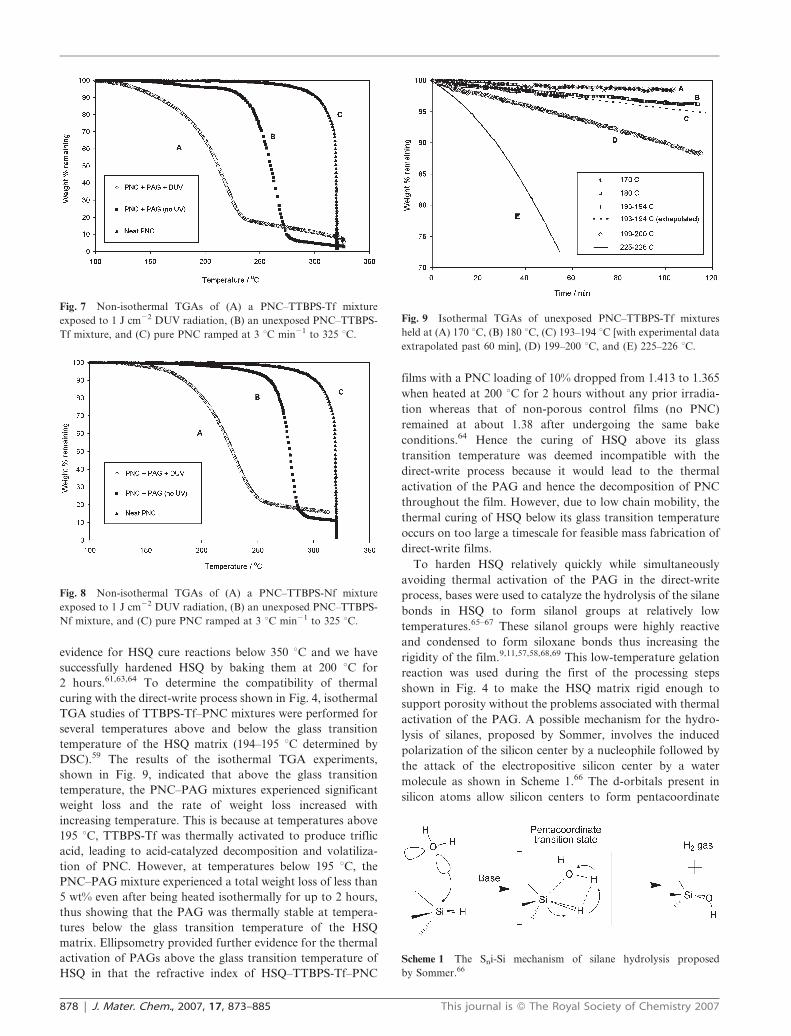
Ionic PAGs with cations derived from the photosensitive
triphenyl sulfonium moiety are attractive due to their high
thermal stability relative to diphenyl iodonium PAGs.47 As
seen in Fig. 7, TTBPS-Tf has the following desirable pro-
perties: relatively high thermal stability with respect to the PEB
temperatures required to decompose PNC after UV exposure
as well as the ability to decompose PNC rapidly due to the
high strength of the photogenerated acid (triflic acid).47
Further TGA studies showed that TTBPS-Nf had desirable
properties similar to TTBPS-Tf as seen in Fig. 8. Hence it was
determined that TTBPS-Tf and TTBPS-Nf were suitable
PAGs to incorporate in the direct-write system.
In order for the SOG matrix to mechanically support
porosity, it must be rigid enough to avoid pore collapse during
decomposition of the sacrificial polymer. In conventional SOG
processing, the resins are spin-coated onto silicon wafers to
form planar dielectric films that become rigid when heated
above their glass transition temperature.61,63,64 Although HSQ
is typically thermally cured above 350 uC, researchers reported
Fig. 6 Non-isothermal TGAs of (A) a PNC–Rhodorsil 2074 mixture
exposed to 1 J cm22 DUV radiation, (B) an unexposed PNC–
Rhodorsil 2074 mixture, and (C) pure PNC ramped at 3 uC min21 to
325 uC.
This journal is � The Royal Society of Chemistry 2007 J. Mater. Chem., 2007, 17, 873–885 | 877
evidence for HSQ cure reactions below 350 uC and we have
successfully hardened HSQ by baking them at 200 uC for
2 hours.61,63,64 To determine the compatibility of thermal
curing with the direct-write process shown in Fig. 4, isothermal
TGA studies of TTBPS-Tf–PNC mixtures were performed for
several temperatures above and below the glass transition
temperature of the HSQ matrix (194–195 uC determined by
DSC).59 The results of the isothermal TGA experiments,
shown in Fig. 9, indicated that above the glass transition
temperature, the PNC–PAG mixtures experienced significant
weight loss and the rate of weight loss increased with
increasing temperature. This is because at temperatures above
195 uC, TTBPS-Tf was thermally activated to produce triflic
acid, leading to acid-catalyzed decomposition and volatiliza-
tion of PNC. However, at temperatures below 195 uC, the
PNC–PAG mixture experienced a total weight loss of less than
5 wt% even after being heated isothermally for up to 2 hours,
thus showing that the PAG was thermally stable at tempera-
tures below the glass transition temperature of the HSQ
matrix. Ellipsometry provided further evidence for the thermal
activation of PAGs above the glass transition temperature of
HSQ in that the refractive index of HSQ–TTBPS-Tf–PNC
films with a PNC loading of 10% dropped from 1.413 to 1.365
when heated at 200 uC for 2 hours without any prior irradia-
tion whereas that of non-porous control films (no PNC)
remained at about 1.38 after undergoing the same bake
conditions.64 Hence the curing of HSQ above its glass
transition temperature was deemed incompatible with the
direct-write process because it would lead to the thermal
activation of the PAG and hence the decomposition of PNC
throughout the film. However, due to low chain mobility, the
thermal curing of HSQ below its glass transition temperature
occurs on too large a timescale for feasible mass fabrication of
direct-write films.
To harden HSQ relatively quickly while simultaneously
avoiding thermal activation of the PAG in the direct-write
process, bases were used to catalyze the hydrolysis of the silane
bonds in HSQ to form silanol groups at relatively low
temperatures.65–67 These silanol groups were highly reactive
and condensed to form siloxane bonds thus increasing the
rigidity of the film.9,11,57,58,68,69 This low-temperature gelation
reaction was used during the first of the processing steps
shown in Fig. 4 to make the HSQ matrix rigid enough to
support porosity without the problems associated with thermal
activation of the PAG. A possible mechanism for the hydro-
lysis of silanes, proposed by Sommer, involves the induced
polarization of the silicon center by a nucleophile followed by
the attack of the electropositive silicon center by a water
molecule as shown in Scheme 1.66 The d-orbitals present in
silicon atoms allow silicon centers to form pentacoordinate
Fig. 7 Non-isothermal TGAs of (A) a PNC–TTBPS-Tf mixture
exposed to 1 J cm22 DUV radiation, (B) an unexposed PNC–TTBPS-
Tf mixture, and (C) pure PNC ramped at 3 uC min21 to 325 uC.
Fig. 8 Non-isothermal TGAs of (A) a PNC–TTBPS-Nf mixture
exposed to 1 J cm22 DUV radiation, (B) an unexposed PNC–TTBPS-
Nf mixture, and (C) pure PNC ramped at 3 uC min21 to 325 uC.
Fig. 9 Isothermal TGAs of unexposed PNC–TTBPS-Tf mixtures
held at (A) 170 uC, (B) 180 uC, (C) 193–194 uC [with experimental data
extrapolated past 60 min], (D) 199–200 uC, and (E) 225–226 uC.
Scheme 1 The Sni-Si mechanism of silane hydrolysis proposed
by Sommer.66
878 | J. Mater. Chem., 2007, 17, 873–885 This journal is � The Royal Society of Chemistry 2007
and hexacoordinate transition states during reactions.65 There
is an internal rearrangement of the temporary bonds in the
transition state that leads to a silanol group replacing the
silane group as shown in Scheme 1.66 According to West,
the hydrolysis of cyclic silanes such as HSQ cages is
thermodynamically favorable because the pentacoordinate
transition state relieves the bond strains present in the original
cyclic structures.67
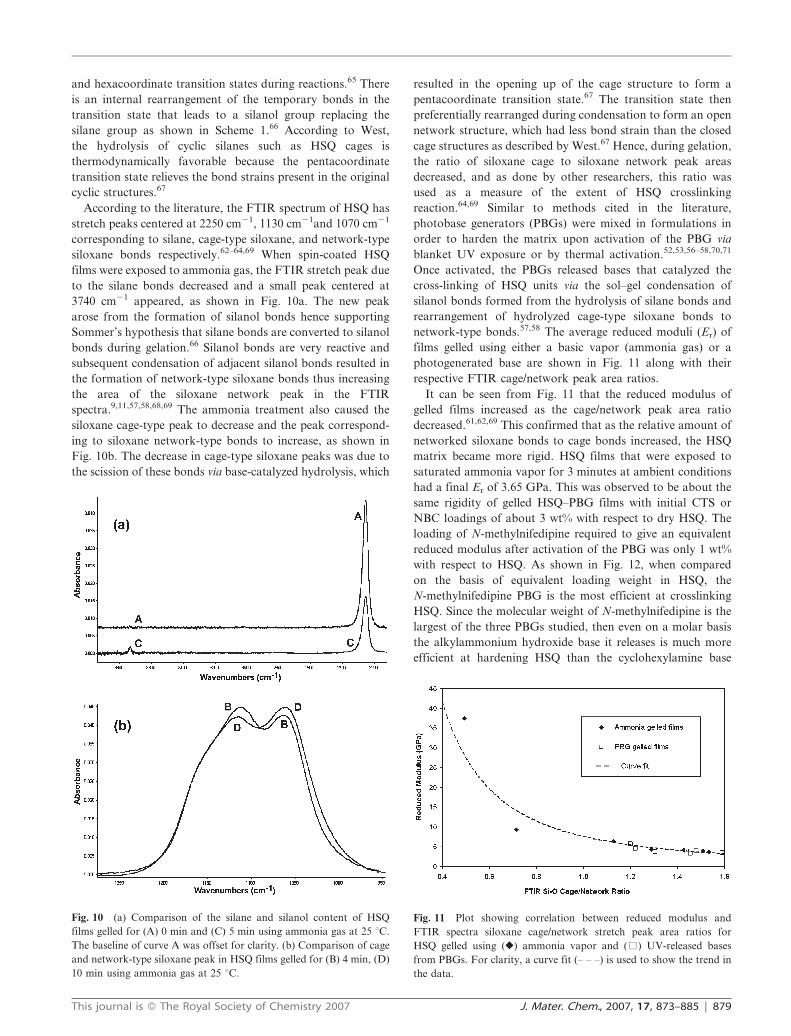
According to the literature, the FTIR spectrum of HSQ has
stretch peaks centered at 2250 cm21, 1130 cm21and 1070 cm21
corresponding to silane, cage-type siloxane, and network-type
siloxane bonds respectively.62–64,69 When spin-coated HSQ
films were exposed to ammonia gas, the FTIR stretch peak due
to the silane bonds decreased and a small peak centered at
3740 cm21 appeared, as shown in Fig. 10a. The new peak
arose from the formation of silanol bonds hence supporting
Sommer’s hypothesis that silane bonds are converted to silanol
bonds during gelation.66 Silanol bonds are very reactive and
subsequent condensation of adjacent silanol bonds resulted in
the formation of network-type siloxane bonds thus increasing
the area of the siloxane network peak in the FTIR
spectra.9,11,57,58,68,69 The ammonia treatment also caused the
siloxane cage-type peak to decrease and the peak correspond-
ing to siloxane network-type bonds to increase, as shown in
Fig. 10b. The decrease in cage-type siloxane peaks was due to
the scission of these bonds via base-catalyzed hydrolysis, which
resulted in the opening up of the cage structure to form a
pentacoordinate transition state.67 The transition state then
preferentially rearranged during condensation to form an open
network structure, which had less bond strain than the closed
cage structures as described by West.67 Hence, during gelation,
the ratio of siloxane cage to siloxane network peak areas
decreased, and as done by other researchers, this ratio was
used as a measure of the extent of HSQ crosslinking
reaction.64,69 Similar to methods cited in the literature,
photobase generators (PBGs) were mixed in formulations in
order to harden the matrix upon activation of the PBG via
blanket UV exposure or by thermal activation.52,53,56–58,70,71
Once activated, the PBGs released bases that catalyzed the
cross-linking of HSQ units via the sol–gel condensation of
silanol bonds formed from the hydrolysis of silane bonds and
rearrangement of hydrolyzed cage-type siloxane bonds to
network-type bonds.57,58 The average reduced moduli (Er) of
films gelled using either a basic vapor (ammonia gas) or a
photogenerated base are shown in Fig. 11 along with their
respective FTIR cage/network peak area ratios.
It can be seen from Fig. 11 that the reduced modulus of
gelled films increased as the cage/network peak area ratio
decreased.61,62,69 This confirmed that as the relative amount of
networked siloxane bonds to cage bonds increased, the HSQ
matrix became more rigid. HSQ films that were exposed to
saturated ammonia vapor for 3 minutes at ambient conditions
had a final Er of 3.65 GPa. This was observed to be about the
same rigidity of gelled HSQ–PBG films with initial CTS or
NBC loadings of about 3 wt% with respect to dry HSQ. The
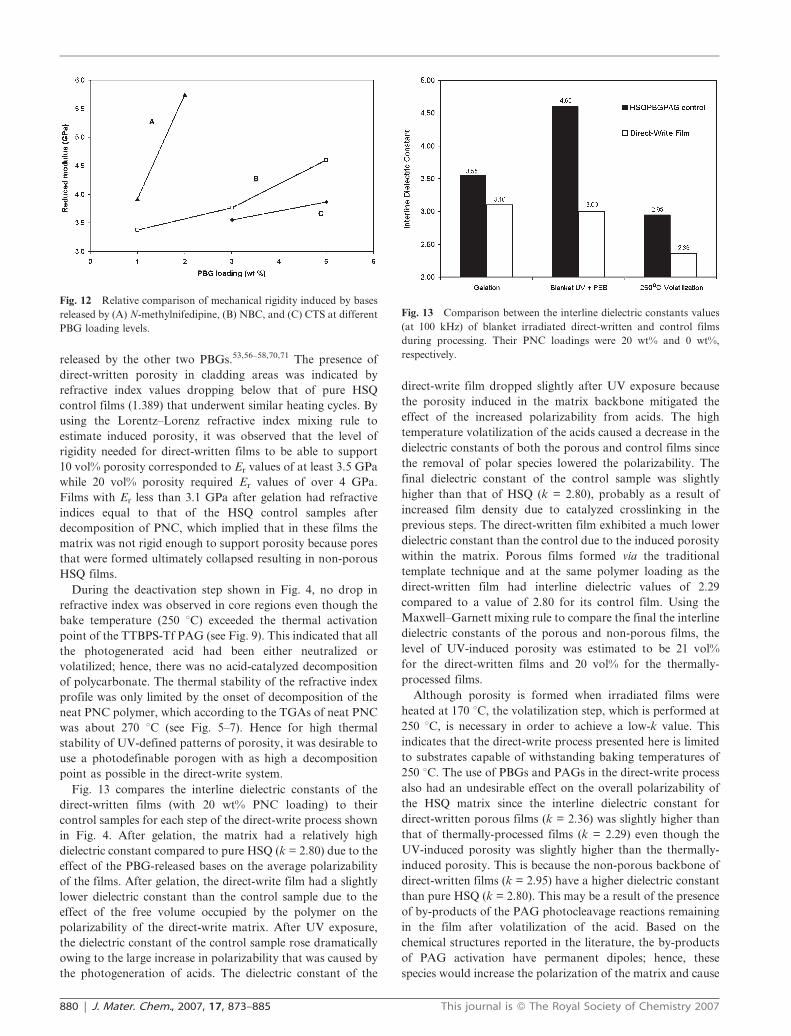
loading of N-methylnifedipine required to give an equivalent
reduced modulus after activation of the PBG was only 1 wt%
with respect to HSQ. As shown in Fig. 12, when compared
on the basis of equivalent loading weight in HSQ, the
N-methylnifedipine PBG is the most efficient at crosslinking
HSQ. Since the molecular weight of N-methylnifedipine is the
largest of the three PBGs studied, then even on a molar basis
the alkylammonium hydroxide base it releases is much more
efficient at hardening HSQ than the cyclohexylamine base
Fig. 10 (a) Comparison of the silane and silanol content of HSQ
films gelled for (A) 0 min and (C) 5 min using ammonia gas at 25 uC.
The baseline of curve A was offset for clarity. (b) Comparison of cage
and network-type siloxane peak in HSQ films gelled for (B) 4 min, (D)
10 min using ammonia gas at 25 uC.
Fig. 11 Plot showing correlation between reduced modulus and
FTIR spectra siloxane cage/network stretch peak area ratios for
HSQ gelled using (r) ammonia vapor and (%) UV-released bases
from PBGs. For clarity, a curve fit (– – –) is used to show the trend in
the data.
This journal is � The Royal Society of Chemistry 2007 J. Mater. Chem., 2007, 17, 873–885 | 879
released by the other two PBGs.53,56–58,70,71 The presence of
direct-written porosity in cladding areas was indicated by
refractive index values dropping below that of pure HSQ
control films (1.389) that underwent similar heating cycles. By
using the Lorentz–Lorenz refractive index mixing rule to
estimate induced porosity, it was observed that the level of
rigidity needed for direct-written films to be able to support
10 vol% porosity corresponded to Er values of at least 3.5 GPa
while 20 vol% porosity required Er values of over 4 GPa.
Films with Er less than 3.1 GPa after gelation had refractive
indices equal to that of the HSQ control samples after
decomposition of PNC, which implied that in these films the
matrix was not rigid enough to support porosity because pores
that were formed ultimately collapsed resulting in non-porous
HSQ films.
During the deactivation step shown in Fig. 4, no drop in
refractive index was observed in core regions even though the
bake temperature (250 uC) exceeded the thermal activation
point of the TTBPS-Tf PAG (see Fig. 9). This indicated that all
the photogenerated acid had been either neutralized or
volatilized; hence, there was no acid-catalyzed decomposition
of polycarbonate. The thermal stability of the refractive index
profile was only limited by the onset of decomposition of the
neat PNC polymer, which according to the TGAs of neat PNC
was about 270 uC (see Fig. 5–7). Hence for high thermal
stability of UV-defined patterns of porosity, it was desirable to
use a photodefinable porogen with as high a decomposition
point as possible in the direct-write system.
Fig. 13 compares the interline dielectric constants of the
direct-written films (with 20 wt% PNC loading) to their
control samples for each step of the direct-write process shown
in Fig. 4. After gelation, the matrix had a relatively high
dielectric constant compared to pure HSQ (k = 2.80) due to the
effect of the PBG-released bases on the average polarizability
of the films. After gelation, the direct-write film had a slightly
lower dielectric constant than the control sample due to the
effect of the free volume occupied by the polymer on the
polarizability of the direct-write matrix. After UV exposure,
the dielectric constant of the control sample rose dramatically
owing to the large increase in polarizability that was caused by
the photogeneration of acids. The dielectric constant of the
direct-write film dropped slightly after UV exposure because
the porosity induced in the matrix backbone mitigated the
effect of the increased polarizability from acids. The high
temperature volatilization of the acids caused a decrease in the
dielectric constants of both the porous and control films since
the removal of polar species lowered the polarizability. The
final dielectric constant of the control sample was slightly
higher than that of HSQ (k = 2.80), probably as a result of
increased film density due to catalyzed crosslinking in the
previous steps. The direct-written film exhibited a much lower
dielectric constant than the control due to the induced porosity
within the matrix. Porous films formed via the traditional
template technique and at the same polymer loading as the
direct-written film had interline dielectric values of 2.29
compared to a value of 2.80 for its control film. Using the
Maxwell–Garnett mixing rule to compare the final the interline
dielectric constants of the porous and non-porous films, the
level of UV-induced porosity was estimated to be 21 vol%
for the direct-written films and 20 vol% for the thermally-
processed films.
Although porosity is formed when irradiated films were
heated at 170 uC, the volatilization step, which is performed at
250 uC, is necessary in order to achieve a low-k value. This
indicates that the direct-write process presented here is limited
to substrates capable of withstanding baking temperatures of
250 uC. The use of PBGs and PAGs in the direct-write process
also had an undesirable effect on the overall polarizability of
the HSQ matrix since the interline dielectric constant for
direct-written porous films (k = 2.36) was slightly higher than
that of thermally-processed films (k = 2.29) even though the
UV-induced porosity was slightly higher than the thermally-
induced porosity. This is because the non-porous backbone of
direct-written films (k = 2.95) have a higher dielectric constant
than pure HSQ (k = 2.80). This may be a result of the presence
of by-products of the PAG photocleavage reactions remaining
in the film after volatilization of the acid. Based on the
chemical structures reported in the literature, the by-products
of PAG activation have permanent dipoles; hence, these
species would increase the polarization of the matrix and cause
Fig. 12 Relative comparison of mechanical rigidity induced by bases
released by (A) N-methylnifedipine, (B) NBC, and (C) CTS at different
PBG loading levels.
Fig. 13 Comparison between the interline dielectric constants values
(at 100 kHz) of blanket irradiated direct-written and control films
during processing. Their PNC loadings were 20 wt% and 0 wt%,
respectively.
880 | J. Mater. Chem., 2007, 17, 873–885 This journal is � The Royal Society of Chemistry 2007
the dielectric constant to be higher than that of a pure
HSQ film.48,49
Two scenarios would allow the final polarizability of direct-
written films to be lowered even further. If an alternative
matrix material could be crosslinked at low temperatures
without the need for base catalysis, then the required PAG
content would be much lower since no bases would be present
to partially neutralize the acid molecules. The mass ratio of
PAG to polymer used in the TGA studies was only 3 wt%, thus
the absence of PBGs in such a direct-write system would allow
PAG loadings to be lowered by at least one order of magni-
tude. If the acid content was sufficiently low, the volatilization
step may become unnecessary, hence allowing more substrates
to be used for direct-write processing of low-k films. An
alternative case would involve the use of a base that was more
efficient at crosslinking HSQ than the base released by
N-methylnifedipine. The greater mechanical integrity would
allow higher levels of UV-induced porosity to be incorporated
within the direct-written matrix hence allowing lower values
of the dielectric constant of the direct-written films after the
volatilization step.
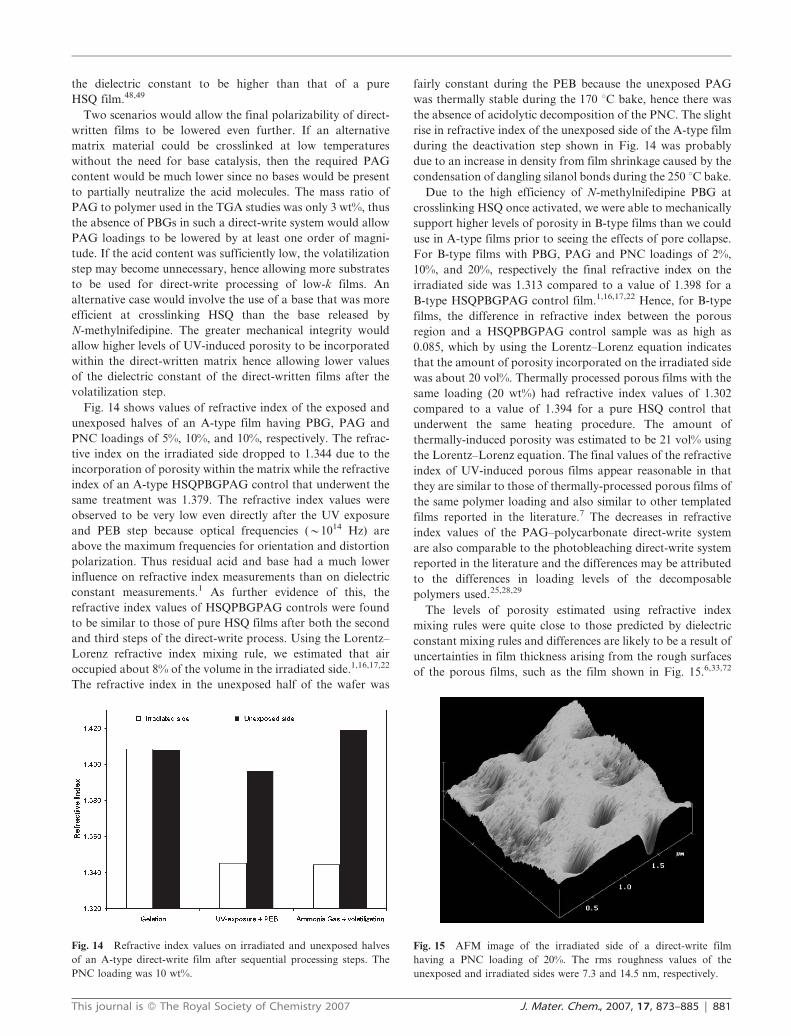
Fig. 14 shows values of refractive index of the exposed and
unexposed halves of an A-type film having PBG, PAG and
PNC loadings of 5%, 10%, and 10%, respectively. The refrac-
tive index on the irradiated side dropped to 1.344 due to the
incorporation of porosity within the matrix while the refractive
index of an A-type HSQPBGPAG control that underwent the
same treatment was 1.379. The refractive index values were
observed to be very low even directly after the UV exposure
and PEB step because optical frequencies (y1014 Hz) are
above the maximum frequencies for orientation and distortion
polarization. Thus residual acid and base had a much lower
influence on refractive index measurements than on dielectric
constant measurements.1 As further evidence of this, the
refractive index values of HSQPBGPAG controls were found
to be similar to those of pure HSQ films after both the second
and third steps of the direct-write process. Using the Lorentz–
Lorenz refractive index mixing rule, we estimated that air
occupied about 8% of the volume in the irradiated side.1,16,17,22
The refractive index in the unexposed half of the wafer was
fairly constant during the PEB because the unexposed PAG
was thermally stable during the 170 uC bake, hence there was
the absence of acidolytic decomposition of the PNC. The slight
rise in refractive index of the unexposed side of the A-type film
during the deactivation step shown in Fig. 14 was probably
due to an increase in density from film shrinkage caused by the
condensation of dangling silanol bonds during the 250 uC bake.
Due to the high efficiency of N-methylnifedipine PBG at
crosslinking HSQ once activated, we were able to mechanically
support higher levels of porosity in B-type films than we could
use in A-type films prior to seeing the effects of pore collapse.
For B-type films with PBG, PAG and PNC loadings of 2%,
10%, and 20%, respectively the final refractive index on the
irradiated side was 1.313 compared to a value of 1.398 for a
B-type HSQPBGPAG control film.1,16,17,22 Hence, for B-type
films, the difference in refractive index between the porous
region and a HSQPBGPAG control sample was as high as
0.085, which by using the Lorentz–Lorenz equation indicates
that the amount of porosity incorporated on the irradiated side
was about 20 vol%. Thermally processed porous films with the
same loading (20 wt%) had refractive index values of 1.302
compared to a value of 1.394 for a pure HSQ control that
underwent the same heating procedure. The amount of
thermally-induced porosity was estimated to be 21 vol% using
the Lorentz–Lorenz equation. The final values of the refractive
index of UV-induced porous films appear reasonable in that
they are similar to those of thermally-processed porous films of
the same polymer loading and also similar to other templated
films reported in the literature.7 The decreases in refractive
index values of the PAG–polycarbonate direct-write system
are also comparable to the photobleaching direct-write system
reported in the literature and the differences may be attributed
to the differences in loading levels of the decomposable
polymers used.25,28,29
The levels of porosity estimated using refractive index
mixing rules were quite close to those predicted by dielectric
constant mixing rules and differences are likely to be a result of
uncertainties in film thickness arising from the rough surfaces
of the porous films, such as the film shown in Fig. 15.6,33,72
Fig. 14 Refractive index values on irradiated and unexposed halves
of an A-type direct-write film after sequential processing steps. The
PNC loading was 10 wt%.
Fig. 15 AFM image of the irradiated side of a direct-write film
having a PNC loading of 20%. The rms roughness values of the
unexposed and irradiated sides were 7.3 and 14.5 nm, respectively.
This journal is � The Royal Society of Chemistry 2007 J. Mater. Chem., 2007, 17, 873–885 | 881
The surface roughness of porous films scaled with the initial
PNC loading, for both UV-exposed and thermally-processed
films. For direct-written films with 20% PNC loadings, the
unexposed and UV-irradiated sides had rms surface roughness
values of 7 nm and 14 nm respectively, while thermally-
processed films of the same PNC loading had an rms surface
roughness values of 26 nm. The sizes of pits on the surface of
both direct-write and thermally-processed porous films varied
widely with their depths ranging from 60–150 nm and their
lateral dimensions were of the order of hundreds of nano-
meters for direct-written films and from hundreds of nano-
meters to 1.5 mm for thermally-processed films. Although the
degree of surface roughness increased with increasing polymer
loading, there did not seem to be any correlation between the
polymer loading and the dimensions of the pits. Light
scattering induced by the surface roughness gave the porous
films a hazy appearance and would have adversely affected the
optical characterization of the films hence increasing the
uncertainty of the refractive index values and any porosity
estimated using them. The roughness would have had a lower
influence on the electrical characterization because the average
film thicknesses (280–430 nm) were much larger than the
values of rms roughness of the films and the uncertainty
induced in modeling the IDEs would be small. For this reason,
the porosity estimates based on the dielectric constant data are
more reliable than that calculated using optical data.
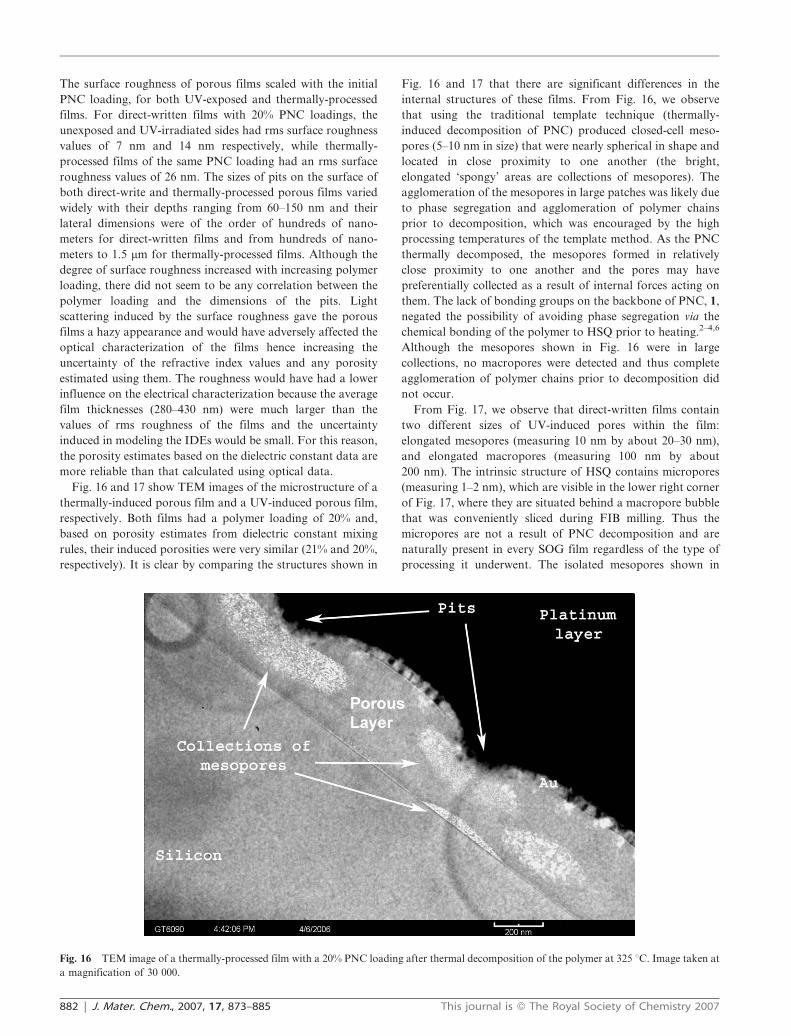
Fig. 16 and 17 show TEM images of the microstructure of a
thermally-induced porous film and a UV-induced porous film,
respectively. Both films had a polymer loading of 20% and,
based on porosity estimates from dielectric constant mixing
rules, their induced porosities were very similar (21% and 20%,
respectively). It is clear by comparing the structures shown in
Fig. 16 and 17 that there are significant differences in the
internal structures of these films. From Fig. 16, we observe
that using the traditional template technique (thermally-
induced decomposition of PNC) produced closed-cell meso-
pores (5–10 nm in size) that were nearly spherical in shape and
located in close proximity to one another (the bright,
elongated ‘spongy’ areas are collections of mesopores). The
agglomeration of the mesopores in large patches was likely due
to phase segregation and agglomeration of polymer chains
prior to decomposition, which was encouraged by the high
processing temperatures of the template method. As the PNC
thermally decomposed, the mesopores formed in relatively
close proximity to one another and the pores may have
preferentially collected as a result of internal forces acting on
them. The lack of bonding groups on the backbone of PNC, 1,
negated the possibility of avoiding phase segregation via the
chemical bonding of the polymer to HSQ prior to heating.2–4,6
Although the mesopores shown in Fig. 16 were in large
collections, no macropores were detected and thus complete
agglomeration of polymer chains prior to decomposition did
not occur.
From Fig. 17, we observe that direct-written films contain
two different sizes of UV-induced pores within the film:
elongated mesopores (measuring 10 nm by about 20–30 nm),
and elongated macropores (measuring 100 nm by about
200 nm). The intrinsic structure of HSQ contains micropores
(measuring 1–2 nm), which are visible in the lower right corner
of Fig. 17, where they are situated behind a macropore bubble
that was conveniently sliced during FIB milling. Thus the
micropores are not a result of PNC decomposition and are
naturally present in every SOG film regardless of the type of
processing it underwent. The isolated mesopores shown in
Fig. 16 TEM image of a thermally-processed film with a 20% PNC loading after thermal decomposition of the polymer at 325 uC. Image taken at
a magnification of 30 000.
882 | J. Mater. Chem., 2007, 17, 873–885 This journal is � The Royal Society of Chemistry 2007
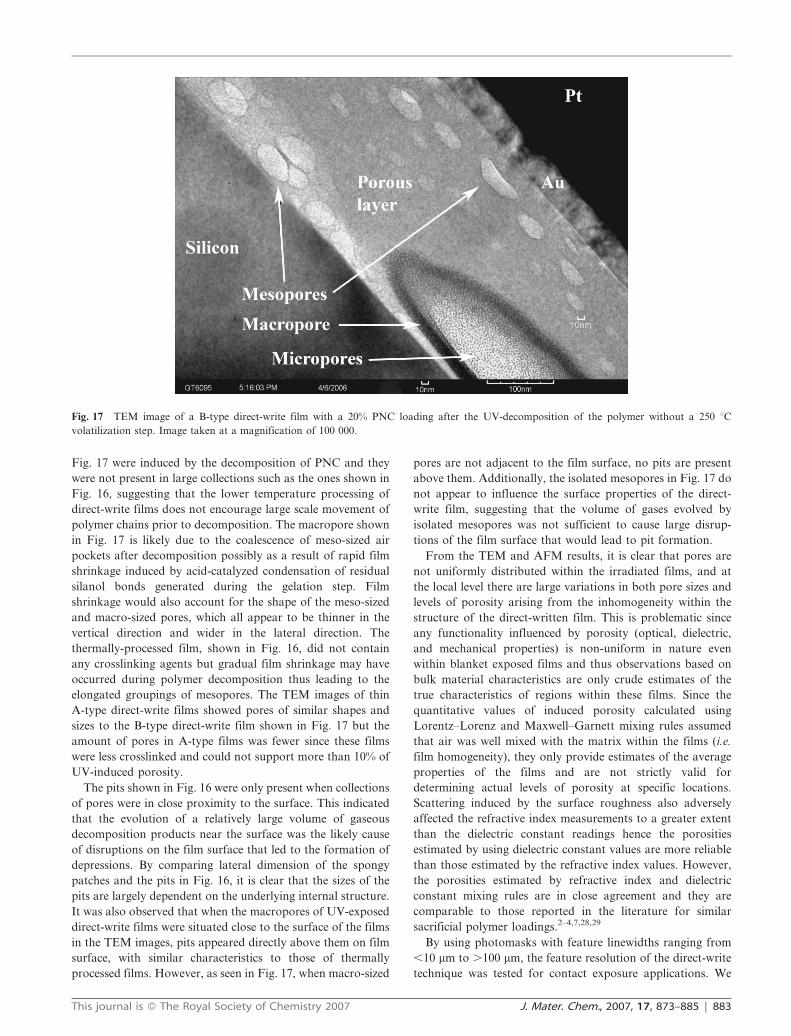
Fig. 17 were induced by the decomposition of PNC and they
were not present in large collections such as the ones shown in
Fig. 16, suggesting that the lower temperature processing of
direct-write films does not encourage large scale movement of
polymer chains prior to decomposition. The macropore shown
in Fig. 17 is likely due to the coalescence of meso-sized air
pockets after decomposition possibly as a result of rapid film
shrinkage induced by acid-catalyzed condensation of residual
silanol bonds generated during the gelation step. Film
shrinkage would also account for the shape of the meso-sized
and macro-sized pores, which all appear to be thinner in the
vertical direction and wider in the lateral direction. The
thermally-processed film, shown in Fig. 16, did not contain
any crosslinking agents but gradual film shrinkage may have
occurred during polymer decomposition thus leading to the
elongated groupings of mesopores. The TEM images of thin
A-type direct-write films showed pores of similar shapes and
sizes to the B-type direct-write film shown in Fig. 17 but the
amount of pores in A-type films was fewer since these films
were less crosslinked and could not support more than 10% of
UV-induced porosity.
The pits shown in Fig. 16 were only present when collections
of pores were in close proximity to the surface. This indicated
that the evolution of a relatively large volume of gaseous
decomposition products near the surface was the likely cause
of disruptions on the film surface that led to the formation of
depressions. By comparing lateral dimension of the spongy
patches and the pits in Fig. 16, it is clear that the sizes of the
pits are largely dependent on the underlying internal structure.
It was also observed that when the macropores of UV-exposed
direct-write films were situated close to the surface of the films
in the TEM images, pits appeared directly above them on film
surface, with similar characteristics to those of thermally
processed films. However, as seen in Fig. 17, when macro-sized
pores are not adjacent to the film surface, no pits are present
above them. Additionally, the isolated mesopores in Fig. 17 do
not appear to influence the surface properties of the direct-
write film, suggesting that the volume of gases evolved by
isolated mesopores was not sufficient to cause large disrup-
tions of the film surface that would lead to pit formation.
From the TEM and AFM results, it is clear that pores are
not uniformly distributed within the irradiated films, and at
the local level there are large variations in both pore sizes and
levels of porosity arising from the inhomogeneity within the
structure of the direct-written film. This is problematic since
any functionality influenced by porosity (optical, dielectric,
and mechanical properties) is non-uniform in nature even
within blanket exposed films and thus observations based on
bulk material characteristics are only crude estimates of the
true characteristics of regions within these films. Since the
quantitative values of induced porosity calculated using
Lorentz–Lorenz and Maxwell–Garnett mixing rules assumed
that air was well mixed with the matrix within the films (i.e.
film homogeneity), they only provide estimates of the average
properties of the films and are not strictly valid for
determining actual levels of porosity at specific locations.
Scattering induced by the surface roughness also adversely
affected the refractive index measurements to a greater extent
than the dielectric constant readings hence the porosities
estimated by using dielectric constant values are more reliable
than those estimated by the refractive index values. However,
the porosities estimated by refractive index and dielectric
constant mixing rules are in close agreement and they are
comparable to those reported in the literature for similar
sacrificial polymer loadings.2–4,7,28,29
By using photomasks with feature linewidths ranging from
,10 mm to .100 mm, the feature resolution of the direct-write
technique was tested for contact exposure applications. We
Fig. 17 TEM image of a B-type direct-write film with a 20% PNC loading after the UV-decomposition of the polymer without a 250 uCvolatilization step. Image taken at a magnification of 100 000.
This journal is � The Royal Society of Chemistry 2007 J. Mater. Chem., 2007, 17, 873–885 | 883
observed that although the direct-write process shown in Fig. 4
allowed patterning of arbitrary shapes and complex designs,
the direct-written features had indistinct core/cladding bound-
aries. By comparing the dimensions of indistinct features as
processing parameters such as PEB temperature and time were
varied, we concluded that the fuzzy boundaries were a result of
acid diffusion that arose from the formation of an acid
concentration gradient within the film after UV exposure. The
acid gradient was produced because acid was only formed in
irradiated areas, while no acid was initially present underneath
opaque areas of the photomasks.73 As acid molecules diffused
from exposed to unexposed areas across the core/cladding
boundary, partial decomposition of PNC occurred in the
unexposed region adjacent to the boundary. The final result of
the acid diffusion was image spreading of the photoactive
region, which is a common limitation of the linewidth
resolution of resists.74–77 The diffusion of photogenerated acid
into unexposed regions also led a decrease of the waveguide
core linewidth owing to decomposition of PNC as acid mole-
cules permeated the core/cladding boundary. Preliminary
studies have shown that, depending on PEB conditions,
patterned core linewidths varied from being between 3 mm
and 17 mm thinner than the width of the opaque lines on the
photomask thus limiting the fine-feature patterning capability
of the direct-write process to features with dimensions
measuring several microns.
One method for reducing the image spreading of the
photogenerated acid in the direct-write system is to increase
the ratio of PBG to PAG prior to spin-coating the wafer.76 In
such a system photogenerated bases would neutralize acid
molecules that diffuse into the unexposed regions thus
quenching acid diffusion and decreasing the diffusion length.76
Further studies need to be performed to determine the optimal
formulation and processing conditions for achieving minimal
acid diffusion and highest resolution of core and cladding
features. In light of the diffusion of photogenerated acid into
core regions, it is expected that the direct-write method
outlined in this paper leads to graded profiles of porosity
and refractive index and thus the core/cladding D(refractive
index) shown in Fig. 14 is the maximum difference between
core and cladding regions of an A-type direct-write film.
Conclusions
A processing technique was presented in which UV exposure
was used to create both blanket porosity and laterally
patterned porosity within dielectric films. This process relied
on the ability of photogenerated acids to cause main chain
scission and volatilization of polycarbonate-based sacrificial
polymers templated in a crosslinkable dielectric matrix. The
results were repeatable and processing was performed in a
laboratory using commercially available materials and low-
cost equipment. The average level of induced porosity scaled
with the initial sacrificial polymer loadings but direct-written
pores were unevenly distributed within the films and the
microstructures were non-homogeneous. For optimal condi-
tions, direct-written films with sacrificial polymer loadings of
20 wt% with respect to matrix solids produced roughly an
average of porosity of 21 vol% to give a final interline dielectric
constant of 2.36, and a refractive index value of 1.313. Both
elongated mesopores (measuring 10 nm by about 20–30 nm),
and elongated macropores (measuring 100 nm by about
200 nm) were produced within the internal structure of
direct-written films. It is believed that the mesopores were
a direct result of the decomposition of the photodefinable
polymer whereas the macropores were likely a result of
coalescence of the mesopores due to film shrinkage.
Acknowledgements
The authors would like to acknowledge the sample donations
of research-grade PNC and FOx1-1x resins by Promerus LLC
and Dow Corning Corp., respectively. The N-methylnifidepine
PBG was synthesized, purified and its structure, 4, verified
using 1H-NMR by Takashi Okada, a visiting scientist from
JSR. The authors would also like to thank Professor Seth
Marder in the Department of Chemistry at the Georgia
Institute of Technology for offering advice regarding PBG
synthesis. Thin TEM sections were prepared by Martin
Brucherseifer using the facilities in the FIB2 Center at the
Georgia Institute of Technology established under NSF :
CRIF project # 0343028. TEM analyses were performed by
Yolande Berta using the facilities in the Center of
Nanostructure Characterization and Fabrication at the
Georgia Institute of Technology. AFM analyses were
performed by Dhananjay Bhusari using the facilities located
in the Microelectronics Research Center located at the Georgia
Institute of Technology. This material is based on work
supported by the STC program of the National Science
Foundation under agreement # DMR-0120967.
References
1 K. Maex, M. R. Baklanov, D. Shamiryan, F. Iacopi, S. H.Brongersma and Z. S. Yanovitskaya, J. Appl. Phys., 2003, 93,8793–8841.
2 J. L. Hedrick, R. D. Miller, C. J. Hawker, K. R. Carter, W. Volksen,D. Y. Yoon and M. Trollsas, Adv. Mater., 1998, 10, 1049–1053.
3 K. R. Carter, R. A. DiPietro, M. I. Sanchez and S. A. Swanson,Chem. Mater., 2001, 13, 213–221.
4 J. W. Labadie, J. L. Hedrick, V. Wakharkar, D. C. Hofer andT. P. Russell, IEEE Trans. Compon., Hybrids, Manuf. Technol.,1992, 15, 925–930.
5 A. M. Padovani, S. A. Bidstrup Allen and P. A. Kohl, Proceedingsof 8th International Advanced Packaging Materials Symposium,Stone Mountain, GA, USA, 2002, ed. R. Tummala, IEEE,Piscataway, NJ, USA, 2002, pp. 20–24.
6 A. M. Padovani, L. Rhodes, S. A. Bidstrup Allen and P. A. Kohl,J. Electrochem. Soc., 2002, 149, 161–170.
7 A. M. Padovani, L. Riester, L. Rhodes, S. A. Bidstrup Allen andP. A. Kohl, J. Electrochem. Soc., 2002, 149, 171–180.
8 A. M. Padovani, L. Rhodes, L. Riester, G. Lohman, B. Tsuie,J. Conner, S. A. Bidstrup and P. A. Kohl, Electrochem. Solid-StateLett., 2001, 4, 25–28.
9 H.-J. Lee, E. K. Lin, H. Wang, W. Wen-li, C. Wei and E. S. Moyer,Chem. Mater., 2002, 14, 1845–1852.
10 F. Iacopi, M. R. Baklanov, E. Sleeckx, T. Conard, H. Bender,H. Meynen and K. Maex, J. Vac. Sci. Technol., B, 2002, 20,109–115.
11 B. Zhong, H. Meynen, F. Iocopi, K. Weidner, S. Mailhouitre,E. Moyer, C. Bargeron, P. Schalk, A. Peck, M. V. Hove andK. Maex, Mater. Res. Soc. Symp. Proc., 2002, 716, 575–580.
12 F. Iacopi, Z. Tokei, Q. T. Le, D. Shamiryan, T. Conard, B. Brijs,U. Kreissig, M. Van Hove and K. Maex, J. Appl. Phys., 2002, 92,1548.
884 | J. Mater. Chem., 2007, 17, 873–885 This journal is � The Royal Society of Chemistry 2007
13 V. Jousseaume, M. Fayolle, C. Guedj, P. H. Haumesser, C. Huguet,F. Pierre, R. Pantel, H. Feldis and G. Passemard, J. Electrochem.Soc., 2005, 152, 156–161.
14 P. De Rouffignac, Z. Li and R. G. Gordon, Electrochem. Solid-State Lett., 2004, 7, 306–308.
15 B. P. Gorman, D. W. Mueller, O. Chyan and R. F. Reidy,Advanced Metallization Conference 2005 (AMC 2005), ColoradoSprings, CO, United States, 2006, ed. S. H. Brongersma, T. C.Taylor, M. Tsujimura and K. Masu, MRS, Warrendale, PA, USA,2006, pp. 392–397.
16 M. R. Baklanov and K. P. Mogilnikov, Microelectron. Eng., 2002,64, 335–349.
17 M. R. Baklanov, E. Kondoh, E. K. Lin, D. W. Gidley, H. J. Lee,K. P. Mogilnikov and J. N. Sun, Proceedings of the IEEE 2001International Interconnect Technology Conference, Burlingame,CA, USA, 2001, IEEE, Piscataway, NJ, USA, 2001, pp. 189–191.
18 J. H. Wang, W. J. Chen, T. C. Chang, P. T. Liu, S. L. Cheng,J. Y. Lin and L. J. Chen, J. Electrochem. Soc., 2003, 150, 141–146.
19 J.-N. Sun, Y. Hu, W. E. Frieze, W. Chen and D. W. Gidley,J. Electrochem. Soc., 2003, 150, 97–101.
20 Y. Xu, D. W. Zheng, Y. Tsai, K. N. Tu, B. Zhao, Q. Z. Liu,M. Brongo, C. W. Ong, C. L. Choy, G. T. T. Sheng and C. H. Tung,J. Electron. Mater., 2001, 30, 309–313.
21 J.-H. Yim, M. R. Baklanov, D. W. Gidley, H. Peng, H.-D. Jeongand L. S. Pu, J. Phys. Chem. B, 2004, 108, 8953–8959.
22 C. Murray, C. Flannery, I. Streiter, S. E. Schulz, M. R. Baklanov,K. P. Mogilnikov, C. Himcinschi, M. Friedrich, D. R. T. Zahn andT. Gessner, Microelectron. Eng., 2002, 60, 133–141.
23 F. Iacopi, R. A. Donaton, B. Coenegrachts, T. Komiya, H. Struyf,M. Lepage, J. Van Aelst, W. Boullart, D. De Roest, I. Vos,M. R. Baklanov, G. Vereecke, M. Van Hove, M. Stucchi, Z. Tokei,H. Meynen, J. N. Bremmer, S. Vanhaelemeersch and K. Maex,Proceeding of Advanced Metallization Conference (AMC), heldOctober 2–5 in San Diego, CA, United States and October 19–20in Tokyo, Japan, 2000, ed. D. Edelstein, G. Dixit, Y. Yasuda andT. Ohba, MRS, Warrendale, PA, USA, 2000, pp. 287–293.
24 R. K. Nahar, J. Vac. Sci. Technol., B, 2002, 20, 382–385.25 N. Nagayama, M. Shimono, T. Sato and M. Yokoyama, Mol.
Cryst. Liq. Cryst. Sci. Technol., Sect. A, 2000, 349, 119–122.26 K. Tamaki, H. Takase, Y. Eriyama and T. Ukachi, J. Photopolym.
Sci. Technol., 2003, 16, 639–648.27 R. D. Miller and J. Michl, Chem. Rev., 1989, 89, 1359–1410.28 S. Mimura, H. Naito, Y. Kanemitsu, K. Matsukawa and H. Inoue,
J. Organomet. Chem., 2000, 611, 40–44.29 S. Miura, A. Kobayashi, H. Naito, Y. Matsuura, K. Matsukawa
and H. Inoue, Synth. Met., 2003, 137, 1405–1406.30 Y. Nakayama, T. Kurando, H. Hayashi, K. Oka and T. Dohmaru,
J. Non-Cryst. Solids, 1996, 198–200, 657–660.31 A. Watanabe, O. Ito, M. Matsuda, M. Suezawa and K. Sumino,
Jpn. J. Appl. Phys., Part 1, 1994, 33, 4133–4134.32 A. Watanabe and M. Matsuda, Macromolecules, 1992, 25, 484–488.33 K. Matsukawa, S. Fukui, N. Higashi, M. Niwa and H. Inoue,
Chem. Lett., 1999, 1073–1074.34 K. Matsukawa, K. Katada, N. Nishioka, Y. Matsuura and
H. Inoue, J. Photopolym. Sci. Technol., 2004, 17, 51–52.35 K. Matsukawa and Y. Matsuura, Mater. Res. Soc. Symp. Proc.,
2005, 847, 45–56.36 J. M. J. Frechet, F. Bouchard, E. Eichler, F. M. Houlihan,
T. Iizawa, B. Kryczka and C. G. Willson, Polym. J., 1987, 19,31–49.
37 J. P. Jayachandran, H. A. Reed, H. Zhen, L. F. Rhodes, C. L.Henderson, S. A. Bidstrup and P. A. Kohl, J. Microelectromech.Syst., 2003, 12, 147–159.
38 J. V. Crivello, Chemistry of photoacid generating compounds, ACS,Washington DC, USA, 1989.
39 J. V. Crivello, J. Polym. Sci., Part A: Polym. Chem., 1999, 37,4241–4254.
40 J. V. Crivello and S. Kong, Macromolecules, 2000, 33, 833–842.41 J. V. Crivello and J. H. W. Lam, J. Polym. Sci., Polym. Symp.,
1977, 383–395.
42 J. V. Crivello and J. H. W. Lam, J. Polym. Sci., Polym. Lett. Ed.,1978, 16, 563–571.
43 J. V. Crivello and J. L. Lee, Polym. Photochem., 1982, 2, 219–226.44 J. V. Crivello, J. Ma and F. Jiang, J. Polym. Sci., Part A: Polym.
Chem., 2002, 40, 3465–3480.45 J. P. Fouassier, D. Burr and J. V. Crivello, J. Macromol. Sci., Pure
Appl. Chem., 1994, A31, 677–701.46 M. Shirai, K. Suyama, H. Okamura and M. Tsunooka,
J. Photopolym. Sci. Technol., 2002, 15, 715–730.47 M. Shirai and M. Tsunooka, Prog. Polym. Sci., 1996, 21, 1–45.48 S. Tagawa, S. Nagahara, T. Iwamoto, M. Wakita, T. Kozawa,
Y. Yamamoto, D. Werst and A. D. Trifunac, Proc. SPIE–Int. Soc.Opt. Eng., 2000, 3999, 204–213.
49 J. L. Dektar and N. P. Hacker, J. Am. Chem. Soc., 1990, 112,6004–6015.
50 J. F. Cameron, C. Grant Willson and J. M. J. Frechet, J. Am.Chem. Soc., 1997, 118, 12925–12937.
51 A. M. Sarker, A. Lungu, A. Mejiritski, Y. Kaneko andD. C. Neckers, J. Chem. Soc., Perkin Trans. 2, 1998, 2315–2331.
52 G. A. Epling and M. E. Walker, Tetrahedron Lett., 1982, 23,3843–3846.
53 S. Matuszczak, J. F. Cameron, J. M. J. Frechet and C. G. Wilson,J. Mater. Chem., 1991, 1, 1045–1050.
54 M. Tsunooka, H. Tachi, T. Yamamoto and M. Shirai, Polym.Prepr. (Am. Chem. Soc., Div. Polym. Chem.), 2001, 42, 720–721.
55 C. G. Willson, J. F. Cameron and J. M. J. Frechet, Polym. Mater.:Sci. Eng., 1996, 74, 437.
56 M. R. a. Winkle and K. A. Graziano, J. Photopolym. Sci. Technol.,1990, 3, 419–422.
57 B. R. Harkness, K. Takeuchi and M. Tachikawa, Macromolecules,1998, 31, 4798–4805.
58 B. R. Harkness, K. Takeuchi and M. Tachikawa, Polym. Adv.Technol., 1999, 10, 669–677.
59 Y. K. Siew, G. Sarkar, X. Hu, J. Hui, A. See and C. T. Chua,J. Electrochem. Soc., 2000, 147, 335–339.
60 W. C. Oliver and G. M. Pharr, J. Mater. Res., 1992, 7, 1564–1580.61 H.-C. Liou and J. Pretzer, Thin Solid Films, 1998, 335, 186–191.62 W.-C. Liu, C.-C. Yang, W.-C. Chen, B.-T. Dai and M.-S. Tsai,
J. Non-Cryst. Solids, 2002, 311, 233–240.63 J. N. Bremmer, Y. Liu, K. G. Gruszynski and F. C. Dall, Mater.
Res. Soc. Symp. Proc., 1997, 476, 37–44.64 C.-C. Yang and W.-C. Chen, J. Mater. Chem., 2002, 12,
1138–1141.65 M. A. Brook, Silicon in Organic, Organometallic, and Polymer
Chemistry, John Wiley & Sons, New York, 2000.66 L. H. Sommer, Stereochemistry, mechanism and silicon; an intro-
duction to the dynamic stereochemistry and reaction mechanisms ofsilicon centers, McGraw-Hill, New York, 1965.
67 R. West, J. Am. Chem. Soc., 1954, 76, 6015–6017.68 K. J. Shea and D. A. Loy, Acc. Chem. Res., 2001, 34, 707–716.69 Y. Toivola, J. Thurn and R. F. Cook, J. Electrochem. Soc., 2002,
149, 9–17.70 J. F. Cameron and J. M. J. Frechet, J. Am. Chem. Soc., 1991, 113,
4303–4313.71 S. K. Lee, B.-J. Jung, T. Ahn, I. Song and H.-K. Shim,
Macromolecules, 2003, 36, 9252–9256.72 Y. Matsuura, S. Miura, H. Naito, H. Inoue and K. Matsukawa,
J. Photopolym. Sci. Technol., 2002, 15, 761–764.73 A. L. Hines, Maddox and N. Robert, Mass transfer: fundamentals
and applications, Prentice-Hall, Englewood Cliffs, NJ, 1985.74 F. A. Houle, W. D. Hinsberg, M. Morrison, M. I. Sanchez,
G. Wallraff, C. Larson and J. Hoffnagle, J. Vac. Sci. Technol., B,2000, 18, 1874–1885.
75 T. Itani, H. Yoshino, S. Hashimoto, M. Yamana, N. Samoto andK. Kasama, Microelectron. Eng., 1997, 35, 149–152.
76 T. Itani, H. Yoshino, S. Hashimoto, M. Yamana, N. Samoto andK. Kasama, Polym. Mater. Sci. Eng., 1997, 77, 432–433.
77 E. Richter, S. Hien and M. Sebald, Microelectron. Eng., 2000, 53,479–483.
This journal is � The Royal Society of Chemistry 2007 J. Mater. Chem., 2007, 17, 873–885 | 885