Embed Size (px)
Citation preview

AD-Ai54 149 AN INVESTIGATION OF THE IRRADIATION SWELLING MECHANISMS 1/2IN REFRACTORY MET.-(U) WESTINGHOUSE ADVANCED ENERGYSYSTEMS DIV LARGE PA R BAJFIJ ET AL. FEB 85
UNCLASSIFIED WESD-TR-85-0085 AFOSR-TR-85 13378 F/G 11/6 N
EhmhhhosmmomiEEohmhhEEEEEEEEhEEohhohEmhEI*uuuuumuuuuumomEEEEEEEmhhhEImhahmhh!EDh

6
1 1 50 3 111112
11111 ____111113 __ 15 j 2 O211111 111112
1*25 ff 1*4
0 NATIONAL BUREAU OF STANDARDSMtGROCOPY RESOLUTION TEST CHART
6 """ ' "" " m f ' . . . .t " " " ' ' i i k l m' m "J''g~ ~kRkl'''--a, m L m W

AFOSR-TR. 8 5 - 0 378 WAESD-TR-85-005. -
AD-A154 149
An Investigation Of TheIrradiation Swelling Mechanisms
In Refractory MetalsAt High Temperatures
Phase I Report
Prepared For
AIR FORCE OFFICE OF SCIENTIFIC RESEARCH
SContract No. F49620-3-C-O1ODT'C
FEBRUARY 19S5 -.M AY 2 2 1§5
Cm.~~~~ DISMhB JTON 'TAh. rf
LA) Approved k.f ,.,bf i, r] .as.;
(i @ WestinghouseAdvanced Energy Systems Division
Large, P.O. Box I104, Pftbu'gh, PA 15236

DISCLAIMER
* ~The views and conclusions contained, in this dpcmn #those of the authors and should not be' interprete,. d usneesAHA1Irepresenting the official ' licies or. eftdbrs6Wmtst~t' xr~eor implied, of the Air Force Office of- ScientifcReeidor the U.S. Government.4

* ' ,Aclassi,d_51 CJH-TN CLASSIFIC47 IONv OF THIS PAGE
REPORT DOCUMENTATION PAGE- aH(iC,R7 SLCURTY CLASSIFICAr ION 1b,. RESTRICTIVE MARKINGS
* Unclassified _______________________r 2a SEC.,RITY CLASSiFICATION AUTHORITY 3. ODSTRIBUTION/AVAI LABILITY OF REPORT
j2-) OLCLASS>IFICATiC%,DO..%NGRADING SCHEDULE Uncl assi f ipoedrubI r1e.4 PEHF~PMINI~ ORIdNIZATbutioaiunlimited. -
-4 PRFC;MINGORG: NIATIO REORT UMBEtS)5. NI1TORING ORGANIZATION REPORT NUMBERiSI
AFOSRt-TR- 845-0378I,, .A'.'L OF PERF CPM.,%G ORGANIZATION 0b OFFICE SYMBOL 7a. NAME OF MONITORING Ol-GAINIZATION
Iv..estinghouse-.dvanced Energy (If'applicobh') Air Force Office of Scientific Researchc jste-s Division______________ _______
& (c. ADOHESS (1tt, !-late anid LIP (oded 7b. ADDRESS (City, Stal1e and ZIP Cod.1
* P.O. Box 10864* Pittsburgh, PA 15236 Boiling Air Force Base, Dr 20332
____ ___ ____ ___ ____ _ ___________(AFSC)
6 .AVE OF F-%C.'.GSONSORING 8ao. OFFICE SYMBOL 9. PROCUREMENT INSTRUMENT IDENTIFICATION NUMBERORGANIZATION Air Force Office (I applicablec6 0-3 C 0 2
of Scientific Resea.rchF4608-0l26c ADDRESS sClt.. State anid IP Code) 10 SOURCE OF FULNDING NOS
PnCGRAM PROJECT TASK(
Foilinq Air Force Base, DC 20332 E._EMENT NO. NO. NO0
11 "61 IfcIjonifAn Investigation of t e F I~~~'~O 'LIrr di, i-n Sw,-ellinn Mechanisms in Pefractory I,
12.FESC .C. ALT~R~j le at Hign lemperaturesu
* 12a. TYPE OF REPORT 13b. TIME COVERED 114. DATE OF REPORT (Yr.. M.,. Day) 15I. PAGE COUNT
Z6 UPLEMNAR OTTO FROM 1983. TO 1984 Feb. 1985 110j
17II COSATI CODES 18 SUBJECT TERMS ICoritinue on rev~erse it neceusam- and adentify by block nijmberi
FIELD1 i GRLPSBG ~ e ng , Rad iat ion Ef fec ts, I on Bomba rdmen t, Ref ra cto ry
I Metals, Theory of Swelling, Ion-Simulation Irradiation j19. ABSTRACT (Coninue on frLers, if necessar-y and identify by block number) ~ ~ -
-This report presents the results of progress made during th e first year of a
*three year program on the investigation of swelling mechanisms in refractory
ietals irrddidted at elevated temperatures, i.e. 0.3 T - 0.6 T (where
0 T = melting point in K). The objective of this work is to achieve an
understanding of the elevated temperature swelling in these body centered
*cubic (bcc) metals by a close coupling of theoretical development and
experimental verification.*I
0 __ _ _ _ _ _ _ _ _ _ _ _ _ _ _ _ _ _ _ _
20 OIST7o6SUTION AVAILABILITY OF ABSTRACT 21 ABSTRACT SECURITY CLASSIFICATION
* UNCLASSIFIED UNLIMI1TED C SAME AS RPT E: D1IC USERS
" 2a NAME OF RESPONSIBLE INDIVIDUAL2uTEEHN NUMBER t#22c OFFIC Sfi&L
* DD FORM 1473, 83 APR~ EDITION OF I JAN 73 IS OBSOLETE -Unclasified -
SECURITY CLASSIFICATION OF THIS 04-C

* .. , . . .. . -- .- -. ; -. . -. v- . , .- v-.: -* -. = .. . . . .. .. w
0 t';a .si fied SECURITY CLASSIFfCATION OF THIS PAGE
19. Abstract Contd.
I During this period, a theoretical model based on the chemical reaction rate
formalism was developed specifically for bcc metals. Calculations were
perform~ed for niobium, which was subsequently chosen for the experimental work
based on theoretical, experimental and practical considerations. A special Nb
ion source material was developed which produced Nb ions of sufficient energy
and flux to permit, for the first time, ion bombardment of niobium with
self-ions. A series of irradiations with 5.3 MeV Nb + ions at temperatures
ranging from 700°C to 12000 C were performed at the Argonne National Laboratory.
At a nominal dose of 50 dpa and a dose rate of approximately 6 x 10⁻³ dpa/s
swelling was observed over a temperature range of 700 ° to 1200 0C with peak
swelling of 7% at 9000C. Comparison of these experimental results with
previous investigations suggested that the use of Ni ions in earlier
irradiations may account for the observed difference in the data.
The microstructural data, obtained from transmission electron microscopy (TEM)
were compared to the predictions of the theoretical model. A reasonable
agreement was obtained between experimental measurements of swelling and
theoretical predictions by adjusting both the niobium-oxygen binding energy
and the incubation dose for swelling to realistic values. Sink-strength
ratios were also calculated from the data. The theory-experiment comparison
indicated a need for further investigation in the areas of microstructural
evolution at low dose, kinetics of cavity growth, and trapping effects due to
oxygen.
SECURITY CLASSIFICATION OF THIS PAGr

'IAESD-TR-85-005
AN INVESTIGATION OF THE IRRADIATION SWELLING
MECHANISMS IN REFRACTORY METALS AT HIGH TEMPERATURES
SW.FINAL TECHNICAL REPORT
R. Bajaj
- "B.O. Hall
G.R. Fenske
Approved by: AS.A. Shiels, Manager
Materials Science
R.W ckman, Jr., Managw
Materials Technology
C.R. Adkins, Manager
Technology Department
Prepared for the Air Force Office of Scientific Research (AFSC)
Under Contract
* F49b20-83-C-0l 20
February 1985
Westinghouse Electric Corporation
Advanced Energy Systems Division
P.O. Box 10864
Pittsburgh, PA 15236
Thi, '
• Djep hi f, ..-, , . - D I . . . , -

I
AN INVESTIGATION OF IRRADIATION SWELLING MECHANISMS
IN REFRACTORY METALS AT HIGH TEMPERATURES..
R. Bajaj
3 Westinghouse Advanced Energy Systems Division
B.O. Hall
@3 Westinghouse Research Laboratories
G.R. Fenske
6g _ Argonne National Laboratories
6"
-.
* '- -
K'%.9p'rw

I-:
TABLE OF CONTENTS
Page
m Abstract x
1.0 INTRODUCTION AND BACKGROUND 1
2.0 PROGRAM OBJECTIVE 2
3.0 SIMULATION TECHNIQUES 2
4.0 REVIEW OF IRRADIATION TESTS ON REFRACTORY METALS 3
4.1 Vanadium 4
4.2 Niobium 7
4.3 Tantalum 7
4.4 Molybdenum B
4.5 Tungsten 9
4.6 Conclusions on the State of the Art of Refractory
Metal Irradiation Data 10
5.0 SELECTION OF MATERIAL FOR STUDY 10
6.0 DEVELOPMENT OF A THEORETICAL MODEL FOR REFRACTORY METALS 12
6.1 Point-Defect Concentrations 12
6.1.1 Sink Strengths 14
6.1.2 Defect Production Rates 16
6.2 Interstitial Dislocation Loops 16
6.2.1 Rate Equations 19
6.3 Helium 20
6.4 Solutes 22
6.5 Cavities 23
6.6 Calculations for Niobium 23
6.7 Results of Calculations 24
6.7.1 Loop Capture Efficiencies 24
6.7.2 Loop and Void Growth Rates 36
6.7.3 Helium 41
6.8 Summary o" Results of Calculations 43

TABLE OF CONTENTS (Continued)
Page
7.0 EXPERIMENTAL 45
7.1 Irradiation Facility 45
* 7.1.1 2-MV Tandem Accelerator 46
7.1.2 Material Procurement and Specimen Preparation 48
7.2 Irradiation Procedure 50
7.3 Post-Irradiation Specimen Preparation and TEM
Observations 54
7.4 Analysis of Data Obtained from TEM 56
0 7.4.1 Correction Factor Ft . for Surface
Intersections 58
8.0 RESULTS 59
9.0 DISCUSSION 77
9.1 Comparison of Results of Present Study with the
Existing Data 77
9.2 Comparison of Experimental Data and Model
Calculations 84
9.2.1 Critical Size for Cavity Growth 85
9.2.2 Sink Strength Ratios 86
9.2.3 Calculated Swelling Curves 88
9.3 Suggested Areas of Experimental and Theoretical
Investigation 99
10.0 SUMMARY AND CONCLUSIONS 100
11.0 REFERENCES 102
12.0 ACKNOWLEDGEMENTS 109
ii
" I -~ h i -J i ' j d d "~'a- ,,-

13 LIST OF FIGURES
Fig. NO. Page
I 1 Schematic of regimes for loop capture efficiencies 27
- and Z 2 Solid line indicates values consistent
with current theories.
2 Vacancy concentration as a function of temperature for 30
production rates G of 1020 , 1018 , and 1 16/cm3 -s, in
descending order. Solid curves are for network density
=16 2 11 2L = 106/cm , dashed curves for L = 10 /cm
3 Schematic of growth and shrinkage regimes for loops 32
and voids as a function of sink strength ratio SI/S v .
4 Sink strength ratio S /Sv as a function of cavity density 3312 vI U nd
Nc for Z 1 1.02, ZI = biZI /b2 0 and Zd = 1.05. Panels
are labeled by network density L, and individual curves by
the value of N1 2. N l = 10- 5 N1 2.
5 Sink strength ratio S/Sv as a function of cavity density Nc 34
for Z = 1.05, ZI = bZ 12/b and Znd = 1.05. Panels
are labeled by network density L, and individual curves by
*_ the value of N12. N l = 10- 5 Nt2.
6 Sink strength ratio S /Sv as a function of cavity density 35t2 ti U2 ndNc for ZI = 1.10, ZI = bIz I 2# and ZI = 1.05. Panels
4 are labeled by network density L, and individual curves by
the value of Nt2. N 1 t 10- N 2.
iii
, -

LIST OF FIGURES (Continued)
Fig. No. Page
7 Growth rate for <100> loops as a function of temperature. 38
Solid curves are for a network dislocation density L of
108 /cm ; dashed curves are for L = 10l/cm . Curves9.2
in each set are for bias factors Z = 1.0, 1.02, 1.05,1 11 9.2
and 1.1 in an ascending sequence, with ZI = b 1 lb 2.
Irradiation and microstructural parameters are given in
the text.
8 Growth rate for <111> loops as a function of temperature. 39
Solid curves are for a network dislocation density L of
10 /cm ; dashed curves are for L = 10l/cm . Curves9.2
in each set are for bias factors Z1 values, with the
sign indicating growth (+) or shrinkage (-). Irradiation
4and microstructural parameters are given in the text.
9 Growth rate for voids as a function of temperature. Solid 40
curves are for a network dislocation density L of 10 /cm2
9.2
and are labeled by assumed Z values. Dashed curve1 11 2
is for a network density L = 10 /cm , and for all values
of Z investigated. (+} sign indicates growth regime;(-) sign indicates shrinkage regime.
10 Cavity growth rate as a function of temperature for 428 2 9.2L = 10 /cm , Z 1 1.02, and other parameters as
given in text. Curves are labeled by ratio P /Pegg g
11 Critical temperature Tc and peak growth temperature I 44
as a function of ratio P /peg.gg
I
iv
'.I i

LIST OF FIGURES (Continued)EFig. No. Page
12 A photographic view of the target holder and electron 51
4beam heating arrangement.
13 Energy deposition and projected range probability for 53
niobium irradiated with 5.3 MeV Nb + at an incidence
angle of 100.
14 Ion milling calibration curve for niobium. 55
•L 15 Swelling as a function of irradiation temperature for 61
niobium.
16 Void number density as a function of irradiation 62
temperature for niobium.
17 Average void size and dislocation density as a function 63
of irradiation temperature for niobium.U
18 Voids and dislocations (inset) in niobium irradiated 65
to 32 +4 dpa at 700*C. For voids [113), for
dislocations 9 = [110], ~ [1131.
19 Voids and dislocations (inset) in niobium irradiated 66
to 54 +9 dpa at 8000C. For voids ~ [111],
for dislocations g = [110], 1 [111].
20 Voids and dislocations (inset) in niobium irradiated 67
to 50 +9 dpa at 9000 C. For voids I - [111,
for dislocations g = [110], 1 - [1111.
V

LIST OF FIGURES (Continued)
Fig. No. Page
21 Voids and dislocations (inset) in niobium irradiated 68
to 57 +10 dpa at 100°0 C. For voids I [111], for
dislocations g = [110], 1 [111].
22 Voids and dislocations (inset) in niobium irradiated 69
to 53 +9 dpa at 1000°C. For voids I - [111], for
dislocations g = [110], 1 [111].
23 Voids and dislocations (inset) in niobium irradiated 70
* to 52 +9 dpa at 1200 0C. For voids [ [111], for
dislocations g = [110], 1 [l1].
24 Void size distribution in niobium irradiated at 700°C 71
to 32 +4 dpa. NOTE: Beam was held at incidence angles
of 100 and 450 for equal times.
25 Void size distribution in niobium irradiated at 72
800°C.
26 Void size distribution in niobium irradiated at 73
900 0C.
I
27 Void size distribution in niobium irradiated at 74
10 00C.
28 Void size distribution in niobium irradiated at 75
11000C.
29 Void size distribution in niobium irradiated at 76
1200 0C.
v i!

LIST OF FIGURES (Continued)AJ
f. No. Page
30 Loops in weak beam dark field g/3g. Condition in niobium 78
irradiated to 10 +2 dpa at 700*C, 9 = [220].
31 Voids in niobium irradiated to 10 +2 dpa at 700 0C, 79
1 [oo].
32 A comparison of swelling data obtained it, this work 8o
with those of Loomis and Gerber (23 )
33 A comparison of void number density in this work with 82
those of Loomis and Gerber (23 ) Solid line represents
data obtained in this work and dotted line shows data of
Loomis and Gerber(23)I34 A comparison of average void sizes in irradiated niobium 83
between this study and that of Loomis and Gerber (2 3 ).
35 Critical radius as a function of temperature for three 87
values of the interstitial-oxygen binding energy, EB.
Curves are labelled by EB in eV.
36 Calculated swelling as a function of temperature. Curves 90
are labelled by the assumed value of the incubation dose
in dpa. Experimental data are given by the dashed curve.
vii
L

LIST OF FIGURES (Continued)
Fig. No. Page
37 Calculated swelling as a function of interstitial-oxygen 92
binding energy for an incubation dose of 0 dpa. Curves
are labelled by temperature in *C. Experimental points
are shown near the right margin, for 7000, 8000, and 900*C
in ascending order.
38 Calculated swelling as a function of interstitial-oxygen 93
binding energy for an incubation dose of 0 dpa. Curves
are labelled by temperature in °C. Experimental points
are shown near the right margin, for 10000, 11000 and
12000C in descending order.
39 Calculated swelling as a function of interstitial-oxygen 94
binding energy for an incubation dose of 10 dpa. Curves
are labelled as in Fig. 37.
40 Calculated swelling as a function of interstitial-oxygen 95
binding energy for an incubation dose of 10 dpa. Curves
are labelled as in Fig. 38.
41 Calculated swelling as a function of temperature for two 97
combinations of incubation dose and interstitial-oxygen
binding energy: A (0 dpa, 1.995 eV); 0 (10 dpa, 1.943 eV).
Experimental points are shown with error bars.
viii
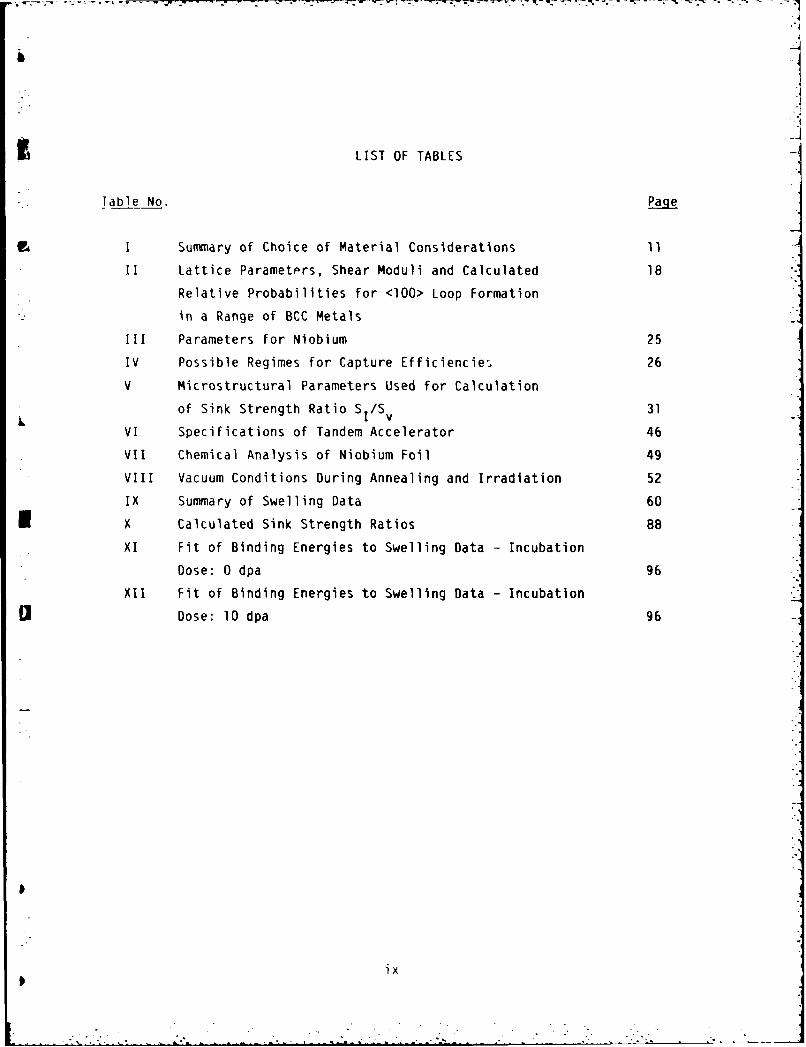
ILIST OF TABLES
Table No. Page
I Summary of Choice of Material Considerations 11
II Lattice Parametprs, Shear Moduli and Calculated 18
Relative Probabilities for <100> Loop Formation
in a Range of BCC Metals
III Parameters for Niobium 25
IV Possible Regimes for Capture Efficiencies 26
V Microstructural Parameters Used for Calculation
of Sink Strength Ratio SI/S v 31
VI Specifications of Tandem Accelerator 46
VII Chemical Analysis of Niobium Foil 49
VIII Vacuum Conditions During Annealing and Irradiation 52
IX Summary of Swelling Data 60
X Calculated Sink Strength Ratios 88
XI Fit of Binding Energies to Swelling Data - Incubation
Dose: 0 dpa 96
XII Fit of Binding Energies to Swelling Data - Incubation
U Dose: 10 dpa 96
ix

ABSTRACT
This report presents the results of progress made during the first year of a
three year program on the investigation of swelling mechanisms in refractory
metals irradiated at elevated temperatures, i.e. 0.3 Tm - 0.6 Tm (where
Tm = melting point in K). The objective of this work is to achieve an
understanding of the elevated temperature swelling in these body centered
cubic (bcc) metals by a close coupling of theoretical development and
experimental verification.
During this period, a theoretical model based on the chemical reaction rate
formalism was developed specifically for bcc metals. Calculations were
performed for niobium, which was subsequently chosen for the experimental work
based on theoretical, experimental and practical considerations. A special Nb
6 ion source material was developed which produced Nb ions of sufficient energy
and flux to permit, for the first time, ion bombardment of niobium with
self-ions. A series of irradiations with 5.3 MeV Nb + ions at temperatures
ranging from 7000C to 1200 0C were performed at the Argonne National Laboratory.
At a nominal dose of 50 dpa and a dose rate of approximately 6 x 10⁻³ dpa/s
swelling was observed over a temperature range of 7000 to 12000C with peak
swelling of 7% at 9000C. Comparison of these experimental results with
previous investigations suggested that the use of Ni ions in earlier
irradiations may account for the observed difference in the data.
The microstructural data, obtained from transmission electron microscopy (TEM)
* were compared to the predictions of the theoretical model. A reasonable
agreement was obtained between experimental measurements of swelling and
theoretical predictions by adjusting both the niobium-oxygen binding energy
and the incubation dose for swelling to realistic values. Sink-strength
d ratios were also calculated from the data. The theory-experiment comparison
indicated a need for further investigation in the areas of microstructural
evolution at low dose, kinetics of cavity growth, and trapping effects due to
oxygen.
IX
IL

1.0 INTRODUCTION AND BACKGROUND
3 Refractory metals and their alloys offer distinct advantages for applications
in nuclear systems where high temperatures are required because they exhibit
high elevated temperature strength, better corrosion resistance in liquid
metal coolants and better thermophysical properties than other structural
P1 materials. In applications where high temperatures are accompanied by high
neutron fluxes, these materials are expected to experience swelling which is
caused by the agglomeration of irradiation induced vacancies into cavities and
by the production of gaseous transmutation products such as helium. Unfor-
tunately swelling data for these materials are limited, also current theoreti-
cal treatments of swelling are not directly applicable to refractory metals
since they were developed for face centered cubic (fcc) rather than body
centered cubic (bcc) materials.
Recognizing the need for a mechanistic swelling model applicable to refractory
metals, a three year research program was developed with the objective of
achieving an understanding of the swelling phenomenon that would apply to all
* bcc metals. This program builds upon the understanding of swelling in fcc
materials, which have been studied extensively since the first discovery of
voids in stainless steel (1), and also on the available swelling information
for refractory metals and their alloys.
UIn the experimental area, this program adopts the techniques of self-ion
irradiations developed for austenitic, iron and nickel based alloys. This
report summarizes the available literature on refractory metal swelling,
details the development of the theoretical model and the experimental tech-
niques and presents the experimental data generated in the first year of the
program. The results of incorporating the data into the theoretical model are
given and recommendations are made for work during the follow up phases of the
program.
S

.0]
2.0 PROGRAM OBJECTIVE
The primary objective of this program is to further the understanding of hightemperature (from 0.3 Tm - 0.6 T m) cavity swelling and microtructural
response of refractory metals to neutron irradiation. The ultimate goal is to
acquire a theoretical understanding of swelling and through this to demonstrate
the practicality of a low swelling alloy for elevated temperature service.
This goal will be achieved by a close coupling of theory development and
controlled experimental studies. The neutron-induced swelling will be
simulated by single and dual ion irradiations with self-ions, and self-ions
plus helium, respectively.
3.0 SIMULATION TECHNIQUES
Over the last ten years, techniques have been developed for simulating neutron
irradiation damage in small, transmission electron microscopy (TEM) size
specimens. These techniques have been developed to a high degree of sophisti-
cation (5-9) and have been proven to be very useful in alloy design and
modeling of microstructural evolution and swelling. Simulation techniques
I offer several advantages over in-reactor irradiations:
(a) They can be performed ex-reactor. Heavy ion bombardment is used to
produce the simulated neutron damage. Ion bombardment can be performed at
a number of accelerator facilities around the country.
(b) Irradiation times for a specific dose are three to four orders of
magnitude shorter.
(c) Irradiation variables such as dose rate, temperature, helium to
displacement-per atom ratio (He/dpa) can be varied in a controlled manner.
(d) The technique is significantly less expensive than in-reactor irradiations.
(e) The irradiated specimens are not radioactive.
0
2

The versatility of the simulation method is of major importance in the type of
work proposed here since a wide variation in irradiation conditions can be
r achieved and can be tailored to investigate specific aspects of theoretical
models.
An important modification to the heavy ion bombardment technique is the use of
* self-ions. Although difficult to accomplish for refractory metals, the use of
self-ions prevents the possibility of chemical interactions which might
influence swelling behavior.
A second modification proposed in this work is the simultaneous bombardment of
the specimens with self-ions and helium. In earlier work the specimens were
pre-injected with helium to simulate the transmutation-produced gas. More
recently it was realized that nucleation of cavities and subsequent micro-
structural evolution in pre-injected specimens differ significantly from that
-. in specimens under simultaneous bombardment.
In this work the displacement damage produced by the energetic neutrons is
3I simulated by high energy (5-6 MeV) self ions, and the transmutation produced
helium is simulated by irradiating the specimen simultaneously with a beam of
high energy self-ions and a beam of helium ions. The energy of the latter is
adjusted so that the displacement damage and the deposition of helium occur in
the same location in the specimen.
4.0 REVIEW OF IRRADIATION TESTS ON REFRACTORY METALS
The refractory alloy systems are based on vanadium, niobium, molybdenum,
tantalum and tungsten. Swelling in these metals has received much less
attention than in the austenitic materials, although some attention has been
given to these metals because of their potential use in fusion reactors. Most
of the studies have been limited to relatively low temperatures and the infor-
mation in the range of 0.4-0.6 Tm is scant. The other drawbacks of these
studies are that they deal with existing alloys or metals of uncontrolled
purity and the ion irradiation studies utilized heavy ions of foreign metal
* (e.g., Ni in V, Ta in Mo) rather than self-ions. This latter factor clouds the
* 3
-O
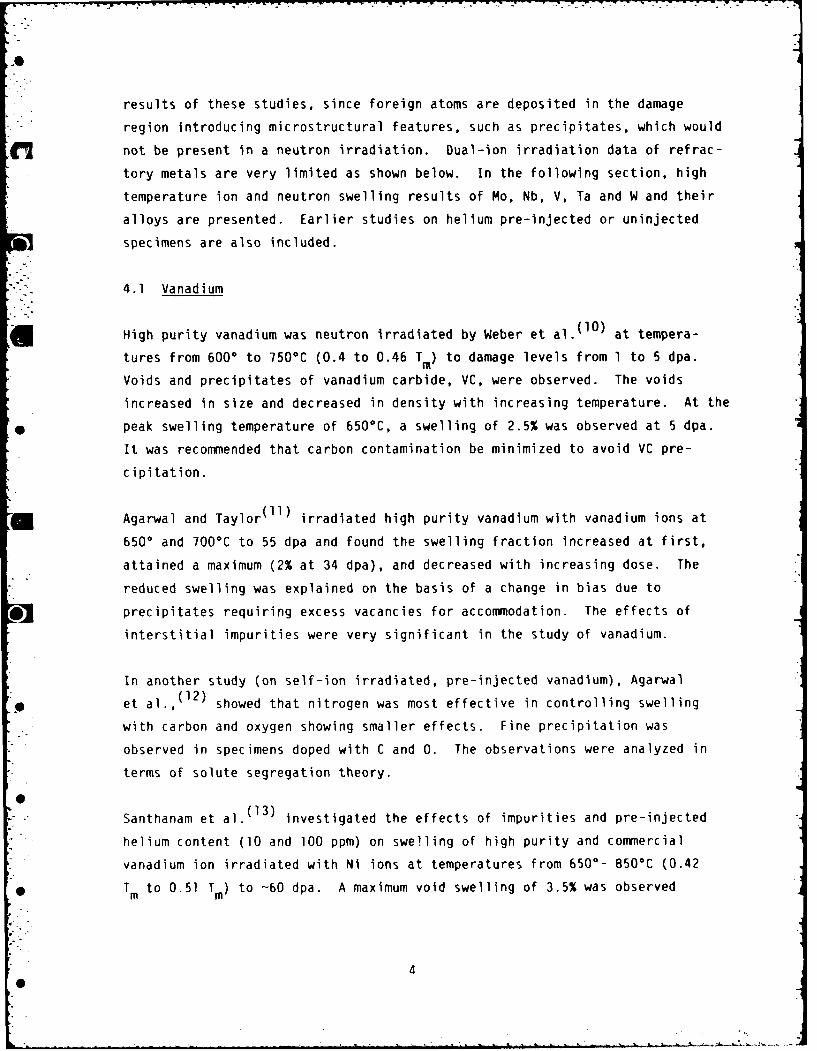
results of these studies, since foreign atoms are deposited in the damage
region introducing microstructural features, such as precipitates, which would
not be present in a neutron irradiation. Dual-ion irradiation data of refrac-
tory metals are very limited as shown below. In the following section, high
temperature ion and neutron swelling results of Mo, Nb, V, Ta and W and their
alloys are presented. Earlier studies on helium pre-injected or uninjected
specimens are also included.
4.1 Vanadium
High purity vanadium was neutron irradiated by Weber et al. (1 0 ) at tempera-
tures from 6000 to 750 0C (0.4 to 0.46 Tm) to damage levels from 1 to 5 dpa.
Voids and precipitates of vanadium carbide, VC, were observed. The voids
increased in size and decreased in density with increasing temperature. At the
* peak swelling temperature of 650°C, a swelling of 2.5% was observed at 5 dpa.
It was recommended that carbon contamination be minimized to avoid VC pre-
cipitation.
i Agarwal and Taylor ( 1) irradiated high purity vanadium with vanadium ions at
6500 and 7000 C to 55 dpa and found the swelling fraction increased at first,
attained a maximum (2% at 34 dpa), and decreased with increasing dose. The
reduced swelling was explained on the basis of a change in bias due to
*precipitates requiring excess vacancies for accommodation. The effects of
interstitial impurities were very significant in the study of vanadium.
In another study (on self-ion irradiated, pre-injected vanadium), Agarwal
et al.,( 12 ) showed that nitrogen was most effective in controlling swelling
with carbon and oxygen showing smaller effects. Fine precipitation was
observed in specimens doped with C and 0. The observations were analyzed in
terms of solute segregation theory.
0
Santhanam et al.( 1 3) investigated the effects of impurities and pre-injected
helium content (10 and 100 ppm) on swelling of high purity and commercial
vanadium ion irradiated with Ni ions at temperatures from 650o - 850°C (0.42
Tm to 0.51 T ) to -60 dpa. A maximum void swelling of 3.5% was observed
m m
• _ _ . _ _. L . - - - " • -L ,a ,' .I . .Z v . . .........

in commercial purity vanadium containing 10 appm He. The voids were cubic and
their concentration was an order of magnitude larger in commercial purity
material than high purity material at 6500 and 700 0C. The voids were smaller
in the commercial purity material, however. The peak swelling temperatures
(700°C for high purity and 750°C for commercial purity) coincided with the
temperature at which precipitates were first observed. The effect of helium
dt was significant only at 750 0C (0.46 Tm) where the swelling decreased with
increasing helium content. It was postulated that bubbles were formed by prior
annealing at 7500C for one hour and acted as predominant sinks and competed
with dislocations, thus causing low swelling. Also, it was suggested that
helium bubbles were not good void nuclei in vanadium.
Lott et al.,( 14 ) investigated the effect of substitutional nickel and
interstitial nitrogen on vanadium bombarded with Cull + ions without the
presence of helium at relati-aly low temperatures of 4500 to 650°C (0.26 to
C.34 Tm). Both of these elements reduced swelling in vanadium. It has
suggested that the reduction in swelling was caused by precipitation phenomena
observed in nickel doped specimens. The precipitation increased the density of
3unbiased sinks and enhanced recombination. In the nitrogen doped specimens, it
was speculated that the small black dot (dislocation loop) damage caused the
same effects as the precipitates.
pl In studies of neutron irradiated vanadium, Bressers and van Witzenberg( 15 )
irradiated single crystal and polycrystalline vanadium at 400 0-BO0°C (0.31 -
0.49 T m), after doping with 850 appm oxygen, to a fluence of 2.5 x 1O22
n/cm (E>l MeV). A maximum swelling of 0.14% was observed in doped poly-
crystalline material. The effect of interstitial oxygen was greatest in the
annealed single crystals and at the higher temperature range. Void lattice
formation was not observed in any of the specimens.
Tyler and oodhew ( 16 ) conducted annealing studies on helium pre-implanted
vanadium, to study the bubble growth mechanism. Isothermal anneals were
conducted for times up to 100 h at 9500 C. Bubbles produced during annealing
were faceted. It was concluded that the growth of bubbles occurred by migra-
* tion and coalescence. The rate limiting parameter was impurity sensitive
nucleation of atomic ledges on the bubble facets.
-. ° .S-a - 5-I.-
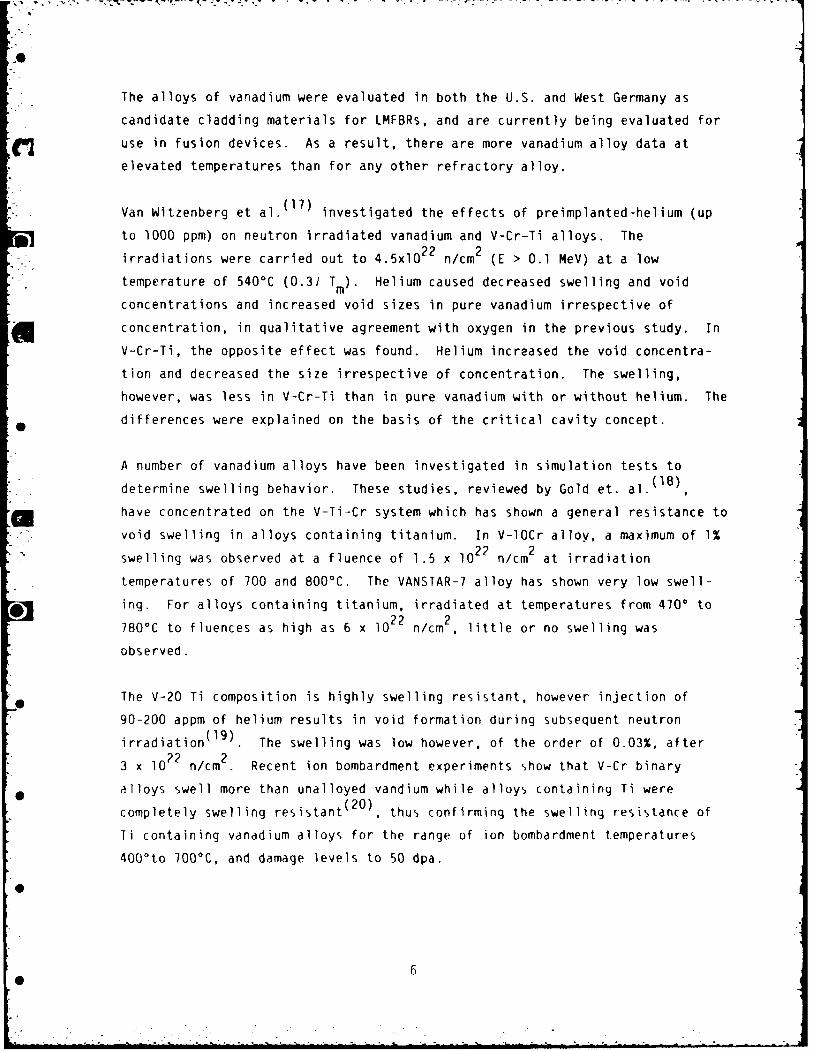
The alloys of vanadium were evaluated in both the U.S. and West Germany as
candidate cladding materials for LMFBRs, and are currently being evaluated for
(UI use in fusion devices. As a result, there are more vanadium alloy data at
elevated temperatures than for any other refractory alloy.
Van Witzenberg et al.( 1 7) investigated the effects of preimplanted-helium (up
to 1000 ppm) on neutron irradiated vanadium and V-Cr-Ti alloys. The
irradiations were carried out to 4.5xi0 2 2 n/cm 2 (E > 0.1 MeV) at a low
temperature of 540°C (0.31 Tm). Helium caused decreased swelling and void
concentrations and increased void sizes in pure vanadium irrespective of
concentration, in qualitative agreement with oxygen in the previous study. In
V-Cr-Ti, the opposite effect was found. Helium increased the void concentra-
tion and decreased the size irrespective of concentration. The swelling,
however, was less in V-Cr-Ti than in pure vanadium with or without helium. The
differences were explained on the basis of the critical cavity concept.
A number of vanadium alloys have been investigated in simulation tests to
determine swelling behavior. These studies, reviewed by Gold et. a]. (18)
have concentrated on the V-Ti-Cr system which has shown a general resistance to
void swelling in alloys containing titanium. In V-lOCr alloy, a maximum of 1%
swelling was observed at a fluence of 1.5 x lO2 2 n/cm 2 at irradiation
temperatures of 700 and 800°C. The VANSTAR-7 alloy has shown very low swell-
*ing. For alloys containing titanium, irradiated at temperatures from 4700 to
780°C to fluences as high as 6 x 10²? n/cm 2 , little or no swelling was
observed.
The V-20 Ti composition is highly swelling resistant, however injection of
90-200 appm of helium results in void formation during subsequent neutron(19)irradiation The swelling was low however, of the order of 0.03%, after
3 x 10 2 n/cm . Recent ion bombardment experiments show that V-Cr binary
alloys swell more than unalloyed vandium while alloys containing Ti were
completely swelling resistant (20), thus confirming the swelling resistance of
Ti containing vanadium alloys for the range of ion bombardment temperatures
400 0to 7000 C, and damage levels to 50 dpa.
0
6

4.2 Niobium
In uninjected niobium and its alloys irradiated with Ni ions, Loomis
et al., (21,22) found void swelling between 6000 and 1150 0C (0.31 Tm and
0.52 1m respectively) with peak swelling occurring at 0.4 Tm in Nb and
-025°C (0.47 m) in Nb-l Zr. Oxygen impurities reduced the swelling,
promoted void ordering and increased void nucleation.
Loomis and Gerber irradiated niobium and its binary and ternary alloyswith dual beams of Ni and He+ at temperatures as high as 9500 C (0.47 T
mand showed that Fe and Ni impurities that diffuse rapidly in Nb have a minor
influence on swelling whereas those (e.g., Mo) that diffuse slowly decrease the
swelling. Elements that getter oxygen (e.g., Ti) decreased the swelling,
suggesting a strong role of oxygen in swelling in niobium.
Jang and Moteff (2 4 ) neutron irradiated Nb-l Zr to IxlO 2 2 n/cm 2 at temperatures
varying from 4300 to 1050°C (0.26 Tm to 0.48 Tm) and found void swelling at
all temperatures. A maximum of 2% swelling was observed at 800 0C (a shift of
3 -200 0C from ion data) at this relatively low dose. The swelling was analyzed
in terms of reaction rate theory with a good agreement.
Bartlett et al( 25 ) reported results of swelling in Nb-5Zr and Nb-lOZr irradi-
p. ated to a fluence of 3.6 x 10² 2 n/cm 2 at 4500 to 600 0C. They found no sig-
nificant amount of swelling for any condition, although a few voids were
observed for the irradiation at 5500 and 6000 C.
4.3 Tantalum
Unalloyed tantalum showed swelling under neutron bombardment between 4000 and(2)22 2
lO00C( 6) . At a fluence of approx. 2.5 x 10 n/cm , a swelling of 2.5%
was observed. ( 2 7 ) Murgatroyd (2 8 ) found swelling in tantalum irradiated at
5000 C, however, the swelling decreased with increasing fluence. This recovery
was attributed to the shrinkage of voids due to the transmutation of Ta to W,
with a resulting reduction in lattice parameter.
S 7

.. . . . L ,- -.. r : . C . . = . .r- .---r .. " . " .. ..- -"-
00
Swelling in tantalum alloys has received little attention. No swelling was
observed in T-1ll irradiated at 4500 and 6000C. The Ta-IOW alloy showed some
(Evoids, but swelling was less than in the unalloyed metal.( 2 9 )
4.4 Molybdenum
Brimhall and Simonen ( 30 ) studied swelling in uninjected Mo single crystals at
temperatures up to 900°C (0.4 Tm) by ion bombardment with 7.5 MeV Tal + ions
to doses as high as 150 dpa. A void swelling of -2% was observed at the
highest dose. They found a maximum in void concentration occurring at rela-
tively low dose and further swelling occurred by void growth. The dose
dependence of swelling was less than linear. Void ordering was also observed.
Simonen and Brimhall ( 3 1 ) analyzed the swelling data on Mo irradiated to
1000-C (0.44 T m) and concluded that e voids act as unbiased sinks. In
another study, Bradley and Brimhall (3 2 ) found a good correlation between
swelling with Ni ions and that with neutrons when the temperature shift was
included. They also found little effect of free surfaces on the ion bombarded
specimens of Mo single crystals.
(33)
Recently, Brimhall, et al . irradiated Mo at high temperature (0.44 Tm)
in a dual beam facility and injected Ta+14 and He+ ions simultaneously to
dose of 80 dpa. Simultaneous injection of helium caused continuous nucleation
of voids. The helium had little effect on the absolute magnitude of the
swelling which was approximately 0.5%, and the dose dependence was similar to
neutron irradiations at low dose levels.
0
The effect of an oversized atom (Zr) on void swelling at 700'-900'C in Mo was
investigated by Liou, et al.( 3 4 ) Zr appeared to reduce the stacking fault
energy and ease loop nucleation. Solute-defect flux coupling caused precipita-
tion of an incoherent phase.
Stubbins and Moteff (3 5 ) studied Mo and its alloys irradiated at the highest
temperatures to 1425°C (-0.55Tm). Their study on the uninjected Mo and TiZM
(an alloy with Ti, Zr and Mo) metal showed increasing swelling with increasing

--7
temperatures. The dose dependence of swelling varied with temperature and was
different in different alloys. Over a temperature range of 850°-1000°C, TZM
showed lower swelling than Mo-O.5Ti; also swelling in TZM showed less tempera-
ture dependence than in Mo-O.5Ti alloy.
In Mo and its alloys, neutron irradiated from 3300 to 850°C to fluences ofn/c 2 Bete,(ta. 36 ,37)
1 and 3xlO 20 n/cm2 , Bentley, et a ' observed voids at all tempera-
tures, and void growth with increasing temperature. In TZM, however, void
shrinkage was observed at 7500 and 850 0C and the damage :tructure consisted of
dislocation loops and almost a complete absence of voids. A strong influence
of impurities with damage structure was envisaged, with oversize alloying
elements segregating to the dislocation core. Pard and Garr (38 ) irradiated
TLM to 8xlO 2 2 n/cm 2 (E > 0.1 MeV); however, their temperatures of irradia-
tion were low and very little void swelling was observed. Sprague et al.( 3 9 )
and Gelles et al.( 40 )also studied low temperature (650°C, 0.32 T
swelling in Mo and its alloys. A value of 3% swelling was found in Mo at a
fluence of 5.4 x 10 n/cm (E > 0.1 MeV) by Sprague et al. Gelles et al.23 2
reported a swelling of 3% in TZM alloy at a fluence of 1.47 x 10 n/cm(E > 0.1 MeV); however saturation was not predicted until 1024 n/cm 2 with
20% swelling.
4.5 Tungsten
Tungsten and its alloys have received the least amount of attention of the five
refractory alloy systems. Neutron irradiated tungsten showed swelling over the
temperature range of 4500 to 1300 0C (0.2 to 0.43 Tm). Matolich et. al. (4 1 )
observed swelling of approx. 2% at 750 0C, however increasing swelling was
suggested at temperatures > 12000C.
A tungsten-rhenium (W-25Re) alloy examined after a range of irradiation
conditions showed no swelling.( 4 2 ) No void formation was observed in W
containing 5 to 25% Re irradiated to a fluence of 4 to 5 x 1O21 n/cm 2 at
temperatures from 600°-1500°C.
A recent review paper by Wiffen (4 3 ) provides an excellent review of
irradiation effects data in refractory metals.
6, 9

.0
4.6 Conclusions on the State of the Art of Refractory Metal Irradiation Data
From the literature survey of swelling in bcc refractory metals, it is clear
thdt no controlled and systematic study is available from which to draw any
definite conclusions on the swelling mechanisms in these metals. In addition,
the data h se on high temperature swelling under controlled conditions is
meager at best. The present work is intended to fill the gap existing in the
understanding of high temperature swelling in these materials.
5.0 SELECTION OF MATERIAL FOR STUDY
The technologically important refractory metals can generally be classified
into two groups: i.e. Group V metals, vanadium, niobium and tantalum, and Group
VI metals, molybdenum and tungsten. All were considered in the selection of a
model material. The choice was based on three major considerations; (1)
theoretical, (2) experimental, and (3) practical i.e., those related to the
engineering application of these materials. In making the choice of material,
the third consideration was weighted less than the first two.
lhe theoretical considerations involved the availability of the parameters
needed for theoretical modelling of the swelling phenomenon. These parameters
are related to dislocation bias, point defect diffusivities, sink strengths,
i*I binding energies, vacancy and interstitial migration and formation energies.
In addition, an important consideration was the probability of formation of
<100> loops. Based on these latter considerations V, Nb and Mo were more
desirable than Ta and W.
Among the experimFntal factors considered were the availability of a self-ion
beam with sufficient ion current in an energy range of 4 8 MeV, the depth of
ppnetration of the incoming self-ion, and susceptibility to contamination
riuring the irradiation. These considerations favored niobium over all of the
other candidates, since ion beams of sufficient current can be ob,.iined using a
rnfvPl ,approach which i- de,,( r i htd in Sect ion 6. Peak damage due to self -ions
in Nb orcurs at a depth of approximately 1 lim, which is onsidered suffi-
ritntly removed from thef surface to avoid surface sensitive effects. Also, the

only other candidate material, V is very susceptible to contamination during
ion irradiation. Ta, Mo and W were rejected because ion currents of sufficient
K intensity could not be obtained and because the penetration depth is limited
due to their high atomic weights.
Practical or applications oriented considerations favored Nb and Ta because
alloys of these materials can be utilized up to high temperatures, 12008 and
1350°C, respectively, whereas V alloys are only usable to < 8000 C. W and Mo
can be used at high temperatures, however fabrication of their alloys is
difficult and they undergo a transition from ductile to brittle behavior at
relatively high temperatures, especially in the irradiated condition.
Based on these considerations niobium was chosen as the material for study.
Table I summarizes the matrix used to make the selection of material for study.
Model calculations, which predict the swelling in niobium are provided in the
next section.
iTABLE I
Summary of Choice of Material Considerations
Metal Theoretical Experimental Practical
2 V 0 X X
Nb 0 0 0
Ta X X 0
Mo 0 X X
WX X X
O-Favorable
X-Less Favorable
11

6.0 DEVELOPMENT OF A THEORETICAL MODEL FOR REFRACTORY METALS
Since the discovery of voids in irradiated stainless steel by Cawthorne and
Fulton (1 ) in 1967, there has been considerable study of void and cavity
nucleation and growth in metals. Classical steady-state nucleation theory has
been extended to treat nucleation when supersaturations of both vacancies and
interstitials are present, and has been used to calculate nucleation rates for
various irradiation conditions. (44-46) Time dependent nucleation models,
based on the chemical reaction rate formalism, have also been developed to
predict nucleation rate as a function of time. (4 7'48 ) Experimental data
suggest that the classical separation of cavity evolution into nucleation and
growth regimes is not a bad approximation, and theoretical models have been
developed to predict growth of an average void or cavity after nucleation is
complete.(4 9'50 ) These growth models have recently been expanded to include
* equations that describe higher moments of the cavity size distribution
function.( 5 1 )
Although the details of crystal structure are not emphasized in rate-theory
model development, calculations are generally performed for face centered cubic
metals and have been quite successful in reproducing qualitative trends in the
experimental data, including the temperature dependence of the nucleation and
growth behavior, the general form of the size distribution function, nucleation
times, and gross impurity effects. Little attention, on the other hand, has
been given to body centered cubic metals. In these metals, differences in the
migration and formation energies of vacancies and interstitials, in surface
energies, in development of the loop microstructure, and in impurity inter-
actions can give rise to significant differences in cavity growth and swelling
behavior. The purpose of the present work is to develop a cavity growth model
specifically for body centered cubic metals and to calculate growth rates and
swelling behavior in refractory metals. The results of this effort are pre-
* sented in this section.
6.1 Point-Defect Concentrations
The rate equations for the concentrations of point defects - vacancies and
inLerstitials -- can be written as
12
0 . • .'. -• '- " . . ..

.I
D C aC .
v(D VC + VUv) + G - RCvC I - K C - v() Jv Cv k v v V vv atK
andD I CI aC IY (D - - RCvCI- KIC - (2)
(D1 CI + kTI IU1 v I I I at[1
where the subscripts I and v denote interstitials and vacancies, D is a dif-
fusion coefficient, C is concentration of point defects per unit volume, k is
Boltzmann's constant, T is absolute temperature, U is the interaction energy of
point defects with a sink, G is a point defect production rate per unit volume,
R is the recombination coefficient, and K is a reaction rate constant. Time-
dependent solutions of Eqs. (1) and (2) can be obtained using standard numeri-
cal techniques. Treatment of void swelling, however, does not require this,
since the relaxation times for changes in the point defect concentrations are
short when compared with those required to change the microstructure. A
quasi-steady-state condition is generally assumed to hold, and the time deriva-
tives are neglected. A second approximation that is invoked to simplify the
problem is that the real material with its set or inhomogeneous sinks can be
replaced by a continuum with a uniform sink distribution whose integrated
effect on the point defect concentrations is the same as that of the discrete
set. The spatial derivatives in Eqs. (1) and (2) are then eliminated, and an
analytic solution can be obtained for the quasi-steady-state point defect
concentrations:
[KIKv + R(GI-Gv)] 4RGVKIKv 112 (Iv ({1 + vl ]21-) (3)V 2RK v IK[KIKv + R(GI- Gv )
[KIKv + R(Gv-G)] 4RGIKIK v 112_i4
CI = 2RKI ((1 K 2 )(LKIK + R(GI- G )
The steady-state defect concentrations obtained from Eqs. (3) and (4) are
functions of the point-defect production rates G and G and the sink
strengths, K and Kv, which are determined by the microstructure. They
I
13

enter the rate equations that describe the microstructural evolution as
parameters that are self-consistently adjusted as the microstructure changes
with time.
6.1.1 Sink Strengths
The model material is assumed to contain a variety of sinks for point defects:
network dislocations (nd), interstitial dislocation loops (1), cavities (c),
precipitates (p), and grain boundaries (gb). The strength Si of a given sink j
is that quantity that, when multiplied by the point defect diffusion coeffi-
cient and concentration, gives the loss rate of defects to the sink. Si isgenerally written as the product of three factors: a geometric parameter
describing the sink, a capture efficiency Zi, and a correction factor that
accounts for interactions between sinks. The expressions that were used for
S. in the present work are
Snd ZndS =dLZ nd(5)I,v I,v
where L is the network dislocation density;
SI,v = 4r r tNt ZI,v (6)
where N is the loop density and r is an effective capture radius,*2
defined by r2 = 6rt/2, where 6 is the dislocation core radius and
rt is loop radius;
S = 41 r N Z c (7)I,v c c I,v
where r is the cavity radius, and N is the cavity density;c c
S p 4w r N Z p (8)I,v pp I,v
where r is the precipitate radius, and N is the precipitate density; andp p
14

_gb 6S 1 / 2 (9)Iv d ' -.j
where S is the sum of the strength of all sinks within the grain, and d is the
grain diameter.
The capture efficiencies Z which occur in Eqs. (5) through (9), are given
by the ratio of the actual point-defect current to the sink to an ideal
current, which would result if the sink were a perfect absorber and had no
stress field to interact with that of the point defect. Attempts have been
mdde to theoretically evaluate the capture efficiencies for a variety of sink
types. ( 52 - 5 5 ) The problem is a difficult one, however, and these calcula-
tions can be criticized because of oversimplifications, invalid approximations,
and inconsistencies. (56,57) For numerical calculations, the capture effi-
ciencies are therefore treated as parameters: Z for a sink type is gen-V
erally assumed to be 1, and ZI for dislocations ranges between roughly 1.02
and 1.5, with ZI for other sinks assumed to be 1.
The reaction-rate constants K, for each sink are obtained by multiplying the
sink strengths by the appropriate point-defect diffusion coefficient:
Ki -Si B ,(10)I ,v I,v I,v
and the rate constants K which appear in the equations for the pointdefect concentrations, are
K _JI'v . I'v
The point-defect diffusion coefficients D and Dv are given by
D 0 exp [-Q /kT] (12)I,v I,v I'v
where D°0 is the pre-exponential factor, and Q is the activation energy.I v I'V
15

* -.6.1.2 Defect Production Rates
In many swelling models, the production rates for interstitials and vacancies
are assumed to be equal. The steady-state defect concentrations can then be
written as
" K 4RG 1/2_1
Cv 2R (1 + K K v -1) (13)
Kv 1 4RG 1/2I- 2R ((I + KKv -1) , (14)
where G = Gv G is the production rate, and the ratio of concentrations,
CI/C is equal to K v/KI This assumption is valid in certain physical
situations, specifically when vacancy loop formation in cascades is negligible
0 and when interstitial injection does not occur. Most generally, the production
rates can be written as
G = (I - v) G (15)
and
G (I I G, (16)
where c v is the fraction of vacancies that form vacancy loops and cI is the
fraction of additional interstitials due to self-ion injection. The latter
parameter EI is non-zero only near the end of range, where the implanted
ions come to rest.
6.2 Interstitial Dislocation Loops
Interstitial loops observed in body centered cubic metals after irradiation are
of two types. The type most frequently found is a perfect loop with 2 <111>
0 Burgers vector and a (111) habit plane. (58-6 l) After ion or electron irradia--
tion at high temperatures, however, perfect loops with a <100> Burgers vectors
and {I00) habit planes are seen in a iron (62) and ferritic alloys. (63)
*
16

Eyre and Bullough 16 4 ) proposed a mechanism for formation of interstitial
loops in the body centered cubic lattice. They suggested that <110> split
dumbbsll interstitials aggregate on {I101 planes to form faulted loop nuclei
with 2 <110> Burgers vector. Due to a high stacking fault energy, the loops
unfault by either of two reactions:
a [110] + a [110] a [1001 (17)2 2
ora [110] [001] ! (18)2 2 2
The elastic energy of either product loop is further reduced by a rotation of
the habit plane from (100) and (111 respectively. Bullough and Perrin (6 5 )
verified thAs model using a computer simulation of the a-iron lattice and
found that 2 <111> loop formation was energetically favored at all irradiation
temperatures. In addition, their results showed that unfaulting occurred at
very small loop sizes, below the resolution limit for conventional trans-
mission-electron microscopy.
Little, Bullough, and Wood (6 3 ) have recently used these ideas to explain the
evolution of the damage structure and the observed swelling resistance in FV
448 martensitic stainless steel. After neutron irradiation to damage levels of
30 displacements per atom (dpa) at temperatures in the range 3800 to 4800 C, a
homogeneous population of loops with a <100> Burgers vector was observed to
exist in domains, which lay within the martensite matrix that retained a high
(preirradiation) network dislocation density. The overall swelling of the
alloy, estimated from measurements of void statistics, was <<0.1%, a value in
agreement with bulk density determinations. (2 ) The mechanism that Little,
Bullough, and Wood proposed for the observed swelling suppression is based on
theoretical calculations of bias factors for interstitial dislocation
loops. (5 2 - 5 5 ) According to these calculations, the bias of a dislocation
depends on the magnitude of its Burgers vector. Hence, 1he bias of an a <100>
type dislocation with II = a is larger than that of an 2 <111> type
dislocation with IbI = 3 a/2.
17
L

The <111> dislocations are relatively neutral sinks when compared with
the a <100> dislocations and act to absorb the excess vacancies that would be
available for void formation in their absence.
The mechanism of swelling suppression that occurs in the ferritic steels is
applicable to the general class of body centered cubic materials, including
the technologically important refractory metals such as Nb, Mo, W, V, Ta, and
their alloys. The requirements for the mechanism to be effective are (1) the
presence of a high initial dislocation density, and (2) a sufficiently high
probability for a <100> loop formation. Table II, which was taken from
* reference (63), contains a list of body centered cubic metals with their
lattice parameters, shear moduli, and the relative probability P for <100>
loop formation, calculated from
P = exp [(E< 1 00 > E <lll>)/kT] (19)
where the loop energies E< 1 0 0> and E< 1II > are given by
E <100> (a + sin a) + a Y (sin a cos a - a) (20)
Table II
*Lattice Parameters, Shear Moduli and Calculated RelativeProbabilities for <100> Loop Formation in a Range of BCC Metals
LatticeMetal Parameter, Shear Modulus Relative
a I Probability,(nm) (x 10GPa) P
Nb 0.330 3.96 4.3 x 10- 5
V 0.304 4.73 5.5 x 10⁵
Fe 0.287 8.60 5.7 x 10⁻⁹
Ta 0.330 7.07 7.9 x 10
Mo 0.315 ° 12.3 1.9 x 10¹⁹
W 0.317 16.0 1.4 x 10⁻²⁷
18
0

E > (3 + sin 3) + a2Y (sin 1 cos B - B), (21)8ir
with
= 2 sin- (a
161ry
= 2 sin - (ya321ry
where a is the lattice parameter, Y is the stacking fault energy, and u is
the shear modulus.
V and Nb are clearly good candidates for swelling suppression via the loop
mechanism, since the probability of <lO0> loop formation in these metals is
roughly four orders of magnitude larger than that for a-iron. In Ta, Mo, and
W, the mechanism should be relatively unimportant.
I-
6.2.1 Rate Equations
The differential equations that describe the time evolution of the two types of
interstitial loop are
dr ii 2 ii IV thdt = {aI I v (C vii) ,(22)
where r U is the mean radius of the loops of type i.
C t h is the thermal vacancy concentration at the loop, which is given byvi
Ct h = Cth exp [- (Y + Eti- aa) a2/kT], (23)
where Ct h is the bulk thermal vacancy concentration, and a is the hydro-v fa iulrloisgvnb (66 )'
static stress. The elastic energy EU of a circular loop is given by 6
E ti = A1 A2 [in (p/6) - In (w/4) -2] + A3) , (24)
* where p is the loop perimeter, and
*O 19

A1 [pp/4r (I-v)]
2_2 2A2 =[(l-v/2) (b b b]) + b l-
A3 [-(1-2v) (b 2-b) + 2(3-2v)b2]/8 (1-u)
where v is Poisson's ratio, b is the Burgers vector, bz is the z-component
of the Burgers vector, with the z-axis perpendicular to the loop plane, and
6 is the dislocation core radius.
6.3 Helium
The presence of helium in a metal during irradiation can have a substantial
effect on cavity nucleation. 6 7'6 8 " It is relatively insoluble, and the
L binding energy between vacancies and helium atoms is high, of the order of
3 eV. Helium is consequently trapped by small vacancy clusters. The gas then
stabilizes the clusters by reducing the vacancy emission rate, and the clusters
can grow until they reach the critical size. At this size, the excess flux of
vacancies over interstitials is sufficient for continued growth.
The critical cavity size depends on temperature. At low temperatures, clusters
with two or three vacancies are stable and the effect of helium is small. At
@1 higher temperatures, however, when clusters require ten or more vacancies to be
stable, the presence of helium can determine whether cavity formation is
possible.
0 As currently included in the theory of cavity growth the effect of helium is
simply to decrease the thermal emission rate of vacancies from the cavity. The
gas exerts a pressure opposing the surface tension, and the thermal equilibriumthvacancy concentration C at the cavity surface becomesvc
0
Cvc = thv exp [-(P g-2Y/r c) Q/kT] , (25)
20
0 ,

where P is the gas pressure, and Q is the atomic volume. The decrease ing
the thermal concentration, as given by Eq. (25), leads to cavity growth at
higher temperatures.
Helium can also interact with other components of the microstructure, for
example, dislocations and precipitates. Both experimental evidence 6 9 ) and
m theoretical calculations, (51,0) however, indicate that vacancies or cavities
are the dominant sink for the gas. In the present work, therefore, helium is
assumed to be either mobile and occupying an interstitial site or trapped in a
cavity, with the possibility of emission either by thermal detrapping or by
knockout. The sink strength S of a cavity for helium is taken by
SC = 4n r N (26)He c c
The rate equation that governs the concentration of mobile helium is
dCHe .; v C 4X (27)
dt He He He +
for the concentration of free helium, where n is the helium injection rate,He
K ve is the reaction rate constant for loss of helium to cavities, and X is the
rate at which helium is emitted from cavities. The equation for the concentra-
tion of helium trapped in cavities is
dC THe _ v
dt He CHe (28)
The detrapping rate X is given by
T
X=nd + dCHe ' (29)
where nd is the radiation displacement rate for helium from cavities, and
Vd is the thermal detrapping rate for a single helium atom.
21
' - . - ,, ... . . . . .. . - . - . - - -- -,, -- ,, .- - .-.---..-.-----. . ,t... . .. . -. . ..... .... .

6.4 Solutes
Solutes that interact with point defects can affect cavity growth in a metal in
several ways. The most widely studied phenomenon is that of solute segregation
to cavities,(71,72) which occurs because of the coupled diffusion of point
defects and solutes to sinks during irradiation. Theoretical calculations have
shown that the presence of a solute at the cavity surface can decrease the
vacancy capture efficiency of the cavity, leading to a reduction in the growth
rate. This effect is difficult to model, however, and has not been substan-
tiated by experimental evidence. It is therefore not included in the present
work.
Solutes can also act as traps for either interstitials or vacancies or both
types of point defect. As traps, solutes hinder diffusion and change the time
scales of the basic nucleation and growth processes. Modification of the basic
swelling model to include defect trapping is accomplished by means of an
effective diffusion coefficient, D , which is given by(73 )
ci 0 [1U + 41( C R 0 *DIv I /v T T I,v T - H)1 (30
where CT is trap concentration, rH is the time spent at a host atom site
during the diffusion process, TT is the time spent at a trap site, and Rl
0] is the capture radius of the trap. A square-well interaction potential is
assumed, with a capture radius equal to a single jump distance. The time
T and TH are given by
and = 'T V exp [-(EmE /kE)(k1)Tl = 0 1, v B)/ l 3
and
VH V exp (-(E /kl) (3?)XH H 0 1 Ik )
0where T and vH are jump frequencies, v is the attempt frequen(y, E. v
are motion energies, and EB is the solute-point defect binding energy.
2?
0 i i'lil ll l

Vacancy trapping by solute atoms generally leads to longer incubation times for
cavity nucleation and higher cavity number densities. (73) The cavity growth
rdte is reduced, and tOtdl swelling at a fixed fluence is lowered.
6.5 Cavities
Ihe ,we1liny rate S is given by
2 dr4% Nc rc dt (33)
drwhere the time rate of change dc of the mean cavity radius rc is
drcQ - 1 = [ (C -cth 1c C(4
dt _ r v v v vc I D (34)
where the thermal vacancy concentration Cth at the cavity surface is given byvc
Eq. (25).
Eqs. (22), (27), (28), and (34) are the basic set of differential equations for
modelling swelling in body centered cubic metals. They can be solved numeric-
a11y using standard techniques such as those in the GEAR package. (74)
6.6 Calculations for Niobium
As mentioned previously, one of the features that distinguishes the irradia-
tion-induced microstructure in body centered cubic metals from that found in
face centered cubic metals is the existence of two types of dislocation loops.
The dominant type is of <111> orientation, but <100> loops can also form. The
presence of several sinks in the system with positive but differing biases for
interstitials complicates the microstructural evolution during irradiation.
The relative values of the bias factors for the network dislocations, the <111>
loops, and the <100> loops, for example, determine whether <100> loops grow or
shrink in a given microstructural environment and affect the cavity growth
23

0I
rate. One purpose ot the model was to quantitatively evaluate the effects of
the loop bias or preference factors on the loop and cavity growth rates.
A second goal was to numerically assess the effect of helium on cavity growth.
As in face centered cubic metals, the presence of helium in sufficient quantity
in body centered cubic metals enhances the cavity growth rate and leads to
increased swelling. The chemical reaction rate model was used to calculate
cavity growth rates for cavities with different gas contents. The growth rates
show a clear dependence on the gas content, and the impact of the results on
the temperature dependence of cavity swelling in the presence of helium is
outlined.
In the following section, numerical results of calculations performed with
parameters appropriate for niobium are presented. Values that are used are
* presented in Table III
6.7 Results of Calculations
6.1.1 Loop Capture Efficiencies
Calculations were performed to determine the sensitivity of the growth rates of
voids and loops to the values assumed for the interstitial capture efficiencies
* Z and Z of the <l00> and <111> interstitial dislocation loops. Values of
Z and Z between 1.0 and 1.3 were considered; the capture efficiency Z1
of the network dislocations was held fixed at 1.05, a value that is typically
used for modeling work and is supported by experimental data in face centered
cubic metals. ( 18) A listing of the possible cases for values I and
with respect to each other and to the value of the network capture effi
C ency is given in Table IV and a schematic representation of these
lhfsF, cases is shown in Fig. 1. Theoretical considerations may be used to
* limit the possibilities. Calculations of bias factors in sevPral approxi-
maition5 ' ' 8 3 suqqet that the capture efficien(y of small dislocation
S
* 7 ,

.4
lable Ill. Parameters for Niobium
Quantity Value
Lattice parameter, a 3.29 x 10⁻⁸ cm (75)
Atomic volume, Q 1.78 x 1O-23 cm3 (75)
Nearest neighbor distance, d 2.85 x 10⁻⁸ cm( 7 5)
Dislocation core radius, 6 2.85 x 10⁻⁸ cm
Shear modulus, v 3.9f, x 1011 dynes/cm 2 (76)
Poisson's ratio, v 0.392 (76)
Surface energy, Y 2.7 x 10³ ergs/cm 2 (6 3)
Vacancy formation energy, Ef 2.53 eV (77,78)V
Vacancy migration energy, Em 1.09 eV (77,78)V
Vacancy formation prefactor, Cth 4/9vo
Vacancy diffusion prefactor, D O.OOB cm2/s (78)vo
Interstitial migration energy, E I 0.115 eV (79)
Interstitial diffusion prefactor, Dio 101 3 d2/A cm2/s (77)
Helium migration energy, E m 0.2 eV (80)
'He
Helium diffusion prefactor, DHeo 1013 d2/6 cm2/s
13 -L3 8 (79)Helium detrapping frequency, vo 10 eT/
14 25

Table IV. Possible Regimes for Capture Efficiencies (see Fig. 1)
(1(Condensed notation: Z U > Z Zt z )d=
Regime Definition Dimensionality
I Z 1 ;Z2 1 pointIaz 1; 1 <7Z < Z nline
Ilb z 1 = 1; Z 2 Z n point
IIC z I = 1; Z 2 > Z n line
S lila z= 1; 1 < Z. < Zn line
IlIb z2 = 1; Z =Zn point
IlIc 7 = 1; 7 line
Iva I > Z1 Zrn; 2 < 1 area
*IVb 7 = Z <7Z line1 2 nIVc 7 =7z =7 point1 2 n
*IVd 1 < <Z; Z > Z~ area
IVe 1 < Z 1 < Z n 7 = Zn line
I Vf l<Z z< 7 line
Va Il<Zl< Zn; Z > Zn area
Vb l =Z ; Z2 >7Z line
VIa Z n < Z1< Z2 < Z nareaV ~ b Z n < Z1'; 2 = z n l n
Vlla 7 < 7 7;' < 72 < ZIarea
VIIb Z < Z 7 = 7 linen 1' 2 1
VIIc Z n < Z7;Z > Ia rea
0
26

Curve 746907-A
- ~~~1.3 ~ z~ z
.2
V IVII /
0~ b
2Z d I b I
IV / VI
1.0 1.1 1.2 1.3K 100> Loop Capture Efficiency, L
Pig. 1. Schematic of regimes for loop capture efficiencies
Z and Z Solid line indicates values consistent with
* current theories.
270

loops is larger than that for network dislocations. In addition, the capture
efficiency for a loop is proportional to the magnitude of its Burgers vector b;
-II lone may assume, therefore, that > 2 and, other factors being equal,one tay sue hrfrta I Z
ZII /Z I b1/b2. These two considerations yield potential (ZI , ZI ) values
along the solid line in Fig. 1.
It should be noted that calculations of capture efficiencies for loops have
been done using approaches and approximations that are subject to criticism.(57)Nichols in a recent review of bias factor calculations, concluded that
"bias factor estimates are quantitatively unreliable" and that "bias factors
used in swelling analyses must be considered empirical". In light of this
conclusion, it is useful to view the bias factor as a model parameter and to
determine the range of values that is required to reproduce experimental
results -- specifically, the necessary conditions for obtaining growth of <100>
loops and shrinkage of <111> loops, as seen in FV 448 steel with a high network.(84)
dislocation density
According to Eq. (22), the growth rate of an interstitial loop when bias
effects dominate depends on the difference between two terms, which represent
the two defect fluxes:
dri 9i
dt -a (ZI DIC I - DvC v) (35)
where r9 i is the loop radius, t is the capture efficiency, D is ati I
defect diffusion coefficient, and C is a defect concentration. In a system
with four types of sink -- network dislocations, <100> loops, <111> loops, and
cavities -- a positive growth rate for a loop requires
Ii SIz > (36)
where S is a defect sink strength. Equation (36) is obtained from Eq. (35)
above and Eqs. (10), (11), (13) and (14).
28
S.

As defined in Section 5.1.1
nd * U * 12S= LZ + 4wr N Z + 41rr N Z + 41r N
9.1I t92 c c ()
and
Sv = L + 4wr 1N1 + 4rr 2N V + 4rrcNc (38)
where capture efficiencies for vacancies have been taken as I for all sink
types, as has the capture efficiency for interstitials at cavities. The
notation in Eqs. (37) and (38) is that used before, L is the network density, N
is a microstructural defect density, r9 l is an effective capture radius
for loops, and rc is the cavity radius.
When bias effects dominate, the change in cavity radius rc with time is given
by
drc Q
dt - r''DCv-DICI (39)
and a positive growth rate requires that
S1 < (40)
V
This condition is obtained in a straightforward manner from Eq. (39) above and
Eqs. (10), (11), (13) and (14).
Bias effects determine the cavity growth rate when the thermal vacancy term in
Eq. (34) is small and can be neglected. A comparison of the total vacancy
concentration with the thermal vacancy concentration is shown as a function of
temperature in Fig. 2 for three values of the defect production rate and two
values of the network dislocation density. Other parameters that were used:
H = 0' .N = 1014 /cm3 , N 1 0= 10O/cm 3 , = 1015 /cm3, znd = 1.05, ZI
1.176, 1 1.05, rc = 10 cm, r ti = 10 cm, and r9t2 = 10 cm. From the
the figure, it is apparent that the bias-dominated growth regime occurs at low
temperatures, and extends toward higher temperatures as either network density
* decreases or defect production rate increases.
29
I - : : . .: . . . . . .: - . . . . . . ' -

Curve 746905-A
*Temperature (0 K)18 1700 1500 1300 110090
10
NN14
~12
S101 NNN
IN
8
*10.5 0.7 0.9 1.1
1/Tx 10 *K'1)
0Fig. 2. Vacancy concentration as a function of temperature forproduction rates G of 1020, 1018, and 10)16/cm3-s. indescending order. Solid curves are for network density L106/CM2, dashed curves for L = 101 /cm2 .
r 3nl
0

j. |
The growth and shrinkage regimes defined by Eqs. (36) and (40) are illustrated
schematically in Fig. 3. It is apparent that the sink strength ratio SI/S v
must lie between Z and Zt for <111> loops to shrink and <100> loops to grow.I n I
In this region, voids grow.
Equations (36), (37), (38), and (39) can be used to evaluate the values of
capture efficiencies necessary for growth, stability or shrinkage of thevarious microstructural components for a given microstructure. Conversely,
for fixed values of the capture efficiencies, the microstructural conditions,
parameterized by L, r*9 l, r* rc, N9l, N and N , can be varied in9.2' UP9%I .2' c
order to investigate the possible values of the sink strength ratio, SI /Sv'
The latter was done for the ranges of microstructural parameters given in9.1 92 nd t
Table V. Z was assumed equal to blZ I /b2 and ZI to
1.05.
Table V. Microstructural Parameters Used for Calculations ofSink Strength Ratio S I/Sv
Network Density, L 108-1012/cm2
13_ 18 3Cavity Density, N 10 -10 /cmc
<100> Loop Density, N t0-5N2
<111> Loop Density, N92 l0l3-10 /cm
Capture areas, 4r lO 6 cm
The results for S /S are plotted in Figs. 4 through 6, for Z1 equal to 1.02,1 v I
1.05, and 1.1 respectively. Although much detail can be extracted from these
figures, several general features are important for this analysis. First,
since the ranges of microstructural parameters were selected so that all
physically observed microstructural densities are included, the results in
Figs. 4 through 6 establish the values of the sink strength ratio that are
obtainable in practice. These lie, in the three cases considered, between 1.0nd 9.2
and either Z or Z whichever is larger. The former is obtained when the
network dislocation density and the <111> loop density are relatively low, and
the cavity density is high. The upper limit value, if Znd when the
I occurs
31
. - . . - .. -.. . * . . . . -' *

11 Loops Grow 11 Loops Shrink
12 Loops Grow 12 Loops Shrink
VoidsShrinks Voids Grow
9,2 Zg1iU I ZI Li
Sink Strength Ratio, SI/S V
-41
Fig. 3. Schematic of growth and shrinkage regimes for loops and voidsas a function of sink strength ratio SI/S v
32
'"'-0 . -'. - . . . . " _ . - i '" . . ,

I ndz
•10 13 L= 10 8/Cm 2 _1.04 l [010 .cm
Fo141o 15 ,16 i17 ,18
1.02 -
100 10 18z
10 101 0
, 1.04 L= 1n'II"? 10 15 10
._o.10 _1 17
6, 1.02 . _Z1I2
101801
r'-I
LPn
-1.0V) nd
Z
1.04 1 01
10 121.02 12 /2
10[=10 /c2
1.0 I I113 15 I17 -
Cavity Density ( cm-3
Fig. 4. Sink strength ratio SI/S v as a function of cavity density Nc
for Z2= 1.02, Zt = b ZV /b2 and Z = 1.05. Panels arefo I 1. 2 I 1 2#=
labeled by network density L, and individual curves by the
value of N t2' N = 10- 5 N 12.
33

f 18 IZ2 nd
1.171
> 110
L= 10 /cm 2
0) 1
1.04 1 82 n
13 1710 -10
L 122Cm1[=1 1cm
*) 10 10 151013 i 1 0
3 1
for4 10 1.50~~/2 n -10. Pnl r
1 . 2 v a l u of 19 2 N/ C m 2 0
1.02
343CaiyDnst0c

4T
1.0
01
*1.06 14
N410 Znd
1.10Cavit Denit (m2
-0 5
valueof N 2. N 1 104~ 2
350/M

0
network density is high and the <111> loop and cavity densities are relativelylo. I h2cs hr > nd 2wenh
low. In the case where Z %2 > (see Fig. 6), SI/S v approaches Z when the
network and cavity densities are low, and the <111> loop density is high.
The second point to be made regarding the results in Figs. 4 through 6 is that
they establish the microstructural conditions under which <111> loops shrink,422
while <100> loops grow. As was stated previously, this requires that Z <
S v/Sv < ZI in the bias-driven growth regime. The condition is satisfied if
S< zZ and if the network dislocation density dominates the sink strengthratio. Figure 4 shows that for a network density of 108/cmL , S /S is
in the appropriate range if the cavity density is less than -l0 4/Cm3 and
the <111> loop density is -10 1/cm3 or lower. When the network density is10 2 l6 3is 10 /cm , cavity densities of -10 /cm or lower and <111> loop densities
of 101 7/cm3 or lower will satisfy the requirement. Finally, if the network
density is high, i.e. 10 /cm , SI/S > Z for all cavity and loop densitiess v I
considered. This is consistent with experimental observations in FV 448(63,84),2
but requires a value for the bias factor Z of <111> loops that is not in
accord with current theoretical arguments.
In addition to Nichols' critique of theoretical calculations of bias factors,
it should also be noted that these calculations treat a single sink that is
isolated in a medium that possesses some averaged properties, which are assumed
O to account for the multiple-sink nature of the material. This approach may not
give the appropriate bias factor for a sink whose absorption of defects is
strongly influenced by the surrounding sink structure. In the calculations of422
void and cavity growth rates, therefore, values of Z were not restricted tond
those greater than or equal to the network bias Z .SI
6.7.2 Loop and Void Growth Rates
Growth rates for loops and voids were calculated as a function of temperature
for network dislocation densities of 108 and 10 1/cm 2 and bias factors Z
of 1.0, 1.02, 1.05, and 1.1. Values assumed for the microstructurai parameters
were Nc - 1014/cm3 , Nil 1010 /cm3 , N%2 = 1015/cm3 , rc l0-7 cm, ril = 10-7
cm, and r 2 cm. Z was equal to b Z /b the network bias factor.2 ea 1 1 2'

*i
nd i
Zd equaled 1.05, and the displacement rate G was 102 0 /cm3 . The results are
given in Figs. 7 through 9.
For the low network density, the growth rate of <100> loops increases monotonic-
ally with temperature as shown in Fig. 7, and, at a given temperature, increases9.2M slightly as ZI increases from 1.0 to 1.1.
When the network density is high, the growth rate increases with temperature from
625' to -925'; at higher temperatures it maintains a constant value. The9.2 9.2
dependence of the growth rate on Z is stronger, again increasing as Zincreases from 1.0 to I.I.
As shown in Fig. 8, the temperature dependence of the <ill> loop growth rate at
low and high network dislocation densities is similar to that of the <100> loop
growth rate. The magnitude and sign, however, depend on the choice of loop bias
8m 2 2factor, as discussed in the previous section. When L = 10 /cM and I = 1.0,
the <111> loop shrinks at a rate of -2 x 10- 9 cm/s at 625°C and -6 x 10⁻⁸ cm/s
at 14250 C. For Z = 1.02, the shrinkage rate is an order of magnitude less atat145C.Fo I U
all temperatures. When = 1.05, <111> loops grow at rates which are com-
parable in magnitude to the shrinkage rates for Z I = 1.0. An increase of
the bias factor to 1.1 leads to roughly a factor of two increase in the growth92
rate over the Z 1.05 values.Il
At the high network density, the growth rate is negative for ZI 1.0 and
1.02, with a decrease in magnitude for the latter values of less than a factor
of two. The growth rate for ZI = 1.05 is positive, but small -- three orders
of magnitude lower than that for Z 1.1.
The effects of network dislocation density and loop bias factors on the growth
rate of voids are illustrated in Fig. 9. All of the curves are qualitatively
37
0-

10- 5
E
Of -7= 10
C--Q_
10i I
700 900 1100 1300Temperature ( °C)
Fig. 7. Growth rate for <100> loops as a function of temperature. Solid
curves are for a network dislocation density L of 10 /cm2;
dashed curves are fvr L = 10 1/cm 2 . Curves in each set are
for bias factors Z %2 = 1.0, 1.02, 1.05, and 1.1 in an ascending
sequence, with Z blZ V/b Irradiation and microstructural1 1 2
parameters are given in the text.
38
. .. . •,0- _. , . - . , , , ,.... .... . , . J.' ,.:. . .. . ....... .. .. ... ... ... .. . .

10
+ 105+
1.0) 1.02
10
1.05
0
700 900 1100 1300Temperature (°C)
Fig. 8. Growth tate for <111> loops as a function of temperature. Solid
curves are for a network dislocation density L of 10O/cm2;
dashed curves are for L = 1011/cm2. Curves in each set are
for bias factors ZI1 values, with the sign indicating growth()
0I
or shrinkage (-.Irradiation and microstructural parameters are
given in the text.
39 ""
" L,"-".. . . . , t J... 7 m mmh m m~m"""" "" ~,,m' - a ' ' , ,
-, , , ' , '
4'

*.......
0 -5
10
I10-7 -
~1.05
(1.0
-9*- 10
.- 11
100q
*m I
-11 _ _____
* 700 900 1100 1300Temperature ( OC)
Fig. 9. Growth rate for voids as a function of temperature. Solid
curves are for a network dislocation density L of 10/cm2 andt2
are labeled by assumed Z values. Dashed curve is for a network
11 22i adensity L = 10 /cm2 , and for all values of Z investigated.
sign indicates growth regime; (-) sign indicates shrinkage regime.
110

.4
similar: at low temperatures the growth rate is positive, increases with
increasing temperature, then peaks and decreases rapidly to zero, at a
F temperature which will be henceforth referred to as the critical temperature
T c . At temperature above Tco the growth rate is negative and the void
shrinks at an increasing rate. Above -1100 0C, the shrinkage rate is inde-
pendent of both dislocation density and the values of ZI and Z 2 since in this
regime, the thermal emission term in Eq. (34) is dominant. For a network density
of 108 /cm2, the void growth rate depends on the values of the loop bias
factors, increasing by roughly an order of magnitude at low temperatures as
Z I increases from 1.0 to 1.1. The peak temperature Tp increases as Z 2I
increases, having values of 850'C, 875°C, 910°C and 935 0C for Z values of
1.0, 1.02, 1.05, and 1.1 respectively. T also increases with increasingc
bias factor, with values of 900 ° , 950 ° , 990 ° , and 1025 0 C. For the assumed
microstructural conditions, the <111> loops are the dominant sink for inter-
stitials and increasing bias on the loops means increasing absorption of
interstitials. The vacancy supersaturation and void growth rate therefore
increase.
11 2* For a network density of 10 /cm , the void growth rate is controlled by
the absorption of interstitials at network dislocations and is independent of
the loop bias factors. The peak temperature is -8600 and Tc is -9500 C.
6.7.3 Helium
The effect of helium on the cavity growth rate is illustrated in Fig. 10. The
curves were obtained for an assumed bias factor Z of 1.02, although the
results are qualitatively similar for other values as well. The microstruc-
tural parameters and irradiation conditions used for the calculations were
identical to those for Figs. 7 through 9, with network density L = 108/cmEach of the curves in Fig. 10 is labeled by the ratio of the gas pressure Pg
in the cavity to the equilibrium pressure given by Peq = 2Y/r . The heliumg c
was treated as an ideal gas.
Three trends are immediately evident as the gas pressure in the cavity
increases: the peak temperature T increases, the maximum growth rateP
41

10 1 2 1. 02
0 0.1
E
0.5
cc
0.0.
100
700 900 1100 1300Temperature (00
0
0Fig. 10. Cavity growth rate as a function of temperature for L 10 /cm2
Z 1 1.02, and other parameters as given in text. Curves areI
labeled by ratio P /P eg*~ gg

increases, and the critical temperature Tc increases. In Fig. 11, Tc and
Tp are plotted as a function of the ratio P g/P 9.- Both increase linearly,
with Tc having a greater slope.
Swelling vs temperature or S(T) plots for various helium injection rates can
only be obtained from a full model calculation, where the size distribution
functions for cavities are calculated as a function of irradiation time at
various temperatures. Figures 10 and 11, however, can be used to predict
several qualitative features of these plots. First, for temperatures between
625°C and 825°C, Fig. 10 shows that the cavity growth rate does not depend on
gas pressure, for the range of pressures considered. In this temperature
regime, the rate of vacancy emission from cavities is small, cavity growth is
determined by the bias, and S(T) plots will be insensitive to the helium
injection rate.
Second, since the peak cavity growth rate increases in magnitude and occurs at
higher temperatures as gas pressure increases, a temperature shift will be
observed for the peak swelling temperature as helium injection rate increases.
Third, since T increases more rapidly with gas pressure than Tp, the highc
temperature end of the S(T) plot will broaden as helium injection rate increases.
6.8 Summary of Results of Calculations
When microstructural evolution in body centered cubic metals is described using
the formalism of the chemical-reaction-rate theory, the details of dislocation
loop and void or cavity growth depend strongly on the interstitial preference or
bias factors of the dislocations in the system. Whether loops of <100> type
grow or shrink, the magnitude of loop and cavity growth rates, and the tempera-
ture dependence of the cavity growth rate are determined by the (relative)
values assumed for these factors, when they are treated as size-independent
model parameters. Over the range of microstructural and irradiation conditions
investigated, however, shrinkage of cavities in the bias-driven regime (i.e. at
low and moderate temperatures) was not observed. For this to occur with the
model presented here, a low dislocation density, a high <111> loop density, and
a bias factor for <111> loops less than 1 would be required.
4V .Vi
W"3
K- " "- . , L . .- ' . - • ' I i' " - . .

1200
* 11000)
* T01000 p
90
0 0.5P /,eq
0
Fig. 11. Critical temperature T~ and peak growth temperature T as aC p
function of ratio P /P eg
0
44
0

- - "- ... - '- - - - ° " -- -"i . - . . . .. r . r - . - , . o * - . •
The sensitivity of microstructural evolution to the dislocation bias factors in
the body centered cubic metals over the midrange of temperatures suggests that
this would be a fruitful regime for experimentation. In this regime, critical
tests of theories on bias factors, which provide the fundamental basis for
current models of cavity swelling, may be possible.
#A The model calculations presented here predict that, when helium is present, the
temperature range for swelling is increased at the high temperature end and the
peak temperature shifts to a higher temperature. These effects of helium in
body centered cubic metals are qualitatively similar to those observed in face
centered cubic metals.
7.0 EXPERIMENTAL
7.1 Irradiation Facility
The investigation of high temperature swelling in refractory metals requires a
facility capable of providing high current beams of heavy ions and helium, which
If can simultaneously bombard a specimen heated to a high temperature (O.6Tm,
approx. 1375°C for Nb). Experimental facilities capable of meeting these
stringent requirements, together with high vacuum capability, high isotopic
purity of incoming ions and diagnostics ability, are limited in number. A
3 survey of existing accelerator facilities was therefore conducted to evaluate
the best facility for this work. The evaluation also included turnaround
times, schedular availability and unit costs. The following four facilities
were considered as candidates
1. Dual-ion irradiation facility at the Oak Ridge National Laboratory
2. HVEM-Tandem Facility at the Argonne National Laboratory (ANL)
3. Irradiation Facility at the Pacific Northwest Laboratory
4. High Energy Ion Bombardment Studies (HEIBS) Facility at the University
of Pittsburgh.
Of these four facilities only the HVEM-Tandem facility at ANL satisfied all of
the program requirements and therefore was contracted to perform the irradia-tions. A brief description of the facility is provided below.
45

The HVEM Tandem facility consists of a Kratos 1.2 MV high voltage transmission
electron microscope, a National Electrostatics 2-MV Tandem type universal ion
accelerator, and a Texas Nuclear 300 KV ion accelerator. The two accelerators
together provide ion beams of essentially all elements with energies from
approx. 10 KeV to 8 MeV. The facility is located in the Materials Science and
Technology Division at Argonne National Laboratory.
7.1.1 2-MV Tandem Accelerator
The National Electrostatics Type 2 UDHS 2.0-MV Tandem accelerator is equipped
with one internal and two external negative ion sources for helium and metal
ions, respectively. The specifications are given in Table VI.
Table VI. Specifications of Tandem Accelerator
Terminal Voltage 180-2000 kV
Charging System 1 pelletron chain
Energy Stability +250 eV
Internal Ion Sources Danfysik Models 910 & 911Duoplasmatron
External Ion SourcesHe- NEC Alphatrosmetal Ions Wisconsin SNICS Type
Ion Beams All stable isotopes in the
periodic table
UHV Beam Transport System
Target Room Beam LinesWest Lines 450(220)*, 300(480), 80(6560)East Lines 100(4200), 20'(1060), 300(480),
450(220)
• Numbers in parentheses indicate mass-energy products (amu.MeV).
The accelerator may be operated in conjunction with the HVEM or separately for
ion implantation/bombardment and ion-beam-analysis studies. Independently
46
Sl .•.. - . .

i
powered internal positive ion and external negative ion sources are provided
both to obtain all ion species in the periodic table and to minimize downtime
U caused by ion source malfunction. Available positive ion sources are Danfysik
models 910 and 911, a duoplasmatron, a sputter source, and an rf source.
Negative ion sources presently available are an NEC Alphatros rf source for
He ions and a Wisconsin type SNICS source for producing negative ions of
selected metals. All ion sources are controlled by fiber-optic telemetry,
which also provides direct readout of source parameters at the control
console. Access to the internal source may be gained within one hour with use
of the high-throughput gas-recovery system which serves both the HVEM and the
accelerator. Typical ion-beam currents will range from -10 vA for protonsto 0.1 i 2A for 04b. The mass-energy product of the East and West 300
beam lines provides for singly charged ions with an atomic mass of 240 at an
energy of 2 MeV.
The 300-KV ion accelerator is a modified Texas Nuclear high-current unit that
has been equipped with sources for metal and gaseous positive ions. This
accelerator will be used to provide helium ion beam for the present program.I
The NEC/University of Wisconsin SNICS (Source of Negative Ions through Cesium
Sputtering) and negative ion source, with ANL modifications to facilitate
target mounting and to provide target cooling, was used to perform the
experiments. The source yielded a ion current of ~40 nA with a metallic Nb
target. The flux of ions was too low to perform high fluence (-60 dpa)
irradiations in a reasonable amount of time. Therefore, a novel approach was
required to achieve a higher ion output. After a considerable effort, a
procedure analogous to the production of titanium ions was successful in
achieving high ion currents of niobium. This procedure requires a hydride
target material. A special hydriding method was developed at ANL to obtain
Nb-hydride. The process involves heating the Nb sample to high temperature
under vacuum, backfilling the vacuum chamber with high purity hydrogen at room
temperature to absorb the hydrogen and form a Nb-hydride compound. Use of
Nb-hydride target improved the output of the SNICS source from -40 nA of Nb-
with a metallic source to -5-10PA of Nb ions (Nb, NbH NbH, 2 NbH 3
etc.) with a hydrided target.
47

7.1.2 Material Procurement and Specimen Preparation
Niobium used in this investigation was Marz-grade foil (0.5 mm thick) obtained
from the Materials Research Corporation. The material was received in an
annealed condition, (1l50°-1200°C for 0.5 h). The chemical composition of the
material, as certified by the vendor is shown in Table VII. Overcheck analysis
was conducted for the interstitial elements C, 0 and N, with results also shown
in Table VII. A substantial disagreement is apparent between the vendors
analysis and the overcheck analysis.
The preparation of the specimen surfaces to be used for ion irradiations is a
delicate and painstaking operation consisting of a number of polishing steps
and optical examinations. This process was made more difficult in the case of
high purity niobium bcause of its low hardness, and therefore, susceptibility
to surface smearing and cold work. The cold work of the surface was manifested
by "mounds" on the specimens. These "mounds" were more numerous near the
specimen edges than towards the center, and were always found whenever diamond
abrasives were used. The polishing procedure had to be modified to avoid use
of high hardness abrasives, and the material removal from the surface to be
irradiated was minimized to 50 pm (0.002 in).
Disc specimens, 3 mm (0.12 in) in diameter, were punched from the foil,
deburred and mounted with crystal bond wax and cold mount in a stainless steel
holder with a 0.38 mm (0.015 in) recess and polished using a 600 grit paper to
a thickness of 0.23 mm (0.009 in) with a final polish with 1 pm alumina. The
specimens were then demounted and remounted with the flat 1 pm polished
surface facing down, onto a stainless steel holder with 0.18 mm (0.007 in)
recess. Two adhesives were then used to mount the specimens flat on the
holder. First, specimens were placed on the holder in molten crystal bond
wax. Each specimen was pressed to assure that the flat side was against the
holder as the wax cooled. The wax from around the specimens was then removed
and replaced with epoxy. This procedure assured a good and flat bonding of the
specimens.
The specimens were then polished on 400 grit paper until they were flat and
then gently polished with 6 Vm and 1 um alumina abrasive. During and after
48
-0 - - - --

TABLE VII Chemical Analysis of Niobium Foil*CE
Element Wt. ppm
Vendor Analysis** Overcheck Analysis
H <1C 25 33N <50 15 120+Na 0.07Mg 0.45Si 17.0p <0.1Al 3.6S 1.4
* Cl 0.7K 0.2Ca 0.1Ti <0.1Cr 1.8Fe 3.4
r Ni 1.0Cu <0.1Zn 0.5Ga <0.1Zr <0.1Mo <0.1Pd <0.1Ag 5.9In <0.1Sn <0.1Sb <0.1Ta 200W <0.1Pt <0.1Au <0.1Pb <0.1
* Marz Grade, Lot No. 41/2064, Foil 0.200 in thick x I in wide x 6 in long
** Analysis by mass spectrography, Leco method (gases and conductometric
(carbon)
Analyzed by vacuum fusion analysis
+ Average of two analyses.
0 49

each polishing step specimens were examined for flatness, scratches and cold
work. The final polishing step consisted of 12-15 h polishing with 0.05 um
alumina in a vibratory polisher. No cold work was observed on any specimens
following the above procedure. Following the polishing, the specimens were
demounted and cleaned ultrasonically in multiple baths of acetone and methanol.
The cleaned specimens were lacquered on one side ard then electropolished for
20 s in a solution containing 12% HF and 88% HNO 3 maintained at 0'-50 C. This
step removed approx. 6 pm from the polished surface and produced a clean
surface free of nearly all embedded abrasive. An additional 6-10 Pm of
material was removed from this surface by ion milling to assure scratch and
deformation free surface.
Prior to irradiation each specimen was annealed at 1200 0C for 0.5 h in the
vacuum chamber of the accelerator. This further assured that the irradiated
surface was in the fully annealed condition, devoid of any deformation due to
specimen preparation. The temperature was monitored by an infra-red tempera-
ture monitor (IRCON 300 HCS). After cleaning the specimens, they were stored
in 200 proof ethanol to avoid oxidation.
7.2 Irradiation Procedure
The specimens were loaded into a tantalum holder. The holder consists of a
tantalum strip with 5 holes approx. 2.3 mm in diameter and with a 3 mm recess
on one side. The specimens were secured by four tantalum tabs spot welded to
the specimen holder. The tabs held the specimen by friction, therefore the
specimen was free to move in all directions during annealing and irradiation.
This avoided any Jeformation due to clamping. Four specimens were loaded at
one time into the holder (the fifth hole was used to align the beams). The
specimen holder had freedom in the x and y directions to enable accurate
9 alignment, with the heams. A photograph of the specimen holder and the electron
gutn heater is shown in Fig. 12.
The specimens were irradiated with 5.3 + 0.1 MeV Nb+ ions at a nominal
maximum displacement rate of approx. 6 x 10- 3 dpa/s (displacements per atom
por sec.). The target peak dose was approx. 60 dpa. The energy deposition
f 5 ()
0

~r4
0~C
LL
C
4C0L
(-)0.)
0.)
C(U
L0.)
0
4I~a.)0~L(U
4~)
- 0.)7;,- 1
41 0
30.)
(-I
0.(UL
0
0
0.

profile for Nb was calculated using Biersack's TRIM Monte Carlo program.
Figure 13 shows the energy deposition and projected range probabilities for Nb
in Nb at an incidence angle of 1O . The maximum energy deposition for 5.3 MeV
Nb bombardment was computed to occur at depth of -900 nm. The calcu-
lated dpa values have an accuracy of + 10%. In calculation of dpa, a dis-
placement energy of 40 eV and an atomic density of 5.6 x 10² 2 atoms/cm 3
were assumed for Nb.
lhe implantations were performed at target temperatures ranging from 7000 to
1300'C. The samples were individually heated to the desired temperatures using
an electron beam heating system designed at ANL. The temperature was con-
trolled using a feedback signal from an infrared pyrometer (IRCON 300 HCS) to
the electron beam heater. The surface emissivity was assumed to be 0.19
independent of temperature and direction. The temperatures were controlled to
within + 50C.6
Prior to the irradiation and with the sample at room temperature, the all-metal
vacuum sorption pumped system was evacuated to a base pressure of -2-5 x 10⁻⁹
torr. Typical vacuum levels achieved during annealing and irradiation are
shown in Table VIII. Residual gas analysis of the chamber gases was performed
during the annealing and irradiation stages using a Micromass QX200 quadrapole
mass spectrometer. The major peaks during the irradiations were identified as
being associated with nitrogen, water, and hydrogen.
lable VIII
Vacuum Conditions During Annealing and Irradiation
Irradiation Temperature Vacuum During Annealing Vacuum During Irradiation(OC) (torr) (torr)
700 5.0 x bO 4.0 x 10 8
800 1.0 x0 4.0x 10 8
7 -8* 900 2.0 x 10⁷ 2.0 x lo
1000 4 0 x lo- 2.0 x 1O8
1100 0.0 x 10 8 b.0 x 10 8
1200 hO x 10 8 7.0 x 10 8
* 1300 4.1 x 10 5.0 x lo-
100 (10 dpa) 3.0 x 10 8 3.0 x 10 8
0-

Ilk
+
(NWy NIISV18 - - 0 010 0~
U C14 n (POCC1 I IIwC
3
ui 0I.-LC
0 c0
4D44-
0
z~ I-
Z C)>N
0 *
0 0
00 0 0 0 ea0
( /Aa) NQIIISOd3G A983N3 C'4
C.,
53

The first 7000 C specimen irradiation was performed at incidence angles of 100
and 450 to the specimen normal for equal times to spread the damage zone.
(II However, it was realized that gradient effects may introduce microstructural
changes which may be difficult to interpret; therefore, in subsequent experi-
ments the irradiations were conducted at a single incidence angle of 100.
7.3 Post-Irradiation Specimen Preparation and TEM Observations
Post irradiation specimen preparation involved removal of a controlled amount
of material from the front surface (sectioning) so that the peak or near peak
4 region of the damage could be examined in the transmission electron microscope
(TEM). This method yielded data in the region of high damage away from the
region most susceptible to surface effects. A Siemens Elmiskop 101 TEM opera-
ting at lOOkV was used in this work.
The sectioning was accomplished using an ion milling technique. Ion milling
involves removal of material by ion sputtering using inert gas ions, such as
argon or krypton, accelerated to approx. 1 KeV. In our experiments ion mill-
*ing was accomplished using argon gas accelerated to 800 eV. The specimens were
rotated and tilted continuously during milling to achieve a uniform milling of
surfaces. Prior to sectioning of irradiated specimens, the ion milling rate
was calibrated using the same surface finish as the pre-irradiated specimens.
Figure 14 shows a plot of ion milling depth as a function of milling time.
This master plot was used to determine the time required for sectioning. All
specimens except one were sectioned to remove 750 nm.
The irradiated s.rfaces of the ion milled specimens was protected by stop-off
lacquer and the specimen was back-thinned using a modified Fischione Jet
Polisher. One jet of the twin-jet polisher was removed to enable polishing
from only the back side of the specimen. Considerable effort was expended in
arriving at an appropriate thinning method for the specimens. A number of
chemical solutions and conditions were investigated before a satisfactory
polish was obtained. A solution of approximately 10% saturated NH4F in 90%
methanol at -300C was found to produce a good polish in a reasonable time. A
current of 12 mA at 100 V was required to polish a 1 mm diameter area in the
54

!"2
1400 1 I I 1 1 1 1
1200
10000
C
800
0
200
0
1"" 0 5 10 15 20 25 30 35 40
-" MILLING TIME (minutes) -.
SFig. 14. Ion milling calibration curve for niobium
-JL
00
55
0 i" . -. ,2 . - . - . . ". l
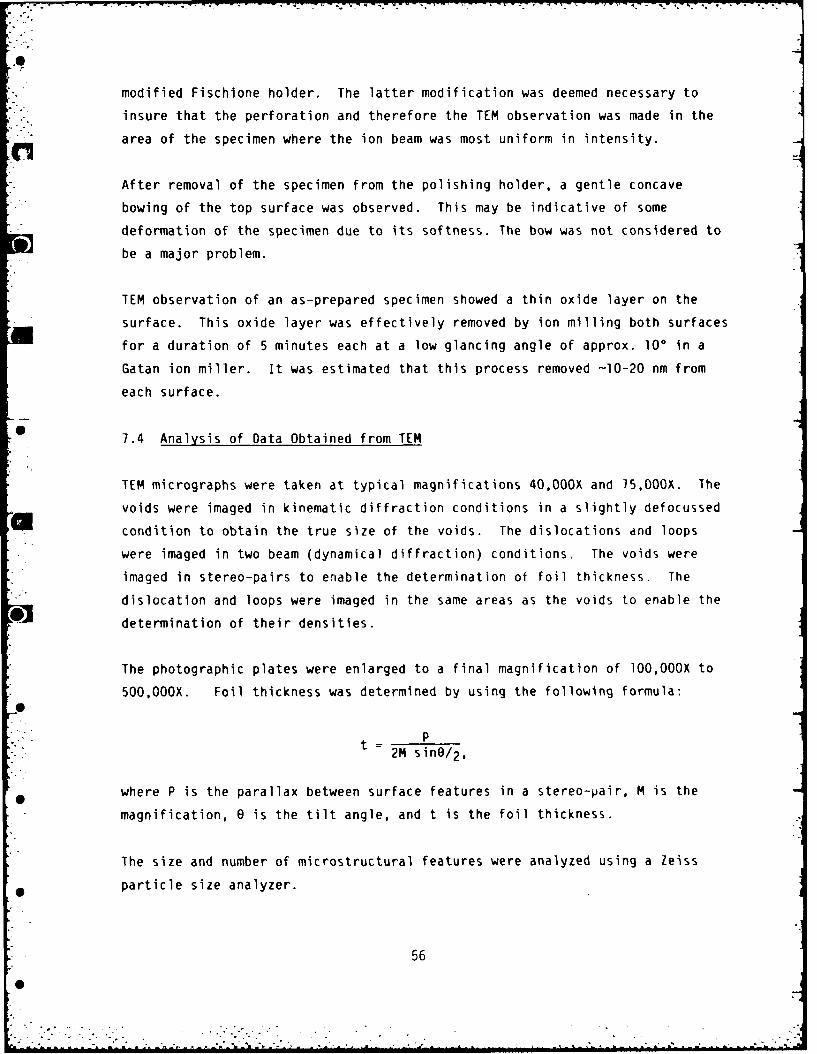
.0
modified Fischione holder. The latter modification was deemed necessary to
" insure that the perforation and therefore the TEM observation was made in the
area of the specimen where the ion beam was most uniform in intensity.
After removal of the specimen from the polishing holder, a gentle concave
bowing of the top surface was observed. This may be indicative of some
deformation of the specimen due to its softness. The bow was not considered to
be a major problem.
TEM observation of an as-prepared specimen showed a thin oxide layer on the
surface. This oxide layer was effectively removed by ion milling both surfaces
for a duration of 5 minutes each at a low glancing angle of approx. 100 in a
Gatan ion miller. It was estimated that this process removed -10-20 nm from
each surface.
7.4 Analysis of Data Obtained from TEM
TEM micrographs were taken at typical magnifications 40,OOOX and 75,00OX. The
voids were imaged in kinematic diffraction conditions in a slightly defocussed
condition to obtain the true size of the voids. The dislocations dnd loops
were imaged in two beam (dynamical diffraction) conditions. The voids were
imaged in stereo-pairs to enable the determination of foil thickness. The
dislocation and loops were imaged in the same areas as the voids to enable the
determination of their densities.
The photographic plates were enlarged to a final magnification of lO0,OOOX to
500,OOOX. Foil thickness was determined by using the following formula:
0P
2M sinO/ 2 ,
where P is the parallax between surface features in a stereo-pair, M is the
magnification, e is the tilt angle, and t is the foil thickness.
The size and number of microstructural features were analyzed using a Zeiss
particle size analyzer.
56
S ' " " " " "" _i • " ." _ " /

From the micrographs. the following parameters were evaluated.
(1) Diameter of the voids, di, in a size classification.
3
(2) Number of voids per cm3, ni, in a size classification.
- (3) Void density pv = IF ti ni/foil volume, where Fti is
the correction factor for surface intersection.
(4) Number of loops per cm3
(5) Average swelling defined by I I F tinid 3
61
(6) Weighted average diameter, dv, of void, defined as
(XF nd31
The void parameters were calculated from the void diameters measured on the
micrographs. Most of the foils were oriented with the normal in a <1ll>
direction. The diameter of the void was taken as the diameter of a circle
inscribed within the black fringe around the void. This void dimension gives
an upper bound estimate of swelling, especially at high temperatures
(> 10000C) where voids showed less truncation of the cuboldal shape. Assuming
a perfect cube projected on a (111) plane the measured equivalent sphere
diameter is a V7 (where a is the cube edge). The corresponding swelling is
therefore over- estimated by 32%. In reality, however, not all voids showed
perfect cuboidal shapes and therefore the errors are estimated to be less than
30% in swelling and less than 10% in weighted average diameter. At low
temperatures, where voids were truncated in the <100> and <111> directions,
the errors are even less since they can be more closely approximated as
spheres.
57

For each specimen (except for those irradiated at 7000 C) at least four micro-
- -graphs were analyzed for void swelling to obtain a statistical estimate of the
swelling parameters.
7.4.1 Correction Factor Ft for Surface Intersections!t
Voids exposed at the foil surface during electropolishing quickly erode to
larger sizes and more irregular shapes, and may lose observable contrast.
,*. This occurrence was quite common in the niobium specimens examined, especially
- those with large voids. ASTM(8 5 ) has recommended corrections for obtaining
bulk representative void densities from TEM micrographs. This correction
involves exclusion of the voids whose centers lie within 0.5 di (di = void
diameter) of each foil surface. This approach is not practical in many cases
where a large number of measurements are required from many areas of foils at
different magnification, and where a non-homogeneous distribution of cavities
occurs or where thin areas of foils are examined. A correction factor
suggested by Spitznagel et al.,( 86 ) which avoids many of the problems, was
therefore used here. The correction factor, Ft is defined such that
2DiFt = n. = Uc A A = i AA
1 2D + 3t
where ni =number of cavities in size class i
Uc =Underwood correction factor to the specific projected area of
the particle per unit test area, AA
e D. =diameter of cavities in size class i
t =foil thickness
* it can be shown (8 7 ) that
3t 2Di
t 20 20 + 3t
1 18
' 58
-

If the number of cavities in each size class is multiplied by Ft. a volume
fraction corrected for truncation of cavities, with centers either inside or
r outside of the foil volume imaged, is obtained. Every feature thought to be an
image of a cavity, regardless of its proximity to the foil surface, can thus be
counted and sized on the projected image. A numerical exclusion at void size
of 0. > t further ensures that an unrealistically large reduction in cavity
* volume fraction is not introduced. The factor Ft was included in all cal-
culations of parameters defined in section 6.4 above.
8.0 RESULTS
The results from the transmission electron microscopy (TEM) of the Nb speci-
mens irradiated from 7000C (0.35 Tm) to 1300°C (0.57 Tm) are presented in
Table IX. This table lists the damage levels, swelling, void number density,
Lvoid size and dislocation density for each of the specimen examined. Addi-
tionally, ranges in swelling, void number densities and void sizes are
included. These ranges were obtained from the analysis of multiple areas of a
specimen.IFigure 15 shows swelling as a function of irradiation temperature. Swelling
was observed at temperatures from 7000 to 12000C. No voids were observed in
the specimen irradiated at 13000C. As seen in Fig. 15 the swelling increased
from 7000 to 9000 C, reached a peak of 7% at 9000C and decreased slowly there-
after, with increasing temperature, to zero at 13000C.
3.The void number density, expressed as voids per cm3 , is plotted as a func-
tion of irradiation temperature, in Fig. 16. The maximum void density was
observed at the lowest irradiation temperature of 700 0C, where the density was16 - 3 15 -3
1 x 10 cm . The void density decreased gradually, to 1 x 10 cm
over a temperature range 700 0 -900 0C. From 9000 to 1000 0C the void density
decreased rapidly to 5 x 1013 cm 3 and then decreased gradually from 10000
to 1200 0C.
The decrease in void density was accompanied by an increase in the average void
* size as shown in Fig. 17. At 700 0C, the average diameter of voids was 10 nm.
The void diameter increased to ~ 45 nm at 9000 C and then increased to 110 nm
59

C\JD
0 C)C-,;
E 0~ 0w 0 0
cy- -
Cu> 0 0 0
E co LO -m
W0 r- Kl 4w 1W~ Lo-C
r= C-17toU
0S 0 CD C)C
Cuu
4- IU
aC L Ka
E x a' U
o1 x U" x C.)
S- + -0D (D 0 C4
=3 4) to -o
c o c r ( n I mIj
c I I I I I
CDC
C~4A+ 1 + 1 1 + 1 + 4
00
U'0
tv0 0 a CD a
CL
' C-)a' a 0G

ui E
CL
0
o
- a)
N~ 0 owDNIl-oM %
4 C61
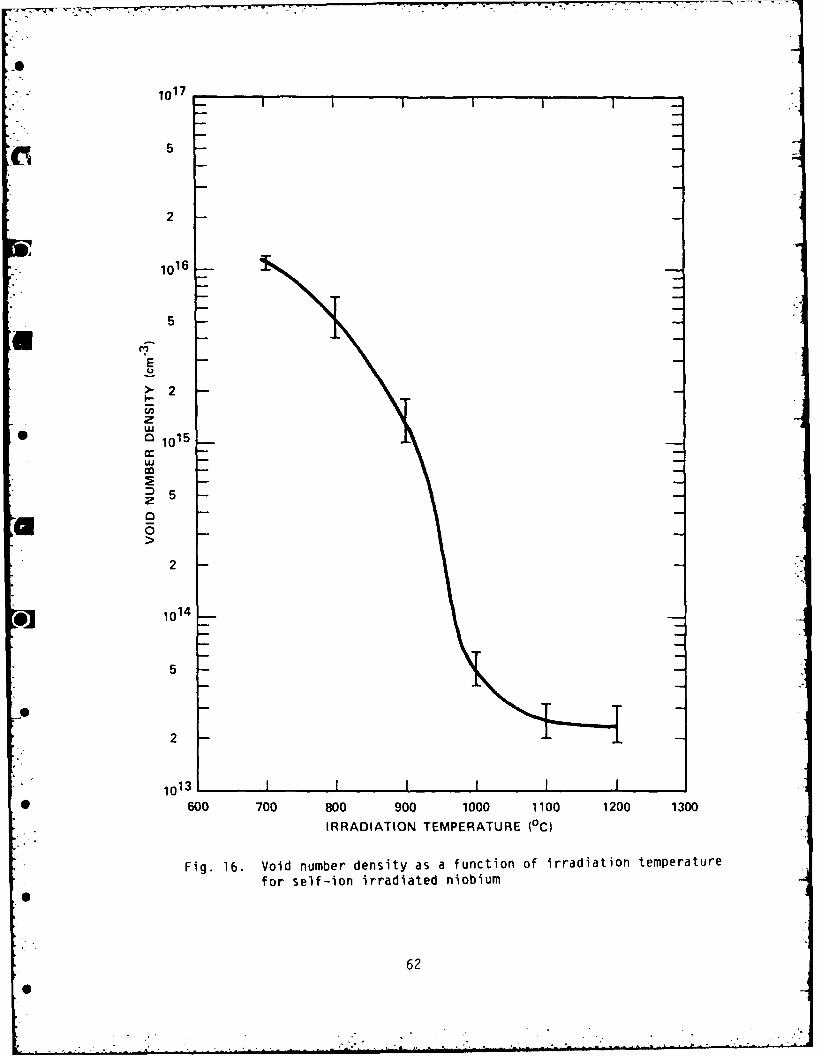
.1017
2
1016
5
E
US w2
a 1015
S5 -z
2
O 1014
5
2
1013 1 , ,I 1 1
* 600 700 800 900 1000 1100 1200 1300
IRRADIATION TEMPERATURE (°C)
Fig. 16. Void number density as a function of irradiation temperature
for self-ion irradiated niobium
62
0" .""' , - . .,, _ ... L.'' " " " "

140 14
120 -12
E100- 10
46 x
N 808
w
WJ60 6 0I>0
40--4
20 -- 2
0 0600 700 800 900 1000 1100 1200 1300
IRRADIATION TEMPERATURE (0C)
Fig. 17. Average void size and dislocation density as a function ofirradiation temperature for self-ion irradiated niobium
63

at 1000 0C. Thereafter, the diameter increased slowly with increasing
temperature. At 12000C, a large scatter in void diameter was obtained from
area to area in the specimen. A part of this scatter is attributed to
enlargements of surface voids due to attack of the electropolishing agent on
the large voids. The dislocation densities are also shown in Fig. 17. The
dislocation densities varied from 6 x 10 1 to 2 x 10 1cm-2 for irradiation
temperatures of 8000 to 12000 C.-4
Figures 18-23 show typical photomicrographs of voids in Nb irradiated from 700
to 12000C. Dislocations are also shown in the insets in these figures.
-- The dislocations were imaged in a two beam condition, mostly with a diffrac-
tion vector g = <110>. Note the differences in magnifications of the
micrographs.
The void size distributions are shown in Figs. 24-29. At low temperatures,
the distributions showed single, relatively sharp peaks at 10 nm, 20 nm and
30 nm for 7000, 8000 and 9000 C. With increasing temperatures the void
distribution shifted to larger sizes and broadened considerably. At the
highest temperature (1200 0C) the size distribution showed multiple small
peaks which are again attributed to the attack on the voids by the elec-
tropolishing-solution.
Micrographs from specimens irradiated at 7000, 8000 and 9000 C were carefully
examined under a stereoscope for void ordering (void lattice formation) in
all the three directions. No ordering was observed in any of the specimens.
Void ordering was also absent in specimens irradiated at higher temperatures.
The loop size and density determinations were hampered by the presence of a
high density (>1016 cm- 3) of small (<10 nm) size loops produced by ion
milling (8 8 ). These loop sizes and densities were comparable to those
expected at irradiation temperatures <800°C. At temperatures of 900C the
density of loops >30 nm in diameter was estimated to be 5 x lO14 cm-3
At temperatures of 10000 - 12000 C they were 2-3 x I014 cm-3
Table IX lists data for a specimen irradiated at 700 0C to 10 dpa. The
purpose of this experiment was to analyze the characteristics of dislocation
6q
64
0 .. '

4.
56
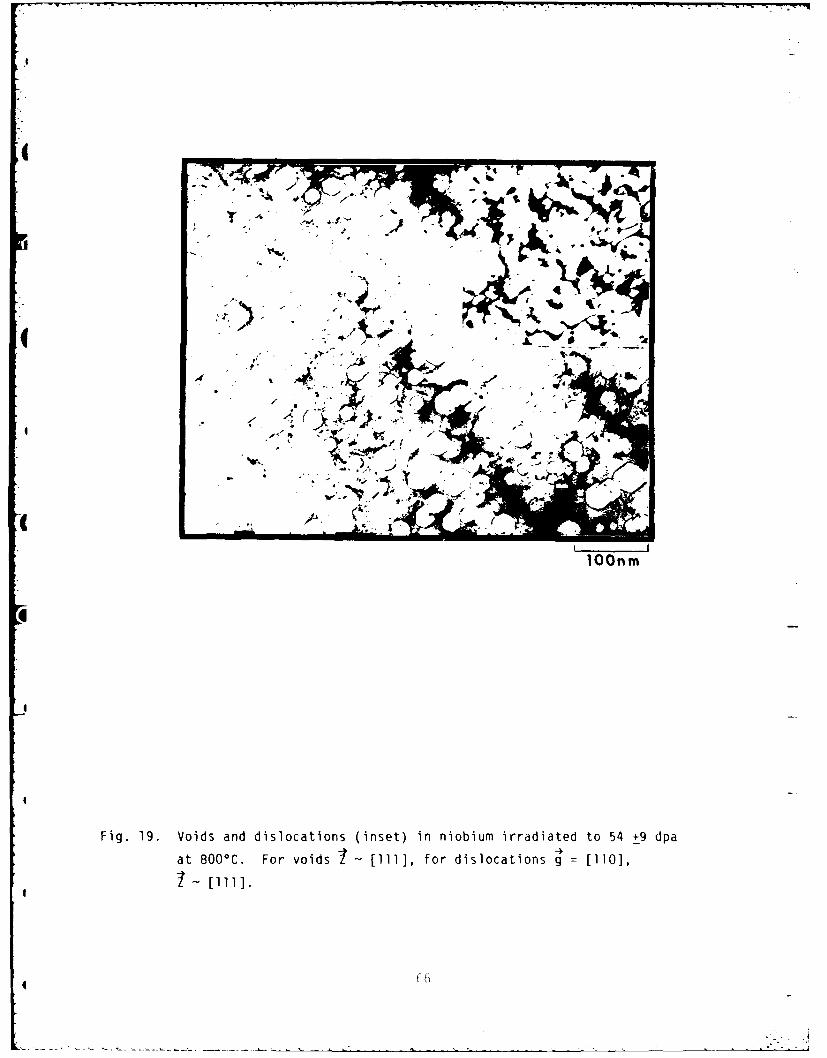
d
"t,
Fig. 19. Voids and dislocations (inset) in niobium
irradiated to 54 +9 dpa
at 800 C. For voids [111il ], for dislocations
g = [ 10],
ib i
k
IA

ti
IA
lO0nm
Fig. 20. Voids and dislocations (inset) in niobium irradiated to 50 +9 dpa
at 900*C. For voids I-[111], for dislocations g [110],
67

caa
00n
Fig. 21. Voids and dislocations (inset) in niobium irradiated to 57 +10 dpadpa at 1000*C. For voids ~-[111], for dislocations g [110],
1~ [1118

C A.
200nm
Fig. 22. Voids and dislocations (inset) in niobium irradiated to 53 +9 dpa
at 1100*C. For voids -[111], for dislocations -g [110],
69

®r.
200n
00
Fig. 23. Voids and dislocations (inset) in niobium irradiated to 52 +9 dpa
at 12000C. For voids -[1ll], for dislocations 94 [110],
07

*0
CL,0+n
0 +1
4% 4-1 O
.-
o to
00
co G
co w C*4
AON~n3H:0-
71

LP
00
(0 0
4-4
co 0 C0
AON~n3U~i
72V

-44
00
E-
I-ILr) W
N
VV
0
ol coc
00~n~u %
6373

0 C
00
Loo
4-,
00
74-

N
0.
0
4 U-
NE
Aa.D3~
c~) 75

C~jlV 0 M
CL-
0 CD
Cui
a 0N
*0i
0 a~j
LL
A3NnDMi %~
76C

loops (vacancy vs. interstitials) produced at this temperature. The dose was
reduced to obtain a small density of loops. However, as seen in Fig. 30 a
high density (1.2 x 101 cm- 3 ) of small loops (40 nm) was observed which
was very difficult to analyze. It appears that the damage level of 10 dpa
was too high to permit loop analysis. Although a lower damage level may
increase the probability of this analysis the small loop size will still pose
a problem. Therefore, experiments will be designed where the specimens will
be irradiated to very low dose levels (0.1-0.5 dpa) and subsequently annealed
at higher temperatures (e.g. 100°0 C) to increase the loop size by thermal
agglomeration prior to the loop analysis. To this end, an ultra high vacuum
annealing furnace capable of annealing up to 1100*C has been assembled.
In the specimen irradiated to 10 dpa at 700*C, voids were also observed.
Figure 31 shows the micrograph of voids in this specimen. The density of
voids was estimated to be 6 x 1016 cm- 3 and the average void size was
6 nm. The size and density of voids observed indicates that at 700°C the
swelling incubation dose has been exceeded.
1 9.0 DISCUSSION
9.1 Comparison of Results of Present Study with Existing Data
As stated in section 3.0, no data exist on the swelling of self-ion irradia-
ted Nb; therefore, a comparison can only be made with Nb irradiated with ions
other than self-ions. Loomis and Gerber (2 3 ) have irradiated Nb over com-
parable temperature and dose ranges with Ni ions. They have also studied the
influence of oxygen on the swelling in Nb. These data are compared with the
present work. In this comparison, the data of Loomis and Gerber correspond-
ing to an oxygen content of 0.07 a/o were utilized, since vacuum fusion
analysis of our material indicated an oxygen concentration of 115 wppmi (660
appm, 0.066 a/o).
Figure 32 shows a comparison of swelling data obtained in the two studies.
Although the peak swelling values were comparable, significant differences
*occur in the temperature dependence of swelling. In this study, maximum
77

50nm
0
Fig. 30. Loops in weak beam dark field g/3g Condition in niobium
* irradiated to 10 +2 dpa at 7000 g = [220]
72
.i -Mta

-, a .
-A
-I
50nm
• Fig. 31. Voids in niobim irradiated to 0 +2 dpa at 7O0°C.
-rT[0
7
[ia,

0C) '
0)
0~
0
*L 0
N cE0
o 0
00lop
0
- ~ 0
00o N
800

"D-Ai54 149 AN INVESTIGATION OF THE IRRADIATION SMELLING MECHANISMS 2/2IN REFRACTORY MET..(U) WESTINGHOUSE ADVANCED ENERGYSYSTEMS DIV LARGE PA R BAJAJ ET AL FEB 85
UNCLASSIFIED WAESD-TR-85-BB5 RFOSR-TR-85-8378 F/G i16 NL
EEEEEEEEEEmiElEEEEEEEEEEEEEEIflflflflflflfl

I3,
*1*261 4 16
~Ill'
- iiie
NATIONAL BUREAU OF STANDARDSMICROCOPY RESOLUTION TEST CHART
S.
0f:
0- :i .". -.- " - - ~ i '

swelling occurred at 925 0C whereas Loomis and Gerber saw a swelling peak at
10000 C. Also, in their study, swelling occurred over a temperature range of
7000 to 1150C; whereas in this work swelling occurred over a broader
temperature range (7000-13000 C). Loomis and Gerber observed no voids at
1150°C, whereas voids were observed at temperatures as high as 12000C in this
work (see Fig. 22). The swelling at 8000 and 9000C was also significantlyhigher.
A comparison of void number densities obtained in the two studies is shown as
a function of irradiation temperature, in Fig. 33. A sharp decrease in void
number densities as a function of temperature was observed in both studies,
although the magnitudes and temperature dependences were different. In this
study, the density decreased by a factor 220 over a temperature range of
700°-10000C, whereas Loomis and Gerber observed a decrease by a factor of
500. The absolute values of the void number densities are significantly
different in the two studies. For example, at irradiation temperatures of
8000 and 10000C, the void densities reported here are a factor of 6 lower
than those of Loomis and Gerber.I
The average void diameters as a function of temperature from the two studies
are plotted in Fig. 34. Rapid size increases are observed from 9000 to
1000 0C in both studies, but the void diameters are significantly higher in
the work reported here.
Loomis and Gerber also observed void ordering in niobium containing oxygen in
excess of 0.04 a/o and irradiated at 7750C. No void ordering was observed in
specimens irradiated at 700* or 8000 C in this study.
In an earlier study, Loomis et al(8 9 ) observed a double peak in the tem-
perature dependence of swelling in niobium containing 0.006 a/o oxygen,
irradiated to 50 dpa with Ni+ ions. The peaks occurred at - 825 0C and
1025 0C. The maximum void swelling was 12%. The void number densities showed
dips at the peak swelling temperatures. At 1100C the void density increased
by an order of magnitude over that at 10000 C. The void diameters also showed
two peaks occuring at the peak swelling temperatures. The dislocation
~81
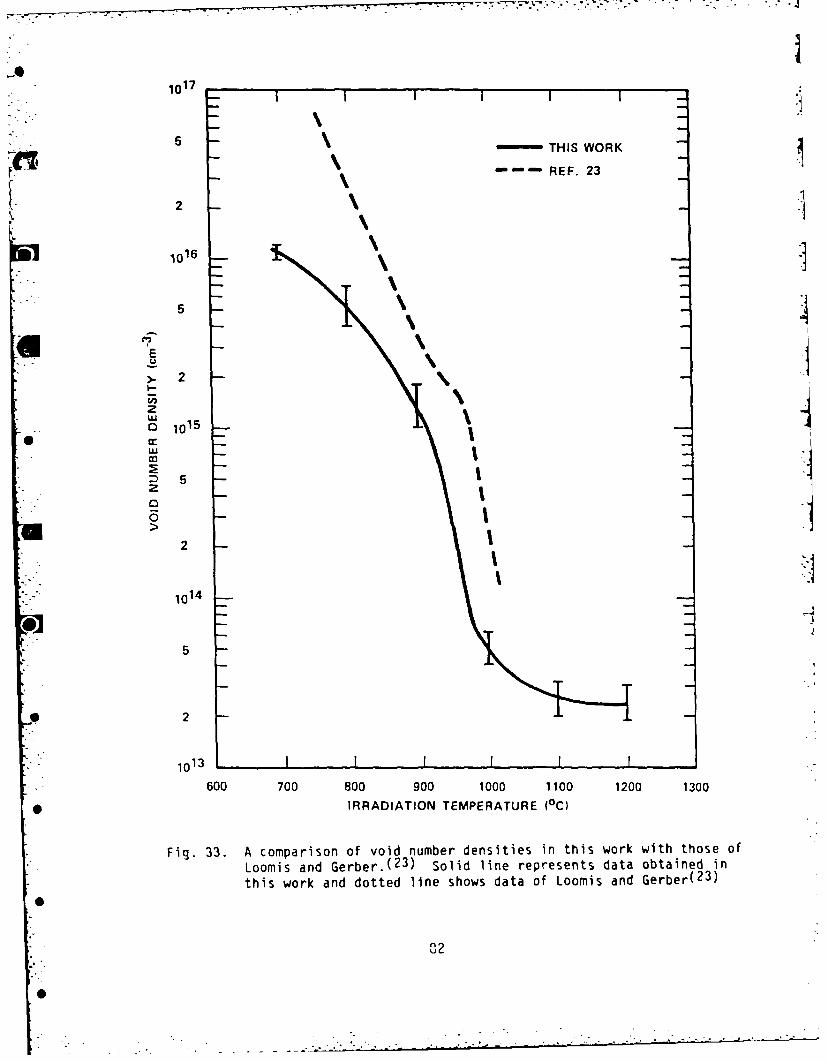
1017
5 -THIS WORK
-- REF. 23
2
5 ~
aE> 2
z• r0 1015 _
S5z>
2 :i* io14
5
*m 2
10143-
" I I I I
600 700 800 900 1000 1100 1200 1300
IRRADIATION TEMPERATURE (°C)
Fig. 33. A comparison of void number densities in this work with those of
Loomis and Gerber.( 23) Solid line represents data obtained inthis work and dotted line shows data of Loomis and Gerber(
2 3 )
02
................................................." . , .:''•-.... ............

i
I
140- THIS WORK
-= --- REF. 23
120
100
E
"' 80N
w6 0 ° /40
20/
0600 700 800 900 1000 1100 1200 1300
IRRADIATION TEMPERATURE (°C)
Fig. 34. A comparison of average void sizes in irradiated niobium
between this study and that of Loomis and Gerber (23 )
83

9 2
densities were of the order of 10 cm 2 and average dislocation loop and
spot diameters varied from 10 nm to 98 nm between 8000 and 11000 C. No
swelling was observed at temperatures above 11500 C. These data cannot be
compared to the data of the present study because of an order of magnitude
difference in starting oxygen content and possible continuous oxygen pickup
during irradiation as suggested by the authors.
The difference in the results of this study and that of Loomis and
Gerber ( 23), especially with regards to the temperature dependence of
swelling, void number densities, and average void sizes, cannot be accounted
for by the differences in pre-irradiation oxygen levels and oxygen pickup
during the irradiation. This is because, at oxygen levels of 0.08 a/o,
saturations in void number densities and average void sizes were observed by
Loomis and Gerber {2 3" " Also, the temperature dependence of swelling was
reported to be nearly independent of oxygen content.
The only major difference between the two studies is the ion species used to
irradiate the niobium specimens. Loomis and Gerber ( 23 ) used 5BNi + ions
whereas in this study self-ions were used. Chemical effects between the
nickel ions and either niobium or oxygen or both cannot be ruled out at this
time. Injected interstitials are known to influence swelling and micro-
structure; the examination of the impact of this effect on the results of
*I this work has not yet been completed.
9.2 Comparison of Experimental Data and Model Calculations
A major objective of this program is development of a model for swelling in
.-. body centered cubic metals based on the formalism of chemical reaction rate
theory. The basic equations of the model and preliminary calculations for
niobium were presented in Section 5. The results of the calculations were
used to determine conditions for the first set of experiments. In this
section, the experimental results are compared with model calculations in
order to test the validity of the theoretical assumptions that have been
made, to evaluate values of critical model parameters, and to determine areas
where experiments that lead to refinement of the model can be performed.
R,
"0" i lm.m ",., , , -'w ,,w ,,..

The results of three sets of calculations are presented. The first set,
which is a determination of the critical cavity size required for growth as a
r function of temperature, provides an explanation for the high-temperature
cutoff observed for swelling. Results of the second set, evaluation of sink
strength ratios from the experimental data, have implications with respect to
the values of the loop bias factors and the temperature dependence of loop
-- growth kinetics. Finally, calculations of swelling as a function of tempera-
ture show that swelling depends strongly on interactions of impurities with
point defects and development of the dislocation structure before the onset
• -of swelling.
9.2.1 Critical Size for Cavity Growth
The differential equation that describes the rate of change of the cavity
radius with time [Eq. (34)] contains two terms which are respectively the
rate at which the cavity radius increases due to net vacancy absorption and
the rate at which the radius decreases due to interstitial absorption per
unit time increment. The magnitudes of these terms depend on the cavity
U radius; appearing directly in the conversion of defect volume to change in
radius and in the thermal vacancy emission term [Eq. (25)] and indirectly
because of the dependence of the steady-state point defect concentrations on
the total sink strength [Eq. (10)], which includes a term for the cavity sink
strength [Eq.(7)].
In order for a cavity to grow, the cavity radius must be greater than thecrit"critical radius" rci which will be defined here as the radius atv
which the vacancy and interstitial absorption terms balance. An expressioncri t
for rv can be obtained from Eq. (34) by setting the derivative to
zero and solving:
Zc Dv Cv c DIC -1rcrit - [ kT ln ( v - ZI -] (41)v ?yQ c D th
Zv v Cvc
The terms in Eq. (41) have been defined previously in Section 5.
85
0 ., .

The value of the critical radius depends on the sink structure, the bias
parameters, dose rate, and temperature. Using the average void densities and
dislocation densities given in Table IV, and the experimental temperatures and --eAdose rate, the critical radius was calculated as a function of temperature.
The results are shown in Fig. 35 (Curve labelled 0). Bias parameters Z c
c ndZ were assumed to be one, and Z to be 1.05. Loop density was taken asI I1 t
zero, since the network is established at doses of the order of 10-20 dpa.
Evaluation of the critical radius is important for analysis of the swelling
data for several reasons. First, it establishes the end of the nucleation
process for a given set of experimental conditions. Once a cavity has attained
this size it is assumed to continue growing at a rate defined by Eq. (34).crit
In a practical sense, this means that the value of r rv is used as the ini-
tial cavity radius when the swelling equation is solved. Second, an estimate
of the incubation period for swelling at each temperature can be obtained if
the measured swelling values are fit to those calculated using the model
equations. The difference between the actual irradiation times and the times
at which the model calculations reach the measured values provide these data.
Finally, the rapid increase in the critical radius at high temperatures
explains the observed absence of cavities and the lack of swelling at 1300°C.
No cavity embryo can reach the critical radius at this temperature in the
absence of a large quantity of gas acting to stabilize the cavity by reducing
thermal emission of vacancies. The cavity nucleation rate therefore drops to
zero.
9.2.2 Sink Strength Ratios
.0 The data given in Table IX can be used to estimate sink strength ratios for the
microstructure observed in the implanted niobium specimens. Since experimental
data for the dislocation loops are not available, values for the loop densities,
bias factors, and sizes must be assumed in order to perform the calculations.
Z2 ,the bias factor of <111> loops for interstitials, was assumed to liebetween 1.0 and 1.1 and ZtI was taken to be equal to biZt2/b The <111>
1 11 16 b1-j l 2. h* 11loop density was assumed to be between 10 and 10 cm ; the <100> loop
density was assumed to be a factor of 10-5 lower. The capture area factors,
4wr*, for both types of loop were taken as 10- 6 cm.
86
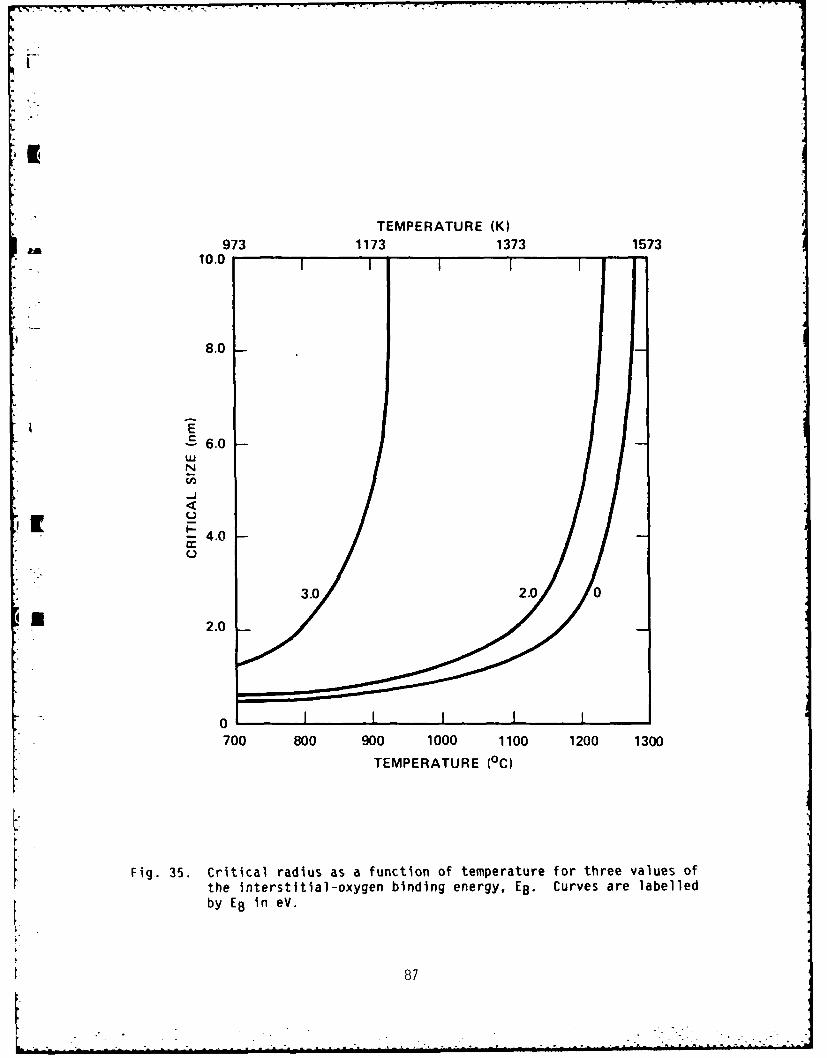
r
TEMPERATURE (K)973 1173 1373 1573
10.0 I
8.0
' E-S 6.0
N
4.0
3.0 2. 0
2.0
0 I I I700 800 900 1000 1100 1200 1300
TEMPERATURE (°C)
Fig. 35. Critical radius as a function of temperature for three values ofthe interstitial-oxygen binding energy, EB. Curves are labelledby EB in eV.
87

Results of the calculations are summarized in Table X. Specimens are identi-
fied by the implantation temperature, given in the first column. The range of
i, values of the sink strength ratio, SI/Sv, obtained for the range of
parameters given above are listed in the second column. The final column12 Uf sls hnZate
contains a bounding value Zmaxfor Z I if is less than Zmax' then
S /S is greater than Z1 and the condition for shrinkage of <111> loops isI vI
met. The value of Z is independent of the assumed <111> loop density for1max 16
densities from 1011 to l cm 3 .
Table X. Calculated Sink Strength Ratios
Temperature (°C) SI/Sv Zmax
700 1.017-1.021 1.018
700 1.027-1.033 1.029
800 1.020-1.027 1.022O
900 1.022-1.033 1.025
1000 1.034-I.057 1.044
1100 1.036-1.059 1.046
1200 1.031-1.062 1.044
A rough estimate of loop densities was made using the micrographs given in
Figs. 18-23 and a value of approx. 1014 cm- 3 was obtained. For this
density, the calculated sink strength ratio is independent of ZI , for ZI
between 1.0 and 1.1, at all temperatures, and is given by Zmax' In addi-
tion, it depends only slightly on temperature, with an average value of
1.023 between 7000 and 9000C and 1.045 between 10000 and 12000C. One
implication of this result is immediately apparent; if Z U lies between 1.023
and 1.045, <111> loops will grow at low temperatures and shrink at high
temperatures.
9.2.3 Calculated Swelling Curves
Theoretical swelling curves were obtained from the model equations for threedifferent sets of assumptions. Each will be discussed in turn, to indicate
how the analysis developed.
88
For the first calculation, the experimental dislocation density was taken as
the value for the network density with bias equal to 1.05. The average cavity
4 density was used for Nc , and loop densities were assumed to be zero. (This
set of assumptions is equivalent to assuming that the swelling model used for
face centered cubic metals is valid.) The total swelling time was taken equal
to the irradiation time; nucleation is thus assumed to occur at t=O. The
I results of this calculation are given in Fig. 36 (Curve labeled 0). The
experimental results are indicated in Fig. 36 by the dashed curve, with the
medsured points and error bars shown. It is apparent that the calculation
does not reproduce the data, overpredicting the low temperature results by an
order of magnitude, and the high temperature results by roughly a factor of
three.
The first modification of the initial assumptions was the inclusion of an
incubation time for swelling. At the onset of irradiation, a sequence of
events occurs to set the stage for the swelling phenomenon. This sequence
includes establishment of steady-state point defect concentrations, loop
nucleation, loop growth, and cavity nucleation. Loop growth and network
4 formation may be completed within the initial transient period, or may extend
into the cavity growth regime. (We have assumed that the former is the case,
since the network density is equal to the measured dislocation density.)
Cavity growth is significant only after this sequence is completed. The
4 I extent of the initial transient period depends on temperature, dose rate, and
impurity concentrations and requires of the order of 1-10 dpa. A theoretical
estimate can be obtained if a full-scale nucleation calculation is performed.
To examine the effect of an incubation period on the calculated swelling, four
incubation times, corresponding to doses of 1,5,10, and 15 dpa, were assumed,
and the calculations redone. The results are shown in Fig. 36, where the
curves are labelled by the incubation dose. As can be seen from the curves,
inclusion of an incubation period does reduce the calculated swelling, but the
reduction is not large enough to cause agreement between the calculations and
the data. For example, with an incubation dose of 10 dpa, the calculated
swelling is reduced by roughly 25 to 30 percent over the entire temperature
range.
89

TEMPERATURE (K)973 1173 1373 1573
50
0
40
01
30 30
z
U wU
U20
10
700 800 900 1000 1100 1200 1300TEMPERATURE (0C)
Fig. 36. Calculated swelling as a function of temperature. Curves arelabelled by the assumed value of the incubation dose in dpa.
* Experimental data are given by the dashed curve.
gn

At this point, two major effects remained to be considered within the context
of the model as it has been developed to date: those due to the two types of
I( loops and their differing biases for interstitials, and those due to impuri-
ties. At the doses examined, it is apparent from the micrographs that the
evolution of the dislocation structure has advanced into the stage where the
network dominates the microstructure, and data on loop types, densities, and
i Isizes can not be obtained. Calculation of the impact of loop properties on
swelling is therefore difficult and will be deferred until low dose data is
avdilable. The third set of swelling calculations focused on impurity effects.
As mentioned previously in Section 5.4, trapping of point defects by impuri-
ties can have a significant effect on the cavity growth rate and hence the
swelling rate. Measured oxygen concentrations in the material used in this
work are roughly 0.07 appm. Work by Loomis and Gerber (2 3 ) has shown that
concentrations of this order are sufficient to affect swelling, leading to a
reduction in swelling relative to that in low-oxygen material. If we assume
that the mechanism involved is trapping of niobium interstitials by oxygen,
the diffusion coefficient DI appearing in the model equations must be
C Ureplaced by the effective diffusion coefficient given in Eq. (40). This
introduces the interstitial-oxygen binding energy EB as a parameter in the
* model, since its value has not been measured.
* 1Preliminary calculations showed that binding energies of the order of 2 eV are
needed to produce calculated swelling curves that correspond to the experi-
mental curves. A series of calculations was then made with the binding energy
ranging between 1.75 and 2.1 eV. Two incubation doses were used: 0 and 10
.- dpa. The results are shown in Figs. 37 through 40 where the calculated
swelling is plotted as a function of binding energy for the six experimental
temperatures. Each experimental point was then used, along with its error
bar, to determine the range of EB values that would produce a fit. The
4 procedure is illustrated in Fig. 37 for 900 0 C. Results for all temperatures
are given in Table XI for zero incubation dose, and in Table XII for an
incubation dose of 10 dpa. As can be seen from the tables, there is some
scatter in the results, with an average value of 1.995 eV for 0 dpa and
* 1.943 eV for 10 dpa. These average values were used in the model equations
91
Lo

00
C:
rL 00
0-
x CPW L
CPJ
o> I
00
I 4I
CC
m 0W C=a) co
CL)W
hi IV
IFV , tiA
co 0 0 0)
( 'J ONII13AA
92tV

0 )
c0
CLC
00
L.
CdCD
0 C10 tN .
co.- 0) 0
0 0
o V)C
4-J0
z4-)
WW(
'C r_ a) ".0cO
0 4-)LC
0 0
CC,
4- (L
M L;
S- 0
CRC
Q ) 0
to LE
w - S-
CV)
LA-
93

CLC
.0>. I
*0 4'. CO
CD
w L ol
C
49
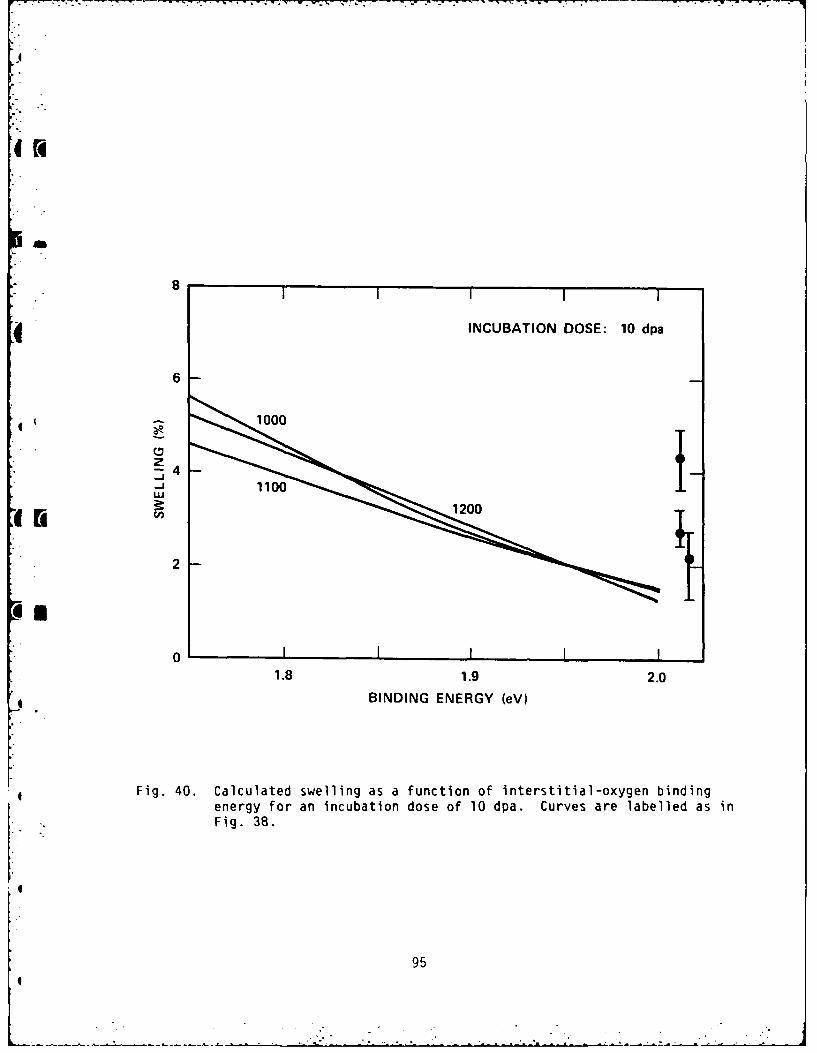
-4
8
4 INCUBATION DOSE: 10 dpa
6
-4
=~_ 18.92.
-4
I Q oBINDING ENERGY (eV)
[-4
i.I IFig. 40. Calculated swelling as a function of interstitial-oxygen binding
t energy for an incubation dose of 10 dpa. Curves are labelled as inIi" Fig. 38.
E9i
[-2
E-
0 II1. 19-.
BIDNGEEGY(V
95

and swelling calculated as a function of temperature, as shown in Fig. 41.
Triangles are for an incubation dose of 0 dpa, and circles for 10 dpa.
Table XI. Fit of Binding Energies to Swelling Data
Incubation Dose: 0 dpa
Temperature (°C) Range EB (eV) Mean Fit
700 2.088-2.049 2.068
800 2.130-2.094 2.111
900 2.021-1.966 1.987
1000 1.898-1.840 1.866
1100 1.976-1.921 1.954
1200 -1.952 1.982
Average 1.995
Table XII. Fit of Binding Energies to Swelling Data
Incubation Dose. 10 dpa
* Temperature (°C) Range EB (eV) Mean Fit
700 2.026-1.986 2.004
800 2.092-2.055 2.073
900 1.972-1.917 1.939
1000 1.846-1.781 1.810
1100 1.917-1.853 1.892
* 1200 -1.904 1.942
Average 1.943
* The two combinations of incubation dose and binding energy give approximately
the same fit to the data. Significant discrepancies occur at two temperatures,
8000 and 1000C. At the former temperature, the swelling is overpredicted by
roughly a factor of two; at the latter, underpredicted by the same factor.
96

TEMPERATURE (K)
973 1173 1373 15738
6 0
-4w -J
-j
a. 2 2
2
o I I I II
700 800 900 1000 1100 1200 1300TEMPERATURE (°C)
Fig. 41. Calculated swelling as a function of temperature for twocombinations of incubation dose and interstitial-oxygen bindingenergy: A (0 dpa, 1.995 eV); 0 (10 dpa, 1.943 eV). Experimentalpoints are shown with error bars.
97

A
Whether the values obtained for EB are reasonable can be tested to a limited
extent by looking at the effect of the binding energy on the critical radius.
Trapping of interstitials by oxygen reduces the diffusivity of interstitialscrit crit
and changes r [see Eq. (41)]. Calculations of r as a function ofv v crittemperature were done for a range of assumed binding energies, and r
increases as binding energy increases for a fixed temperature. Values ofcritr ri are plotted in Fig. 35 as a function of temperature for binding_m v
energies of 2 and 3 eV. As can be seen from the figure, there is a large shift
of the high temperature portion of the curve toward lower temperatures as the
binding energy increases from 2 to 3 eV. The shift when EB changes from 0 to
2 eV is relatively small in comparison. Any increase in assumed binding
energy, which would result in a better fit to the 800°C data point, for
example, would result in critical radii at high temperatures that would becrit
unacceptably large. Since cavities are observed at 1200°C, rv mustV
remain relatively small until this temperature is exceeded. For bindingcrit
energies near 2 eV, r is 5 nm, a value that is somewhat high. AV
reduced binding energy is therefore more reasonable than an increased one.
* By examination of the cavity distribution after implantation, Horton (91) has
recently determined the critical cavity radius in Fe - 10% Cr irradiated at
577°C (.5Tm) with 4 MeV Fe" + ions to a damage level of 30 dpa. The value
obtained was 2.5 nm, a result that is of the same order as those calculated in
th? present work for temperatures near 1200*C with binding energies between 0
and 2 eV.
As indicated in the discussions of experimental results, measured dislocation
densities in Ni-implanted niobium are roughly an order of magnitude lower than
those measured in the present work. Because of possible deformation during
sample preparation, the densities given in Table IX may be high. A series of
swelling calculations was performed in order to determine the effect of the
dislocation density. Reduction of measured values of dislocation density by an
order of magnitude led to a significant reduction in the calculated swelling
relative to the first series of calculations (see Fig. 36 , curve labelled 0).
At 7000 C, swelling was reduced by a factor of 5, and at 900°C by a factor of
4. For the three high temperature points, there was only a small reduction, of
93
S
the order of 10%. If warranted by measurements of deformation induced during
sample preparation, modification of the experimental dislocation densities and
I Urefitting of the swelling data to the model calculations would give oxygen-
interstitial binding energies that are lower than those determined for the
conditions as given. Determination of preparation-induced deformation, if any,
is therefore important.
g.3 Suggested Areas of Experimental and Theoretical Investigation
The combination of experimental data and calculational results indicate several
areas that can be investigated both theoretically and experimentally to aid in
the development of the theory for swelling in body centered cubic mptals.
These include:
6 o Low-dose microstructural evolution
o Cavity growth kinetics
o Loop and cavity nucleation
* o Oxygen trapping
The first two would require experimental work, the second two, primarily
theoretical effort..5
A series of experiments at low doses could provide data on the development of
the conditions that prevail at the onset of swelling. For example, the data
for 10 and 32 dpa at 700 0 C indicate that coalescence of small cavities may
*occur, since the cavity number density at the lower dose is greater than that
at the higher. The swelling model does not currently include coalescence as
a possible growth mechanism. In addition, data on the dislocation loops,
* including types, densities, and sizes, is needed in order to evaluate the
possible effects of the presence of both <100> and <111> loops on swelling.
Data on the growth rate of cavities at moderate doses (between 10 and 50
dpa), obtained from experiments with total dose as a variable, could be
* •directly compared with predicted growth rates. An outcome of this would be
99
0 :_..:ii• _ ._
an experimental determination of the incubation dose, which in the present
analysis was used as a parameter, independent of temperature.
A theoretical estimate of the incubation dose can also be obtained from a
three-component nucleation calculation. Nucleation models based on the
chemical-reaction-rate formalism are available, and a calculation that
includes <100> and <111> loops as well as cavities is relatively straight-
forward. Predictions of low-dose loop growth kinetics would be automatically
a part of the output of this type of computation. As can be seen from the
data, the cavity density drops significantly between 9000 and 10000C, and the
dislocation density flattens out as a function of temperature. As a result,
the calculated sink strength also changes. The key to understanding the
temperature dependence of the densities lies in understanding what controls
cavity nucleation.
From the swelling calculations it is clear that any impurity trapping (in
this case oxygen) could be significant in determining swelling behavior. An
investigation of oxygen effects in niobium would require extensive experi-
mental and analytical work, and is currently not a major focus of the pro-
gram. Loomis, however, has done extensive work on oxygen in niobium, and his
published data provide a test for any swelling model that includes oxygen as
a critical component. As a preliminary to performing experiments involving
variable oxygen concentrations, it would be useful to analyze Loomis' data
with our model. This could have the additional benefit of explaining the
differences between the two data sets.
10.0 SUMMARY AND CONCLUSIONS
During Phase I (first year) of a three year program to investigate irradia-
tion swelling mechanisms in refractory metals, a theoretical model based on
* the chemical reaction rate formalism was developed specifically for body
centered cubic metals. Calculations were performed for a selected metal,
niobium material, i.e. niobium. A special source preparation method was
developed to produce a niobium hydride target material. The use of this
* tdrget in the ion source resulted in an output of Nb ions of sufficient
0

energy and flux to permit, for the first time, ion bombardment studies of
niobium with self-ions. Irradiated experiments were conducted at the Argonne
4 ~National Laboratory accelerator facility. Microstructural data obtained from
trdnsmission electron microscopy (TEM) were compared with the existing data
and with the theory and further experimental directions were developed. The
experimental results showed:
1. A peak swelling of 7% was obtained at 900°C in niobium (0.07 a/o
oxygen) irradiation with 5.3 MeV Nb ions at a nominal dose of 50
dpa and a dose rate of 6 x 10- 3 dpa/s.
2. Swelling occurred over a temperature range of 7000 to 1200°C.
Swelling was not observed at 13000 C.
3 The dislocation structures were well developed.
A comparison of data from this study and those obtained by Loomis and Gerber
on niobium irradiated with nickel ions showed several differences between the
4 4 data sets. These differences may be due to the use of Ni ions in the earlier
studies.
A comparison of model calculations with the experimental results showed a
reasonable agreement between the calculated and experimental swelling values
when trapping of interstitials by oxygen was included. An interstitial-
{ oxygen binding energy of approximately 2 eV/atom provided the best fit to the
data. Microstructural data were utilized to calculate sink-strength ratios
whose average values as a function of temperature ranged from 1.018 to 1.046.
The experimental results and their theoretical analysis suggest the following
Vareas for further investigation4
(1) Microstructural evolution at low dose
(2) Kinetics of cavity growth
(3) Trapping effects due to oxygen
(4) Self-interstitial effects
101I
- a k. ..- &.t .

11.0 REFERENCES
1. C. Cawthorne and E.J. Fulton, "Voids in Irradiated Metals", Nature, 216,cI pp. 575-576 (1967).
2. E.A. Little and D.A. Stow, "Void Swelling in Irons and Ferritic Steels-II An Experimental Survey of Materials Irradiated in a FastReactor,"Nucl. Mater, 87, pp. 25-39(1979).
3. Proceedings of the 1971 International Conference on Radiation InducedVoids in Metals, Albany, New York, June 6-11, 1971, U.S. Atomic EnergyConission, April 1972.
. 4. H. Weidersich, "Theory of Defect Clustering and Void Formation" inRadiation Damage in Metals, pp. 157-191, ASM, Cleveland, 1976.
A 5. M.L. Bleiberg and 3.W. Bennett, Eds., Proceedings of InternationalConference on the Radiation Effects in Breeder Reactor StructuralMaterials, June 19-23, 1977, Scottsdale, Arizona, Metallurgical Societyof AIME, 1977.
6. R. Bajaj, S. Diamond, M.L. Bleiberg, "Optimization of Precipitation0 Hardened Fe-Cr-Ni Alloys Using Nickel Ion Bombardment Simulation
Studies", in Effects of Radiation on Materials, Eleventh Conference,ASTM-STP-782, H.R. Brager and J.S. Perrin, Eds., American Society forTesting and Materials, pp. 856-884, 1982.
7. S. Wood, J.A. Spitznagel, W.J. Choyke, et al, "MicrostructuralDevelopment in Dual-Ion bombarded 316 Stainless Steel", Effects ofRadiation on Materials: Tenth Conference, ASTM-STP-725, David Kramer,H.R. Brager and J.S. Perrin, Eds., American Society for Testing andMaterials, pp. 455--469, 1981.
B. W.G. Johnston, T. Lauritzen, J.H. Rosolowski et al, "The Effect of*] Metallurgical Variables on Void Swelling", in Radiation Damage in Metals,
pp. 227-266, ASTM Cleveland, Ohio, 1976.
9. M.L. Bleiberg, R. Bajaj, I.M. Baron, et al., "Swelling and Gamma-PrimeParticle Stability of Ion-Bombarded Iron-Chromium Nickel Alloys", inIrradiation Effects on the Microstructure and Properties of Metal,
0 ASTM-STP-611, American Society for Testing and Materials, pp. 315-336,1976.
10. W.J. Weber, G.L. Kulcinski, R.G. Lott, et al., "Ion Simulation Study ofVoid Formation in High Purity Vanadium", in Radiation Effects and TritiumTechnology for Fusion Reactors, CONF-750989, pp. 1-130-149, March 1976.
11. S.C. Agarwal and A. Taylor, "Dose Dependence of Void Swelling in Vanadiumirradiated with Self Ions", in Radiation Effects and Tritium Technologyfor Fusion Reactors, CONF-750989, pp. 1-150-157, March 1976.
0

12. S.C. Agarwal, D.I. Potter and A. Taylor, "Effect of Interstitial Soluteson the Microstructures of Self Ion Irradiated Vanadium", in IrradiationEffects on the Microstructure and Properties of Metals, ASTM-STP-611,
4 (American Society for Testing and Materials, pp. 298-311, 1976.
13. A.1. Santhanam, A. Taylor and S.D. Harkness, "Charged Particle SimulationStudies of Vanadium and Vanadium Alloys", in Defects and Defect Cluster
" in B.C.C. Metals and Their Alloys", R.J. Arsenault Ed., pp. 302-320,1973.
| 14. R.G. Lott, G.L. Kulchisni, P. Wilkes et al, "Effect of Nickel andNitrogen on Void Formation in Ion Bombarded Vanadium," J. Nucl. Mat.85-86_ pp. 751-755 (1979).
15. J. Bressers and W. Van Witzenberg, "The Influence of Oxygen on VoidFormation in Neutron Irradiated Vanadium", J. Nucl. Mater., 85-86, pp.757-761, (1979).
16. S.K. Tyler and P.J. Goodhew, "Helium Bubble Giowth in Vanadium", Effectsof Radiation on Materials, Tenth Conference ASTM-STP-725, David Kramer,M.R. Broger and J.S. Perrin, Eds. American Society for Testing andMaterials, pp 654-662, 1981.
17. W. Van Witzenberg, A. Mastenbrock and J.D. Elen, "The Influence ofPreimplanted Helium on the Microstructure of Neutron IrradiatedVanadium," J. Nucl. Mater. 103-104, pp 1187-1192, (1982).
18. R.E. Gold and D.L. Harrod, "Radiation Effects in Vanadium and Vanadium4 KBase Alloys", Int. Met. Rev., 25, Nos. 5 and 6: pp. 232-254, (1980).
19. M.P. Tanaka, E.E. Bloom and J.A. Horak, "Tensile Properties andMicrostructure of Helium-Injected and Reactor Irradiated V-2OTi;" 3.Nucl. Mater., 103-104, pp. 895-900, (1981).
m 20. B.A. Loomis and G. Ayrault, "Cavity Formation in Single and Dual-IonIrradiated V-l 5Cr 5Ti Alloy", in Quarterly Progress Report, Oct-Dec.1982, DOE/ER-0046/12, pp. 194-205, Feb. 1983.
21. B.A. Loomis, A.T. Taylor, T.E. Klippert, et al.,"Effect of OxygenImpurity on Void Formation in Ion Bombarded Niobium", in Defects andDefect Clusters in B.C.C. Metals and Their Alloys, R.J. Arsenault Ed.,pp. 332-340, 1973.
22. B.A. Loomis, A.T. Taylor and S.B. Gerber, "Void Swelling of Nb, Nb-IAT%Zrand Nb-0.5At%0 Induced by 58 Ni+ Bombardment", Radiation Effects andTritium Technology for Fusion Reactors, CONF-750989-Pl, pp. 1-93-105,March 1976.
103
• '" - • " ' " L ' .,, i ... ...... ... .. .. . - .. .... --: .-" ... .... .-.:_ i ... ....... ..... ...... ..... ..... .....

23. B.A. Loomis and S.B. Gerber, "Swelling of 58 Ni+ and 3He+Ion-Irradiated Nb and Nb Alloys", J. Nucl. Mater. 103-104, pp. 1193-1197(1982) and "Similar Dependence on Dilute 0 Concentration of VoidFormation in Ion-Irradiated Nb and Some Properties of Unirradiated Nb",J. Nucl. Mater, 97, pp. 113-125, 1981.
24. H. Jang and J. Moteff, "The Influence of Neutron Irradiation Temperatureon the Void Characteristics of Nb and Nb-!/Zirconium Alloy", RadiationEffects and Tritium Technology for Fusion Reactors, CONF-750989-P, pp.1-106-121, March 1976.
25. A.F. Bartlett J.H. Evans, B.L. Eyre, et al. "High Temperature IrradiationDamage Structures in Fast Reactor Irradiated Niobium and VanadiumAlloys", in Radiation Effects and Tritium Technology for Fusion Reactors,CONF-750989-PI, pp. 1-122-129, March 1976.
26. F.W. Wiffen, "The Microstructure and Swelling of Neutron IrradiatedTantalum", J. Nucl. Mater., 67, pp. 119-130 (1977).
27. J.F. Bates and A.L. Pitner, "Dimensional Stability of Tantalum ControlRods in LMFBRS", Nucl. Technol., 16, pp. 405-409 (1972).
6 28. R.A. Murgatroyd, I.P. Bell, and J.T. Bland, "Dimensional Stability ofTantalum During Fast Neutron Irradiation", in Droperties of ReactorStructure Alloys After Neutron or Particle Irradiation, ASIM, STP 570,American Society for Testing and Materials, pp. 421-432, 1975.
29. F. W. Wiffen,"Swelling of irradiated lantalum and Tantalum Alloys," inQuarterly Prog. Report Irradiation Effects on Reactor StructiralMaterials, Aug-Oct. 1972, HEDL-TME-72-144, Dec. 1972.
30. J. L. Brimhall and E. P. Simonen,"Microstructure of Ion Bombarded SingleCrystal Molybdenum", in Defects and Defect Clusters in B.C.C Metals andTreir Alloys, R.J. Arsenauit Ed., pp. 321-331, 1913.
31. E. P. Simonen and J. L. Brimhali, "The Dependence or Swellirg or VoidSurface Reaction Rate Constants", in Fundamental Aspects of RadiationDamage in Metals, CONF-751006-P2, Vol. II. pp 1196-1202, (1973).
32. E. R. Bradley and J. L. Brimhall, "The Effect of toe tree Surface on Void
Formation in Ion Bombarded Molybdenum,," iF, Rajia_tion Effets and TriLiumTecnnoloq2_ ,r Fjsior: Reactors, CONF -50989-PI, pp 1 31 ! 31 Mar(h 19).
33. 3. L. Brimha~l, L. , nar~ot and H. r. Kissinger, "Effect of HP on theSwElling/MicrcsLruck re roduced in M, by Icn Bormbardmer, I J.NutIMater., 85-R , p,). ?-,-114. ( q
0
1:4
0 ,: . ._ . _ - : ' _: ::i : - . . - . :. . - .. , --.- -

34. K. Y. Liou, P. Wilkes, G. L. Kulcinski et al, "Void Swelling and Phase InStability in Heavy Ion Irradiated Mo-Zr Alloy" J. Nucl. Mater., 85-86,pp. 735-738, (1979).
35. J. H. Stubbins and J. Moteff, "Swelling Behavior of Mo-O.5Ti and TZMBombarded with Heavy Ions at Temperatures Between 750 and 1450°C", J.Nucl. Mater. 103-104, pp. 1163-1168 (1981).
36. J. Bentley, B. L. Eyre and M. H. Loretto, "High Temperature Neutron
1A Irradiation Damage in Molybdenum," in Fundamental Aspects of RadiationDamage in Metals, CONF-751006-P2, pp. 925-931, (1973).
37. J. Bentley, B. L. Eyre and M. H. Loretto, "Suppression of Void Formation
in Neutron Irradiated TZM", in Radiation Effects and Tritium Technologyfor Fusion Reactors, CONF-750989-PI, pp. 1-297-322 March 1976.
38. A. G. Pard and K. R. Garr, "Damage Structure in Neutron Irradiated TZM",in Radiation Effects and Tritium Technology frr Fusion Reactors,CONF-750989P1, pp. 1-312-322, March 1976.
39. J.A. Sprague, F.A.Smidt, Jr., and J.R. Reed, "The Microstructure of SomeRefractory Metals and Alloys Following Neutron Irradiation at 650 0 C, ' J.Nucl. Mater., 85-86, pp. 739-743 (1979).
40. D. S. Gelles, D. T. Peterson and J. F. Bates, "Void Swelling inMolybdenum Alloy TZM Irradiated to High Fluence", 3. Nucl. Mater.,103-104, pp. 1141-1146, (1981).
41. J. Matolich, H. Nahm and J. Moteff, "Swelling in Neutron IrradiatedTungsten and Tungsten-25 Percent Rhenium," Scripta Met. 8, pp. 837-842(1974).
42. R. K. Williams, F.W. Wiffen, J. Bentley, et al, "Irradiation Induced* Precipitation in Tungsten Based W-Re Alloys", Met. Trans. 14A, pp.
655-666 (1983).
43. F. W. Wiffen, Proceedings of the Symposium on Refractory Alloy Technologyfor Space Nuclear Power Applications, Oak Ridge, Tennessee, Aug. 1983, R.H. Cooper, Jr., and E. E. Hoffman Eds. pp. 252-277, Jan. 1984.
44. J. L. Katz and H. Wiedersich, "Nucleation of Voids in MaterialsSupersaturated with Vacancies and Interstitials", J. Chem. Phys. 55, pp.1414-1425, (1971).
45. K. C. Russell, "Nucleation of Voids in Irradiated Metals", Acta Met. 19,pp. 753-758, (1971).
46. J. J. Burton, "Effect of Mobile Interstitials on the Nucleation of
Voids", Scripta Met. 5, pp. 449-458, (1971).
47. M. R. Hayns, "The Nucleation and Early Growth of Interstitial Dislocation
Loops in Irradiated Materials", J. Nucl. Mater. 56, 267-274, (1975).
105

48. B. 0. Hall, "Point Defect Clustering During Irradiation", J. Nuci. Mater.91, pp. 63-72, (1980).
49. H. Wiedersich, "On the Theory of Void Formation During Irradiation", Rad.Effects 12, pp. 111-125, (1972).
50. A. D. Brailsford and R. Bullough, "The Rate of Swelling Due to VoidGrowth In Irradiated Metals", J. Nucl. Mater. 44, pp. 121-135, (1972).
51. B. 0. Hall, "Helium Partioning Between Voids and Dislocations", J. Nucl.*Mater., 117, pp. 89-95 (1983).
52. W. G. Wolfer and M. Ashkin, "Diffusion, Vacancies and Interstitials toEdge Dislocations", J. Appl. Phys. 47, pp. 791-800, (1976).
53. P. T. Heald, "The Preferential Trapping of Interstitials atDislocations", Phil. Maq. 31, pp. 551-558, (1975).
54. A. D. Brailsford, R. Bullough and M. R. Hayns, "Point Defect SinkStrengths and Voids Swelling", 3. Nucl. Mater. 60, pp. 246-256, (197b).
55. R. Bullough, M. R. Hayns, and C. H. Woo, "The Sink Strengths of* Dislocation Loops and Their Growth in Irradiated Materials", J. Nucl.
Mater. 84, pp. 93-100, (1979).
56. F. A. Nichols, "Bias Factors for Use in Reaction-Rate-Theory Analysis ofVoid Swelling and Radiation Creep", Rad. Effects 39, pp. 169-175, (1978).
I 57. F. A. Nichols, "Bias Factors for Radiation Creep, Growth and Swelling",J. Nucl. Mater. 90, pp. 29-43, (1980).
58. M.E. Downey and B.L. Eyre, "Neutron Irradiation Damage in Molybdenum,"- " Phil. Mag 11, pp. 53-80, (1965).
59. B. L. Eyre, D. M. Maher, and A. F. Bartlett, "Neutron Irradiation Damagein Molybdenum", Phil. Mag. 23. pp. 439-465, (1971).
60. K. Shiraishi, K. Fukaya, and Y. Katano, "Radiation and Anneal Hardeningin Neutron-Irradiated Vanadium", J. Nucl. Mater. 54, pp. 275-285, (1974).
61. J. Narayan and S. M. Ohr, "The Characteristics of 15 MeV and FissionNeutron Darage in Niobium", J. Nucl. Mater. 63, pp. 454-459, (1976).
62. E. A. Little and B. L. Eyre, "The Geometry of Dislocation Loops Generatedin Alpha-Iron by 1-MeV Electron irradiation at 550 0 C, "J. Microscqp_y 97,pp. 107-111, (1913).
63. E. A. Little, R. Bullough, and M. H. Wood, "On the Swelling Resistance ofFerritic Steels", Proc_..Roal Soc. London A, 372, pp. 565-579 (1980).
0
. \. L . .b . . . - . - .... , . '- .- .'' L' . - - - ' " - ;' ° . .--
* 64. B. L. Eyre and R. Bullough, "On the Formation of Interstitial Loops inBCC Metals," Phil. Mag. 8. #12, pp. 31-39, (1965).
65. R. Bullough and R. C. Perrin, "The Morphology of Interstitial Aggregatesin Iron," Proc. Roy. Soc. London A.305 pp. 541-552, (1968).
66. D. J. Bacon and A. G. Crocker, "The Elastic Energies of Dislocation6.Loops, in "Lattice Defects in Quenched Metals, R. M. J. Cotterill, M.
Koyama, J. J. Jackson, and M. Meshii, eds.) (Academic Press, New York,,P0 1965, pp. 667-678.
67. K. C. Russell, "Thermodynamics of Gas Containing Voids in Metals", ActaMet. 20, pp. 899-907, (1972).
68. J. L. Katz and H. Wiedersich, "Effect of Insoluble Gas Molecules onNucleation of Voids in Materials Supersaturated with Both Vacancies andInterstitials", J. Nucl. Mater. 45, pp. 41-45, (1973).
69. J. A. Spitznagel, S. Wood and N.J. Doyle, et al., "Helium Partioning toExtended Defects in Dual Ion Bombarded 304 and 316SS", J. Nucl. Mater.103-104, pp. 1463-1468, (1981).
70. B. 0. Hall, "Trap Theory of Helium Partioning at Low Doses", J. Nucl.Mater. 103-104, pp. 1391-1396, (1981).
71. P.R. Okamoto, N.Q. Lam, and H. Wiedersich, "Effects of Defect Trappingand Radiation-Induced Segregation on Void Swelling", in Proc. ofWorkshop on Correlation of Neutron and Charged-Particle Damage,CONF-760673, pp. 111-146, (1973).
72. H. Wiedersich, P. R. Okamoto, and N. Q. Lam, "Solute Segregation DuringIrradiation", in Radiation Effects in Breeder Reactor StructuralMaterials, M. L. Bleiberg and J. W. Bennett, Eds. pp. 801, The
P. Metallurgical Society of AIME, 1977.
73. B. 0. Hall and D. I. Potter, "Microstructural Development During Low DoseIrradiation" in Effects of Radiation on Structural Materials,ASTM-STP-683, J.A. Sprague and D. Kramer, Eds. pp-32-45 (1978)
74. A. C. Hindmarsh, "GEAR: Ordinary Differential Equation System Solver,"UCID-3001 (Rev. 3), December 1974.
75. C. Kittell, Introduction to Solid State Physics, 3r ed. Wiley London,
p. 29, 1968.
76. J.P. Hirth and J. Lothe, Theory of Dislocations, McGraw Hill, New York,p. 762, 1968.
1076

77. R.W. Balluffi, "Vacancy Defect Mobilities and Binding Energies Obtainedfrom Annealing Studies", J. Nucl. Mater., 69-70, pp. 240-263, 1978.
78. N.L. Peterson, "Self Diffusion in Pure Metals", J. Nucl. Mater., 69-70,pp. 3-37, 1978.
79. F.W. Young, Jr., "Interstitial Mobility and Interactions," J. Nucl.Mater., 69-70, pp. 310-330, 1978.
80. D.J. Reed, "A Review of Recent Theoretical Developments in theUnderstanding of the Migration of Helium in Metals and Its Interactionwith Lattice Defects," Rad. Effects, 31, pp. 129-147, 1977.
" 81. M. H. Yoo and J. 0. Stiegler, "Growth Kinetics and Preference Factor ofFrank Loops in Nickel During Electron Irradiation", Phil. Maq. 36, pp.1305-1315, (1977).
82. R. Bullough, B. L. Eyre, and R. C. Perrin, "The Growth and Stability ofVoids in Irradiated Metals", Nucl. Applic. Technol. 9, pp. 346-355,(1970).
83. W. G. Wolfer, "Correlation of Radiation Creep Theory With Experimental* Evidence," J. Nucl. Mater, 90, pp. 175-192 (1979).
84. J. T. Buswell and S. B. Fisher, "Interstitial Loop Growth in ElectronIrradiated Vacuum-Remelted FV448," CEGB-RD-B-N-4564, May 1979.
* 85. ASTM Proposed New Standard Recommended Practice for Neutron RadiationDamage Simulation by Charged Particle Irradiation Part II. PostIrradiation Examination (1975).
86. J. A. Spitznagel, S. Wood, and W. 3. Choyke, "Irradiation Response ofMaterials", Damage Analysis and Fundamental Studies, Quarterly ProgressReport, DOE/0046-April-June 1980, pp. 103-114, August 1980.
* 87. 3.A. Spitznagel, Westinghouse Research and Development Center,Unpulbished Work 1980.
88. J. Greggi, Westinghouse Research and Development Center, PrivateCommunication, 1984.
B9. B.A. Loomis A. Taylor and S.B. Gerber, "Void Swelling of Nb and Nb-l% ZrInduced by 5BNi+ Bombardment," J. Nucl. Mater., 56, pp. 25-37, 1975.
90. L. L. Horton, "Experimental Determination of the Critical Cavity Radiusin Fe-l0% Cr For Ion Irradiation" CONF-840848-6, pp. 6-7, 1984.
0
*i 9
K -:- .z -, .: . ... : : :-; / .. .L . .- _-::. ,- ._ -- . ,:i. :. .i - _.. .i • "

S
12.0 ACKNOWLEDGEMENTS
The performance of this work involved the efforts of many people at ANL and
Westinghouse. The following people are gratefully acknowledged for ther
sincere effort and cooperation.
Argonne National Laboratory
Jack Wallace and Pete Baldo for their effort in (1) constructing and testing
. of the SNICS source, (2) operation of the SNICS source, and (3) operation of
the Tandem accelerator; and their guidance and assistance in setting up and
aligning the beam lines and target chamber.
Pete Billquist and Don Westlake for their efforts in the development, fabri-
cation, and testing of the Nb-hydride target for the SNICS source. This is
the first time this was attempted for niobium, and as a result of their
efforts, the output of the SNICS source was increased from -40 nA for
metallic Nb to 5-10 pA for the Nb-hydride target. Without this break-
through, the Nb irradiation would not have been possible. Ed Ryan for his
i effort in the repair and operation of the Texas Nuclear Accelerator used to
inject helium.
Bob Ercek for his guidance in setting up the electron beam heater which he
P4 designed and constructed. The electron beam heater is an integral part of
these tests in that it permits heating (from ~600 ° to >2000°C) of individual
samples while nearby samples (-9.5 mm away) remain unheated. His design
also facilitates target rotation during the runs while controlling the
temperature. Ed Johanson for his effort in designing and constructing the
equipment used to control the target racking during each irradiation. This
equipment allows the target to be rotated to specified angles and held there
until a specific dose is accumulated. Jim Emerson for his effort in the "
construction, alignment, and vacuum leak checking of beam lines and accelera-
tors. Ray Kentra for his timely effort in fabricating components for the
SNICS source, Tandem and 300-kV accelerators, beam lines, and target chambers.
* 109

Ben Loomis and Stu Gerber for permitting us to utilize their beam line
facility, and for their help and guidance in assembling the entire system.
Beth Beiersdorf for performing the Monte Carlo range and energy deposition
(calculations using Biersack's TRIM program and B. Kestal in guidance in
post-irradiation specimen preparation.
Drs. A. Taylor, R. W. Seigel and R. Poeppel are acknowledged for their
encouragement and administrative support during all stages of the program.
Westinghouse
The efforts of Janet Lauer, Wesley Hughes and Jim Haugh in ion milling of
specimens, R. Reese for stereographic thickness measurements and S. Laciak and
R. Muir for pre-irradiation specimens preparation are acknowledged. Micro-
scopy work done by Dr. J. Greggi is also appreciated. Management support
* given by R. W. Buckman, Dr. S. A. Shiels, M. L. Bleiberg and Dr. S. Wood is
appreciated.
& 110
0

REPORT SUMMARY FORM
I. SECURITY CLASSIFICATION: None
4 2 REPORT NO.: WAESD-TR-85-005
3. PROPRIETARY CLAS: None
4. AVAILABILITY: AESD-WM Library
5. ORIGINATING SOURCE: AESD-L
6. CONTRACT NO. : F49620-83-C-0120
7. FUNDING SOURCE: Air Force Office. of Scientific Research
8. NOTES:
9. AUTHOR(S): R. Bajaj
I 0. TITLE: An Investilation of Irradiation Swelling Mechanisms in Refractory
Metals at High Temperatures
I 1. DATE- - YYMMDO: 850131
12. PAGES, REF.. ILLUS.:_____ ___________
13. DOCUMENT TYPE: Report
14. KEYWORDS: Irradiation, Swelling, Refractory Metals, Niobium
4,15. AESTRACT-- PURPOSE. SCOPE, APPROAQI, RESULTS. CONCLUSIONS, SIGNIFICANCE:
(MAXIMUM: 200 WORDS)
The objective of this work is to achieve an understandinq of the elevatedtemperature swellinq of refractory metals by a close coupling of theoryand experimentation. A theoretical swelling model based on chemical reactionrate formalism was developed, specifically for bcc metals and calculationswere performed for niobium.
A special source was developed at ANL which produced Nb ions of sufficientenergy and flux level to permit self-ion irradiation of Nb. A seriesof irradiations was performed at the ANL Accelerator Facility. Swellingwas observed, at a nominal dose of 50 dpa, between 7000 C and 1200'C witha peak of about 7% at 900°C. Comparison of the data with published workusing Ni ions suggests that the published results may have been influencedby chemical action of the Ni atoms.
Comparison of data with the theoretical model suggests a strong influence
. of oxygen.

DOCUMENT DISTRIBUTION LIST
INTERNAL AESD EXTERNAL AESD
FULL RSF COPY NO. OF COPYNAME. DEPT. LOCATI NO. NAME AND ADDRESS COPIES NO-*
R. Bajaj Tech. L 5 Major Henry Pugh, Jr. 16S. Shiels Tech. L 1 AFOSR/NP
Directorate of Physical &M. Bleiberq Tech. L 3 Geophysical ScienceR. Buckman Tech. L 1 Building 410
Bolling AFB, DC 20332A. Boltax Tech. L 1
R. Morqan Nuc Pro WM 1B.O. Hall WR&D5
D. French Mrktg. WM 1
Library WM 3 G.R. Fenske 5
Argonne National Lab .-
9700 S. Cass AvenueArgonne, IL
6
1^ICATZ OF COPIES OF FULL TEYXT
* -7. . .Ye F C.7.1 .:NLYr
Z . ------ 7-'IJTICN. IF~ AP"DL!CAELE-" -' -I-- -
-..

* FILMED
* 7-85
* DTICJaNidX J Ns 1ANH AAU'j IV (I IH I4(f 041 H