Embed Size (px)
Citation preview

S NA S U A S USDA NASS
l California California Agricultural A Agricultural
sS t cStatistics
2009 Crop Year
December 2010


Table of Contents CHAPTER PAGE Agricultural Overview .............................................................................................. 1 Field Crops ............................................................................................................. 12 Floriculture ............................................................................................................ 35 Fruit and Nut Crops ............................................................................................... 38 Livestock and Dairy ................................................................................................ 64 Vegetables and Melons ......................................................................................... 79 County Agricultural Commissioners ...................................................................... 90 To Subscribe .......................................................................................................... 92
Compiled by:
USDA’s National Agricultural Statistics Service, California Field Office
650 Capitol Mall, Suite 6-100 P.O. Box 1258
Sacramento, California 95812-1258 Phone: (916) 498-5161 Fax: (916) 498-5186
Vic Tolomeo, Director of California Agricultural Statistics
Kelly Krug and Sarah Hoffman, Deputy Directors of California Agricultural Statistics
Cooperating with the California Department of Food and Agriculture
Cover photo by D. Lance Carter, USDA, Farm Service Agency (FSA)
December 2010
Updated PDF Published May 4, 2011

San Francisco
San Mateo
Sierra
Siskiyou Modoc
Humboldt
Trinity Shasta
Lassen
Del Norte
Mendocino
Plumas
Butte Glenn
Colusa Lake
Tehama
Nevada
Yuba
Sutter
Placer
Yolo
Napa Sonoma
El Dorado
Alpine
Marin Contra Costa
Solano
Amador Sacra- mento
Alameda
Tuolumne
Calaveras
San Joaquin
Mono
Inyo
Mariposa Stanislaus
Santa Clara
San Bernardino
Santa Cruz
Kern
Merced
Fresno
Kings
Madera
San Benito
Monterey Tulare
San Luis Obispo
Santa Barbara
Ventura
Los Angeles
Orange Riverside
San Diego Imperial
30
40
51
80
20
10
50
60
10 = NORTH COAST
50 = SACRAMENTO VALLEY 51 = SAN JOAQUIN VALLEY 60 = SIERRA NEVADA
40 = CENTRAL COAST 30 = NORTHEAST MOUNTAIN 20 = NORTH MOUNTAIN
80 = SOUTHERN CALIFORNIA
California Agricultural Statistics Districts by County

USDA, NASS, California Field Office 1 California Agricultural Statistics, 2009
Agricultural Overview
alifornia agriculture experienced a 9 percent drop in the sales value of its products for 2009. The state’s 81,500 farms and ranches received $34.8 billion for their output
last year, down from the all-time high of $38.4 billion reached during 2008. The state’s agricultural sales for 2009 were the third highest recorded, behind only 2008 and 2007. California’s decline in revenue was led by the dairy sector. Dairy producers received $4.54 billion for their milk production in 2009, down 34 percent from 2008, and down 38 percent from the 2007 record high of $7.34 billion. Herd size decreased 3 percent from 2008. Milk production from the state’s dairy farms decreased 4 percent. Milk prices received by producers continued to fall from $18.05 in 2007, to $16.82 in 2008, to $11.49 per hundred pounds of milk sold in 2009. California produced 20.9 percent of the nation’s milk supply last year. Milk prices remained low for the first 7 months before beginning to recover. California remained the number one state in cash farm receipts in 2009, with its $34.8 billion in revenue representing 12.3 percent of the U.S. total. The state accounted for 16.5 percent of national receipts for crops, and 6.5 percent of the U.S. revenue for livestock and livestock products. California’s agricultural abundance includes more than 400 commodities. The state produces nearly half of U.S.-grown fruits, nuts, and vegetables. Across the nation, U.S. consumers regularly purchase several crops produced solely in California.
Top 5 Agricultural States in Cash Receipts, 2009
State Rank Total Value
Billion Dollars
California 1 34.8 Iowa 2 21.0 Texas 3 16.6 Nebraska 4 15.3 Illinois 5 14.5
Notable Increases in California Cash Receipts: Kiwifruit ............................................................................ 79% Blueberries ......................................................................... 46% Safflower ........................................................................... 44% Plums and prunes ............................................................... 36% Walnuts .............................................................................. 32% Beans, dry .......................................................................... 26% Nectarines .......................................................................... 24% Aquaculture ....................................................................... 22% Pecans ................................................................................ 20% Notable Decreases in California Cash Receipts: Wheat ............................................................................... -29% Olives ............................................................................... -31% Other berries .................................................................... -31% Milk, wholesale ............................................................... -34% Avocados ......................................................................... -36% Honey .............................................................................. -36% Wool ................................................................................ -37% Misc. fruits & nuts ........................................................... -38% Oats .................................................................................. -38% Hay .................................................................................. -44% Cotton .............................................................................. -52%
Crop and Livestock Commodities in which California Leads the Nation*
Almonds Escarole/Endive Limes Plums Apricots Figs Melons, Cantaloupe Plums, Dried Artichokes Flowers, Bulbs Melons, Honeydew Pluots Asparagus Flowers, Cut Milk Pomegranates Avocados Flowers, Potted Plants Milk Goats Raspberries Beans, Dry Lima Garlic Nectarines Rice, Sweet Bedding/Garden Plants Grapes, Raisins Nursery, Bedding Plants Safflower Broccoli Grapes, Table Nursery Crops Seed, Alfalfa Brussels Sprouts Grapes, Wine Olives Seed, Bermuda Grass Cabbage, Chinese Greens, Mustard Onions, Dry Seed, Ladino Clover Cabbage, F.M. Hay, Alfalfa Onions, Green Seed, Vegetable and Flower Carrots Herbs Parsley Spinach Cauliflower Kale Peaches, Clingstone Strawberries Celery Kiwifruit Peaches, Freestone Tangelos Chicory Kumquats Pears, Bartlett Tangerines Cotton, American Pima Lemons Peppers, Bell Tomatoes, Processing Daikon Lettuce, Head Persimmons Vegetables, Greenhouse Dates Lettuce, Leaf Pigeons and Squabs Vegetables, Oriental Eggplant Lettuce, Romaine Pistachios Walnuts
Wild Rice
*California is the sole producer (99 percent or more) of the commodities in bold.
C

USDA, NASS, California Field Office 2 California Agricultural Statistics, 2009
Land Values/Cash Rents In 2009, the average value of farm real estate increased $160 per acre to $6,600 per acre. Farm real estate increased over the past year in California, whereas all types of farmland showed modest decreases across the United States. Irrigated cropland valued at $11,600 per acre and non-irrigated cropland valued at $3,400 per acre both decreased 6 and 5 percent in value from the previous year. All cropland was valued at $9,480 per acre and decreased $400 per acre from 2008. Pastureland was valued at $2,900 per acre for 2009, down 4 percent from the previous year. Because crop and pasture land values decreased from the previous year, so too did their respective rental rates. Irrigated cropland rental rates were valued at $350 per acre, a decrease of $10 per acre from the previous year. Similarly, non-irrigated land rental rates decreased 5 percent to $56 per acre. All cropland was valued at $274 per acre. Pastureland was valued at $14 per acre, a decrease of 7 percent from the previous year.
Farm Facts In 2009, 81,500 farms operated in California, less than 4 percent of the national total. Over 23 percent of California farms produced commodity sales totaling over $100,000, compared with 17 percent for the U.S. as a whole. During 2009, California lands devoted to farming and ranching totaled 25.4 million acres, unchanged from 2008. Both the California and U.S. average farm size remained steady from the previous year at 312 and 418 acres, respectively.
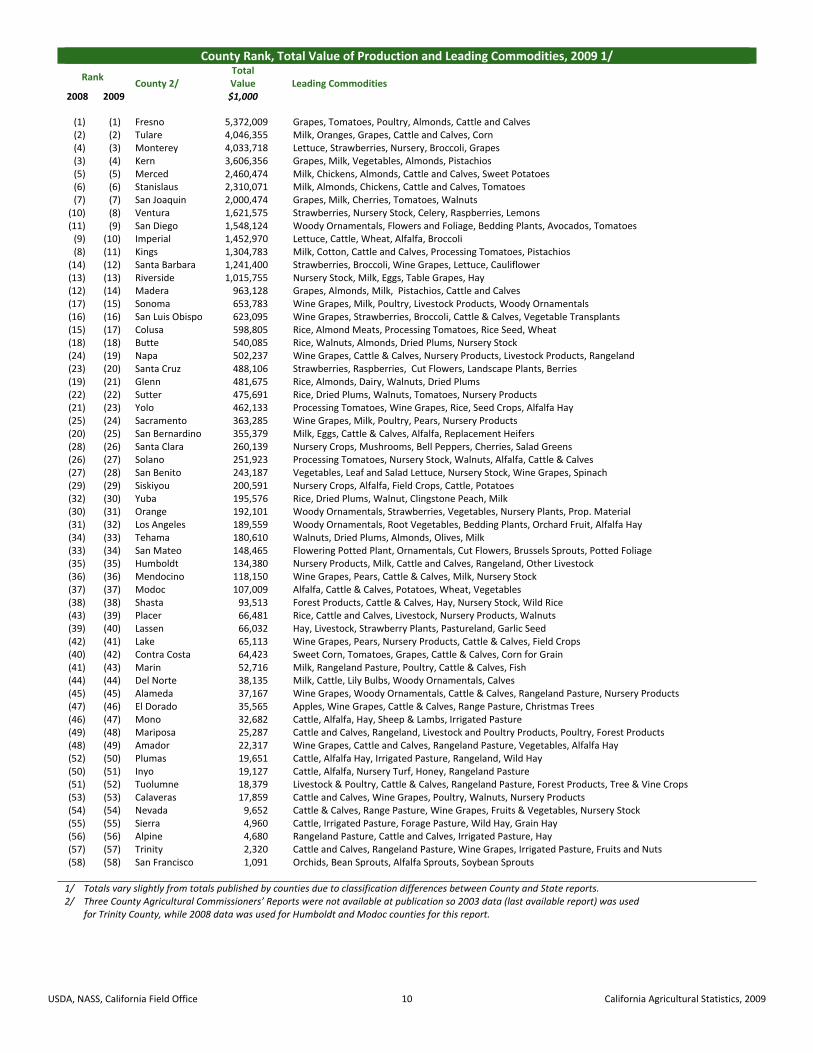
Leading Counties California is home to some of the most productive counties in the nation. According to the 2007 Census of Agriculture’s ranking of market value of agricultural products sold, nine of the Nation’s top 10 producing counties are in California. The sales of these nine counties accounted for 6.6 percent of the Nation’s total sales value. California's counties reported a decrease of 8.5 percent in the value of their agricultural production for 2009. Four counties reported agricultural production exceeding $3.0 billion each and thirteen counties reported a value of production in excess of $1.0 billion. Fresno continued as the leading county with an agricultural production value of $5.37 billion, a decrease of 4.7 percent from the 2008 value. Tulare County was second in value of production with $4.05 billion, a 19.4 percent decrease from 2008. Monterey had an increase of 5.4 percent in production to $4.03 billion, moving the county to third in value. Kern’s decrease of 10.6 percent dropped their value of agricultural production to $3.61 billion, fourth in value.
Top Commodities California’s top 20 crop and livestock commodities accounted for more than $27.2 billion in value for 2009. Eight commodities exceeded $1.00 billion in value for 2009. Eleven of the 20 commodities registered an increase in value from the previous year. The same was not true for California’s leading commodity, Milk and Cream, which decreased by over $2 billion in value, due to lower production and lower prices. Final grower returns could change the sales value for hay, berries and other commodities, resulting in an updated dollar amount in next year’s report.
Top 20 Commodities for 2007‐2009
Commodity Value and Rank
2007 2008 2009 $1,000
Milk and Cream 7,336,603 (1) 6,924,121 (1) 4,537,171 (1)Grapes, All 3,079,870 (2) 2,923,015 (2) 3,267,848 (2)Nursery Products 2,938,450 (3) 2,726,160 (3) 2,848,500 (3)Almonds (shelled) 2,401,875 (4) 2,343,200 (4) 2,293,500 (4)Lettuce, All 1,697,278 (6) 1,580,831 (7) 1,725,799 (5)Berries, All Strawberries 1,410,652 (7) 1,578,175 (8) 1,725,232 (6)Cattle and Calves 1,784,101 (5) 1,884,660 (5) 1,676,373 (7)Tomatoes, All 1,223,435 (9) 1,317,321 (9) 1,509,647 (8)Flowers and Foliage 1,036,266 (10) 1,060,489 (10) 935,195 (9)Rice 455,132 (17) 826,143 (11) 928,173 (10)Hay, Alfalfa and Other 1,405,800 (8) 1,797,032 (6) 927,496 (11)Walnuts 751,120 (11) 558,080 (17) 738,530 (12)Broccoli 626,325 (14) 663,319 (13) 698,376 (13)Chickens, All 713,218 (12) 724,667 (12) 691,518 (14)Oranges, All 373,077 (19) 558,974 (16) 655,820 (15)Pistachio 586,560 (15) 569,900 (15) 592,850 (16)Carrots, All 461,976 (16) 517,663 (18) 499,766 (17)Lemons 358,402 (20) 479,531 (19) 364,248 (18)Celery 395,667 (18) 354,979 (21) 349,918 (19)Peaches 331,840 (23) 294,549 (24) 326,331 (20)
Top 10 Agricultural Counties
County
Total Value and Rank
Leading Commodities 2008 2009
$1,000 Fresno 5,644,541 (1) 5,372,009 (1) Grapes, Tomatoes, Poultry, Almonds, Cattle and CalvesTulare 5,017,955 (2) 4,046,355 (2) Milk, Oranges, Grapes, Cattle and Calves, Corn Monterey 3,826,791 (4) 4,033,718 (3) Lettuce, Strawberries, Nursery, Broccoli, Grapes Kern 4,032,830 (3) 3,606,356 (4) Grapes, Milk, Vegetables, Almonds, Pistachios Merced 2,999,698 (5) 2,460,474 (5) Milk, Chickens, Almonds, Cattle and Calves, Sweet PotatoesStanislaus 2,473,842 (6) 2,310,071 (6) Milk, Almonds, Chickens, Cattle and Calves, TomatoesSan Joaquin 2,129,793 (7) 2,000,474 (7) Grapes, Milk, Cherries, Tomatoes, Walnuts Ventura 1,611,089 (10) 1,621,575 (8) Strawberries, Nursery Stock, Celery, Raspberries, LemonsSan Diego 1,552,103 (11) 1,548,124 (9) Woody Ornamentals, Flowers & Foliage, Bedding Plants, Avocados, TomatoesImperial 1,684,522 (9) 1,452,970 (10) Lettuce, Cattle, Wheat, Alfalfa, Broccoli
Source: Summary of California County Agricultural Commissioners’ Reports, 2008‐2009.

USDA, NASS, California Field Office 3 California Agricultural Statistics, 2009
Weather Highlights for 2009 January began with cool and foggy weather over much of the interior. Earlier in the month some isolated shower activity occurred along the extreme northern coast and across the far northern counties while Southern California was basked in sunny and unseasonably warm weather. This was followed by a warm front passing through the north coast bringing about rain. The latter part of the month going into early February was dominated by unseasonably warm and dry conditions. Early plantings were progressing well from the recent wet weather while winter wheat and grains were growing well due to warm conditions. For the remainder of the month, the state experienced unsettled weather as a series of low pressure systems brought significant rainfall amounts and snow to northern parts of the state. Even though temperatures across the state were very mild, rainfall continued in the northern two-thirds of the state throughout the first half of March while Southern California remained dry. The remnant of the month was characterized by fluctuations between low pressure systems which brought scattered showers and high pressure systems which brought mild temperatures. A series of high pressure ridges brought clear skies and mild temperatures to California in the month of April and mostly throughout the month of May, resulting in above seasonal normal temperatures across the state throughout Memorial Day; however amid these high pressures were moderate precipitation, gusty winds, and cooler temperatures across the state. The heaviest rainfall was focused across the central portion of the state, from the coast to the Sierra Nevada Mountains. High winds throughout much of the Sacramento Valley hampered orchard spraying and bee pollination. A strong offshore flow developed over Southern California, resulting in ideal wildfire conditions along the Santa Barbara region. June began with some excitements. First, a trough of low pressure slowly moving across the northern part of the state causing unusual cooling and due to this, some locations in the valley broke previous rainfall records. A series of thunderstorms then aligned across the state to create an unusual event. Brief heavy rain, small-sized hail, and frequent dangerous lightning dominated the sky in the path of these thunderstorms. There were nearly 2,800 lightning strikes recorded on the very first week of the month just in the northern part of the state. Most of California stayed relatively cool during the month of June with temperatures in the valley and foothill locations 10 degrees below normal. By the end of the month, temperatures rose drastically through most of the state. Due to rain, wheat harvest slowed and some fruits were lost to splitting. Typical weather was observed for the month of July. Strong high pressure settled over the Desert Southwest, resulting in a common summer time pattern with very hot temperatures observed across most of California. Fire hazard remained high in some areas due to the extremely dry conditions.
The month of August began with strong high pressure over the entire southwestern portion of the United States, including California, bringing very hot weather to the Golden State. An upper level low pressure system then approached the Central California coast resulting in an increased onshore flow which cooled off many coastal areas as well as the Sacramento-San Joaquin River Delta. This low also sparked a few showers across the mountains, especially across the Northern Sierra Nevada range. It even managed to spread a few sprinkles down to the Northern Sacramento Valley. Although this pattern continued throughout the month, seasonal weather dominated the month. Some cotton fields received their last watering and were treated for aphid as more bolls opened. Southern California remained under the influence of strong high pressure which brought hotter than normal temperatures to that region at the start of September. The high pressure rebuilt over the entire state as the month progressed and unseasonably hot temperatures were observed towards the end of the month. Rangeland and dry-land pasture forage conditions, already critically dry, continued to deteriorate. Fire danger was high to extreme. The month of October was dominated by low pressure systems. Due to these systems, the state saw a significant amount of precipitation and strong winds. Three weeks into the month, rainfall records were noted across central and northern California. Total rainfall amounts varied from 2 to 6 inches in the valley, and 4 to 8 inches in the foothills and higher elevations. Along the coast, rainfall totals were estimated to be 3 to 8 inches. Minor flooding due to heavy rainfall was documented on highways, small streams and creeks. Sustained winds of 25 to 35 mph, with gusts to around 55 mph, were recorded in portions of the Sacramento and Central Valley and along the coast. Gusts over 65 mph were recorded in the higher elevations. Property damage, downed trees and branches were documented. Rainfall interrupted harvest and field preparation in many areas. The wind and rain caused lodging in some rice fields. Rain fell on some stacked alfalfa. Corn plants were pushed over by the wind and rain, but were still harvestable. High pressure systems were common over most of California during the month of November. Southern California remained dry except for some spotty coastal drizzle. Towards the end of the month, a cold front moved across the northern portion of the state, spreading rain showers across the valley and snow in the northern mountains. December started with temperatures across the Sacramento and San Joaquin Valleys falling to record levels. Morning lows in the Northern Sacramento Valley fell to the teens. Snowfall across the Sierra Nevada Mountains was impressive, with over 2 feet falling at the higher elevations. Southern California enjoyed sunny and unseasonably warm weather as abundant sunshine warmed the Southland. Wheat, oats, and barley continue to be planted, although field work was slowed due to rain.
USDA, NASS, California Field Office 4 California Agricultural Statistics, 2009
Cash Income by Commodity Groups, 2007‐2009 1/
Source of Income 2007 2008 2009
Source of Income 2007 2008 2009
$1,000 $1,000
FIELD CROPS VEGETABLE CROPS
Barley 8,888 16,543 13,487 Artichokes 58,080 54,683 63,279
Beans, Dry 57,420 48,649 61,232 Asparagus 70,180 52,625 52,000
Corn for Grain 80,640 150,428 111,536 Beans, Snap, Fresh 48,338 40,499 48,025
Cotton Lint 580,357 584,054 258,545 Broccoli, All 626,325 663,319 698,376
Cottonseed 84,483 54,342 45,278 Cabbage 80,349 75,686 74,070
Grain, Sorghum 3,887 3,435 2/ Carrots, All 461,976 517,663 499,766
Hay, All 795,621 1,546,618 864,163 Cauliflower 200,045 231,789 255,766
Oats 2,647 8,253 5,076 Celery 395,667 354,979 349,918
Oil Crops 25,541 39,823 56,268 Corn, Sweet 107,072 94,022 111,154
Potatoes (Excl. Sweet) 146,399 189,204 206,307 Cucumbers, All 36,840 40,846 41,693
Potatoes, Sweet 80,864 132,726 158,549 Garlic 162,012 176,715 191,330
Rice 455,132 826,143 928,173 Lettuce 1,697,278 1,580,831 1,725,799
Sugar Beets 60,517 47,130 39,693 Melons, Cantaloupe 148,590 179,010 166,310
Wheat 161,267 327,126 230,752 Melons, Honeydew 47,695 37,604 38,170
Other Seed Crops 140,657 208,230 166,900 Melons, Watermelon 73,427 104,209 86,106
Other Field Crops 495,672 664,560 444,761 Mushrooms, Agaricus 188,605 195,727 202,608
Onions 189,159 164,559 151,675
TOTAL 3,179,992 4,847,264 3,590,720 Peppers, Chili 61,884 44,041 50,409
% of Gross Cash Income 8.2% 11 8% 9.5% Peppers, Green 227,758 290,692 228,472
Pumpkins 12,852 18,550 20,558
FRUIT AND NUT CROPS Spinach, All 135,821 148,749 175,265
Almonds 2,401,875 2,343,200 2,293,500 Squash 29,082 33,500 32,160
Apples 74,661 76,509 66,411 Tomatoes, Fresh 374,070 388,112 363,312
Apricots 34,878 34,404 36,935 Tomatoes, Processing 849,365 929,209 1,146,335
Avocados 253,581 321,709 207,406 Other Vegetable Crops 1,037,516 1,562,240 1,080,522
Berries, Other 278,449 335,925 387,563
Berries, Strawberries 1,410,652 1,578,175 1,725,232 TOTAL 7,319,986 7,979,859 7,853,078
Cherries 155,016 194,534 185,265 % of Gross Cash Income 18.8 19.4 20.8
Dates 37,459 28,972 28,194
Figs 19,145 25,954 30,465 LIVESTOCK, POULTRY AND PRODUCTS
Grapefruit 63,003 58,190 67,807 Aquaculture 90,374 52,813 64,344
Grapes 3,079,870 2,923,015 3,267,848 Cattle and Calves 1,784,101 1,884,660 1,676,373
Kiwifruit 22,517 19,545 35,048 Chickens, All 713,218 724,667 691,518
Lemons 358,402 479,531 364,248 Eggs 346,426 440,438 319,771
Nectarines 89,039 107,675 133,770 Hogs 31,662 33,217 24,771
Olives 86,693 46,587 32,209 Honey 14,144 25,520 16,284
Oranges, Navel 234,986 412,623 497,633 Milk and Cream 7,336,603 6,924,121 4,537,171
and Miscellaneous Sheep and Lambs 35,443 30,717 36,705
Oranges, Valencia 138,091 146,351 158,187 Turkeys 211,669 252,416 202,800
Peaches, Clingstone 152,665 147,857 158,452 Wool and Mohair 2,789 3,702 2,355
Peaches, Freestone 179,175 146,692 167,879 Other Livestock/Poultry 252,404 251,807 241,914
Pears 82,691 105,839 93,329
Pecans 7,832 4,913 5,919 TOTAL 10,818,833 10,624,078 7,814,006
Pistachios 586,560 569,900 592,850 % of Gross Cash Income 27.8 25.9 20.7
Plums 101,077 56,960 57,568
Plums, Dried 240,921 128,858 194,355 TOTAL CASH INCOME FROM MARKETINGS
Tangerines 84,789 142,797 159,094 TOTAL 36,385,579 38,407,408 34,840,648
Walnuts 751,120 558,080 738,530
Other Fruits and Nuts 160,357 164,061 104,851 FARM RELATED INCOME
TOTAL 2,549,883 2,667,312 2,953,790
TOTAL 11,085,504 11,158,856 11,790,548 % of Gross Cash Income 6.5 6.5 7 8
% of Gross Cash Income 28.5% 27 2% 31.2%
GROSS CASH INCOME FROM FARMING
CHRISTMAS TREES TOTAL 38,935,462 41,074,720 37,794,438
TOTAL 6,547 10,701 8,600
% of Gross Cash Income 1/ Includes value of home consumption, value of inventory
adjustments, machine hire and custom work, forest products sold,
NURSERY, GREENHOUSE AND FLORICULTURE rental value of farm dwelling, government payments, and other
TOTAL 3,974,716 3,786,649 3,783,695 miscellaneous farm income.
% of Gross Cash Income 10.2% 9.2 10 0 2/ Data not available for 2009 at time of publication.
Source: USDA’s Economic Research Service
USDA, NASS, California Field Office 5 California Agricultural Statistics, 2009
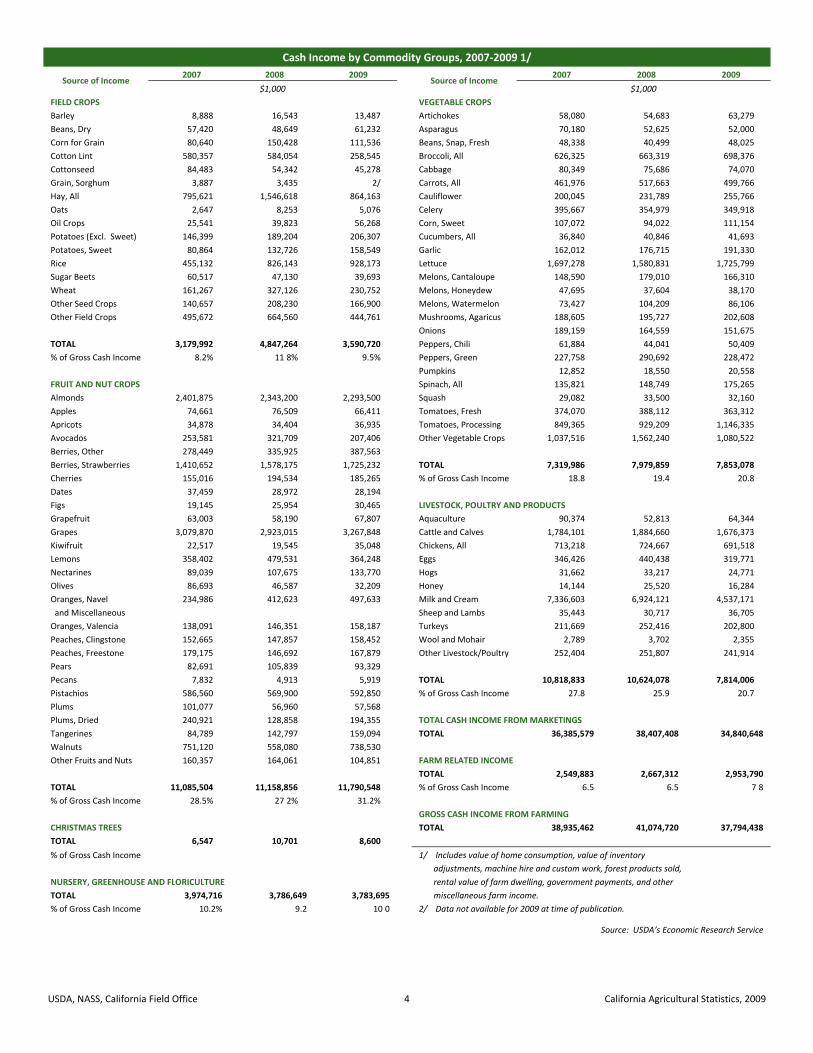
Farm Income Indicators, 2005‐2009 1/
Item 2005 2006 2007 2008 2009
$1,000
Value of Crop Production 23,618,255 23,868,539 25,540,905 27,539,035 27,117,995 Food grains 449,669 485,381 616,398 1,153,268 1,158,925 Feed crops 758,791 682,550 891,684 1,725,277 994,262 Cotton 842,289 581,682 664,841 638,396 303,823 Oil crops 18,673 20,708 25,541 39,823 56,268 Fruits and tree nuts 10,904,790 10,280,120 11,081,509 11,155,927 11,785,997 Vegetables 6,420,042 7,087,497 7,412,068 8,151,783 8,072,007 All other crops 4,465,359 4,705,527 4,874,705 4,918,857 4,655,359 Home consumption 18,388 32,310 20,270 26,516 24,399 Value of inventory adjustment 2/ (259,746) (7,236) (46,111) (270,812) 66,955
Value of Livestock Production 8,512,145 7,669,011 10,789,257 10,416,570 7,728,437 Meat animals 1,836,636 1,751,489 1,851,206 1,948,594 1,737,849 Dairy products 5,223,062 4,492,229 7,336,603 6,924,121 4,537,171 Poultry and eggs 1,150,902 1,108,094 1,346,579 1,483,515 1,284,489 Miscellaneous livestock 227,462 231,024 284,445 267,848 254,497 Home consumption 15,735 32,142 23,625 19,483 15,164 Value of inventory adjustment 2/ 58,348 54,033 (53,201) (226,991) (100,733)
Revenues from Services and Forestry 2,431,626 2,819,157 2,605,300 3,119,115 2,948,006 Machine hire and custom work 465,008 631,292 329,810 786,694 794,927 Forest products sold 8,012 9,380 10,250 12,488 9,500 Other farm income 697,948 853,087 894,474 878,357 658,670 Gross imputed rental value of farm dwellings 1,260,658 1,325,398 1,370,766 1,441,576 1,484,909
VALUE OF AGRICULTURAL SECTOR PRODUCTION 34,562,026 34,356,707 38,935,462 41,074,720 37,794,438
less: Purchased Inputs 16,071,784 17,647,372 18,610,451 21,840,630 18,995,821
Farm Origin 4,559,721 4,828,840 5,617,593 7,090,404 5,664,565 Feed purchased 2,860,001 3,049,998 3,870,000 5,080,001 4,009,999 Livestock and poultry purchased 709,720 708,845 677,596 630,402 674,566 Seed purchased 990,000 1,069,997 1,069,997 1,380,001 980,000
Manufactured Inputs 3,656,090 4,068,462 4,099,864 4,828,348 4,172,713 Fertilizers and lime 1,029,999 1,170,000 1,110,001 1,500,000 1,239,999 Pesticides 1,160,000 1,240,001 1,160,001 1,340,001 1,280,000 Petroleum fuel and oils 923,168 1,017,252 1,159,345 1,308,318 904,079 Electricity 542,923 641,209 670,517 680,029 748,635
Other Purchased Inputs 7,855,973 8,750,070 8,892,994 9,921,878 9,158,543 Repair and maintenance of capital items 966,918 1,034,308 1,177,823 1,350,360 1,025,961 Machine hire and custom work 700,320 663,925 637,761 821,712 638,037 Marketing, storage, and transportation expenses 2,264,789 2,308,707 2,111,338 1,973,120 2,169,680 Contract labor 1,564,550 1,407,974 2,043,677 2,340,980 1,737,422 Miscellaneous expenses 2,359,396 3,335,156 2,922,395 3,435,706 3,587,443
plus: Net Government Transactions (32,515) (295,811) (438,089) (523,303) (368,140) + Direct Government payments 703,629 530,177 478,229 435,144 568,427 ‐ Motor vehicle registration and licensing fees 56,094 65,989 56,317 58,447 66,568 ‐ Property taxes 680,050 759,999 860,001 900,000 869,999
Gross Value Added 18,457,728 16,413,524 19,886,922 18,710,787 18,430,477
less: Capital Consumption 1,299,990 1,347,022 1,393,875 1,493,530 1,565,188
Net Value Added 17,157,738 15,066,502 18,493,047 17,217,256 16,865,289
less: Payments to Stakeholders 7,305,180 7,330,394 6,778,173 7,450,499 8,083,223 Employee compensation (total hired labor) 5,530,307 5,461,928 4,975,901 5,523,744 6,113,374 Net rent received by non‐operator landlords 498,995 419,490 282,409 366,506 432,696 Real estate and non‐real estate interest 1,275,878 1,448,976 1,519,863 1,560,249 1,537,153
NET FARM INCOME 9,852,558 7,736,108 11,714,874 9,766,757 8,782,066 1/ Value of agricultural sector production is the gross value of commodities and services produced within a year. Net value‐added is the sector's contribution to the National economy and is the sum of the income from production earned by all factors‐of‐production, regardless of ownership Net farm income is the farm operators' share of. income from the sector's production activities. The concept presented is consistent with that employed by the Organization for Economic Cooperation and Development 2/ A positive value of inventory change represents current‐year production not sold by December 31. A negative value is an offset to production from prior years included in current‐year sales. Source: USDA's Economic Research Service

USDA, NASS, California Field Office 6 California Agricultural Statistics, 2009
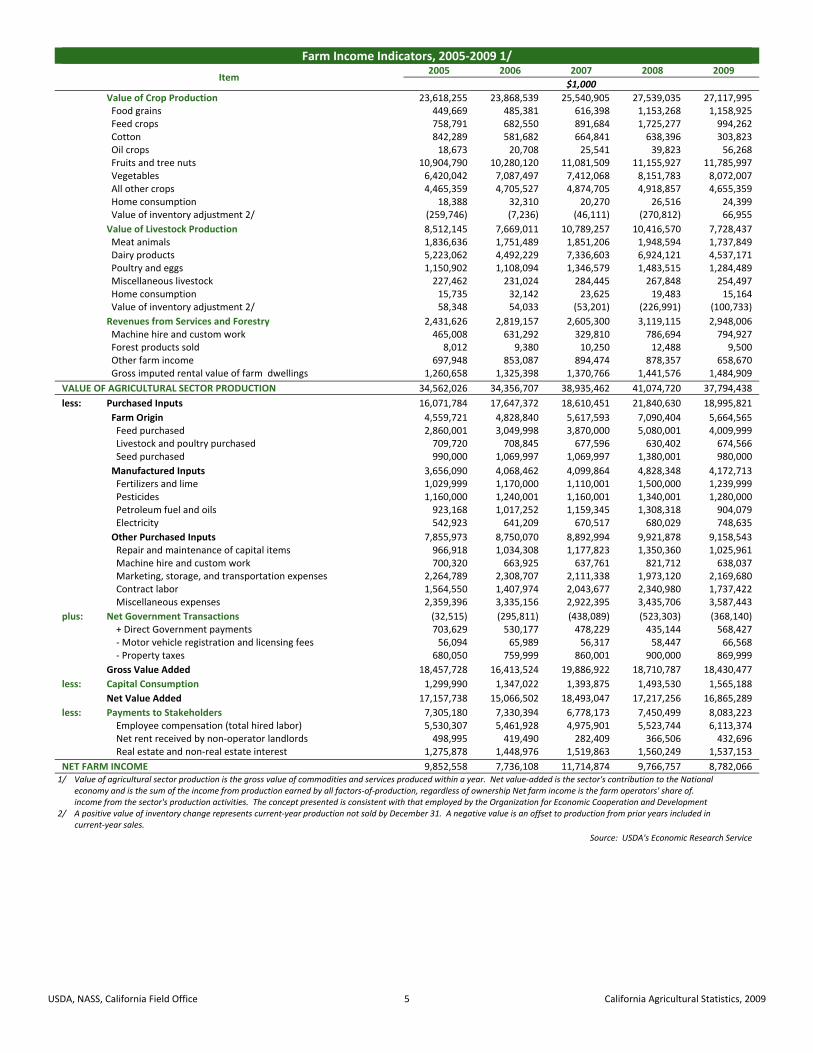
Commodity Rank, Acreage, Production, Value and Leading Producing Counties, 2009
Commodity
U.S. Rank 1/
CA Share of U.S. Prod.
1/ Area
Harvested Short Tons (2,000 Lbs.) Total Value 2/
California Rank 3/
Harvest Season Leading Counties 4/
2008 2009
Number Percent 1,000 Acres 1,000 Tons $1,000 Number
VEGETABLE AND MELON CROPS TOTAL VALUE ‐‐ $7,840,491,000,000
Artichokes 4/ 1 99 8.6 55.9 63,279 49 48 Continuous Monterey, Riverside, Imperial, San Mateo, San Benito
Asparagus 1 44 12.5 20.0 52,000 51 54 Jan. 1‐Nov. 30 San Joaquin, Monterey, Fresno, San Benito, Imperial
Beans, Fresh Market Snap
3 14 6.3 34.6 48,025 56 55 June 1‐Dec. 31 Stanislaus, Riverside, Fresno, San Diego, Santa Clara
Broccoli 1 94 115.0 920.0 698,376 13 13 Continuous Monterey, Santa Barbara, Imperial, San Luis Obispo, Fresno
Cabbage, Fresh Market
1 22 12.5 246.9 74,070 45 45 Continuous Monterey, Ventura, San Luis Obispo, Imperial, Santa Barbara
Carrots, All 1 69 62.0 993.8 499,766 17 17 Continuous Imperial, Monterey, Fresno, Riverside, Los Angeles
Cauliflower 1 89 31.4 290.4 255,766 28 25 Jan. 20‐Dec. 15 Monterey, Santa Barbara, Imperial, San Luis Obispo, Riverside
Celery 1 95 26.6 931.5 349,918 20 18 Continuous Monterey, Ventura, Santa Barbara, San Luis Obispo, Imperial
Corn, Fresh Market Sweet
2 16 24.9 224.1 111,154 44 41 May 1‐Dec. 1 Imperial, Fresno, San Joaquin, Contra Costa, Riverside
Cucumbers, Fresh Market
5 5 3.2 23.2 11,693 69 68 Apr. 1‐Nov. 30 Ventura, San Diego, San Joaquin, Tulare, Fresno
Garlic 4/ 1 95 22.0 187.0 191,330 35 32 Apr. 1‐Sept. 15 Fresno, Kern, Santa Clara, San Benito, Mono
Lettuce, Head 1 79 114.0 2,109.0 902,652 ‐‐‐ ‐‐‐ Jan. 1‐Nov. 30 Monterey, Imperial, Fresno, Santa Barbara, San Luis Obispo
Lettuce, Leaf 1 85 40.5 475.9 337,889 ‐‐‐ ‐‐‐ Continuous Monterey, Fresno, Imperial, Santa Barbara, San Luis Obispo
Lettuce, Romaine 1 79 63.0 1,023.8 485,258 ‐‐‐ ‐‐‐ Continuous Monterey, San Benito, Riverside, Ventura
Lettuce, All ‐‐‐ ‐‐‐ 217.5 3,608.7 1,725,799 7 5 ‐‐‐ Monterey, Imperial, Fresno, Santa Barbara, San Benito
Melons, Cantaloupe 1 59 38.4 585.6 166,310 33 36 June 1‐Dec. 15 Fresno, Imperial, Merced, Stanislaus, Kern
Melons, Honeydew 1 73 12.8 134.4 38,170 58 57 June 1‐Dec. 15 Fresno, Sutter, Imperial, Riverside, Stanislaus
Melons, Watermelon 2 17 12.4 347.2 86,106 43 43 June 1‐Oct. 25 Fresno, Riverside, San Joaquin, Kern, Imperial
Mushroom, Agaricus 2 15 0.5 62.0 202,599 30 29 Continuous Monterey, Santa Clara, Ventura, San Diego, Fresno
Onions, All 1 27 43.8 1,010.2 184,819 34 34 May 1‐Oct. 31 Fresno, Imperial, Kern, Los Angeles, San Joaquin
Peppers, Bell 1 49 20.5 379.8 228,472 ‐‐‐ ‐‐‐ Apr. 1‐Oct. 31 Riverside, Ventura, Kern, San Joaquin, San Benito
Peppers, Chili 2 42 5.8 101.6 50,409 ‐‐‐ ‐‐‐ May 1‐Nov. 30 Santa Clara, San Benito, Fresno
Peppers, All ‐‐‐ ‐‐‐ 26.3 481.4 278,881 22 23 ‐‐‐ ‐‐‐
Pumpkins 2 16 5.1 73.9 20,558 68 66 Sept. 1‐Oct. 31 San Joaquin, San Mateo, Ventura, Stanislaus, Santa Clara
Spinach, Fresh Market
1 71 28.5 220.9 167,884 ‐‐‐ ‐‐‐ Continuous Monterey
Spinach, Processing 1 73 7.5 62.5 7,381 ‐‐‐ ‐‐‐ Continuous Monterey
Spinach, All ‐‐‐ ‐‐‐ 36.0 283.4 175,265 38 35 ‐‐‐ Monterey, San Benito, Imperial, Ventura, Stanislaus
Squash 2 17 5.8 60.9 32,160 60 62 June 1‐Aug. 31 Fresno, Santa Barbara, Stanislaus, Monterey, San Diego
Tomatoes, Fresh 2 32 36.0 522.0 363,312 ‐‐‐ ‐‐‐ May 15‐Jan. 31 Fresno, San Diego, San Joaquin, Merced, Stanislaus
Tomatoes, Processing 1 95 308.0 13,314.0 1,146,335 ‐‐‐ ‐‐‐ June 20‐Nov. 10 Fresno, Yolo, San Joaquin, Kings, Stanislaus
Tomatoes, All ‐‐‐ ‐‐‐ 344.0 13,836.0 1,509,647 9 8 ‐‐‐ ‐‐‐
Other Vegetable & Melons
‐‐‐ ‐‐‐ ‐‐‐ ‐‐‐ 1,064,800 ‐‐‐ ‐‐‐ ‐‐‐ ‐‐‐
Continued on Next Page

USDA, NASS, California Field Office 7 California Agricultural Statistics, 2009
Commodity Rank, Acreage, Production, Value and Leading Producing Counties, 2009
Commodity
U.S. Rank 1/
CA Share of U.S. Prod. 1/
Area Harvested
Short Tons (2,000 Lbs.) Total Value 2/
California Rank 3/
Harvest Season Leading Counties 4/
2008 2009
Number Percent 1,000 Acres 1,000 Tons $1,000 Number
FRUIT AND NUT CROPS TOTAL VALUE ‐‐ $11,634,843,000 Almond (shelled) 5/ 1 99 720.0 705.0 2,293,500 4 4 Aug. 1‐Oct. 31 Fresno, Stanislaus, Kern, Merced,
Madera Apples 5 3 19.0 132.5 62,228 40 49 July 15‐Oct. 30 San Joaquin, Kern, El Dorado,
Fresno, Stanislaus Apricots 1 97 11.0 59.5 36,935 59 58 May 1‐July 15 Stanislaus, Fresno, Kings, Kern, San
Joaquin Avocados 1 76 65.0 88.0 200,640 23 30 Continuous San Diego, Santa Barbara, Ventura,
Riverside, San Luis Obispo Berries, Blueberries 7 7 3.0 12.1 71,148 52 46 ‐‐‐ Glenn, Butte, Madera, MariposaBerries, Raspberries 1 12 5.4 51.3 297,315 26 22 June 1‐Oct. 31 Ventura, Santa Cruz, MontereyBerries, FM Strawberries
‐‐‐ 88 ‐‐‐ 1,002.0 1,583,160 ‐‐‐ ‐‐‐ ‐‐‐ Monterey, Ventura, Santa Barbara, San Luis Obispo, Sacramento
Berries, Proc Strawberries
‐‐‐ 94 ‐‐‐ 240.8 142,072 ‐‐‐ ‐‐‐ ‐‐‐ Ventura, Santa Barbara, Monterey, San Luis Obispo, San Diego
Berries, All Strawberries
1 89 39.8 1,242.8 1,725,232 8 6 Feb. 20‐Nov. 15 Monterey, Ventura, Santa Barbara, Santa Cruz, San Luis Obispo
Cherries, Sweet 2 18 28.0 78.0 185,265 31 33 May 20‐June 25 San Joaquin, Fresno, Stanislaus, Tulare, Kern
Dates 5/ 1 82 6.3 23.4 28,782 63 64 Oct. 1‐Dec. 15 Riverside, Imperial, Fresno, SutterFigs 5/ 1 96 9.3 40.0 30,465 64 63 June 10‐Sept. 15 Madera, Merced, Fresno, Imperial,
Los Angeles Grapefruit, All 4 13 9.6 160.8 D 53 52 Nov. 1‐July 31 Riverside, San Diego, Tulare, Kern,
Kings Grapes, Raisin Type ‐‐‐ ‐‐‐ 216.0 1,927.0 567,894 ‐‐‐ ‐‐‐ May 15‐Nov. 15 Fresno, Madera, Tulare, Kern,
Kings Grapes, Table type ‐‐‐ ‐‐‐ 84.0 874.0 406,401 ‐‐‐ ‐‐‐ May 25‐Dec. 15 Kern, Tulare, Fresno, Riverside,
Madera Grapes, Wine Type ‐‐‐ ‐‐‐ 489.0 3,743.0 2,293,116 ‐‐‐ ‐‐‐ Aug. 5‐Dec. 15 Napa, Sonoma, San Joaquin,
Monterey, Fresno Grapes, All 1 90 789.0 6,544.0 3,267,411 2 2 ‐‐‐ Fresno, Kern, Napa, Sonoma,
Tulare Kiwifruit 5/ 1 97 4.2 26.0 35,048 67 60 Oct. 1‐May 31 Tulare, Butte, Yuba, Fresno, SutterLemons 1 88 47.0 798.0 305,424 18 21 Aug. 1‐July 31 Ventura, Riverside, Kern, Tulare,
San Diego Nectarines 5/ 1 96 29.0 210.0 133,770 41 39 June 10‐Sept. 5 Fresno, Tulare, Kings, Kern,
Madera Olives 5/ 1 96 31.0 46.3 32,209 55 61 Sept. 25‐Mar. 15 Glenn, Tehama, San Joaquin,
Tulare, Butte Oranges, Navel & Misc
‐‐‐ ‐‐‐ 141.0 1,293.8 462,233 ‐‐‐ ‐‐‐ Nov. 1‐Aug.31 Tulare, Fresno, Kern, Riverside, San Bernardino
Oranges, Valencia ‐‐‐ ‐‐‐ 45.0 450.0 133,676 ‐‐‐ ‐‐‐ Nov. 1‐June 15 Tulare, Kern, Fresno, Ventura, San Diego
Oranges, All 2 22 186.0 1,743.8 595,909 14 15 ‐‐‐ Tulare, Fresno, Kern, Ventura, Riverside
Peaches, Clingstone 1 100 24.5 469.0 158,452 ‐‐‐ ‐‐‐ July 15‐Sept. 15 Stanislaus, Sutter, Yuba, Merced, Butte
Peaches, Freestone 1 55 28.0 350.0 167,879 ‐‐‐ ‐‐‐ May 10‐Sept. 15 Fresno, Tulare, Kings, Stanislaus, Merced
Peaches, All 1 74 52.5 819.0 326,331 25 19 ‐‐‐ Fresno, Tulare, Stanislaus, Sutter, Kings
Pears, All 2 27 14.0 255.0 93,329 42 42 Aug. 5‐Oct. 5 Sacramento, Fresno, Lake, Mendocino, Yuba
Pecans 8 1 3.2 19.6 5,919 72 72 Sept. 1‐Nov. 30 Tulare Pistachio 5/ 1 98 126.0 177.5 592,850 15 16 Sept. 15‐Dec. 10 Kern, Fresno, Tulare, Madera,
Kings Plums 5/ 1 97 26.6 112.0 57,568 48 51 May 25‐Aug. 20 Fresno, Tulare, Kings, Madera,
Yuba Plums, Dried 5/ 1 99 64.0 166.0 199,200 32 31 Aug. 15‐Oct. 10 Sutter, Butte, Yuba, Tehama, GlennTangerines, Mandarins, Tangelos & Tangors
1 62 27.0 251.2 D 36 37 Nov. 1‐May 15 Kern, Tulare, Madera, Riverside, San Diego
Walnuts 5/ 1 99 223.0 218.5 738,530 16 12 Sept. 5‐Nov. 10 San Joaquin, Butte, Stanislaus, Tulare, Tehama
Other Fruits and Nuts ‐‐‐ ‐‐‐ ‐‐‐ ‐‐‐ 100,300 ‐‐‐ ‐‐‐ ‐‐‐ ‐‐‐ Continued on Next Page
USDA, NASS, California Field Office 8 California Agricultural Statistics, 2009
Commodity Rank, Acreage, Production, Value and Leading Producing Counties, 2009
Commodity
U.S. Rank 1/
CA Share of U.S. Prod. 1/
Area Harvested
Short Tons (2,000 Lbs.) Total Value 2/
California Rank 3/
Harvest Season Leading Counties 4/
2008 2009
Number Percent 1,000 Acres 1,000 Tons $1,000 Number
FIELD AND SEED CROPS TOTAL VALUE ‐‐ $3,544,328,000 Barley 12 1 55.0 71.3 10,098 66 70 May 15‐Oct. 1 Fresno, Siskiyou, Modoc, Merced,
Monterey Beans, Dry 6 6 68.0 75.4 78,718 47 44 Aug. 20‐Nov. 15 Stanislaus, Fresno, San Joaquin,
Tulare, Sutter Cotton Lint, All 5 5 186.0 144.2 277,320 24 24 Oct. 1‐Jan. 1 Kings, Fresno, Kern, Merced, TulareCottonseed 4 7 ‐‐‐ 275.0 57,902 46 50 ‐‐‐ Fresno, Kings, Merced, Tulare,
Riverside Grain, Corn 28 ‐‐‐ 160.0 806.4 125,280 37 40 Sept. 1‐Dec. 1 San Joaquin, Sacramento, Glenn,
Merced, Tulare Grain, Sorghum ‐‐‐ ‐‐‐ ‐‐‐ ‐‐‐ ‐‐‐ ‐‐‐ ‐‐‐ ‐‐‐ Tulare, Imperial, SutterHay, Alfalfa and Other
1 6 1,520.0 8,632.0 927,496 6 9 Mar. 1‐Nov. 5 Imperial, Kern, Tulare, Fresno, Merced
Oats 10 3 30.0 50.4 10,238 71 69 June 15‐Oct. 1 Sacramento, Siskiyou, Butte, Fresno, Lassen
Potatoes (Excl. Sweet)
10 3 38.4 741.7 228,452 29 27 Continuous Kern, San Joaquin, Modoc, Imperial, Siskiyou
Potatoes, Sweet 2 30 17.4 295.8 158,549 39 38 July 15‐Nov. 15 Merced, Stanislaus, San Benito, Sutter
Rice 2 22 556.0 2,390.2 889,154 10 11 Sept. 1‐Nov. 30 Colusa, Sutter, Butte, Glenn, YubaSugar Beets 7 3 24.6 984.0 44,083 54 56 Apr. 1‐Dec. 10 Imperial, Kern, FresnoWheat, All 15 2 485.0 1,266.0 240,600 21 26 May 20‐Sept. 1 Imperial, Fresno, Tulare, Kern, KingsOil Crops 6/ ‐‐‐ ‐‐‐ ‐‐‐ ‐‐‐ 56,268 57 53 ‐‐‐ ‐‐‐ Other Field Crops ‐‐‐ ‐‐‐ ‐‐‐ ‐‐‐ 440,210 ‐‐‐ ‐‐‐ ‐‐‐ ‐‐‐
NURSERY, GREENHOUSE AND FLORICULTURE CROPS TOTAL VALUE ‐‐ $3,778,810,000Nursery Products 4/ 5/ 7/
1 ‐‐‐ ‐‐‐ ‐‐‐ 2,848,500 3 3 Continuous San Diego, Monterey, Riverside, Ventura, Orange
Flowers and Foliage 8/
1 ‐‐‐ ‐‐‐ ‐‐‐ 921,710 11 10 Continuous San Diego, Santa Barbara, Santa Cruz, Monterey, San Luis Obispo
Christmas Trees ‐‐‐ ‐‐‐ ‐‐‐ ‐‐‐ 8,600 70 71 Nov. 1‐Dec. 24 El Dorado, Santa Clara, San Mateo, Sonoma, Siskiyou
1/ Based on quantity produced for crops and on quantity marketed for livestock and poultry products. 2/ Based on value of quantity harvested for crops, value of quantity marketed for livestock, and value of quantity produced for poultry products. 3/ Based on total value. 4/ Based on values published in the county agricultural commissioners' annual crop reports. 5/ Share of U.S. production based on 2007 Census of Agriculture. 6/ Includes sunflower, safflower, and canola. 7/ Includes trees, shrubs, vines, bulbs, turf, etc., not included in flowers and foliage category. 8/ Includes cut flowers, potted plants, foliage plants, bedding plants, and indoor decoratives.
USDA, NASS, California Field Office 9 California Agricultural Statistics, 2009
Commodity Rank, Value and Leading Producing Counties, 2009
Commodity
U.S. Rank 1/ CA Share of U.S. Prod. Marketings Cash Receipts 2/ California Rank
Leading Counties 3/ Number Percent 1,000 Pounds $1,000
2008 2009
Number
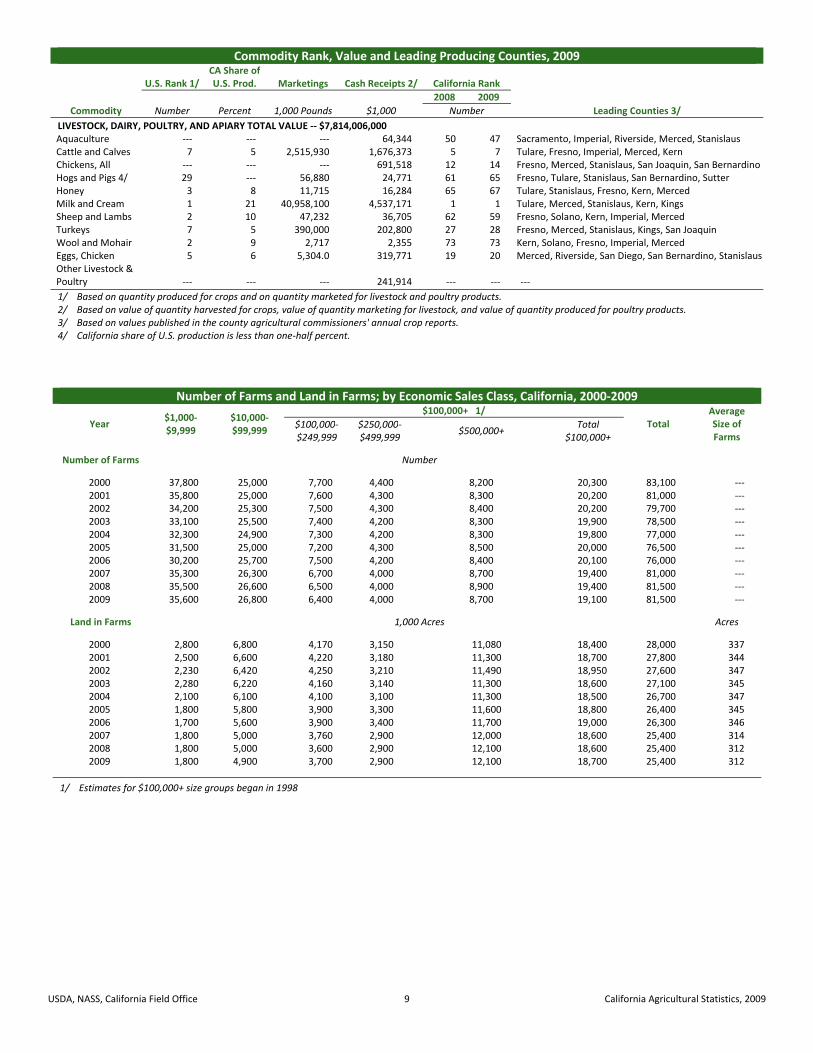
LIVESTOCK, DAIRY, POULTRY, AND APIARY TOTAL VALUE ‐‐ $7,814,006,000Aquaculture ‐‐‐ ‐‐‐ ‐‐‐ 64,344 50 47 Sacramento, Imperial, Riverside, Merced, StanislausCattle and Calves 7 5 2,515,930 1,676,373 5 7 Tulare, Fresno, Imperial, Merced, KernChickens, All ‐‐‐ ‐‐‐ ‐‐‐ 691,518 12 14 Fresno, Merced, Stanislaus, San Joaquin, San BernardinoHogs and Pigs 4/ 29 ‐‐‐ 56,880 24,771 61 65 Fresno, Tulare, Stanislaus, San Bernardino, SutterHoney 3 8 11,715 16,284 65 67 Tulare, Stanislaus, Fresno, Kern, MercedMilk and Cream 1 21 40,958,100 4,537,171 1 1 Tulare, Merced, Stanislaus, Kern, KingsSheep and Lambs 2 10 47,232 36,705 62 59 Fresno, Solano, Kern, Imperial, MercedTurkeys 7 5 390,000 202,800 27 28 Fresno, Merced, Stanislaus, Kings, San JoaquinWool and Mohair 2 9 2,717 2,355 73 73 Kern, Solano, Fresno, Imperial, MercedEggs, Chicken 5 6 5,304.0 319,771 19 20 Merced, Riverside, San Diego, San Bernardino, StanislausOther Livestock & Poultry ‐‐‐ ‐‐‐ ‐‐‐ 241,914 ‐‐‐ ‐‐‐ ‐‐‐
1/ Based on quantity produced for crops and on quantity marketed for livestock and poultry products.2/ Based on value of quantity harvested for crops, value of quantity marketing for livestock, and value of quantity produced for poultry products.3/ Based on values published in the county agricultural commissioners' annual crop reports.4/ California share of U.S. production is less than one‐half percent.
Number of Farms and Land in Farms; by Economic Sales Class, California, 2000‐2009
Year $1,000‐ $9,999
$10,000‐$99,999
$100,000+ 1/
Total Average Size of Farms
$100,000‐ $250,000‐$500,000+
Total $249,999 $499,999 $100,000+
Number of Farms Number
2000 37,800 25,000 7,700 4,400 8,200 20,300 83,100 ‐‐‐2001 35,800 25,000 7,600 4,300 8,300 20,200 81,000 ‐‐‐2002 34,200 25,300 7,500 4,300 8,400 20,200 79,700 ‐‐‐2003 33,100 25,500 7,400 4,200 8,300 19,900 78,500 ‐‐‐2004 32,300 24,900 7,300 4,200 8,300 19,800 77,000 ‐‐‐2005 31,500 25,000 7,200 4,300 8,500 20,000 76,500 ‐‐‐2006 30,200 25,700 7,500 4,200 8,400 20,100 76,000 ‐‐‐2007 35,300 26,300 6,700 4,000 8,700 19,400 81,000 ‐‐‐2008 35,500 26,600 6,500 4,000 8,900 19,400 81,500 ‐‐‐2009 35,600 26,800 6,400 4,000 8,700 19,100 81,500 ‐‐‐
Land in Farms 1,000 Acres Acres
2000 2,800 6,800 4,170 3,150 11,080 18,400 28,000 3372001 2,500 6,600 4,220 3,180 11,300 18,700 27,800 3442002 2,230 6,420 4,250 3,210 11,490 18,950 27,600 3472003 2,280 6,220 4,160 3,140 11,300 18,600 27,100 3452004 2,100 6,100 4,100 3,100 11,300 18,500 26,700 3472005 1,800 5,800 3,900 3,300 11,600 18,800 26,400 3452006 1,700 5,600 3,900 3,400 11,700 19,000 26,300 3462007 1,800 5,000 3,760 2,900 12,000 18,600 25,400 3142008 1,800 5,000 3,600 2,900 12,100 18,600 25,400 3122009 1,800 4,900 3,700 2,900 12,100 18,700 25,400 312
1/ Estimates for $100,000+ size groups began in 1998
USDA, NASS, California Field Office 10 California Agricultural Statistics, 2009
County Rank, Total Value of Production and Leading Commodities, 2009 1/
Rank County 2/
Total Value Leading Commodities
2008 2009 $1,000
(1) (1) Fresno 5,372,009 Grapes, Tomatoes, Poultry, Almonds, Cattle and Calves(2) (2) Tulare 4,046,355 Milk, Oranges, Grapes, Cattle and Calves, Corn(4) (3) Monterey 4,033,718 Lettuce, Strawberries, Nursery, Broccoli, Grapes(3) (4) Kern 3,606,356 Grapes, Milk, Vegetables, Almonds, Pistachios(5) (5) Merced 2,460,474 Milk, Chickens, Almonds, Cattle and Calves, Sweet Potatoes(6) (6) Stanislaus 2,310,071 Milk, Almonds, Chickens, Cattle and Calves, Tomatoes(7) (7) San Joaquin 2,000,474 Grapes, Milk, Cherries, Tomatoes, Walnuts
(10) (8) Ventura 1,621,575 Strawberries, Nursery Stock, Celery, Raspberries, Lemons(11) (9) San Diego 1,548,124 Woody Ornamentals, Flowers and Foliage, Bedding Plants, Avocados, Tomatoes (9) (10) Imperial 1,452,970 Lettuce, Cattle, Wheat, Alfalfa, Broccoli(8) (11) Kings 1,304,783 Milk, Cotton, Cattle and Calves, Processing Tomatoes, Pistachios
(14) (12) Santa Barbara 1,241,400 Strawberries, Broccoli, Wine Grapes, Lettuce, Cauliflower(13) (13) Riverside 1,015,755 Nursery Stock, Milk, Eggs, Table Grapes, Hay(12) (14) Madera 963,128 Grapes, Almonds, Milk, Pistachios, Cattle and Calves(17) (15) Sonoma 653,783 Wine Grapes, Milk, Poultry, Livestock Products, Woody Ornamentals (16) (16) San Luis Obispo 623,095 Wine Grapes, Strawberries, Broccoli, Cattle & Calves, Vegetable Transplants (15) (17) Colusa 598,805 Rice, Almond Meats, Processing Tomatoes, Rice Seed, Wheat(18) (18) Butte 540,085 Rice, Walnuts, Almonds, Dried Plums, Nursery Stock(24) (19) Napa 502,237 Wine Grapes, Cattle & Calves, Nursery Products, Livestock Products, Rangeland (23) (20) Santa Cruz 488,106 Strawberries, Raspberries, Cut Flowers, Landscape Plants, Berries (19) (21) Glenn 481,675 Rice, Almonds, Dairy, Walnuts, Dried Plums(22) (22) Sutter 475,691 Rice, Dried Plums, Walnuts, Tomatoes, Nursery Products(21) (23) Yolo 462,133 Processing Tomatoes, Wine Grapes, Rice, Seed Crops, Alfalfa Hay (25) (24) Sacramento 363,285 Wine Grapes, Milk, Poultry, Pears, Nursery Products(20) (25) San Bernardino 355,379 Milk, Eggs, Cattle & Calves, Alfalfa, Replacement Heifers(28) (26) Santa Clara 260,139 Nursery Crops, Mushrooms, Bell Peppers, Cherries, Salad Greens (26) (27) Solano 251,923 Processing Tomatoes, Nursery Stock, Walnuts, Alfalfa, Cattle & Calves (27) (28) San Benito 243,187 Vegetables, Leaf and Salad Lettuce, Nursery Stock, Wine Grapes, Spinach (29) (29) Siskiyou 200,591 Nursery Crops, Alfalfa, Field Crops, Cattle, Potatoes(32) (30) Yuba 195,576 Rice, Dried Plums, Walnut, Clingstone Peach, Milk(30) (31) Orange 192,101 Woody Ornamentals, Strawberries, Vegetables, Nursery Plants, Prop. Material (31) (32) Los Angeles 189,559 Woody Ornamentals, Root Vegetables, Bedding Plants, Orchard Fruit, Alfalfa Hay (34) (33) Tehama 180,610 Walnuts, Dried Plums, Almonds, Olives, Milk(33) (34) San Mateo 148,465 Flowering Potted Plant, Ornamentals, Cut Flowers, Brussels Sprouts, Potted Foliage (35) (35) Humboldt 134,380 Nursery Products, Milk, Cattle and Calves, Rangeland, Other Livestock (36) (36) Mendocino 118,150 Wine Grapes, Pears, Cattle & Calves, Milk, Nursery Stock(37) (37) Modoc 107,009 Alfalfa, Cattle & Calves, Potatoes, Wheat, Vegetables(38) (38) Shasta 93,513 Forest Products, Cattle & Calves, Hay, Nursery Stock, Wild Rice(43) (39) Placer 66,481 Rice, Cattle and Calves, Livestock, Nursery Products, Walnuts(39) (40) Lassen 66,032 Hay, Livestock, Strawberry Plants, Pastureland, Garlic Seed(42) (41) Lake 65,113 Wine Grapes, Pears, Nursery Products, Cattle & Calves, Field Crops (40) (42) Contra Costa 64,423 Sweet Corn, Tomatoes, Grapes, Cattle & Calves, Corn for Grain(41) (43) Marin 52,716 Milk, Rangeland Pasture, Poultry, Cattle & Calves, Fish(44) (44) Del Norte 38,135 Milk, Cattle, Lily Bulbs, Woody Ornamentals, Calves(45) (45) Alameda 37,167 Wine Grapes, Woody Ornamentals, Cattle & Calves, Rangeland Pasture, Nursery Products(47) (46) El Dorado 35,565 Apples, Wine Grapes, Cattle & Calves, Range Pasture, Christmas Trees (46) (47) Mono 32,682 Cattle, Alfalfa, Hay, Sheep & Lambs, Irrigated Pasture(49) (48) Mariposa 25,287 Cattle and Calves, Rangeland, Livestock and Poultry Products, Poultry, Forest Products(48) (49) Amador 22,317 Wine Grapes, Cattle and Calves, Rangeland Pasture, Vegetables, Alfalfa Hay (52) (50) Plumas 19,651 Cattle, Alfalfa Hay, Irrigated Pasture, Rangeland, Wild Hay(50) (51) Inyo 19,127 Cattle, Alfalfa, Nursery Turf, Honey, Rangeland Pasture(51) (52) Tuolumne 18,379 Livestock & Poultry, Cattle & Calves, Rangeland Pasture, Forest Products, Tree & Vine Crops(53) (53) Calaveras 17,859 Cattle and Calves, Wine Grapes, Poultry, Walnuts, Nursery Products (54) (54) Nevada 9,652 Cattle & Calves, Range Pasture, Wine Grapes, Fruits & Vegetables, Nursery Stock (55) (55) Sierra 4,960 Cattle, Irrigated Pasture, Forage Pasture, Wild Hay, Grain Hay(56) (56) Alpine 4,680 Rangeland Pasture, Cattle and Calves, Irrigated Pasture, Hay(57) (57) Trinity 2,320 Cattle and Calves, Rangeland Pasture, Wine Grapes, Irrigated Pasture, Fruits and Nuts(58) (58) San Francisco 1,091 Orchids, Bean Sprouts, Alfalfa Sprouts, Soybean Sprouts
1/ Totals vary slightly from totals published by counties due to classification differences between County and State reports. 2/ Three County Agricultural Commissioners’ Reports were not available at publication so 2003 data (last available report) was used for Trinity County, while 2008 data was used for Humboldt and Modoc counties for this report.

USDA, NASS, California Field Office 11 California Agricultural Statistics, 2009
Seasonal Rainfall with Comparisons to Normal, 2009‐2010
Stations
2008‐2009 2009‐2010 Normal Rainfall 1/
Precipitation 1/ Percent of Normal
Precipitation 1/ Percent of Normal
Inches Inches Inches
NORTH COAST
Eureka 28.88 75 41.90 109 38.32
Ukiah 21.65 55 24.02 61 39.36
Santa Rosa 22.45 73 32.01 103 30.93
CENTRAL COAST
San Francisco Airport 14.62 72 21.55 106 20.33
San Jose ‐‐‐ ‐‐‐ 16.00 106 15.15
Salinas Airport 11.02 86 14.31 111 12.86
Monterey FAA 10.71 52 13.15 64 20.52
King City 6.05 49 13.76 112 12.24
Paso Robles Airport 5.87 44 13.25 99 13.35
SACRAMENTO VALLEY
Redding 25.05 70 30.61 86 35.74
Red Bluff FSS 17.53 74 24.21 102 23.73
Chico AFS 28.91 109 28.46 107 26.52
Marysville 16.25 73 20.03 89 22.41
Sacramento Airport 16.33 91 20.61 115 17.96
SAN JOAQUIN VALLEY
Stockton WSO 9.31 67 15.47 111 13.94
Fresno 7.71 68 12.39 109 11.38
Bakersfield 4.95 76 7.19 110 6.55
SOUTH COAST
Santa Maria Airport 10.10 71 15.31 108 14.19
Santa Barbara 10.11 58 20.83 119 17.46
Ventura 9.02 59 16.33 106 15.34
Los Angeles 9.08 59 16.36 107 15.29
Riverside 6.67 62 ‐‐‐ ‐‐‐ 10.73
San Diego Airport 9.17 85 11.02 102 10.78
SOUTHEASTERN INTERIOR
Bishop 2.84 56 6.84 136 5.04
Lancaster 5.39 69 7.63 97 7.86
Daggett Airport 3.81 90 4.21 100 4.23
Thermal Airport 1.48 41 3.75 104 3.61
Blythe 1.86 46 4.67 114 4.08
Imperial 1.95 65 3.77 125 3.02
CASCADE‐SIERRA
Alturas 10.65 87 9.79 80 12.26
Mt. Shasta 37.19 93 45.86 115 39.99
Blue Canyon 47.25 72 49.80 76 65.90 Yosemite Valley 20.36 53 17.69 46 38.41
1/ Rainfall year is July 1 ‐ June 30.
Source: Western Regional Climate Center, Reno, Nevada

USDA, NASS, California Field Office 12 California Agricultural Statistics, 2009
Field Crops
he total value of California field crop production declined to $3.54 billion, down 29 percent from a record high in 2008, and down 14 percent from 2007.
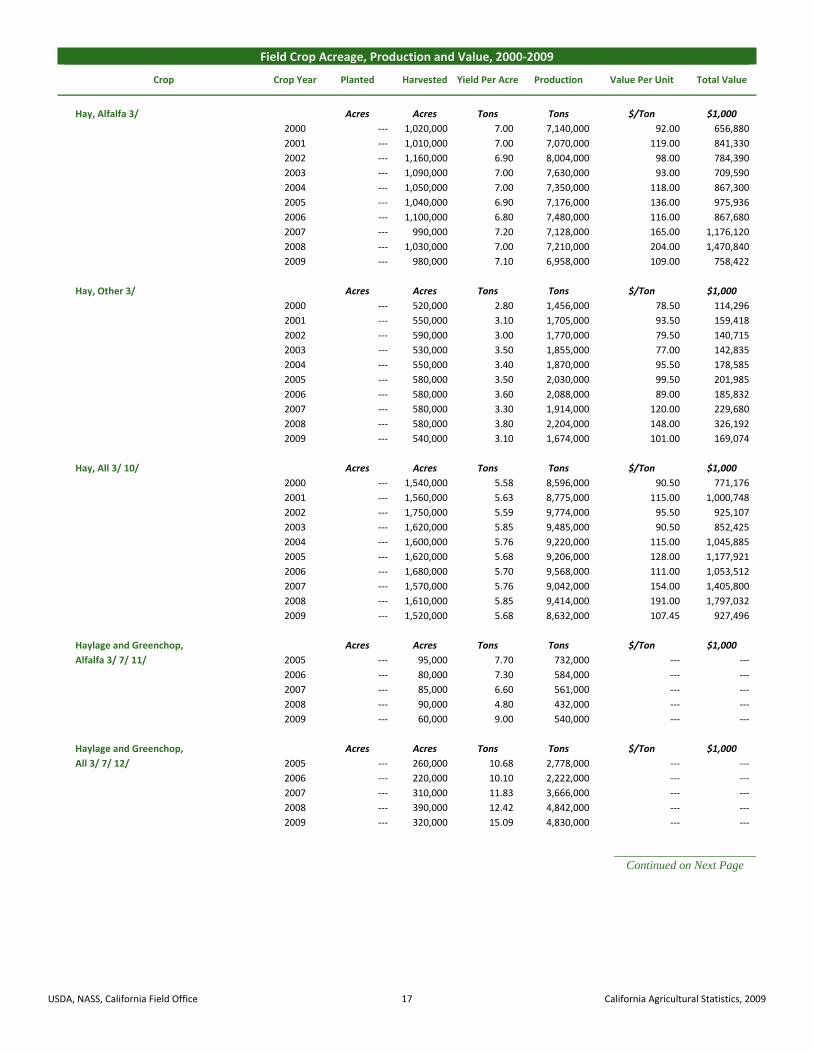
California's acreage and production both decreased. The harvested acreage declined by 13 percent while production was down by 17 percent from 2008. California continued to lead the nation in alfalfa hay production, despite dry growing conditions and lower prices. In 2009, California produced approximately 6.96 million tons of alfalfa hay, generating $758 million. Other hay also showed a decline in production and price. Values were also down 48 percent to $169 million. In total, all hay declined in value by 48 percent for a total value of $927 million. Price of Upland cotton was $0.72 per pound, up 20 percent from 2008; however, tight water supplies and crop conversion lowered planted acreage for the fifth year in a row to 71,000 acres, which was a 41 percent drop from 2008, and 87 percent below 2004. The total value of Upland cotton also decreased from $105 million in 2008 to $86 million in 2009, a drop of 18 percent. California growers planted 119,000 acres of American Pima cotton, down 36,000 from 2008. The American Pima cotton price increased to $1.14 per pound. The rise in price kept total value unchanged for American Pima Cotton from 2008 to 2009, which generated $192 million for each year. Rice plantings grew by 8 percent in California, with 561,000 acres planted in 2009. Medium grain rice contributed to 90 percent of the total rice acreage and 91 percent of the total production. Despite an increase in acreage, the total value of rice production declined by 25 percent from the previous year. The 2009 total value for all rice was $889 million. California corn for grain production was valued at $125 million for 2009,
which was a 21 percent drop from 2008. The harvested acreage and yield both declined from the previous year. Harvested acreage was down 6 percent to 160,000 acres, while yield was down 8 percent to 5.04 tons per acre. Fifty-four percent of the California winter wheat crop was harvested for grain. Many growers of wheat and other small grains chose to harvest the crop for hay or silage due to drought conditions. Wheat was planted on 795,000 acres and 500,000 were harvested for grain. Overall, production decreased 12 percent and value dropped 32 percent. While winter wheat production declined by 22 percent, durum wheat production increased by 12 percent. Prices were lower for both winter wheat and durum wheat, priced at $175.00 per ton and $200.00 per ton, respectively. Notable Increases in Value: Beans, Dry Edible .................................................. 34% Oats ........................................................................ 28% Potatoes, Spring ..................................................... 28% Potatoes, Sweet ...................................................... 19% Notable Decreases in Value: Safflower ............................................................... 61% Barley, All ............................................................. 50% Hay, Alfalfa (Dry) ................................................. 48% Hay, All (Dry) ....................................................... 48% Hay, Other (Dry).................................................... 48% Potatoes, Summer .................................................. 48%
T

USDA, NASS, California Field Office 13 California Agricultural Statistics, 2009
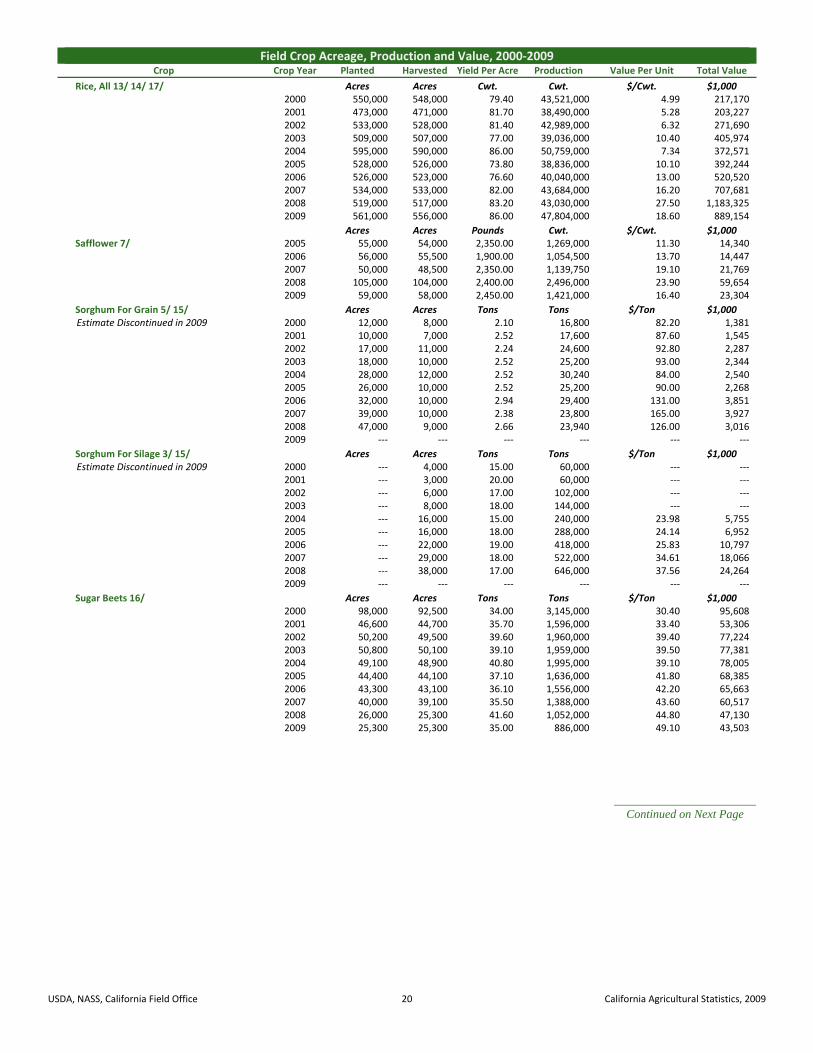
Field Crop Acreage, Production and Value, 2000‐2009Crop Crop Year Planted Harvested Yield Per Acre Production Value Per Unit Total Value
Acres Acres Tons Tons $/Ton $1,000
Barley 1/ 2000 130,000 95,000 1.63 155,040 98.75 15,310
2001 160,000 110,000 1.27 139,920 98.33 13,759
2002 130,000 75,000 1.70 127,800 103.75 13,259
2003 100,000 58,000 1.54 89,088 115.42 10,282
2004 110,000 75,000 1.44 108,000 110.42 11,925
2005 100,000 60,000 1.51 90,720 109.58 9,941
2006 90,000 65,000 1.32 85,800 103.33 8,866
2007 85,000 40,000 1.54 61,440 188.33 11,571
2008 95,000 60,000 1.32 79,200 256.25 20,295
2009 90,000 55,000 1.30 71,280 141.67 10,098
Acres Acres Pounds Cwt. $/Cwt. $1,000
Beans, Black 2/ 3/ 2000 1,000 1,000 500 5,000 ‐‐‐ ‐‐‐
2001 ‐‐‐ ‐‐‐ ‐‐‐ ‐‐‐ ‐‐‐ ‐‐‐
2002 ‐‐‐ ‐‐‐ ‐‐‐ ‐‐‐ ‐‐‐ ‐‐‐
2003 400 400 1,750 7,000 ‐‐‐ ‐‐‐
2004 900 700 1,430 10,000 ‐‐‐ ‐‐‐
2005 400 400 1,750 7,000 ‐‐‐ ‐‐‐
2006 600 600 1,670 10,000 ‐‐‐ ‐‐‐
2007 400 400 2,000 8,000 ‐‐‐ ‐‐‐
2008 ‐‐‐ ‐‐‐ ‐‐‐ ‐‐‐ ‐‐‐ ‐‐‐
2009 ‐‐‐ ‐‐‐ ‐‐‐ ‐‐‐ ‐‐‐ ‐‐‐
Acres Acres Pounds Cwt. $/Cwt. $1,000
Beans, Blackeye Dry 2/ 3/ 2000 15,300 15,300 2,160 330,000 ‐‐‐ ‐‐‐
2001 12,000 12,000 2,420 290,000 ‐‐‐ ‐‐‐
2002 12,600 12,400 2,520 313,000 ‐‐‐ ‐‐‐
2003 16,500 16,100 2,450 395,000 ‐‐‐ ‐‐‐
2004 10,500 10,300 2,490 256,000 ‐‐‐ ‐‐‐
2005 9,000 8,900 2,210 197,000 ‐‐‐ ‐‐‐
2006 12,600 12,500 2,420 303,000 ‐‐‐ ‐‐‐
2007 12,500 12,500 2,150 269,000 ‐‐‐ ‐‐‐
2008 7,100 7,100 1,760 125,000 ‐‐‐ ‐‐‐
2009 12,400 12,400 2,610 324,000 ‐‐‐ ‐‐‐
Acres Acres Pounds Cwt. $/Cwt. $1,000
Beans, Cranberry 2/ 3/ 2000 3,500 3,500 1,060 37,000 ‐‐‐ ‐‐‐
2001 1,500 1,500 2,000 30,000 ‐‐‐ ‐‐‐
2002 1,700 1,700 1,350 23,000 ‐‐‐ ‐‐‐
2003 1,500 1,500 1,670 25,000 ‐‐‐ ‐‐‐
2004 2,000 1,600 1,440 23,000 ‐‐‐ ‐‐‐
2005 1,100 1,100 1,180 13,000 ‐‐‐ ‐‐‐
2006 800 800 1,880 15,000 ‐‐‐ ‐‐‐
2007 800 800 2,250 18,000 ‐‐‐ ‐‐‐
2008 1,300 1,300 1,620 21,000 ‐‐‐ ‐‐‐
2009 1,000 1,000 1,800 18,000 ‐‐‐ ‐‐‐
Acres Acres Pounds Cwt. $/Cwt. $1,000
Beans, Garbanzo Dry 2/ 3/ 2000 24,500 23,500 1,460 343,000 ‐‐‐ ‐‐‐
2001 29,000 27,000 1,270 342,000 ‐‐‐ ‐‐‐
2002 18,500 18,000 1,600 288,000 ‐‐‐ ‐‐‐
2003 9,700 9,400 900 85,000 ‐‐‐ ‐‐‐
2004 6,100 5,800 1,980 115,000 ‐‐‐ ‐‐‐
2005 10,000 9,700 2,270 220,000 ‐‐‐ ‐‐‐
2006 16,000 15,300 1,290 198,000 ‐‐‐ ‐‐‐
2007 6,500 6,000 1,900 114,000 ‐‐‐ ‐‐‐
2008 6,400 6,300 1,840 116,000 ‐‐‐ ‐‐‐
2009 14,400 14,000 2,030 284,000 ‐‐‐ ‐‐‐ Continued on Next Page
USDA, NASS, California Field Office 14 California Agricultural Statistics, 2009
Field Crop Acreage, Production and Value, 2000‐2009Crop Crop Year Planted Harvested Yield Per Acre Production Value Per Unit Total Value
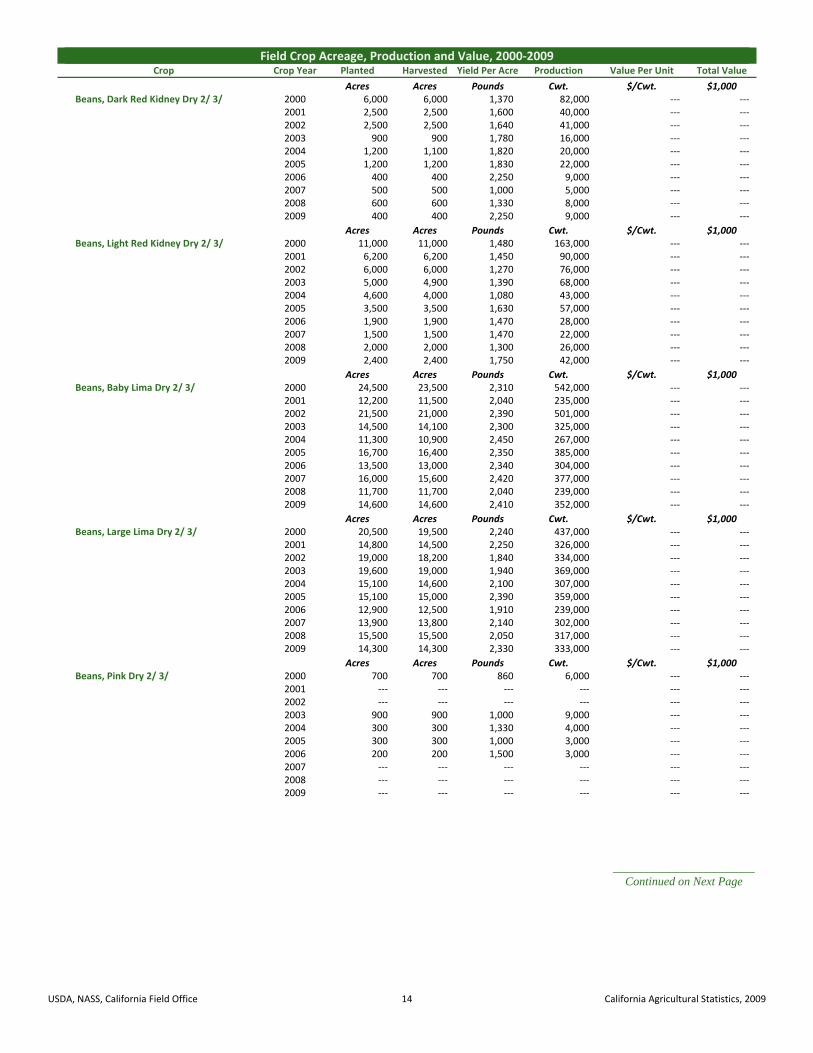
Acres Acres Pounds Cwt. $/Cwt. $1,000 Beans, Dark Red Kidney Dry 2/ 3/ 2000 6,000 6,000 1,370 82,000 ‐‐‐ ‐‐‐
2001 2,500 2,500 1,600 40,000 ‐‐‐ ‐‐‐2002 2,500 2,500 1,640 41,000 ‐‐‐ ‐‐‐2003 900 900 1,780 16,000 ‐‐‐ ‐‐‐2004 1,200 1,100 1,820 20,000 ‐‐‐ ‐‐‐2005 1,200 1,200 1,830 22,000 ‐‐‐ ‐‐‐2006 400 400 2,250 9,000 ‐‐‐ ‐‐‐2007 500 500 1,000 5,000 ‐‐‐ ‐‐‐2008 600 600 1,330 8,000 ‐‐‐ ‐‐‐2009 400 400 2,250 9,000 ‐‐‐ ‐‐‐
Acres Acres Pounds Cwt. $/Cwt. $1,000 Beans, Light Red Kidney Dry 2/ 3/ 2000 11,000 11,000 1,480 163,000 ‐‐‐ ‐‐‐
2001 6,200 6,200 1,450 90,000 ‐‐‐ ‐‐‐2002 6,000 6,000 1,270 76,000 ‐‐‐ ‐‐‐2003 5,000 4,900 1,390 68,000 ‐‐‐ ‐‐‐2004 4,600 4,000 1,080 43,000 ‐‐‐ ‐‐‐2005 3,500 3,500 1,630 57,000 ‐‐‐ ‐‐‐2006 1,900 1,900 1,470 28,000 ‐‐‐ ‐‐‐2007 1,500 1,500 1,470 22,000 ‐‐‐ ‐‐‐2008 2,000 2,000 1,300 26,000 ‐‐‐ ‐‐‐2009 2,400 2,400 1,750 42,000 ‐‐‐ ‐‐‐
Acres Acres Pounds Cwt. $/Cwt. $1,000 Beans, Baby Lima Dry 2/ 3/ 2000 24,500 23,500 2,310 542,000 ‐‐‐ ‐‐‐
2001 12,200 11,500 2,040 235,000 ‐‐‐ ‐‐‐2002 21,500 21,000 2,390 501,000 ‐‐‐ ‐‐‐2003 14,500 14,100 2,300 325,000 ‐‐‐ ‐‐‐2004 11,300 10,900 2,450 267,000 ‐‐‐ ‐‐‐2005 16,700 16,400 2,350 385,000 ‐‐‐ ‐‐‐2006 13,500 13,000 2,340 304,000 ‐‐‐ ‐‐‐2007 16,000 15,600 2,420 377,000 ‐‐‐ ‐‐‐2008 11,700 11,700 2,040 239,000 ‐‐‐ ‐‐‐2009 14,600 14,600 2,410 352,000 ‐‐‐ ‐‐‐
Acres Acres Pounds Cwt. $/Cwt. $1,000 Beans, Large Lima Dry 2/ 3/ 2000 20,500 19,500 2,240 437,000 ‐‐‐ ‐‐‐
2001 14,800 14,500 2,250 326,000 ‐‐‐ ‐‐‐2002 19,000 18,200 1,840 334,000 ‐‐‐ ‐‐‐2003 19,600 19,000 1,940 369,000 ‐‐‐ ‐‐‐2004 15,100 14,600 2,100 307,000 ‐‐‐ ‐‐‐2005 15,100 15,000 2,390 359,000 ‐‐‐ ‐‐‐2006 12,900 12,500 1,910 239,000 ‐‐‐ ‐‐‐2007 13,900 13,800 2,140 302,000 ‐‐‐ ‐‐‐2008 15,500 15,500 2,050 317,000 ‐‐‐ ‐‐‐2009 14,300 14,300 2,330 333,000 ‐‐‐ ‐‐‐
Acres Acres Pounds Cwt. $/Cwt. $1,000 Beans, Pink Dry 2/ 3/ 2000 700 700 860 6,000 ‐‐‐ ‐‐‐
2001 ‐‐‐ ‐‐‐ ‐‐‐ ‐‐‐ ‐‐‐ ‐‐‐2002 ‐‐‐ ‐‐‐ ‐‐‐ ‐‐‐ ‐‐‐ ‐‐‐2003 900 900 1,000 9,000 ‐‐‐ ‐‐‐2004 300 300 1,330 4,000 ‐‐‐ ‐‐‐2005 300 300 1,000 3,000 ‐‐‐ ‐‐‐2006 200 200 1,500 3,000 ‐‐‐ ‐‐‐2007 ‐‐‐ ‐‐‐ ‐‐‐ ‐‐‐ ‐‐‐ ‐‐‐2008 ‐‐‐ ‐‐‐ ‐‐‐ ‐‐‐ ‐‐‐ ‐‐‐2009 ‐‐‐ ‐‐‐ ‐‐‐ ‐‐‐ ‐‐‐ ‐‐‐
Continued on Next Page

USDA, NASS, California Field Office 15 California Agricultural Statistics, 2009
Field Crop Acreage, Production and Value, 2000‐2009Crop Crop Year Planted Harvested Yield Per Acre Production Value Per Unit Total Value
Beans, Other Dry 2/ 3/ Acres Acres Pounds Cwt. $/Cwt. $1,000 2000 8,000 8,000 1,430 114,000 ‐‐‐ ‐‐‐2001 9,800 9,800 1,460 143,000 ‐‐‐ ‐‐‐2002 10,200 9,200 2,020 186,000 ‐‐‐ ‐‐‐2003 7,500 7,300 1,030 75,000 ‐‐‐ ‐‐‐2004 8,000 7,700 1,390 107,000 ‐‐‐ ‐‐‐2005 8,700 8,500 1,440 122,000 ‐‐‐ ‐‐‐2006 8,100 7,800 1,280 100,000 ‐‐‐ ‐‐‐2007 6,900 6,900 1,410 97,000 ‐‐‐ ‐‐‐2008 7,400 7,400 1,460 108,000 ‐‐‐ ‐‐‐2009 9,000 8,900 1,640 146,000 ‐‐‐ ‐‐‐
Beans, All Dry Edible 2/ 4/ Acres Acres Pounds Cwt. $/Cwt. $1,000 2000 115,000 112,000 1,840 2,059,000 26.80 55,1812001 88,000 85,000 1,760 1,496,000 31.20 46,6752002 92,000 89,000 1,980 1,762,000 33.30 58,6752003 77,000 75,000 1,840 1,380,000 35.30 48,7142004 60,000 57,000 2,020 1,152,000 36.90 42,5092005 66,000 65,000 2,130 1,385,000 41.00 56,7852006 67,000 65,000 1,860 1,209,000 46.60 56,3392007 59,000 58,000 2,090 1,212,000 48.90 59,2672008 52,000 51,900 1,850 960,000 61.40 58,9442009 68,500 68,000 2,220 1,508,000 52.20 78,718
Corn For Grain 5/ Acres Acres Tons Tons $/Ton $1,000 2000 540,000 205,000 4.76 975,800 87.14 85,0342001 480,000 160,000 4.76 761,600 87.50 66,6402002 545,000 150,000 4.76 714,000 97.50 69,6152003 530,000 140,000 4.48 627,200 103.57 64,9602004 540,000 150,000 4.90 735,000 94.64 69,5632005 560,000 130,000 4.82 626,080 96.43 60,3722006 520,000 110,000 4.62 508,200 119.64 60,8032007 650,000 190,000 5.10 968,240 152.86 148,0022008 670,000 170,000 5.46 928,200 170.36 158,1262009 550,000 160,000 5.04 806,400 155.36 125,280
Corn For Silage 3/ Acres Acres Tons Tons $/Ton $1,000 2000 ‐‐‐ 330,000 26.00 8,580,000 17.09 161,3902001 ‐‐‐ 315,000 26.00 8,190,000 21.75 178,1332002 ‐‐‐ 390,000 26.00 10,140,000 22.00 223,0802003 ‐‐‐ 385,000 26.00 10,010,000 22.00 220,2202004 ‐‐‐ 385,000 26.00 10,010,000 24.31 243,3432005 ‐‐‐ 425,000 26.00 11,050,000 26.85 296,6932006 ‐‐‐ 405,000 27.00 10,935,000 24.29 265,6002007 ‐‐‐ 455,000 26.50 12,058,000 29.90 360,5872008 ‐‐‐ 495,000 26.50 13,118,000 31.66 415,3722009 ‐‐‐ 385,000 26.00 10,010,000 31.60 316,300
Cotton, American‐Pima 6/ 17/ Acres Acres Pounds Bales ¢/Lb. $1,000 2000 145,000 144,000 1,154 346,300 101.0 167,8862001 240,000 239,000 1,283 639,000 85.6 262,5522002 210,000 209,000 1,386 603,300 86.0 249,0422003 150,000 149,000 1,194 370,500 123.0 218,7432004 215,000 214,000 1,532 683,000 128.0 419,6352005 230,000 229,000 1,170 558,000 126.0 337,4782006 275,000 274,000 1,204 687,000 95.1 313,6022007 260,000 257,000 1,481 793,000 99.0 376,8342008 155,000 151,000 1,281 403,000 99.2 191,8922009 119,000 116,000 1,494 361,000 114.0 191,520
Continued on Next Page

USDA, NASS, California Field Office 16 California Agricultural Statistics, 2009
Field Crop Acreage, Production and Value, 2000‐2009Crop Crop Year Planted Harvested Yield Per Acre Production Value Per Unit Total Value
Cotton, Upland 6/ 17/ Acres Acres Pounds Bales ¢/Lb. $1,000 2000 775,000 770,000 1,378 2,210,000 52.0 551,6162001 630,000 625,000 1,359 1,770,000 41.6 353,4342002 480,000 477,000 1,469 1,460,000 57.3 401,5582003 550,000 545,000 1,317 1,495,000 74.5 534,6122004 560,000 557,000 1,543 1,790,000 51.6 443,3472005 430,000 428,000 1,194 1,065,000 60.4 308,7652006 285,000 283,000 1,321 779,000 58.2 217,6212007 195,000 194,000 1,608 650,000 72.2 225,2642008 120,000 117,000 1,506 367,000 59.4 104,6392009 71,000 70,000 1,646 240,000 71.5 85,800
Cotton, All 6/ 17/ Acres Acres Pounds Bales ¢/Lb. $1,000 2000 920,000 914,000 1,342 2,556,300 58.6 719,5022001 870,000 864,000 1,338 2,409,000 53.3 615,9862002 690,000 686,000 1,444 2,063,300 65.7 650,6002003 700,000 694,000 1,290 1,865,500 84.1 753,3552004 775,000 771,000 1,540 2,473,000 72.7 862,9822005 660,000 657,000 1,186 1,623,000 83.0 646,2432006 560,000 557,000 1,263 1,466,000 75.5 531,2232007 455,000 451,000 1,536 1,443,000 86.9 602,0982008 275,000 268,000 1,379 770,000 80.2 296,5322009 190,000 186,000 1,551 601,000 96.1 277,320
Cottonseed 3/ 17/ Acres Acres Tons Tons $/Ton $1,000 2000 ‐‐‐ ‐‐‐ ‐‐‐ 909,000 139.00 126,3512001 ‐‐‐ ‐‐‐ ‐‐‐ 849,000 142.00 120,5582002 ‐‐‐ ‐‐‐ ‐‐‐ 731,000 138.00 100,8782003 ‐‐‐ ‐‐‐ ‐‐‐ 680,000 152.00 103,3602004 ‐‐‐ ‐‐‐ ‐‐‐ 902,000 150.00 135,3002005 ‐‐‐ ‐‐‐ ‐‐‐ 594,000 146.00 86,7242006 ‐‐‐ ‐‐‐ ‐‐‐ 532,000 182.00 96,8242007 ‐‐‐ ‐‐‐ ‐‐‐ 546,000 249.00 135,9542008 ‐‐‐ ‐‐‐ ‐‐‐ 280,000 254.00 71,1202009 ‐‐‐ ‐‐‐ ‐‐‐ 275,000 262.00 57,902
Forage, Alfalfa 3/ 7/ 8/ Acres Acres Tons Tons $/Ton $1,000 2005 ‐‐‐ 1,050,000 7.18 7,538,000 ‐‐‐ ‐‐‐2006 ‐‐‐ 1,120,000 6.94 7,769,000 ‐‐‐ ‐‐‐2007 ‐‐‐ 1,015,000 7.30 7,405,000 ‐‐‐ ‐‐‐2008 ‐‐‐ 1,050,000 7.07 7,424,000 ‐‐‐ ‐‐‐2009 ‐‐‐ 1,020,000 7.08 7,225,000 ‐‐‐ ‐‐‐
Forage, All 3/ 7/ 9/ Acres Acres Tons Tons $/Ton $1,000 2005 ‐‐‐ 1,785,000 5.93 10,579,000 ‐‐‐ ‐‐‐2006 ‐‐‐ 1,840,000 5.80 10,667,000 ‐‐‐ ‐‐‐2007 ‐‐‐ 1,815,000 5.98 10,854,000 ‐‐‐ ‐‐‐2008 ‐‐‐ 1,930,000 6.12 11,808,000 ‐‐‐ ‐‐‐2009 ‐‐‐ 1,820,000 6.05 11,020,000 ‐‐‐ ‐‐‐
Continued on Next Page
USDA, NASS, California Field Office 17 California Agricultural Statistics, 2009
Field Crop Acreage, Production and Value, 2000‐2009
Crop Crop Year Planted Harvested Yield Per Acre Production Value Per Unit Total Value
Hay, Alfalfa 3/ Acres Acres Tons Tons $/Ton $1,000
2000 ‐‐‐ 1,020,000 7.00 7,140,000 92.00 656,880
2001 ‐‐‐ 1,010,000 7.00 7,070,000 119.00 841,330
2002 ‐‐‐ 1,160,000 6.90 8,004,000 98.00 784,390
2003 ‐‐‐ 1,090,000 7.00 7,630,000 93.00 709,590
2004 ‐‐‐ 1,050,000 7.00 7,350,000 118.00 867,300
2005 ‐‐‐ 1,040,000 6.90 7,176,000 136.00 975,936
2006 ‐‐‐ 1,100,000 6.80 7,480,000 116.00 867,680
2007 ‐‐‐ 990,000 7.20 7,128,000 165.00 1,176,120
2008 ‐‐‐ 1,030,000 7.00 7,210,000 204.00 1,470,840
2009 ‐‐‐ 980,000 7.10 6,958,000 109.00 758,422
Hay, Other 3/ Acres Acres Tons Tons $/Ton $1,000
2000 ‐‐‐ 520,000 2.80 1,456,000 78.50 114,296
2001 ‐‐‐ 550,000 3.10 1,705,000 93.50 159,418
2002 ‐‐‐ 590,000 3.00 1,770,000 79.50 140,715
2003 ‐‐‐ 530,000 3.50 1,855,000 77.00 142,835
2004 ‐‐‐ 550,000 3.40 1,870,000 95.50 178,585
2005 ‐‐‐ 580,000 3.50 2,030,000 99.50 201,985
2006 ‐‐‐ 580,000 3.60 2,088,000 89.00 185,832
2007 ‐‐‐ 580,000 3.30 1,914,000 120.00 229,680
2008 ‐‐‐ 580,000 3.80 2,204,000 148.00 326,192
2009 ‐‐‐ 540,000 3.10 1,674,000 101.00 169,074
Hay, All 3/ 10/ Acres Acres Tons Tons $/Ton $1,000
2000 ‐‐‐ 1,540,000 5.58 8,596,000 90.50 771,176
2001 ‐‐‐ 1,560,000 5.63 8,775,000 115.00 1,000,748
2002 ‐‐‐ 1,750,000 5.59 9,774,000 95.50 925,107
2003 ‐‐‐ 1,620,000 5.85 9,485,000 90.50 852,425
2004 ‐‐‐ 1,600,000 5.76 9,220,000 115.00 1,045,885
2005 ‐‐‐ 1,620,000 5.68 9,206,000 128.00 1,177,921
2006 ‐‐‐ 1,680,000 5.70 9,568,000 111.00 1,053,512
2007 ‐‐‐ 1,570,000 5.76 9,042,000 154.00 1,405,800
2008 ‐‐‐ 1,610,000 5.85 9,414,000 191.00 1,797,032
2009 ‐‐‐ 1,520,000 5.68 8,632,000 107.45 927,496
Haylage and Greenchop, Acres Acres Tons Tons $/Ton $1,000
Alfalfa 3/ 7/ 11/ 2005 ‐‐‐ 95,000 7.70 732,000 ‐‐‐ ‐‐‐
2006 ‐‐‐ 80,000 7.30 584,000 ‐‐‐ ‐‐‐
2007 ‐‐‐ 85,000 6.60 561,000 ‐‐‐ ‐‐‐
2008 ‐‐‐ 90,000 4.80 432,000 ‐‐‐ ‐‐‐
2009 ‐‐‐ 60,000 9.00 540,000 ‐‐‐ ‐‐‐
Haylage and Greenchop, Acres Acres Tons Tons $/Ton $1,000
All 3/ 7/ 12/ 2005 ‐‐‐ 260,000 10.68 2,778,000 ‐‐‐ ‐‐‐
2006 ‐‐‐ 220,000 10.10 2,222,000 ‐‐‐ ‐‐‐
2007 ‐‐‐ 310,000 11.83 3,666,000 ‐‐‐ ‐‐‐
2008 ‐‐‐ 390,000 12.42 4,842,000 ‐‐‐ ‐‐‐
2009 ‐‐‐ 320,000 15.09 4,830,000 ‐‐‐ ‐‐‐
Continued on Next Page

USDA, NASS, California Field Office 18 California Agricultural Statistics, 2009
Field Crop Acreage, Production and Value, 2000‐2009Crop Crop Year Planted Harvested Yield Per Acre Production Value Per Unit Total Value
Oats 1/ Acres Acres Tons Tons $/Ton $1,000 2000 220,000 25,000 1.20 30,000 96.88 2,9062001 260,000 25,000 0.96 24,000 140.63 3,3752002 260,000 32,000 1.31 41,984 181.25 7,6102003 260,000 35,000 1.28 44,800 125.00 5,6002004 240,000 25,000 1.36 34,000 125.00 4,2502005 270,000 20,000 1.28 25,600 142.50 3,6482006 270,000 20,000 1.44 28,800 168.75 4,8602007 215,000 25,000 1.58 39,600 190.63 7,5492008 260,000 25,000 1.28 32,000 250.00 8,0002009 250,000 30,000 1.68 50,400 203.13 10,238
Potatoes, Winter Acres Acres Cwt. Cwt. $/Cwt. $1,000 2000 9,000 9,000 320 2,880,000 17.00 48,9602001 9,000 9,000 310 2,790,000 19.70 54,9632002 9,000 9,000 270 2,430,000 24.00 58,3202003 8,500 8,500 310 2,635,000 26.70 70,3552004 13,000 13,000 250 3,250,000 22.70 73,7752005 14,000 14,000 250 3,500,000 19.10 66,8502006 12,000 12,000 260 3,120,000 18.00 56,1602007 10,500 10,500 215 2,258,000 18.50 41,7642008 11,000 11,000 230 2,530,000 20.00 50,6002009 9,000 8,700 245 2,132,000 18.10 38,589
Potatoes, Spring Acres Acres Cwt. Cwt. $/Cwt. $1,000 2000 18,800 18,800 395 7,426,000 12.20 90,5972001 15,500 15,500 390 6,045,000 12.40 74,9582002 19,000 19,000 405 7,695,000 19.80 152,3612003 19,000 19,000 440 8,360,000 12.60 105,3362004 17,500 17,500 475 8,313,000 13.40 111,3882005 15,100 15,100 405 6,116,000 13.00 79,5022006 15,300 15,300 395 6,044,000 12.00 72,5222007 15,500 15,500 395 6,123,000 10.10 61,8372008 15,400 15,400 450 6,930,000 14.20 98,4062009 17,800 17,500 410 7,175,000 17.50 125,563
Potatoes, Summer Acres Acres Cwt. Cwt. $/Cwt. $1,000 2000 7,500 7,500 355 2,663,000 18.10 48,2002001 8,000 8,000 355 2,840,000 15.40 43,7362002 7,300 7,300 360 2,628,000 19.10 50,1952003 7,500 7,200 385 2,772,000 16.40 45,4612004 5,100 5,100 350 1,785,000 14.50 25,8832005 3,500 3,500 355 1,243,000 14.40 17,8922006 3,600 3,600 335 1,206,000 15.30 18,4522007 4,300 4,300 360 1,548,000 10.80 16,7182008 3,600 3,600 360 1,296,000 19.90 25,7902009 3,400 3,400 405 1,377,000 19.80 27,086
Potatoes, Fall Acres Acres Cwt. Cwt. $/Cwt. $1,000 2000 8,700 8,700 430 3,741,000 5.80 21,6982001 3,400 3,400 445 1,513,000 8.25 12,4822002 8,300 8,300 520 4,316,000 8.45 36,4702003 8,300 8,300 425 3,528,000 9.20 32,4532004 7,600 7,600 480 3,648,000 7.95 29,0022005 7,600 7,600 435 3,306,000 7.35 24,2992006 8,600 8,600 450 3,870,000 6.75 26,1232007 7,900 7,900 480 3,792,000 7.70 29,1982008 8,400 8,400 470 3,948,000 7.55 29,8072009 8,000 8,000 495 3,960,000 8.95 37,214
Continued on Next Page

USDA, NASS, California Field Office 19 California Agricultural Statistics, 2009
Field Crop Acreage, Production and Value, 2000‐2009Crop Crop Year Planted Harvested Yield Per Acre Production Value Per Unit Total Value
Potatoes, All Acres Acres Cwt. Cwt. $/Cwt. $1,000 (Excluding Sweet) 2000 44,000 44,000 380 16,710,000 12.50 209,455
2001 35,900 35,900 367 13,188,000 14.20 186,1392002 43,600 43,600 391 17,069,000 17.50 297,3462003 43,300 43,000 402 17,295,000 14.80 253,6052004 43,200 43,200 393 16,996,000 14.30 240,0482005 40,200 40,200 352 14,165,000 13.40 188,5432006 39,500 39,500 361 14,240,000 12.30 173,2572007 38,200 38,200 359 13,721,000 11.00 149,5172008 38,400 38,400 383 14,704,000 14.00 204,6032009 38,200 37,600 389 14,644,000 15.60 228,452
Potatoes, Sweet Acres Acres Cwt. Cwt. $/Cwt. $1,000 2000 10,500 10,500 250 2,625,000 24.10 63,2632001 10,000 10,000 230 2,300,000 26.90 61,8702002 10,400 10,400 280 2,912,000 23.10 67,2672003 10,700 10,700 300 3,210,000 25.20 80,8922004 11,500 11,500 280 3,220,000 25.00 80,5002005 11,700 11,700 285 3,335,000 25.30 84,3762006 12,700 12,700 305 3,874,000 20.10 77,8672007 13,500 13,300 320 4,256,000 19.00 80,8642008 14,800 14,800 295 4,366,000 30.40 132,7262009 17,400 17,400 340 5,916,000 26.80 158,549
Rice, Long 3/ Acres Acres Cwt. Cwt. $/Cwt. $1,000 2000 9,000 9,000 71.00 639,000 ‐‐‐ ‐‐‐2001 13,000 13,000 77.00 1,001,000 ‐‐‐ ‐‐‐2002 7,000 7,000 64.00 448,000 ‐‐‐ ‐‐‐2003 7,000 7,000 69.00 483,000 ‐‐‐ ‐‐‐2004 7,000 7,000 73.00 511,000 ‐‐‐ ‐‐‐2005 9,000 9,000 71.00 639,000 ‐‐‐ ‐‐‐2006 6,000 5,000 58.00 290,000 ‐‐‐ ‐‐‐2007 9,000 9,000 71.00 639,000 ‐‐‐ ‐‐‐2008 9,000 9,000 69.00 621,000 ‐‐‐ ‐‐‐2009 5,000 5,000 66.00 330,000 ‐‐‐ ‐‐‐
Rice, Medium 3/ Acres Acres Cwt. Cwt. $/Cwt. $1,000 2000 507,000 505,000 80.00 40,400,000 ‐‐‐ ‐‐‐2001 435,000 433,000 83.00 35,939,000 ‐‐‐ ‐‐‐2002 500,000 495,000 83.00 41,085,000 ‐‐‐ ‐‐‐2003 460,000 458,000 78.40 35,907,000 ‐‐‐ ‐‐‐2004 540,000 535,000 88.00 47,080,000 ‐‐‐ ‐‐‐2005 465,000 463,000 75.50 34,957,000 ‐‐‐ ‐‐‐2006 460,000 458,000 78.80 36,090,000 ‐‐‐ ‐‐‐2007 460,000 459,000 85.00 39,015,000 ‐‐‐ ‐‐‐2008 460,000 458,000 85.50 39,159,000 ‐‐‐ ‐‐‐2009 505,000 500,000 87.40 43,700,000 ‐‐‐ ‐‐‐
Rice, Short 3/ 13/ Acres Acres Cwt. Cwt. $/Cwt. $1,000 2000 34,000 34,000 73.00 2,482,000 ‐‐‐ ‐‐‐2001 25,000 25,000 62.00 1,550,000 ‐‐‐ ‐‐‐2002 26,000 26,000 56.00 1,456,000 ‐‐‐ ‐‐‐2003 42,000 42,000 63.00 2,646,000 ‐‐‐ ‐‐‐2004 48,000 48,000 66.00 3,168,000 ‐‐‐ ‐‐‐2005 54,000 54,000 60.00 3,240,000 ‐‐‐ ‐‐‐2006 60,000 60,000 61.00 3,660,000 ‐‐‐ ‐‐‐2007 65,000 65,000 62.00 4,030,000 ‐‐‐ ‐‐‐2008 50,000 50,000 65.00 3,250,000 ‐‐‐ ‐‐‐2009 51,000 51,000 74.00 3,774,000 ‐‐‐ ‐‐‐
Continued on Next Page
USDA, NASS, California Field Office 20 California Agricultural Statistics, 2009
Field Crop Acreage, Production and Value, 2000‐2009Crop Crop Year Planted Harvested Yield Per Acre Production Value Per Unit Total Value
Rice, All 13/ 14/ 17/ Acres Acres Cwt. Cwt. $/Cwt. $1,000 2000 550,000 548,000 79.40 43,521,000 4.99 217,1702001 473,000 471,000 81.70 38,490,000 5.28 203,2272002 533,000 528,000 81.40 42,989,000 6.32 271,6902003 509,000 507,000 77.00 39,036,000 10.40 405,9742004 595,000 590,000 86.00 50,759,000 7.34 372,5712005 528,000 526,000 73.80 38,836,000 10.10 392,2442006 526,000 523,000 76.60 40,040,000 13.00 520,5202007 534,000 533,000 82.00 43,684,000 16.20 707,6812008 519,000 517,000 83.20 43,030,000 27.50 1,183,3252009 561,000 556,000 86.00 47,804,000 18.60 889,154
Acres Acres Pounds Cwt. $/Cwt. $1,000 Safflower 7/ 2005 55,000 54,000 2,350.00 1,269,000 11.30 14,340
2006 56,000 55,500 1,900.00 1,054,500 13.70 14,4472007 50,000 48,500 2,350.00 1,139,750 19.10 21,7692008 105,000 104,000 2,400.00 2,496,000 23.90 59,6542009 59,000 58,000 2,450.00 1,421,000 16.40 23,304
Sorghum For Grain 5/ 15/ Acres Acres Tons Tons $/Ton $1,000 Estimate Discontinued in 2009 2000 12,000 8,000 2.10 16,800 82.20 1,381
2001 10,000 7,000 2.52 17,600 87.60 1,5452002 17,000 11,000 2.24 24,600 92.80 2,2872003 18,000 10,000 2.52 25,200 93.00 2,3442004 28,000 12,000 2.52 30,240 84.00 2,5402005 26,000 10,000 2.52 25,200 90.00 2,2682006 32,000 10,000 2.94 29,400 131.00 3,8512007 39,000 10,000 2.38 23,800 165.00 3,9272008 47,000 9,000 2.66 23,940 126.00 3,0162009 ‐‐‐ ‐‐‐ ‐‐‐ ‐‐‐ ‐‐‐ ‐‐‐
Sorghum For Silage 3/ 15/ Acres Acres Tons Tons $/Ton $1,000 Estimate Discontinued in 2009 2000 ‐‐‐ 4,000 15.00 60,000 ‐‐‐ ‐‐‐
2001 ‐‐‐ 3,000 20.00 60,000 ‐‐‐ ‐‐‐2002 ‐‐‐ 6,000 17.00 102,000 ‐‐‐ ‐‐‐2003 ‐‐‐ 8,000 18.00 144,000 ‐‐‐ ‐‐‐2004 ‐‐‐ 16,000 15.00 240,000 23.98 5,7552005 ‐‐‐ 16,000 18.00 288,000 24.14 6,9522006 ‐‐‐ 22,000 19.00 418,000 25.83 10,7972007 ‐‐‐ 29,000 18.00 522,000 34.61 18,0662008 ‐‐‐ 38,000 17.00 646,000 37.56 24,2642009 ‐‐‐ ‐‐‐ ‐‐‐ ‐‐‐ ‐‐‐ ‐‐‐
Sugar Beets 16/ Acres Acres Tons Tons $/Ton $1,000 2000 98,000 92,500 34.00 3,145,000 30.40 95,6082001 46,600 44,700 35.70 1,596,000 33.40 53,3062002 50,200 49,500 39.60 1,960,000 39.40 77,2242003 50,800 50,100 39.10 1,959,000 39.50 77,3812004 49,100 48,900 40.80 1,995,000 39.10 78,0052005 44,400 44,100 37.10 1,636,000 41.80 68,3852006 43,300 43,100 36.10 1,556,000 42.20 65,6632007 40,000 39,100 35.50 1,388,000 43.60 60,5172008 26,000 25,300 41.60 1,052,000 44.80 47,1302009 25,300 25,300 35.00 886,000 49.10 43,503
Continued on Next Page

USDA, NASS, California Field Office 21 California Agricultural Statistics, 2009
Field Crop Acreage, Production and Value, 2000‐2009Crop Crop Year Planted Harvested Yield Per Acre Production Value Per Unit Total Value
Acres Acres Pounds Cwt. $/Cwt. $1,000 Sunflower , Oil 2005 ‐‐‐ ‐‐‐ ‐‐‐ ‐‐‐ ‐‐‐ ‐‐‐
2006 ‐‐‐ ‐‐‐ ‐‐‐ ‐‐‐ ‐‐‐ ‐‐‐2007 ‐‐‐ ‐‐‐ ‐‐‐ ‐‐‐ ‐‐‐ ‐‐‐2008 ‐‐‐ ‐‐‐ ‐‐‐ ‐‐‐ ‐‐‐ ‐‐‐2009 34,000 33,500 1,200.00 402,000 17.80 7,156
Acres Acres Pounds Cwt. $/Cwt. $1,000 Sunflower , Non‐Oil 2005 ‐‐‐ ‐‐‐ ‐‐‐ ‐‐‐ ‐‐‐ ‐‐‐
2006 ‐‐‐ ‐‐‐ ‐‐‐ ‐‐‐ ‐‐‐ ‐‐‐2007 ‐‐‐ ‐‐‐ ‐‐‐ ‐‐‐ ‐‐‐ ‐‐‐2008 ‐‐‐ ‐‐‐ ‐‐‐ ‐‐‐ ‐‐‐ ‐‐‐2009 8,000 8,000 1,350.00 108,000 21.80 2,354
Acres Acres Pounds Cwt. $/Cwt. $1,000 Sunflower , All 2005 ‐‐‐ ‐‐‐ ‐‐‐ ‐‐‐ ‐‐‐ ‐‐‐
2006 ‐‐‐ ‐‐‐ ‐‐‐ ‐‐‐ ‐‐‐ ‐‐‐2007 ‐‐‐ ‐‐‐ ‐‐‐ ‐‐‐ ‐‐‐ ‐‐‐2008 ‐‐‐ ‐‐‐ ‐‐‐ ‐‐‐ ‐‐‐ ‐‐‐2009 42,000 41,500 1,229.00 510,000 18.60 9,510
Wheat, Winter 1/ Acres Acres Tons Tons $/Ton $1,000 2000 535,000 390,000 2.10 819,000 89.00 72,8912001 530,000 380,000 2.10 798,000 97.67 77,9382002 530,000 300,000 2.28 684,000 115.67 79,1162003 740,000 410,000 1.83 750,300 114.00 85,5342004 560,000 320,000 2.55 816,000 118.00 96,2882005 495,000 300,000 2.16 648,000 120.33 77,9762006 450,000 250,000 1.74 435,000 137.00 59,5952007 550,000 265,000 2.43 643,950 178.00 114,6232008 680,000 400,000 2.55 1,020,000 233.33 238,0002009 615,000 330,000 2.40 792,000 175.00 138,600
Wheat, Durum Acres Acres Tons Tons $/Ton $1,000 2000 100,000 97,000 3.00 291,000 106.33 30,9432001 85,000 81,000 3.15 255,200 128.97 32,9142002 95,000 90,000 3.00 270,000 132.00 35,6402003 130,000 115,000 3.00 345,000 150.33 51,8652004 120,000 100,000 2.70 270,000 145.67 39,3302005 75,000 69,000 2.85 196,650 134.67 26,4822006 70,000 65,000 2.97 193,050 140.33 27,0912007 90,000 80,000 3.00 240,000 187.33 44,9602008 160,000 145,000 3.15 456,750 251.00 114,6442009 180,000 170,000 3.00 510,000 200.00 102,000
Continued on Next Page

USDA, NASS, California Field Office 22 California Agricultural Statistics, 2009
Field Crop Acreage, Production and Value, 2000‐2009Crop Crop Year Planted Harvested Yield Per Acre Production Value Per Unit Total Value
Wheat, All 1/ Acres Acres Tons Tons $/Ton $1,000 2000 635,000 487,000 2.28 1,110,000 94.00 103,8342001 615,000 461,000 2.28 1,053,200 103.67 110,8522002 625,000 390,000 2.45 954,000 120.33 114,7562003 870,000 525,000 2.09 1,095,300 118.00 137,3992004 680,000 420,000 2.59 1,086,000 126.67 135,6182005 570,000 369,000 2.29 844,650 124.67 104,4582006 520,000 315,000 1.99 628,050 138.00 86,6862007 640,000 345,000 2.56 883,950 180.33 159,5832008 840,000 545,000 2.71 1,476,750 236.00 352,6442009 795,000 500,000 2.60 1,302,000 184.79 240,600
1/ Area planted includes preceding fall. 2/ Production is on a clean basis. 3/ Missing data has not been published due to the estimate being discontinued, not estimated, or not available. 4/ Includes varieties not listed separately. Excludes beans grown for garden seed. 5/ Planted acreage is for all purposes. 6/ Production ginned. Cotton bales are 480 lbs. net‐weight. 7/ Estimates began in 2005. 8/ All alfalfa forage production is the sum of alfalfa harvested as dry hay; and alfalfa haylage and greenchop production after converting it to a dry equivalent basis. 9/ All forage production is the sum of the following dry equivalents: alfalfa hay and all other hay harvested as dry hay, alfalfa haylage and greenchop, all other hay haylage and greenchop; after converting alfalfa and all other haylage and greenchop to a dry equivalent basis.10/ Estimated marketings of alfalfa and other hay used as weights to calculate all hay prices.11/ Includes only alfalfa and alfalfa mixtures that were harvested as haylage or greenchop (green weight). Alfalfa harvested as dry hay is not included. 12/ Includes all types of forage harvested as haylage or greenchop (green weight). Forage harvested as dry hay and corn and sorghum silage/greenchop are not included. 13/ Sweet rice acreage has been included since the 2003 crop year, but not previous years.14/ Excludes wild rice. 15/ Estimates began in 2000. 16/ Relates to year of intended harvest for fall planted beets in central California and to year of planting for overwintered beets in central and southern California. 17/ Preliminary Marketing Year Average Price.

USDA, NASS, California Field Office 23 California Agricultural Statistics, 2009
Field Crop Monthly Average Prices Received, 2000‐2009
Crop Crop Year
Jan. Feb. Mar. Apr. May June July Aug. Sept. Oct. Nov. Dec.
Barley 1/ $/Ton2000 94.00 102.00 103.00 99.00 101.00 103.00 101.00 96.00 ‐‐‐ ‐‐‐ ‐‐‐ ‐‐‐2001 ‐‐‐ ‐‐‐ ‐‐‐ ‐‐‐ ‐‐‐ 100.00 94.00 91.00 91.00 101.00 ‐‐‐ 95.002002 ‐‐‐ ‐‐‐ ‐‐‐ ‐‐‐ ‐‐‐ ‐‐‐ ‐‐‐ ‐‐‐ ‐‐‐ ‐‐‐ ‐‐‐ ‐‐‐2003 ‐‐‐ ‐‐‐ ‐‐‐ ‐‐‐ ‐‐‐ 117.00 113.00 110.00 ‐‐‐ 126.00 ‐‐‐ ‐‐‐2004 ‐‐‐ ‐‐‐ ‐‐‐ ‐‐‐ ‐‐‐ 115.00 118.00 ‐‐‐ ‐‐‐ ‐‐‐ ‐‐‐ ‐‐‐2005 ‐‐‐ ‐‐‐ ‐‐‐ ‐‐‐ ‐‐‐ ‐‐‐ ‐‐‐ 95.00 ‐‐‐ ‐‐‐ ‐‐‐ ‐‐‐2006 118.00 ‐‐‐ ‐‐‐ ‐‐‐ 120.00 99.60 ‐‐‐ 110.00 ‐‐‐ ‐‐‐ ‐‐‐ ‐‐‐2007 ‐‐‐ ‐‐‐ ‐‐‐ ‐‐‐ ‐‐‐ 155.40 ‐‐‐ ‐‐‐ ‐‐‐ ‐‐‐ ‐‐‐ ‐‐‐2008 ‐‐‐ ‐‐‐ ‐‐‐ ‐‐‐ ‐‐‐ ‐‐‐ ‐‐‐ ‐‐‐ ‐‐‐ ‐‐‐ ‐‐‐ ‐‐‐2009 ‐‐‐ ‐‐‐ ‐‐‐ ‐‐‐ ‐‐‐ ‐‐‐ ‐‐‐ ‐‐‐ ‐‐‐ ‐‐‐ ‐‐‐ ‐‐‐
Beans, Dry Edible 1/ $/Cwt.2000 27.10 26.80 26.70 27.00 26.40 26.60 26.00 25.80 27.20 27.10 27.20 26.602001 26.90 26.90 26.60 26.80 26.80 26.30 26.30 27.00 27.20 28.60 31.50 31.202002 31.80 31.60 32.70 32.20 32.30 31.90 32.40 33.40 32.50 31.70 31.60 32.602003 32.50 32.60 36.30 35.00 35.40 35.70 34.20 29.60 32.00 41.10 35.20 35.602004 35.00 32.50 36.30 34.80 31.10 34.50 35.80 36.30 35.80 38.70 36.80 38.402005 40.70 37.00 37.20 37.90 35.50 39.80 35.10 ‐‐‐ 30.40 37.80 46.40 44.802006 40.00 42.80 44.50 42.60 42.30 41.40 38.20 41.30 38.30 49.10 48.10 54.002007 43.70 47.80 56.20 42.50 36.90 42.70 43.00 36.30 39.00 ‐‐‐ 46.90 49.202008 45.10 47.30 ‐‐‐ ‐‐‐ 47.70 ‐‐‐ 49.10 ‐‐‐ 53.00 ‐‐‐ 64.10 66.702009 67.10 58.50 66.80 61.00 ‐‐‐ ‐‐‐ ‐‐‐ ‐‐‐ 46.30 44.40 54.70 56.80
Cotton Lint, Upland 1/ ¢/Lb.2000 ‐‐‐ 57.90 ‐‐‐ ‐‐‐ 58.70 ‐‐‐ ‐‐‐ ‐‐‐ 66.10 64.90 69.00 68.202001 57.80 57.40 ‐‐‐ 39.60 39.70 36.50 37.10 ‐‐‐ 47.90 ‐‐‐ 35.10 53.302002 39.40 ‐‐‐ ‐‐‐ ‐‐‐ ‐‐‐ ‐‐‐ ‐‐‐ ‐‐‐ ‐‐‐ 51.80 55.60 ‐‐‐2003 ‐‐‐ 58.40 59.10 ‐‐‐ ‐‐‐ ‐‐‐ ‐‐‐ ‐‐‐ 68.60 78.20 76.10 75.002004 69.60 72.60 70.30 68.20 ‐‐‐ ‐‐‐ ‐‐‐ ‐‐‐ ‐‐‐ ‐‐‐ 53.50 51.502005 51.10 49.80 ‐‐‐ ‐‐‐ 51.70 ‐‐‐ ‐‐‐ ‐‐‐ 54.70 60.60 57.40 67.902006 61.00 58.90 61.20 62.40 60.00 ‐‐‐ ‐‐‐ ‐‐‐ ‐‐‐ ‐‐‐ 53.80 67.602007 58.00 64.00 59.30 ‐‐‐ 55.70 ‐‐‐ 56.60 ‐‐‐ ‐‐‐ ‐‐‐ ‐‐‐ ‐‐‐2008 ‐‐‐ 73.40 ‐‐‐ ‐‐‐ ‐‐‐ ‐‐‐ ‐‐‐ ‐‐‐ ‐‐‐ ‐‐‐ ‐‐‐ ‐‐‐2009 ‐‐‐ ‐‐‐ 58.9 62.3 ‐‐‐ ‐‐‐ ‐‐‐ ‐‐‐ ‐‐‐ ‐‐‐ ‐‐‐ ‐‐‐
Cottonseed 1/ 2/ $/Ton2000 116.00 137.00 ‐‐‐ ‐‐‐ ‐‐‐ ‐‐‐ ‐‐‐ ‐‐‐ ‐‐‐ 145.00 140.00 134.002001 136.00 143.00 ‐‐‐ ‐‐‐ ‐‐‐ ‐‐‐ ‐‐‐ ‐‐‐ ‐‐‐ 146.00 141.00 145.002002 132.00 137.00 ‐‐‐ ‐‐‐ ‐‐‐ ‐‐‐ ‐‐‐ ‐‐‐ ‐‐‐ 150.00 142.00 132.002003 ‐‐‐ ‐‐‐ ‐‐‐ ‐‐‐ ‐‐‐ ‐‐‐ ‐‐‐ ‐‐‐ ‐‐‐ 184.00 158.00 153.002004 ‐‐‐ 150.00 ‐‐‐ ‐‐‐ ‐‐‐ ‐‐‐ ‐‐‐ ‐‐‐ ‐‐‐ 161.00 144.00 155.002005 145.00 ‐‐‐ ‐‐‐ ‐‐‐ ‐‐‐ ‐‐‐ ‐‐‐ ‐‐‐ ‐‐‐ 169.00 149.00 136.002006 ‐‐‐ ‐‐‐ ‐‐‐ ‐‐‐ ‐‐‐ ‐‐‐ ‐‐‐ ‐‐‐ ‐‐‐ 194.00 184.00 201.002007 153.00 158.00 ‐‐‐ ‐‐‐ ‐‐‐ ‐‐‐ ‐‐‐ ‐‐‐ ‐‐‐ 246.00 ‐‐‐ ‐‐‐2008 ‐‐‐ ‐‐‐ ‐‐‐ ‐‐‐ ‐‐‐ ‐‐‐ ‐‐‐ ‐‐‐ ‐‐‐ ‐‐‐ 277.00 243.002009 199.00 228.00 ‐‐‐ ‐‐‐ ‐‐‐ ‐‐‐ ‐‐‐ ‐‐‐ ‐‐‐ ‐‐‐ 253.00 279.00
Hay, Alfalfa (Baled) $/Ton2000 85.00 94.00 99.00 96.00 91.00 81.00 76.00 81.00 89.00 97.00 97.00 97.002001 102.00 103.00 111.00 130.00 121.00 114.00 111.00 113.00 125.00 123.00 128.00 124.002002 113.00 122.00 126.00 121.00 116.00 101.00 95.00 90.00 92.00 98.00 101.00 95.002003 99.00 102.00 99.00 99.00 97.00 90.00 85.00 86.00 88.00 94.00 98.00 89.002004 89.00 97.00 105.00 126.00 122.00 115.00 109.00 109.00 113.00 119.00 122.00 119.002005 121.00 131.00 133.00 141.00 144.00 134.00 134.00 131.00 135.00 139.00 142.00 138.002006 135.00 136.00 141.00 134.00 124.00 111.00 103.00 105.00 108.00 114.00 116.00 118.002007 125.00 135.00 150.00 150.00 164.00 166.00 162.00 158.00 156.00 166.00 174.00 170.002008 170.00 183.00 195.00 150.00 223.00 217.00 218.00 214.00 208.00 200.00 192.00 175.002009 159.00 162.00 144.00 133.00 119.00 109.00 99.00 96.00 97.00 104.00 102.00 104.00
Continued on Next Page

USDA, NASS, California Field Office 24 California Agricultural Statistics, 2009
Field Crop Monthly Average Prices Received, 2000‐2009
Crop Crop Year
Jan. Feb. Mar. Apr. May June July Aug. Sept. Oct. Nov. Dec.
Hay, All (Baled) $/Ton2000 83.00 88.00 98.00 96.00 90.00 81.00 77.00 81.00 87.00 93.00 95.00 94.002001 100.00 100.00 110.00 128.00 116.00 112.00 108.00 110.00 121.00 117.00 117.00 115.002002 111.00 119.00 123.00 119.00 115.00 98.00 92.00 88.00 89.00 94.00 95.00 94.002003 98.00 100.00 99.00 98.00 94.00 88.00 84.00 85.00 86.00 90.00 93.00 85.002004 88.00 95.00 103.00 121.00 118.00 112.00 108.00 107.00 110.00 115.00 117.00 114.002005 116.00 125.00 127.00 135.00 136.00 126.00 128.00 124.00 127.00 129.00 129.00 129.002006 126.00 128.00 134.00 130.00 120.00 108.00 101.00 101.00 103.00 108.00 110.00 112.002007 118.00 130.00 142.00 142.00 152.00 152.00 153.00 150.00 149.00 156.00 161.00 158.002008 158.00 172.00 183.00 204.00 211.00 203.00 207.00 198.00 191.00 187.00 175.00 163.002009 146.00 155.00 142.00 133.00 118.00 107.00 98.00 95.00 95.00 101.00 97.00 99.00
Potatoes, All $/Cwt.(Excluding Sweet) 2000 12.10 11.90 12.20 14.00 10.80 11.10 14.60 17.40 16.80 8.00 10.80 14.60
2001 15.60 16.00 7.35 6.90 12.10 11.10 12.60 16.00 15.10 11.00 12.70 17.002002 17.20 19.70 15.30 25.00 24.10 18.40 18.80 18.80 20.50 9.95 15.80 18.202003 18.40 15.80 16.20 19.90 14.50 11.30 12.90 17.10 14.70 9.85 12.40 14.302004 15.60 17.30 21.00 21.00 14.20 12.40 13.20 14.30 15.00 8.85 8.60 10.202005 14.40 15.20 15.50 16.80 12.80 12.50 13.20 14.40 14.40 7.85 12.20 10.602006 13.40 11.10 13.00 17.90 11.60 11.30 13.50 15.90 14.50 8.45 8.70 12.502007 13.50 14.50 12.60 6.65 11.30 9.25 9.90 11.10 8.15 7.30 6.65 7.852008 14.70 17.50 16.60 11.10 11.80 13.80 15.90 21.10 19.80 7.65 6.95 14.102009 13.70 13.00 16.70 8.25 15.70 16.60 14.70 9.90 9.50 7.45 6.75 6.70
Wheat, All 1/ $/Ton2000 ‐‐‐ 85.00 87.00 ‐‐‐ ‐‐‐ ‐‐‐ ‐‐‐ ‐‐‐ ‐‐‐ ‐‐‐ ‐‐‐ ‐‐‐2001 ‐‐‐ ‐‐‐ ‐‐‐ ‐‐‐ ‐‐‐ ‐‐‐ ‐‐‐ ‐‐‐ ‐‐‐ ‐‐‐ ‐‐‐ ‐‐‐2002 ‐‐‐ ‐‐‐ ‐‐‐ ‐‐‐ ‐‐‐ 118.00 ‐‐‐ ‐‐‐ ‐‐‐ ‐‐‐ ‐‐‐ ‐‐‐2003 ‐‐‐ ‐‐‐ ‐‐‐ ‐‐‐ ‐‐‐ 125.00 113.00 115.00 113.00 111.00 118.00 120.002004 ‐‐‐ 122.00 ‐‐‐ 131.00 133.00 139.00 125.00 ‐‐‐ ‐‐‐ 107.00 ‐‐‐ ‐‐‐2005 ‐‐‐ ‐‐‐ ‐‐‐ ‐‐‐ 121.00 115.00 ‐‐‐ ‐‐‐ ‐‐‐ ‐‐‐ 95.30 112.002006 116.00 125.00 121.00 135.00 153.00 141.00 131.00 123.00 136.00 140.00 143.00 153.002007 137.00 157.00 148.00 144.00 139.00 172.00 171.00 184.00 203.00 224.00 176.00 231.002008 179.00 ‐‐‐ ‐‐‐ ‐‐‐ ‐‐‐ ‐‐‐ ‐‐‐ ‐‐‐ ‐‐‐ 263.00 ‐‐‐ ‐‐‐2009 ‐‐‐ ‐‐‐ ‐‐‐ ‐‐‐ ‐‐‐ 205.00 185.00 173.00 177.00 172.00 ‐‐‐ 178.00
1/ Missing data was not published due to insufficient sales to establish a price or the price was not published to avoid possible disclosure.2/ Season runs from August to February.

USDA, NASS, California Field Office 25 California Agricultural Statistics, 2009
Barley Acreage, Yield and Production by County, 2008‐09
County
2008 2009
Planted Harvested Yield/Acre Production Planted Harvested Yield/Acre Production
Acres Acres Tons Tons Acres Acres Tons Tons
Del Norte ‐‐‐ ‐‐‐ ‐‐‐ ‐‐‐ ‐‐‐ ‐‐‐ ‐‐‐ ‐‐‐ Humboldt ‐‐‐ ‐‐‐ ‐‐‐ ‐‐‐ ‐‐‐ ‐‐‐ ‐‐‐ ‐‐‐ Mendocino ‐‐‐ ‐‐‐ ‐‐‐ ‐‐‐ ‐‐‐ ‐‐‐ ‐‐‐ ‐‐‐ District 10 Total ‐‐‐ ‐‐‐ ‐‐‐ ‐‐‐ ‐‐‐ ‐‐‐ ‐‐‐ ‐‐‐ Shasta ‐‐‐ ‐‐‐ ‐‐‐ ‐‐‐ ‐‐‐ ‐‐‐ ‐‐‐ ‐‐‐ Siskiyou ‐‐‐ ‐‐‐ ‐‐‐ ‐‐‐ ‐‐‐ ‐‐‐ ‐‐‐ ‐‐‐ Trinity ‐‐‐ ‐‐‐ ‐‐‐ ‐‐‐ ‐‐‐ ‐‐‐ ‐‐‐ ‐‐‐ Other Counties 1/ 10,000 6,600 1 97 13,008 7,300 5,400 1.80 9,744 District 20 Total 10,000 6,600 1.97 13,008 7,300 5,400 1.80 9,744 Lassen ‐‐‐ ‐‐‐ ‐‐‐ ‐‐‐ ‐‐‐ ‐‐‐ ‐‐‐ ‐‐‐ Modoc ‐‐‐ ‐‐‐ ‐‐‐ ‐‐‐ ‐‐‐ ‐‐‐ ‐‐‐ ‐‐‐ Plumas ‐‐‐ ‐‐‐ ‐‐‐ ‐‐‐ ‐‐‐ ‐‐‐ ‐‐‐ ‐‐‐ Other Counties 1/ 3,400 2,400 2.62 6,288 2,700 1,900 2.36 4,488 District 30 Total 3,400 2,400 2.62 6,288 2,700 1,900 2.36 4,488 Alameda ‐‐‐ ‐‐‐ ‐‐‐ ‐‐‐ ‐‐‐ ‐‐‐ ‐‐‐ ‐‐‐ Contra Costa ‐‐‐ ‐‐‐ ‐‐‐ ‐‐‐ ‐‐‐ ‐‐‐ ‐‐‐ ‐‐‐ Lake ‐‐‐ ‐‐‐ ‐‐‐ ‐‐‐ ‐‐‐ ‐‐‐ ‐‐‐ ‐‐‐ Marin ‐‐‐ ‐‐‐ ‐‐‐ ‐‐‐ ‐‐‐ ‐‐‐ ‐‐‐ ‐‐‐ Monterey 4,000 2,200 1.16 2,544 5,000 2,700 0.68 1,824 Napa ‐‐‐ ‐‐‐ ‐‐‐ ‐‐‐ ‐‐‐ ‐‐‐ ‐‐‐ ‐‐‐ San Benito ‐‐‐ ‐‐‐ ‐‐‐ ‐‐‐ ‐‐‐ ‐‐‐ ‐‐‐ ‐‐‐ San Francisco ‐‐‐ ‐‐‐ ‐‐‐ ‐‐‐ ‐‐‐ ‐‐‐ ‐‐‐ ‐‐‐ San Luis Obispo 20,500 18,100 0.68 12,384 19,500 12,800 0.51 6,552 San Mateo ‐‐‐ ‐‐‐ ‐‐‐ ‐‐‐ ‐‐‐ ‐‐‐ ‐‐‐ ‐‐‐ Santa Clara ‐‐‐ ‐‐‐ ‐‐‐ ‐‐‐ ‐‐‐ ‐‐‐ ‐‐‐ ‐‐‐ Santa Cruz ‐‐‐ ‐‐‐ ‐‐‐ ‐‐‐ ‐‐‐ ‐‐‐ ‐‐‐ ‐‐‐ Sonoma ‐‐‐ ‐‐‐ ‐‐‐ ‐‐‐ ‐‐‐ ‐‐‐ ‐‐‐ ‐‐‐ Other Counties 1/ 1,400 500 1 20 600 2,500 700 0.89 624 District 40 Total 25,900 20,800 0.75 15,528 27,000 16,200 0.56 9,000 Butte ‐‐‐ ‐‐‐ ‐‐‐ ‐‐‐ ‐‐‐ ‐‐‐ ‐‐‐ ‐‐‐ Colusa ‐‐‐ ‐‐‐ ‐‐‐ ‐‐‐ ‐‐‐ ‐‐‐ ‐‐‐ ‐‐‐ Glenn ‐‐‐ ‐‐‐ ‐‐‐ ‐‐‐ 800 600 2.24 1,344 Sacramento ‐‐‐ ‐‐‐ ‐‐‐ ‐‐‐ ‐‐‐ ‐‐‐ ‐‐‐ ‐‐‐ Solano ‐‐‐ ‐‐‐ ‐‐‐ ‐‐‐ ‐‐‐ ‐‐‐ ‐‐‐ ‐‐‐ Sutter ‐‐‐ ‐‐‐ ‐‐‐ ‐‐‐ ‐‐‐ ‐‐‐ ‐‐‐ ‐‐‐ Tehama 1,700 1,700 1.13 1,920 ‐‐‐ ‐‐‐ ‐‐‐ ‐‐‐ Yolo 2,400 2,300 1 52 3,504 ‐‐‐ ‐‐‐ ‐‐‐ ‐‐‐ Yuba ‐‐‐ ‐‐‐ ‐‐‐ ‐‐‐ ‐‐‐ ‐‐‐ ‐‐‐ ‐‐‐ Other Counties 1/ 3,100 2,700 1.43 3,864 6,300 6,000 1.08 6,480 District 50 Total 7,200 6,700 1.39 9,288 7,100 6,600 1.19 7,824 Fresno ‐‐‐ ‐‐‐ ‐‐‐ ‐‐‐ ‐‐‐ ‐‐‐ ‐‐‐ ‐‐‐ Kern ‐‐‐ ‐‐‐ ‐‐‐ ‐‐‐ ‐‐‐ ‐‐‐ ‐‐‐ ‐‐‐ Kings ‐‐‐ ‐‐‐ ‐‐‐ ‐‐‐ ‐‐‐ ‐‐‐ ‐‐‐ ‐‐‐ Madera ‐‐‐ ‐‐‐ ‐‐‐ ‐‐‐ ‐‐‐ ‐‐‐ ‐‐‐ ‐‐‐ Merced ‐‐‐ ‐‐‐ ‐‐‐ ‐‐‐ ‐‐‐ ‐‐‐ ‐‐‐ ‐‐‐ San Joaquin ‐‐‐ ‐‐‐ ‐‐‐ ‐‐‐ 1,100 1,000 1.01 1,008 Stanislaus ‐‐‐ ‐‐‐ ‐‐‐ ‐‐‐ ‐‐‐ ‐‐‐ ‐‐‐ ‐‐‐ Tulare ‐‐‐ ‐‐‐ ‐‐‐ ‐‐‐ ‐‐‐ ‐‐‐ ‐‐‐ ‐‐‐ Other Counties 1/ ‐‐‐ ‐‐‐ ‐‐‐ ‐‐‐ 37,900 21,900 1.71 37,512 District 51 Total ‐‐‐ ‐‐‐ ‐‐‐ ‐‐‐ 39,000 22,900 1.68 38,520 Alpine ‐‐‐ ‐‐‐ ‐‐‐ ‐‐‐ ‐‐‐ ‐‐‐ ‐‐‐ ‐‐‐ Amador ‐‐‐ ‐‐‐ ‐‐‐ ‐‐‐ ‐‐‐ ‐‐‐ ‐‐‐ ‐‐‐ Calaveras ‐‐‐ ‐‐‐ ‐‐‐ ‐‐‐ ‐‐‐ ‐‐‐ ‐‐‐ ‐‐‐ El Dorado ‐‐‐ ‐‐‐ ‐‐‐ ‐‐‐ ‐‐‐ ‐‐‐ ‐‐‐ ‐‐‐ Inyo ‐‐‐ ‐‐‐ ‐‐‐ ‐‐‐ ‐‐‐ ‐‐‐ ‐‐‐ ‐‐‐ Mariposa ‐‐‐ ‐‐‐ ‐‐‐ ‐‐‐ ‐‐‐ ‐‐‐ ‐‐‐ ‐‐‐ Mono ‐‐‐ ‐‐‐ ‐‐‐ ‐‐‐ ‐‐‐ ‐‐‐ ‐‐‐ ‐‐‐ Nevada ‐‐‐ ‐‐‐ ‐‐‐ ‐‐‐ ‐‐‐ ‐‐‐ ‐‐‐ ‐‐‐ Placer ‐‐‐ ‐‐‐ ‐‐‐ ‐‐‐ ‐‐‐ ‐‐‐ ‐‐‐ ‐‐‐ Sierra ‐‐‐ ‐‐‐ ‐‐‐ ‐‐‐ ‐‐‐ ‐‐‐ ‐‐‐ ‐‐‐ Tuolumne ‐‐‐ ‐‐‐ ‐‐‐ ‐‐‐ ‐‐‐ ‐‐‐ ‐‐‐ ‐‐‐ District 60 Total ‐‐‐ ‐‐‐ ‐‐‐ ‐‐‐ ‐‐‐ ‐‐‐ ‐‐‐ ‐‐‐ Imperial ‐‐‐ ‐‐‐ ‐‐‐ ‐‐‐ ‐‐‐ ‐‐‐ ‐‐‐ ‐‐‐ Los Angeles ‐‐‐ ‐‐‐ ‐‐‐ ‐‐‐ ‐‐‐ ‐‐‐ ‐‐‐ ‐‐‐ Orange ‐‐‐ ‐‐‐ ‐‐‐ ‐‐‐ ‐‐‐ ‐‐‐ ‐‐‐ ‐‐‐ Riverside ‐‐‐ ‐‐‐ ‐‐‐ ‐‐‐ ‐‐‐ ‐‐‐ ‐‐‐ ‐‐‐ San Bernardino ‐‐‐ ‐‐‐ ‐‐‐ ‐‐‐ ‐‐‐ ‐‐‐ ‐‐‐ ‐‐‐ San Diego ‐‐‐ ‐‐‐ ‐‐‐ ‐‐‐ ‐‐‐ ‐‐‐ ‐‐‐ ‐‐‐ Santa Barbara ‐‐‐ ‐‐‐ ‐‐‐ ‐‐‐ ‐‐‐ ‐‐‐ ‐‐‐ ‐‐‐ Ventura ‐‐‐ ‐‐‐ ‐‐‐ ‐‐‐ ‐‐‐ ‐‐‐ ‐‐‐ ‐‐‐ Other Counties 1/ ‐‐‐ ‐‐‐ ‐‐‐ ‐‐‐ 6,900 2,000 0.85 1,704 District 80 Total ‐‐‐ ‐‐‐ ‐‐‐ ‐‐‐ 6,900 2,000 0.85 1,704 Other Districts 1/ 48,500 23,500 1.49 35,088 ‐‐‐ ‐‐‐ ‐‐‐ ‐‐‐ STATE 95,000 60,000 1.32 79,200 90,000 55,000 1.30 71,280
1/ Counties or district data combined to avoid disclosing data for individual farms.

USDA, NASS, California Field Office 26 California Agricultural Statistics, 2009
Dry Edible Bean Acreage, Yield and Production by County, 2008‐09
County
2008 2009
Planted Harvested Yield/Acre Production Planted Harvested Yield/Acre Production
Acres Acres Pounds Cwt. Acres Acres Pounds Cwt.
Del Norte ‐‐‐ ‐‐‐ ‐‐‐ ‐‐‐ ‐‐‐ ‐‐‐ ‐‐‐ ‐‐‐ Humboldt ‐‐‐ ‐‐‐ ‐‐‐ ‐‐‐ ‐‐‐ ‐‐‐ ‐‐‐ ‐‐‐ Mendocino ‐‐‐ ‐‐‐ ‐‐‐ ‐‐‐ ‐‐‐ ‐‐‐ ‐‐‐ ‐‐‐ District 10 Total ‐‐‐ ‐‐‐ ‐‐‐ ‐‐‐ ‐‐‐ ‐‐‐ ‐‐‐ ‐‐‐ Shasta ‐‐‐ ‐‐‐ ‐‐‐ ‐‐‐ ‐‐‐ ‐‐‐ ‐‐‐ ‐‐‐ Siskiyou ‐‐‐ ‐‐‐ ‐‐‐ ‐‐‐ ‐‐‐ ‐‐‐ ‐‐‐ ‐‐‐ Trinity ‐‐‐ ‐‐‐ ‐‐‐ ‐‐‐ ‐‐‐ ‐‐‐ ‐‐‐ ‐‐‐ District 20 Total ‐‐‐ ‐‐‐ ‐‐‐ ‐‐‐ ‐‐‐ ‐‐‐ ‐‐‐ ‐‐‐ Lassen ‐‐‐ ‐‐‐ ‐‐‐ ‐‐‐ ‐‐‐ ‐‐‐ ‐‐‐ ‐‐‐ Modoc ‐‐‐ ‐‐‐ ‐‐‐ ‐‐‐ ‐‐‐ ‐‐‐ ‐‐‐ ‐‐‐ Plumas ‐‐‐ ‐‐‐ ‐‐‐ ‐‐‐ ‐‐‐ ‐‐‐ ‐‐‐ ‐‐‐ District 30 Total ‐‐‐ ‐‐‐ ‐‐‐ ‐‐‐ ‐‐‐ ‐‐‐ ‐‐‐ ‐‐‐ Alameda ‐‐‐ ‐‐‐ ‐‐‐ ‐‐‐ ‐‐‐ ‐‐‐ ‐‐‐ ‐‐‐ Contra Costa ‐‐‐ ‐‐‐ ‐‐‐ ‐‐‐ ‐‐‐ ‐‐‐ ‐‐‐ ‐‐‐ Lake ‐‐‐ ‐‐‐ ‐‐‐ ‐‐‐ ‐‐‐ ‐‐‐ ‐‐‐ ‐‐‐ Marin ‐‐‐ ‐‐‐ ‐‐‐ ‐‐‐ ‐‐‐ ‐‐‐ ‐‐‐ ‐‐‐ Monterey ‐‐‐ ‐‐‐ ‐‐‐ ‐‐‐ ‐‐‐ ‐‐‐ ‐‐‐ ‐‐‐ Napa ‐‐‐ ‐‐‐ ‐‐‐ ‐‐‐ ‐‐‐ ‐‐‐ ‐‐‐ ‐‐‐ San Benito ‐‐‐ ‐‐‐ ‐‐‐ ‐‐‐ ‐‐‐ ‐‐‐ ‐‐‐ ‐‐‐ San Francisco ‐‐‐ ‐‐‐ ‐‐‐ ‐‐‐ ‐‐‐ ‐‐‐ ‐‐‐ ‐‐‐ San Luis Obispo ‐‐‐ ‐‐‐ ‐‐‐ ‐‐‐ ‐‐‐ ‐‐‐ ‐‐‐ ‐‐‐ San Mateo ‐‐‐ ‐‐‐ ‐‐‐ ‐‐‐ ‐‐‐ ‐‐‐ ‐‐‐ ‐‐‐ Santa Clara ‐‐‐ ‐‐‐ ‐‐‐ ‐‐‐ ‐‐‐ ‐‐‐ ‐‐‐ ‐‐‐ Santa Cruz ‐‐‐ ‐‐‐ ‐‐‐ ‐‐‐ ‐‐‐ ‐‐‐ ‐‐‐ ‐‐‐ Sonoma ‐‐‐ ‐‐‐ ‐‐‐ ‐‐‐ ‐‐‐ ‐‐‐ ‐‐‐ ‐‐‐ Other Counties ‐‐‐ ‐‐‐ ‐‐‐ ‐‐‐ ‐‐‐ ‐‐‐ ‐‐‐ ‐‐‐ District 40 Total ‐‐‐ ‐‐‐ ‐‐‐ ‐‐‐ ‐‐‐ ‐‐‐ ‐‐‐ ‐‐‐ Butte ‐‐‐ ‐‐‐ ‐‐‐ ‐‐‐ ‐‐‐ ‐‐‐ ‐‐‐ ‐‐‐ Colusa ‐‐‐ ‐‐‐ ‐‐‐ ‐‐‐ 6,000 6,000 2,000 120,000 Glenn ‐‐‐ ‐‐‐ ‐‐‐ ‐‐‐ ‐‐‐ ‐‐‐ ‐‐‐ ‐‐‐ Sacramento ‐‐‐ ‐‐‐ ‐‐‐ ‐‐‐ ‐‐‐ ‐‐‐ ‐‐‐ ‐‐‐ Solano ‐‐‐ ‐‐‐ ‐‐‐ ‐‐‐ ‐‐‐ ‐‐‐ ‐‐‐ ‐‐‐ Sutter ‐‐‐ ‐‐‐ ‐‐‐ ‐‐‐ ‐‐‐ ‐‐‐ ‐‐‐ ‐‐‐ Tehama ‐‐‐ ‐‐‐ ‐‐‐ ‐‐‐ ‐‐‐ ‐‐‐ ‐‐‐ ‐‐‐ Yolo ‐‐‐ ‐‐‐ ‐‐‐ ‐‐‐ ‐‐‐ ‐‐‐ ‐‐‐ ‐‐‐ Yuba ‐‐‐ ‐‐‐ ‐‐‐ ‐‐‐ ‐‐‐ ‐‐‐ ‐‐‐ ‐‐‐ Other Counties 1/ ‐‐‐ ‐‐‐ ‐‐‐ ‐‐‐ 22,700 22,500 1,860 418,000 District 50 Total ‐‐‐ ‐‐‐ ‐‐‐ ‐‐‐ 28,700 28,500 1,890 538,000 Fresno ‐‐‐ ‐‐‐ ‐‐‐ ‐‐‐ ‐‐‐ ‐‐‐ ‐‐‐ ‐‐‐ Kern ‐‐‐ ‐‐‐ ‐‐‐ ‐‐‐ ‐‐‐ ‐‐‐ ‐‐‐ ‐‐‐ Kings ‐‐‐ ‐‐‐ ‐‐‐ ‐‐‐ ‐‐‐ ‐‐‐ ‐‐‐ ‐‐‐ Madera ‐‐‐ ‐‐‐ ‐‐‐ ‐‐‐ 500 500 2,400 12,000 Merced ‐‐‐ ‐‐‐ ‐‐‐ ‐‐‐ ‐‐‐ ‐‐‐ ‐‐‐ ‐‐‐ San Joaquin ‐‐‐ ‐‐‐ ‐‐‐ ‐‐‐ ‐‐‐ ‐‐‐ ‐‐‐ ‐‐‐ Stanislaus ‐‐‐ ‐‐‐ ‐‐‐ ‐‐‐ 6,300 6,300 2,940 185,000 Tulare ‐‐‐ ‐‐‐ ‐‐‐ ‐‐‐ ‐‐‐ ‐‐‐ ‐‐‐ ‐‐‐ Other Counties 1/ ‐‐‐ ‐‐‐ ‐‐‐ ‐‐‐ 30,700 30,400 2,390 727,000 District 51 Total ‐‐‐ ‐‐‐ ‐‐‐ ‐‐‐ 37,500 37,200 2,480 924,000 Alpine ‐‐‐ ‐‐‐ ‐‐‐ ‐‐‐ ‐‐‐ ‐‐‐ ‐‐‐ ‐‐‐ Amador ‐‐‐ ‐‐‐ ‐‐‐ ‐‐‐ ‐‐‐ ‐‐‐ ‐‐‐ ‐‐‐ Calaveras ‐‐‐ ‐‐‐ ‐‐‐ ‐‐‐ ‐‐‐ ‐‐‐ ‐‐‐ ‐‐‐ El Dorado ‐‐‐ ‐‐‐ ‐‐‐ ‐‐‐ ‐‐‐ ‐‐‐ ‐‐‐ ‐‐‐ Inyo ‐‐‐ ‐‐‐ ‐‐‐ ‐‐‐ ‐‐‐ ‐‐‐ ‐‐‐ ‐‐‐ Mariposa ‐‐‐ ‐‐‐ ‐‐‐ ‐‐‐ ‐‐‐ ‐‐‐ ‐‐‐ ‐‐‐ Mono ‐‐‐ ‐‐‐ ‐‐‐ ‐‐‐ ‐‐‐ ‐‐‐ ‐‐‐ ‐‐‐ Nevada ‐‐‐ ‐‐‐ ‐‐‐ ‐‐‐ ‐‐‐ ‐‐‐ ‐‐‐ ‐‐‐ Placer ‐‐‐ ‐‐‐ ‐‐‐ ‐‐‐ ‐‐‐ ‐‐‐ ‐‐‐ ‐‐‐ Sierra ‐‐‐ ‐‐‐ ‐‐‐ ‐‐‐ ‐‐‐ ‐‐‐ ‐‐‐ ‐‐‐ Tuolumne ‐‐‐ ‐‐‐ ‐‐‐ ‐‐‐ ‐‐‐ ‐‐‐ ‐‐‐ ‐‐‐ District 60 Total ‐‐‐ ‐‐‐ ‐‐‐ ‐‐‐ ‐‐‐ ‐‐‐ ‐‐‐ ‐‐‐ Imperial ‐‐‐ ‐‐‐ ‐‐‐ ‐‐‐ ‐‐‐ ‐‐‐ ‐‐‐ ‐‐‐ Los Angeles ‐‐‐ ‐‐‐ ‐‐‐ ‐‐‐ ‐‐‐ ‐‐‐ ‐‐‐ ‐‐‐ Orange ‐‐‐ ‐‐‐ ‐‐‐ ‐‐‐ ‐‐‐ ‐‐‐ ‐‐‐ ‐‐‐ Riverside ‐‐‐ ‐‐‐ ‐‐‐ ‐‐‐ ‐‐‐ ‐‐‐ ‐‐‐ ‐‐‐ San Bernardino ‐‐‐ ‐‐‐ ‐‐‐ ‐‐‐ ‐‐‐ ‐‐‐ ‐‐‐ ‐‐‐ San Diego ‐‐‐ ‐‐‐ ‐‐‐ ‐‐‐ ‐‐‐ ‐‐‐ ‐‐‐ ‐‐‐ Santa Barbara ‐‐‐ ‐‐‐ ‐‐‐ ‐‐‐ ‐‐‐ ‐‐‐ ‐‐‐ ‐‐‐ Ventura ‐‐‐ ‐‐‐ ‐‐‐ ‐‐‐ ‐‐‐ ‐‐‐ ‐‐‐ ‐‐‐ Other Counties ‐‐‐ ‐‐‐ ‐‐‐ ‐‐‐ ‐‐‐ ‐‐‐ ‐‐‐ ‐‐‐ District 80 Total ‐‐‐ ‐‐‐ ‐‐‐ ‐‐‐ ‐‐‐ ‐‐‐ ‐‐‐ ‐‐‐ Other Counties 1/ 52,000 51,900 1,850 960,000 2,300 2,300 2,000 46,000 District 98 Total 1/ 52,000 51,900 1,850 960,000 2,300 2,300 2,000 46,000 STATE 52,000 51,900 1,850 960,000 68,500 68,000 2,220 1,508,000
1/ Counties or district data combined to avoid disclosing data for individual farms.
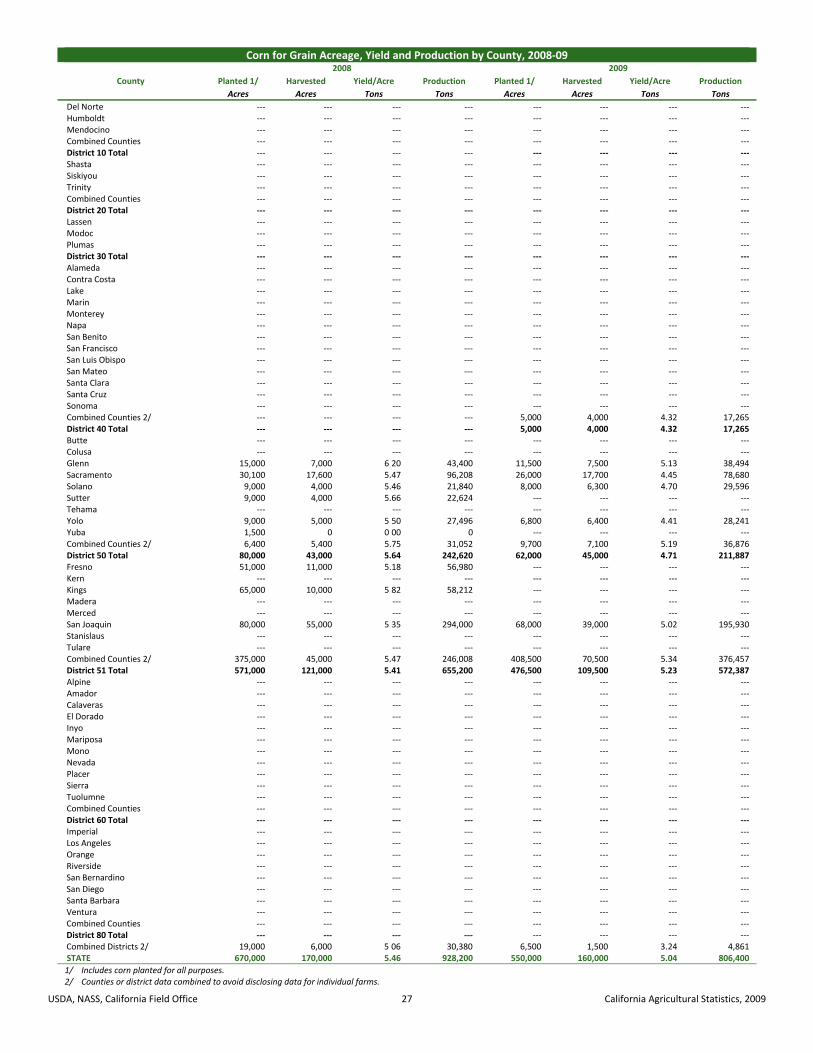
USDA, NASS, California Field Office 27 California Agricultural Statistics, 2009
Corn for Grain Acreage, Yield and Production by County, 2008‐09
County
2008 2009
Planted 1/ Harvested Yield/Acre Production Planted 1/ Harvested Yield/Acre Production
Acres Acres Tons Tons Acres Acres Tons Tons
Del Norte ‐‐‐ ‐‐‐ ‐‐‐ ‐‐‐ ‐‐‐ ‐‐‐ ‐‐‐ ‐‐‐ Humboldt ‐‐‐ ‐‐‐ ‐‐‐ ‐‐‐ ‐‐‐ ‐‐‐ ‐‐‐ ‐‐‐ Mendocino ‐‐‐ ‐‐‐ ‐‐‐ ‐‐‐ ‐‐‐ ‐‐‐ ‐‐‐ ‐‐‐ Combined Counties ‐‐‐ ‐‐‐ ‐‐‐ ‐‐‐ ‐‐‐ ‐‐‐ ‐‐‐ ‐‐‐ District 10 Total ‐‐‐ ‐‐‐ ‐‐‐ ‐‐‐ ‐‐‐ ‐‐‐ ‐‐‐ ‐‐‐ Shasta ‐‐‐ ‐‐‐ ‐‐‐ ‐‐‐ ‐‐‐ ‐‐‐ ‐‐‐ ‐‐‐ Siskiyou ‐‐‐ ‐‐‐ ‐‐‐ ‐‐‐ ‐‐‐ ‐‐‐ ‐‐‐ ‐‐‐ Trinity ‐‐‐ ‐‐‐ ‐‐‐ ‐‐‐ ‐‐‐ ‐‐‐ ‐‐‐ ‐‐‐ Combined Counties ‐‐‐ ‐‐‐ ‐‐‐ ‐‐‐ ‐‐‐ ‐‐‐ ‐‐‐ ‐‐‐ District 20 Total ‐‐‐ ‐‐‐ ‐‐‐ ‐‐‐ ‐‐‐ ‐‐‐ ‐‐‐ ‐‐‐ Lassen ‐‐‐ ‐‐‐ ‐‐‐ ‐‐‐ ‐‐‐ ‐‐‐ ‐‐‐ ‐‐‐ Modoc ‐‐‐ ‐‐‐ ‐‐‐ ‐‐‐ ‐‐‐ ‐‐‐ ‐‐‐ ‐‐‐ Plumas ‐‐‐ ‐‐‐ ‐‐‐ ‐‐‐ ‐‐‐ ‐‐‐ ‐‐‐ ‐‐‐ District 30 Total ‐‐‐ ‐‐‐ ‐‐‐ ‐‐‐ ‐‐‐ ‐‐‐ ‐‐‐ ‐‐‐ Alameda ‐‐‐ ‐‐‐ ‐‐‐ ‐‐‐ ‐‐‐ ‐‐‐ ‐‐‐ ‐‐‐ Contra Costa ‐‐‐ ‐‐‐ ‐‐‐ ‐‐‐ ‐‐‐ ‐‐‐ ‐‐‐ ‐‐‐ Lake ‐‐‐ ‐‐‐ ‐‐‐ ‐‐‐ ‐‐‐ ‐‐‐ ‐‐‐ ‐‐‐ Marin ‐‐‐ ‐‐‐ ‐‐‐ ‐‐‐ ‐‐‐ ‐‐‐ ‐‐‐ ‐‐‐ Monterey ‐‐‐ ‐‐‐ ‐‐‐ ‐‐‐ ‐‐‐ ‐‐‐ ‐‐‐ ‐‐‐ Napa ‐‐‐ ‐‐‐ ‐‐‐ ‐‐‐ ‐‐‐ ‐‐‐ ‐‐‐ ‐‐‐ San Benito ‐‐‐ ‐‐‐ ‐‐‐ ‐‐‐ ‐‐‐ ‐‐‐ ‐‐‐ ‐‐‐ San Francisco ‐‐‐ ‐‐‐ ‐‐‐ ‐‐‐ ‐‐‐ ‐‐‐ ‐‐‐ ‐‐‐ San Luis Obispo ‐‐‐ ‐‐‐ ‐‐‐ ‐‐‐ ‐‐‐ ‐‐‐ ‐‐‐ ‐‐‐ San Mateo ‐‐‐ ‐‐‐ ‐‐‐ ‐‐‐ ‐‐‐ ‐‐‐ ‐‐‐ ‐‐‐ Santa Clara ‐‐‐ ‐‐‐ ‐‐‐ ‐‐‐ ‐‐‐ ‐‐‐ ‐‐‐ ‐‐‐ Santa Cruz ‐‐‐ ‐‐‐ ‐‐‐ ‐‐‐ ‐‐‐ ‐‐‐ ‐‐‐ ‐‐‐ Sonoma ‐‐‐ ‐‐‐ ‐‐‐ ‐‐‐ ‐‐‐ ‐‐‐ ‐‐‐ ‐‐‐ Combined Counties 2/ ‐‐‐ ‐‐‐ ‐‐‐ ‐‐‐ 5,000 4,000 4.32 17,265 District 40 Total ‐‐‐ ‐‐‐ ‐‐‐ ‐‐‐ 5,000 4,000 4.32 17,265 Butte ‐‐‐ ‐‐‐ ‐‐‐ ‐‐‐ ‐‐‐ ‐‐‐ ‐‐‐ ‐‐‐ Colusa ‐‐‐ ‐‐‐ ‐‐‐ ‐‐‐ ‐‐‐ ‐‐‐ ‐‐‐ ‐‐‐ Glenn 15,000 7,000 6 20 43,400 11,500 7,500 5.13 38,494 Sacramento 30,100 17,600 5.47 96,208 26,000 17,700 4.45 78,680 Solano 9,000 4,000 5.46 21,840 8,000 6,300 4.70 29,596 Sutter 9,000 4,000 5.66 22,624 ‐‐‐ ‐‐‐ ‐‐‐ ‐‐‐ Tehama ‐‐‐ ‐‐‐ ‐‐‐ ‐‐‐ ‐‐‐ ‐‐‐ ‐‐‐ ‐‐‐ Yolo 9,000 5,000 5 50 27,496 6,800 6,400 4.41 28,241 Yuba 1,500 0 0 00 0 ‐‐‐ ‐‐‐ ‐‐‐ ‐‐‐ Combined Counties 2/ 6,400 5,400 5.75 31,052 9,700 7,100 5.19 36,876 District 50 Total 80,000 43,000 5.64 242,620 62,000 45,000 4.71 211,887 Fresno 51,000 11,000 5.18 56,980 ‐‐‐ ‐‐‐ ‐‐‐ ‐‐‐ Kern ‐‐‐ ‐‐‐ ‐‐‐ ‐‐‐ ‐‐‐ ‐‐‐ ‐‐‐ ‐‐‐ Kings 65,000 10,000 5 82 58,212 ‐‐‐ ‐‐‐ ‐‐‐ ‐‐‐ Madera ‐‐‐ ‐‐‐ ‐‐‐ ‐‐‐ ‐‐‐ ‐‐‐ ‐‐‐ ‐‐‐ Merced ‐‐‐ ‐‐‐ ‐‐‐ ‐‐‐ ‐‐‐ ‐‐‐ ‐‐‐ ‐‐‐ San Joaquin 80,000 55,000 5 35 294,000 68,000 39,000 5.02 195,930 Stanislaus ‐‐‐ ‐‐‐ ‐‐‐ ‐‐‐ ‐‐‐ ‐‐‐ ‐‐‐ ‐‐‐ Tulare ‐‐‐ ‐‐‐ ‐‐‐ ‐‐‐ ‐‐‐ ‐‐‐ ‐‐‐ ‐‐‐ Combined Counties 2/ 375,000 45,000 5.47 246,008 408,500 70,500 5.34 376,457 District 51 Total 571,000 121,000 5.41 655,200 476,500 109,500 5.23 572,387 Alpine ‐‐‐ ‐‐‐ ‐‐‐ ‐‐‐ ‐‐‐ ‐‐‐ ‐‐‐ ‐‐‐ Amador ‐‐‐ ‐‐‐ ‐‐‐ ‐‐‐ ‐‐‐ ‐‐‐ ‐‐‐ ‐‐‐ Calaveras ‐‐‐ ‐‐‐ ‐‐‐ ‐‐‐ ‐‐‐ ‐‐‐ ‐‐‐ ‐‐‐ El Dorado ‐‐‐ ‐‐‐ ‐‐‐ ‐‐‐ ‐‐‐ ‐‐‐ ‐‐‐ ‐‐‐ Inyo ‐‐‐ ‐‐‐ ‐‐‐ ‐‐‐ ‐‐‐ ‐‐‐ ‐‐‐ ‐‐‐ Mariposa ‐‐‐ ‐‐‐ ‐‐‐ ‐‐‐ ‐‐‐ ‐‐‐ ‐‐‐ ‐‐‐ Mono ‐‐‐ ‐‐‐ ‐‐‐ ‐‐‐ ‐‐‐ ‐‐‐ ‐‐‐ ‐‐‐ Nevada ‐‐‐ ‐‐‐ ‐‐‐ ‐‐‐ ‐‐‐ ‐‐‐ ‐‐‐ ‐‐‐ Placer ‐‐‐ ‐‐‐ ‐‐‐ ‐‐‐ ‐‐‐ ‐‐‐ ‐‐‐ ‐‐‐ Sierra ‐‐‐ ‐‐‐ ‐‐‐ ‐‐‐ ‐‐‐ ‐‐‐ ‐‐‐ ‐‐‐ Tuolumne ‐‐‐ ‐‐‐ ‐‐‐ ‐‐‐ ‐‐‐ ‐‐‐ ‐‐‐ ‐‐‐ Combined Counties ‐‐‐ ‐‐‐ ‐‐‐ ‐‐‐ ‐‐‐ ‐‐‐ ‐‐‐ ‐‐‐ District 60 Total ‐‐‐ ‐‐‐ ‐‐‐ ‐‐‐ ‐‐‐ ‐‐‐ ‐‐‐ ‐‐‐ Imperial ‐‐‐ ‐‐‐ ‐‐‐ ‐‐‐ ‐‐‐ ‐‐‐ ‐‐‐ ‐‐‐ Los Angeles ‐‐‐ ‐‐‐ ‐‐‐ ‐‐‐ ‐‐‐ ‐‐‐ ‐‐‐ ‐‐‐ Orange ‐‐‐ ‐‐‐ ‐‐‐ ‐‐‐ ‐‐‐ ‐‐‐ ‐‐‐ ‐‐‐ Riverside ‐‐‐ ‐‐‐ ‐‐‐ ‐‐‐ ‐‐‐ ‐‐‐ ‐‐‐ ‐‐‐ San Bernardino ‐‐‐ ‐‐‐ ‐‐‐ ‐‐‐ ‐‐‐ ‐‐‐ ‐‐‐ ‐‐‐ San Diego ‐‐‐ ‐‐‐ ‐‐‐ ‐‐‐ ‐‐‐ ‐‐‐ ‐‐‐ ‐‐‐ Santa Barbara ‐‐‐ ‐‐‐ ‐‐‐ ‐‐‐ ‐‐‐ ‐‐‐ ‐‐‐ ‐‐‐ Ventura ‐‐‐ ‐‐‐ ‐‐‐ ‐‐‐ ‐‐‐ ‐‐‐ ‐‐‐ ‐‐‐ Combined Counties ‐‐‐ ‐‐‐ ‐‐‐ ‐‐‐ ‐‐‐ ‐‐‐ ‐‐‐ ‐‐‐ District 80 Total ‐‐‐ ‐‐‐ ‐‐‐ ‐‐‐ ‐‐‐ ‐‐‐ ‐‐‐ ‐‐‐ Combined Districts 2/ 19,000 6,000 5 06 30,380 6,500 1,500 3.24 4,861 STATE 670,000 170,000 5.46 928,200 550,000 160,000 5.04 806,400
1/ Includes corn planted for all purposes. 2/ Counties or district data combined to avoid disclosing data for individual farms.

USDA, NASS, California Field Office 28 California Agricultural Statistics, 2009
Corn for Silage Acreage, Yield and Production by County, 2008‐09
County
2008 2009
Planted 1/ Harvested Yield/Acre Production Planted 1/ Harvested Yield/Acre Production
Acres Acres Tons Tons Acres Acres Tons Tons
Del Norte ‐‐‐ ‐‐‐ ‐‐‐ ‐‐‐ ‐‐‐ ‐‐‐ ‐‐‐ ‐‐‐ Humboldt ‐‐‐ ‐‐‐ ‐‐‐ ‐‐‐ ‐‐‐ 600 16.70 10,000 Mendocino ‐‐‐ ‐‐‐ ‐‐‐ ‐‐‐ ‐‐‐ ‐‐‐ ‐‐‐ ‐‐‐ Combined Counties 1/ ‐‐‐ ‐‐‐ ‐‐‐ ‐‐‐ ‐‐‐ ‐‐‐ ‐‐‐ ‐‐‐ District 10 Total ‐‐‐ ‐‐‐ ‐‐‐ ‐‐‐ ‐‐‐ 600 16.70 10,000 Shasta ‐‐‐ ‐‐‐ ‐‐‐ ‐‐‐ ‐‐‐ ‐‐‐ ‐‐‐ ‐‐‐ Siskiyou ‐‐‐ ‐‐‐ ‐‐‐ ‐‐‐ ‐‐‐ ‐‐‐ ‐‐‐ ‐‐‐ Trinity ‐‐‐ ‐‐‐ ‐‐‐ ‐‐‐ ‐‐‐ ‐‐‐ ‐‐‐ ‐‐‐ Combined Counties 1/ ‐‐‐ ‐‐‐ ‐‐‐ ‐‐‐ ‐‐‐ ‐‐‐ ‐‐‐ ‐‐‐ District 20 Total ‐‐‐ ‐‐‐ ‐‐‐ ‐‐‐ ‐‐‐ ‐‐‐ ‐‐‐ ‐‐‐ Lassen ‐‐‐ ‐‐‐ ‐‐‐ ‐‐‐ ‐‐‐ ‐‐‐ ‐‐‐ ‐‐‐ Modoc ‐‐‐ ‐‐‐ ‐‐‐ ‐‐‐ ‐‐‐ ‐‐‐ ‐‐‐ ‐‐‐ Plumas ‐‐‐ ‐‐‐ ‐‐‐ ‐‐‐ ‐‐‐ ‐‐‐ ‐‐‐ ‐‐‐ District 30 Total ‐‐‐ ‐‐‐ ‐‐‐ ‐‐‐ ‐‐‐ ‐‐‐ ‐‐‐ ‐‐‐ Alameda ‐‐‐ ‐‐‐ ‐‐‐ ‐‐‐ ‐‐‐ ‐‐‐ ‐‐‐ ‐‐‐ Contra Costa ‐‐‐ ‐‐‐ ‐‐‐ ‐‐‐ ‐‐‐ ‐‐‐ ‐‐‐ ‐‐‐ Lake ‐‐‐ ‐‐‐ ‐‐‐ ‐‐‐ ‐‐‐ ‐‐‐ ‐‐‐ ‐‐‐ Marin ‐‐‐ ‐‐‐ ‐‐‐ ‐‐‐ ‐‐‐ ‐‐‐ ‐‐‐ ‐‐‐ Monterey ‐‐‐ ‐‐‐ ‐‐‐ ‐‐‐ ‐‐‐ ‐‐‐ ‐‐‐ ‐‐‐ Napa ‐‐‐ ‐‐‐ ‐‐‐ ‐‐‐ ‐‐‐ ‐‐‐ ‐‐‐ ‐‐‐ San Benito ‐‐‐ ‐‐‐ ‐‐‐ ‐‐‐ ‐‐‐ ‐‐‐ ‐‐‐ ‐‐‐ San Francisco ‐‐‐ ‐‐‐ ‐‐‐ ‐‐‐ ‐‐‐ ‐‐‐ ‐‐‐ ‐‐‐ San Luis Obispo ‐‐‐ ‐‐‐ ‐‐‐ ‐‐‐ ‐‐‐ ‐‐‐ ‐‐‐ ‐‐‐ San Mateo ‐‐‐ ‐‐‐ ‐‐‐ ‐‐‐ ‐‐‐ ‐‐‐ ‐‐‐ ‐‐‐ Santa Clara ‐‐‐ ‐‐‐ ‐‐‐ ‐‐‐ ‐‐‐ ‐‐‐ ‐‐‐ ‐‐‐ Santa Cruz ‐‐‐ ‐‐‐ ‐‐‐ ‐‐‐ ‐‐‐ ‐‐‐ ‐‐‐ ‐‐‐ Sonoma ‐‐‐ ‐‐‐ ‐‐‐ ‐‐‐ ‐‐‐ ‐‐‐ ‐‐‐ ‐‐‐ Combined Counties 1/ ‐‐‐ ‐‐‐ ‐‐‐ ‐‐‐ ‐‐‐ 1,000 25.00 25,000 District 40 Total ‐‐‐ ‐‐‐ ‐‐‐ ‐‐‐ ‐‐‐ 1,000 25.00 25,000 Butte ‐‐‐ ‐‐‐ ‐‐‐ ‐‐‐ ‐‐‐ ‐‐‐ ‐‐‐ ‐‐‐ Colusa ‐‐‐ ‐‐‐ ‐‐‐ ‐‐‐ ‐‐‐ ‐‐‐ ‐‐‐ ‐‐‐ Glenn ‐‐‐ 8,000 26 90 215,000 ‐‐‐ ‐‐‐ ‐‐‐ ‐‐‐ Sacramento ‐‐‐ 12,500 22 00 275,000 ‐‐‐ ‐‐‐ ‐‐‐ ‐‐‐ Solano ‐‐‐ ‐‐‐ ‐‐‐ ‐‐‐ ‐‐‐ ‐‐‐ ‐‐‐ ‐‐‐ Sutter ‐‐‐ ‐‐‐ ‐‐‐ ‐‐‐ ‐‐‐ ‐‐‐ ‐‐‐ ‐‐‐ Tehama ‐‐‐ ‐‐‐ ‐‐‐ ‐‐‐ ‐‐‐ ‐‐‐ ‐‐‐ ‐‐‐ Yolo ‐‐‐ ‐‐‐ ‐‐‐ ‐‐‐ ‐‐‐ ‐‐‐ ‐‐‐ ‐‐‐ Yuba ‐‐‐ 1,500 20 00 30,000 ‐‐‐ ‐‐‐ ‐‐‐ ‐‐‐ Combined Counties 1/ ‐‐‐ 15,000 25 20 378,000 ‐‐‐ ‐‐‐ ‐‐‐ ‐‐‐ District 50 Total ‐‐‐ 37,000 24.30 898,000 ‐‐‐ ‐‐‐ ‐‐‐ ‐‐‐ Fresno ‐‐‐ 40,000 24 80 990,000 ‐‐‐ ‐‐‐ ‐‐‐ ‐‐‐ Kern ‐‐‐ ‐‐‐ ‐‐‐ ‐‐‐ ‐‐‐ ‐‐‐ ‐‐‐ ‐‐‐ Kings ‐‐‐ 55,000 25 50 1,405,000 ‐‐‐ ‐‐‐ ‐‐‐ ‐‐‐ Madera ‐‐‐ ‐‐‐ ‐‐‐ ‐‐‐ ‐‐‐ ‐‐‐ ‐‐‐ ‐‐‐ Merced ‐‐‐ 83,000 26 80 2,225,000 ‐‐‐ ‐‐‐ ‐‐‐ ‐‐‐ San Joaquin ‐‐‐ 25,000 29 00 725,000 ‐‐‐ ‐‐‐ ‐‐‐ ‐‐‐ Stanislaus ‐‐‐ 59,000 27.70 1,635,000 ‐‐‐ 44,500 27.60 1,227,300 Tulare ‐‐‐ 107,000 28 20 3,013,000 ‐‐‐ ‐‐‐ ‐‐‐ ‐‐‐ Combined Counties 1/ ‐‐‐ 76,000 26 90 2,045,000 ‐‐‐ 317,500 25.90 8,208,700 District 51 Total ‐‐‐ 445,000 27.10 12,038,000 ‐‐‐ 362,000 26.10 9,436,000 Alpine ‐‐‐ ‐‐‐ ‐‐‐ ‐‐‐ ‐‐‐ ‐‐‐ ‐‐‐ ‐‐‐ Amador ‐‐‐ ‐‐‐ ‐‐‐ ‐‐‐ ‐‐‐ ‐‐‐ ‐‐‐ ‐‐‐ Calaveras ‐‐‐ ‐‐‐ ‐‐‐ ‐‐‐ ‐‐‐ ‐‐‐ ‐‐‐ ‐‐‐ El Dorado ‐‐‐ ‐‐‐ ‐‐‐ ‐‐‐ ‐‐‐ ‐‐‐ ‐‐‐ ‐‐‐ Inyo ‐‐‐ ‐‐‐ ‐‐‐ ‐‐‐ ‐‐‐ ‐‐‐ ‐‐‐ ‐‐‐ Mariposa ‐‐‐ ‐‐‐ ‐‐‐ ‐‐‐ ‐‐‐ ‐‐‐ ‐‐‐ ‐‐‐ Mono ‐‐‐ ‐‐‐ ‐‐‐ ‐‐‐ ‐‐‐ ‐‐‐ ‐‐‐ ‐‐‐ Nevada ‐‐‐ ‐‐‐ ‐‐‐ ‐‐‐ ‐‐‐ ‐‐‐ ‐‐‐ ‐‐‐ Placer ‐‐‐ ‐‐‐ ‐‐‐ ‐‐‐ ‐‐‐ ‐‐‐ ‐‐‐ ‐‐‐ Sierra ‐‐‐ ‐‐‐ ‐‐‐ ‐‐‐ ‐‐‐ ‐‐‐ ‐‐‐ ‐‐‐ Tuolumne ‐‐‐ ‐‐‐ ‐‐‐ ‐‐‐ ‐‐‐ ‐‐‐ ‐‐‐ ‐‐‐ Combined Counties 1/ ‐‐‐ ‐‐‐ ‐‐‐ ‐‐‐ ‐‐‐ ‐‐‐ ‐‐‐ ‐‐‐ District 60 Total ‐‐‐ ‐‐‐ ‐‐‐ ‐‐‐ ‐‐‐ ‐‐‐ ‐‐‐ ‐‐‐ Imperial ‐‐‐ ‐‐‐ ‐‐‐ ‐‐‐ ‐‐‐ ‐‐‐ ‐‐‐ ‐‐‐ Los Angeles ‐‐‐ ‐‐‐ ‐‐‐ ‐‐‐ ‐‐‐ ‐‐‐ ‐‐‐ ‐‐‐ Orange ‐‐‐ ‐‐‐ ‐‐‐ ‐‐‐ ‐‐‐ ‐‐‐ ‐‐‐ ‐‐‐ Riverside ‐‐‐ ‐‐‐ ‐‐‐ ‐‐‐ ‐‐‐ ‐‐‐ ‐‐‐ ‐‐‐ San Bernardino ‐‐‐ ‐‐‐ ‐‐‐ ‐‐‐ ‐‐‐ ‐‐‐ ‐‐‐ ‐‐‐ San Diego ‐‐‐ ‐‐‐ ‐‐‐ ‐‐‐ ‐‐‐ ‐‐‐ ‐‐‐ ‐‐‐ Santa Barbara ‐‐‐ ‐‐‐ ‐‐‐ ‐‐‐ ‐‐‐ ‐‐‐ ‐‐‐ ‐‐‐ Ventura ‐‐‐ ‐‐‐ ‐‐‐ ‐‐‐ ‐‐‐ ‐‐‐ ‐‐‐ ‐‐‐ Combined Counties 1/ ‐‐‐ ‐‐‐ ‐‐‐ ‐‐‐ ‐‐‐ ‐‐‐ ‐‐‐ ‐‐‐ District 80 Total ‐‐‐ ‐‐‐ ‐‐‐ ‐‐‐ ‐‐‐ ‐‐‐ ‐‐‐ ‐‐‐ Combined Districts 1/ ‐‐‐ 13,000 14 00 182,000 ‐‐‐ 21,400 25.20 539,000 STATE ‐‐‐ 495,000 26.50 13,118,000 ‐‐‐ 385,000 26.00 10,010,000
1/ Counties or district data combined to avoid disclosing data for individual farms.

USDA, NASS, California Field Office 29 California Agricultural Statistics, 2009
American Pima Cotton Acreage, Yield and Production by County, 2008‐09
County
2008 2009
Planted Harvested Yield/Acre Production Planted Harvested Yield/Acre Production
Acres Acres Pounds Bales Acres Acres Pounds Bales
Del Norte ‐‐‐ ‐‐‐ ‐‐‐ ‐‐‐ ‐‐‐ ‐‐‐ ‐‐‐ ‐‐‐ Humboldt ‐‐‐ ‐‐‐ ‐‐‐ ‐‐‐ ‐‐‐ ‐‐‐ ‐‐‐ ‐‐‐ Mendocino ‐‐‐ ‐‐‐ ‐‐‐ ‐‐‐ ‐‐‐ ‐‐‐ ‐‐‐ ‐‐‐ District 10 Total ‐‐‐ ‐‐‐ ‐‐‐ ‐‐‐ ‐‐‐ ‐‐‐ ‐‐‐ ‐‐‐ Shasta ‐‐‐ ‐‐‐ ‐‐‐ ‐‐‐ ‐‐‐ ‐‐‐ ‐‐‐ ‐‐‐ Siskiyou ‐‐‐ ‐‐‐ ‐‐‐ ‐‐‐ ‐‐‐ ‐‐‐ ‐‐‐ ‐‐‐ Trinity ‐‐‐ ‐‐‐ ‐‐‐ ‐‐‐ ‐‐‐ ‐‐‐ ‐‐‐ ‐‐‐ District 20 Total ‐‐‐ ‐‐‐ ‐‐‐ ‐‐‐ ‐‐‐ ‐‐‐ ‐‐‐ ‐‐‐ Lassen ‐‐‐ ‐‐‐ ‐‐‐ ‐‐‐ ‐‐‐ ‐‐‐ ‐‐‐ ‐‐‐ Modoc ‐‐‐ ‐‐‐ ‐‐‐ ‐‐‐ ‐‐‐ ‐‐‐ ‐‐‐ ‐‐‐ Plumas ‐‐‐ ‐‐‐ ‐‐‐ ‐‐‐ ‐‐‐ ‐‐‐ ‐‐‐ ‐‐‐ District 30 Total ‐‐‐ ‐‐‐ ‐‐‐ ‐‐‐ ‐‐‐ ‐‐‐ ‐‐‐ ‐‐‐ Alameda ‐‐‐ ‐‐‐ ‐‐‐ ‐‐‐ ‐‐‐ ‐‐‐ ‐‐‐ ‐‐‐ Contra Costa ‐‐‐ ‐‐‐ ‐‐‐ ‐‐‐ ‐‐‐ ‐‐‐ ‐‐‐ ‐‐‐ Lake ‐‐‐ ‐‐‐ ‐‐‐ ‐‐‐ ‐‐‐ ‐‐‐ ‐‐‐ ‐‐‐ Marin ‐‐‐ ‐‐‐ ‐‐‐ ‐‐‐ ‐‐‐ ‐‐‐ ‐‐‐ ‐‐‐ Monterey ‐‐‐ ‐‐‐ ‐‐‐ ‐‐‐ ‐‐‐ ‐‐‐ ‐‐‐ ‐‐‐ Napa ‐‐‐ ‐‐‐ ‐‐‐ ‐‐‐ ‐‐‐ ‐‐‐ ‐‐‐ ‐‐‐ San Benito ‐‐‐ ‐‐‐ ‐‐‐ ‐‐‐ ‐‐‐ ‐‐‐ ‐‐‐ ‐‐‐ San Francisco ‐‐‐ ‐‐‐ ‐‐‐ ‐‐‐ ‐‐‐ ‐‐‐ ‐‐‐ ‐‐‐ San Luis Obispo ‐‐‐ ‐‐‐ ‐‐‐ ‐‐‐ ‐‐‐ ‐‐‐ ‐‐‐ ‐‐‐ San Mateo ‐‐‐ ‐‐‐ ‐‐‐ ‐‐‐ ‐‐‐ ‐‐‐ ‐‐‐ ‐‐‐ Santa Clara ‐‐‐ ‐‐‐ ‐‐‐ ‐‐‐ ‐‐‐ ‐‐‐ ‐‐‐ ‐‐‐ Santa Cruz ‐‐‐ ‐‐‐ ‐‐‐ ‐‐‐ ‐‐‐ ‐‐‐ ‐‐‐ ‐‐‐ Sonoma ‐‐‐ ‐‐‐ ‐‐‐ ‐‐‐ ‐‐‐ ‐‐‐ ‐‐‐ ‐‐‐ District 40 Total ‐‐‐ ‐‐‐ ‐‐‐ ‐‐‐ ‐‐‐ ‐‐‐ ‐‐‐ ‐‐‐ Butte ‐‐‐ ‐‐‐ ‐‐‐ ‐‐‐ ‐‐‐ ‐‐‐ ‐‐‐ ‐‐‐ Colusa ‐‐‐ ‐‐‐ ‐‐‐ ‐‐‐ ‐‐‐ ‐‐‐ ‐‐‐ ‐‐‐ Glenn ‐‐‐ ‐‐‐ ‐‐‐ ‐‐‐ ‐‐‐ ‐‐‐ ‐‐‐ ‐‐‐ Sacramento ‐‐‐ ‐‐‐ ‐‐‐ ‐‐‐ ‐‐‐ ‐‐‐ ‐‐‐ ‐‐‐ Solano ‐‐‐ ‐‐‐ ‐‐‐ ‐‐‐ ‐‐‐ ‐‐‐ ‐‐‐ ‐‐‐ Sutter ‐‐‐ ‐‐‐ ‐‐‐ ‐‐‐ ‐‐‐ ‐‐‐ ‐‐‐ ‐‐‐ Tehama ‐‐‐ ‐‐‐ ‐‐‐ ‐‐‐ ‐‐‐ ‐‐‐ ‐‐‐ ‐‐‐ Yolo ‐‐‐ ‐‐‐ ‐‐‐ ‐‐‐ ‐‐‐ ‐‐‐ ‐‐‐ ‐‐‐ Yuba ‐‐‐ ‐‐‐ ‐‐‐ ‐‐‐ ‐‐‐ ‐‐‐ ‐‐‐ ‐‐‐ District 50 Total ‐‐‐ ‐‐‐ ‐‐‐ ‐‐‐ ‐‐‐ ‐‐‐ ‐‐‐ ‐‐‐ Fresno 45,000 44,000 1,255 115,000 32,600 31,600 1,466 96,500 Kern 28,500 28,000 1,491 87,000 21,200 20,700 1,484 64,000 Kings 77,000 74,500 1,224 190,000 56,900 55,400 1,560 180,000 Madera ‐‐‐ ‐‐‐ ‐‐‐ ‐‐‐ ‐‐‐ ‐‐‐ ‐‐‐ ‐‐‐ Merced 4,500 4,500 1,173 11,000 ‐‐‐ ‐‐‐ ‐‐‐ ‐‐‐ San Joaquin ‐‐‐ ‐‐‐ ‐‐‐ ‐‐‐ ‐‐‐ ‐‐‐ ‐‐‐ ‐‐‐ Stanislaus ‐‐‐ ‐‐‐ ‐‐‐ ‐‐‐ ‐‐‐ ‐‐‐ ‐‐‐ ‐‐‐ Tulare ‐‐‐ ‐‐‐ ‐‐‐ ‐‐‐ ‐‐‐ ‐‐‐ ‐‐‐ ‐‐‐ Other Counties 1/ ‐‐‐ ‐‐‐ ‐‐‐ ‐‐‐ 8,300 8,300 1,186 20,500 District 51 Total 155,000 151,000 1,281 403,000 119,000 116,000 1,494 361,000 Alpine ‐‐‐ ‐‐‐ ‐‐‐ ‐‐‐ ‐‐‐ ‐‐‐ ‐‐‐ ‐‐‐ Amador ‐‐‐ ‐‐‐ ‐‐‐ ‐‐‐ ‐‐‐ ‐‐‐ ‐‐‐ ‐‐‐ Calaveras ‐‐‐ ‐‐‐ ‐‐‐ ‐‐‐ ‐‐‐ ‐‐‐ ‐‐‐ ‐‐‐ El Dorado ‐‐‐ ‐‐‐ ‐‐‐ ‐‐‐ ‐‐‐ ‐‐‐ ‐‐‐ ‐‐‐ Inyo ‐‐‐ ‐‐‐ ‐‐‐ ‐‐‐ ‐‐‐ ‐‐‐ ‐‐‐ ‐‐‐ Mariposa ‐‐‐ ‐‐‐ ‐‐‐ ‐‐‐ ‐‐‐ ‐‐‐ ‐‐‐ ‐‐‐ Mono ‐‐‐ ‐‐‐ ‐‐‐ ‐‐‐ ‐‐‐ ‐‐‐ ‐‐‐ ‐‐‐ Nevada ‐‐‐ ‐‐‐ ‐‐‐ ‐‐‐ ‐‐‐ ‐‐‐ ‐‐‐ ‐‐‐ Placer ‐‐‐ ‐‐‐ ‐‐‐ ‐‐‐ ‐‐‐ ‐‐‐ ‐‐‐ ‐‐‐ Sierra ‐‐‐ ‐‐‐ ‐‐‐ ‐‐‐ ‐‐‐ ‐‐‐ ‐‐‐ ‐‐‐ Tuolumne ‐‐‐ ‐‐‐ ‐‐‐ ‐‐‐ ‐‐‐ ‐‐‐ ‐‐‐ ‐‐‐ District 60 Total ‐‐‐ ‐‐‐ ‐‐‐ ‐‐‐ ‐‐‐ ‐‐‐ ‐‐‐ ‐‐‐ Imperial ‐‐‐ ‐‐‐ ‐‐‐ ‐‐‐ ‐‐‐ ‐‐‐ ‐‐‐ ‐‐‐ Los Angeles ‐‐‐ ‐‐‐ ‐‐‐ ‐‐‐ ‐‐‐ ‐‐‐ ‐‐‐ ‐‐‐ Orange ‐‐‐ ‐‐‐ ‐‐‐ ‐‐‐ ‐‐‐ ‐‐‐ ‐‐‐ ‐‐‐ Riverside ‐‐‐ ‐‐‐ ‐‐‐ ‐‐‐ ‐‐‐ ‐‐‐ ‐‐‐ ‐‐‐ San Bernardino ‐‐‐ ‐‐‐ ‐‐‐ ‐‐‐ ‐‐‐ ‐‐‐ ‐‐‐ ‐‐‐ San Diego ‐‐‐ ‐‐‐ ‐‐‐ ‐‐‐ ‐‐‐ ‐‐‐ ‐‐‐ ‐‐‐ Santa Barbara ‐‐‐ ‐‐‐ ‐‐‐ ‐‐‐ ‐‐‐ ‐‐‐ ‐‐‐ ‐‐‐ Ventura ‐‐‐ ‐‐‐ ‐‐‐ ‐‐‐ ‐‐‐ ‐‐‐ ‐‐‐ ‐‐‐ District 80 Total ‐‐‐ ‐‐‐ ‐‐‐ ‐‐‐ ‐‐‐ ‐‐‐ ‐‐‐ ‐‐‐ STATE 155,000 151,000 1,281 403,000 119,000 116,000 1,494 361,000
1/ Counties or district data combined to avoid disclosing data for individual farms.

USDA, NASS, California Field Office 30 California Agricultural Statistics, 2009
Upland Cotton Acreage, Yield and Production by County, 2008‐09
County
2008 2009
Planted Harvested Yield/Acre Production Planted Harvested Yield/Acre Production
Acres Acres Pounds Bales Acres Acres Pounds Bales
Del Norte ‐‐‐ ‐‐‐ ‐‐‐ ‐‐‐ ‐‐‐ ‐‐‐ ‐‐‐ ‐‐‐ Humboldt ‐‐‐ ‐‐‐ ‐‐‐ ‐‐‐ ‐‐‐ ‐‐‐ ‐‐‐ ‐‐‐ Mendocino ‐‐‐ ‐‐‐ ‐‐‐ ‐‐‐ ‐‐‐ ‐‐‐ ‐‐‐ ‐‐‐ District 10 Total ‐‐‐ ‐‐‐ ‐‐‐ ‐‐‐ ‐‐‐ ‐‐‐ ‐‐‐ ‐‐‐ Shasta ‐‐‐ ‐‐‐ ‐‐‐ ‐‐‐ ‐‐‐ ‐‐‐ ‐‐‐ ‐‐‐ Siskiyou ‐‐‐ ‐‐‐ ‐‐‐ ‐‐‐ ‐‐‐ ‐‐‐ ‐‐‐ ‐‐‐ Trinity ‐‐‐ ‐‐‐ ‐‐‐ ‐‐‐ ‐‐‐ ‐‐‐ ‐‐‐ ‐‐‐ District 20 Total ‐‐‐ ‐‐‐ ‐‐‐ ‐‐‐ ‐‐‐ ‐‐‐ ‐‐‐ ‐‐‐ Lassen ‐‐‐ ‐‐‐ ‐‐‐ ‐‐‐ ‐‐‐ ‐‐‐ ‐‐‐ ‐‐‐ Modoc ‐‐‐ ‐‐‐ ‐‐‐ ‐‐‐ ‐‐‐ ‐‐‐ ‐‐‐ ‐‐‐ Plumas ‐‐‐ ‐‐‐ ‐‐‐ ‐‐‐ ‐‐‐ ‐‐‐ ‐‐‐ ‐‐‐ District 30 Total ‐‐‐ ‐‐‐ ‐‐‐ ‐‐‐ ‐‐‐ ‐‐‐ ‐‐‐ ‐‐‐ Alameda ‐‐‐ ‐‐‐ ‐‐‐ ‐‐‐ ‐‐‐ ‐‐‐ ‐‐‐ ‐‐‐ Contra Costa ‐‐‐ ‐‐‐ ‐‐‐ ‐‐‐ ‐‐‐ ‐‐‐ ‐‐‐ ‐‐‐ Lake ‐‐‐ ‐‐‐ ‐‐‐ ‐‐‐ ‐‐‐ ‐‐‐ ‐‐‐ ‐‐‐ Marin ‐‐‐ ‐‐‐ ‐‐‐ ‐‐‐ ‐‐‐ ‐‐‐ ‐‐‐ ‐‐‐ Monterey ‐‐‐ ‐‐‐ ‐‐‐ ‐‐‐ ‐‐‐ ‐‐‐ ‐‐‐ ‐‐‐ Napa ‐‐‐ ‐‐‐ ‐‐‐ ‐‐‐ ‐‐‐ ‐‐‐ ‐‐‐ ‐‐‐ San Benito ‐‐‐ ‐‐‐ ‐‐‐ ‐‐‐ ‐‐‐ ‐‐‐ ‐‐‐ ‐‐‐ San Francisco ‐‐‐ ‐‐‐ ‐‐‐ ‐‐‐ ‐‐‐ ‐‐‐ ‐‐‐ ‐‐‐ San Luis Obispo ‐‐‐ ‐‐‐ ‐‐‐ ‐‐‐ ‐‐‐ ‐‐‐ ‐‐‐ ‐‐‐ San Mateo ‐‐‐ ‐‐‐ ‐‐‐ ‐‐‐ ‐‐‐ ‐‐‐ ‐‐‐ ‐‐‐ Santa Clara ‐‐‐ ‐‐‐ ‐‐‐ ‐‐‐ ‐‐‐ ‐‐‐ ‐‐‐ ‐‐‐ Santa Cruz ‐‐‐ ‐‐‐ ‐‐‐ ‐‐‐ ‐‐‐ ‐‐‐ ‐‐‐ ‐‐‐ Sonoma ‐‐‐ ‐‐‐ ‐‐‐ ‐‐‐ ‐‐‐ ‐‐‐ ‐‐‐ ‐‐‐ District 40 Total ‐‐‐ ‐‐‐ ‐‐‐ ‐‐‐ ‐‐‐ ‐‐‐ ‐‐‐ ‐‐‐ Butte ‐‐‐ ‐‐‐ ‐‐‐ ‐‐‐ ‐‐‐ ‐‐‐ ‐‐‐ ‐‐‐ Colusa ‐‐‐ ‐‐‐ ‐‐‐ ‐‐‐ ‐‐‐ ‐‐‐ ‐‐‐ ‐‐‐ Glenn ‐‐‐ ‐‐‐ ‐‐‐ ‐‐‐ ‐‐‐ ‐‐‐ ‐‐‐ ‐‐‐ Sacramento ‐‐‐ ‐‐‐ ‐‐‐ ‐‐‐ ‐‐‐ ‐‐‐ ‐‐‐ ‐‐‐ Solano ‐‐‐ ‐‐‐ ‐‐‐ ‐‐‐ ‐‐‐ ‐‐‐ ‐‐‐ ‐‐‐ Sutter ‐‐‐ ‐‐‐ ‐‐‐ ‐‐‐ ‐‐‐ ‐‐‐ ‐‐‐ ‐‐‐ Tehama ‐‐‐ ‐‐‐ ‐‐‐ ‐‐‐ ‐‐‐ ‐‐‐ ‐‐‐ ‐‐‐ Yolo ‐‐‐ ‐‐‐ ‐‐‐ ‐‐‐ ‐‐‐ ‐‐‐ ‐‐‐ ‐‐‐ Yuba ‐‐‐ ‐‐‐ ‐‐‐ ‐‐‐ ‐‐‐ ‐‐‐ ‐‐‐ ‐‐‐ Other Counties 1/ 3,400 3,300 1,411 9,700 ‐‐‐ ‐‐‐ ‐‐‐ ‐‐‐ District 50 Total 3,400 3,300 1,411 9,700 ‐‐‐ ‐‐‐ ‐‐‐ ‐‐‐ Fresno 20,200 20,100 1,638 68,600 ‐‐‐ ‐‐‐ ‐‐‐ ‐‐‐ Kern 22,400 22,300 1,612 74,900 18,400 18,200 1,709 64,800 Kings 13,900 13,500 1,515 42,600 8,500 8,500 1,480 26,200 Madera 4,000 3,200 1,245 8,300 ‐‐‐ ‐‐‐ ‐‐‐ ‐‐‐ Merced 32,000 31,700 1,216 80,300 15,800 15,200 1,595 50,500 San Joaquin ‐‐‐ ‐‐‐ ‐‐‐ ‐‐‐ ‐‐‐ ‐‐‐ ‐‐‐ ‐‐‐ Stanislaus ‐‐‐ ‐‐‐ ‐‐‐ ‐‐‐ ‐‐‐ ‐‐‐ ‐‐‐ ‐‐‐ Tulare 12,500 12,200 1,763 44,800 10,800 10,600 1,739 38,400 Other Counties 1/ ‐‐‐ ‐‐‐ ‐‐‐ ‐‐‐ 8,800 8,800 1,424 26,100 District 51 Total 105,000 103,000 1,489 319,500 62,300 61,300 1,613 206,000 Alpine ‐‐‐ ‐‐‐ ‐‐‐ ‐‐‐ ‐‐‐ ‐‐‐ ‐‐‐ ‐‐‐ Amador ‐‐‐ ‐‐‐ ‐‐‐ ‐‐‐ ‐‐‐ ‐‐‐ ‐‐‐ ‐‐‐ Calaveras ‐‐‐ ‐‐‐ ‐‐‐ ‐‐‐ ‐‐‐ ‐‐‐ ‐‐‐ ‐‐‐ El Dorado ‐‐‐ ‐‐‐ ‐‐‐ ‐‐‐ ‐‐‐ ‐‐‐ ‐‐‐ ‐‐‐ Inyo ‐‐‐ ‐‐‐ ‐‐‐ ‐‐‐ ‐‐‐ ‐‐‐ ‐‐‐ ‐‐‐ Mariposa ‐‐‐ ‐‐‐ ‐‐‐ ‐‐‐ ‐‐‐ ‐‐‐ ‐‐‐ ‐‐‐ Mono ‐‐‐ ‐‐‐ ‐‐‐ ‐‐‐ ‐‐‐ ‐‐‐ ‐‐‐ ‐‐‐ Nevada ‐‐‐ ‐‐‐ ‐‐‐ ‐‐‐ ‐‐‐ ‐‐‐ ‐‐‐ ‐‐‐ Placer ‐‐‐ ‐‐‐ ‐‐‐ ‐‐‐ ‐‐‐ ‐‐‐ ‐‐‐ ‐‐‐ Sierra ‐‐‐ ‐‐‐ ‐‐‐ ‐‐‐ ‐‐‐ ‐‐‐ ‐‐‐ ‐‐‐ Tuolumne ‐‐‐ ‐‐‐ ‐‐‐ ‐‐‐ ‐‐‐ ‐‐‐ ‐‐‐ ‐‐‐ District 60 Total ‐‐‐ ‐‐‐ ‐‐‐ ‐‐‐ ‐‐‐ ‐‐‐ ‐‐‐ ‐‐‐ Imperial 3,400 3,400 1,440 10,200 ‐‐‐ ‐‐‐ ‐‐‐ ‐‐‐ Los Angeles ‐‐‐ ‐‐‐ ‐‐‐ ‐‐‐ ‐‐‐ ‐‐‐ ‐‐‐ ‐‐‐ Orange ‐‐‐ ‐‐‐ ‐‐‐ ‐‐‐ ‐‐‐ ‐‐‐ ‐‐‐ ‐‐‐ Riverside 8,200 7,300 1,815 27,600 ‐‐‐ ‐‐‐ ‐‐‐ ‐‐‐ San Bernardino ‐‐‐ ‐‐‐ ‐‐‐ ‐‐‐ ‐‐‐ ‐‐‐ ‐‐‐ ‐‐‐ San Diego ‐‐‐ ‐‐‐ ‐‐‐ ‐‐‐ ‐‐‐ ‐‐‐ ‐‐‐ ‐‐‐ Santa Barbara ‐‐‐ ‐‐‐ ‐‐‐ ‐‐‐ ‐‐‐ ‐‐‐ ‐‐‐ ‐‐‐ Ventura ‐‐‐ ‐‐‐ ‐‐‐ ‐‐‐ ‐‐‐ ‐‐‐ ‐‐‐ ‐‐‐ Other Counties 1/ ‐‐‐ ‐‐‐ ‐‐‐ ‐‐‐ ‐‐‐ ‐‐‐ ‐‐‐ ‐‐‐ District 80 Total 11,600 10,700 1,696 37,800 ‐‐‐ ‐‐‐ ‐‐‐ ‐‐‐ Other Districts 1/ ‐‐‐ ‐‐‐ ‐‐‐ ‐‐‐ 8,700 8,700 1,876 34,000 STATE 120,000 117,000 1,506 367,000 71,000 70,000 1,646 240,000
1/ Counties or district data combined to avoid disclosing data for individual farms.

USDA, NASS, California Field Office 31 California Agricultural Statistics, 2009
Oats Acreage, Yield and Production by County, 2008‐09
County
2008 2009
Planted Harvested Yield/Acre Production Planted Harvested Yield/Acre Production
Acres Acres Tons Tons Acres Acres Tons Tons
Del Norte ‐‐‐ ‐‐‐ ‐‐‐ ‐‐‐ ‐‐‐ ‐‐‐ ‐‐‐ ‐‐‐ Humboldt ‐‐‐ ‐‐‐ ‐‐‐ ‐‐‐ ‐‐‐ ‐‐‐ ‐‐‐ ‐‐‐ Mendocino ‐‐‐ ‐‐‐ ‐‐‐ ‐‐‐ ‐‐‐ ‐‐‐ ‐‐‐ ‐‐‐ Combined Counties 1/ ‐‐‐ ‐‐‐ ‐‐‐ ‐‐‐ ‐‐‐ ‐‐‐ ‐‐‐ ‐‐‐ District 10 Total ‐‐‐ ‐‐‐ ‐‐‐ ‐‐‐ ‐‐‐ ‐‐‐ ‐‐‐ ‐‐‐ Shasta ‐‐‐ ‐‐‐ ‐‐‐ ‐‐‐ ‐‐‐ ‐‐‐ ‐‐‐ ‐‐‐ Siskiyou ‐‐‐ ‐‐‐ ‐‐‐ ‐‐‐ ‐‐‐ ‐‐‐ ‐‐‐ ‐‐‐ Trinity ‐‐‐ ‐‐‐ ‐‐‐ ‐‐‐ ‐‐‐ ‐‐‐ ‐‐‐ ‐‐‐ Combined Counties 1/ ‐‐‐ ‐‐‐ ‐‐‐ ‐‐‐ ‐‐‐ ‐‐‐ ‐‐‐ ‐‐‐ District 20 Total ‐‐‐ ‐‐‐ ‐‐‐ ‐‐‐ ‐‐‐ ‐‐‐ ‐‐‐ ‐‐‐ Lassen ‐‐‐ ‐‐‐ ‐‐‐ ‐‐‐ ‐‐‐ ‐‐‐ ‐‐‐ ‐‐‐ Modoc ‐‐‐ ‐‐‐ ‐‐‐ ‐‐‐ 800 500 1.76 880 Plumas ‐‐‐ ‐‐‐ ‐‐‐ ‐‐‐ ‐‐‐ ‐‐‐ ‐‐‐ ‐‐‐ Combined Counties 1/ ‐‐‐ ‐‐‐ ‐‐‐ ‐‐‐ 500 0 0.00 0 District 30 Total ‐‐‐ ‐‐‐ ‐‐‐ ‐‐‐ 1,300 500 1.76 880 Alameda ‐‐‐ ‐‐‐ ‐‐‐ ‐‐‐ ‐‐‐ ‐‐‐ ‐‐‐ ‐‐‐ Contra Costa ‐‐‐ ‐‐‐ ‐‐‐ ‐‐‐ 700 0 0.00 0 Lake ‐‐‐ ‐‐‐ ‐‐‐ ‐‐‐ 700 0 0.00 0 Marin ‐‐‐ ‐‐‐ ‐‐‐ ‐‐‐ ‐‐‐ ‐‐‐ ‐‐‐ ‐‐‐ Monterey 1,100 0 0.00 0 1,100 0 0.00 0 Napa ‐‐‐ ‐‐‐ ‐‐‐ ‐‐‐ ‐‐‐ ‐‐‐ ‐‐‐ ‐‐‐ San Benito ‐‐‐ ‐‐‐ ‐‐‐ ‐‐‐ ‐‐‐ ‐‐‐ ‐‐‐ ‐‐‐ San Francisco ‐‐‐ ‐‐‐ ‐‐‐ ‐‐‐ ‐‐‐ ‐‐‐ ‐‐‐ ‐‐‐ San Luis Obispo ‐‐‐ ‐‐‐ ‐‐‐ ‐‐‐ 4,500 500 0.83 416 San Mateo ‐‐‐ ‐‐‐ ‐‐‐ ‐‐‐ ‐‐‐ ‐‐‐ ‐‐‐ ‐‐‐ Santa Clara ‐‐‐ ‐‐‐ ‐‐‐ ‐‐‐ ‐‐‐ ‐‐‐ ‐‐‐ ‐‐‐ Santa Cruz ‐‐‐ ‐‐‐ ‐‐‐ ‐‐‐ ‐‐‐ ‐‐‐ ‐‐‐ ‐‐‐ Sonoma 13,400 700 0.98 688 8,900 1,700 1.41 2,400 Combined Counties 1/ 10,500 1,300 0.95 1,232 6,100 1,800 0.79 1,424 District 40 Total 25,000 2,000 0.96 1,920 22,000 4,000 1.06 4,240 Butte ‐‐‐ ‐‐‐ ‐‐‐ ‐‐‐ ‐‐‐ ‐‐‐ ‐‐‐ ‐‐‐ Colusa ‐‐‐ ‐‐‐ ‐‐‐ ‐‐‐ ‐‐‐ ‐‐‐ ‐‐‐ ‐‐‐ Glenn ‐‐‐ ‐‐‐ ‐‐‐ ‐‐‐ 2,300 1,500 1.51 2,272 Sacramento ‐‐‐ ‐‐‐ ‐‐‐ ‐‐‐ ‐‐‐ ‐‐‐ ‐‐‐ ‐‐‐ Solano ‐‐‐ ‐‐‐ ‐‐‐ ‐‐‐ ‐‐‐ ‐‐‐ ‐‐‐ ‐‐‐ Sutter ‐‐‐ ‐‐‐ ‐‐‐ ‐‐‐ ‐‐‐ ‐‐‐ ‐‐‐ ‐‐‐ Tehama 1,600 300 1.12 336 ‐‐‐ ‐‐‐ ‐‐‐ ‐‐‐ Yolo ‐‐‐ ‐‐‐ ‐‐‐ ‐‐‐ ‐‐‐ ‐‐‐ ‐‐‐ ‐‐‐ Yuba ‐‐‐ ‐‐‐ ‐‐‐ ‐‐‐ ‐‐‐ ‐‐‐ ‐‐‐ ‐‐‐ Combined Counties 1/ 15,400 2,700 1.51 4,080 17,700 3,500 1.59 5,568 District 50 Total 17,000 3,000 1.47 4,416 20,000 5,000 1.57 7,840 Fresno ‐‐‐ ‐‐‐ ‐‐‐ ‐‐‐ ‐‐‐ ‐‐‐ ‐‐‐ ‐‐‐ Kern 9,500 1,400 0.88 1,232 ‐‐‐ ‐‐‐ ‐‐‐ ‐‐‐ Kings ‐‐‐ ‐‐‐ ‐‐‐ ‐‐‐ ‐‐‐ ‐‐‐ ‐‐‐ ‐‐‐ Madera ‐‐‐ ‐‐‐ ‐‐‐ ‐‐‐ ‐‐‐ ‐‐‐ ‐‐‐ ‐‐‐ Merced 62,000 3,500 1.12 3,920 59,500 6,000 1.92 11,520 San Joaquin ‐‐‐ ‐‐‐ ‐‐‐ ‐‐‐ ‐‐‐ ‐‐‐ ‐‐‐ ‐‐‐ Stanislaus 55,000 1,500 1.17 1,760 50,000 2,200 1.89 4,160 Tulare ‐‐‐ ‐‐‐ ‐‐‐ ‐‐‐ ‐‐‐ ‐‐‐ ‐‐‐ ‐‐‐ Combined Counties 1/ 77,500 11,200 1.33 14,848 85,500 10,300 1.75 18,000 District 51 Total 204,000 17,600 1.24 21,760 195,000 18,500 1.82 33,680 Alpine ‐‐‐ ‐‐‐ ‐‐‐ ‐‐‐ ‐‐‐ ‐‐‐ ‐‐‐ ‐‐‐ Amador ‐‐‐ ‐‐‐ ‐‐‐ ‐‐‐ ‐‐‐ ‐‐‐ ‐‐‐ ‐‐‐ Calaveras ‐‐‐ ‐‐‐ ‐‐‐ ‐‐‐ ‐‐‐ ‐‐‐ ‐‐‐ ‐‐‐ El Dorado ‐‐‐ ‐‐‐ ‐‐‐ ‐‐‐ ‐‐‐ ‐‐‐ ‐‐‐ ‐‐‐ Inyo ‐‐‐ ‐‐‐ ‐‐‐ ‐‐‐ ‐‐‐ ‐‐‐ ‐‐‐ ‐‐‐ Mariposa ‐‐‐ ‐‐‐ ‐‐‐ ‐‐‐ ‐‐‐ ‐‐‐ ‐‐‐ ‐‐‐ Mono ‐‐‐ ‐‐‐ ‐‐‐ ‐‐‐ ‐‐‐ ‐‐‐ ‐‐‐ ‐‐‐ Nevada ‐‐‐ ‐‐‐ ‐‐‐ ‐‐‐ ‐‐‐ ‐‐‐ ‐‐‐ ‐‐‐ Placer ‐‐‐ ‐‐‐ ‐‐‐ ‐‐‐ 2,200 0 0.00 0 Sierra ‐‐‐ ‐‐‐ ‐‐‐ ‐‐‐ ‐‐‐ ‐‐‐ ‐‐‐ ‐‐‐ Tuolumne ‐‐‐ ‐‐‐ ‐‐‐ ‐‐‐ ‐‐‐ ‐‐‐ ‐‐‐ ‐‐‐ Combined Counties 1/ 2,000 0 0.00 0 800 0 0.00 0 District 60 Total 2,000 0 0.00 0 3,000 0 0.00 0 Imperial ‐‐‐ ‐‐‐ ‐‐‐ ‐‐‐ ‐‐‐ ‐‐‐ ‐‐‐ ‐‐‐ Los Angeles ‐‐‐ ‐‐‐ ‐‐‐ ‐‐‐ ‐‐‐ ‐‐‐ ‐‐‐ ‐‐‐ Orange ‐‐‐ ‐‐‐ ‐‐‐ ‐‐‐ ‐‐‐ ‐‐‐ ‐‐‐ ‐‐‐ Riverside ‐‐‐ ‐‐‐ ‐‐‐ ‐‐‐ ‐‐‐ ‐‐‐ ‐‐‐ ‐‐‐ San Bernardino ‐‐‐ ‐‐‐ ‐‐‐ ‐‐‐ ‐‐‐ ‐‐‐ ‐‐‐ ‐‐‐ San Diego ‐‐‐ ‐‐‐ ‐‐‐ ‐‐‐ ‐‐‐ ‐‐‐ ‐‐‐ ‐‐‐ Santa Barbara ‐‐‐ ‐‐‐ ‐‐‐ ‐‐‐ ‐‐‐ ‐‐‐ ‐‐‐ ‐‐‐ Ventura ‐‐‐ ‐‐‐ ‐‐‐ ‐‐‐ ‐‐‐ ‐‐‐ ‐‐‐ ‐‐‐ Combined Counties 1/ 8,500 1,000 1.50 1,504 6,500 1,500 1.87 2,800 District 80 Total 8,500 1,000 1.50 1,504 6,500 1,500 1.87 2,800 Other Districts 3,500 1,400 1.71 2,400 2,200 500 1.92 960 STATE 260,000 25,000 1.28 32,000 250,000 30,000 1.68 50,400
1/ Counties or district data combined to avoid disclosing data for individual farms.

USDA, NASS, California Field Office 32 California Agricultural Statistics, 2009
Rice Acreage, Yield and Production by County, 2008‐09
County
2008 2009
Planted Harvested Yield/Acre Production Planted Harvested Yield/Acre Production
Acres Acres Pounds Cwt. Acres Acres Pounds Cwt.
Del Norte ‐‐‐ ‐‐‐ ‐‐‐ ‐‐‐ ‐‐‐ ‐‐‐ ‐‐‐ ‐‐‐ Humboldt ‐‐‐ ‐‐‐ ‐‐‐ ‐‐‐ ‐‐‐ ‐‐‐ ‐‐‐ ‐‐‐ Mendocino ‐‐‐ ‐‐‐ ‐‐‐ ‐‐‐ ‐‐‐ ‐‐‐ ‐‐‐ ‐‐‐ District 10 Total ‐‐‐ ‐‐‐ ‐‐‐ ‐‐‐ ‐‐‐ ‐‐‐ ‐‐‐ ‐‐‐ Shasta ‐‐‐ ‐‐‐ ‐‐‐ ‐‐‐ ‐‐‐ ‐‐‐ ‐‐‐ ‐‐‐ Siskiyou ‐‐‐ ‐‐‐ ‐‐‐ ‐‐‐ ‐‐‐ ‐‐‐ ‐‐‐ ‐‐‐ Trinity ‐‐‐ ‐‐‐ ‐‐‐ ‐‐‐ ‐‐‐ ‐‐‐ ‐‐‐ ‐‐‐ District 20 Total ‐‐‐ ‐‐‐ ‐‐‐ ‐‐‐ ‐‐‐ ‐‐‐ ‐‐‐ ‐‐‐ Lassen ‐‐‐ ‐‐‐ ‐‐‐ ‐‐‐ ‐‐‐ ‐‐‐ ‐‐‐ ‐‐‐ Modoc ‐‐‐ ‐‐‐ ‐‐‐ ‐‐‐ ‐‐‐ ‐‐‐ ‐‐‐ ‐‐‐ Plumas ‐‐‐ ‐‐‐ ‐‐‐ ‐‐‐ ‐‐‐ ‐‐‐ ‐‐‐ ‐‐‐ District 30 Total ‐‐‐ ‐‐‐ ‐‐‐ ‐‐‐ ‐‐‐ ‐‐‐ ‐‐‐ ‐‐‐ Alameda ‐‐‐ ‐‐‐ ‐‐‐ ‐‐‐ ‐‐‐ ‐‐‐ ‐‐‐ ‐‐‐ Contra Costa ‐‐‐ ‐‐‐ ‐‐‐ ‐‐‐ ‐‐‐ ‐‐‐ ‐‐‐ ‐‐‐ Lake ‐‐‐ ‐‐‐ ‐‐‐ ‐‐‐ ‐‐‐ ‐‐‐ ‐‐‐ ‐‐‐ Marin ‐‐‐ ‐‐‐ ‐‐‐ ‐‐‐ ‐‐‐ ‐‐‐ ‐‐‐ ‐‐‐ Monterey ‐‐‐ ‐‐‐ ‐‐‐ ‐‐‐ ‐‐‐ ‐‐‐ ‐‐‐ ‐‐‐ Napa ‐‐‐ ‐‐‐ ‐‐‐ ‐‐‐ ‐‐‐ ‐‐‐ ‐‐‐ ‐‐‐ San Benito ‐‐‐ ‐‐‐ ‐‐‐ ‐‐‐ ‐‐‐ ‐‐‐ ‐‐‐ ‐‐‐ San Francisco ‐‐‐ ‐‐‐ ‐‐‐ ‐‐‐ ‐‐‐ ‐‐‐ ‐‐‐ ‐‐‐ San Luis Obispo ‐‐‐ ‐‐‐ ‐‐‐ ‐‐‐ ‐‐‐ ‐‐‐ ‐‐‐ ‐‐‐ San Mateo ‐‐‐ ‐‐‐ ‐‐‐ ‐‐‐ ‐‐‐ ‐‐‐ ‐‐‐ ‐‐‐ Santa Clara ‐‐‐ ‐‐‐ ‐‐‐ ‐‐‐ ‐‐‐ ‐‐‐ ‐‐‐ ‐‐‐ Santa Cruz ‐‐‐ ‐‐‐ ‐‐‐ ‐‐‐ ‐‐‐ ‐‐‐ ‐‐‐ ‐‐‐ Sonoma ‐‐‐ ‐‐‐ ‐‐‐ ‐‐‐ ‐‐‐ ‐‐‐ ‐‐‐ ‐‐‐ District 40 Total ‐‐‐ ‐‐‐ ‐‐‐ ‐‐‐ ‐‐‐ ‐‐‐ ‐‐‐ ‐‐‐ Butte 96,500 95,500 8,870 8,475,000 106,400 105,400 9,160 9,653,000 Colusa 152,000 151,800 8,600 13,059,000 150,400 149,400 8,780 13,119,000 Glenn 84,700 84,500 8,390 7,091,000 85,700 85,700 8,600 7,370,000 Sacramento ‐‐‐ ‐‐‐ ‐‐‐ ‐‐‐ ‐‐‐ ‐‐‐ ‐‐‐ ‐‐‐ Solano ‐‐‐ ‐‐‐ ‐‐‐ ‐‐‐ Sutter 97,300 97,000 7,380 7,161,000 115,300 114,300 8,240 9,414,000 Tehama ‐‐‐ ‐‐‐ ‐‐‐ ‐‐‐ ‐‐‐ ‐‐‐ ‐‐‐ ‐‐‐ Yolo 27,300 27,300 8,190 2,237,000 35,900 34,900 8,460 2,953,000 Yuba 35,200 34,900 8,540 2,980,000 38,000 37,000 8,120 3,003,000 Other Counties 1/ 4,500 4,500 8,530 384,000 3,900 3,900 6,050 236,000 District 50 Total 497,500 495,500 8,350 41,387,000 535,600 530,600 8,620 45,748,000 Fresno 1,400 1,400 7,290 102,000 ‐‐‐ ‐‐‐ ‐‐‐ ‐‐‐ Kern ‐‐‐ ‐‐‐ ‐‐‐ ‐‐‐ ‐‐‐ ‐‐‐ ‐‐‐ ‐‐‐ Kings ‐‐‐ ‐‐‐ ‐‐‐ ‐‐‐ ‐‐‐ ‐‐‐ ‐‐‐ ‐‐‐ Madera ‐‐‐ ‐‐‐ ‐‐‐ ‐‐‐ ‐‐‐ ‐‐‐ ‐‐‐ ‐‐‐ Merced 2,400 2,400 7,420 178,000 ‐‐‐ ‐‐‐ ‐‐‐ ‐‐‐ San Joaquin 5,000 5,000 7,680 384,000 5,400 5,400 7,150 386,000 Stanislaus ‐‐‐ ‐‐‐ ‐‐‐ ‐‐‐ ‐‐‐ ‐‐‐ ‐‐‐ ‐‐‐ Tulare ‐‐‐ ‐‐‐ ‐‐‐ ‐‐‐ ‐‐‐ ‐‐‐ ‐‐‐ ‐‐‐ Other Counties 1/ 1,700 1,700 7,530 128,000 6,400 6,400 8,000 512,000 District 51 Total 10,500 10,500 7,540 792,000 11,800 11,800 7,610 898,000 Alpine ‐‐‐ ‐‐‐ ‐‐‐ ‐‐‐ ‐‐‐ ‐‐‐ ‐‐‐ ‐‐‐ Amador ‐‐‐ ‐‐‐ ‐‐‐ ‐‐‐ ‐‐‐ ‐‐‐ ‐‐‐ ‐‐‐ Calaveras ‐‐‐ ‐‐‐ ‐‐‐ ‐‐‐ ‐‐‐ ‐‐‐ ‐‐‐ ‐‐‐ El Dorado ‐‐‐ ‐‐‐ ‐‐‐ ‐‐‐ ‐‐‐ ‐‐‐ ‐‐‐ ‐‐‐ Inyo ‐‐‐ ‐‐‐ ‐‐‐ ‐‐‐ ‐‐‐ ‐‐‐ ‐‐‐ ‐‐‐ Mariposa ‐‐‐ ‐‐‐ ‐‐‐ ‐‐‐ ‐‐‐ ‐‐‐ ‐‐‐ ‐‐‐ Mono ‐‐‐ ‐‐‐ ‐‐‐ ‐‐‐ ‐‐‐ ‐‐‐ ‐‐‐ ‐‐‐ Nevada ‐‐‐ ‐‐‐ ‐‐‐ ‐‐‐ ‐‐‐ ‐‐‐ ‐‐‐ ‐‐‐ Placer 11,000 11,000 7,740 851,000 13,600 13,600 8,510 1,158,000 Sierra ‐‐‐ ‐‐‐ ‐‐‐ ‐‐‐ ‐‐‐ ‐‐‐ ‐‐‐ ‐‐‐ Tuolumne ‐‐‐ ‐‐‐ ‐‐‐ ‐‐‐ ‐‐‐ ‐‐‐ ‐‐‐ ‐‐‐ District 60 Total 11,000 11,000 7,740 851,000 13,600 13,600 8,510 1,158,000 Imperial ‐‐‐ ‐‐‐ ‐‐‐ ‐‐‐ ‐‐‐ ‐‐‐ ‐‐‐ ‐‐‐ Los Angeles ‐‐‐ ‐‐‐ ‐‐‐ ‐‐‐ ‐‐‐ ‐‐‐ ‐‐‐ ‐‐‐ Orange ‐‐‐ ‐‐‐ ‐‐‐ ‐‐‐ ‐‐‐ ‐‐‐ ‐‐‐ ‐‐‐ Riverside ‐‐‐ ‐‐‐ ‐‐‐ ‐‐‐ ‐‐‐ ‐‐‐ ‐‐‐ ‐‐‐ San Bernardino ‐‐‐ ‐‐‐ ‐‐‐ ‐‐‐ ‐‐‐ ‐‐‐ ‐‐‐ ‐‐‐ San Diego ‐‐‐ ‐‐‐ ‐‐‐ ‐‐‐ ‐‐‐ ‐‐‐ ‐‐‐ ‐‐‐ Santa Barbara ‐‐‐ ‐‐‐ ‐‐‐ ‐‐‐ ‐‐‐ ‐‐‐ ‐‐‐ ‐‐‐ Ventura ‐‐‐ ‐‐‐ ‐‐‐ ‐‐‐ ‐‐‐ ‐‐‐ ‐‐‐ ‐‐‐ District 80 Total ‐‐‐ ‐‐‐ ‐‐‐ ‐‐‐ ‐‐‐ ‐‐‐ ‐‐‐ ‐‐‐ STATE 519,000 517,000 8,320 43,030,000 561,000 556,000 8,600 47,804,000
1/ Counties or district data combined to avoid disclosing data for individual farms.

USDA, NASS, California Field Office 33 California Agricultural Statistics, 2009
Sugar Beet Acreage, Yield and Production by County, 2008‐09
County
2008 2009
Planted Harvested Yield/Acre Production Sucrose Planted Harvested Yield/Acre Production Sucrose
Acres Acres Tons Tons Percent Acres Acres Tons Tons Percent
Del Norte ‐‐‐ ‐‐‐ ‐‐‐ ‐‐‐ ‐‐‐ ‐‐‐ ‐‐‐ ‐‐‐ ‐‐‐ ‐‐‐ Humboldt ‐‐‐ ‐‐‐ ‐‐‐ ‐‐‐ ‐‐‐ ‐‐‐ ‐‐‐ ‐‐‐ ‐‐‐ ‐‐‐ Mendocino ‐‐‐ ‐‐‐ ‐‐‐ ‐‐‐ ‐‐‐ ‐‐‐ ‐‐‐ ‐‐‐ ‐‐‐ ‐‐‐ District 10 Total ‐‐‐ ‐‐‐ ‐‐‐ ‐‐‐ ‐‐‐ ‐‐‐ ‐‐‐ ‐‐‐ ‐‐‐ ‐‐‐ Shasta ‐‐‐ ‐‐‐ ‐‐‐ ‐‐‐ ‐‐‐ ‐‐‐ ‐‐‐ ‐‐‐ ‐‐‐ ‐‐‐ Siskiyou ‐‐‐ ‐‐‐ ‐‐‐ ‐‐‐ ‐‐‐ ‐‐‐ ‐‐‐ ‐‐‐ ‐‐‐ ‐‐‐ Trinity ‐‐‐ ‐‐‐ ‐‐‐ ‐‐‐ ‐‐‐ ‐‐‐ ‐‐‐ ‐‐‐ ‐‐‐ ‐‐‐ District 20 Total ‐‐‐ ‐‐‐ ‐‐‐ ‐‐‐ ‐‐‐ ‐‐‐ ‐‐‐ ‐‐‐ ‐‐‐ ‐‐‐ Lassen ‐‐‐ ‐‐‐ ‐‐‐ ‐‐‐ ‐‐‐ ‐‐‐ ‐‐‐ ‐‐‐ ‐‐‐ ‐‐‐ Modoc ‐‐‐ ‐‐‐ ‐‐‐ ‐‐‐ ‐‐‐ ‐‐‐ ‐‐‐ ‐‐‐ ‐‐‐ ‐‐‐ Plumas ‐‐‐ ‐‐‐ ‐‐‐ ‐‐‐ ‐‐‐ ‐‐‐ ‐‐‐ ‐‐‐ ‐‐‐ ‐‐‐ District 30 Total ‐‐‐ ‐‐‐ ‐‐‐ ‐‐‐ ‐‐‐ ‐‐‐ ‐‐‐ ‐‐‐ ‐‐‐ ‐‐‐ Alameda ‐‐‐ ‐‐‐ ‐‐‐ ‐‐‐ ‐‐‐ ‐‐‐ ‐‐‐ ‐‐‐ ‐‐‐ ‐‐‐ Contra Costa ‐‐‐ ‐‐‐ ‐‐‐ ‐‐‐ ‐‐‐ ‐‐‐ ‐‐‐ ‐‐‐ ‐‐‐ ‐‐‐ Lake ‐‐‐ ‐‐‐ ‐‐‐ ‐‐‐ ‐‐‐ ‐‐‐ ‐‐‐ ‐‐‐ ‐‐‐ ‐‐‐ Marin ‐‐‐ ‐‐‐ ‐‐‐ ‐‐‐ ‐‐‐ ‐‐‐ ‐‐‐ ‐‐‐ ‐‐‐ ‐‐‐ Monterey ‐‐‐ ‐‐‐ ‐‐‐ ‐‐‐ ‐‐‐ ‐‐‐ ‐‐‐ ‐‐‐ ‐‐‐ ‐‐‐ Napa ‐‐‐ ‐‐‐ ‐‐‐ ‐‐‐ ‐‐‐ ‐‐‐ ‐‐‐ ‐‐‐ ‐‐‐ ‐‐‐ San Benito ‐‐‐ ‐‐‐ ‐‐‐ ‐‐‐ ‐‐‐ ‐‐‐ ‐‐‐ ‐‐‐ ‐‐‐ ‐‐‐ San Francisco ‐‐‐ ‐‐‐ ‐‐‐ ‐‐‐ ‐‐‐ ‐‐‐ ‐‐‐ ‐‐‐ ‐‐‐ ‐‐‐ San Luis Obispo ‐‐‐ ‐‐‐ ‐‐‐ ‐‐‐ ‐‐‐ ‐‐‐ ‐‐‐ ‐‐‐ ‐‐‐ ‐‐‐ San Mateo ‐‐‐ ‐‐‐ ‐‐‐ ‐‐‐ ‐‐‐ ‐‐‐ ‐‐‐ ‐‐‐ ‐‐‐ ‐‐‐ Santa Clara ‐‐‐ ‐‐‐ ‐‐‐ ‐‐‐ ‐‐‐ ‐‐‐ ‐‐‐ ‐‐‐ ‐‐‐ ‐‐‐ Santa Cruz ‐‐‐ ‐‐‐ ‐‐‐ ‐‐‐ ‐‐‐ ‐‐‐ ‐‐‐ ‐‐‐ ‐‐‐ ‐‐‐ Sonoma ‐‐‐ ‐‐‐ ‐‐‐ ‐‐‐ ‐‐‐ ‐‐‐ ‐‐‐ ‐‐‐ ‐‐‐ ‐‐‐ District 40 Total ‐‐‐ ‐‐‐ ‐‐‐ ‐‐‐ ‐‐‐ ‐‐‐ ‐‐‐ ‐‐‐ ‐‐‐ ‐‐‐ Butte ‐‐‐ ‐‐‐ ‐‐‐ ‐‐‐ ‐‐‐ ‐‐‐ ‐‐‐ ‐‐‐ ‐‐‐ ‐‐‐ Colusa ‐‐‐ ‐‐‐ ‐‐‐ ‐‐‐ ‐‐‐ ‐‐‐ ‐‐‐ ‐‐‐ ‐‐‐ ‐‐‐ Glenn ‐‐‐ ‐‐‐ ‐‐‐ ‐‐‐ ‐‐‐ ‐‐‐ ‐‐‐ ‐‐‐ ‐‐‐ ‐‐‐ Sacramento ‐‐‐ ‐‐‐ ‐‐‐ ‐‐‐ ‐‐‐ ‐‐‐ ‐‐‐ ‐‐‐ ‐‐‐ ‐‐‐ Solano ‐‐‐ ‐‐‐ ‐‐‐ ‐‐‐ ‐‐‐ ‐‐‐ ‐‐‐ ‐‐‐ ‐‐‐ ‐‐‐ Sutter ‐‐‐ ‐‐‐ ‐‐‐ ‐‐‐ ‐‐‐ ‐‐‐ ‐‐‐ ‐‐‐ ‐‐‐ ‐‐‐ Tehama ‐‐‐ ‐‐‐ ‐‐‐ ‐‐‐ ‐‐‐ ‐‐‐ ‐‐‐ ‐‐‐ ‐‐‐ ‐‐‐ Yolo ‐‐‐ ‐‐‐ ‐‐‐ ‐‐‐ ‐‐‐ ‐‐‐ ‐‐‐ ‐‐‐ ‐‐‐ ‐‐‐ Yuba ‐‐‐ ‐‐‐ ‐‐‐ ‐‐‐ ‐‐‐ ‐‐‐ ‐‐‐ ‐‐‐ ‐‐‐ ‐‐‐ District 50 Total ‐‐‐ ‐‐‐ ‐‐‐ ‐‐‐ ‐‐‐ ‐‐‐ ‐‐‐ ‐‐‐ ‐‐‐ ‐‐‐ Fresno 6,000 5,800 31.7 184,000 16.26 ‐‐‐ ‐‐‐ ‐‐‐ ‐‐‐ ‐‐‐ Kern ‐‐‐ ‐‐‐ ‐‐‐ ‐‐‐ ‐‐‐ ‐‐‐ ‐‐‐ ‐‐‐ ‐‐‐ ‐‐‐ Kings 1,100 1,000 36.0 36,000 16.66 ‐‐‐ ‐‐‐ ‐‐‐ ‐‐‐ ‐‐‐ Madera ‐‐‐ ‐‐‐ ‐‐‐ ‐‐‐ ‐‐‐ ‐‐‐ ‐‐‐ ‐‐‐ ‐‐‐ ‐‐‐ Merced ‐‐‐ ‐‐‐ ‐‐‐ ‐‐‐ ‐‐‐ ‐‐‐ ‐‐‐ ‐‐‐ ‐‐‐ ‐‐‐ San Joaquin ‐‐‐ ‐‐‐ ‐‐‐ ‐‐‐ ‐‐‐ ‐‐‐ ‐‐‐ ‐‐‐ ‐‐‐ ‐‐‐ Stanislaus ‐‐‐ ‐‐‐ ‐‐‐ ‐‐‐ ‐‐‐ ‐‐‐ ‐‐‐ ‐‐‐ ‐‐‐ ‐‐‐ Tulare ‐‐‐ ‐‐‐ ‐‐‐ ‐‐‐ ‐‐‐ ‐‐‐ ‐‐‐ ‐‐‐ ‐‐‐ ‐‐‐ Other Counties 1/ 500 500 36.0 18,000 15.62 ‐‐‐ ‐‐‐ ‐‐‐ ‐‐‐ ‐‐‐ District 51 Total 7,600 7,300 32.6 238,000 16.26 ‐‐‐ ‐‐‐ ‐‐‐ ‐‐‐ ‐‐‐ Alpine ‐‐‐ ‐‐‐ ‐‐‐ ‐‐‐ ‐‐‐ ‐‐‐ ‐‐‐ ‐‐‐ ‐‐‐ ‐‐‐ Amador ‐‐‐ ‐‐‐ ‐‐‐ ‐‐‐ ‐‐‐ ‐‐‐ ‐‐‐ ‐‐‐ ‐‐‐ ‐‐‐ Calaveras ‐‐‐ ‐‐‐ ‐‐‐ ‐‐‐ ‐‐‐ ‐‐‐ ‐‐‐ ‐‐‐ ‐‐‐ ‐‐‐ El Dorado ‐‐‐ ‐‐‐ ‐‐‐ ‐‐‐ ‐‐‐ ‐‐‐ ‐‐‐ ‐‐‐ ‐‐‐ ‐‐‐ Inyo ‐‐‐ ‐‐‐ ‐‐‐ ‐‐‐ ‐‐‐ ‐‐‐ ‐‐‐ ‐‐‐ ‐‐‐ ‐‐‐ Mariposa ‐‐‐ ‐‐‐ ‐‐‐ ‐‐‐ ‐‐‐ ‐‐‐ ‐‐‐ ‐‐‐ ‐‐‐ ‐‐‐ Mono ‐‐‐ ‐‐‐ ‐‐‐ ‐‐‐ ‐‐‐ ‐‐‐ ‐‐‐ ‐‐‐ ‐‐‐ ‐‐‐ Nevada ‐‐‐ ‐‐‐ ‐‐‐ ‐‐‐ ‐‐‐ ‐‐‐ ‐‐‐ ‐‐‐ ‐‐‐ ‐‐‐ Placer ‐‐‐ ‐‐‐ ‐‐‐ ‐‐‐ ‐‐‐ ‐‐‐ ‐‐‐ ‐‐‐ ‐‐‐ ‐‐‐ Sierra ‐‐‐ ‐‐‐ ‐‐‐ ‐‐‐ ‐‐‐ ‐‐‐ ‐‐‐ ‐‐‐ ‐‐‐ ‐‐‐ Tuolumne ‐‐‐ ‐‐‐ ‐‐‐ ‐‐‐ ‐‐‐ ‐‐‐ ‐‐‐ ‐‐‐ ‐‐‐ ‐‐‐ District 60 Total ‐‐‐ ‐‐‐ ‐‐‐ ‐‐‐ ‐‐‐ ‐‐‐ ‐‐‐ ‐‐‐ ‐‐‐ ‐‐‐ Imperial 18,400 18,000 45.2 814,000 17.07 25,300 25,300 35 886,000 17 81 Los Angeles ‐‐‐ ‐‐‐ ‐‐‐ ‐‐‐ ‐‐‐ ‐‐‐ ‐‐‐ ‐‐‐ ‐‐‐ ‐‐‐ Orange ‐‐‐ ‐‐‐ ‐‐‐ ‐‐‐ ‐‐‐ ‐‐‐ ‐‐‐ ‐‐‐ ‐‐‐ ‐‐‐ Riverside ‐‐‐ ‐‐‐ ‐‐‐ ‐‐‐ ‐‐‐ ‐‐‐ ‐‐‐ ‐‐‐ ‐‐‐ ‐‐‐ San Bernardino ‐‐‐ ‐‐‐ ‐‐‐ ‐‐‐ ‐‐‐ ‐‐‐ ‐‐‐ ‐‐‐ ‐‐‐ ‐‐‐ San Diego ‐‐‐ ‐‐‐ ‐‐‐ ‐‐‐ ‐‐‐ ‐‐‐ ‐‐‐ ‐‐‐ ‐‐‐ ‐‐‐ Santa Barbara ‐‐‐ ‐‐‐ ‐‐‐ ‐‐‐ ‐‐‐ ‐‐‐ ‐‐‐ ‐‐‐ ‐‐‐ ‐‐‐ Ventura ‐‐‐ ‐‐‐ ‐‐‐ ‐‐‐ ‐‐‐ ‐‐‐ ‐‐‐ ‐‐‐ ‐‐‐ ‐‐‐ District 80 Total 18,400 18,000 45.2 814,000 17.07 25,300 25,300 35 886,000 17.81 STATE 26,000 25,300 41.6 1,052,000 16.89 25,300 25,300 35 886,000 17.81
1/ Counties or district data combined to avoid disclosing data for individual farms.
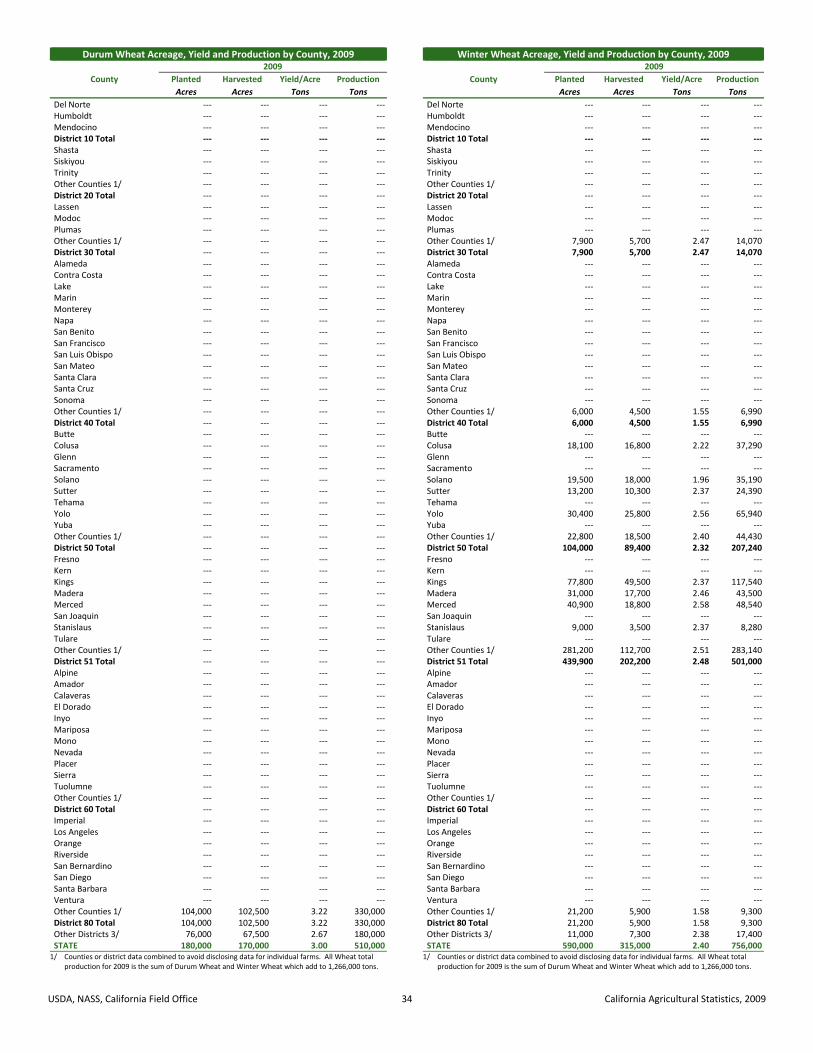
USDA, NASS, California Field Office 34 California Agricultural Statistics, 2009
Durum Wheat Acreage, Yield and Production by County, 2009
Winter Wheat Acreage, Yield and Production by County, 2009
County
2009
County
2009
Planted Harvested Yield/Acre Production Planted Harvested Yield/Acre Production
Acres Acres Tons Tons Acres Acres Tons Tons
Del Norte ‐‐‐ ‐‐‐ ‐‐‐ ‐‐‐ Del Norte ‐‐‐ ‐‐‐ ‐‐‐ ‐‐‐ Humboldt ‐‐‐ ‐‐‐ ‐‐‐ ‐‐‐ Humboldt ‐‐‐ ‐‐‐ ‐‐‐ ‐‐‐ Mendocino ‐‐‐ ‐‐‐ ‐‐‐ ‐‐‐ Mendocino ‐‐‐ ‐‐‐ ‐‐‐ ‐‐‐ District 10 Total ‐‐‐ ‐‐‐ ‐‐‐ ‐‐‐ District 10 Total ‐‐‐ ‐‐‐ ‐‐‐ ‐‐‐ Shasta ‐‐‐ ‐‐‐ ‐‐‐ ‐‐‐ Shasta ‐‐‐ ‐‐‐ ‐‐‐ ‐‐‐ Siskiyou ‐‐‐ ‐‐‐ ‐‐‐ ‐‐‐ Siskiyou ‐‐‐ ‐‐‐ ‐‐‐ ‐‐‐ Trinity ‐‐‐ ‐‐‐ ‐‐‐ ‐‐‐ Trinity ‐‐‐ ‐‐‐ ‐‐‐ ‐‐‐ Other Counties 1/ ‐‐‐ ‐‐‐ ‐‐‐ ‐‐‐ Other Counties 1/ ‐‐‐ ‐‐‐ ‐‐‐ ‐‐‐ District 20 Total ‐‐‐ ‐‐‐ ‐‐‐ ‐‐‐ District 20 Total ‐‐‐ ‐‐‐ ‐‐‐ ‐‐‐ Lassen ‐‐‐ ‐‐‐ ‐‐‐ ‐‐‐ Lassen ‐‐‐ ‐‐‐ ‐‐‐ ‐‐‐ Modoc ‐‐‐ ‐‐‐ ‐‐‐ ‐‐‐ Modoc ‐‐‐ ‐‐‐ ‐‐‐ ‐‐‐ Plumas ‐‐‐ ‐‐‐ ‐‐‐ ‐‐‐ Plumas ‐‐‐ ‐‐‐ ‐‐‐ ‐‐‐ Other Counties 1/ ‐‐‐ ‐‐‐ ‐‐‐ ‐‐‐ Other Counties 1/ 7,900 5,700 2.47 14,070 District 30 Total ‐‐‐ ‐‐‐ ‐‐‐ ‐‐‐ District 30 Total 7,900 5,700 2.47 14,070 Alameda ‐‐‐ ‐‐‐ ‐‐‐ ‐‐‐ Alameda ‐‐‐ ‐‐‐ ‐‐‐ ‐‐‐ Contra Costa ‐‐‐ ‐‐‐ ‐‐‐ ‐‐‐ Contra Costa ‐‐‐ ‐‐‐ ‐‐‐ ‐‐‐ Lake ‐‐‐ ‐‐‐ ‐‐‐ ‐‐‐ Lake ‐‐‐ ‐‐‐ ‐‐‐ ‐‐‐ Marin ‐‐‐ ‐‐‐ ‐‐‐ ‐‐‐ Marin ‐‐‐ ‐‐‐ ‐‐‐ ‐‐‐ Monterey ‐‐‐ ‐‐‐ ‐‐‐ ‐‐‐ Monterey ‐‐‐ ‐‐‐ ‐‐‐ ‐‐‐ Napa ‐‐‐ ‐‐‐ ‐‐‐ ‐‐‐ Napa ‐‐‐ ‐‐‐ ‐‐‐ ‐‐‐ San Benito ‐‐‐ ‐‐‐ ‐‐‐ ‐‐‐ San Benito ‐‐‐ ‐‐‐ ‐‐‐ ‐‐‐ San Francisco ‐‐‐ ‐‐‐ ‐‐‐ ‐‐‐ San Francisco ‐‐‐ ‐‐‐ ‐‐‐ ‐‐‐ San Luis Obispo ‐‐‐ ‐‐‐ ‐‐‐ ‐‐‐ San Luis Obispo ‐‐‐ ‐‐‐ ‐‐‐ ‐‐‐ San Mateo ‐‐‐ ‐‐‐ ‐‐‐ ‐‐‐ San Mateo ‐‐‐ ‐‐‐ ‐‐‐ ‐‐‐ Santa Clara ‐‐‐ ‐‐‐ ‐‐‐ ‐‐‐ Santa Clara ‐‐‐ ‐‐‐ ‐‐‐ ‐‐‐ Santa Cruz ‐‐‐ ‐‐‐ ‐‐‐ ‐‐‐ Santa Cruz ‐‐‐ ‐‐‐ ‐‐‐ ‐‐‐ Sonoma ‐‐‐ ‐‐‐ ‐‐‐ ‐‐‐ Sonoma ‐‐‐ ‐‐‐ ‐‐‐ ‐‐‐ Other Counties 1/ ‐‐‐ ‐‐‐ ‐‐‐ ‐‐‐ Other Counties 1/ 6,000 4,500 1.55 6,990 District 40 Total ‐‐‐ ‐‐‐ ‐‐‐ ‐‐‐ District 40 Total 6,000 4,500 1.55 6,990 Butte ‐‐‐ ‐‐‐ ‐‐‐ ‐‐‐ Butte ‐‐‐ ‐‐‐ ‐‐‐ ‐‐‐ Colusa ‐‐‐ ‐‐‐ ‐‐‐ ‐‐‐ Colusa 18,100 16,800 2.22 37,290 Glenn ‐‐‐ ‐‐‐ ‐‐‐ ‐‐‐ Glenn ‐‐‐ ‐‐‐ ‐‐‐ ‐‐‐ Sacramento ‐‐‐ ‐‐‐ ‐‐‐ ‐‐‐ Sacramento ‐‐‐ ‐‐‐ ‐‐‐ ‐‐‐ Solano ‐‐‐ ‐‐‐ ‐‐‐ ‐‐‐ Solano 19,500 18,000 1.96 35,190 Sutter ‐‐‐ ‐‐‐ ‐‐‐ ‐‐‐ Sutter 13,200 10,300 2.37 24,390 Tehama ‐‐‐ ‐‐‐ ‐‐‐ ‐‐‐ Tehama ‐‐‐ ‐‐‐ ‐‐‐ ‐‐‐ Yolo ‐‐‐ ‐‐‐ ‐‐‐ ‐‐‐ Yolo 30,400 25,800 2.56 65,940 Yuba ‐‐‐ ‐‐‐ ‐‐‐ ‐‐‐ Yuba ‐‐‐ ‐‐‐ ‐‐‐ ‐‐‐ Other Counties 1/ ‐‐‐ ‐‐‐ ‐‐‐ ‐‐‐ Other Counties 1/ 22,800 18,500 2.40 44,430 District 50 Total ‐‐‐ ‐‐‐ ‐‐‐ ‐‐‐ District 50 Total 104,000 89,400 2.32 207,240 Fresno ‐‐‐ ‐‐‐ ‐‐‐ ‐‐‐ Fresno ‐‐‐ ‐‐‐ ‐‐‐ ‐‐‐ Kern ‐‐‐ ‐‐‐ ‐‐‐ ‐‐‐ Kern ‐‐‐ ‐‐‐ ‐‐‐ ‐‐‐ Kings ‐‐‐ ‐‐‐ ‐‐‐ ‐‐‐ Kings 77,800 49,500 2.37 117,540 Madera ‐‐‐ ‐‐‐ ‐‐‐ ‐‐‐ Madera 31,000 17,700 2.46 43,500 Merced ‐‐‐ ‐‐‐ ‐‐‐ ‐‐‐ Merced 40,900 18,800 2.58 48,540 San Joaquin ‐‐‐ ‐‐‐ ‐‐‐ ‐‐‐ San Joaquin ‐‐‐ ‐‐‐ ‐‐‐ ‐‐‐ Stanislaus ‐‐‐ ‐‐‐ ‐‐‐ ‐‐‐ Stanislaus 9,000 3,500 2.37 8,280 Tulare ‐‐‐ ‐‐‐ ‐‐‐ ‐‐‐ Tulare ‐‐‐ ‐‐‐ ‐‐‐ ‐‐‐ Other Counties 1/ ‐‐‐ ‐‐‐ ‐‐‐ ‐‐‐ Other Counties 1/ 281,200 112,700 2.51 283,140 District 51 Total ‐‐‐ ‐‐‐ ‐‐‐ ‐‐‐ District 51 Total 439,900 202,200 2.48 501,000 Alpine ‐‐‐ ‐‐‐ ‐‐‐ ‐‐‐ Alpine ‐‐‐ ‐‐‐ ‐‐‐ ‐‐‐ Amador ‐‐‐ ‐‐‐ ‐‐‐ ‐‐‐ Amador ‐‐‐ ‐‐‐ ‐‐‐ ‐‐‐ Calaveras ‐‐‐ ‐‐‐ ‐‐‐ ‐‐‐ Calaveras ‐‐‐ ‐‐‐ ‐‐‐ ‐‐‐ El Dorado ‐‐‐ ‐‐‐ ‐‐‐ ‐‐‐ El Dorado ‐‐‐ ‐‐‐ ‐‐‐ ‐‐‐ Inyo ‐‐‐ ‐‐‐ ‐‐‐ ‐‐‐ Inyo ‐‐‐ ‐‐‐ ‐‐‐ ‐‐‐ Mariposa ‐‐‐ ‐‐‐ ‐‐‐ ‐‐‐ Mariposa ‐‐‐ ‐‐‐ ‐‐‐ ‐‐‐ Mono ‐‐‐ ‐‐‐ ‐‐‐ ‐‐‐ Mono ‐‐‐ ‐‐‐ ‐‐‐ ‐‐‐ Nevada ‐‐‐ ‐‐‐ ‐‐‐ ‐‐‐ Nevada ‐‐‐ ‐‐‐ ‐‐‐ ‐‐‐ Placer ‐‐‐ ‐‐‐ ‐‐‐ ‐‐‐ Placer ‐‐‐ ‐‐‐ ‐‐‐ ‐‐‐ Sierra ‐‐‐ ‐‐‐ ‐‐‐ ‐‐‐ Sierra ‐‐‐ ‐‐‐ ‐‐‐ ‐‐‐ Tuolumne ‐‐‐ ‐‐‐ ‐‐‐ ‐‐‐ Tuolumne ‐‐‐ ‐‐‐ ‐‐‐ ‐‐‐ Other Counties 1/ ‐‐‐ ‐‐‐ ‐‐‐ ‐‐‐ Other Counties 1/ ‐‐‐ ‐‐‐ ‐‐‐ ‐‐‐ District 60 Total ‐‐‐ ‐‐‐ ‐‐‐ ‐‐‐ District 60 Total ‐‐‐ ‐‐‐ ‐‐‐ ‐‐‐ Imperial ‐‐‐ ‐‐‐ ‐‐‐ ‐‐‐ Imperial ‐‐‐ ‐‐‐ ‐‐‐ ‐‐‐ Los Angeles ‐‐‐ ‐‐‐ ‐‐‐ ‐‐‐ Los Angeles ‐‐‐ ‐‐‐ ‐‐‐ ‐‐‐ Orange ‐‐‐ ‐‐‐ ‐‐‐ ‐‐‐ Orange ‐‐‐ ‐‐‐ ‐‐‐ ‐‐‐ Riverside ‐‐‐ ‐‐‐ ‐‐‐ ‐‐‐ Riverside ‐‐‐ ‐‐‐ ‐‐‐ ‐‐‐ San Bernardino ‐‐‐ ‐‐‐ ‐‐‐ ‐‐‐ San Bernardino ‐‐‐ ‐‐‐ ‐‐‐ ‐‐‐ San Diego ‐‐‐ ‐‐‐ ‐‐‐ ‐‐‐ San Diego ‐‐‐ ‐‐‐ ‐‐‐ ‐‐‐ Santa Barbara ‐‐‐ ‐‐‐ ‐‐‐ ‐‐‐ Santa Barbara ‐‐‐ ‐‐‐ ‐‐‐ ‐‐‐ Ventura ‐‐‐ ‐‐‐ ‐‐‐ ‐‐‐ Ventura ‐‐‐ ‐‐‐ ‐‐‐ ‐‐‐ Other Counties 1/ 104,000 102,500 3.22 330,000 Other Counties 1/ 21,200 5,900 1.58 9,300 District 80 Total 104,000 102,500 3.22 330,000 District 80 Total 21,200 5,900 1.58 9,300 Other Districts 3/ 76,000 67,500 2.67 180,000 Other Districts 3/ 11,000 7,300 2.38 17,400 STATE 180,000 170,000 3.00 510,000 STATE 590,000 315,000 2.40 756,0001/ Counties or district data combined to avoid disclosing data for individual farms. All Wheat total production for 2009 is the sum of Durum Wheat and Winter Wheat which add to 1,266,000 tons.
1/ Counties or district data combined to avoid disclosing data for individual farms. All Wheat total production for 2009 is the sum of Durum Wheat and Winter Wheat which add to 1,266,000 tons.

USDA, NASS, California Field Office 35 California Agricultural Statistics, 2009
Floriculture
alifornia’s 2009 floriculture crop leads the nation at a value of $922 million wholesale, for operations with $100,000 or more in sales, but is down 12 percent from
the revised 2008 total. California accounts for 25 percent of the total wholesale value of reported crop for the United States. Florida, the next largest producer, was down 9 percent from the prior year, with $674 million in wholesale value for 2009. The number of producers in California declined from a revised 492 in 2008 to 436 in 2009. In Florida, the number of producers decreased from a revised 528 in 2008 to 475 in 2009. California and Florida together accounted for 43 percent of the 15-state total value of floriculture crops. California‐grown annual bedding and garden plants accounts for almost 16 percent of the total value recorded for this grouping to lead the highest valued crop category in the 15‐state program. Wholesale value of California grown bedding and garden plants, produced by all operations with $100,000 or more in sales, decreased approximately 3 percent from a revised $217 million in 2008 to approximately $210 million in 2009. Wholesale value of Michigan crops, the second largest, decreased almost 4 percent to $180 million. The total wholesale of annual bedding and garden plant crops in the 15-State program slightly increased to $1.32 billion. The number of annual bedding and garden plant producers in the 15-State program increased more than 1 percent, from 1,779 in 2008 to 1,806, in 2009. California is the dominant State in cut flower production, accounting for 75 percent of the total cut flower wholesale value among operations surveyed with $100,000 or more in
total sales. The $269 million in value for 2009 was down 17 percent from the revised 2008 valuation of $324 million. Total cut flower wholesale value increased nearly 13 percent for the second largest, Washington state, from a revised $23.1 million in 2008 to $26.1 million in 2009. The total wholesale value of cut flower crops in the 15-State program decreased nearly 14 percent, from a revised $417 million in 2008 to $359 million, in 2009. The number of cut flower producers in the 15-State program declined slightly, from 364 in 2008 to 362 in 2009. California also leads the country in potted flowering plant value for 2009 with a total value of $206 million wholesale produced by operations with $100,000 or more in total sales, down over 15 percent from the revised 2008 valuation. California accounted for approximately 33 percent of the 15‐state total wholesale value reported. Florida, the second largest producer, accounted for 21 percent of the 15-state total with $131 million wholesale. Potted orchid production continued to lead this category in California with crops valued at $74.9 million up 16 percent from the revised 2008 wholesale value. Production of potted orchids, potted poinsettias and florist roses together accounted for over 58 percent of the wholesale value of California-grown potted flower plants. The total wholesale value of potted flowering plant crops in the 15-State program decreased over 5 percent from the revised 2008 valuation to $632 million. The number of potted flowering plant producers in the 15-State program increased slightly from a revised 1,251 in 2008 to 1,259 in 2009.
C
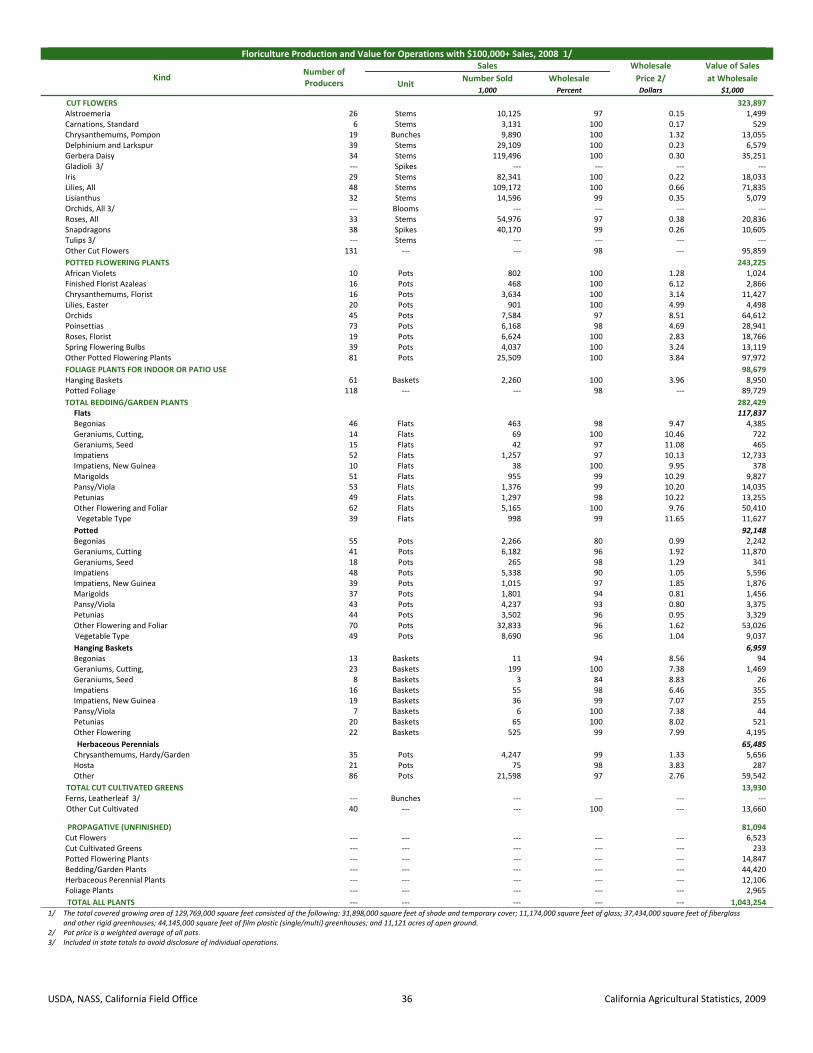
USDA, NASS, California Field Office 36 California Agricultural Statistics, 2009
Floriculture Production and Value for Operations with $100,000+ Sales, 2008 1/
Kind Number of Producers
Sales Wholesale Value of Sales
Unit Number Sold Wholesale Price 2/ at Wholesale
1,000 Percent Dollars $1,000
CUT FLOWERS 323,897 Alstroemeria 26 Stems 10,125 97 0.15 1,499 Carnations, Standard 6 Stems 3,131 100 0.17 529 Chrysanthemums, Pompon 19 Bunches 9,890 100 1.32 13,055 Delphinium and Larkspur 39 Stems 29,109 100 0.23 6,579 Gerbera Daisy 34 Stems 119,496 100 0.30 35,251 Gladioli 3/ ‐‐‐ Spikes ‐‐‐ ‐‐‐ ‐‐‐ ‐‐‐ Iris 29 Stems 82,341 100 0.22 18,033 Lilies, All 48 Stems 109,172 100 0.66 71,835 Lisianthus 32 Stems 14,596 99 0.35 5,079 Orchids, All 3/ ‐‐‐ Blooms ‐‐‐ ‐‐‐ ‐‐‐ ‐‐‐ Roses, All 33 Stems 54,976 97 0.38 20,836 Snapdragons 38 Spikes 40,170 99 0.26 10,605 Tulips 3/ ‐‐‐ Stems ‐‐‐ ‐‐‐ ‐‐‐ ‐‐‐ Other Cut Flowers 131 ‐‐‐ ‐‐‐ 98 ‐‐‐ 95,859
POTTED FLOWERING PLANTS 243,225 African Violets 10 Pots 802 100 1.28 1,024 Finished Florist Azaleas 16 Pots 468 100 6.12 2,866 Chrysanthemums, Florist 16 Pots 3,634 100 3.14 11,427 Lilies, Easter 20 Pots 901 100 4.99 4,498 Orchids 45 Pots 7,584 97 8.51 64,612 Poinsettias 73 Pots 6,168 98 4.69 28,941 Roses, Florist 19 Pots 6,624 100 2.83 18,766 Spring Flowering Bulbs 39 Pots 4,037 100 3.24 13,119 Other Potted Flowering Plants 81 Pots 25,509 100 3.84 97,972
FOLIAGE PLANTS FOR INDOOR OR PATIO USE 98,679 Hanging Baskets 61 Baskets 2,260 100 3.96 8,950 Potted Foliage 118 ‐‐‐ ‐‐‐ 98 ‐‐‐ 89,729
TOTAL BEDDING/GARDEN PLANTS 282,429 Flats 117,837 Begonias 46 Flats 463 98 9.47 4,385 Geraniums, Cutting, 14 Flats 69 100 10.46 722 Geraniums, Seed 15 Flats 42 97 11.08 465 Impatiens 52 Flats 1,257 97 10.13 12,733 Impatiens, New Guinea 10 Flats 38 100 9.95 378 Marigolds 51 Flats 955 99 10.29 9,827 Pansy/Viola 53 Flats 1,376 99 10.20 14,035 Petunias 49 Flats 1,297 98 10.22 13,255 Other Flowering and Foliar 62 Flats 5,165 100 9.76 50,410
Vegetable Type 39 Flats 998 99 11.65 11,627
Potted 92,148 Begonias 55 Pots 2,266 80 0.99 2,242 Geraniums, Cutting 41 Pots 6,182 96 1.92 11,870 Geraniums, Seed 18 Pots 265 98 1.29 341 Impatiens 48 Pots 5,338 90 1.05 5,596 Impatiens, New Guinea 39 Pots 1,015 97 1.85 1,876 Marigolds 37 Pots 1,801 94 0.81 1,456 Pansy/Viola 43 Pots 4,237 93 0.80 3,375 Petunias 44 Pots 3,502 96 0.95 3,329 Other Flowering and Foliar 70 Pots 32,833 96 1.62 53,026
Vegetable Type 49 Pots 8,690 96 1.04 9,037
Hanging Baskets 6,959 Begonias 13 Baskets 11 94 8.56 94 Geraniums, Cutting, 23 Baskets 199 100 7.38 1,469 Geraniums, Seed 8 Baskets 3 84 8.83 26 Impatiens 16 Baskets 55 98 6.46 355 Impatiens, New Guinea 19 Baskets 36 99 7.07 255 Pansy/Viola 7 Baskets 6 100 7.38 44 Petunias 20 Baskets 65 100 8.02 521 Other Flowering 22 Baskets 525 99 7.99 4,195
Herbaceous Perennials 65,485 Chrysanthemums, Hardy/Garden 35 Pots 4,247 99 1.33 5,656 Hosta 21 Pots 75 98 3.83 287 Other 86 Pots 21,598 97 2.76 59,542
TOTAL CUT CULTIVATED GREENS 13,930 Ferns, Leatherleaf 3/ ‐‐‐ Bunches ‐‐‐ ‐‐‐ ‐‐‐ ‐‐‐
Other Cut Cultivated 40 ‐‐‐ ‐‐‐ 100 ‐‐‐ 13,660
PROPAGATIVE (UNFINISHED) 81,094 Cut Flowers ‐‐‐ ‐‐‐ ‐‐‐ ‐‐‐ ‐‐‐ 6,523 Cut Cultivated Greens ‐‐‐ ‐‐‐ ‐‐‐ ‐‐‐ ‐‐‐ 233 Potted Flowering Plants ‐‐‐ ‐‐‐ ‐‐‐ ‐‐‐ ‐‐‐ 14,847 Bedding/Garden Plants ‐‐‐ ‐‐‐ ‐‐‐ ‐‐‐ ‐‐‐ 44,420 Herbaceous Perennial Plants ‐‐‐ ‐‐‐ ‐‐‐ ‐‐‐ ‐‐‐ 12,106 Foliage Plants ‐‐‐ ‐‐‐ ‐‐‐ ‐‐‐ ‐‐‐ 2,965
TOTAL ALL PLANTS ‐‐‐ ‐‐‐ ‐‐‐ ‐‐‐ ‐‐‐ 1,043,254 1/ The total covered growing area of 129,769,000 square feet consisted of the following: 31,898,000 square feet of shade and temporary cover; 11,174,000 square feet of glass; 37,434,000 square feet of fiberglass
and other rigid greenhouses; 44,145,000 square feet of film plastic (single/multi) greenhouses; and 11,121 acres of open ground. 2/ Pot price is a weighted average of all pots. 3/ Included in state totals to avoid disclosure of individual operations.
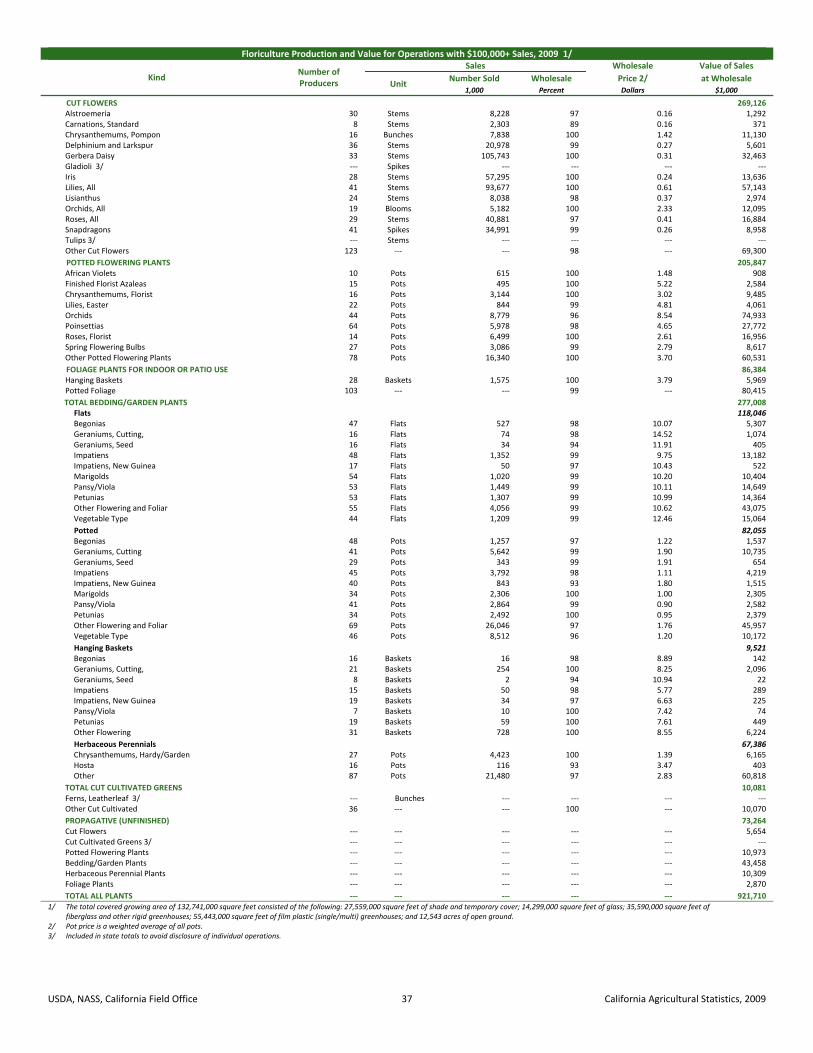
USDA, NASS, California Field Office 37 California Agricultural Statistics, 2009
Floriculture Production and Value for Operations with $100,000+ Sales, 2009 1/
Kind Number of Producers
Sales Wholesale Value of Sales
Unit Number Sold Wholesale Price 2/ at Wholesale
1,000 Percent Dollars $1,000
CUT FLOWERS 269,126 Alstroemeria 30 Stems 8,228 97 0.16 1,292 Carnations, Standard 8 Stems 2,303 89 0.16 371 Chrysanthemums, Pompon 16 Bunches 7,838 100 1.42 11,130 Delphinium and Larkspur 36 Stems 20,978 99 0.27 5,601 Gerbera Daisy 33 Stems 105,743 100 0.31 32,463 Gladioli 3/ ‐‐‐ Spikes ‐‐‐ ‐‐‐ ‐‐‐ ‐‐‐ Iris 28 Stems 57,295 100 0.24 13,636 Lilies, All 41 Stems 93,677 100 0.61 57,143 Lisianthus 24 Stems 8,038 98 0.37 2,974 Orchids, All 19 Blooms 5,182 100 2.33 12,095 Roses, All 29 Stems 40,881 97 0.41 16,884 Snapdragons 41 Spikes 34,991 99 0.26 8,958 Tulips 3/ ‐‐‐ Stems ‐‐‐ ‐‐‐ ‐‐‐ ‐‐‐ Other Cut Flowers 123 ‐‐‐ ‐‐‐ 98 ‐‐‐ 69,300
POTTED FLOWERING PLANTS 205,847 African Violets 10 Pots 615 100 1.48 908 Finished Florist Azaleas 15 Pots 495 100 5.22 2,584 Chrysanthemums, Florist 16 Pots 3,144 100 3.02 9,485 Lilies, Easter 22 Pots 844 99 4.81 4,061 Orchids 44 Pots 8,779 96 8.54 74,933 Poinsettias 64 Pots 5,978 98 4.65 27,772 Roses, Florist 14 Pots 6,499 100 2.61 16,956 Spring Flowering Bulbs 27 Pots 3,086 99 2.79 8,617 Other Potted Flowering Plants 78 Pots 16,340 100 3.70 60,531
FOLIAGE PLANTS FOR INDOOR OR PATIO USE 86,384 Hanging Baskets 28 Baskets 1,575 100 3.79 5,969 Potted Foliage 103 ‐‐‐ ‐‐‐ 99 ‐‐‐ 80,415
TOTAL BEDDING/GARDEN PLANTS 277,008 Flats 118,046 Begonias 47 Flats 527 98 10.07 5,307 Geraniums, Cutting, 16 Flats 74 98 14.52 1,074 Geraniums, Seed 16 Flats 34 94 11.91 405 Impatiens 48 Flats 1,352 99 9.75 13,182 Impatiens, New Guinea 17 Flats 50 97 10.43 522 Marigolds 54 Flats 1,020 99 10.20 10,404 Pansy/Viola 53 Flats 1,449 99 10.11 14,649 Petunias 53 Flats 1,307 99 10.99 14,364 Other Flowering and Foliar 55 Flats 4,056 99 10.62 43,075 Vegetable Type 44 Flats 1,209 99 12.46 15,064
Potted 82,055 Begonias 48 Pots 1,257 97 1.22 1,537 Geraniums, Cutting 41 Pots 5,642 99 1.90 10,735 Geraniums, Seed 29 Pots 343 99 1.91 654 Impatiens 45 Pots 3,792 98 1.11 4,219 Impatiens, New Guinea 40 Pots 843 93 1.80 1,515 Marigolds 34 Pots 2,306 100 1.00 2,305 Pansy/Viola 41 Pots 2,864 99 0.90 2,582 Petunias 34 Pots 2,492 100 0.95 2,379 Other Flowering and Foliar 69 Pots 26,046 97 1.76 45,957 Vegetable Type 46 Pots 8,512 96 1.20 10,172
Hanging Baskets 9,521 Begonias 16 Baskets 16 98 8.89 142 Geraniums, Cutting, 21 Baskets 254 100 8.25 2,096 Geraniums, Seed 8 Baskets 2 94 10.94 22 Impatiens 15 Baskets 50 98 5.77 289 Impatiens, New Guinea 19 Baskets 34 97 6.63 225 Pansy/Viola 7 Baskets 10 100 7.42 74 Petunias 19 Baskets 59 100 7.61 449 Other Flowering 31 Baskets 728 100 8.55 6,224
Herbaceous Perennials 67,386 Chrysanthemums, Hardy/Garden 27 Pots 4,423 100 1.39 6,165 Hosta 16 Pots 116 93 3.47 403 Other 87 Pots 21,480 97 2.83 60,818
TOTAL CUT CULTIVATED GREENS 10,081 Ferns, Leatherleaf 3/ ‐‐‐ Bunches ‐‐‐ ‐‐‐ ‐‐‐ ‐‐‐ Other Cut Cultivated 36 ‐‐‐ ‐‐‐ 100 ‐‐‐ 10,070
PROPAGATIVE (UNFINISHED) 73,264 Cut Flowers ‐‐‐ ‐‐‐ ‐‐‐ ‐‐‐ ‐‐‐ 5,654 Cut Cultivated Greens 3/ ‐‐‐ ‐‐‐ ‐‐‐ ‐‐‐ ‐‐‐ ‐‐‐ Potted Flowering Plants ‐‐‐ ‐‐‐ ‐‐‐ ‐‐‐ ‐‐‐ 10,973 Bedding/Garden Plants ‐‐‐ ‐‐‐ ‐‐‐ ‐‐‐ ‐‐‐ 43,458 Herbaceous Perennial Plants ‐‐‐ ‐‐‐ ‐‐‐ ‐‐‐ ‐‐‐ 10,309 Foliage Plants ‐‐‐ ‐‐‐ ‐‐‐ ‐‐‐ ‐‐‐ 2,870
TOTAL ALL PLANTS ‐‐‐ ‐‐‐ ‐‐‐ ‐‐‐ ‐‐‐ 921,710 1/ The total covered growing area of 132,741,000 square feet consisted of the following: 27,559,000 square feet of shade and temporary cover; 14,299,000 square feet of glass; 35,590,000 square feet of
fiberglass and other rigid greenhouses; 55,443,000 square feet of film plastic (single/multi) greenhouses; and 12,543 acres of open ground. 2/ Pot price is a weighted average of all pots. 3/ Included in state totals to avoid disclosure of individual operations.

USDA, NASS, California Field Office 38 California Agricultural Statistics, 2009
Fruit and Nut Crops
alifornia accounts for 46 percent of the U.S. fruit and nut production and 62 percent of the national value of fruit and nut crops. In 2009, the state produced 14.2
million tons of fruit and nuts, 5 percent less than 2008. Grape production totaled 6.54 million tons for 2009, a slight decrease from the 2008 grape crop. The state’s total production value of all fruits and nuts in 2009 was $11.8 billion, up 6 percent from 2008. Grapes continue to be the top-valued fruit and nut crop at $3.27 billion, up 12 percent from the previous year. The California grape crop accounts for 90 percent of the 2009 United States utilized grape production. Crops with record production in 2009 were blueberries, raspberries, strawberries, pistachios, and walnuts. California accounted for nearly all the national production of almonds, dates, figs, kiwifruit, olives, Clingstone peaches, pistachios, dried plums, raisins, and walnuts. Notable Increases in California Production:
Blueberries .................................................................. 73% Lemons ....................................................................... 42% Plums, Dried ............................................................... 29% Pistachios .................................................................... 28% Grapes, Wine .............................................................. 23% Notable Decreases in California Production:
Avocados .................................................................... 47% Olives. ......................................................................... 31% Plums .......................................................................... 30% Nectarines ................................................................... 29% Oranges, Valencia ....................................................... 29%
According to the USDA’s Economic Research Service, in 2009 California was the number one exporter of agricultural commodities in the United States. Tree nuts were the number one agricultural export for California, followed by fruit. The United States is among the top producers and consumers of fruit and tree nuts in the world. Each year, fruit and tree nut production generates about 13 percent of the United States farm cash receipts for all agricultural crops. Over one-tenth of United States fruit and tree nut production is destined for the export market, while imports make up over one-third of domestic fruit and tree nut consumption. The typical American consumes around 280 pounds of fruit and tree nuts (fresh and processed products) each year. Oranges, apples, grapes, and bananas are the most popular fruit while almonds, pecans, and walnuts are the most preferred tree nuts. The nation’s largest fruit producing states are California, Florida and Washington. California accounts for over half of the harvested fruit acreage, Florida over ten percent, and Washington around six percent. U.S. tree nut production since the mid-2000s generated, on average, nearly $4 billion in annual farm cash receipts, with almonds, walnuts, pistachios and pecans accounting for most of the sales. California is the nation’s number one producer of tree nuts. Almost 90 percent of the U.S. tree nut production is harvested from Golden State orchards annually.
C
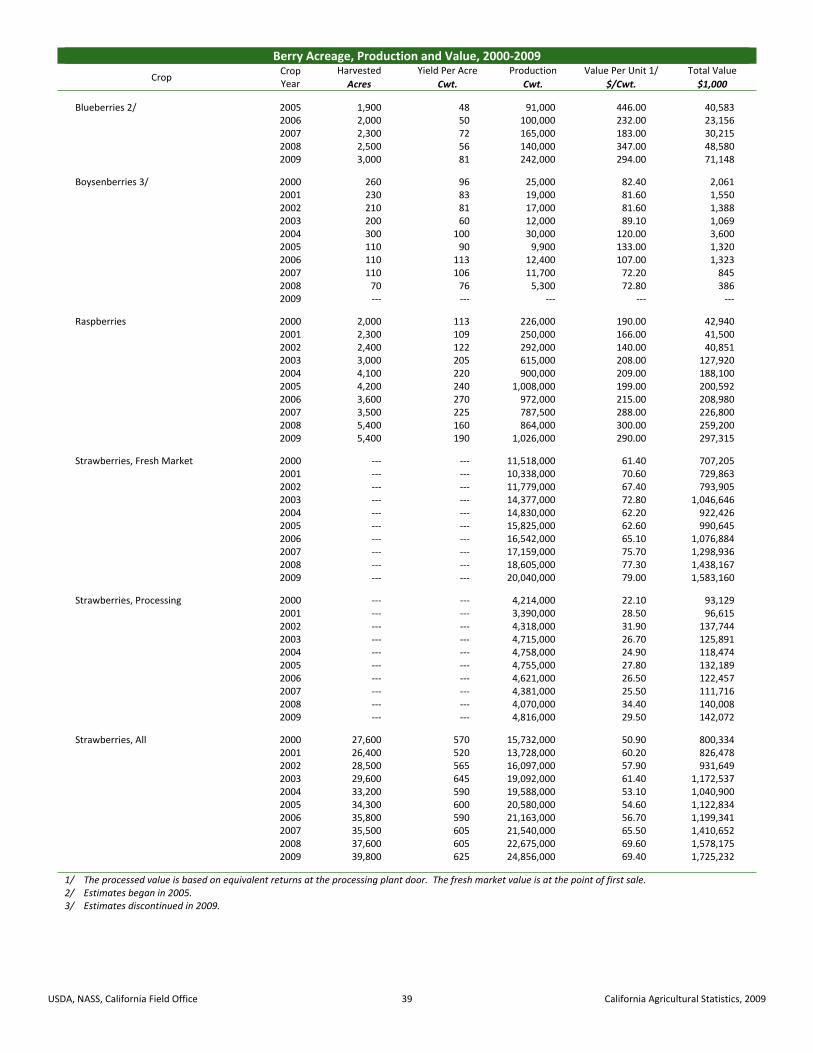
USDA, NASS, California Field Office 39 California Agricultural Statistics, 2009
Berry Acreage, Production and Value, 2000‐2009
Crop Crop Year
Harvested Yield Per Acre Production Value Per Unit 1/ Total Value
Acres Cwt. Cwt. $/Cwt. $1,000
Blueberries 2/ 2005 1,900 48 91,000 446.00 40,5832006 2,000 50 100,000 232.00 23,1562007 2,300 72 165,000 183.00 30,2152008 2,500 56 140,000 347.00 48,5802009 3,000 81 242,000 294.00 71,148
Boysenberries 3/ 2000 260 96 25,000 82.40 2,0612001 230 83 19,000 81.60 1,5502002 210 81 17,000 81.60 1,3882003 200 60 12,000 89.10 1,0692004 300 100 30,000 120.00 3,6002005 110 90 9,900 133.00 1,3202006 110 113 12,400 107.00 1,3232007 110 106 11,700 72.20 8452008 70 76 5,300 72.80 3862009 ‐‐‐ ‐‐‐ ‐‐‐ ‐‐‐ ‐‐‐
Raspberries 2000 2,000 113 226,000 190.00 42,9402001 2,300 109 250,000 166.00 41,5002002 2,400 122 292,000 140.00 40,8512003 3,000 205 615,000 208.00 127,9202004 4,100 220 900,000 209.00 188,1002005 4,200 240 1,008,000 199.00 200,5922006 3,600 270 972,000 215.00 208,9802007 3,500 225 787,500 288.00 226,8002008 5,400 160 864,000 300.00 259,2002009 5,400 190 1,026,000 290.00 297,315
Strawberries, Fresh Market 2000 ‐‐‐ ‐‐‐ 11,518,000 61.40 707,2052001 ‐‐‐ ‐‐‐ 10,338,000 70.60 729,8632002 ‐‐‐ ‐‐‐ 11,779,000 67.40 793,9052003 ‐‐‐ ‐‐‐ 14,377,000 72.80 1,046,6462004 ‐‐‐ ‐‐‐ 14,830,000 62.20 922,4262005 ‐‐‐ ‐‐‐ 15,825,000 62.60 990,6452006 ‐‐‐ ‐‐‐ 16,542,000 65.10 1,076,8842007 ‐‐‐ ‐‐‐ 17,159,000 75.70 1,298,9362008 ‐‐‐ ‐‐‐ 18,605,000 77.30 1,438,1672009 ‐‐‐ ‐‐‐ 20,040,000 79.00 1,583,160
Strawberries, Processing 2000 ‐‐‐ ‐‐‐ 4,214,000 22.10 93,1292001 ‐‐‐ ‐‐‐ 3,390,000 28.50 96,6152002 ‐‐‐ ‐‐‐ 4,318,000 31.90 137,7442003 ‐‐‐ ‐‐‐ 4,715,000 26.70 125,8912004 ‐‐‐ ‐‐‐ 4,758,000 24.90 118,4742005 ‐‐‐ ‐‐‐ 4,755,000 27.80 132,1892006 ‐‐‐ ‐‐‐ 4,621,000 26.50 122,4572007 ‐‐‐ ‐‐‐ 4,381,000 25.50 111,7162008 ‐‐‐ ‐‐‐ 4,070,000 34.40 140,0082009 ‐‐‐ ‐‐‐ 4,816,000 29.50 142,072
Strawberries, All 2000 27,600 570 15,732,000 50.90 800,3342001 26,400 520 13,728,000 60.20 826,4782002 28,500 565 16,097,000 57.90 931,6492003 29,600 645 19,092,000 61.40 1,172,5372004 33,200 590 19,588,000 53.10 1,040,9002005 34,300 600 20,580,000 54.60 1,122,8342006 35,800 590 21,163,000 56.70 1,199,3412007 35,500 605 21,540,000 65.50 1,410,6522008 37,600 605 22,675,000 69.60 1,578,1752009 39,800 625 24,856,000 69.40 1,725,232
1/ The processed value is based on equivalent returns at the processing plant door. The fresh market value is at the point of first sale. 2/ Estimates began in 2005. 3/ Estimates discontinued in 2009.

USDA, NASS, California Field Office 40 California Agricultural Statistics, 2009
Strawberry Monthly and Season Average Prices Received, 2000‐2009 1/
Crop Year
Jan. Feb. Mar. Apr. May June July Aug. Sept. Oct. Nov. Dec. Season Average
$/Cwt
2000 95.80 107.00 75.70 68.90 46.10 58.20 56.80 49.60 62.20 95.40 ‐‐‐ ‐‐‐ 61.40
2001 153.00 125.00 96.10 75.70 51.60 61.50 68.70 87.40 78.10 80.70 96.40 ‐‐‐ 70.60
2002 185.00 133.00 96.70 60.00 63.40 57.30 53.10 82.60 58.40 68.40 108.00 ‐‐‐ 67.40
2003 105.00 92.70 71.30 69.50 64.20 58.20 66.60 68.10 86.80 100.00 165.00 ‐‐‐ 72.80
2004 127.00 120.00 58.00 44.00 54.70 56.20 50.40 65.20 84.00 84.80 164.00 154.00 62.20
2005 114.00 110.00 62.00 54.00 59.00 55.00 56.00 66.00 70.00 57.00 77.00 154.00 62.60
2006 96.10 90.10 63.80 59.80 61.80 51.40 64.00 63.70 77.60 72.90 96.10 ‐‐‐ 65.10
2007 133.00 115.00 88.40 64.20 68.60 66.10 53.00 93.30 57.40 80.00 137.00 162.00 75.70
2008 185.00 107.00 95.20 65.50 83.30 61.90 65.90 91.00 70.10 72.00 87.60 215.00 77.30
2009 104.00 122.00 89.30 78.90 76.10 62.80 74.80 73.50 75.00 108.00 87.60 142.00 79.00
1/ Prices are average received at point of first sale.

USDA, NASS, California Field Office 41 California Agricultural Statistics, 2009
Citrus Acreage, Production and Value, 2000‐2009 1/
Crop Crop Year Bearing Non‐Bearing 2/ Yield Per Acre Production Value Per Unit 3/ Total Value
Acres Acres Cartons Cartons $/Carton $1,000
Grapefruit, All 99‐00 16,600 ‐‐‐ 868 14,400,000 4.09 58,798(Net weight 00‐01 15,400 ‐‐‐ 818 12,600,000 4.39 55,242per carton: 33.5 pounds) 01‐02 14,000 161 842 11,800,000 4.03 47,485
02‐03 13,000 ‐‐‐ 862 11,200,000 5.77 64,59603‐04 12,000 391 967 11,600,000 5.08 58,92004‐05 11,000 816 1,109 12,200,000 8.09 98,73205‐06 10,000 ‐‐‐ 1,200 12,000,000 6.63 79,50906‐07 9,600 ‐‐‐ 1,146 11,000,000 6.12 67,27807‐08 9,600 1,316 1,083 10,400,000 4.59 47,73608‐09 9,600 ‐‐‐ 1,000 9,600,000 ‐‐‐ ‐‐‐
Lemons 99‐00 49,500 ‐‐‐ 768 38,000,000 6.68 253,876(Net weight 00‐01 50,500 ‐‐‐ 896 45,200,000 4.71 212,725 per carton: 38 pounds) 01‐02 51,000 2,430 718 36,600,000 7.84 287,026
02‐03 50,000 ‐‐‐ 960 48,000,000 5.46 262,04003‐04 48,000 3,358 750 36,000,000 6.81 245,28204‐05 48,000 3,287 854 41,000,000 6.78 277,99105‐06 48,000 ‐‐‐ 917 44,000,000 8.52 374,73706‐07 48,000 ‐‐‐ 771 37,000,000 10.66 394,28007‐08 47,000 2,759 630 29,600,000 16.00 473,54608‐09 47,000 ‐‐‐ 894 42,000,000 7.27 305,424
Oranges, Navel and Misc. 99‐00 128,000 ‐‐‐ 626 80,000,000 3.28 262,160(Net weight 00‐01 130,000 ‐‐‐ 546 71,000,000 4.99 354,320 per carton: 37.5 pounds) 01‐02 130,000 7,499 492 64,000,000 6.44 412,305
02‐03 134,000 ‐‐‐ 627 84,000,000 3.99 335,04003‐04 136,000 9,243 581 79,000,000 5.30 418,77304‐05 138,000 11,888 638 88,000,000 4.91 431,90405‐06 140,000 ‐‐‐ 671 94,000,000 4.81 452,37506‐07 141,000 ‐‐‐ 489 69,000,000 5.67 391,56507‐08 141,000 7,185 638 90,000,000 5.23 470,59108‐09 141,000 ‐‐‐ 490 69,000,000 6.70 462,233
Oranges, Valencia 99‐00 71,000 ‐‐‐ 676 48,000,000 1.74 83,494(Net weight 00‐01 68,000 ‐‐‐ 558 38,000,000 4.22 160,140 per carton: 37.5 pounds) 01‐02 65,000 1,080 600 39,000,000 3.76 146,538
02‐03 64,000 ‐‐‐ 625 40,000,000 3.27 130,67203‐04 57,000 443 386 22,000,000 6.24 137,24204‐05 53,000 402 774 41,000,000 4.19 171,69005‐06 50,000 ‐‐‐ 560 28,000,000 6.46 180,97006‐07 49,000 ‐‐‐ 469 23,000,000 5.52 126,93107‐08 47,000 492 723 34,000,000 4.06 138,09108‐09 45,000 ‐‐‐ 534 24,000,000 5.57 133,676
Oranges, All 99‐00 199,000 ‐‐‐ 644 128,000,000 2.70 345,654(Net weight 00‐01 198,000 ‐‐‐ 550 10,900,000 4.72 514,460 per carton: 37.5 pounds) 01‐02 195,000 8,579 528 103,000,000 5.43 558,843
02‐03 198,000 ‐‐‐ 626 124,000,000 3.76 465,71203‐04 193,000 9,686 523 101,000,000 5.51 556,01504‐05 191,000 12,290 675 129,000,000 4.68 603,59405‐06 190,000 ‐‐‐ 642 122,000,000 5.19 633,34506‐07 190,000 ‐‐‐ 484 92,000,000 5.64 518,49607‐08 188,000 7,677 660 124,000,000 4.91 608,68208‐09 186,000 ‐‐‐ 500 93,000,000 6.41 595,909
Tangerines 99‐00 8,800 ‐‐‐ 568 5,000,000 5.55 27,759Including Mandarins and 00‐01 9,000 ‐‐‐ 488 4,400,000 7.08 31,137Hybrids, Tangelos and 01‐02 9,500 2,794 464 4,400,000 8.83 38,821Tangors 02‐03 11,000 ‐‐‐ 509 5,600,000 7.90 44,202(Net weight 03‐04 12,000 7,691 367 4,400,000 7.55 33,222 per carton: 37.5 pounds) 04‐05 13,000 11,834 446 5,800,000 9.21 53,432
05‐06 15,000 ‐‐‐ 480 7,200,000 8.21 59,13406‐07 19,000 ‐‐‐ 368 7,000,000 11.02 77,15207‐08 23,000 5,707 583 13,400,000 12.58 168,62308‐09 27,000 ‐‐‐ 496 13,400,000 ‐‐‐ ‐‐‐
1/ Missing data not published to avoid disclosure of individual operations. 2/ Non‐bearing shown only in year when acreage surveys were conducted. 3/ Equivalent packinghouse door returns.

USDA, NASS, California Field Office 42 California Agricultural Statistics, 2009
Citrus Sales by Utilization and Value Per Carton, 2000‐2009 1/
Crop Crop Year
All Sales Fresh Market Processing
Quantity Value 2/ Quantity Value 2/ Quantity Value 2/
1,000 Cartons $/Carton 1,000 Cartons $/Carton 1,000 Cartons $/Carton
Grapefruit, All 3/ 99‐00 14,400 4.09 12,400 4.80 2,000 ‐0.33(Net weight 00‐01 12,600 4.39 10,800 5.14 1,800 ‐0.12per carton: 33.5 pounds) 01‐02 11,800 4.03 10,200 4.68 1,600 ‐0.13
02‐03 11,200 5.77 9,800 6.61 1,400 ‐0.1303‐04 11,600 5.08 10,200 5.80 1,400 ‐0.1404‐05 12,200 8.09 10,800 9.16 1,400 ‐0.1405‐06 12,000 6.63 10,600 7.52 1,400 ‐0.1506‐07 11,000 6.12 9,600 7.03 1,400 ‐0.1507‐08 10,400 4.59 10,400 4.59 ‐‐‐ ‐‐‐08‐09 9,600 ‐‐‐ 9,600 ‐‐‐ ‐‐‐ ‐‐‐
Lemons 99‐00 38,000 6.68 23,200 10.49 14,800 0.71(Net weight 00‐01 45,200 4.71 23,020 9.00 22,180 0.25 per carton: 38 pounds) 01‐02 36,600 7.84 25,040 11.41 11,560 0.13
02‐03 48,000 5.46 26,200 9.91 21,800 0.1103‐04 36,000 6.81 24,400 10.01 11,600 0.1004‐05 41,000 6.78 23,606 11.71 17,394 0.0905‐06 44,000 8.52 31,774 11.87 12,226 ‐0.1906‐07 37,000 10.66 22,000 18.07 15,000 ‐0.2107‐08 29,600 16.00 18,800 25.32 10,800 ‐0.2208‐09 42,000 7.27 25,800 ‐‐‐ 16,200 ‐‐‐
Oranges, Navel and Misc. 99‐00 80,000 3.28 62,000 4.24 18,000 ‐0.04(Net weight 00‐01 71,000 4.99 61,000 5.82 10,000 ‐0.07 per carton: 37.5 pounds) 01‐02 64,000 6.44 55,800 7.40 8,200 ‐0.08
02‐03 84,000 3.99 68,000 4.88 16,000 0.2003‐04 79,000 5.30 68,600 6.08 10,400 0.2004‐05 88,000 4.91 67,400 6.35 20,600 0.1905‐06 94,000 4.81 65,000 6.63 29,000 0.7506‐07 69,000 5.67 41,000 9.05 28,000 0.7407‐08 90,000 5.23 70,600 6.47 19,400 0.7308‐09 69,000 6.70 58,600 ‐‐‐ 10,400 ‐‐‐
Oranges, Valencia 99‐00 48,000 1.74 25,400 3.35 22,600 ‐0.07(Net weight 00‐01 38,000 4.22 31,000 5.08 7,000 0.38 per carton: 37.5 pounds) 01‐02 39,000 3.76 32,700 4.41 6,300 0.37
02‐03 40,000 3.27 31,600 4.09 8,400 0.1703‐04 22,000 6.24 20,400 6.72 1,600 0.1604‐05 41,000 4.19 31,000 5.49 10,000 0.1505‐06 28,000 6.46 23,000 7.72 5,000 0.7106‐07 23,000 5.52 13,400 8.89 9,600 0.8207‐08 34,000 4.06 23,800 5.46 10,200 0.8108‐09 24,000 5.57 19,600 ‐‐‐ 4,400 ‐‐‐
Oranges, All 99‐00 128,000 2.70 87,400 3.98 40,600 ‐0.06(Net weight 00‐01 109,000 4.72 92,000 5.57 17,000 0.12 per carton: 37.5 pounds) 01‐02 103,000 5.43 88,500 6.30 14,500 0.12
02‐03 124,000 3.76 99,600 4.63 24,400 0.1903‐04 101,000 5.51 89,000 6.22 12,000 0.1904‐05 129,000 4.68 98,400 6.08 30,600 0.1805‐06 122,000 5.19 88,000 6.91 34,000 0.7506‐07 92,000 5.64 54,400 9.01 37,600 0.7607‐08 124,000 4.91 94,400 6.21 29,600 0.7608‐09 93,000 6.41 78,100 ‐‐‐ 14,800 ‐‐‐
Tangerines 99‐00 5,000 5.55 3,400 8.20 1,600 ‐0.07Including Mandarins and 00‐01 4,400 7.08 3,420 9.13 980 ‐0.09Hybrids, Tangelos and 01‐02 4,400 8.83 3,940 9.81 460 0.37Tangors 02‐03 5,600 7.90 4,900 8.99 700 0.22(Net weight 03‐04 4,400 7.55 3,878 8.55 522 0.16 per carton: 37.5 pounds) 04‐05 5,800 9.21 4,954 10.76 846 0.15
05‐06 7,200 8.21 5,392 10.92 1,808 0.1406‐07 7,000 11.02 5,240 14.68 1,760 0.1307‐08 13,400 12.59 11,194 15.04 2,206 0.1208‐09 13,400 ‐‐‐ 11,200 ‐‐‐ 2,200 ‐‐‐
1/ Missing data not published to avoid disclosure of individual operations. 2/ Equivalent packinghouse door returns. 3/ Beginning in 2007‐08 crop year, small quantities of processed grapefruit are included in fresh.

USDA, NASS, California Field Office 43 California Agricultural Statistics, 2009
Citrus Monthly and Season Average Prices Received, 2000‐2009 1/
Grapefruit, All Crop Year
Nov. Dec. Jan. Feb. Mar. Apr. May June July Aug. Sept. Oct. Season Average
$/Carton
Fresh Sales 99‐00 6.90 6.50 6.25 5.25 4.35 3.45 4.05 5.10 4.65 4.50 4.70 5.40 4.80 00‐01 5.99 5.79 5.69 4.74 4.89 4.54 5.79 5.44 4.94 4.69 5.09 4.84 5.14 01‐02 5.38 5.53 5.38 5.08 2.98 3.53 4.68 4.98 5.03 4.88 4.18 4.43 4.68 02‐03 7.26 7.21 5.91 5.21 3.81 5.26 6.96 7.81 6.56 6.01 9.06 7.41 6.61 03‐04 5.75 5.05 5.15 4.45 2.90 4.05 5.60 5.65 5.25 5.45 8.70 6.95 5.80 04‐05 7.96 6.71 7.41 6.86 6.21 10.51 10.66 10.51 9.76 8.71 10.76 8.76 9.16 05‐06 6.42 5.52 5.67 4.97 4.62 7.07 9.27 8.02 8.22 8.27 7.82 8.67 7.52 06‐07 7.03 8.13 7.73 7.68 3.88 5.58 7.43 7.48 7.03 6.73 6.33 7.08 7.03 07‐08 4.59 4.99 4.64 4.84 3.09 5.54 5.99 4.74 4.19 3.24 4.24 4.44 4.59 08‐09 2.35 2.85 3.70 3.75 2.55 5.50 4.80 5.05 4.55 4.05 4.80 2.80 ‐‐‐
Processing 2/ 99‐00 (0.33) (0.33) (0.33) (0.33) (0.33) (0.33) (0.33) (0.33) (0.33) (0.33) (0.33) (0.33) (0.33)00‐01 (0.12) (0.12) (0.12) (0.12) (0.12) (0.12) (0.12) (0.12) (0.12) (0.12) (0.12) (0.12) (0.12)01‐02 (0.13) (0.13) (0.13) (0.13) (0.13) (0.13) (0.13) (0.13) (0.13) (0.13) (0.13) (0.13) (0.13)02‐03 (0.13) (0.13) (0.13) (0.13) (0.13) (0.13) (0.13) (0.13) (0.13) (0.13) (0.13) (0.13) (0.13)03‐04 (0.14) (0.14) (0.14) (0.14) (0.14) (0.14) (0.14) (0.14) (0.14) (0.14) (0.14) (0.14) (0.14)04‐05 (0.14) (0.14) (0.14) (0.14) (0.14) (0.14) (0.14) (0.14) (0.14) (0.14) (0.14) (0.14) (0.14)05‐06 (0.15) (0.15) (0.15) (0.15) (0.15) (0.15) (0.15) (0.15) (0.15) (0.15) (0.15) (0.15) (0.15)06‐07 (0.15) (0.15) (0.15) (0.15) (0.15) (0.15) (0.15) (0.15) (0.15) (0.15) (0.15) (0.15) (0.15)07‐08 ‐‐‐ ‐‐‐ ‐‐‐ ‐‐‐ ‐‐‐ ‐‐‐ ‐‐‐ ‐‐‐ ‐‐‐ ‐‐‐ ‐‐‐ ‐‐‐ ‐‐‐08‐09 ‐‐‐ ‐‐‐ ‐‐‐ ‐‐‐ ‐‐‐ ‐‐‐ ‐‐‐ ‐‐‐ ‐‐‐ ‐‐‐ ‐‐‐ ‐‐‐ ‐‐‐
All Sales 99‐00 5.93 6.01 5.62 4.85 4.19 3.31 3.57 4.37 3.87 3.40 4.17 4.53 4.09 00‐01 5.05 5.30 5.06 4.33 4.69 4.35 5.09 4.68 4.14 3.58 4.53 4.07 4.39 01‐02 4.54 5.17 4.83 4.83 2.89 3.41 4.12 4.29 4.25 3.75 3.73 3.74 4.03 02‐03 6.11 6.69 5.35 4.95 3.67 5.10 6.13 6.74 5.55 4.65 8.06 6.22 5.77 03‐04 4.88 4.71 4.66 4.31 2.73 3.93 4.94 4.88 4.48 4.29 7.88 5.91 5.08 04‐05 6.69 6.20 6.67 6.56 5.79 10.16 9.38 9.07 8.32 6.87 9.79 7.58 8.10 05‐06 5.39 5.10 5.09 4.78 4.34 6.85 8.14 6.92 6.97 6.52 7.12 7.54 6.63 06‐07 5.87 7.44 6.97 7.40 3.59 5.35 6.50 6.45 5.94 5.27 5.74 6.12 6.12 07‐08 4.59 4.99 4.64 4.84 3.09 5.54 5.99 4.74 4.19 3.24 4.24 4.44 4.59 08‐09 2.35 2.85 3.70 3.75 2.55 5.50 4.80 5.05 4.55 4.05 4.80 2.80 ‐‐‐
Continued on Next Page

USDA, NASS, California Field Office 44 California Agricultural Statistics, 2009
Citrus Monthly and Season Average Prices Received, 2000‐2009 1/
Lemons, All Crop Year
Aug. Sept. Oct. Nov. Dec. Jan. Feb. Mar. Apr. May June July Season Average
$/Carton
Fresh Sales 99‐00 14.69 15.24 13.14 10.59 11.69 11.44 8.89 8.94 7.59 7.14 10.89 13.94 10.49 00‐01 14.30 30.10 7.50 5.85 5.70 5.25 5.20 6.35 8.75 9.65 10.55 13.40 9.00 01‐02 15.26 13.61 14.24 12.11 10.43 9.38 8.40 7.99 9.21 10.66 13.11 13.66 11.41 02‐03 14.81 14.66 13.06 10.91 8.56 7.11 4.96 4.91 8.16 10.31 11.26 11.46 9.91 03‐04 11.41 9.46 7.71 7.76 7.21 6.61 7.56 9.46 10.76 11.11 12.31 13.06 10.01 04‐05 12.76 12.46 11.46 10.86 11.01 10.91 10.36 10.11 11.46 15.96 13.26 12.86 11.71 05‐06 10.52 9.32 8.57 8.72 9.07 8.37 9.62 10.67 14.57 16.67 16.47 15.77 11.87 06‐07 16.22 18.27 19.72 15.72 12.17 10.87 21.77 21.57 21.07 20.77 21.82 23.17 18.07 07‐08 24.47 25.82 26.62 26.72 24.32 25.62 26.32 25.72 24.37 24.97 25.72 24.27 25.32 08‐09 20.61 17.91 12.56 11.86 9.81 9.86 8.51 7.26 7.16 8.56 11.51 14.21 ‐‐‐
Processing 99‐00 0.71 0.71 0.71 0.71 0.71 0.71 0.71 0.71 0.71 0.71 0.71 0.71 0.71 00‐01 0.70 0.70 0.70 0.16 0.16 0.16 0.16 0.16 0.16 0.16 0.16 0.16 0.25 01‐02 0.15 0.15 0.15 0.12 0.12 0.12 0.12 0.12 0.12 0.12 0.12 0.12 0.13 02‐03 0.11 0.11 0.11 0.11 0.11 0.11 0.11 0.11 0.11 0.11 0.11 0.11 0.11 03‐04 0.10 0.10 0.10 0.10 0.10 0.10 0.10 0.10 0.10 0.10 0.10 0.10 0.10 04‐05 0.09 0.09 0.09 0.09 0.09 0.09 0.09 0.09 0.09 0.09 0.09 0.09 0.09 05‐06 0.08 0.08 (0.20) (0.20) (0.20) (0.20) (0.20) (0.20) (0.20) (0.20) (0.20) (0.20) (0.19)06‐07 (0.21) (0.21) (0.21) (0.21) (0.21) (0.21) (0.21) (0.21) (0.21) (0.21) (0.21) (0.21) (0.21)07‐08 (0.22) (0.22) (0.22) (0.22) (0.22) (0.22) (0.22) (0.22) (0.22) (0.22) (0.22) (0.22) (0.22)08‐09 ‐‐‐ ‐‐‐ ‐‐‐ ‐‐‐ ‐‐‐ ‐‐‐ ‐‐‐ ‐‐‐ ‐‐‐ ‐‐‐ ‐‐‐ ‐‐‐ ‐‐‐
All Sales 99‐00 10.50 11.95 9.70 7.51 7.85 7.74 6.86 6.34 4.77 3.84 5.44 7.97 6.68 00‐01 8.77 6.51 4.17 3.05 2.91 2.42 2.45 2.76 3.90 4.77 6.58 9.98 4.71 01‐02 11.32 9.81 11.67 9.57 6.76 5.55 4.39 5.03 6.33 7.38 9.84 10.95 7.84 02‐03 12.27 11.32 9.49 7.09 5.45 3.91 2.73 2.46 4.45 4.86 5.02 5.25 5.46 03‐04 8.75 7.37 5.63 5.06 4.09 3.53 4.48 5.93 7.10 8.46 9.71 9.58 6.82 04‐05 11.54 11.13 10.02 7.74 6.84 6.56 5.73 5.01 5.43 4.69 9.04 7.98 6.78 05‐06 8.82 7.85 6.62 7.22 6.29 5.12 8.53 7.43 9.40 10.20 11.15 12.10 8.52 06‐07 13.87 15.96 15.12 14.13 9.69 9.48 17.65 7.86 7.53 7.52 9.23 10.42 10.66 07‐08 19.53 19.31 19.91 19.98 14.50 14.14 16.84 14.80 14.91 13.12 16.16 15.63 16.00 08‐09 16.82 15.65 8.30 8.14 6.68 5.95 4.38 3.97 5.15 5.83 8.47 9.49 7.27
Continued on Next Page

USDA, NASS, California Field Office 45 California Agricultural Statistics, 2009
Citrus Monthly and Season Average Prices Received, 2000‐2009 1/
Oranges, Navel and Misc.
Crop Year
Oct. Nov. Dec. Jan. Feb. Mar. Apr. May June July Aug. Sept. Season Average
$/Carton
Fresh Sales 99‐00 ‐‐‐ 6.94 4.74 4.29 3.69 3.64 3.49 4.24 6.39 ‐‐‐ ‐‐‐ ‐‐‐ 4.24 00‐01 6.97 5.52 4.97 4.77 5.02 6.32 7.62 8.67 9.42 ‐‐‐ ‐‐‐ ‐‐‐ 5.82 01‐02 ‐‐‐ 9.70 8.10 7.55 6.90 6.45 7.25 8.55 ‐‐‐ ‐‐‐ ‐‐‐ ‐‐‐ 7.40 02‐03 ‐‐‐ 6.73 5.33 4.03 3.28 4.38 5.48 6.18 7.58 6.43 ‐‐‐ ‐‐‐ 4.88 03‐04 ‐‐‐ 7.28 6.18 5.43 5.48 6.28 6.18 6.48 7.73 ‐‐‐ ‐‐‐ ‐‐‐ 6.08 04‐05 12.25 7.70 6.40 5.95 5.65 5.75 6.45 6.90 6.85 ‐‐‐ ‐‐‐ ‐‐‐ 6.35 05‐06 ‐‐‐ 7.73 6.53 5.78 5.78 5.88 7.03 8.23 11.03 ‐‐‐ ‐‐‐ ‐‐‐ 6.63 06‐07 7.20 6.00 7.45 7.45 13.60 12.65 12.80 13.95 ‐‐‐ ‐‐‐ ‐‐‐ ‐‐‐ 9.05 07‐08 10.22 9.02 6.77 6.02 5.42 5.52 5.07 6.42 10.12 ‐‐‐ ‐‐‐ ‐‐‐ 6.47 08‐09 ‐‐‐ 9.04 7.34 8.39 7.79 7.14 6.54 8.49 11.29 ‐‐‐ ‐‐‐ ‐‐‐ ‐‐‐
Processing 99‐00 ‐‐‐ (0.04) (0.04) (0.04) (0.04) (0.04) (0.04) (0.04) (0.04) ‐‐‐ ‐‐‐ ‐‐‐ (0.04)00‐01 (0.07) (0.07) (0.07) (0.07) (0.07) (0.07) (0.07) (0.07) (0.07) ‐‐‐ ‐‐‐ ‐‐‐ (0.07)01‐02 ‐‐‐ (0.08) (0.08) (0.08) (0.08) (0.08) (0.08) (0.08) ‐‐‐ ‐‐‐ ‐‐‐ ‐‐‐ (0.08)02‐03 ‐‐‐ 0.20 0.20 0.20 0.20 0.20 0.20 0.20 0.20 0.20 ‐‐‐ ‐‐‐ 0.20 03‐04 ‐‐‐ 0.20 0.20 0.20 0.20 0.20 0.20 0.20 0.20 ‐‐‐ ‐‐‐ ‐‐‐ 0.20 04‐05 ‐‐‐ 0.19 0.19 0.19 0.19 0.19 0.19 0.19 0.19 ‐‐‐ ‐‐‐ ‐‐‐ 0.19 05‐06 ‐‐‐ 0.75 0.75 0.75 0.75 0.75 0.75 0.75 0.75 0.75 ‐‐‐ ‐‐‐ 0.75 06‐07 0.74 0.74 0.74 0.74 0.74 0.74 0.74 0.74 ‐‐‐ ‐‐‐ ‐‐‐ ‐‐‐ 0.74 07‐08 0.73 0.73 0.73 0.73 0.73 0.73 0.73 0.73 0.73 ‐‐‐ ‐‐‐ ‐‐‐ 0.73 08‐09 ‐‐‐ ‐‐‐ ‐‐‐ ‐‐‐ ‐‐‐ ‐‐‐ ‐‐‐ ‐‐‐ ‐‐‐ ‐‐‐ ‐‐‐ ‐‐‐ ‐‐‐
All Sales 99‐00 ‐‐‐ 5.76 4.12 3.73 3.03 2.78 2.50 2.73 3.78 ‐‐‐ ‐‐‐ ‐‐‐ 3.28 00‐01 4.63 4.66 4.41 4.31 4.44 5.30 6.12 7.13 9.42 ‐‐‐ ‐‐‐ ‐‐‐ 4.99 01‐02 ‐‐‐ 8.73 7.17 7.03 6.17 5.41 5.84 7.32 ‐‐‐ ‐‐‐ ‐‐‐ ‐‐‐ 6.44 02‐03 ‐‐‐ 5.98 4.92 3.48 2.70 3.41 4.24 4.72 5.47 4.36 ‐‐‐ ‐‐‐ 3.99 03‐04 ‐‐‐ 6.43 5.77 4.94 4.91 5.45 4.90 5.10 6.89 ‐‐‐ ‐‐‐ ‐‐‐ 5.30 04‐05 12.25 6.74 5.55 4.95 4.49 4.31 4.29 4.67 4.63 ‐‐‐ ‐‐‐ ‐‐‐ 4.91 05‐06 ‐‐‐ 6.57 5.46 4.64 4.23 4.17 4.69 5.26 5.55 0.75 ‐‐‐ ‐‐‐ 4.82 06‐07 5.76 5.41 6.59 6.56 3.37 6.79 6.00 3.47 ‐‐‐ ‐‐‐ ‐‐‐ ‐‐‐ 5.68 07‐08 8.95 7.81 5.92 5.30 4.44 4.37 3.83 4.57 7.18 ‐‐‐ ‐‐‐ ‐‐‐ 5.23 08‐09 8.16 6.41 7.43 6.94 6.10 5.43 6.62 8.77 6.70
Continued on Next Page

USDA, NASS, California Field Office 46 California Agricultural Statistics, 2009
Citrus Monthly and Season Average Prices Received, 2000‐2009 1/
Oranges, Valencia Crop Year
Feb. Mar. Apr. May June July Aug. Sept. Oct. Nov. Dec. Jan. Season Average
$/Carton
Fresh Sales 99‐00 ‐‐‐ 4.65 4.55 4.00 3.75 3.20 2.95 3.10 2.50 ‐‐‐ ‐‐‐ ‐‐‐ 3.35 00‐01 5.53 5.73 6.08 5.63 4.88 4.33 4.48 5.38 4.83 ‐‐‐ ‐‐‐ ‐‐‐ 5.08 01‐02 7.61 5.81 4.96 4.36 3.91 3.76 4.31 4.36 4.51 ‐‐‐ ‐‐‐ ‐‐‐ 4.41 02‐03 5.04 4.79 5.19 4.54 3.79 3.69 4.04 3.69 3.64 ‐‐‐ ‐‐‐ ‐‐‐ 4.09 03‐04 4.77 5.87 5.37 5.72 6.37 6.02 6.72 8.92 11.47 ‐‐‐ ‐‐‐ ‐‐‐ 6.72 04‐05 6.39 5.60 5.35 5.46 5.07 4.28 3.10 3.37 2.81 ‐‐‐ ‐‐‐ ‐‐‐ 5.49 05‐06 5.87 5.52 6.22 6.12 6.82 7.72 8.67 12.27 10.77 ‐‐‐ ‐‐‐ ‐‐‐ 7.72 06‐07 13.54 10.19 11.24 10.99 10.29 9.69 8.59 7.69 6.09 4.69 ‐‐‐ ‐‐‐ 8.89 07‐08 ‐‐‐ 5.06 5.16 5.21 5.06 5.16 5.16 6.41 6.36 6.36 ‐‐‐ ‐‐‐ 5.46 08‐09 ‐‐‐ 6.68 5.83 5.58 5.78 6.58 6.83 ‐‐‐ ‐‐‐ ‐‐‐ ‐‐‐ ‐‐‐ ‐‐‐
Processing 99‐00 ‐‐‐ (0.07) (0.07) (0.07) (0.07) (0.07) (0.07) (0.07) (0.07) ‐‐‐ ‐‐‐ ‐‐‐ (0.07)00‐01 ‐‐‐ 0.38 0.38 0.38 0.38 0.38 0.38 0.38 0.38 ‐‐‐ ‐‐‐ ‐‐‐ 0.38 01‐02 0.37 0.37 0.37 0.37 0.37 0.37 0.37 0.37 0.37 ‐‐‐ ‐‐‐ ‐‐‐ 0.37 02‐03 ‐‐‐ 0.17 0.17 0.17 0.17 0.17 0.17 0.17 0.17 ‐‐‐ ‐‐‐ ‐‐‐ 0.17 03‐04 ‐‐‐ 0.16 0.16 0.16 0.16 0.16 0.16 ‐‐‐ ‐‐‐ ‐‐‐ ‐‐‐ ‐‐‐ 0.16 04‐05 ‐‐‐ 0.15 0.15 0.15 0.15 0.15 0.15 0.15 0.15 ‐‐‐ ‐‐‐ ‐‐‐ 0.15 05‐06 ‐‐‐ ‐‐‐ 0.71 0.71 0.71 0.71 0.71 0.71 0.71 ‐‐‐ ‐‐‐ ‐‐‐ 0.71 06‐07 0.82 0.82 0.82 0.82 0.82 0.82 0.82 0.82 0.82 0.82 ‐‐‐ ‐‐‐ 0.82 07‐08 ‐‐‐ 0.81 0.81 0.81 0.81 0.81 0.81 0.81 0.81 0.81 ‐‐‐ ‐‐‐ 0.81 08‐09 ‐‐‐ ‐‐‐ ‐‐‐ ‐‐‐ ‐‐‐ ‐‐‐ ‐‐‐ ‐‐‐ ‐‐‐ ‐‐‐ ‐‐‐ ‐‐‐ ‐‐‐
All Sales 99‐00 ‐‐‐ 3.86 3.93 3.19 2.63 1.66 1.33 1.30 0.87 ‐‐‐ ‐‐‐ ‐‐‐ 1.74 00‐01 5.53 5.42 5.49 4.99 4.04 3.49 3.68 4.27 3.62 ‐‐‐ ‐‐‐ ‐‐‐ 4.22 01‐02 6.41 4.82 3.94 3.66 3.27 3.26 3.84 3.86 3.89 ‐‐‐ ‐‐‐ ‐‐‐ 3.76 02‐03 5.04 4.33 4.88 4.15 3.35 2.99 3.08 2.72 2.14 ‐‐‐ ‐‐‐ ‐‐‐ 3.27 03‐04 4.77 5.30 4.85 5.35 5.71 5.37 6.33 8.92 11.47 ‐‐‐ ‐‐‐ ‐‐‐ 6.24 04‐05 6.39 6.44 6.39 5.99 5.64 4.84 4.64 5.29 5.14 ‐‐‐ ‐‐‐ ‐‐‐ 4.19 05‐06 5.87 5.52 5.76 5.34 5.48 5.71 7.08 10.23 8.76 ‐‐‐ ‐‐‐ ‐‐‐ 6.47 06‐07 7.18 5.51 7.07 6.24 6.08 5.55 5.76 5.19 3.83 2.76 ‐‐‐ ‐‐‐ 5.52 07‐08 ‐‐‐ 4.35 4.58 4.63 3.89 4.07 3.46 4.26 3.28 4.51 ‐‐‐ ‐‐‐ 4.06
08‐09 ‐‐‐ 5.99 5.22 5.08 4.46 5.36 5.67 ‐‐‐ ‐‐‐ ‐‐‐ ‐‐‐ ‐‐‐ 5.57
Continued on Next Page
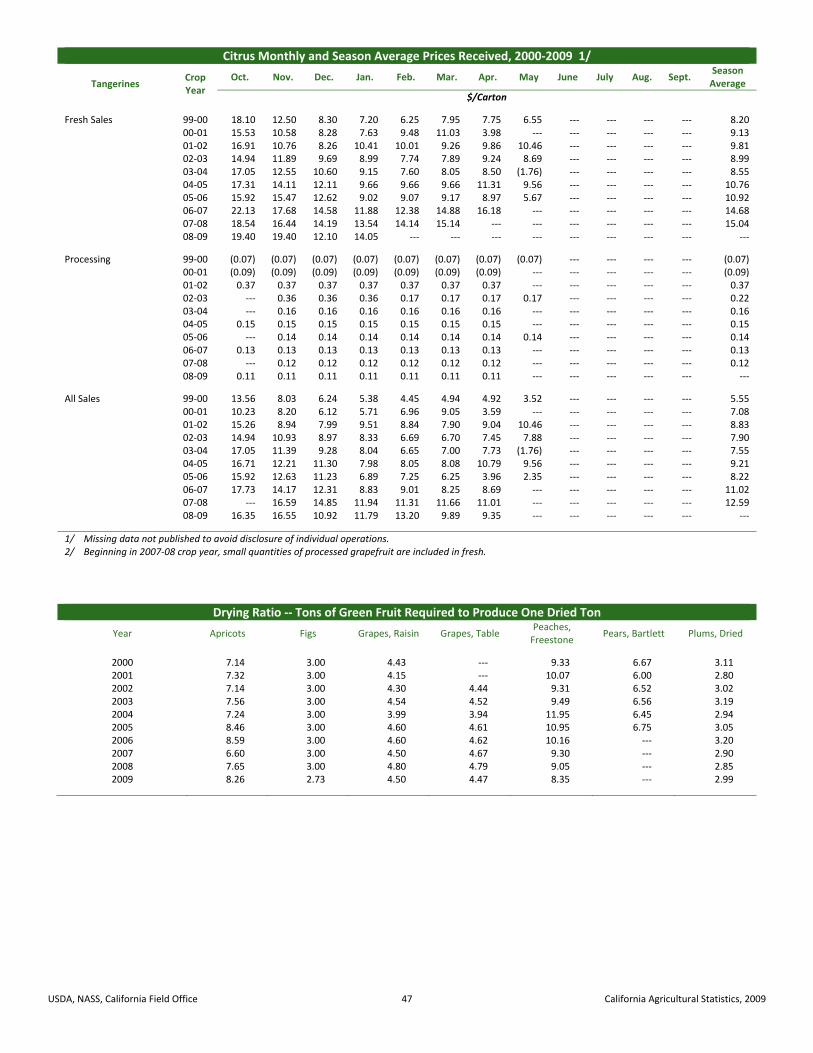
USDA, NASS, California Field Office 47 California Agricultural Statistics, 2009
Citrus Monthly and Season Average Prices Received, 2000‐2009 1/
Tangerines Crop Year
Oct. Nov. Dec. Jan. Feb. Mar. Apr. May June July Aug. Sept. Season Average
$/Carton
Fresh Sales 99‐00 18.10 12.50 8.30 7.20 6.25 7.95 7.75 6.55 ‐‐‐ ‐‐‐ ‐‐‐ ‐‐‐ 8.20 00‐01 15.53 10.58 8.28 7.63 9.48 11.03 3.98 ‐‐‐ ‐‐‐ ‐‐‐ ‐‐‐ ‐‐‐ 9.13 01‐02 16.91 10.76 8.26 10.41 10.01 9.26 9.86 10.46 ‐‐‐ ‐‐‐ ‐‐‐ ‐‐‐ 9.81 02‐03 14.94 11.89 9.69 8.99 7.74 7.89 9.24 8.69 ‐‐‐ ‐‐‐ ‐‐‐ ‐‐‐ 8.99 03‐04 17.05 12.55 10.60 9.15 7.60 8.05 8.50 (1.76) ‐‐‐ ‐‐‐ ‐‐‐ ‐‐‐ 8.55 04‐05 17.31 14.11 12.11 9.66 9.66 9.66 11.31 9.56 ‐‐‐ ‐‐‐ ‐‐‐ ‐‐‐ 10.76 05‐06 15.92 15.47 12.62 9.02 9.07 9.17 8.97 5.67 ‐‐‐ ‐‐‐ ‐‐‐ ‐‐‐ 10.92 06‐07 22.13 17.68 14.58 11.88 12.38 14.88 16.18 ‐‐‐ ‐‐‐ ‐‐‐ ‐‐‐ ‐‐‐ 14.68 07‐08 18.54 16.44 14.19 13.54 14.14 15.14 ‐‐‐ ‐‐‐ ‐‐‐ ‐‐‐ ‐‐‐ ‐‐‐ 15.04 08‐09 19.40 19.40 12.10 14.05 ‐‐‐ ‐‐‐ ‐‐‐ ‐‐‐ ‐‐‐ ‐‐‐ ‐‐‐ ‐‐‐ ‐‐‐
Processing 99‐00 (0.07) (0.07) (0.07) (0.07) (0.07) (0.07) (0.07) (0.07) ‐‐‐ ‐‐‐ ‐‐‐ ‐‐‐ (0.07)00‐01 (0.09) (0.09) (0.09) (0.09) (0.09) (0.09) (0.09) ‐‐‐ ‐‐‐ ‐‐‐ ‐‐‐ ‐‐‐ (0.09)01‐02 0.37 0.37 0.37 0.37 0.37 0.37 0.37 ‐‐‐ ‐‐‐ ‐‐‐ ‐‐‐ ‐‐‐ 0.37 02‐03 ‐‐‐ 0.36 0.36 0.36 0.17 0.17 0.17 0.17 ‐‐‐ ‐‐‐ ‐‐‐ ‐‐‐ 0.22 03‐04 ‐‐‐ 0.16 0.16 0.16 0.16 0.16 0.16 ‐‐‐ ‐‐‐ ‐‐‐ ‐‐‐ ‐‐‐ 0.16 04‐05 0.15 0.15 0.15 0.15 0.15 0.15 0.15 ‐‐‐ ‐‐‐ ‐‐‐ ‐‐‐ ‐‐‐ 0.15 05‐06 ‐‐‐ 0.14 0.14 0.14 0.14 0.14 0.14 0.14 ‐‐‐ ‐‐‐ ‐‐‐ ‐‐‐ 0.14 06‐07 0.13 0.13 0.13 0.13 0.13 0.13 0.13 ‐‐‐ ‐‐‐ ‐‐‐ ‐‐‐ ‐‐‐ 0.13 07‐08 ‐‐‐ 0.12 0.12 0.12 0.12 0.12 0.12 ‐‐‐ ‐‐‐ ‐‐‐ ‐‐‐ ‐‐‐ 0.12 08‐09 0.11 0.11 0.11 0.11 0.11 0.11 0.11 ‐‐‐ ‐‐‐ ‐‐‐ ‐‐‐ ‐‐‐ ‐‐‐
All Sales 99‐00 13.56 8.03 6.24 5.38 4.45 4.94 4.92 3.52 ‐‐‐ ‐‐‐ ‐‐‐ ‐‐‐ 5.55 00‐01 10.23 8.20 6.12 5.71 6.96 9.05 3.59 ‐‐‐ ‐‐‐ ‐‐‐ ‐‐‐ ‐‐‐ 7.08 01‐02 15.26 8.94 7.99 9.51 8.84 7.90 9.04 10.46 ‐‐‐ ‐‐‐ ‐‐‐ ‐‐‐ 8.83 02‐03 14.94 10.93 8.97 8.33 6.69 6.70 7.45 7.88 ‐‐‐ ‐‐‐ ‐‐‐ ‐‐‐ 7.90 03‐04 17.05 11.39 9.28 8.04 6.65 7.00 7.73 (1.76) ‐‐‐ ‐‐‐ ‐‐‐ ‐‐‐ 7.55 04‐05 16.71 12.21 11.30 7.98 8.05 8.08 10.79 9.56 ‐‐‐ ‐‐‐ ‐‐‐ ‐‐‐ 9.21 05‐06 15.92 12.63 11.23 6.89 7.25 6.25 3.96 2.35 ‐‐‐ ‐‐‐ ‐‐‐ ‐‐‐ 8.22 06‐07 17.73 14.17 12.31 8.83 9.01 8.25 8.69 ‐‐‐ ‐‐‐ ‐‐‐ ‐‐‐ ‐‐‐ 11.02 07‐08 ‐‐‐ 16.59 14.85 11.94 11.31 11.66 11.01 ‐‐‐ ‐‐‐ ‐‐‐ ‐‐‐ ‐‐‐ 12.59 08‐09 16.35 16.55 10.92 11.79 13.20 9.89 9.35 ‐‐‐ ‐‐‐ ‐‐‐ ‐‐‐ ‐‐‐ ‐‐‐
1/ Missing data not published to avoid disclosure of individual operations. 2/ Beginning in 2007‐08 crop year, small quantities of processed grapefruit are included in fresh.
Drying Ratio ‐‐ Tons of Green Fruit Required to Produce One Dried Ton
Year Apricots Figs Grapes, Raisin Grapes, Table Peaches, Freestone
Pears, Bartlett Plums, Dried
2000 7.14 3.00 4.43 ‐‐‐ 9.33 6.67 3.112001 7.32 3.00 4.15 ‐‐‐ 10.07 6.00 2.802002 7.14 3.00 4.30 4.44 9.31 6.52 3.022003 7.56 3.00 4.54 4.52 9.49 6.56 3.192004 7.24 3.00 3.99 3.94 11.95 6.45 2.942005 8.46 3.00 4.60 4.61 10.95 6.75 3.052006 8.59 3.00 4.60 4.62 10.16 ‐‐‐ 3.202007 6.60 3.00 4.50 4.67 9.30 ‐‐‐ 2.902008 7.65 3.00 4.80 4.79 9.05 ‐‐‐ 2.852009 8.26 2.73 4.50 4.47 8.35 ‐‐‐ 2.99

USDA, NASS, California Field Office 48 California Agricultural Statistics, 2009
Non‐Citrus Fruit Acreage, Production and Value, 2000‐2009
Crop Crop Year
Bearing Non‐Bearing 1/ Yield Per Acre Production Value Per Unit 2/ Total ValueAcres Acres Tons Tons $/Ton $1,000
Apples 2000 33,000 ‐‐‐ 8.65 285,000 328 83,4302001 30,000 ‐‐‐ 8.65 260,000 314 77,1102002 28,000 ‐‐‐ 8.40 235,000 408 93,4802003 28,000 ‐‐‐ 8.05 225,000 356 78,1902004 26,000 ‐‐‐ 8.05 177,500 298 52,9752005 24,000 ‐‐‐ 7.40 177,500 420 74,7182006 21,000 ‐‐‐ 8.45 177,500 480 85,0682007 20,500 ‐‐‐ 8.40 172,500 526 90,7692008 19,500 ‐‐‐ 9.25 180,000 610 109,7082009 19,000 ‐‐‐ 6.97 132,500 470 62,228
Apricots 2000 19,000 ‐‐‐ 4.74 90,000 329 26,6792001 18,000 ‐‐‐ 4.28 77,000 319 22,3302002 16,000 ‐‐‐ 5.31 85,000 306 22,9642003 15,200 ‐‐‐ 6.09 92,500 316 29,2212004 13,500 ‐‐‐ 6.96 94,000 334 28,5752005 12,600 ‐‐‐ 5.99 75,500 481 33,9302006 11,700 ‐‐‐ 3.33 39,000 593 23,1282007 11,300 ‐‐‐ 7.17 81,000 431 34,8782008 11,100 ‐‐‐ 6.94 77,000 472 34,4042009 11,000 ‐‐‐ 5.41 59,500 621 36,935
Avocados 99‐00 59,000 ‐‐‐ 2.73 161,000 2,110 339,59400‐01 59,000 ‐‐‐ 3.61 213,000 1,480 315,84201‐02 58,500 ‐‐‐ 3.42 200,000 1,790 358,00002‐03 59,500 ‐‐‐ 2.82 168,000 2,170 364,56003‐04 60,500 ‐‐‐ 3.57 216,000 1,760 380,16004‐05 62,000 ‐‐‐ 2.44 151,000 1,830 276,33005‐06 62,100 ‐‐‐ 4.83 300,000 1,140 342,00006‐07 65,000 ‐‐‐ 2.03 132,000 1,890 249,48007‐08 66,000 ‐‐‐ 2.50 165,000 1,990 328,35008‐09 65,000 1.35 88,000 2,280 200,640
Cherries, Sweet 2000 20,000 ‐‐‐ 2.35 47,000 1,570 71,5642001 22,000 ‐‐‐ 2.51 55,300 1,560 79,8142002 24,000 ‐‐‐ 2.31 55,500 1,740 93,3152003 25,000 ‐‐‐ 2.62 65,600 1,670 106,8832004 25,000 ‐‐‐ 2.92 73,000 1,750 123,1562005 25,000 ‐‐‐ 2.11 52,700 1,740 84,7512006 26,000 ‐‐‐ 1.62 42,100 3,090 124,3912007 26,000 ‐‐‐ 3.27 85,000 1,900 155,0162008 27,000 ‐‐‐ 3.18 86,000 2,350 194,5342009 28,000 ‐‐‐ 2.79 78,000 2,470 185,265
Dates 2000 5,000 ‐‐‐ 3.48 17,400 1,230 21,4022001 4,900 ‐‐‐ 4.02 19,700 1,360 26,7922002 4,800 ‐‐‐ 5.04 24,200 1,550 37,5102003 5,200 ‐‐‐ 3.46 18,000 1,380 24,8402004 5,500 ‐‐‐ 3.13 17,200 1,310 22,5322005 5,700 ‐‐‐ 3.02 17,200 1,430 24,5962006 5,500 ‐‐‐ 3.22 17,700 2,140 37,8782007 5,300 ‐‐‐ 3.08 16,300 2,290 37,3272008 5,700 ‐‐‐ 3.67 20,900 1,260 26,3342009 6,300 ‐‐‐ 3.71 23,400 1,230 28,782
Figs 2000 15,900 ‐‐‐ 3.52 55,900 272 15,2262001 14,600 ‐‐‐ 2.81 41,000 366 15,0122002 13,500 ‐‐‐ 3.94 53,200 340 18,0872003 13,000 ‐‐‐ 3.73 48,500 317 15,3732004 12,600 ‐‐‐ 4.06 51,100 396 20,2142005 12,000 ‐‐‐ 4.08 49,000 404 19,8072006 10,300 ‐‐‐ 4.16 42,800 426 18,2532007 9,100 ‐‐‐ 5.25 47,800 401 19,1452008 9,400 ‐‐‐ 4.61 43,300 599 25,9542009 9,300 ‐‐‐ 4.30 39,950 763 30,465
Continued on Next Page

USDA, NASS, California Field Office 49 California Agricultural Statistics, 2009
Non‐Citrus Fruit Acreage, Production and Value, 2000‐2009
Crop Crop Year
Bearing Non‐Bearing 1/ Yield Per Acre Production Value Per Unit 2/ Total ValueAcres Acres Tons Tons $/Ton $1,000
Grapes, Raisin 3/ 4/ 2000 280,000 7,000 10.40 2,921,000 166 485,1392001 235,000 7,000 9.43 2,215,000 186 411,2962002 246,000 6,000 11.40 2,804,000 152 425,8382003 255,000 5,000 8.71 2,220,000 170 374,1672004 244,000 4,000 8.35 2,038,000 306 624,6002005 240,000 6,000 9.52 2,285,000 261 597,4562006 234,000 6,000 7.83 1,833,000 277 507,8932007 227,000 6,000 9.48 2,151,000 278 597,6002008 221,000 4,000 11.40 2,520,000 265 668,5552009 216,000 3,000 8.92 1,927,000 295 567,894
Grapes, Table 4/ 2000 89,000 11,000 8.70 774,000 565 437,4482001 88,000 10,000 8.10 713,000 610 435,1772002 88,000 9,000 8.44 743,000 616 457,6282003 85,000 8,000 8.61 732,000 601 407,6072004 83,000 9,000 9.28 770,000 695 535,0092005 83,000 10,000 10.50 872,000 442 385,1162006 83,000 10,000 8.64 717,000 898 643,7772007 82,000 10,000 9.65 791,000 787 622,8942008 83,000 10,000 11.70 973,000 405 394,5212009 84,000 9,000 10.40 874,000 465 406,401
Grapes, Wine 2000 458,000 110,000 7.34 3,364,000 567 1,908,6492001 480,000 90,000 6.36 3,051,000 597 1,820,1062002 486,000 70,000 6.48 3,149,000 535 1,683,4522003 479,000 50,000 6.07 2,909,000 530 1,542,8762004 473,000 40,000 5.95 2,815,000 570 1,604,9252005 477,000 45,000 7.98 3,806,000 582 2,215,2482006 480,000 47,000 6.62 3,176,000 582 1,848,2882007 480,000 43,000 6.85 3,288,000 564 1,855,1202008 482,000 44,000 6.34 3,055,000 609 1,859,1502009 489,000 42,000 7.65 3,743,000 613 2,293,116
Grapes, All 3/ 5/ 2000 827,000 128,000 8.54 7,059,000 401 2,831,2362001 803,000 107,000 7.45 5,979,000 446 2,666,5792002 820,000 85,000 8.17 6,696,000 383 2,566,9182003 819,000 63,000 7.16 5,861,000 402 2,324,6502004 800,000 53,000 7.03 5,623,000 492 2,764,5342005 800,000 61,000 8.70 6,963,000 459 3,197,8202006 797,000 63,000 7.18 5,726,000 524 2,999,9582007 789,000 59,000 7.90 6,230,000 494 3,075,6142008 786,000 58,000 8.33 6,548,000 446 2,922,2262009 789,000 54,000 8.29 6,544,000 499 3,267,411
Kiwifruit 2000 5,300 ‐‐‐ 6.42 34,000 455 13,8882001 4,900 ‐‐‐ 5.27 25,800 667 15,3402002 4,500 ‐‐‐ 5.80 26,100 783 18,0972003 4,500 ‐‐‐ 5.64 25,400 853 20,4722004 4,500 ‐‐‐ 5.93 26,700 809 19,9772005 4,500 ‐‐‐ 8.27 37,200 620 22,4612006 4,200 ‐‐‐ 6.21 26,100 911 23,1482007 4,200 ‐‐‐ 5.83 24,500 950 22,5172008 4,200 ‐‐‐ 5.48 23,000 888 19,5452009 4,200 ‐‐‐ 6.19 26,000 1,470 35,048
Nectarines 2000 35,500 ‐‐‐ 7.52 267,000 398 106,2562001 36,500 ‐‐‐ 7.53 275,000 464 127,6422002 36,500 ‐‐‐ 8.22 300,000 382 114,6002003 35,500 ‐‐‐ 7.69 273,000 436 119,0282004 35,000 ‐‐‐ 7.69 269,000 342 86,1842005 34,000 ‐‐‐ 7.03 239,000 504 120,4562006 33,000 ‐‐‐ 6.61 218,000 517 112,7062007 31,000 ‐‐‐ 8.68 269,000 331 89,0392008 31,000 ‐‐‐ 9.52 295,000 365 107,6752009 29,000 ‐‐‐ 7.24 210,000 637 133,770
Continued on Next Page
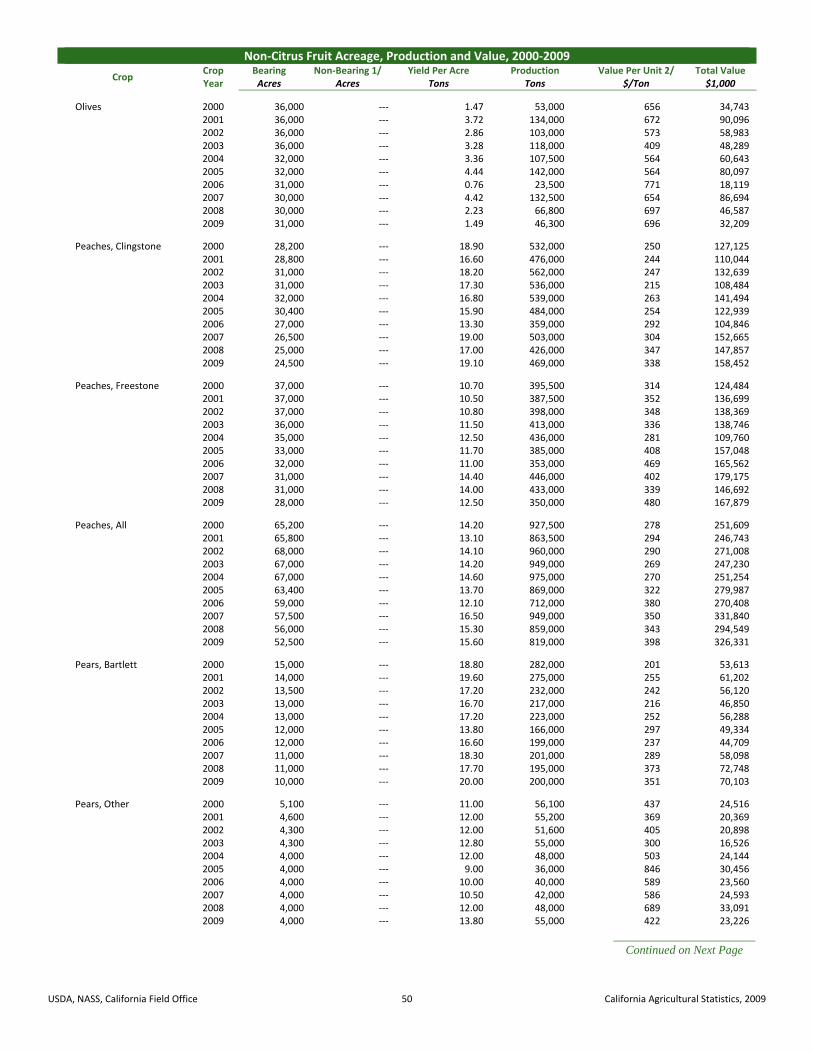
USDA, NASS, California Field Office 50 California Agricultural Statistics, 2009
Non‐Citrus Fruit Acreage, Production and Value, 2000‐2009
Crop Crop Year
Bearing Non‐Bearing 1/ Yield Per Acre Production Value Per Unit 2/ Total ValueAcres Acres Tons Tons $/Ton $1,000
Olives 2000 36,000 ‐‐‐ 1.47 53,000 656 34,7432001 36,000 ‐‐‐ 3.72 134,000 672 90,0962002 36,000 ‐‐‐ 2.86 103,000 573 58,9832003 36,000 ‐‐‐ 3.28 118,000 409 48,2892004 32,000 ‐‐‐ 3.36 107,500 564 60,6432005 32,000 ‐‐‐ 4.44 142,000 564 80,0972006 31,000 ‐‐‐ 0.76 23,500 771 18,1192007 30,000 ‐‐‐ 4.42 132,500 654 86,6942008 30,000 ‐‐‐ 2.23 66,800 697 46,5872009 31,000 ‐‐‐ 1.49 46,300 696 32,209
Peaches, Clingstone 2000 28,200 ‐‐‐ 18.90 532,000 250 127,1252001 28,800 ‐‐‐ 16.60 476,000 244 110,0442002 31,000 ‐‐‐ 18.20 562,000 247 132,6392003 31,000 ‐‐‐ 17.30 536,000 215 108,4842004 32,000 ‐‐‐ 16.80 539,000 263 141,4942005 30,400 ‐‐‐ 15.90 484,000 254 122,9392006 27,000 ‐‐‐ 13.30 359,000 292 104,8462007 26,500 ‐‐‐ 19.00 503,000 304 152,6652008 25,000 ‐‐‐ 17.00 426,000 347 147,8572009 24,500 ‐‐‐ 19.10 469,000 338 158,452
Peaches, Freestone 2000 37,000 ‐‐‐ 10.70 395,500 314 124,4842001 37,000 ‐‐‐ 10.50 387,500 352 136,6992002 37,000 ‐‐‐ 10.80 398,000 348 138,3692003 36,000 ‐‐‐ 11.50 413,000 336 138,7462004 35,000 ‐‐‐ 12.50 436,000 281 109,7602005 33,000 ‐‐‐ 11.70 385,000 408 157,0482006 32,000 ‐‐‐ 11.00 353,000 469 165,5622007 31,000 ‐‐‐ 14.40 446,000 402 179,1752008 31,000 ‐‐‐ 14.00 433,000 339 146,6922009 28,000 ‐‐‐ 12.50 350,000 480 167,879
Peaches, All 2000 65,200 ‐‐‐ 14.20 927,500 278 251,6092001 65,800 ‐‐‐ 13.10 863,500 294 246,7432002 68,000 ‐‐‐ 14.10 960,000 290 271,0082003 67,000 ‐‐‐ 14.20 949,000 269 247,2302004 67,000 ‐‐‐ 14.60 975,000 270 251,2542005 63,400 ‐‐‐ 13.70 869,000 322 279,9872006 59,000 ‐‐‐ 12.10 712,000 380 270,4082007 57,500 ‐‐‐ 16.50 949,000 350 331,8402008 56,000 ‐‐‐ 15.30 859,000 343 294,5492009 52,500 ‐‐‐ 15.60 819,000 398 326,331
Pears, Bartlett 2000 15,000 ‐‐‐ 18.80 282,000 201 53,6132001 14,000 ‐‐‐ 19.60 275,000 255 61,2022002 13,500 ‐‐‐ 17.20 232,000 242 56,1202003 13,000 ‐‐‐ 16.70 217,000 216 46,8502004 13,000 ‐‐‐ 17.20 223,000 252 56,2882005 12,000 ‐‐‐ 13.80 166,000 297 49,3342006 12,000 ‐‐‐ 16.60 199,000 237 44,7092007 11,000 ‐‐‐ 18.30 201,000 289 58,0982008 11,000 ‐‐‐ 17.70 195,000 373 72,7482009 10,000 ‐‐‐ 20.00 200,000 351 70,103
Pears, Other 2000 5,100 ‐‐‐ 11.00 56,100 437 24,5162001 4,600 ‐‐‐ 12.00 55,200 369 20,3692002 4,300 ‐‐‐ 12.00 51,600 405 20,8982003 4,300 ‐‐‐ 12.80 55,000 300 16,5262004 4,000 ‐‐‐ 12.00 48,000 503 24,1442005 4,000 ‐‐‐ 9.00 36,000 846 30,4562006 4,000 ‐‐‐ 10.00 40,000 589 23,5602007 4,000 ‐‐‐ 10.50 42,000 586 24,5932008 4,000 ‐‐‐ 12.00 48,000 689 33,0912009 4,000 ‐‐‐ 13.80 55,000 422 23,226
Continued on Next Page

USDA, NASS, California Field Office 51 California Agricultural Statistics, 2009
Non‐Citrus Fruit Acreage, Production and Value, 2000‐2009
Crop Crop Year
Bearing Non‐Bearing 1/ Yield Per Acre Production Value Per Unit 2/ Total ValueAcres Acres Tons Tons $/Ton $1,000
Pears, All 2000 20,100 ‐‐‐ 16.80 338,100 242 78,1292001 18,600 ‐‐‐ 17.80 330,200 276 81,5712002 17,800 ‐‐‐ 15.90 283,600 272 77,0182003 17,300 ‐‐‐ 15.70 272,000 233 63,3762004 17,000 ‐‐‐ 15.90 271,000 297 80,4322005 16,000 ‐‐‐ 12.60 202,000 395 79,7902006 16,000 ‐‐‐ 14.90 239,000 298 68,2692007 15,000 ‐‐‐ 16.20 243,000 340 82,6912008 15,000 ‐‐‐ 16.20 243,000 436 105,8392009 14,000 ‐‐‐ 18.20 255,000 366 93,329
Plums 2000 38,000 ‐‐‐ 5.18 197,000 442 87,1152001 37,000 ‐‐‐ 5.68 210,000 306 64,3622002 36,000 ‐‐‐ 5.58 201,000 386 77,5862003 35,000 ‐‐‐ 5.97 209,000 418 87,3622004 33,500 ‐‐‐ 4.66 156,000 516 74,3472005 32,000 ‐‐‐ 5.34 171,000 541 92,4632006 31,000 ‐‐‐ 5.10 158,000 688 108,6482007 29,500 ‐‐‐ 5.15 152,000 665 101,0772008 29,500 ‐‐‐ 5.42 160,000 356 56,9602009 26,600 ‐‐‐ 4.21 112,000 514 57,568
Plums, Dried 5/ 2000 86,000 15,000 2.55 219,000 770 154,7702001 86,000 11,000 1.74 150,000 726 98,0102002 74,000 9,000 2.32 172,000 810 132,0302003 72,000 8,000 2.51 181,000 772 129,6962004 70,000 ‐‐‐ 0.70 49,000 1,500 72,0002005 67,000 7,500 1.45 97,000 1,470 138,1802006 65,000 7,500 3.05 198,000 1,390 262,7102007 64,000 7,500 1.30 83,000 1,450 117,4502008 64,000 ‐‐‐ 2.02 129,000 1,500 193,5002009 64,000 ‐‐‐ 2.59 166,000 1,200 199,200
Miscellaneous 2000 32,000 ‐‐‐ ‐‐‐ 205,000 ‐‐‐ 93,793Fruits and Nuts 6/ 2001 32,000 ‐‐‐ ‐‐‐ 167,000 ‐‐‐ 84,992
2002 33,000 ‐‐‐ ‐‐‐ 196,000 ‐‐‐ 106,2332003 29,000 ‐‐‐ ‐‐‐ 169,000 ‐‐‐ 95,0852004 23,000 ‐‐‐ ‐‐‐ 125,000 ‐‐‐ 88,5772005 29,000 ‐‐‐ ‐‐‐ 178,000 ‐‐‐ 127,0382006 34,000 ‐‐‐ ‐‐‐ 190,000 ‐‐‐ 146,3792007 35,000 ‐‐‐ ‐‐‐ 197,000 ‐‐‐ 156,3612008 36,000 ‐‐‐ ‐‐‐ 214,000 ‐‐‐ 161,1322009 34,000 ‐‐‐ ‐‐‐ 189,000 ‐‐‐ 154,844
`
1/ Non‐bearing shown only in year when acreage surveys were conducted.2/ Return at processing plant door or packinghouse door. 3/ Acres of raisin type grapes enrolled in the California Raisin Industry Diversion (RID) program were; 1998‐2000 ‐ zero; 2001 ‐ 41,000; 2002 ‐ 27,000; 2003‐2007 ‐ zero. These acres were deducted from bearing acres before calculating yield.4/ Production is the fresh equivalent of dried and not dried. 5/ Acreage by county, variety and year of planting for 2007 are available upon request.6/ These crops are apricot‐plum crosses (aprium, plumcot, pluots), black walnuts, chayotes, cherimoyas, chestnuts, feijoas, guavas, jojobas, jujubes, kumquats, limes, loquats, Macadamia nuts, persimmons, pomegranates, prickly pears, quince, citrus by‐products, and orchard biomass.
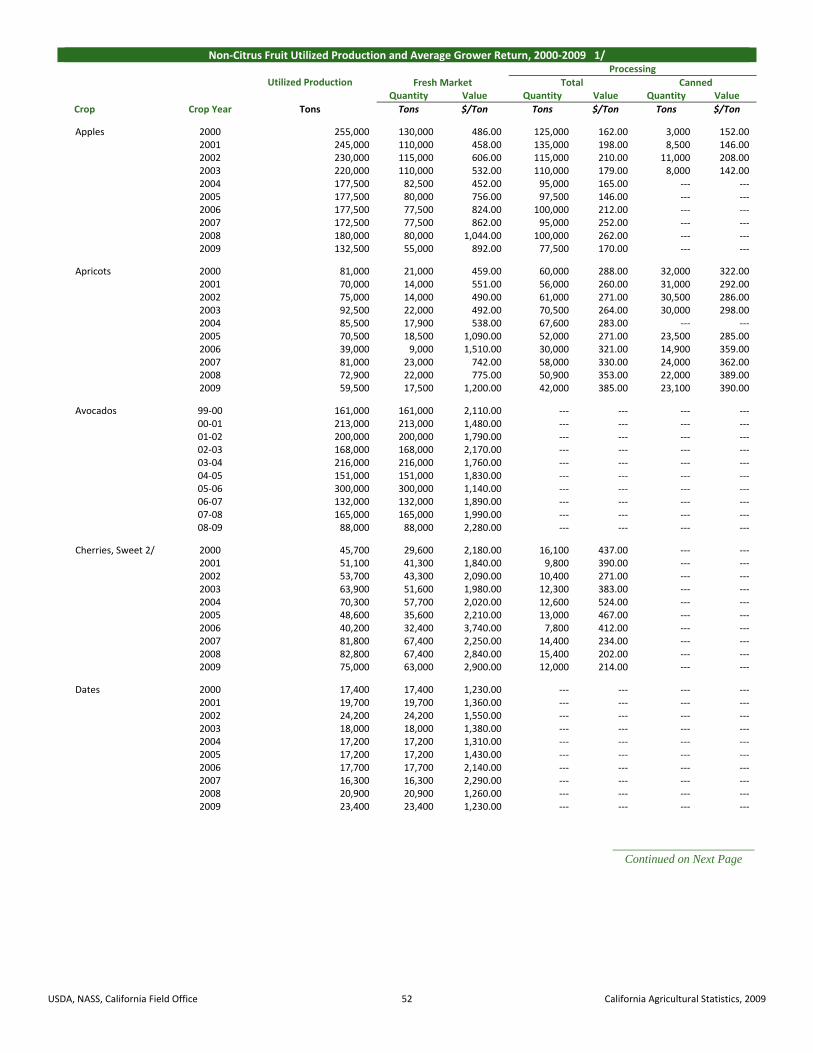
USDA, NASS, California Field Office 52 California Agricultural Statistics, 2009
Non‐Citrus Fruit Utilized Production and Average Grower Return, 2000‐2009 1/
Crop Crop Year
Utilized Production Fresh Market
Processing
Total CannedQuantity Value Quantity Value Quantity Value
Tons Tons $/Ton Tons $/Ton Tons $/Ton
Apples 2000 255,000 130,000 486.00 125,000 162.00 3,000 152.002001 245,000 110,000 458.00 135,000 198.00 8,500 146.002002 230,000 115,000 606.00 115,000 210.00 11,000 208.002003 220,000 110,000 532.00 110,000 179.00 8,000 142.002004 177,500 82,500 452.00 95,000 165.00 ‐‐‐ ‐‐‐2005 177,500 80,000 756.00 97,500 146.00 ‐‐‐ ‐‐‐2006 177,500 77,500 824.00 100,000 212.00 ‐‐‐ ‐‐‐2007 172,500 77,500 862.00 95,000 252.00 ‐‐‐ ‐‐‐2008 180,000 80,000 1,044.00 100,000 262.00 ‐‐‐ ‐‐‐2009 132,500 55,000 892.00 77,500 170.00 ‐‐‐ ‐‐‐
Apricots 2000 81,000 21,000 459.00 60,000 288.00 32,000 322.002001 70,000 14,000 551.00 56,000 260.00 31,000 292.002002 75,000 14,000 490.00 61,000 271.00 30,500 286.002003 92,500 22,000 492.00 70,500 264.00 30,000 298.002004 85,500 17,900 538.00 67,600 283.00 ‐‐‐ ‐‐‐2005 70,500 18,500 1,090.00 52,000 271.00 23,500 285.002006 39,000 9,000 1,510.00 30,000 321.00 14,900 359.002007 81,000 23,000 742.00 58,000 330.00 24,000 362.002008 72,900 22,000 775.00 50,900 353.00 22,000 389.002009 59,500 17,500 1,200.00 42,000 385.00 23,100 390.00
Avocados 99‐00 161,000 161,000 2,110.00 ‐‐‐ ‐‐‐ ‐‐‐ ‐‐‐00‐01 213,000 213,000 1,480.00 ‐‐‐ ‐‐‐ ‐‐‐ ‐‐‐01‐02 200,000 200,000 1,790.00 ‐‐‐ ‐‐‐ ‐‐‐ ‐‐‐02‐03 168,000 168,000 2,170.00 ‐‐‐ ‐‐‐ ‐‐‐ ‐‐‐03‐04 216,000 216,000 1,760.00 ‐‐‐ ‐‐‐ ‐‐‐ ‐‐‐04‐05 151,000 151,000 1,830.00 ‐‐‐ ‐‐‐ ‐‐‐ ‐‐‐05‐06 300,000 300,000 1,140.00 ‐‐‐ ‐‐‐ ‐‐‐ ‐‐‐06‐07 132,000 132,000 1,890.00 ‐‐‐ ‐‐‐ ‐‐‐ ‐‐‐07‐08 165,000 165,000 1,990.00 ‐‐‐ ‐‐‐ ‐‐‐ ‐‐‐08‐09 88,000 88,000 2,280.00 ‐‐‐ ‐‐‐ ‐‐‐ ‐‐‐
Cherries, Sweet 2/ 2000 45,700 29,600 2,180.00 16,100 437.00 ‐‐‐ ‐‐‐2001 51,100 41,300 1,840.00 9,800 390.00 ‐‐‐ ‐‐‐2002 53,700 43,300 2,090.00 10,400 271.00 ‐‐‐ ‐‐‐2003 63,900 51,600 1,980.00 12,300 383.00 ‐‐‐ ‐‐‐2004 70,300 57,700 2,020.00 12,600 524.00 ‐‐‐ ‐‐‐2005 48,600 35,600 2,210.00 13,000 467.00 ‐‐‐ ‐‐‐2006 40,200 32,400 3,740.00 7,800 412.00 ‐‐‐ ‐‐‐2007 81,800 67,400 2,250.00 14,400 234.00 ‐‐‐ ‐‐‐2008 82,800 67,400 2,840.00 15,400 202.00 ‐‐‐ ‐‐‐2009 75,000 63,000 2,900.00 12,000 214.00 ‐‐‐ ‐‐‐
Dates 2000 17,400 17,400 1,230.00 ‐‐‐ ‐‐‐ ‐‐‐ ‐‐‐2001 19,700 19,700 1,360.00 ‐‐‐ ‐‐‐ ‐‐‐ ‐‐‐2002 24,200 24,200 1,550.00 ‐‐‐ ‐‐‐ ‐‐‐ ‐‐‐2003 18,000 18,000 1,380.00 ‐‐‐ ‐‐‐ ‐‐‐ ‐‐‐2004 17,200 17,200 1,310.00 ‐‐‐ ‐‐‐ ‐‐‐ ‐‐‐2005 17,200 17,200 1,430.00 ‐‐‐ ‐‐‐ ‐‐‐ ‐‐‐2006 17,700 17,700 2,140.00 ‐‐‐ ‐‐‐ ‐‐‐ ‐‐‐2007 16,300 16,300 2,290.00 ‐‐‐ ‐‐‐ ‐‐‐ ‐‐‐2008 20,900 20,900 1,260.00 ‐‐‐ ‐‐‐ ‐‐‐ ‐‐‐2009 23,400 23,400 1,230.00 ‐‐‐ ‐‐‐ ‐‐‐ ‐‐‐
Continued on Next Page

USDA, NASS, California Field Office 53 California Agricultural Statistics, 2009
Non‐Citrus Fruit Utilized Production and Average Grower Return, 2000‐2009 1/
Crop Crop Year
Processing
Juice or Crushed Frozen Dried (Fresh Basis) Dried BasisQuantity Value Quantity Value Quantity Value Quantity Value
Tons $/Ton Tons $/Ton Tons $/Ton Tons $/Ton
Apples 2000 112,500 156.00 ‐‐‐ ‐‐‐ ‐‐‐ ‐‐‐ ‐‐‐ ‐‐‐2001 109,000 209.00 ‐‐‐ ‐‐‐ ‐‐‐ ‐‐‐ ‐‐‐ ‐‐‐2002 99,000 213.00 ‐‐‐ ‐‐‐ ‐‐‐ ‐‐‐ ‐‐‐ ‐‐‐2003 95,000 178.00 ‐‐‐ ‐‐‐ ‐‐‐ ‐‐‐ ‐‐‐ ‐‐‐2004 85,000 164.00 ‐‐‐ ‐‐‐ ‐‐‐ ‐‐‐ ‐‐‐ ‐‐‐2005 90,000 149.00 ‐‐‐ ‐‐‐ ‐‐‐ ‐‐‐ ‐‐‐ ‐‐‐2006 87,500 222.00 ‐‐‐ ‐‐‐ ‐‐‐ ‐‐‐ ‐‐‐ ‐‐‐2007 ‐‐‐ ‐‐‐ ‐‐‐ ‐‐‐ ‐‐‐ ‐‐‐ ‐‐‐ ‐‐‐2008 ‐‐‐ ‐‐‐ ‐‐‐ ‐‐‐ ‐‐‐ ‐‐‐ ‐‐‐ ‐‐‐2009 ‐‐‐ ‐‐‐ ‐‐‐ ‐‐‐ ‐‐‐ ‐‐‐ ‐‐‐ ‐‐‐
Apricots 2000 10,000 169.00 10,000 298.00 8,000 260.00 1,120 1,860.002001 9,000 102.00 9,000 308.00 6,000 268.00 820 1,960.002002 7,000 158.00 10,500 299.00 8,000 223.00 1,120 1,590.002003 9,200 210.00 11,000 313.00 6,800 233.00 900 1,760.002004 ‐‐‐ ‐‐‐ 9,700 308.00 11,800 269.00 1,630 1,950.002005 ‐‐‐ ‐‐‐ ‐‐‐ ‐‐‐ 11,500 244.00 1,360 2,060.002006 ‐‐‐ ‐‐‐ ‐‐‐ ‐‐‐ 5,500 303.00 640 2,600.002007 ‐‐‐ ‐‐‐ ‐‐‐ ‐‐‐ 13,000 229.00 1,970 1,510.002008 ‐‐‐ ‐‐‐ ‐‐‐ ‐‐‐ 14,000 309.00 1,830 2,364.002009 ‐‐‐ ‐‐‐ ‐‐‐ ‐‐‐ 9,000 360.00 1,090 2,970.00
Avocados 99‐00 ‐‐‐ ‐‐‐ ‐‐‐ ‐‐‐ ‐‐‐ ‐‐‐ ‐‐‐ ‐‐‐00‐01 ‐‐‐ ‐‐‐ ‐‐‐ ‐‐‐ ‐‐‐ ‐‐‐ ‐‐‐ ‐‐‐01‐02 ‐‐‐ ‐‐‐ ‐‐‐ ‐‐‐ ‐‐‐ ‐‐‐ ‐‐‐ ‐‐‐02‐03 ‐‐‐ ‐‐‐ ‐‐‐ ‐‐‐ ‐‐‐ ‐‐‐ ‐‐‐ ‐‐‐03‐04 ‐‐‐ ‐‐‐ ‐‐‐ ‐‐‐ ‐‐‐ ‐‐‐ ‐‐‐ ‐‐‐04‐05 ‐‐‐ ‐‐‐ ‐‐‐ ‐‐‐ ‐‐‐ ‐‐‐ ‐‐‐ ‐‐‐05‐06 ‐‐‐ ‐‐‐ ‐‐‐ ‐‐‐ ‐‐‐ ‐‐‐ ‐‐‐ ‐‐‐06‐07 ‐‐‐ ‐‐‐ ‐‐‐ ‐‐‐ ‐‐‐ ‐‐‐ ‐‐‐ ‐‐‐07‐08 ‐‐‐ ‐‐‐ ‐‐‐ ‐‐‐ ‐‐‐ ‐‐‐ ‐‐‐ ‐‐‐08‐09 ‐‐‐ ‐‐‐ ‐‐‐ ‐‐‐ ‐‐‐ ‐‐‐ ‐‐‐ ‐‐‐
Cherries, Sweet 2/ 2000 ‐‐‐ ‐‐‐ ‐‐‐ ‐‐‐ ‐‐‐ ‐‐‐ ‐‐‐ ‐‐‐2001 ‐‐‐ ‐‐‐ ‐‐‐ ‐‐‐ ‐‐‐ ‐‐‐ ‐‐‐ ‐‐‐2002 ‐‐‐ ‐‐‐ ‐‐‐ ‐‐‐ ‐‐‐ ‐‐‐ ‐‐‐ ‐‐‐2003 ‐‐‐ ‐‐‐ ‐‐‐ ‐‐‐ ‐‐‐ ‐‐‐ ‐‐‐ ‐‐‐2004 ‐‐‐ ‐‐‐ ‐‐‐ ‐‐‐ ‐‐‐ ‐‐‐ ‐‐‐ ‐‐‐2005 ‐‐‐ ‐‐‐ ‐‐‐ ‐‐‐ ‐‐‐ ‐‐‐ ‐‐‐ ‐‐‐2006 ‐‐‐ ‐‐‐ ‐‐‐ ‐‐‐ ‐‐‐ ‐‐‐ ‐‐‐ ‐‐‐2007 ‐‐‐ ‐‐‐ ‐‐‐ ‐‐‐ ‐‐‐ ‐‐‐ ‐‐‐ ‐‐‐2008 ‐‐‐ ‐‐‐ ‐‐‐ ‐‐‐ ‐‐‐ ‐‐‐ ‐‐‐ ‐‐‐2009 ‐‐‐ ‐‐‐ ‐‐‐ ‐‐‐ ‐‐‐ ‐‐‐ ‐‐‐ ‐‐‐
Dates 2000 ‐‐‐ ‐‐‐ ‐‐‐ ‐‐‐ ‐‐‐ ‐‐‐ ‐‐‐ ‐‐‐2001 ‐‐‐ ‐‐‐ ‐‐‐ ‐‐‐ ‐‐‐ ‐‐‐ ‐‐‐ ‐‐‐2002 ‐‐‐ ‐‐‐ ‐‐‐ ‐‐‐ ‐‐‐ ‐‐‐ ‐‐‐ ‐‐‐2003 ‐‐‐ ‐‐‐ ‐‐‐ ‐‐‐ ‐‐‐ ‐‐‐ ‐‐‐ ‐‐‐2004 ‐‐‐ ‐‐‐ ‐‐‐ ‐‐‐ ‐‐‐ ‐‐‐ ‐‐‐ ‐‐‐2005 ‐‐‐ ‐‐‐ ‐‐‐ ‐‐‐ ‐‐‐ ‐‐‐ ‐‐‐ ‐‐‐2006 ‐‐‐ ‐‐‐ ‐‐‐ ‐‐‐ ‐‐‐ ‐‐‐ ‐‐‐ ‐‐‐2007 ‐‐‐ ‐‐‐ ‐‐‐ ‐‐‐ ‐‐‐ ‐‐‐ ‐‐‐ ‐‐‐2008 ‐‐‐ ‐‐‐ ‐‐‐ ‐‐‐ ‐‐‐ ‐‐‐ ‐‐‐ ‐‐‐2009 ‐‐‐ ‐‐‐ ‐‐‐ ‐‐‐ ‐‐‐ ‐‐‐ ‐‐‐ ‐‐‐
Continued on Next Page

USDA, NASS, California Field Office 54 California Agricultural Statistics, 2009
Non‐Citrus Fruit Utilized Production and Average Grower Return, 2000‐2009 1/
Crop Crop Year
Utilized Production
Fresh Market
Processing
Total CannedQuantity Value Quantity Value Quantity Value
Tons Tons $/Ton Tons $/Ton Tons $/Ton
Figs 3/ 2000 55,900 4,000 ‐‐‐ 51,900 ‐‐‐ ‐‐‐ ‐‐‐2001 41,000 2,000 ‐‐‐ 39,000 ‐‐‐ ‐‐‐ ‐‐‐2002 53,200 2,250 ‐‐‐ 50,950 ‐‐‐ ‐‐‐ ‐‐‐2003 48,500 2,900 ‐‐‐ 45,600 ‐‐‐ ‐‐‐ ‐‐‐2004 51,100 4,300 ‐‐‐ 46,800 ‐‐‐ ‐‐‐ ‐‐‐2005 49,000 3,700 ‐‐‐ 45,300 ‐‐‐ ‐‐‐ ‐‐‐2006 42,800 3,800 ‐‐‐ 39,000 ‐‐‐ ‐‐‐ ‐‐‐2007 47,800 4,300 ‐‐‐ 43,500 ‐‐‐ ‐‐‐ ‐‐‐2008 43,300 4,000 ‐‐‐ 39,300 ‐‐‐ ‐‐‐ ‐‐‐2009 39,950 3,850 ‐‐‐ 36,100 ‐‐‐ ‐‐‐ ‐‐‐
Grapes, Raisin 4/ 2000 2,921,000 230,000 600.00 2,691,000 129.00 32,000 270.002001 2,215,000 217,000 680.00 1,998,000 132.00 29,000 270.002002 2,804,000 264,000 750.00 2,540,000 89.70 31,000 270.002003 2,199,000 172,000 760.00 2,027,000 120.00 27,000 280.002004 2,038,000 192,000 730.00 1,846,000 262.00 25,000 300.002005 2,285,000 213,000 808.00 2,072,000 205.00 ‐‐‐ ‐‐‐2006 1,833,000 151,000 902.00 1,682,000 221.00 21,000 303.002007 2,151,000 173,000 962.00 1,978,000 218.00 21,000 314.002008 2,520,000 163,000 718.00 2,357,000 234.00 25,000 323.002009 1,927,000 137,000 ‐‐‐ 1,790,000 244.00 20,000 337.00
Grapes, Table 2000 774,000 613,000 680.00 161,000 128.00 ‐‐‐ ‐‐‐2001 713,000 587,000 720.00 126,000 99.50 ‐‐‐ ‐‐‐2002 743,000 662,000 680.00 81,000 92.20 ‐‐‐ ‐‐‐2003 678,000 575,000 690.00 103,000 105.00 ‐‐‐ ‐‐‐2004 770,000 644,000 790.00 126,000 208.00 ‐‐‐ ‐‐‐2005 872,000 725,000 500.00 147,000 154.00 ‐‐‐ ‐‐‐2006 717,000 601,000 1,040.00 116,000 162.00 ‐‐‐ ‐‐‐2007 791,000 700,000 868.00 91,000 168.00 ‐‐‐ ‐‐‐2008 973,000 773,000 461.00 200,000 191.00 ‐‐‐ ‐‐‐2009 874,000 755,000 510.00 119,000 179.00 ‐‐‐ ‐‐‐
Grapes, Wine 2000 3,364,000 45,000 300.00 3,319,000 571.00 ‐‐‐ ‐‐‐2001 3,051,000 45,000 300.00 3,006,000 601.00 ‐‐‐ ‐‐‐2002 3,149,000 45,000 300.00 3,104,000 538.00 ‐‐‐ ‐‐‐2003 2,909,000 45,000 300.00 2,864,000 534.00 ‐‐‐ ‐‐‐2004 2,815,000 40,000 510.00 2,775,000 571.00 ‐‐‐ ‐‐‐2005 3,806,000 50,000 510.00 3,756,000 583.00 ‐‐‐ ‐‐‐2006 3,176,000 40,000 500.00 3,136,000 583.00 ‐‐‐ ‐‐‐2007 3,288,000 40,000 500.00 3,248,000 565.00 ‐‐‐ ‐‐‐2008 3,055,000 40,000 500.00 3,015,000 610.00 ‐‐‐ ‐‐‐2009 3,743,000 40,000 ‐‐‐ 3,703,000 612.00 ‐‐‐ ‐‐‐
Grapes, All 4/ 2000 7,059,000 888,000 640.00 6,171,000 367.00 32,000 270.002001 5,979,000 849,000 688.00 5,130,000 406.00 29,000 270.002002 6,696,000 971,000 681.00 5,725,000 333.00 31,000 270.002003 5,786,000 792,000 683.00 4,994,000 357.00 27,000 280.002004 5,623,000 876,000 764.00 4,747,000 441.00 25,000 300.002005 6,963,000 988,000 567.00 5,975,000 441.00 ‐‐‐ ‐‐‐2006 5,726,000 792,000 986.00 4,934,000 450.00 21,000 303.002007 6,230,000 913,000 870.00 5,317,000 429.00 21,000 314.002008 6,548,000 976,000 506.00 5,572,000 436.00 25,000 323.002009 6,544,000 932,000 583.00 5,612,000 485.00 20,000 337.00
Continued on Next Page
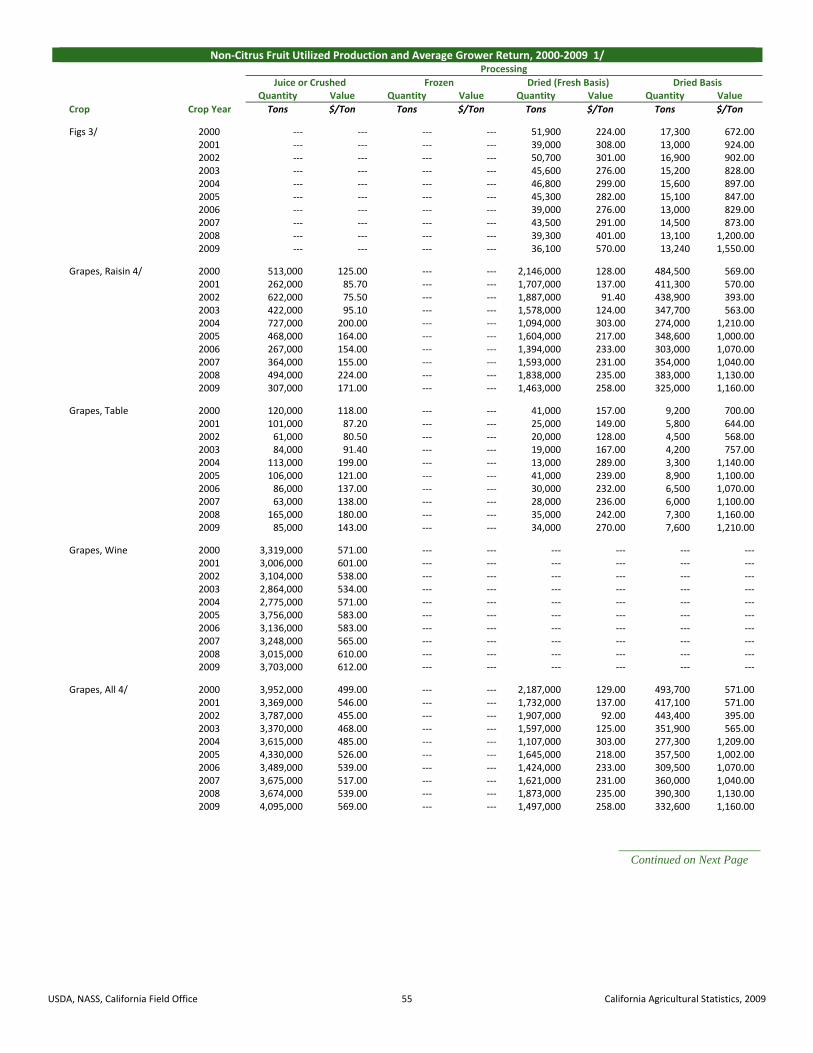
USDA, NASS, California Field Office 55 California Agricultural Statistics, 2009
Non‐Citrus Fruit Utilized Production and Average Grower Return, 2000‐2009 1/
Crop Crop Year
Processing
Juice or Crushed Frozen Dried (Fresh Basis) Dried BasisQuantity Value Quantity Value Quantity Value Quantity Value
Tons $/Ton Tons $/Ton Tons $/Ton Tons $/Ton
Figs 3/ 2000 ‐‐‐ ‐‐‐ ‐‐‐ ‐‐‐ 51,900 224.00 17,300 672.002001 ‐‐‐ ‐‐‐ ‐‐‐ ‐‐‐ 39,000 308.00 13,000 924.002002 ‐‐‐ ‐‐‐ ‐‐‐ ‐‐‐ 50,700 301.00 16,900 902.002003 ‐‐‐ ‐‐‐ ‐‐‐ ‐‐‐ 45,600 276.00 15,200 828.002004 ‐‐‐ ‐‐‐ ‐‐‐ ‐‐‐ 46,800 299.00 15,600 897.002005 ‐‐‐ ‐‐‐ ‐‐‐ ‐‐‐ 45,300 282.00 15,100 847.002006 ‐‐‐ ‐‐‐ ‐‐‐ ‐‐‐ 39,000 276.00 13,000 829.002007 ‐‐‐ ‐‐‐ ‐‐‐ ‐‐‐ 43,500 291.00 14,500 873.002008 ‐‐‐ ‐‐‐ ‐‐‐ ‐‐‐ 39,300 401.00 13,100 1,200.002009 ‐‐‐ ‐‐‐ ‐‐‐ ‐‐‐ 36,100 570.00 13,240 1,550.00
Grapes, Raisin 4/ 2000 513,000 125.00 ‐‐‐ ‐‐‐ 2,146,000 128.00 484,500 569.002001 262,000 85.70 ‐‐‐ ‐‐‐ 1,707,000 137.00 411,300 570.002002 622,000 75.50 ‐‐‐ ‐‐‐ 1,887,000 91.40 438,900 393.002003 422,000 95.10 ‐‐‐ ‐‐‐ 1,578,000 124.00 347,700 563.002004 727,000 200.00 ‐‐‐ ‐‐‐ 1,094,000 303.00 274,000 1,210.002005 468,000 164.00 ‐‐‐ ‐‐‐ 1,604,000 217.00 348,600 1,000.002006 267,000 154.00 ‐‐‐ ‐‐‐ 1,394,000 233.00 303,000 1,070.002007 364,000 155.00 ‐‐‐ ‐‐‐ 1,593,000 231.00 354,000 1,040.002008 494,000 224.00 ‐‐‐ ‐‐‐ 1,838,000 235.00 383,000 1,130.002009 307,000 171.00 ‐‐‐ ‐‐‐ 1,463,000 258.00 325,000 1,160.00
Grapes, Table 2000 120,000 118.00 ‐‐‐ ‐‐‐ 41,000 157.00 9,200 700.002001 101,000 87.20 ‐‐‐ ‐‐‐ 25,000 149.00 5,800 644.002002 61,000 80.50 ‐‐‐ ‐‐‐ 20,000 128.00 4,500 568.002003 84,000 91.40 ‐‐‐ ‐‐‐ 19,000 167.00 4,200 757.002004 113,000 199.00 ‐‐‐ ‐‐‐ 13,000 289.00 3,300 1,140.002005 106,000 121.00 ‐‐‐ ‐‐‐ 41,000 239.00 8,900 1,100.002006 86,000 137.00 ‐‐‐ ‐‐‐ 30,000 232.00 6,500 1,070.002007 63,000 138.00 ‐‐‐ ‐‐‐ 28,000 236.00 6,000 1,100.002008 165,000 180.00 ‐‐‐ ‐‐‐ 35,000 242.00 7,300 1,160.002009 85,000 143.00 ‐‐‐ ‐‐‐ 34,000 270.00 7,600 1,210.00
Grapes, Wine 2000 3,319,000 571.00 ‐‐‐ ‐‐‐ ‐‐‐ ‐‐‐ ‐‐‐ ‐‐‐2001 3,006,000 601.00 ‐‐‐ ‐‐‐ ‐‐‐ ‐‐‐ ‐‐‐ ‐‐‐2002 3,104,000 538.00 ‐‐‐ ‐‐‐ ‐‐‐ ‐‐‐ ‐‐‐ ‐‐‐2003 2,864,000 534.00 ‐‐‐ ‐‐‐ ‐‐‐ ‐‐‐ ‐‐‐ ‐‐‐2004 2,775,000 571.00 ‐‐‐ ‐‐‐ ‐‐‐ ‐‐‐ ‐‐‐ ‐‐‐2005 3,756,000 583.00 ‐‐‐ ‐‐‐ ‐‐‐ ‐‐‐ ‐‐‐ ‐‐‐2006 3,136,000 583.00 ‐‐‐ ‐‐‐ ‐‐‐ ‐‐‐ ‐‐‐ ‐‐‐2007 3,248,000 565.00 ‐‐‐ ‐‐‐ ‐‐‐ ‐‐‐ ‐‐‐ ‐‐‐2008 3,015,000 610.00 ‐‐‐ ‐‐‐ ‐‐‐ ‐‐‐ ‐‐‐ ‐‐‐2009 3,703,000 612.00 ‐‐‐ ‐‐‐ ‐‐‐ ‐‐‐ ‐‐‐ ‐‐‐
Grapes, All 4/ 2000 3,952,000 499.00 ‐‐‐ ‐‐‐ 2,187,000 129.00 493,700 571.002001 3,369,000 546.00 ‐‐‐ ‐‐‐ 1,732,000 137.00 417,100 571.002002 3,787,000 455.00 ‐‐‐ ‐‐‐ 1,907,000 92.00 443,400 395.002003 3,370,000 468.00 ‐‐‐ ‐‐‐ 1,597,000 125.00 351,900 565.002004 3,615,000 485.00 ‐‐‐ ‐‐‐ 1,107,000 303.00 277,300 1,209.002005 4,330,000 526.00 ‐‐‐ ‐‐‐ 1,645,000 218.00 357,500 1,002.002006 3,489,000 539.00 ‐‐‐ ‐‐‐ 1,424,000 233.00 309,500 1,070.002007 3,675,000 517.00 ‐‐‐ ‐‐‐ 1,621,000 231.00 360,000 1,040.002008 3,674,000 539.00 ‐‐‐ ‐‐‐ 1,873,000 235.00 390,300 1,130.002009 4,095,000 569.00 ‐‐‐ ‐‐‐ 1,497,000 258.00 332,600 1,160.00
Continued on Next Page

USDA, NASS, California Field Office 56 California Agricultural Statistics, 2009
Non‐Citrus Fruit Utilized Production and Average Grower Return, 2000‐2009 1/
Crop Crop Year
Utilized Production
Fresh Market
Processing
Total CannedQuantity Value Quantity Value Quantity Value
Tons Tons $/Ton Tons $/Ton Tons $/Ton
Kiwifruit 5/ 2000 30,500 28,500 ‐‐‐ 2,000 ‐‐‐ ‐‐‐ ‐‐‐2001 23,000 22,200 ‐‐‐ 800 ‐‐‐ ‐‐‐ ‐‐‐2002 23,100 22,300 ‐‐‐ 800 ‐‐‐ ‐‐‐ ‐‐‐2003 24,000 22,000 ‐‐‐ 2,000 ‐‐‐ ‐‐‐ ‐‐‐2004 24,700 22,500 ‐‐‐ 2,200 ‐‐‐ ‐‐‐ ‐‐‐2005 36,200 34,200 ‐‐‐ 2,000 ‐‐‐ ‐‐‐ ‐‐‐2006 25,400 23,400 ‐‐‐ 2,000 ‐‐‐ ‐‐‐ ‐‐‐2007 23,700 21,700 ‐‐‐ 2,000 ‐‐‐ ‐‐‐ ‐‐‐2008 22,000 20,100 ‐‐‐ 1,900 ‐‐‐ ‐‐‐ ‐‐‐2009 23,900 23,200 ‐‐‐ 700 ‐‐‐ ‐‐‐ ‐‐‐
Nectarines 3/ 2000 267,000 260,700 ‐‐‐ 6,300 ‐‐‐ ‐‐‐ ‐‐‐2001 275,000 265,400 ‐‐‐ 9,600 ‐‐‐ ‐‐‐ ‐‐‐2002 300,000 300,000 382.00 ‐‐‐ ‐‐‐ ‐‐‐ ‐‐‐2003 273,000 273,000 436.00 ‐‐‐ ‐‐‐ ‐‐‐ ‐‐‐2004 252,000 252,000 342.00 ‐‐‐ ‐‐‐ ‐‐‐ ‐‐‐2005 239,000 239,000 504.00 ‐‐‐ ‐‐‐ ‐‐‐ ‐‐‐2006 218,000 218,000 517.00 ‐‐‐ ‐‐‐ ‐‐‐ ‐‐‐2007 269,000 269,000 331.00 ‐‐‐ ‐‐‐ ‐‐‐ ‐‐‐2008 295,000 295,000 365.00 ‐‐‐ ‐‐‐ ‐‐‐ ‐‐‐2009 210,000 210,000 637.00 ‐‐‐ ‐‐‐ ‐‐‐ ‐‐‐
Olives 2000 53,000 500 500.00 52,500 657.00 41,400 769.002001 134,000 500 500.00 133,500 673.00 109,700 770.002002 103,000 500 500.00 102,500 573.00 82,800 662.002003 118,000 500 500.00 117,500 409.00 96,000 458.002004 107,500 500 500.00 107,000 564.00 74,400 701.002005 142,000 500 500.00 141,500 564.00 100,000 667.002006 23,500 500 500.00 23,000 777.00 17,000 926.002007 132,500 500 500.00 132,000 655.00 96,000 700.002008 66,800 ‐‐‐ ‐‐‐ 66,800 697.00 45,500 767.002009 46,300 ‐‐‐ ‐‐‐ 46,300 696.00 24,500 855.00
Peaches, Clingstone 2000 508,500 ‐‐‐ ‐‐‐ 508,500 250.00 486,950 251.002001 451,000 ‐‐‐ ‐‐‐ 451,000 244.00 435,100 244.002002 537,000 ‐‐‐ ‐‐‐ 537,000 247.00 511,500 244.002003 505,500 ‐‐‐ ‐‐‐ 505,500 215.00 478,500 217.002004 539,000 ‐‐‐ ‐‐‐ 539,000 263.00 505,000 270.002005 484,000 ‐‐‐ ‐‐‐ 484,000 254.00 459,000 256.002006 359,000 ‐‐‐ ‐‐‐ 359,000 292.00 344,000 295.002007 503,000 ‐‐‐ ‐‐‐ 503,000 304.00 466,000 308.002008 426,000 ‐‐‐ ‐‐‐ 426,000 347.00 407,000 351.002009 469,000 ‐‐‐ ‐‐‐ 469,000 338.00 449,000 340.00
Peaches, Freestone 6/ 2000 395,500 269,000 380.00 126,500 187.00 ‐‐‐ ‐‐‐2001 387,500 269,000 428.00 118,500 200.00 ‐‐‐ ‐‐‐2002 398,000 277,850 418.00 120,150 203.00 ‐‐‐ ‐‐‐2003 413,000 282,300 406.00 130,700 196.00 ‐‐‐ ‐‐‐2004 390,000 259,000 341.00 131,000 175.00 ‐‐‐ ‐‐‐2005 385,000 252,000 540.00 133,000 169.00 ‐‐‐ ‐‐‐2006 353,000 242,000 597.00 111,000 205.00 ‐‐‐ ‐‐‐2007 446,000 297,000 498.00 149,000 224.00 ‐‐‐ ‐‐‐2008 433,000 299,000 395.00 134,000 226.00 ‐‐‐ ‐‐‐2009 350,000 261,000 563.00 89,000 252.00 ‐‐‐ ‐‐‐
Continued on Next Page

USDA, NASS, California Field Office 57 California Agricultural Statistics, 2009
Non‐Citrus Fruit Utilized Production and Average Grower Return, 2000‐2009 1/
Crop Crop Year
Processing
Juice or Crushed Frozen Dried (Fresh Basis) Dried BasisQuantity Value Quantity Value Quantity Value Quantity Value
Tons $/Ton Tons $/Ton Tons $/Ton Tons $/Ton
Kiwifruit 5/ 2000 ‐‐‐ ‐‐‐ ‐‐‐ ‐‐‐ ‐‐‐ ‐‐‐ ‐‐‐ ‐‐‐2001 ‐‐‐ ‐‐‐ ‐‐‐ ‐‐‐ ‐‐‐ ‐‐‐ ‐‐‐ ‐‐‐2002 ‐‐‐ ‐‐‐ ‐‐‐ ‐‐‐ ‐‐‐ ‐‐‐ ‐‐‐ ‐‐‐2003 ‐‐‐ ‐‐‐ ‐‐‐ ‐‐‐ ‐‐‐ ‐‐‐ ‐‐‐ ‐‐‐2004 ‐‐‐ ‐‐‐ ‐‐‐ ‐‐‐ ‐‐‐ ‐‐‐ ‐‐‐ ‐‐‐2005 ‐‐‐ ‐‐‐ ‐‐‐ ‐‐‐ ‐‐‐ ‐‐‐ ‐‐‐ ‐‐‐2006 ‐‐‐ ‐‐‐ ‐‐‐ ‐‐‐ ‐‐‐ ‐‐‐ ‐‐‐ ‐‐‐2007 ‐‐‐ ‐‐‐ ‐‐‐ ‐‐‐ ‐‐‐ ‐‐‐ ‐‐‐ ‐‐‐2008 ‐‐‐ ‐‐‐ ‐‐‐ ‐‐‐ ‐‐‐ ‐‐‐ ‐‐‐ ‐‐‐2009 ‐‐‐ ‐‐‐ ‐‐‐ ‐‐‐ ‐‐‐ ‐‐‐ ‐‐‐ ‐‐‐
Nectarines 3/ 2000 ‐‐‐ ‐‐‐ ‐‐‐ ‐‐‐ ‐‐‐ ‐‐‐ ‐‐‐ ‐‐‐2001 ‐‐‐ ‐‐‐ ‐‐‐ ‐‐‐ ‐‐‐ ‐‐‐ ‐‐‐ ‐‐‐2002 ‐‐‐ ‐‐‐ ‐‐‐ ‐‐‐ ‐‐‐ ‐‐‐ ‐‐‐ ‐‐‐2003 ‐‐‐ ‐‐‐ ‐‐‐ ‐‐‐ ‐‐‐ ‐‐‐ ‐‐‐ ‐‐‐2004 ‐‐‐ ‐‐‐ ‐‐‐ ‐‐‐ ‐‐‐ ‐‐‐ ‐‐‐ ‐‐‐2005 ‐‐‐ ‐‐‐ ‐‐‐ ‐‐‐ ‐‐‐ ‐‐‐ ‐‐‐ ‐‐‐2006 ‐‐‐ ‐‐‐ ‐‐‐ ‐‐‐ ‐‐‐ ‐‐‐ ‐‐‐ ‐‐‐2007 ‐‐‐ ‐‐‐ ‐‐‐ ‐‐‐ ‐‐‐ ‐‐‐ ‐‐‐ ‐‐‐2008 ‐‐‐ ‐‐‐ ‐‐‐ ‐‐‐ ‐‐‐ ‐‐‐ ‐‐‐ ‐‐‐2009 ‐‐‐ ‐‐‐ ‐‐‐ ‐‐‐ ‐‐‐ ‐‐‐ ‐‐‐ ‐‐‐
Limited UndersizeOlives 2000 3,000 300.00 5,100 333.00 3,000 11.00 ‐‐‐ ‐‐‐
2001 3,000 300.00 15,300 287.00 5,500 6.00 ‐‐‐ ‐‐‐2002 6,000 240.00 9,900 249.00 3,800 8.00 ‐‐‐ ‐‐‐2003 7,500 238.00 10,500 215.00 3,500 8.00 ‐‐‐ ‐‐‐2004 11,500 361.00 16,100 252.00 5,000 6.00 ‐‐‐ ‐‐‐2005 14,000 526.00 21,200 271.00 6,300 6.00 ‐‐‐ ‐‐‐2006 4,000 405.00 1,500 335.00 500 7.00 ‐‐‐ ‐‐‐2007 12,000 775.00 20,000 496.00 4,000 6.00 ‐‐‐ ‐‐‐2008 14,000 670.00 6,000 382.00 1,300 12.00 ‐‐‐ ‐‐‐2009 20,000 540.00 1,500 306.00 300 8.00 ‐‐‐ ‐‐‐
Peaches, Clingstone 2000 ‐‐‐ ‐‐‐ ‐‐‐ ‐‐‐ ‐‐‐ ‐‐‐ ‐‐‐ ‐‐‐2001 ‐‐‐ ‐‐‐ ‐‐‐ ‐‐‐ ‐‐‐ ‐‐‐ ‐‐‐ ‐‐‐2002 ‐‐‐ ‐‐‐ ‐‐‐ ‐‐‐ ‐‐‐ ‐‐‐ ‐‐‐ ‐‐‐2003 ‐‐‐ ‐‐‐ ‐‐‐ ‐‐‐ ‐‐‐ ‐‐‐ ‐‐‐ ‐‐‐2004 ‐‐‐ ‐‐‐ ‐‐‐ ‐‐‐ ‐‐‐ ‐‐‐ ‐‐‐ ‐‐‐2005 ‐‐‐ ‐‐‐ ‐‐‐ ‐‐‐ ‐‐‐ ‐‐‐ ‐‐‐ ‐‐‐2006 ‐‐‐ ‐‐‐ ‐‐‐ ‐‐‐ ‐‐‐ ‐‐‐ ‐‐‐ ‐‐‐2007 ‐‐‐ ‐‐‐ ‐‐‐ ‐‐‐ ‐‐‐ ‐‐‐ ‐‐‐ ‐‐‐2008 ‐‐‐ ‐‐‐ ‐‐‐ ‐‐‐ ‐‐‐ ‐‐‐ ‐‐‐ ‐‐‐2009 ‐‐‐ ‐‐‐ ‐‐‐ ‐‐‐ ‐‐‐ ‐‐‐ ‐‐‐ ‐‐‐
Peaches, Freestone 6/ 2000 ‐‐‐ ‐‐‐ 92,650 200.00 12,600 78.00 1,350 728.002001 ‐‐‐ ‐‐‐ 86,000 214.00 14,600 51.00 1,450 514.002002 ‐‐‐ ‐‐‐ 91,100 205.00 14,200 49.00 1,525 456.002003 ‐‐‐ ‐‐‐ 95,950 211.00 10,150 47.00 1,070 446.002004 ‐‐‐ ‐‐‐ 86,600 211.00 10,400 32.00 870 382.002005 ‐‐‐ ‐‐‐ 82,800 202.00 12,700 46.00 1,160 504.002006 ‐‐‐ ‐‐‐ 84,100 209.00 13,100 79.00 1,290 802.002007 ‐‐‐ ‐‐‐ 107,900 249.00 12,700 57.00 1,365 530.002008 ‐‐‐ ‐‐‐ 95,100 251.00 9,500 50.00 1,050 452.002009 ‐‐‐ ‐‐‐ 70,300 255.00 7,100 43.00 850 359.00
Continued on Next Page
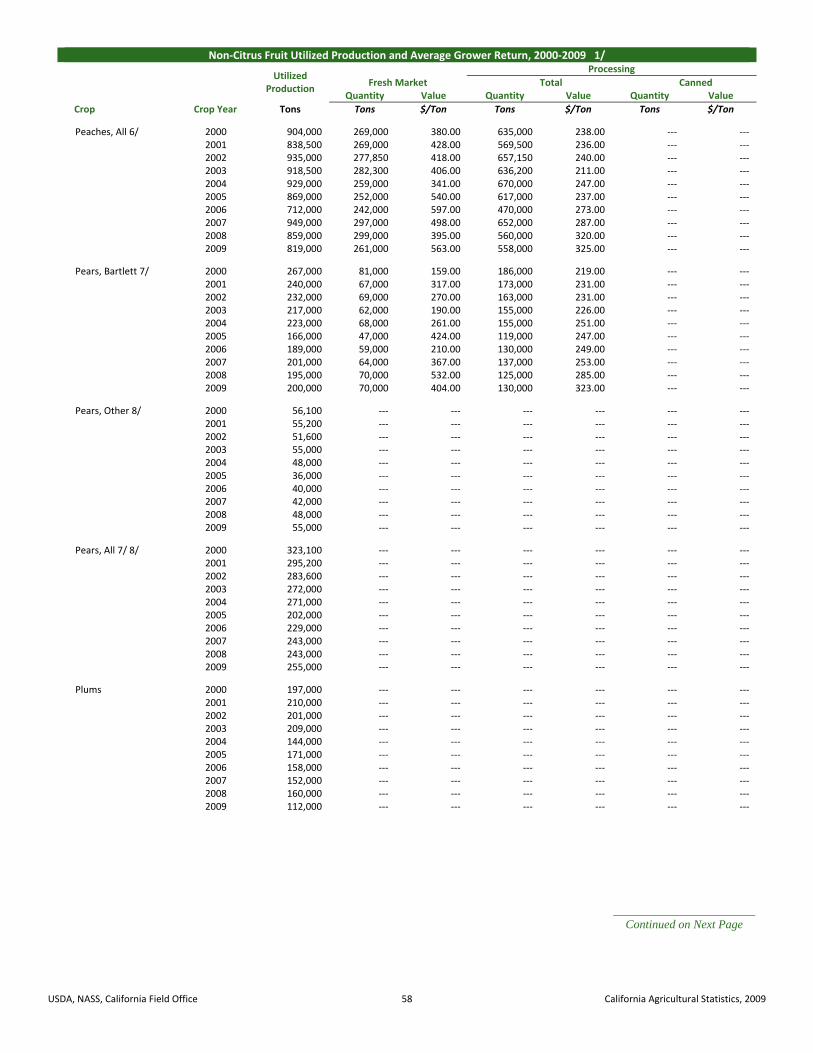
USDA, NASS, California Field Office 58 California Agricultural Statistics, 2009
Non‐Citrus Fruit Utilized Production and Average Grower Return, 2000‐2009 1/
Crop Crop Year
Utilized Production
Fresh Market
Processing
Total CannedQuantity Value Quantity Value Quantity Value
Tons Tons $/Ton Tons $/Ton Tons $/Ton
Peaches, All 6/ 2000 904,000 269,000 380.00 635,000 238.00 ‐‐‐ ‐‐‐2001 838,500 269,000 428.00 569,500 236.00 ‐‐‐ ‐‐‐2002 935,000 277,850 418.00 657,150 240.00 ‐‐‐ ‐‐‐2003 918,500 282,300 406.00 636,200 211.00 ‐‐‐ ‐‐‐2004 929,000 259,000 341.00 670,000 247.00 ‐‐‐ ‐‐‐2005 869,000 252,000 540.00 617,000 237.00 ‐‐‐ ‐‐‐2006 712,000 242,000 597.00 470,000 273.00 ‐‐‐ ‐‐‐2007 949,000 297,000 498.00 652,000 287.00 ‐‐‐ ‐‐‐2008 859,000 299,000 395.00 560,000 320.00 ‐‐‐ ‐‐‐2009 819,000 261,000 563.00 558,000 325.00 ‐‐‐ ‐‐‐
Pears, Bartlett 7/ 2000 267,000 81,000 159.00 186,000 219.00 ‐‐‐ ‐‐‐2001 240,000 67,000 317.00 173,000 231.00 ‐‐‐ ‐‐‐2002 232,000 69,000 270.00 163,000 231.00 ‐‐‐ ‐‐‐2003 217,000 62,000 190.00 155,000 226.00 ‐‐‐ ‐‐‐2004 223,000 68,000 261.00 155,000 251.00 ‐‐‐ ‐‐‐2005 166,000 47,000 424.00 119,000 247.00 ‐‐‐ ‐‐‐2006 189,000 59,000 210.00 130,000 249.00 ‐‐‐ ‐‐‐2007 201,000 64,000 367.00 137,000 253.00 ‐‐‐ ‐‐‐2008 195,000 70,000 532.00 125,000 285.00 ‐‐‐ ‐‐‐2009 200,000 70,000 404.00 130,000 323.00 ‐‐‐ ‐‐‐
Pears, Other 8/ 2000 56,100 ‐‐‐ ‐‐‐ ‐‐‐ ‐‐‐ ‐‐‐ ‐‐‐2001 55,200 ‐‐‐ ‐‐‐ ‐‐‐ ‐‐‐ ‐‐‐ ‐‐‐2002 51,600 ‐‐‐ ‐‐‐ ‐‐‐ ‐‐‐ ‐‐‐ ‐‐‐2003 55,000 ‐‐‐ ‐‐‐ ‐‐‐ ‐‐‐ ‐‐‐ ‐‐‐2004 48,000 ‐‐‐ ‐‐‐ ‐‐‐ ‐‐‐ ‐‐‐ ‐‐‐2005 36,000 ‐‐‐ ‐‐‐ ‐‐‐ ‐‐‐ ‐‐‐ ‐‐‐2006 40,000 ‐‐‐ ‐‐‐ ‐‐‐ ‐‐‐ ‐‐‐ ‐‐‐2007 42,000 ‐‐‐ ‐‐‐ ‐‐‐ ‐‐‐ ‐‐‐ ‐‐‐2008 48,000 ‐‐‐ ‐‐‐ ‐‐‐ ‐‐‐ ‐‐‐ ‐‐‐2009 55,000 ‐‐‐ ‐‐‐ ‐‐‐ ‐‐‐ ‐‐‐ ‐‐‐
Pears, All 7/ 8/ 2000 323,100 ‐‐‐ ‐‐‐ ‐‐‐ ‐‐‐ ‐‐‐ ‐‐‐2001 295,200 ‐‐‐ ‐‐‐ ‐‐‐ ‐‐‐ ‐‐‐ ‐‐‐2002 283,600 ‐‐‐ ‐‐‐ ‐‐‐ ‐‐‐ ‐‐‐ ‐‐‐2003 272,000 ‐‐‐ ‐‐‐ ‐‐‐ ‐‐‐ ‐‐‐ ‐‐‐2004 271,000 ‐‐‐ ‐‐‐ ‐‐‐ ‐‐‐ ‐‐‐ ‐‐‐2005 202,000 ‐‐‐ ‐‐‐ ‐‐‐ ‐‐‐ ‐‐‐ ‐‐‐2006 229,000 ‐‐‐ ‐‐‐ ‐‐‐ ‐‐‐ ‐‐‐ ‐‐‐2007 243,000 ‐‐‐ ‐‐‐ ‐‐‐ ‐‐‐ ‐‐‐ ‐‐‐2008 243,000 ‐‐‐ ‐‐‐ ‐‐‐ ‐‐‐ ‐‐‐ ‐‐‐2009 255,000 ‐‐‐ ‐‐‐ ‐‐‐ ‐‐‐ ‐‐‐ ‐‐‐
Plums 2000 197,000 ‐‐‐ ‐‐‐ ‐‐‐ ‐‐‐ ‐‐‐ ‐‐‐2001 210,000 ‐‐‐ ‐‐‐ ‐‐‐ ‐‐‐ ‐‐‐ ‐‐‐2002 201,000 ‐‐‐ ‐‐‐ ‐‐‐ ‐‐‐ ‐‐‐ ‐‐‐2003 209,000 ‐‐‐ ‐‐‐ ‐‐‐ ‐‐‐ ‐‐‐ ‐‐‐2004 144,000 ‐‐‐ ‐‐‐ ‐‐‐ ‐‐‐ ‐‐‐ ‐‐‐2005 171,000 ‐‐‐ ‐‐‐ ‐‐‐ ‐‐‐ ‐‐‐ ‐‐‐2006 158,000 ‐‐‐ ‐‐‐ ‐‐‐ ‐‐‐ ‐‐‐ ‐‐‐2007 152,000 ‐‐‐ ‐‐‐ ‐‐‐ ‐‐‐ ‐‐‐ ‐‐‐2008 160,000 ‐‐‐ ‐‐‐ ‐‐‐ ‐‐‐ ‐‐‐ ‐‐‐2009 112,000 ‐‐‐ ‐‐‐ ‐‐‐ ‐‐‐ ‐‐‐ ‐‐‐
Continued on Next Page
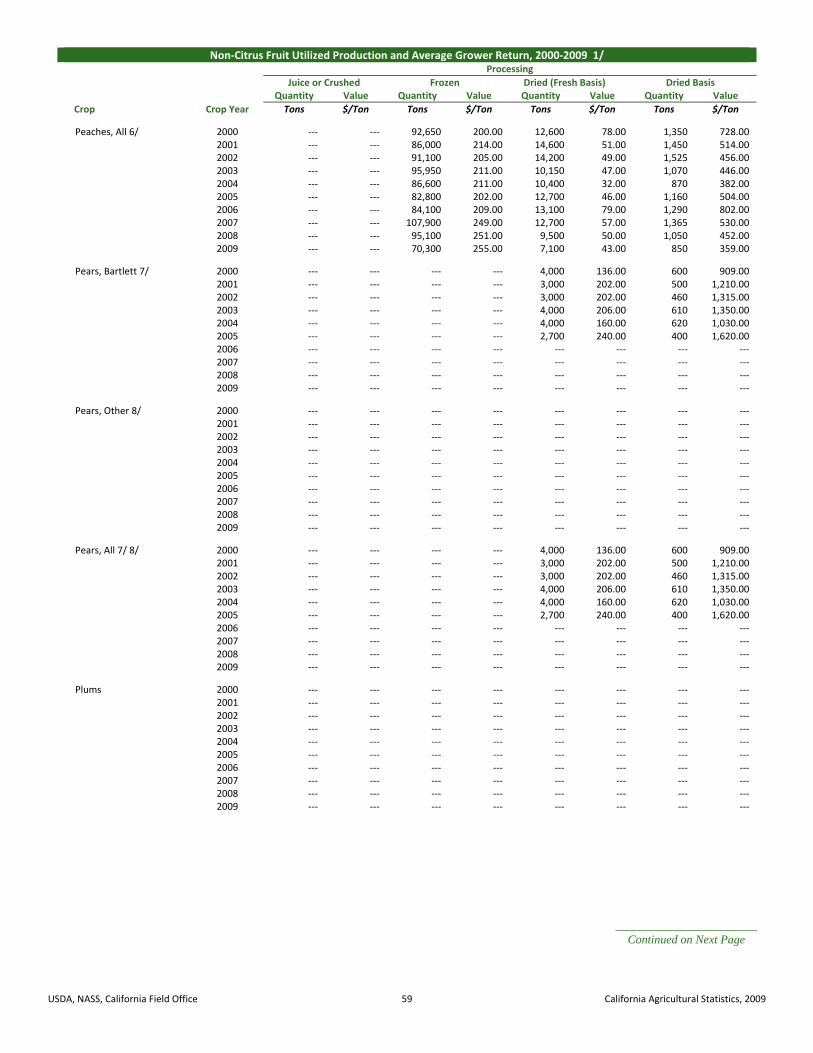
USDA, NASS, California Field Office 59 California Agricultural Statistics, 2009
Non‐Citrus Fruit Utilized Production and Average Grower Return, 2000‐2009 1/
Crop Crop Year
Processing
Juice or Crushed Frozen Dried (Fresh Basis) Dried BasisQuantity Value Quantity Value Quantity Value Quantity Value
Tons $/Ton Tons $/Ton Tons $/Ton Tons $/Ton
Peaches, All 6/ 2000 ‐‐‐ ‐‐‐ 92,650 200.00 12,600 78.00 1,350 728.002001 ‐‐‐ ‐‐‐ 86,000 214.00 14,600 51.00 1,450 514.002002 ‐‐‐ ‐‐‐ 91,100 205.00 14,200 49.00 1,525 456.002003 ‐‐‐ ‐‐‐ 95,950 211.00 10,150 47.00 1,070 446.002004 ‐‐‐ ‐‐‐ 86,600 211.00 10,400 32.00 870 382.002005 ‐‐‐ ‐‐‐ 82,800 202.00 12,700 46.00 1,160 504.002006 ‐‐‐ ‐‐‐ 84,100 209.00 13,100 79.00 1,290 802.002007 ‐‐‐ ‐‐‐ 107,900 249.00 12,700 57.00 1,365 530.002008 ‐‐‐ ‐‐‐ 95,100 251.00 9,500 50.00 1,050 452.002009 ‐‐‐ ‐‐‐ 70,300 255.00 7,100 43.00 850 359.00
Pears, Bartlett 7/ 2000 ‐‐‐ ‐‐‐ ‐‐‐ ‐‐‐ 4,000 136.00 600 909.002001 ‐‐‐ ‐‐‐ ‐‐‐ ‐‐‐ 3,000 202.00 500 1,210.002002 ‐‐‐ ‐‐‐ ‐‐‐ ‐‐‐ 3,000 202.00 460 1,315.002003 ‐‐‐ ‐‐‐ ‐‐‐ ‐‐‐ 4,000 206.00 610 1,350.002004 ‐‐‐ ‐‐‐ ‐‐‐ ‐‐‐ 4,000 160.00 620 1,030.002005 ‐‐‐ ‐‐‐ ‐‐‐ ‐‐‐ 2,700 240.00 400 1,620.002006 ‐‐‐ ‐‐‐ ‐‐‐ ‐‐‐ ‐‐‐ ‐‐‐ ‐‐‐ ‐‐‐2007 ‐‐‐ ‐‐‐ ‐‐‐ ‐‐‐ ‐‐‐ ‐‐‐ ‐‐‐ ‐‐‐2008 ‐‐‐ ‐‐‐ ‐‐‐ ‐‐‐ ‐‐‐ ‐‐‐ ‐‐‐ ‐‐‐2009 ‐‐‐ ‐‐‐ ‐‐‐ ‐‐‐ ‐‐‐ ‐‐‐ ‐‐‐ ‐‐‐
Pears, Other 8/ 2000 ‐‐‐ ‐‐‐ ‐‐‐ ‐‐‐ ‐‐‐ ‐‐‐ ‐‐‐ ‐‐‐2001 ‐‐‐ ‐‐‐ ‐‐‐ ‐‐‐ ‐‐‐ ‐‐‐ ‐‐‐ ‐‐‐2002 ‐‐‐ ‐‐‐ ‐‐‐ ‐‐‐ ‐‐‐ ‐‐‐ ‐‐‐ ‐‐‐2003 ‐‐‐ ‐‐‐ ‐‐‐ ‐‐‐ ‐‐‐ ‐‐‐ ‐‐‐ ‐‐‐2004 ‐‐‐ ‐‐‐ ‐‐‐ ‐‐‐ ‐‐‐ ‐‐‐ ‐‐‐ ‐‐‐2005 ‐‐‐ ‐‐‐ ‐‐‐ ‐‐‐ ‐‐‐ ‐‐‐ ‐‐‐ ‐‐‐2006 ‐‐‐ ‐‐‐ ‐‐‐ ‐‐‐ ‐‐‐ ‐‐‐ ‐‐‐ ‐‐‐2007 ‐‐‐ ‐‐‐ ‐‐‐ ‐‐‐ ‐‐‐ ‐‐‐ ‐‐‐ ‐‐‐2008 ‐‐‐ ‐‐‐ ‐‐‐ ‐‐‐ ‐‐‐ ‐‐‐ ‐‐‐ ‐‐‐2009 ‐‐‐ ‐‐‐ ‐‐‐ ‐‐‐ ‐‐‐ ‐‐‐ ‐‐‐ ‐‐‐
Pears, All 7/ 8/ 2000 ‐‐‐ ‐‐‐ ‐‐‐ ‐‐‐ 4,000 136.00 600 909.002001 ‐‐‐ ‐‐‐ ‐‐‐ ‐‐‐ 3,000 202.00 500 1,210.002002 ‐‐‐ ‐‐‐ ‐‐‐ ‐‐‐ 3,000 202.00 460 1,315.002003 ‐‐‐ ‐‐‐ ‐‐‐ ‐‐‐ 4,000 206.00 610 1,350.002004 ‐‐‐ ‐‐‐ ‐‐‐ ‐‐‐ 4,000 160.00 620 1,030.002005 ‐‐‐ ‐‐‐ ‐‐‐ ‐‐‐ 2,700 240.00 400 1,620.002006 ‐‐‐ ‐‐‐ ‐‐‐ ‐‐‐ ‐‐‐ ‐‐‐ ‐‐‐ ‐‐‐2007 ‐‐‐ ‐‐‐ ‐‐‐ ‐‐‐ ‐‐‐ ‐‐‐ ‐‐‐ ‐‐‐2008 ‐‐‐ ‐‐‐ ‐‐‐ ‐‐‐ ‐‐‐ ‐‐‐ ‐‐‐ ‐‐‐2009 ‐‐‐ ‐‐‐ ‐‐‐ ‐‐‐ ‐‐‐ ‐‐‐ ‐‐‐ ‐‐‐
Plums 2000 ‐‐‐ ‐‐‐ ‐‐‐ ‐‐‐ ‐‐‐ ‐‐‐ ‐‐‐ ‐‐‐2001 ‐‐‐ ‐‐‐ ‐‐‐ ‐‐‐ ‐‐‐ ‐‐‐ ‐‐‐ ‐‐‐2002 ‐‐‐ ‐‐‐ ‐‐‐ ‐‐‐ ‐‐‐ ‐‐‐ ‐‐‐ ‐‐‐2003 ‐‐‐ ‐‐‐ ‐‐‐ ‐‐‐ ‐‐‐ ‐‐‐ ‐‐‐ ‐‐‐2004 ‐‐‐ ‐‐‐ ‐‐‐ ‐‐‐ ‐‐‐ ‐‐‐ ‐‐‐ ‐‐‐2005 ‐‐‐ ‐‐‐ ‐‐‐ ‐‐‐ ‐‐‐ ‐‐‐ ‐‐‐ ‐‐‐2006 ‐‐‐ ‐‐‐ ‐‐‐ ‐‐‐ ‐‐‐ ‐‐‐ ‐‐‐ ‐‐‐2007 ‐‐‐ ‐‐‐ ‐‐‐ ‐‐‐ ‐‐‐ ‐‐‐ ‐‐‐ ‐‐‐2008 ‐‐‐ ‐‐‐ ‐‐‐ ‐‐‐ ‐‐‐ ‐‐‐ ‐‐‐ ‐‐‐2009 ‐‐‐ ‐‐‐ ‐‐‐ ‐‐‐ ‐‐‐ ‐‐‐ ‐‐‐ ‐‐‐
Continued on Next Page

USDA, NASS, California Field Office 60 California Agricultural Statistics, 2009
Non‐Citrus Fruit Utilized Production and Average Grower Return, 2000‐2009 1/
Crop Crop Year
Utilized Production
Fresh Market
Processing
Total CannedQuantity Value Quantity Value Quantity Value
Tons Tons $/Ton Tons $/Ton Tons $/Ton
Plums, Dried 2000 201,000 ‐‐‐ ‐‐‐ 201,000 770.00 ‐‐‐ ‐‐‐2001 135,000 ‐‐‐ ‐‐‐ 135,000 726.00 ‐‐‐ ‐‐‐2002 163,000 ‐‐‐ ‐‐‐ 163,000 810.00 ‐‐‐ ‐‐‐2003 168,000 ‐‐‐ ‐‐‐ 168,000 772.00 ‐‐‐ ‐‐‐2004 48,000 ‐‐‐ ‐‐‐ 48,000 1,500.00 ‐‐‐ ‐‐‐2005 94,000 ‐‐‐ ‐‐‐ 94,000 1,470.00 ‐‐‐ ‐‐‐2006 189,000 ‐‐‐ ‐‐‐ 189,000 1,390.00 ‐‐‐ ‐‐‐2007 81,000 ‐‐‐ ‐‐‐ 81,000 1,450.00 ‐‐‐ ‐‐‐2008 129,000 ‐‐‐ ‐‐‐ 129,000 1,500.00 ‐‐‐ ‐‐‐2009 166,000 ‐‐‐ ‐‐‐ 166,000 1,200.00 ‐‐‐ ‐‐‐
1/ Missing data not published to avoid possible disclosure of individual operations.2/ Total processed includes canned, frozen, juice, and brined.3/ Small quantities processed included in fresh to avoid possible disclosure.4/ Includes substandard raisins diverted to other uses. 5/ Processed and fresh fruit price not published to avoid possible disclosure, but included in total utilized.6/ Quantity and value include dried, but price excludes dried.7/ Processed mostly canned, but includes small quantities dried and other uses not published separately to avoid possible disclosure. Data for 2006 and 2007 not published to avoid possible disclosure.8/ Processed mostly juice, but includes small quantities canned and other uses not published separately to avoid possible disclosure.
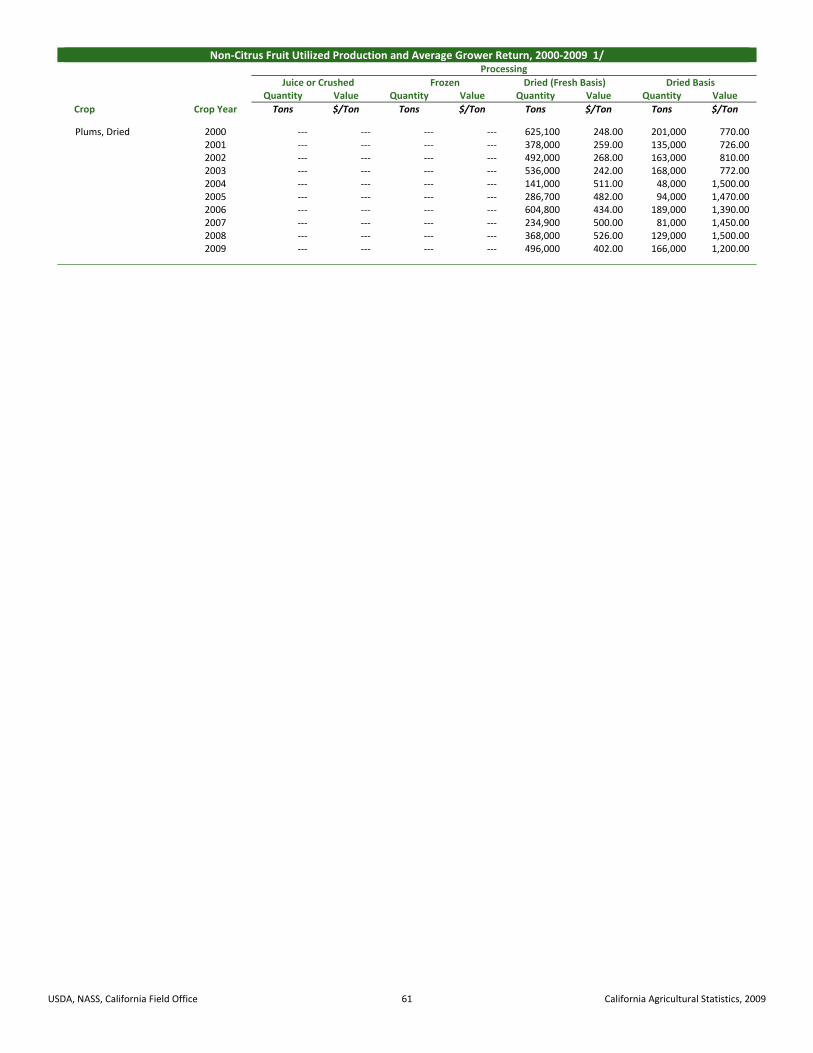
USDA, NASS, California Field Office 61 California Agricultural Statistics, 2009
Non‐Citrus Fruit Utilized Production and Average Grower Return, 2000‐2009 1/
Crop Crop Year
Processing
Juice or Crushed Frozen Dried (Fresh Basis) Dried BasisQuantity Value Quantity Value Quantity Value Quantity Value
Tons $/Ton Tons $/Ton Tons $/Ton Tons $/Ton
Plums, Dried 2000 ‐‐‐ ‐‐‐ ‐‐‐ ‐‐‐ 625,100 248.00 201,000 770.002001 ‐‐‐ ‐‐‐ ‐‐‐ ‐‐‐ 378,000 259.00 135,000 726.002002 ‐‐‐ ‐‐‐ ‐‐‐ ‐‐‐ 492,000 268.00 163,000 810.002003 ‐‐‐ ‐‐‐ ‐‐‐ ‐‐‐ 536,000 242.00 168,000 772.002004 ‐‐‐ ‐‐‐ ‐‐‐ ‐‐‐ 141,000 511.00 48,000 1,500.002005 ‐‐‐ ‐‐‐ ‐‐‐ ‐‐‐ 286,700 482.00 94,000 1,470.002006 ‐‐‐ ‐‐‐ ‐‐‐ ‐‐‐ 604,800 434.00 189,000 1,390.002007 ‐‐‐ ‐‐‐ ‐‐‐ ‐‐‐ 234,900 500.00 81,000 1,450.002008 ‐‐‐ ‐‐‐ ‐‐‐ ‐‐‐ 368,000 526.00 129,000 1,500.002009 ‐‐‐ ‐‐‐ ‐‐‐ ‐‐‐ 496,000 402.00 166,000 1,200.00

USDA, NASS, California Field Office 62 California Agricultural Statistics, 2009
Non‐Citrus Fruit Unutilized Production, 2000‐2009Crop 2000 2001 2002 2003 2004 2005 2006 2007 2008 2009
Unharvested Tons
Apples 30,000 15,000 ‐‐‐ ‐‐‐ ‐‐‐ ‐‐‐ ‐‐‐ ‐‐‐ ‐‐‐ ‐‐‐Apricots 9,000 7,000 10,000 ‐‐‐ 8,500 5,000 ‐‐‐ ‐‐‐ 4,100 ‐‐‐Grapes ‐‐‐ ‐‐‐ ‐‐‐ 75,000 ‐‐‐ ‐‐‐ ‐‐‐ ‐‐‐ ‐‐‐ ‐‐‐Nectarines ‐‐‐ ‐‐‐ ‐‐‐ ‐‐‐ 2,000 ‐‐‐ ‐‐‐ ‐‐‐ ‐‐‐ ‐‐‐Peaches, Freestone ‐‐‐ ‐‐‐ ‐‐‐ ‐‐‐ 2,000 ‐‐‐ ‐‐‐ ‐‐‐ ‐‐‐ ‐‐‐Pears, Bartlett 15,000 35,000 ‐‐‐ ‐‐‐ ‐‐‐ ‐‐‐ 10,000 ‐‐‐ ‐‐‐ ‐‐‐Plums ‐‐‐ 4,000 ‐‐‐ ‐‐‐ 1,000 ‐‐‐ ‐‐‐ ‐‐‐ ‐‐‐ ‐‐‐Plums, Dried ‐‐‐ ‐‐‐ ‐‐‐ ‐‐‐ ‐‐‐ ‐‐‐ 3,000 500 ‐‐‐ ‐‐‐
Harvested Tons Not Sold
Apples ‐‐‐ ‐‐‐ 5,000 5,000 ‐‐‐ ‐‐‐ ‐‐‐ ‐‐‐ ‐‐‐ ‐‐‐Cherries, Sweet 1,300 4,200 1,800 1,700 2,700 4,100 1,900 3,200 3,200 3,000Kiwifruit 3,500 2,800 3,000 1,400 2,000 1,000 700 800 1,000 2,100Nectarines ‐‐‐ ‐‐‐ ‐‐‐ ‐‐‐ 15,000 ‐‐‐ ‐‐‐ ‐‐‐ ‐‐‐ ‐‐‐Peaches, Clingstone 23,500 25,000 ‐‐‐ ‐‐‐ 44,000 ‐‐‐ ‐‐‐ ‐‐‐ ‐‐‐ ‐‐‐Peaches, Freestone ‐‐‐ ‐‐‐ 25,000 30,500 ‐‐‐ ‐‐‐ ‐‐‐ ‐‐‐ ‐‐‐ ‐‐‐Plums ‐‐‐ ‐‐‐ ‐‐‐ ‐‐‐ 11,000 ‐‐‐ ‐‐‐ ‐‐‐ ‐‐‐ ‐‐‐Plums, Dried 18,000 11,000 9,000 13,000 1,000 3,000 6,000 1,500 ‐‐‐ ‐‐‐
Raisin Production and Average Grower Return, 2000‐2009
Raisins 1/ Crop Year
All Varieties
Naturally DriedDehydrated, All Types
Thompson Seedless
Muscats Oleate 2/ Sultanas Zante Currant
Production Tons
2000 484,500 437,000 60 3,700 140 4,800 38,8002001 411,300 378,000 50 6,500 150 4,200 22,4002002 438,900 388,000 40 18,390 90 4,390 28,0302003 347,700 297,020 20 ‐‐‐ 80 3,030 27,5802004 274,000 245,300 ‐‐‐ ‐‐‐ 30 3,500 25,1902005 348,600 321,140 ‐‐‐ ‐‐‐ 75 3,800 23,5302006 303,000 283,100 10 ‐‐‐ 215 2,970 16,2902007 353,600 329,300 5 ‐‐‐ 95 3,350 20,8502008 382,700 355,100 5 ‐‐‐ 70 2,910 24,6302009 * 324,600 301,000 10 ‐‐‐ 65 2,710 20,810
Average Grower Return $/Ton
2000 569 564 533 855 590 831 8522001 570 534 572 814 531 1,019 1,0212002 393 360 628 429 504 807 7732003 563 528 515 ‐‐‐ 495 992 8872004 1,210 1,190 ‐‐‐ ‐‐‐ 880 1,420 1,4302005 1,000 1,160 ‐‐‐ ‐‐‐ 1,040 1,390 1,4102006 1,090 1,200 1,000 ‐‐‐ 890 1,110 1,3502007 1,040 1,190 900 ‐‐‐ 930 990 1,5302008 1,130 1,270 990 ‐‐‐ 1,030 1,230 1,5702009 * 1,160 1,320 1,030 ‐‐‐ 1,080 1,600 1,650
1/ Excludes raisins produced from table‐type grapes. 2/ Miscellaneous seedless grapes with Oleate applied. * Data for 2009 is preliminary.

USDA, NASS, California Field Office 63 California Agricultural Statistics, 2009
Tree Nut Acreage, Production and Value, 2000‐2009
Crop Crop Year
Bearing Non‐Bearing
1/ Yield Per Acre
ProductionValue Per
Unit Total Value Marketable
In‐Shell Shelling Stock
Total
Acres Acres Pounds 1,000 Pounds $/Pound $1,000
Almonds 2/ 2000 510,000 100,000 1,380 ‐‐‐ ‐‐‐ 703,000 0.97 666,487(Shelled Basis) 2001 530,000 75,000 1,570 ‐‐‐ ‐‐‐ 830,000 0.91 740,012
2002 545,000 65,000 2,000 ‐‐‐ ‐‐‐ 1,090,000 1.11 1,200,6872003 550,000 60,000 1,890 ‐‐‐ ‐‐‐ 1,040,000 1.57 1,600,1442004 570,000 70,000 1,760 ‐‐‐ ‐‐‐ 1,005,000 2.21 2,189,0052005 590,000 110,000 1,550 ‐‐‐ ‐‐‐ 915,000 2.81 2,525,9092006 610,000 145,000 1,840 ‐‐‐ ‐‐‐ 1,120,000 2.06 2,258,7902007 640,000 125,000 2,170 ‐‐‐ ‐‐‐ 1,390,000 1.75 2,401,8752008 680,000 115,000 2,400 ‐‐‐ ‐‐‐ 1,630,000 1.45 2,343,2002009 720,000 90,000 1,960 ‐‐‐ ‐‐‐ 1,410,000 1.65 2,293,500
Pecans 2000 2,600 ‐‐‐ 1,310 ‐‐‐ ‐‐‐ 3,400 1.52 5,168(In‐Shell Basis) 2001 2,600 ‐‐‐ 1,420 ‐‐‐ ‐‐‐ 3,700 0.81 2,997
2002 2,600 ‐‐‐ 1,460 ‐‐‐ ‐‐‐ 3,800 1.27 4,8262003 2,600 ‐‐‐ 1,420 ‐‐‐ ‐‐‐ 3,700 1.42 5,2542004 2,700 ‐‐‐ 1,300 ‐‐‐ ‐‐‐ 3,500 2.21 7,7352005 2,800 ‐‐‐ 1,410 ‐‐‐ ‐‐‐ 3,950 1.80 7,1102006 2,900 ‐‐‐ 1,170 ‐‐‐ ‐‐‐ 3,400 1.72 5,8482007 2,500 ‐‐‐ 1,760 ‐‐‐ ‐‐‐ 4,400 1.78 7,8322008 3,100 ‐‐‐ 1,210 ‐‐‐ ‐‐‐ 3,750 1.31 4,9132009 3,200 ‐‐‐ 1,230 ‐‐‐ ‐‐‐ 3,920 1.51 5,919
Pistachios 2000 74,600 21,700 3,260 190,000 53,000 243,000 1.01 245,4302001 78,000 23,500 2,060 126,500 34,500 161,000 1.01 162,6102002 83,000 23,000 3,650 242,000 61,000 303,000 1.10 333,3002003 88,000 23,000 1,350 90,000 29,000 119,000 1.22 145,1802004 93,000 15,000 3,730 254,000 93,000 347,000 1.34 464,9802005 105,000 ‐‐‐ 2,700 215,000 68,000 283,000 2.05 580,1502006 112,000 ‐‐‐ 2,130 201,000 37,000 238,000 1.89 449,8202007 115,000 ‐‐‐ 3,620 333,000 83,000 416,000 1.41 586,5602008 118,000 ‐‐‐ 2,360 231,000 47,000 278,000 2.05 569,9002009 126,000 ‐‐‐ 2,820 290,000 65,000 355,000 1.67 592,850
Sold In‐Shell Sold ShelledAcres Acres Tons Tons Tons Tons $/Ton $1,000
Walnuts 3/ 2000 200,000 31,000 1.20 64,000 175,000 239,000 1,240.00 296,360(In‐Shell Basis) 2001 204,000 29,000 1.50 80,000 225,000 305,000 1,120.00 341,600
2002 210,000 27,000 1.34 67,000 215,000 282,000 1,170.00 329,9402003 213,000 27,000 1.53 81,000 245,000 326,000 1,160.00 378,1602004 214,000 ‐‐‐ 1.52 75,000 250,000 325,000 1,390.00 451,7502005 215,000 26,000 1.65 82,000 273,000 355,000 1,570.00 557,3502006 216,000 ‐‐‐ 1.60 71,000 275,000 346,000 1,630.00 563,9802007 218,000 25,000 1.50 66,000 262,000 328,000 2,290.00 751,1202008 223,000 ‐‐‐ 1.96 95,000 341,000 436,000 1,280.00 558,0802009 223,000 28,000 1.96 117,000 320,000 437,000 1,690.00 738,530
1/ Non‐bearing shown only in year when acreage survey conducted.2/ Values are based on the edible portion of the crop only. Included in production are inedible quantities of no value: 2000 ‐ 15.9 million pounds, 2001 ‐ 16.8 million pounds, 2002 ‐ 8.30 million pounds, 2003 ‐ 20.8 million pounds, 2004 ‐ 14.5 million pounds, 2005 ‐ 16.1 million pounds, 2006 ‐ 23.5 million pounds, 2007 ‐ 17.5 million pounds, 2008 ‐ 14.0 million pounds, 2009 ‐ 20.0 million pounds.3/ Data for 2008 acreage by county, variety and year of planting available upon request.

USDA, NASS, California Field Office 64 California Agricultural Statistics, 2009
Livestock and Dairy
alifornia’s total livestock and livestock products cash receipts were $7.8 billion in 2009, down 26 percent from 2008. Nearly 85 percent of the change from 2008
was due to the decline in dairy products value. California dropped behind Iowa to rank third nationally, accounting for 6.5 percent of total livestock cash receipts. Dairy products remain the state’s leading commodity, despite cash receipts declining for milk by over 34 percent from 2008. Receipts for cattle and calves dropped from the state’s 5th leading commodity in 2008 to 7th. The Golden State’s dairy industry faced a very difficult year with historic low prices, high costs of production and economic conditions making credit availability very tight. Milk production had a net decrease every month in 2009 compared with the same month in 2008. The annual production was 4.1 percent below the prior year, the largest average annual loss in production ever recorded in the state. 1979 was the last year a negative growth in milk production compared to the prior year was recorded. Reduction in production began in 2008 in response to inadequate plant capacity and some cooperatives and other processors initiating production base caps. These caps continued into 2009, and coupled with four Cooperatives Working Together herd retirements and the decline in dairy numbers, drove the decline in production. Additional factors contributing to the slackening production included the movement to cheaper, less protein-rich feed rations in response to high feed costs and some operations limiting herd size to comply with air and water regulations. Prices received by dairy producers had dropped to below cost of production in late 2008 and this disparity continued through third quarter of 2009. Production costs dropped on average by 8 percent from 2008, but the average prices paid to producers for Grade A milk in 2009 decreased nearly 32 percent. Dairies continued to relocate to other states or shut down completely with a net loss of 100 California dairies in 2009. The state’s dairy herd declined sixty-two thousand head in 2009. California has been the nation's leading dairy state since 1993 when it surpassed Wisconsin in milk production. Sales of milk and cream contributed $4.54 billion in 2009. Wisconsin, New York, Idaho, and Pennsylvania were the next leading states in total milk production. California ranked number one in the U.S. in the production of fluid milk, butter, ice cream, and nonfat dry milk. California was second in total cheese production. California’s dairies produced 39.5 billion pounds of milk, accounting for 21 percent of the nation's milk supply. For the third year in a row, all 12 months of 2009 recorded more than 3.1 billion pounds in milk production. Approximately 40 percent of all the Golden State’s milk was used to make cheese, down 2 percent from 2008. According to the California Department of Food and Agriculture’s Dairy Statistics Branch, 33 counties contributed to the state’s commercial milk production. The top five milk-
producing counties in California accounting for 71 percent of the state's total milk production were Tulare (27 percent), Merced (14 percent), Kings (10 percent), Kern (9 percent), and Stanislaus (10 percent). Sales of fluid milk in California averaged 31 percent whole milk, 36 percent reduced fat milk, 15 percent low fat milk, and 15 percent skim milk. Milk production per cow decreased 1.5 percent to 22,000 pounds. California’s total cheese production of 2.06 billion pounds was down nearly 3 percent from 2008. United States cheese exports declined 17 percent from 2008 to 108 thousand metric tons per the USDA Foreign Agricultural Service. Butter exports also decreased by 68 percent. Softening demand, fallout from the worldwide recession and credit crisis, and aggressive Oceania pricing, bumped U.S. suppliers out of the world market when prices fell below U.S. support levels. Dairy product export sales were down 40 percent from 2008’s record level, but most of the downturn reflected lower world prices as overall U.S. dairy product export volume was up 10 percent. Cash receipts for cattle and calves decreased 11 percent from 2008. Sales totaled $1.68 billion, compared with $1.88 billion in 2008. Receipts for hogs and pigs were 25 percent off the previous year. Sheep and lambs increased 19 percent from 2008, recovering from a three year downward trend in cash receipts. Aquaculture receipts were up 22 percent from 2008. California’s 2009 honey production, at 11.7 million pounds, was 36 percent below 2008 and 14 percent below 2007. Producing colonies totaled 355 thousand, down 1 percent from the previous year. The yield per colony averaged 33 pounds, compared to 51 pounds produced in 2008. The average price per pound was 139 cents per pound, the same as 2008.
California Livestock, Dairy, Poultry, and Apiary Cash Income, 2008‐2009
Source of Income
2008 2009 Percent Change $1,000 $1,000
Aquaculture 52,813 64,344 22Chickens, All 724,667 691,518 ‐5Cattle and Calves 1,884,660 1,676,373 ‐11Eggs, Chicken 440,438 319,771 ‐27Hogs and Pigs 33,217 24,771 ‐25Honey 25,520 16,284 ‐36Milk and Cream 6,924,121 4,537,171 ‐34Sheep and Lambs 30,717 36,705 19Turkeys 252,416 202,800 ‐20Wool and Mohair 3,702 2,355 ‐36Other Livestock 185,813 171,514 ‐8Other Poultry 65,994 70,400 6Total 10,624,078 7,814,006 ‐26
Egg producers continued to be concerned about the unknown impacts of the 2008 Prevention of Farm Animal Cruelty Act. With specific space standards yet to be defined, some producers moved to states with less regulation.
C
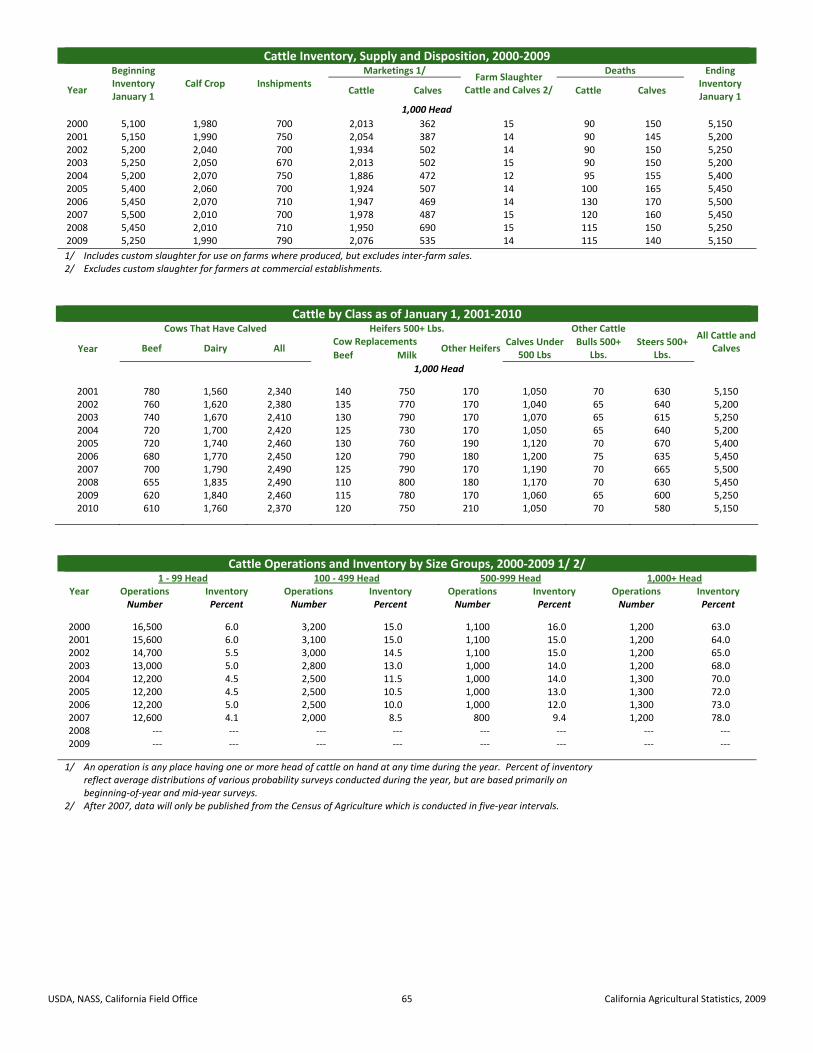
USDA, NASS, California Field Office 65 California Agricultural Statistics, 2009
Cattle Inventory, Supply and Disposition, 2000‐2009
Year
Beginning Inventory January 1
Calf Crop Inshipments Marketings 1/
Farm Slaughter Cattle and Calves 2/
Deaths Ending Inventory January 1
Cattle Calves Cattle Calves
1,000 Head
2000 5,100 1,980 700 2,013 362 15 90 150 5,1502001 5,150 1,990 750 2,054 387 14 90 145 5,2002002 5,200 2,040 700 1,934 502 14 90 150 5,2502003 5,250 2,050 670 2,013 502 15 90 150 5,2002004 5,200 2,070 750 1,886 472 12 95 155 5,4002005 5,400 2,060 700 1,924 507 14 100 165 5,4502006 5,450 2,070 710 1,947 469 14 130 170 5,5002007 5,500 2,010 700 1,978 487 15 120 160 5,4502008 5,450 2,010 710 1,950 690 15 115 150 5,2502009 5,250 1,990 790 2,076 535 14 115 140 5,150
1/ Includes custom slaughter for use on farms where produced, but excludes inter‐farm sales.2/ Excludes custom slaughter for farmers at commercial establishments.
Cattle by Class as of January 1, 2001‐2010
Year
Cows That Have Calved Heifers 500+ Lbs. Other Cattle All Cattle and
Calves Beef Dairy All Cow Replacements
Other HeifersCalves Under
500 Lbs Bulls 500+
Lbs. Steers 500+
Lbs. Beef Milk
1,000 Head
2001 780 1,560 2,340 140 750 170 1,050 70 630 5,150
2002 760 1,620 2,380 135 770 170 1,040 65 640 5,200
2003 740 1,670 2,410 130 790 170 1,070 65 615 5,250
2004 720 1,700 2,420 125 730 170 1,050 65 640 5,200
2005 720 1,740 2,460 130 760 190 1,120 70 670 5,400
2006 680 1,770 2,450 120 790 180 1,200 75 635 5,450
2007 700 1,790 2,490 125 790 170 1,190 70 665 5,500
2008 655 1,835 2,490 110 800 180 1,170 70 630 5,450
2009 620 1,840 2,460 115 780 170 1,060 65 600 5,250
2010 610 1,760 2,370 120 750 210 1,050 70 580 5,150
Cattle Operations and Inventory by Size Groups, 2000‐2009 1/ 2/
Year 1 ‐ 99 Head 100 ‐ 499 Head 500‐999 Head 1,000+ Head
Operations Inventory Operations Inventory Operations Inventory Operations InventoryNumber Percent Number Percent Number Percent Number Percent
2000 16,500 6.0 3,200 15.0 1,100 16.0 1,200 63.02001 15,600 6.0 3,100 15.0 1,100 15.0 1,200 64.02002 14,700 5.5 3,000 14.5 1,100 15.0 1,200 65.02003 13,000 5.0 2,800 13.0 1,000 14.0 1,200 68.02004 12,200 4.5 2,500 11.5 1,000 14.0 1,300 70.02005 12,200 4.5 2,500 10.5 1,000 13.0 1,300 72.02006 12,200 5.0 2,500 10.0 1,000 12.0 1,300 73.02007 12,600 4.1 2,000 8.5 800 9.4 1,200 78.02008 ‐‐‐ ‐‐‐ ‐‐‐ ‐‐‐ ‐‐‐ ‐‐‐ ‐‐‐ ‐‐‐2009 ‐‐‐ ‐‐‐ ‐‐‐ ‐‐‐ ‐‐‐ ‐‐‐ ‐‐‐ ‐‐‐
1/ An operation is any place having one or more head of cattle on hand at any time during the year. Percent of inventory reflect average distributions of various probability surveys conducted during the year, but are based primarily on beginning‐of‐year and mid‐year surveys. 2/ After 2007, data will only be published from the Census of Agriculture which is conducted in five‐year intervals.
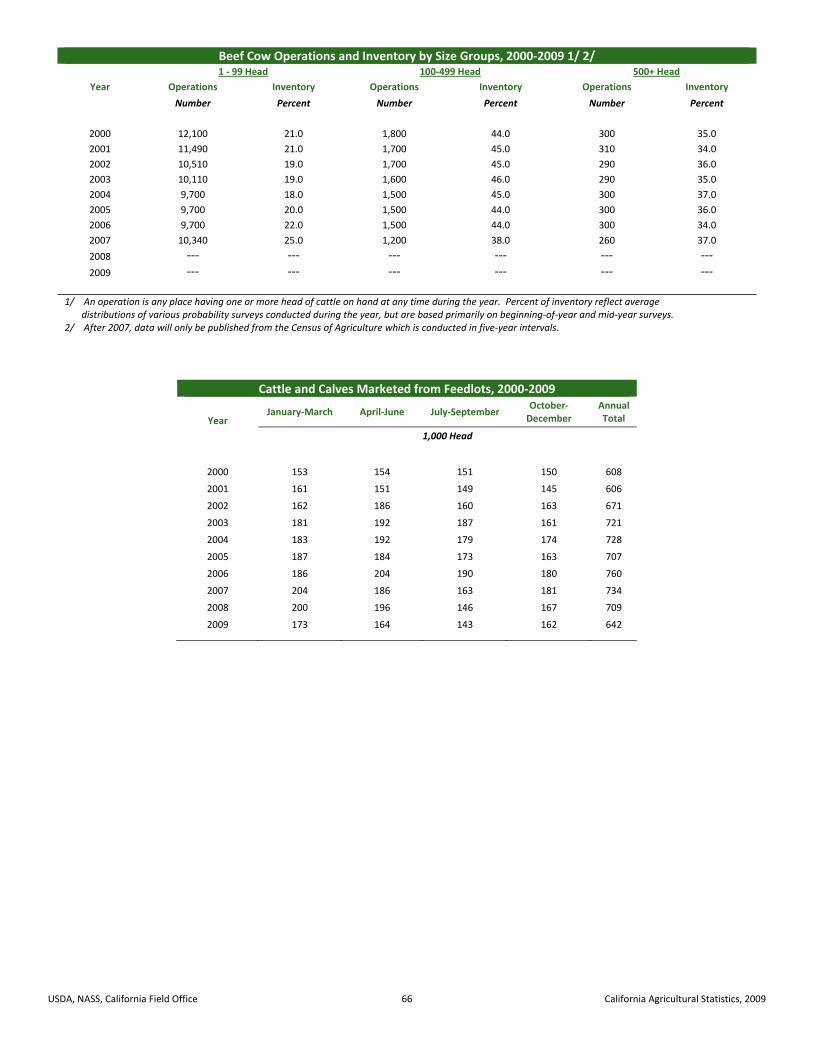
USDA, NASS, California Field Office 66 California Agricultural Statistics, 2009
Beef Cow Operations and Inventory by Size Groups, 2000‐2009 1/ 2/
Year
1 ‐ 99 Head 100‐499 Head 500+ Head
Operations Inventory Operations Inventory Operations Inventory
Number Percent Number Percent Number Percent
2000 12,100 21.0 1,800 44.0 300 35.0
2001 11,490 21.0 1,700 45.0 310 34.0
2002 10,510 19.0 1,700 45.0 290 36.0
2003 10,110 19.0 1,600 46.0 290 35.0
2004 9,700 18.0 1,500 45.0 300 37.0
2005 9,700 20.0 1,500 44.0 300 36.0
2006 9,700 22.0 1,500 44.0 300 34.0
2007 10,340 25.0 1,200 38.0 260 37.0
2008 ‐‐‐ ‐‐‐ ‐‐‐ ‐‐‐ ‐‐‐ ‐‐‐
2009 ‐‐‐ ‐‐‐ ‐‐‐ ‐‐‐ ‐‐‐ ‐‐‐
1/ An operation is any place having one or more head of cattle on hand at any time during the year. Percent of inventory reflect average distributions of various probability surveys conducted during the year, but are based primarily on beginning‐of‐year and mid‐year surveys.2/ After 2007, data will only be published from the Census of Agriculture which is conducted in five‐year intervals.
Cattle and Calves Marketed from Feedlots, 2000‐2009
Year January‐March April‐June July‐September
October‐December
Annual Total
1,000 Head
2000 153 154 151 150 608
2001 161 151 149 145 606
2002 162 186 160 163 671
2003 181 192 187 161 721
2004 183 192 179 174 728
2005 187 184 173 163 707
2006 186 204 190 180 760
2007 204 186 163 181 734
2008 200 196 146 167 709
2009 173 164 143 162 642
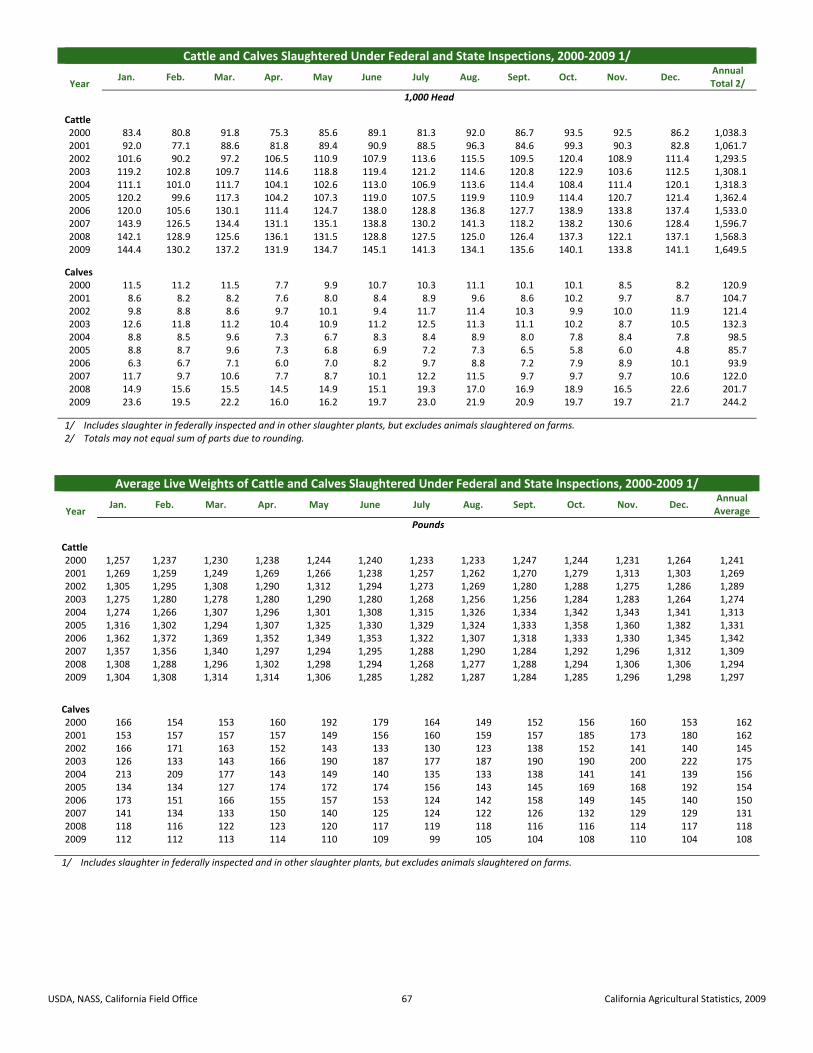
USDA, NASS, California Field Office 67 California Agricultural Statistics, 2009
Cattle and Calves Slaughtered Under Federal and State Inspections, 2000‐2009 1/
Year Jan. Feb. Mar. Apr. May June July Aug. Sept. Oct. Nov. Dec.
Annual Total 2/
1,000 Head
Cattle 2000 83.4 80.8 91.8 75.3 85.6 89.1 81.3 92.0 86.7 93.5 92.5 86.2 1,038.32001 92.0 77.1 88.6 81.8 89.4 90.9 88.5 96.3 84.6 99.3 90.3 82.8 1,061.72002 101.6 90.2 97.2 106.5 110.9 107.9 113.6 115.5 109.5 120.4 108.9 111.4 1,293.52003 119.2 102.8 109.7 114.6 118.8 119.4 121.2 114.6 120.8 122.9 103.6 112.5 1,308.12004 111.1 101.0 111.7 104.1 102.6 113.0 106.9 113.6 114.4 108.4 111.4 120.1 1,318.32005 120.2 99.6 117.3 104.2 107.3 119.0 107.5 119.9 110.9 114.4 120.7 121.4 1,362.42006 120.0 105.6 130.1 111.4 124.7 138.0 128.8 136.8 127.7 138.9 133.8 137.4 1,533.02007 143.9 126.5 134.4 131.1 135.1 138.8 130.2 141.3 118.2 138.2 130.6 128.4 1,596.72008 142.1 128.9 125.6 136.1 131.5 128.8 127.5 125.0 126.4 137.3 122.1 137.1 1,568.32009 144.4 130.2 137.2 131.9 134.7 145.1 141.3 134.1 135.6 140.1 133.8 141.1 1,649.5
Calves 2000 11.5 11.2 11.5 7.7 9.9 10.7 10.3 11.1 10.1 10.1 8.5 8.2 120.92001 8.6 8.2 8.2 7.6 8.0 8.4 8.9 9.6 8.6 10.2 9.7 8.7 104.72002 9.8 8.8 8.6 9.7 10.1 9.4 11.7 11.4 10.3 9.9 10.0 11.9 121.42003 12.6 11.8 11.2 10.4 10.9 11.2 12.5 11.3 11.1 10.2 8.7 10.5 132.32004 8.8 8.5 9.6 7.3 6.7 8.3 8.4 8.9 8.0 7.8 8.4 7.8 98.52005 8.8 8.7 9.6 7.3 6.8 6.9 7.2 7.3 6.5 5.8 6.0 4.8 85.72006 6.3 6.7 7.1 6.0 7.0 8.2 9.7 8.8 7.2 7.9 8.9 10.1 93.92007 11.7 9.7 10.6 7.7 8.7 10.1 12.2 11.5 9.7 9.7 9.7 10.6 122.02008 14.9 15.6 15.5 14.5 14.9 15.1 19.3 17.0 16.9 18.9 16.5 22.6 201.72009 23.6 19.5 22.2 16.0 16.2 19.7 23.0 21.9 20.9 19.7 19.7 21.7 244.2
1/ Includes slaughter in federally inspected and in other slaughter plants, but excludes animals slaughtered on farms. 2/ Totals may not equal sum of parts due to rounding.
Average Live Weights of Cattle and Calves Slaughtered Under Federal and State Inspections, 2000‐2009 1/
Year Jan. Feb. Mar. Apr. May June July Aug. Sept. Oct. Nov. Dec.
Annual Average
Pounds
Cattle 2000 1,257 1,237 1,230 1,238 1,244 1,240 1,233 1,233 1,247 1,244 1,231 1,264 1,2412001 1,269 1,259 1,249 1,269 1,266 1,238 1,257 1,262 1,270 1,279 1,313 1,303 1,2692002 1,305 1,295 1,308 1,290 1,312 1,294 1,273 1,269 1,280 1,288 1,275 1,286 1,2892003 1,275 1,280 1,278 1,280 1,290 1,280 1,268 1,256 1,256 1,284 1,283 1,264 1,2742004 1,274 1,266 1,307 1,296 1,301 1,308 1,315 1,326 1,334 1,342 1,343 1,341 1,3132005 1,316 1,302 1,294 1,307 1,325 1,330 1,329 1,324 1,333 1,358 1,360 1,382 1,3312006 1,362 1,372 1,369 1,352 1,349 1,353 1,322 1,307 1,318 1,333 1,330 1,345 1,3422007 1,357 1,356 1,340 1,297 1,294 1,295 1,288 1,290 1,284 1,292 1,296 1,312 1,3092008 1,308 1,288 1,296 1,302 1,298 1,294 1,268 1,277 1,288 1,294 1,306 1,306 1,2942009 1,304 1,308 1,314 1,314 1,306 1,285 1,282 1,287 1,284 1,285 1,296 1,298 1,297
Calves 2000 166 154 153 160 192 179 164 149 152 156 160 153 1622001 153 157 157 157 149 156 160 159 157 185 173 180 1622002 166 171 163 152 143 133 130 123 138 152 141 140 1452003 126 133 143 166 190 187 177 187 190 190 200 222 1752004 213 209 177 143 149 140 135 133 138 141 141 139 1562005 134 134 127 174 172 174 156 143 145 169 168 192 1542006 173 151 166 155 157 153 124 142 158 149 145 140 1502007 141 134 133 150 140 125 124 122 126 132 129 129 1312008 118 116 122 123 120 117 119 118 116 116 114 117 1182009 112 112 113 114 110 109 99 105 104 108 110 104 108
1/ Includes slaughter in federally inspected and in other slaughter plants, but excludes animals slaughtered on farms.

USDA, NASS, California Field Office 68 California Agricultural Statistics, 2009
Cattle and Calves Average Prices Received, 2000‐2009
Year Jan. Feb. Mar. Apr. May June July Aug. Sept. Oct. Nov. Dec.
Annual Average
$/Cwt.
All Beef Cattle 1/
2000 48.10 48.90 49.50 52.50 52.00 51.80 51.10 50.80 48.10 48.10 49.40 50.80 50.00
2001 54.10 55.90 58.10 58.20 56.90 57.10 55.50 55.20 51.20 49.80 47.90 47.40 53.90
2002 48.20 51.90 55.50 52.70 51.70 51.50 50.50 49.40 49.50 47.80 49.10 52.10 50.80
2003 55.00 56.70 56.80 59.40 61.00 58.50 61.50 62.80 64.80 67.40 69.70 70.70 62.00
2004 62.40 60.80 66.00 70.40 72.90 73.30 75.20 72.30 69.60 67.80 65.40 68.50 68.70
2005 69.10 69.00 72.70 76.70 76.40 73.70 70.00 67.50 67.80 66.00 66.70 70.70 70.40
2006 72.40 70.80 69.00 66.50 65.50 67.20 67.30 67.00 68.70 67.90 64.40 62.10 67.30
2007 64.30 66.70 72.00 74.30 75.30 72.90 74.20 73.40 72.70 70.30 70.20 71.50 71.40
2008 69.90 73.30 72.70 72.00 76.10 76.40 77.10 78.80 78.20 69.80 68.00 63.90 72.90
2009 62.80 63.20 64.10 70.30 68.00 65.40 68.40 66.10 67.10 66.80 67.20 65.60 66.20
Beef Steers and Heifers 2/
2000 67.00 67.50 69.00 72.00 71.00 70.00 68.50 67.00 67.00 70.00 73.00 76.00 69.80
2001 78.00 78.00 79.50 79.50 77.00 76.00 73.00 72.00 71.00 69.00 66.50 66.00 74.10
2002 69.00 72.00 73.00 68.00 67.00 65.50 65.00 65.00 67.00 66.50 71.00 74.50 68.40
2003 77.50 78.50 76.00 78.50 78.50 77.00 76.50 81.00 88.50 96.00 97.50 94.50 83.20
2004 82.00 80.00 85.50 87.00 90.50 93.30 93.50 90.00 88.00 89.00 88.80 90.80 88.30
2005 91.20 90.20 92.60 94.30 92.20 88.20 85.40 85.10 89.30 92.10 94.80 95.60 90.80
2006 99.40 94.80 89.30 85.20 84.00 86.70 86.50 89.20 92.50 91.00 88.40 86.80 89.30
2007 88.90 90.50 95.70 98.20 96.50 90.40 92.40 94.20 96.40 93.70 93.00 95.10 93.70
2008 92.90 92.90 90.50 90.50 95.30 95.80 98.70 98.60 97.10 89.50 89.50 84.20 92.90
2009 84.30 83.80 83.90 88.50 86.20 83.20 84.70 83.00 85.20 84.10 85.10 83.20 84.50
Beef Cows 3/
2000 35.50 36.50 36.50 36.50 37.00 37.50 37.50 37.50 35.00 33.50 35.00 34.00 35.90
2001 37.50 40.50 42.00 41.50 40.50 41.00 40.00 42.00 38.50 37.00 35.50 35.00 38.90
2002 36.00 39.00 40.50 38.00 37.00 37.00 36.50 35.00 34.00 32.50 32.50 34.50 35.90
2003 35.00 36.50 39.00 39.50 42.00 38.50 44.50 44.50 42.00 42.00 44.00 46.00 41.10
2004 42.00 41.50 44.00 48.50 48.60 48.80 53.70 52.30 49.70 47.50 44.60 46.10 47.20
2005 46.90 47.80 49.40 54.30 55.50 54.50 51.20 49.10 47.90 43.80 42.80 44.80 48.50
2006 46.40 46.80 47.80 47.00 44.70 44.40 44.70 45.70 44.90 42.80 40.40 36.40 44.20
2007 40.60 42.00 45.20 47.40 48.30 47.80 48.00 47.00 44.90 41.60 40.00 40.20 44.30
2008 40.60 45.00 46.00 43.00 44.90 44.80 46.10 50.20 48.60 41.40 39.40 36.90 43.70
2009 36.50 39.10 39.80 45.20 43.90 41.80 45.90 43.60 44.10 44.70 44.40 45.00 42.80
Calves 4/
2000 91.00 96.00 97.50 94.50 92.00 90.50 93.00 90.50 91.50 93.00 95.00 93.00 93.00
2001 98.00 95.50 98.00 99.50 95.00 91.00 94.00 94.00 90.00 89.00 90.00 94.00 94.10
2002 91.00 93.50 93.50 85.00 84.50 80.00 77.50 79.00 79.00 79.50 88.00 95.00 85.40
2003 93.00 91.00 92.00 95.00 94.00 93.00 93.00 97.00 99.00 100.00 101.00 109.00 96.60
2004 109.00 101.00 110.00 115.00 107.00 110.00 112.00 108.00 112.00 113.00 120.00 120.00 111.00
2005 123.00 118.00 121.00 127.00 128.00 121.00 117.00 109.00 114.00 121.00 124.00 128.00 121.00
2006 136.00 131.00 124.00 125.00 118.00 117.00 114.00 115.00 113.00 113.00 105.00 108.00 118.00
2007 106.00 104.00 112.00 116.00 112.00 112.00 110.00 110.00 112.00 104.00 104.00 109.00 109.00
2008 110.00 112.00 117.00 105.00 104.00 101.00 100.00 100.00 98.80 93.90 91.30 91.80 102.00
2009 100.00 103.00 103.00 107.00 101.00 96.00 95.00 98.50 97.00 100.00 100.00 104.00 99.70
1/ Steers and heifers over 500 pounds (including fed cattle) and slaughter cows.
2/ Steers and heifers (all qualities) over 500 pounds (including fed cattle).
3/ Beef cows and cull dairy cows sold for slaughter.
4/ Steers and heifers (all qualities) under 500 pounds

USDA, NASS, California Field Office 69 California Agricultural Statistics, 2009
Grazing Fee Annual Average Rates, 2000‐2009 1/
Year Per Animal Unit 2/ Cow‐Calf Per Head
Dollars Per Month
2000 12.30 15.50 12.70
2001 13.00 16.00 13.50
2002 12.80 16.50 14.00
2003 13.50 17.50 14.30
2004 14.50 19.50 15.50
2005 15.40 20.50 17.00
2006 16.50 21.00 17.00
2007 16.50 21.50 17.30
2008 17.80 22.10 18.50
2009 16.70 21.00 17.50
1/ The average rates are estimates based on survey indications of monthly lease rates for private, non‐irrigated grazing land from the
January Cattle Survey. 2/ Includes animal unit plus cow‐calf rates. Cow‐calf rate converted to animal unit (AUM) using (1 aum=cow‐calf *0.833).
Milk Cows, Milk Production and Value, 2000‐2009
Year
Milk Cows Production Per Milk Cow Production Value Total
January 1 Annual Average Milk Milk Fat Milk Milk Fat Per Unit Value 1/
1,000 Head 1,000 Head Pounds Pounds Million Pounds Million Pounds $/Cwt. $1,000
2000 1,490 1,526 21,130 778 32,245 1,187 11.50 3,704,035
2001 1,560 1,589 20,904 771 33,217 1,226 13.94 4,625,431
2002 1,620 1,648 21,277 785 35,065 1,294 10.94 3,832,501
2003 1,670 1,688 20,993 770 35,437 1,301 11.38 4,032,731
2004 1,700 1,725 21,139 776 36,465 1,338 14.73 5,371,295
2005 1,740 1,755 21,404 786 37,564 1,379 13.92 5,228,909
2006 1,770 1,780 21,815 803 38,830 1,429 11.58 4,496,514
2007 1,790 1,813 22,440 826 40,683 1,497 18.05 7,343,282
2008 1,835 1,844 22,344 822 41,203 1,516 16.82 6,930,345
2009 1,840 1,796 22,000 805 39,512 1,446 11.49 4,539,929
1/ Milk valued at averaged returns per 100 pounds in combined marketings of milk and cream. Includes value of milk fed to calves.
Milk Cow Operations and Inventory by Size Groups, 2000‐2009 1/ 2/
Year
1 ‐ 49 Head 50 ‐ 99 Head 100‐199 Head 200‐499 Head 500+ Head
Operations Inventory Operations Inventory Operations Inventory Operations Inventory Operations Inventory
Number Percent Number Percent Number Percent Number Percent Number Percent
2000 370 0.3 70 0.3 230 3.3 730 16.50 1,100 80.00
2001 370 0.3 80 0.3 250 2.9 700 15.00 1,100 82.00
2002 380 0.3 80 0.3 200 2.4 640 13.50 1,100 84.00
2003 390 0.3 80 0.3 210 1.9 620 12.50 1,100 85.00
2004 365 0.2 80 0.3 180 1.9 575 12.00 1,100 86.00
2005 390 0.2 80 0.3 180 1.5 550 11.00 1,100 87.00
2006 330 0.2 70 0.3 170 1.5 530 11.00 1,100 87.00
2007 490 0.1 50 0.2 110 0.8 450 7.90 1,100 91.00
2008 ‐‐‐ ‐‐‐ ‐‐‐ ‐‐‐ ‐‐‐ ‐‐‐ ‐‐‐ ‐‐‐ ‐‐‐ ‐‐‐
2009 ‐‐‐ ‐‐‐ ‐‐‐ ‐‐‐ ‐‐‐ ‐‐‐ ‐‐‐ ‐‐‐ ‐‐‐ ‐‐‐
1/ An operation is any place having one or more head of milk cows, excluding cows used to nurse calves, on hand at any time during the year.
Percent of inventory reflect average distributions of various surveys conducted during the year.
2/ Data will only be published during the Census of Agriculture which is conducted in five‐year intervals.

USDA, NASS, California Field Office 70 California Agricultural Statistics, 2009
Milk Cows, Dairies, and Cows Per Dairy by County and Region, 2008‐2009
County and Region 1/
2008 2009
Number Number Average Number Number Number Average Number
of Cows of Dairies 2/ of Cows Per Dairy of Cows of Dairies 2/ of Cows Per Dairy
Butte 257 3 86 247 3 82
Del Norte 4,340 9 482 4,099 9 455
Fresno 120,299 109 1,104 115,716 102 1,134
Glenn 19,356 46 421 17,519 42 417
Humboldt 15,260 70 218 15,585 69 226
Kern 176,643 54 3,271 167,309 53 3,157
Kings 183,809 156 1,178 181,243 150 1,208
Madera 79,810 56 1,425 73,747 55 1,341
Marin 10,203 27 378 9,284 23 404
Mendocino 3/ ‐‐‐ ‐‐‐ ‐‐‐ ‐‐‐ ‐‐‐ ‐‐‐
Merced 265,660 297 894 261,529 268 976
Monterey 1,449 3 483 ‐‐‐ ‐‐‐ ‐‐‐
Placer ‐‐‐ ‐‐‐ ‐‐‐ ‐‐‐ ‐‐‐ ‐‐‐
Sacramento 16,662 39 427 15,473 34 455
San Benito 634 4 159 527 3 176
San Joaquin 111,231 127 876 101,444 125 812
Santa Clara 3/ ‐‐‐ ‐‐‐ ‐‐‐ ‐‐‐ ‐‐‐ ‐‐‐
Santa Cruz 3/ ‐‐‐ ‐‐‐ ‐‐‐ ‐‐‐ ‐‐‐ ‐‐‐
Shasta 3/ ‐‐‐ ‐‐‐ ‐‐‐ ‐‐‐ ‐‐‐ ‐‐‐
Siskiyou 682 3 227 636 3 212
Solano 4,333 3 1,444 ‐‐‐ ‐‐‐ ‐‐‐
Sonoma 27,262 69 395 26,538 69 385
Stanislaus 183,316 272 674 180,020 259 695
Sutter 3/ ‐‐‐ ‐‐‐ ‐‐‐ ‐‐‐ ‐‐‐ ‐‐‐
Tehama 4,003 15 267 4,802 15 320
Tulare 493,383 329 1,500 493,292 319 1,546
Yolo 2,279 3 760 ‐‐‐ ‐‐‐ ‐‐‐
Yuba 3,097 4 774 3,117 4 779
Northern California 1,726,903 1,704 1,013 1,681,404 1,615 1,041
Imperial 7,547 4 1,887 7,500 4 1,875
Los Angeles 3/ ‐‐‐ ‐‐‐ ‐‐‐ ‐‐‐ ‐‐‐ ‐‐‐
Riverside 51,326 37 1,387 47,856 35 1,367
San Bernardino 88,404 99 893 77,101 90 857
San Diego 3,805 5 761 2,572 4 643
San Luis Obispo 3/ ‐‐‐ ‐‐‐ ‐‐‐ ‐‐‐ ‐‐‐ ‐‐‐
Santa Barbara 3/ ‐‐‐ ‐‐‐ ‐‐‐ ‐‐‐ ‐‐‐ ‐‐‐
Southern California 155,843 148 1,053 139,538 137 1,019
STATE 1,882,746 1,852 1,017 1,820,942 1,752 1,039
1/ Counties omitted have no reported milk production. Data includes total milk sold, excludes milk used on ranch.2/ Number of dairies source is Milk and Dairy Foods Control.3/ Not published, but included in total.
Source: California Department of Food and Agriculture, California Dairy Statistics 2009
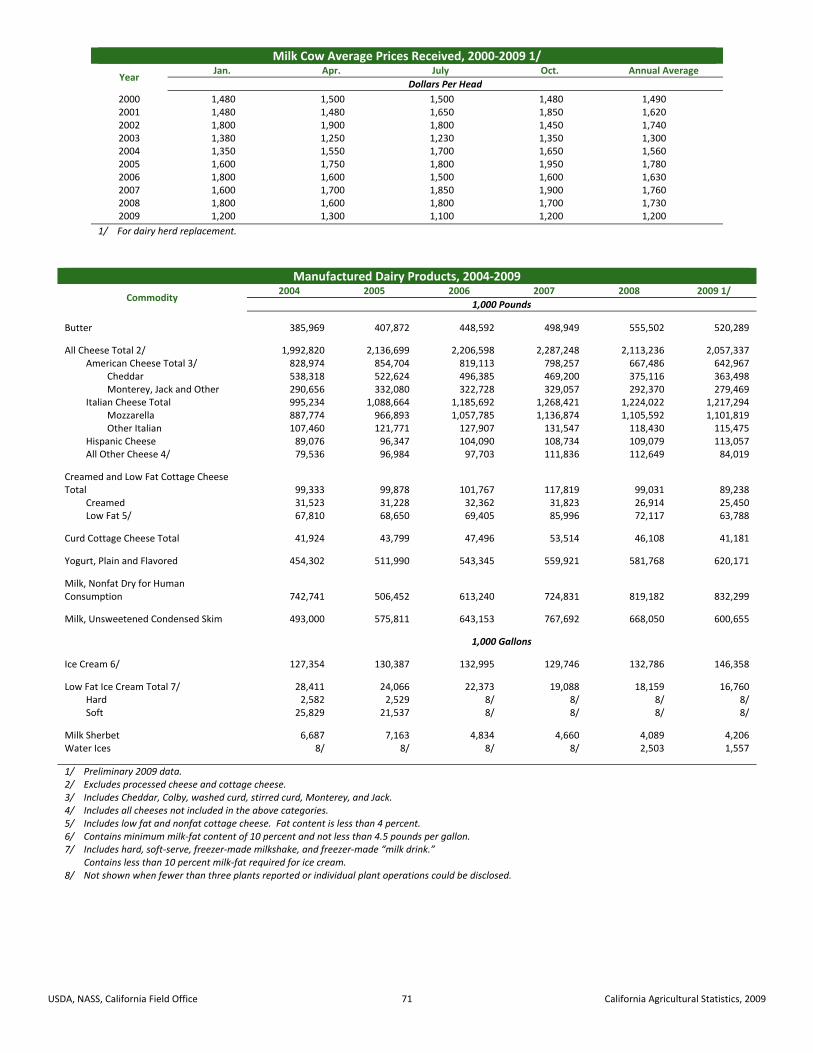
USDA, NASS, California Field Office 71 California Agricultural Statistics, 2009
Milk Cow Average Prices Received, 2000‐2009 1/
Year Jan. Apr. July Oct. Annual Average
Dollars Per Head
2000 1,480 1,500 1,500 1,480 1,4902001 1,480 1,480 1,650 1,850 1,6202002 1,800 1,900 1,800 1,450 1,7402003 1,380 1,250 1,230 1,350 1,3002004 1,350 1,550 1,700 1,650 1,5602005 1,600 1,750 1,800 1,950 1,7802006 1,800 1,600 1,500 1,600 1,6302007 1,600 1,700 1,850 1,900 1,7602008 1,800 1,600 1,800 1,700 1,7302009 1,200 1,300 1,100 1,200 1,200
1/ For dairy herd replacement.
Manufactured Dairy Products, 2004‐2009
Commodity 2004 2005 2006 2007 2008 2009 1/
1,000 Pounds
Butter 385,969 407,872 448,592 498,949 555,502 520,289
All Cheese Total 2/ 1,992,820 2,136,699 2,206,598 2,287,248 2,113,236 2,057,337American Cheese Total 3/ 828,974 854,704 819,113 798,257 667,486 642,967
Cheddar 538,318 522,624 496,385 469,200 375,116 363,498Monterey, Jack and Other 290,656 332,080 322,728 329,057 292,370 279,469
Italian Cheese Total 995,234 1,088,664 1,185,692 1,268,421 1,224,022 1,217,294Mozzarella 887,774 966,893 1,057,785 1,136,874 1,105,592 1,101,819Other Italian 107,460 121,771 127,907 131,547 118,430 115,475
Hispanic Cheese 89,076 96,347 104,090 108,734 109,079 113,057All Other Cheese 4/ 79,536 96,984 97,703 111,836 112,649 84,019
Creamed and Low Fat Cottage Cheese Total 99,333 99,878 101,767 117,819 99,031 89,238
Creamed 31,523 31,228 32,362 31,823 26,914 25,450Low Fat 5/ 67,810 68,650 69,405 85,996 72,117 63,788
Curd Cottage Cheese Total 41,924 43,799 47,496 53,514 46,108 41,181
Yogurt, Plain and Flavored 454,302 511,990 543,345 559,921 581,768 620,171
Milk, Nonfat Dry for Human Consumption 742,741 506,452 613,240 724,831 819,182 832,299
Milk, Unsweetened Condensed Skim 493,000 575,811 643,153 767,692 668,050 600,655
1,000 Gallons
Ice Cream 6/ 127,354 130,387 132,995 129,746 132,786 146,358
Low Fat Ice Cream Total 7/ 28,411 24,066 22,373 19,088 18,159 16,760Hard 2,582 2,529 8/ 8/ 8/ 8/Soft 25,829 21,537 8/ 8/ 8/ 8/
Milk Sherbet 6,687 7,163 4,834 4,660 4,089 4,206Water Ices 8/ 8/ 8/ 8/ 2,503 1,557
1/ Preliminary 2009 data. 2/ Excludes processed cheese and cottage cheese. 3/ Includes Cheddar, Colby, washed curd, stirred curd, Monterey, and Jack.4/ Includes all cheeses not included in the above categories.5/ Includes low fat and nonfat cottage cheese. Fat content is less than 4 percent.6/ Contains minimum milk‐fat content of 10 percent and not less than 4.5 pounds per gallon.7/ Includes hard, soft‐serve, freezer‐made milkshake, and freezer‐made “milk drink.” Contains less than 10 percent milk‐fat required for ice cream.8/ Not shown when fewer than three plants reported or individual plant operations could be disclosed.

USDA, NASS, California Field Office 72 California Agricultural Statistics, 2009
Layers and Egg Production, 2008‐2009
Month Average Number of Layers Average Number of Eggs Per 100 Layers Total Egg Production
2008 2009 2009/2008 2008 2009 2009/2008 2008 2009 2009/20081,000 1,000 Percent Number Number Percent Millions Millions Percent
December 1/ 20,699 20,145 97 2,242 2,274 101 465 458 98January 19,994 19,938 100 2,166 2,242 104 433 447 103February 19,578 19,770 101 2,002 2,023 101 392 400 102March 19,889 19,747 99 2,192 2,274 104 436 449 103April 20,423 19,774 97 2,081 2,190 105 425 433 102May 20,716 19,754 95 2,148 2,253 105 445 445 100June 20,636 19,424 94 2,132 2,234 105 440 434 99July 20,378 19,385 95 2,208 2,321 105 450 450 100August 20,405 19,740 97 2,235 2,310 103 456 456 100September 20,212 19,551 97 2,177 2,235 103 440 437 99October 20,028 19,180 96 2,232 2,336 105 447 448 100November 20,182 19,414 96 2,195 2,302 105 443 447 101
Average/Total 20,26
2 19,652 97 2,168 2,250
104 5,272 5,304 101
1/ December of previous year.
Egg Production and Value,2000‐2009 1/
Year Eggs Value Per Unit 2/ Total Value
Millions ¢/Doz. $1,000
2000 6,319 45.3 238,796 2001 6,082 47.1 238,951 2002 6,257 39.2 204,175 2003 5,454 62.3 283,219 2004 5,454 64.4 292,688 2005 5,271 42.8 187,965 2006 5,231 51.4 223,903 2007 5,290 78.6 346,426 2008 5,271 100.0 440,438 2009 5,304 72.3 319,771
1/ Data covers the 12‐month period of December 1 (of the previous year) through November 30. 2/ Average of all eggs, including hatching eggs.
Turkey Production and Value, 2000‐2009
Year Turkeys Meat Produced 1/ Value Per Unit 2/ Total Value
1,000 Head 1,000 Pounds ¢/Lb. $1,000
2000 18,000 439,200 48.0 210,8162001 18,700 450,670 47.0 211,8152002 17,700 438,960 36.0 158,0262003 17,500 423,500 35.0 148,2252004 15,400 405,020 41.0 166,0582005 14,900 406,770 43.0 174,9112006 14,900 402,300 44.0 177,0122007 16,200 450,360 47.0 211,6692008 16,000 435,200 58.0 252,4162009 15,000 390,000 52.0 202,800
1/ Includes home consumption. 2/ Live weight equivalent price.

USDA, NASS, California Field Office 73 California Agricultural Statistics, 2009
Hogs and Pigs by Class as of December 1, 2000‐2009
Year
Hogs and Pigs Market Hogs
All Breeding Under 50 Pounds
50‐119 Pounds
120‐179 Pounds
180 Pounds and Over
Total
1,000 Head
2000 150 20 32 43 45 10 130
2001 110 20 35 25 11 19 90
2002 150 22 39 32 29 28 128
2003 135 20 35 25 28 27 115
2004 140 20 32 32 26 30 120
2005 145 20 40 35 25 25 125
2006 145 20 40 40 20 25 125
2007 155 20 40 37 30 28 135
2008 1/ 80 10 23 17 20 10 70
2009 100 7 26 18 19 30 93
1/ Market categories changed to : Under 50 Pounds, 50‐119 Pounds, 120‐179 Pounds, and 180 Pounds and Over.
Sows Farrowed and Pig Crop, 2000‐2009
Year
December ‐ November
Sows Farrowed Pig Crop Pigs Per Litter
1,000 Head 1,000 Head Number
2000 40 371 9.3
2001 27 239 8.9
2002 35 304 8.7
2003 34 321 9.4
2004 39 352 9.0
2005 32 306 9.6
2006 33 330 10.0
2007 33 335 10.2
2008 21 196 9.3
2009 14 118 8.4
Hogs and Pigs Inventory, Supply and Disposition, 2000‐2009
Year
Beginning Inventory December 1
(Previous Year)
Pig Crop (Dec.‐Nov.)
Inshipments 1/ Marketings 2/ Farm Slaughter 3/ Deaths Ending Inventory
December 1
1,000 Head
2000 190 371 45 374 7 75 150
2001 150 239 30 278 6 25 110
2002 110 304 45 284 5 20 150
2003 150 321 45 349 8 24 135
2004 135 352 40 350 7 30 140
2005 140 306 42 309 7 27 145
2006 145 330 12 286 7 49 145
2007 145 335 13 285 7 46 155
2008 155 196 59 300 7 23 80
2009 80 118 172 253 6 11 100
1/ For feeding or breeding, excludes stock brought in for immediate slaughter. Inshipment ratios for 2006 and 2007 revised based on new CDFA data. 2/ Includes custom slaughter for use on farms where produced and state out‐shipments, but excludes inter‐farm sales. 3/ Excludes custom slaughter for farmers at commercial establishments.

USDA, NASS, California Field Office 74 California Agricultural Statistics, 2009
Hogs and Pigs Slaughtered Under Federal and State Inspections, 2000‐2009 1/
Year Jan. Feb. Mar. Apr. May June July Aug. Sept. Oct. Nov. Dec.
Annual Total 2/
1,000 Head
2000 192.8 180.4 201.9 175.0 194.6 189.2 173.2 200.9 183.3 205.0 186.3 195.0 2,277.52001 204.8 172.0 196.0 185.6 190.9 178.6 181.8 204.9 184.0 219.4 218.1 230.9 2,367.12002 207.6 176.4 185.7 195.5 203.9 184.9 207.5 213.7 206.1 232.4 186.8 228.2 2,428.72003 215.6 179.4 193.7 198.4 199.5 196.8 205.8 199.0 199.4 215.6 194.2 234.4 2,431.92004 227.5 180.3 219.6 212.5 183.9 214.8 207.4 214.8 223.6 203.5 210.1 221.6 2,519.72005 207.6 194.3 219.8 208.2 206.6 219.1 203.1 234.0 218.5 209.3 223.9 235.8 2,580.22006 217.2 190.2 231.3 201.3 220.5 221.8 203.1 232.2 205.4 223.0 216.2 219.7 2,582.02007 219.6 204.1 218.9 210.2 221.4 210.9 206.4 231.4 201.4 239.7 234.9 251.8 2,650.72008 232.6 208.2 207.6 218.8 216.4 211.9 224.8 231.5 232.7 253.0 207.5 262.1 2,707.02009 230.0 202.1 222.5 216.0 203.3 217.9 222.9 214.3 221.4 225.7 209.2 263.3 2,698.7
1/ Includes slaughter in federally inspected and in other slaughter plants, but excludes animals slaughtered on farms.2/ Totals may not equal sum of parts due to rounding.
Average Weights of Hogs and Pigs Slaughtered Under Federal and State Inspections, 2000‐2009 1/
Year Jan. Feb. Mar. Apr. May June July Aug. Sept. Oct. Nov. Dec.
Annual Average
Pounds
2000 219 213 219 217 218 215 213 216 218 223 222 220 2182001 217 220 223 224 221 221 222 222 223 228 229 230 2242002 229 225 231 234 239 236 229 226 230 234 236 238 2322003 237 238 240 241 241 235 230 230 236 240 242 243 2382004 241 244 249 246 246 243 239 237 238 243 249 246 2432005 243 241 246 243 241 239 234 232 236 242 244 242 2402006 234 241 246 243 246 239 233 231 235 238 240 236 2382007 242 236 245 244 245 238 234 233 235 243 246 245 2412008 243 245 245 243 240 236 233 236 240 243 244 240 2412009 238 243 245 244 245 247 245 242 243 244 243 242 243
1/ Includes slaughter in federally inspected and in other slaughter plants, but excludes animals slaughtered on farms.
Goats by Class as of January 1, 2005‐2010 1/
Year Angora Goats Milk Goats Meat and Other Goats
Head
2005 3,000 38,000 75,000
2006 3,000 40,000 85,000
2007 3,500 37,000 95,000
2008 4,000 36,000 89,000
2009 4,000 37,000 95,000
2010 3,500 38,000 93,000
1/ Initiated in 2005.
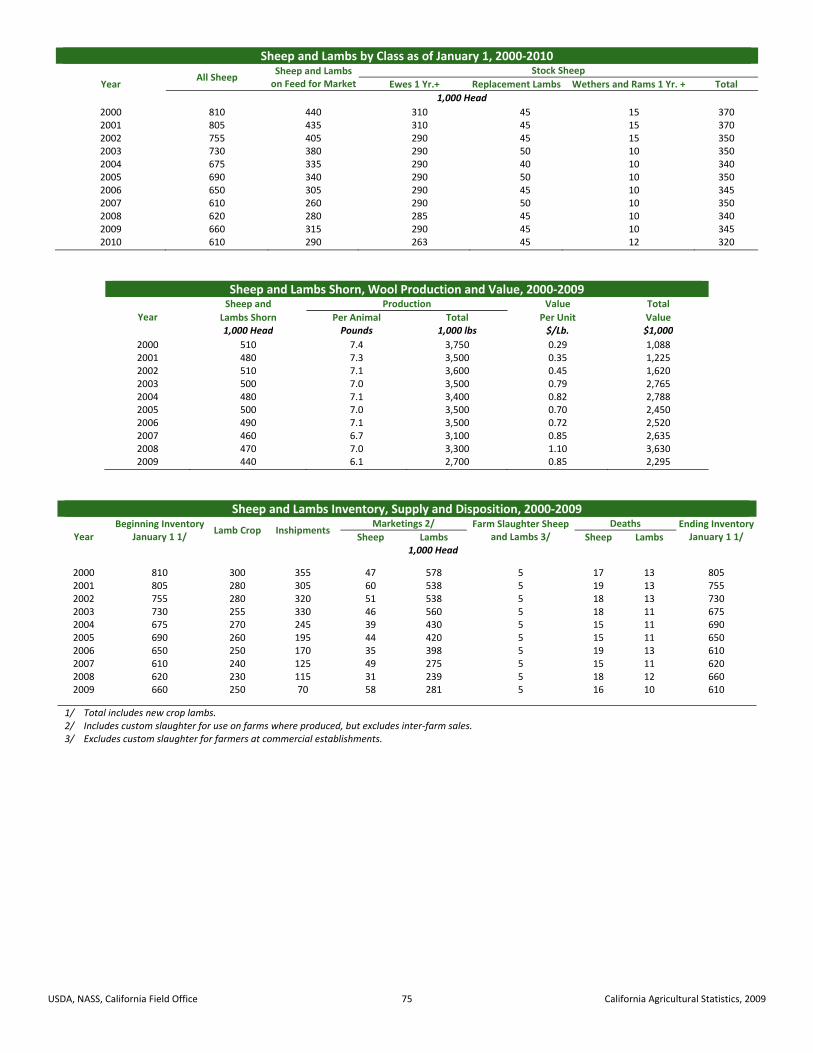
USDA, NASS, California Field Office 75 California Agricultural Statistics, 2009
Sheep and Lambs by Class as of January 1, 2000‐2010
Year All Sheep
Sheep and Lambs on Feed for Market
Stock Sheep
Ewes 1 Yr.+ Replacement Lambs Wethers and Rams 1 Yr. + Total
1,000 Head
2000 810 440 310 45 15 3702001 805 435 310 45 15 3702002 755 405 290 45 15 3502003 730 380 290 50 10 3502004 675 335 290 40 10 3402005 690 340 290 50 10 3502006 650 305 290 45 10 3452007 610 260 290 50 10 3502008 620 280 285 45 10 3402009 660 315 290 45 10 3452010 610 290 263 45 12 320
Sheep and Lambs Shorn, Wool Production and Value, 2000‐2009
Year
Sheep and Production Value Total
Lambs Shorn Per Animal Total Per Unit Value1,000 Head Pounds 1,000 lbs $/Lb. $1,000
2000 510 7.4 3,750 0.29 1,0882001 480 7.3 3,500 0.35 1,2252002 510 7.1 3,600 0.45 1,6202003 500 7.0 3,500 0.79 2,7652004 480 7.1 3,400 0.82 2,7882005 500 7.0 3,500 0.70 2,4502006 490 7.1 3,500 0.72 2,5202007 460 6.7 3,100 0.85 2,6352008 470 7.0 3,300 1.10 3,6302009 440 6.1 2,700 0.85 2,295
Sheep and Lambs Inventory, Supply and Disposition, 2000‐2009
Year Beginning Inventory
January 1 1/ Lamb Crop Inshipments
Marketings 2/ Farm Slaughter Sheep and Lambs 3/
Deaths Ending Inventory January 1 1/ Sheep Lambs Sheep Lambs
1,000 Head
2000 810 300 355 47 578 5 17 13 8052001 805 280 305 60 538 5 19 13 7552002 755 280 320 51 538 5 18 13 7302003 730 255 330 46 560 5 18 11 6752004 675 270 245 39 430 5 15 11 6902005 690 260 195 44 420 5 15 11 6502006 650 250 170 35 398 5 19 13 6102007 610 240 125 49 275 5 15 11 6202008 620 230 115 31 239 5 18 12 6602009 660 250 70 58 281 5 16 10 610
1/ Total includes new crop lambs. 2/ Includes custom slaughter for use on farms where produced, but excludes inter‐farm sales.3/ Excludes custom slaughter for farmers at commercial establishments.

USDA, NASS, California Field Office 76 California Agricultural Statistics, 2009
Sheep and Lambs Average Prices Received, 2000‐2009
Year Jan. Feb. Mar. Apr. May June July Aug. Sept. Oct. Nov. Dec.
Annual Average
1/
$/Cwt.
Sheep 2000 30.00 31.50 37.50 36.00 31.50 28.00 31.00 31.50 28.50 30.50 31.50 34.00 31.502001 40.50 38.00 39.50 31.50 31.00 26.50 29.50 31.50 28.50 26.50 24.00 31.50 30.202002 30.00 30.00 31.00 27.50 27.00 22.00 26.00 29.50 30.50 25.50 34.00 36.50 27.102003 37.00 37.50 32.00 32.00 30.00 29.00 28.00 29.50 32.50 36.00 40.50 42.50 31.302004 36.00 43.00 43.00 35.00 32.50 28.00 28.50 30.50 35.00 36.50 36.50 42.50 32.202005 46.50 45.00 43.00 40.50 48.00 40.00 37.00 40.00 35.00 36.50 42.00 48.00 41.002006 48.00 48.50 40.00 37.50 30.50 28.00 22.50 26.50 36.00 36.00 38.00 43.00 31.402007 43.00 41.00 47.00 42.00 30.00 23.50 24.00 27.50 30.50 28.00 40.00 35.00 29.602008 43.00 29.00 33.00 24.00 20.00 22.00 23.00 25.00 23.00 27.00 34.00 39.50 24.302009 45.50 33.00 36.00 35.00 33.50 29.00 24.00 26.00 27.00 32.50 43.50 44.00 31.10
Lambs 2000 72.00 72.00 80.00 81.00 91.00 90.00 87.00 83.00 79.00 75.00 70.00 68.00 79.102001 69.00 78.00 80.00 78.00 76.50 72.00 68.00 60.00 56.00 51.50 50.00 57.00 67.302002 60.50 63.50 63.00 61.00 62.00 72.50 75.00 73.50 74.50 74.50 77.00 79.00 69.402003 82.00 86.00 90.50 90.00 91.00 92.00 85.00 83.00 88.50 89.00 87.50 87.00 88.002004 89.00 93.00 96.00 91.00 91.50 94.00 89.00 86.00 87.50 86.50 86.50 90.50 90.402005 100.00 101.00 103.00 99.00 103.00 104.00 101.00 96.00 97.50 93.50 93.50 89.50 98.902006 80.50 86.50 78.50 73.50 72.00 83.50 87.00 88.50 90.00 91.50 91.50 89.50 84.002007 87.50 88.50 90.50 87.00 89.00 91.00 92.50 91.00 94.50 92.50 92.00 89.00 90.502008 89.00 89.00 88.50 84.00 86.00 93.00 95.50 95.00 91.50 95.00 97.50 92.50 91.302009 91.50 93.00 88.00 85.00 88.50 96.00 92.50 89.00 87.50 86.00 83.00 82.50 88.70
1/ Average weighted by amount sold each month.
Bee Colonies, Honey Production and Value, 2000‐2009 1/
Year Bee Colonies Yield Per Colony Production
Average Price Value
Per Unit 2/ 1,000 Pounds 1,000 Pounds ¢/Lb. $1,000
2000 440 70 30,800 59 18,1722001 460 61 28,060 69 19,3612002 470 50 23,500 132 31,0202003 480 67 32,160 139 44,7022004 390 45 17,550 105 18,4282005 400 75 30,000 86 25,8002006 380 52 19,760 97 19,1672007 340 40 13,600 104 14,1442008 360 51 18,360 139 25,5202009 355 33 11,715 139 16,284
1/ Producers with five or more colonies. Colonies which produced honey in more than one State were counted in each State. 2/ Average price per unit based on expanded sales.
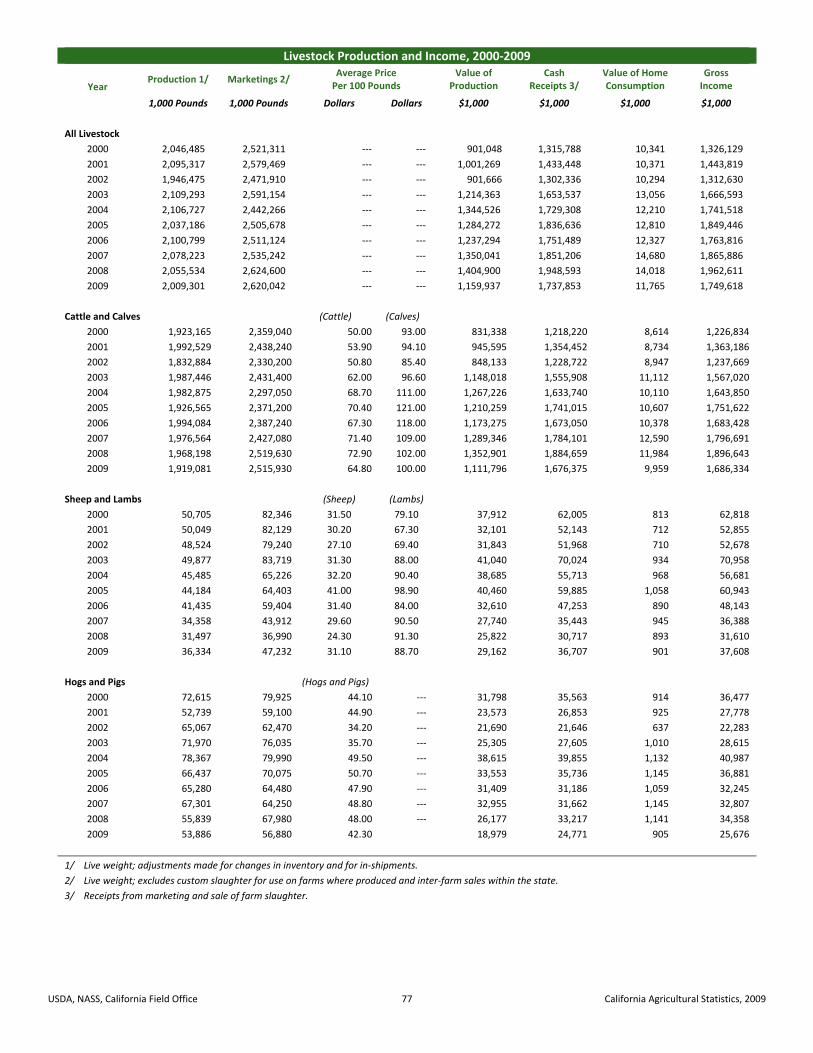
USDA, NASS, California Field Office 77 California Agricultural Statistics, 2009
Livestock Production and Income, 2000‐2009
Year Production 1/ Marketings 2/
Average Price Value of Cash Value of Home Gross Per 100 Pounds Production Receipts 3/ Consumption Income
1,000 Pounds 1,000 Pounds Dollars Dollars $1,000 $1,000 $1,000 $1,000
All Livestock
2000 2,046,485 2,521,311 ‐‐‐ ‐‐‐ 901,048 1,315,788 10,341 1,326,129
2001 2,095,317 2,579,469 ‐‐‐ ‐‐‐ 1,001,269 1,433,448 10,371 1,443,819
2002 1,946,475 2,471,910 ‐‐‐ ‐‐‐ 901,666 1,302,336 10,294 1,312,630
2003 2,109,293 2,591,154 ‐‐‐ ‐‐‐ 1,214,363 1,653,537 13,056 1,666,593
2004 2,106,727 2,442,266 ‐‐‐ ‐‐‐ 1,344,526 1,729,308 12,210 1,741,518
2005 2,037,186 2,505,678 ‐‐‐ ‐‐‐ 1,284,272 1,836,636 12,810 1,849,446
2006 2,100,799 2,511,124 ‐‐‐ ‐‐‐ 1,237,294 1,751,489 12,327 1,763,816
2007 2,078,223 2,535,242 ‐‐‐ ‐‐‐ 1,350,041 1,851,206 14,680 1,865,886
2008 2,055,534 2,624,600 ‐‐‐ ‐‐‐ 1,404,900 1,948,593 14,018 1,962,611
2009 2,009,301 2,620,042 ‐‐‐ ‐‐‐ 1,159,937 1,737,853 11,765 1,749,618
Cattle and Calves (Cattle) (Calves)
2000 1,923,165 2,359,040 50.00 93.00 831,338 1,218,220 8,614 1,226,834
2001 1,992,529 2,438,240 53.90 94.10 945,595 1,354,452 8,734 1,363,186
2002 1,832,884 2,330,200 50.80 85.40 848,133 1,228,722 8,947 1,237,669
2003 1,987,446 2,431,400 62.00 96.60 1,148,018 1,555,908 11,112 1,567,020
2004 1,982,875 2,297,050 68.70 111.00 1,267,226 1,633,740 10,110 1,643,850
2005 1,926,565 2,371,200 70.40 121.00 1,210,259 1,741,015 10,607 1,751,622
2006 1,994,084 2,387,240 67.30 118.00 1,173,275 1,673,050 10,378 1,683,428
2007 1,976,564 2,427,080 71.40 109.00 1,289,346 1,784,101 12,590 1,796,691
2008 1,968,198 2,519,630 72.90 102.00 1,352,901 1,884,659 11,984 1,896,643
2009 1,919,081 2,515,930 64.80 100.00 1,111,796 1,676,375 9,959 1,686,334
Sheep and Lambs (Sheep) (Lambs)
2000 50,705 82,346 31.50 79.10 37,912 62,005 813 62,818
2001 50,049 82,129 30.20 67.30 32,101 52,143 712 52,855
2002 48,524 79,240 27.10 69.40 31,843 51,968 710 52,678
2003 49,877 83,719 31.30 88.00 41,040 70,024 934 70,958
2004 45,485 65,226 32.20 90.40 38,685 55,713 968 56,681
2005 44,184 64,403 41.00 98.90 40,460 59,885 1,058 60,943
2006 41,435 59,404 31.40 84.00 32,610 47,253 890 48,143
2007 34,358 43,912 29.60 90.50 27,740 35,443 945 36,388
2008 31,497 36,990 24.30 91.30 25,822 30,717 893 31,610
2009 36,334 47,232 31.10 88.70 29,162 36,707 901 37,608
Hogs and Pigs (Hogs and Pigs)
2000 72,615 79,925 44.10 ‐‐‐ 31,798 35,563 914 36,477
2001 52,739 59,100 44.90 ‐‐‐ 23,573 26,853 925 27,778
2002 65,067 62,470 34.20 ‐‐‐ 21,690 21,646 637 22,283
2003 71,970 76,035 35.70 ‐‐‐ 25,305 27,605 1,010 28,615
2004 78,367 79,990 49.50 ‐‐‐ 38,615 39,855 1,132 40,987
2005 66,437 70,075 50.70 ‐‐‐ 33,553 35,736 1,145 36,881
2006 65,280 64,480 47.90 ‐‐‐ 31,409 31,186 1,059 32,245
2007 67,301 64,250 48.80 ‐‐‐ 32,955 31,662 1,145 32,807
2008 55,839 67,980 48.00 ‐‐‐ 26,177 33,217 1,141 34,358
2009 53,886 56,880 42.30 18,979 24,771 905 25,676
1/ Live weight; adjustments made for changes in inventory and for in‐shipments.
2/ Live weight; excludes custom slaughter for use on farms where produced and inter‐farm sales within the state.
3/ Receipts from marketing and sale of farm slaughter.

USDA, NASS, California Field Office 78 California Agricultural Statistics, 2009
California Cattle Inventory by Class and County, January 1, 2009‐10
County
2009 2010
All Cattle Beef Cows Milk Cows All Cattle Beef Cows Milk Cows Head
Del Norte 14,000 ‐‐‐ ‐‐‐ 17,000 1,000 ‐‐‐ Humboldt 54,000 ‐‐‐ 14,900 52,000 16,000 15,100 Mendocino 18,000 10,000 ‐‐‐ 17,000 9,000 ‐‐‐ Other Counties 1/ ‐‐‐ 19,000 5,800 ‐‐‐ ‐‐‐ 5,400 District 10 Total 86,000 29,000 20,700 86,000 26,000 20,500 Shasta 36,000 19,000 ‐‐‐ 32,000 16,000 ‐‐‐ Siskiyou 53,000 32,000 700 53,000 30,000 600 Trinity 4,000 3,000 ‐‐‐ 4,000 3,000 ‐‐‐ District 20 Total 93,000 54,000 700 89,000 49,000 600 Lassen 42,000 23,000 ‐‐‐ 41,000 22,000 ‐‐‐ Modoc 58,000 37,000 ‐‐‐ 52,000 32,000 ‐‐‐ Plumas 13,000 ‐‐‐ ‐‐‐ 11,000 5,000 ‐‐‐ Other Counties 1/ ‐‐‐ 5,000 ‐‐‐ ‐‐‐ ‐‐‐ ‐‐‐ District 30 Total 113,000 65,000 ‐‐‐ 104,000 59,000 ‐‐‐ Alameda 15,000 8,000 ‐‐‐ 15,000 8,000 ‐‐‐ Contra Costa 18,000 ‐‐‐ ‐‐‐ 16,000 ‐‐ ‐‐‐ Lake 4,000 2,000 ‐‐‐ 4,000 2,000 ‐‐‐ Marin 32,000 8,000 10,000 30,000 8,000 9,000 Monterey 55,000 21,000 1,400 53,000 20,000 ‐‐‐ Napa 7,000 ‐‐‐ ‐‐‐ 8,000 4,000 ‐‐‐ San Benito 31,000 13,000 ‐‐‐ 29,000 12,000 500 San Francisco ‐‐‐ ‐‐‐ ‐‐‐ ‐‐‐ ‐‐‐ ‐‐‐ San Luis Obispo 59,000 ‐‐‐ ‐‐‐ 56,000 21,000 ‐‐‐ San Mateo 2,000 1,000 ‐‐‐ 2,000 1,000 ‐‐‐ Santa Clara 17,000 8,000 ‐‐‐ 17,000 8,000 ‐‐‐ Santa Cruz 1,000 ‐‐‐ ‐‐‐ 1,000 ‐‐‐ ‐‐‐ Sonoma 70,000 10,000 26,600 68,000 10,000 25,600 Other Counties 1/ ‐‐‐ 30,000 800 ‐‐‐ 7,000 1,300 District 40 Total 311,000 101,000 38,800 299,000 101,000 36,400 Butte 16,000 ‐‐‐ ‐‐‐ 18,000 5,000 ‐‐‐ Colusa 15,000 ‐‐‐ ‐‐‐ 15,000 8,000 ‐‐‐ Glenn 59,000 13,000 18,900 57,000 12,000 17,000 Sacramento 65,000 12,000 16,300 68,000 13,000 14,900 Solano 44,000 ‐‐‐ 4,200 53,000 13,000 ‐‐‐ Sutter ‐‐‐ ‐‐‐ ‐‐‐ ‐‐‐ ‐‐‐ ‐‐‐ Tehama 56,000 21,000 3,900 56,000 21,000 4,600 Yolo ‐‐‐ ‐‐‐ 2,200 ‐‐‐ ‐‐‐ ‐‐‐ Yuba 18,000 5,000 3,000 21,000 7,000 3,000 Other Counties 1/ 28,000 28,000 900 29,000 10,000 6,400 District 50 Total 301,000 79,000 49,400 317,000 89,000 45,900 Fresno 425,000 ‐‐‐ 117,600 429,000 20,000 111,800 Kern 318,000 34,000 172,600 337,000 28,000 161,700 Kings 326,000 7,000 179,600 312,000 7,000 175,200 Madera 181,000 21,000 78,000 179,000 24,000 71,300 Merced 515,000 ‐‐‐ 259,600 481,000 28,000 252,800 San Joaquin 233,000 21,000 108,700 226,000 22,000 98,000 Stanislaus 408,000 38,000 179,200 378,000 32,000 174,000 Tulare 999,000 28,000 482,200 1,013,000 29,000 476,800 Other Counties 1/ ‐‐‐ 51,000 ‐‐‐ ‐‐‐ ‐‐‐ ‐‐‐ District 51 Total 3,405,000 200,000 1,577,500 3,355,000 190,000 1,521,600 Alpine ‐‐‐ ‐‐‐ ‐‐‐ 1,000 8,000 ‐‐‐ Amador 14,000 8,000 ‐‐‐ 14,000 9,000 ‐‐‐ Calaveras 21,000 9,000 ‐‐‐ 19,000 3,000 ‐‐‐ El Dorado 7,000 3,000 ‐‐‐ 7,000 7,000 ‐‐‐ Inyo 14,000 ‐‐‐ ‐‐‐ 13,000 6,000 ‐‐‐ Mariposa 19,000 ‐‐‐ ‐‐‐ 17,000 4,000 ‐‐‐ Mono ‐‐‐ 3,000 ‐‐‐ 7,000 3,000 ‐‐‐ Nevada 5,000 3,000 ‐‐‐ 5,000 ‐‐ ‐‐‐ Placer 16,000 ‐‐‐ ‐‐‐ 14,000 2,000 ‐‐‐ Sierra 4,000 2,000 ‐‐‐ 4,000 6,000 ‐‐‐ Tuolumne 12,000 7,000 ‐‐‐ 12,000 5,000 ‐‐‐ Other Counties 1/ 7,000 17,000 700 ‐‐‐ ‐‐‐ ‐‐‐ District 60 Total 119,000 52,000 700 113,000 53,000 ‐‐‐ Imperial 439,000 ‐‐‐ ‐‐‐ 437,000 ‐‐ 7,200 Los Angeles 1,000 ‐‐‐ ‐‐ ‐‐ ‐‐ Orange ‐‐‐ ‐‐‐ ‐‐‐ ‐‐ ‐‐ ‐‐ Riverside 111,000 3,000 50,200 104,000 3,000 46,300 San Bernardino 203,000 3,000 86,400 178,000 3,000 74,500 San Diego 17,000 6,000 3,700 17,000 6,000 2,500 Santa Barbara 37,000 16,000 ‐‐‐ 37,000 16,000 ‐‐ Ventura 7,000 5,000 ‐‐‐ 7,000 5,000 ‐‐ Other Counties 1/ 8,000 6,000 11,900 7,000 10,000 4,200 District 80 Total 822,000 40,000 152,200 787,000 43,000 134,700 Other Districts 2/ ‐‐‐ ‐‐‐ ‐‐‐ ‐‐‐ ‐‐‐ ‐‐‐ STATE 5,250,000 620,000 1,840,000 5,150,000 610,000 1,760,000
1/ County data combined to avoid disclosing data for individual farms. 2/ District data combined to avoid disclosing data for individual farms.

USDA, NASS, California Field Office 79 California Agricultural Statistics, 2009
Vegetables and Melons
alifornia continued as the leading fresh market vegetable producing state in 2009, accounting for 44 percent of the U.S. harvested area, 49 percent of the
national production, and 52 percent of the value, for the 24 selected vegetables and melons estimated. Fresh market production increased for snap beans, sweet corn, head and Romaine lettuce, cantaloupe, honeydew, watermelon, mushrooms, summer storage onions, chili peppers, spinach and squash. Fresh vegetable crops with decreased production included artichokes, broccoli, carrots, cucumbers, leaf lettuce, bell peppers and tomatoes. California also led the nation in processing vegetable production during 2009, with 27 percent of the U.S. harvested acreage, 69 percent of the national production and 57 percent of the total value, for the eight processed vegetables estimated. The total value of California's 2009 fresh and processing vegetable and melon production was $7.78 billion, down from 2008’s revised total of $8.08 billion. Lettuce remained the leading vegetable crop in value of production, at $1.73 billion, followed by tomatoes with $1.29 billion. Vegetable crops that had value increases were artichokes, snap beans, broccoli, processing carrots, cauliflower, sweet corn, garlic, head, leaf and Romaine lettuce, honeydew melons, agaricus mushrooms, summer storage onions, chili peppers, pumpkins, processing tomatoes and fresh spinach. Crops that had decreased value included asparagus, cabbage, fresh carrots, celery, cucumbers, cantaloupe, watermelon, spring and summer non-storage onions, bell peppers, processing spinach, squash and fresh market tomatoes. California’s cash receipts for vegetables ranked number one in the nation and accounted for 48.3 percent of the U.S. total. Valued at $7.85 billion, vegetables represented 22.5 percent of the state’s total cash income from agriculture in 2009.
According to the USDA Economic Research Service, per capita use of vegetables, melons, potatoes, sweet potatoes, pulse crops and mushrooms in the United States decreased 0.4 percent from 447 pounds in 2008 to 445 pounds in 2009. Fresh market consumption per capita in 2009 was 168 pounds, 1 percent lower than in 2008. Utilization increased for asparagus, broccoli, cucumbers, eggplant, lettuce, spinach, squash, tomatoes and cantaloupe. Declining utilization was observed for snap beans, cabbage, carrots, cauliflower, celery, sweet corn, garlic, onions, bell peppers, pumpkins, watermelon and honeydew. Per capita consumption of U.S. processing vegetables increased 5 percent from 115 pounds in 2008 to 121 pounds in 2009. Processing vegetables whose utilization increased in 2009 included snap beans, sweet corn, cucumbers, tomatoes, chili peppers, and dehydrator onions. Consumption decreased for processing spinach. Notable Increases in Production:
Romaine Lettuce .......................................................... 16% Fresh Market Snap Beans ............................................ 14% Fresh Market Sweet Corn ............................................ 13% Processing Tomatoes ................................................... 13% Chili Peppers ............................................................... 12% Notable Decreases in Production:
Summer Non-Storage Onions ...................................... 16% Spring Onions .............................................................. 14% Fresh Market Cucumbers ............................................. 14% Leaf Lettuce ................................................................. 10% Fresh Market Tomatoes ............................................... 10%
C
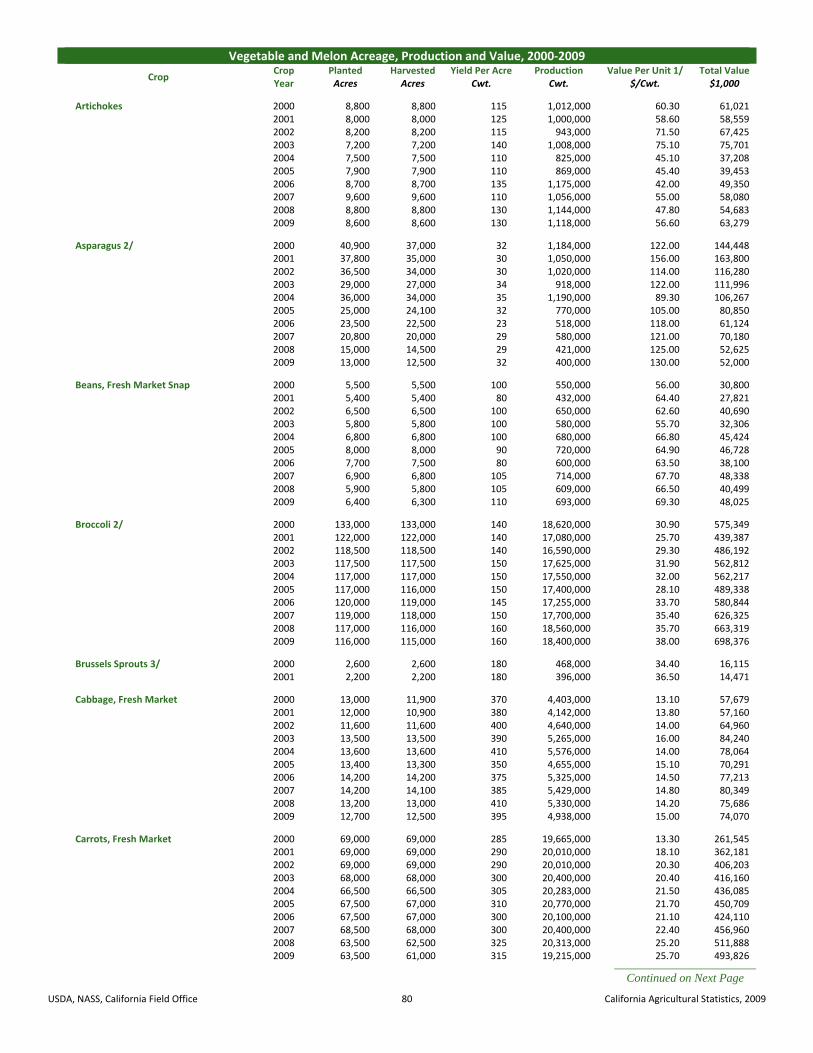
USDA, NASS, California Field Office 80 California Agricultural Statistics, 2009
Vegetable and Melon Acreage, Production and Value, 2000‐2009
Crop Crop Year
Planted Harvested Yield Per Acre Production Value Per Unit 1/ Total ValueAcres Acres Cwt. Cwt. $/Cwt. $1,000
Artichokes 2000 8,800 8,800 115 1,012,000 60.30 61,0212001 8,000 8,000 125 1,000,000 58.60 58,5592002 8,200 8,200 115 943,000 71.50 67,4252003 7,200 7,200 140 1,008,000 75.10 75,7012004 7,500 7,500 110 825,000 45.10 37,2082005 7,900 7,900 110 869,000 45.40 39,4532006 8,700 8,700 135 1,175,000 42.00 49,3502007 9,600 9,600 110 1,056,000 55.00 58,0802008 8,800 8,800 130 1,144,000 47.80 54,6832009 8,600 8,600 130 1,118,000 56.60 63,279
Asparagus 2/ 2000 40,900 37,000 32 1,184,000 122.00 144,4482001 37,800 35,000 30 1,050,000 156.00 163,8002002 36,500 34,000 30 1,020,000 114.00 116,2802003 29,000 27,000 34 918,000 122.00 111,9962004 36,000 34,000 35 1,190,000 89.30 106,2672005 25,000 24,100 32 770,000 105.00 80,8502006 23,500 22,500 23 518,000 118.00 61,1242007 20,800 20,000 29 580,000 121.00 70,1802008 15,000 14,500 29 421,000 125.00 52,6252009 13,000 12,500 32 400,000 130.00 52,000
Beans, Fresh Market Snap 2000 5,500 5,500 100 550,000 56.00 30,8002001 5,400 5,400 80 432,000 64.40 27,8212002 6,500 6,500 100 650,000 62.60 40,6902003 5,800 5,800 100 580,000 55.70 32,3062004 6,800 6,800 100 680,000 66.80 45,4242005 8,000 8,000 90 720,000 64.90 46,7282006 7,700 7,500 80 600,000 63.50 38,1002007 6,900 6,800 105 714,000 67.70 48,3382008 5,900 5,800 105 609,000 66.50 40,4992009 6,400 6,300 110 693,000 69.30 48,025
Broccoli 2/ 2000 133,000 133,000 140 18,620,000 30.90 575,3492001 122,000 122,000 140 17,080,000 25.70 439,3872002 118,500 118,500 140 16,590,000 29.30 486,1922003 117,500 117,500 150 17,625,000 31.90 562,8122004 117,000 117,000 150 17,550,000 32.00 562,2172005 117,000 116,000 150 17,400,000 28.10 489,3382006 120,000 119,000 145 17,255,000 33.70 580,8442007 119,000 118,000 150 17,700,000 35.40 626,3252008 117,000 116,000 160 18,560,000 35.70 663,3192009 116,000 115,000 160 18,400,000 38.00 698,376
Brussels Sprouts 3/ 2000 2,600 2,600 180 468,000 34.40 16,1152001 2,200 2,200 180 396,000 36.50 14,471
Cabbage, Fresh Market 2000 13,000 11,900 370 4,403,000 13.10 57,6792001 12,000 10,900 380 4,142,000 13.80 57,1602002 11,600 11,600 400 4,640,000 14.00 64,9602003 13,500 13,500 390 5,265,000 16.00 84,2402004 13,600 13,600 410 5,576,000 14.00 78,0642005 13,400 13,300 350 4,655,000 15.10 70,2912006 14,200 14,200 375 5,325,000 14.50 77,2132007 14,200 14,100 385 5,429,000 14.80 80,3492008 13,200 13,000 410 5,330,000 14.20 75,6862009 12,700 12,500 395 4,938,000 15.00 74,070
Carrots, Fresh Market 2000 69,000 69,000 285 19,665,000 13.30 261,5452001 69,000 69,000 290 20,010,000 18.10 362,1812002 69,000 69,000 290 20,010,000 20.30 406,2032003 68,000 68,000 300 20,400,000 20.40 416,1602004 66,500 66,500 305 20,283,000 21.50 436,0852005 67,500 67,000 310 20,770,000 21.70 450,7092006 67,500 67,000 300 20,100,000 21.10 424,1102007 68,500 68,000 300 20,400,000 22.40 456,9602008 63,500 62,500 325 20,313,000 25.20 511,888
2009 63,500 61,000 315 19,215,000 25.70 493,826 Continued on Next Page

USDA, NASS, California Field Office 81 California Agricultural Statistics, 2009
Vegetable and Melon Acreage, Production and Value, 2000‐2009
Crop Crop Year
Planted Harvested Yield Per Acre Production Value Per Unit 1/ Total ValueAcres Acres Cwt. Cwt. $/Cwt. $1,000
Carrots, Processing 2000 4,900 4,900 600 2,940,000 4.07 11,9662001 3,300 3,300 586 1,934,000 4.52 8,7502002 2,100 2,100 574 1,205,000 5.40 6,5092003 3,500 3,500 646 2,261,000 5.00 11,3052004 4,300 4,300 640 2,752,000 5.55 15,2742005 4,100 4,100 700 2,870,000 4.10 11,7672006 2,800 2,800 660 1,848,000 3.85 7,1152007 1,900 1,900 660 1,254,000 4.00 5,0162008 1,500 1,500 700 1,050,000 5.50 5,7752009 1,000 1,000 660 660,000 9.00 5,940
Cauliflower 2/ 2000 38,000 38,000 160 6,080,000 30.30 184,3122001 36,500 36,500 155 5,658,000 28.00 158,5452002 35,500 35,500 150 5,325,000 29.40 156,6492003 34,000 34,000 160 5,440,000 35.30 192,2102004 32,000 32,000 175 5,600,000 29.60 166,0092005 36,600 36,300 170 6,171,000 29.00 178,8042006 34,800 34,500 170 5,865,000 30.30 177,9922007 33,700 33,500 180 6,030,000 33.20 200,0452008 32,500 32,300 180 5,814,000 39.90 231,7892009 31,700 31,400 185 5,809,000 44.00 255,766
Celery 2000 24,000 24,000 720 17,280,000 18.80 324,8502001 26,500 25,500 695 17,723,000 14.40 255,8412002 25,500 25,000 710 17,750,000 12.70 225,4052003 25,300 25,300 715 18,090,000 13.30 241,3242004 25,700 25,700 710 18,247,000 15.00 273,5762005 25,500 25,200 705 17,766,000 14.00 248,8162006 26,200 26,000 705 18,330,000 18.00 330,5342007 27,200 26,500 720 19,080,000 20.70 395,6672008 26,800 26,500 720 19,080,000 18.60 354,9792009 26,800 26,600 700 18,630,000 18.80 349,918
Corn, Fresh Market Sweet 2000 24,000 24,000 165 3,960,000 18.70 74,0522001 22,000 22,000 170 3,740,000 22.30 83,4022002 26,000 26,000 175 4,550,000 19.40 88,2702003 28,500 28,500 190 5,415,000 21.80 118,0472004 24,500 24,500 190 4,655,000 20.30 94,4972005 25,600 25,300 185 4,681,000 22.20 103,9182006 24,000 23,900 180 4,302,000 19.20 82,5982007 25,700 25,600 175 4,480,000 23.90 107,0722008 25,000 24,900 160 3,984,000 23.60 94,0222009 25,000 24,900 180 4,482,000 24.80 111,154
Cucumbers, Fresh Market 2000 4,500 4,500 285 1,283,000 28.50 36,5662001 4,700 4,700 240 1,128,000 30.00 33,8402002 4,300 4,300 240 1,032,000 27.80 28,6902003 4,000 4,000 200 800,000 33.30 26,6402004 4,400 4,400 245 1,078,000 23.70 25,5492005 4,600 4,600 215 989,000 23.90 23,6372006 4,100 4,100 205 841,000 23.60 19,8482007 3,200 3,200 185 592,000 22.20 13,1422008 3,000 3,000 180 540,000 25.90 13,9862009 3,200 3,200 145 464,000 25.20 11,693
Eggplant 4/ 2000 1,600 1,600 205 328,000 27.50 9,0202001 1,400 1,400 235 329,000 24.50 8,061
Escarole and Endive 4/ 2000 2,400 2,400 160 384,000 36.70 14,0932001 2,400 2,400 150 360,000 35.50 12,780
Continued on Next Page
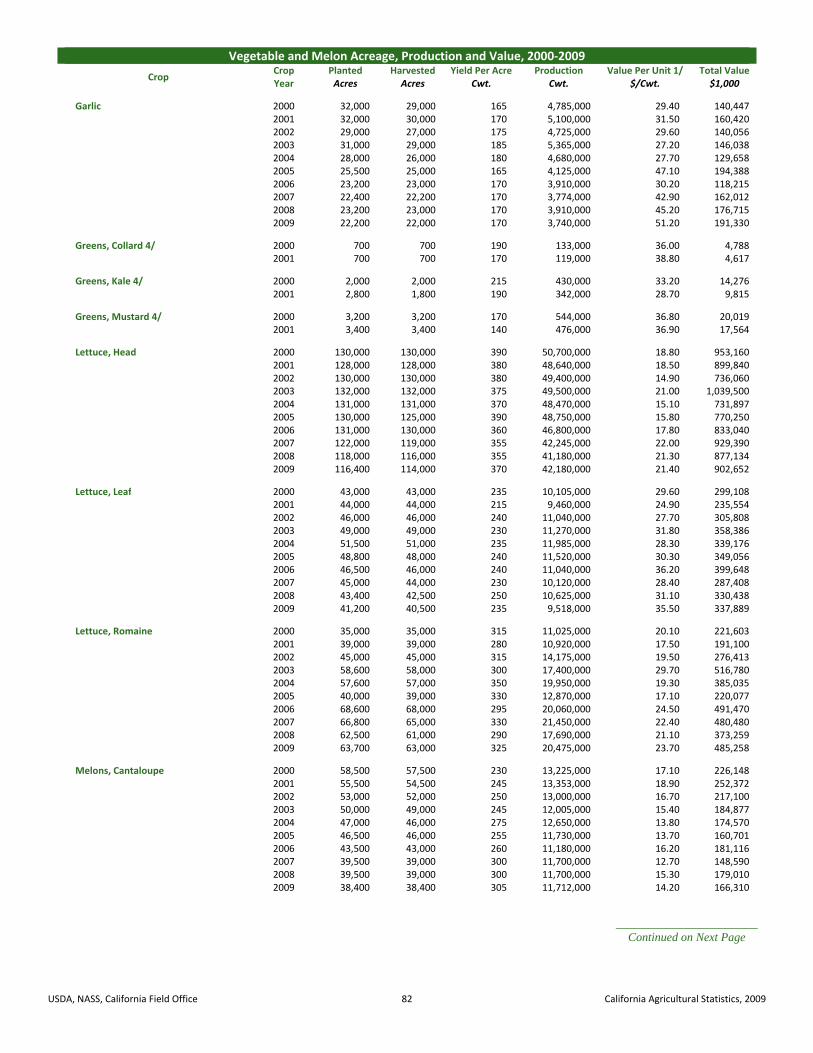
USDA, NASS, California Field Office 82 California Agricultural Statistics, 2009
Vegetable and Melon Acreage, Production and Value, 2000‐2009
Crop Crop Year
Planted Harvested Yield Per Acre Production Value Per Unit 1/ Total ValueAcres Acres Cwt. Cwt. $/Cwt. $1,000
Garlic 2000 32,000 29,000 165 4,785,000 29.40 140,4472001 32,000 30,000 170 5,100,000 31.50 160,4202002 29,000 27,000 175 4,725,000 29.60 140,0562003 31,000 29,000 185 5,365,000 27.20 146,0382004 28,000 26,000 180 4,680,000 27.70 129,6582005 25,500 25,000 165 4,125,000 47.10 194,3882006 23,200 23,000 170 3,910,000 30.20 118,2152007 22,400 22,200 170 3,774,000 42.90 162,0122008 23,200 23,000 170 3,910,000 45.20 176,7152009 22,200 22,000 170 3,740,000 51.20 191,330
Greens, Collard 4/ 2000 700 700 190 133,000 36.00 4,7882001 700 700 170 119,000 38.80 4,617
Greens, Kale 4/ 2000 2,000 2,000 215 430,000 33.20 14,2762001 2,800 1,800 190 342,000 28.70 9,815
Greens, Mustard 4/ 2000 3,200 3,200 170 544,000 36.80 20,0192001 3,400 3,400 140 476,000 36.90 17,564
Lettuce, Head 2000 130,000 130,000 390 50,700,000 18.80 953,1602001 128,000 128,000 380 48,640,000 18.50 899,8402002 130,000 130,000 380 49,400,000 14.90 736,0602003 132,000 132,000 375 49,500,000 21.00 1,039,5002004 131,000 131,000 370 48,470,000 15.10 731,8972005 130,000 125,000 390 48,750,000 15.80 770,2502006 131,000 130,000 360 46,800,000 17.80 833,0402007 122,000 119,000 355 42,245,000 22.00 929,3902008 118,000 116,000 355 41,180,000 21.30 877,1342009 116,400 114,000 370 42,180,000 21.40 902,652
Lettuce, Leaf 2000 43,000 43,000 235 10,105,000 29.60 299,1082001 44,000 44,000 215 9,460,000 24.90 235,5542002 46,000 46,000 240 11,040,000 27.70 305,8082003 49,000 49,000 230 11,270,000 31.80 358,3862004 51,500 51,000 235 11,985,000 28.30 339,1762005 48,800 48,000 240 11,520,000 30.30 349,0562006 46,500 46,000 240 11,040,000 36.20 399,6482007 45,000 44,000 230 10,120,000 28.40 287,4082008 43,400 42,500 250 10,625,000 31.10 330,4382009 41,200 40,500 235 9,518,000 35.50 337,889
Lettuce, Romaine 2000 35,000 35,000 315 11,025,000 20.10 221,6032001 39,000 39,000 280 10,920,000 17.50 191,1002002 45,000 45,000 315 14,175,000 19.50 276,4132003 58,600 58,000 300 17,400,000 29.70 516,7802004 57,600 57,000 350 19,950,000 19.30 385,0352005 40,000 39,000 330 12,870,000 17.10 220,0772006 68,600 68,000 295 20,060,000 24.50 491,4702007 66,800 65,000 330 21,450,000 22.40 480,4802008 62,500 61,000 290 17,690,000 21.10 373,2592009 63,700 63,000 325 20,475,000 23.70 485,258
Melons, Cantaloupe 2000 58,500 57,500 230 13,225,000 17.10 226,1482001 55,500 54,500 245 13,353,000 18.90 252,3722002 53,000 52,000 250 13,000,000 16.70 217,1002003 50,000 49,000 245 12,005,000 15.40 184,8772004 47,000 46,000 275 12,650,000 13.80 174,5702005 46,500 46,000 255 11,730,000 13.70 160,7012006 43,500 43,000 260 11,180,000 16.20 181,1162007 39,500 39,000 300 11,700,000 12.70 148,5902008 39,500 39,000 300 11,700,000 15.30 179,0102009 38,400 38,400 305 11,712,000 14.20 166,310
Continued on Next Page

USDA, NASS, California Field Office 83 California Agricultural Statistics, 2009
Vegetable and Melon Acreage, Production and Value, 2000‐2009
Crop Crop Year
Planted Harvested Yield Per Acre Production Value Per Unit 1/ Total ValueAcres Acres Cwt. Cwt. $/Cwt. $1,000
Melons, Honeydew 2000 20,000 20,000 185 3,700,000 18.60 68,8202001 20,000 20,000 185 3,700,000 19.70 72,8902002 20,400 20,400 185 3,774,000 16.80 63,4032003 17,500 17,500 200 3,500,000 17.50 61,2502004 15,900 15,900 220 3,498,000 17.70 61,9152005 14,900 14,900 210 3,129,000 17.70 55,3832006 13,500 13,500 205 2,768,000 16.30 45,1182007 13,600 13,600 210 2,856,000 16.70 47,6952008 13,100 13,100 205 2,686,000 14.00 37,6042009 13,000 12,800 210 2,688,000 14.20 38,170
Melons, Watermelon 2000 12,300 12,300 535 6,581,000 11.70 76,9982001 11,800 11,800 530 6,254,000 10.90 68,1692002 11,500 11,500 510 5,865,000 12.70 74,4862003 11,700 11,700 480 5,616,000 12.10 67,9542004 13,500 13,500 490 6,615,000 10.60 70,1192005 12,500 12,500 525 6,563,000 11.10 72,8492006 10,600 10,500 545 5,723,000 11.30 64,6702007 11,500 11,400 570 6,498,000 11.30 73,4272008 11,400 11,300 580 6,554,000 15.90 104,2092009 12,600 12,400 560 6,944,000 12.40 86,106
Mushrooms, Agaricus 99‐00 ‐‐‐ 548 2,412 1,322,000 122.00 161,61200‐01 ‐‐‐ 526 2,456 1,292,000 126.00 162,98801‐02 ‐‐‐ 524 2,460 1,289,000 134.00 172,16802‐03 ‐‐‐ 520 2,456 1,277,000 133.00 170,23403‐04 ‐‐‐ 490 2,520 1,235,000 140.00 172,94304‐05 ‐‐‐ 471 2,519 1,186,480 145.00 172,46505‐06 ‐‐‐ 503 2,344 1,179,160 150.00 176,63806‐07 ‐‐‐ 570 2,068 1,178,510 159.00 187,47307‐08 ‐‐‐ 500 2,376 1,188,110 160.00 189,61508‐09 ‐‐‐ 472 2,625 1,239,190 163.00 202,599
Onions, Spring 2000 6,900 6,800 435 2,958,000 10.60 31,3352001 6,400 6,200 430 2,666,000 13.50 35,9912002 5,900 5,700 475 2,708,000 14.20 38,4542003 7,700 7,500 490 3,675,000 22.90 84,1582004 7,300 7,100 505 3,586,000 10.10 36,2192005 8,200 8,000 475 3,800,000 12.40 47,1202006 7,800 7,600 415 3,154,000 9.30 29,3322007 6,900 6,700 450 3,015,000 11.00 33,1652008 6,700 6,500 440 2,860,000 8.60 24,5962009 6,200 6,000 410 2,460,000 8.60 21,156
Onions, Summer Storage 5/ 2000 35,600 34,000 445 15,130,000 7.98 118,6842001 31,000 29,800 405 12,069,000 7.26 85,7482002 29,200 28,200 410 11,562,000 7.27 82,2382003 36,000 35,000 420 14,700,000 7.54 108,9042004 30,900 30,000 440 13,200,000 6.26 81,1202005 31,800 30,600 400 12,240,000 8.49 101,7412006 33,100 31,800 425 13,515,000 9.14 121,2212007 30,000 29,000 425 12,325,000 8.53 102,9592008 32,500 31,300 425 13,303,000 9.01 117,5872009 32,600 31,400 455 14,287,000 9.54 133,941
Onions, Summer Non‐Storage 6/ 2001 7,300 7,000 450 3,150,000 13.50 42,5252002 6,900 6,600 480 3,168,000 12.90 40,8672003 7,800 7,500 530 3,975,000 13.70 54,4582004 8,800 8,400 560 4,704,000 8.80 41,3952005 9,000 8,600 550 4,730,000 11.00 52,0302006 9,100 8,700 560 4,872,000 12.40 60,4132007 8,000 7,800 565 4,407,000 9.90 43,6292008 7,800 7,600 540 4,104,000 8.60 35,2942009 6,600 6,400 540 3,456,000 8.60 29,722
Continued on Next Page

USDA, NASS, California Field Office 84 California Agricultural Statistics, 2009
Vegetable and Melon Acreage, Production and Value, 2000‐2009
Crop Crop Year
Planted Harvested Yield Per Acre Production Value Per Unit 1/ Total ValueAcres Acres Cwt. Cwt. $/Cwt. $1,000
Onions, Processing 7/ 2000 ‐‐‐ ‐‐‐ ‐‐‐ 10,580,000 6.30 66,6542001 ‐‐‐ ‐‐‐ ‐‐‐ 9,125,000 5.50 50,1882002 ‐‐‐ ‐‐‐ ‐‐‐ 8,602,000 5.30 45,5912003 ‐‐‐ ‐‐‐ ‐‐‐ 10,800,000 5.18 55,9442004 ‐‐‐ ‐‐‐ ‐‐‐ 9,090,000 5.13 46,6322005 ‐‐‐ ‐‐‐ ‐‐‐ 8,290,000 7.14 59,1912006 ‐‐‐ ‐‐‐ ‐‐‐ 9,365,000 7.80 73,0472007 ‐‐‐ ‐‐‐ ‐‐‐ 8,655,000 8.30 71,8372008 ‐‐‐ ‐‐‐ ‐‐‐ 9,872,000 9.14 90,2302009 ‐‐‐ ‐‐‐ ‐‐‐ 10,875,000 10.00 108,750
Peppers, Bell 2000 21,000 21,000 300 6,300,000 27.30 171,7882001 22,000 22,000 325 7,150,000 25.50 182,3432002 19,300 19,000 370 7,030,000 28.50 200,6182003 18,500 18,500 390 7,215,000 28.60 206,6062004 19,300 19,000 400 7,600,000 28.60 217,7012005 23,000 23,000 370 8,515,000 28.20 239,7152006 22,300 22,000 350 7,700,000 29.70 228,5202007 21,100 21,000 380 7,980,000 28.50 227,7582008 20,500 20,000 405 8,062,000 36.10 290,6922009 20,600 20,500 370 7,595,000 30.10 228,472
Peppers, Chili 8/ 2000 4,800 4,800 230 1,104,000 35.60 39,2702001 4,400 4,400 225 990,000 36.80 36,4032002 4,700 4,700 230 1,081,000 38.40 41,4632003 4,800 4,800 230 1,104,000 33.50 36,9992004 5,300 5,300 245 1,299,000 24.40 31,7292005 6,000 5,900 240 1,407,000 28.60 40,1842006 5,500 5,500 330 1,815,000 24.30 44,0492007 5,800 5,800 310 1,798,000 34.40 61,8842008 5,700 5,600 325 1,810,000 24.30 44,0412009 5,900 5,800 350 2,033,000 24.80 50,409
Pumpkins 6/ 2000 5,900 5,900 305 1,800,000 10.60 19,0802001 6,100 6,100 240 1,464,000 11.20 16,3972002 5,500 5,500 280 1,540,000 11.50 17,7102003 5,300 4,900 250 1,225,000 12.40 15,1902004 5,200 5,200 270 1,404,000 7.40 10,3902005 5,500 5,500 290 1,595,000 9.00 14,3552006 5,400 5,300 250 1,325,000 11.40 15,1052007 5,200 5,100 240 1,224,000 10.50 12,8522008 5,300 5,300 280 1,484,000 12.50 18,5502009 5,100 5,100 290 1,479,000 13.90 20,558
Radishes 4/ 2000 1,500 1,500 250 375,000 26.00 9,7502001 1,600 1,600 230 368,000 24.50 9,016
Spinach, Fresh Market 2000 17,000 17,000 180 3,060,000 30.70 93,9422001 15,000 15,000 155 2,325,000 32.60 75,7952002 21,000 21,000 155 3,255,000 34.60 112,6232003 23,000 23,000 160 3,680,000 40.70 149,7762004 24,000 24,000 170 4,080,000 20.20 82,4162005 30,500 30,000 180 5,400,000 20.70 111,7802006 30,000 25,000 180 4,500,000 30.80 138,6002007 23,500 23,000 175 4,025,000 32.00 128,8002008 25,500 25,000 165 4,125,000 34.00 140,2502009 29,500 28,500 155 4,418,000 38.00 167,884
Spinach, Processing 9/ 2002 7,300 7,300 204 1,489,000 5.95 8,8612003 10,600 10,600 159 1,688,200 5.49 9,2722004 7,800 7,800 224 1,747,200 5.90 10,3082005 6,100 6,100 258 1,573,400 5.38 8,4642006 6,300 6,300 159 999,200 6.40 6,3952007 8,500 8,500 140 1,190,000 5.90 7,0212008 7,100 7,100 190 1,349,000 6.30 8,4992009 7,500 7,500 167 1,251,000 5.90 7,381
Continued on Next Page

USDA, NASS, California Field Office 85 California Agricultural Statistics, 2009
Vegetable and Melon Acreage, Production and Value, 2000‐2009
Crop Crop Year
Planted Harvested Yield Per Acre Production Value Per Unit 1/ Total ValueAcres Acres Cwt. Cwt. $/Cwt. $1,000
Squash 6/ 2000 8,300 8,300 180 1,494,000 20.00 29,9512001 8,000 8,000 190 1,520,000 18.50 28,0602002 7,900 7,900 190 1,501,000 20.90 31,3842003 6,700 6,500 195 1,268,000 22.60 28,6002004 6,100 5,900 210 1,239,000 28.50 35,3222005 6,700 6,500 220 1,430,000 23.30 33,3012006 6,000 5,800 205 1,189,000 22.10 26,2612007 5,800 5,600 210 1,176,000 24.70 29,0822008 5,700 5,500 205 1,128,000 29.70 33,5002009 5,900 5,800 210 1,218,000 26.40 32,160
Tomatoes, Fresh Market 2000 44,000 44,000 290 12,760,000 29.80 380,2482001 42,000 42,000 270 11,340,000 24.90 282,3662002 40,000 40,000 315 12,600,000 25.30 318,7802003 34,000 34,000 300 10,200,000 35.90 366,1802004 42,500 42,000 310 13,020,000 39.20 510,3842005 41,000 40,000 280 11,200,000 31.00 347,2002006 41,400 41,000 280 11,480,000 44.00 505,1202007 38,000 37,000 300 11,100,000 33.70 374,0702008 38,000 37,000 315 11,655,000 33.30 388,1122009 36,500 36,000 290 10,440,000 34.80 363,312
Miscellaneous Vegetables 2000 ‐‐‐ 194,000 ‐‐‐ 73,063,000 ‐‐‐ 920,215and Melons, Fresh Market 2001 ‐‐‐ 212,000 ‐‐‐ 74,688,000 ‐‐‐ 960,780and Processing 10/ 2002 ‐‐‐ 316,000 ‐‐‐ 118,360,000 ‐‐‐ 1,386,455
2003 ‐‐‐ 180,000 ‐‐‐ 60,880,000 ‐‐‐ 872,1682004 ‐‐‐ 183,000 ‐‐‐ 71,780,000 ‐‐‐ 860,3842005 ‐‐‐ 210,000 ‐‐‐ 77,900,000 ‐‐‐ 991,6832006 ‐‐‐ 190,000 ‐‐‐ 70,060,000 ‐‐‐ 992,5842007 ‐‐‐ 191,000 ‐‐‐ 77,680,000 ‐‐‐ 1,065,8152008 ‐‐‐ 269,000 ‐‐‐ 113,140,000 ‐‐‐ 1,596,7212009 ‐‐‐ 187,000 ‐‐‐ 81,280,000 ‐‐‐ 1,112,774
1/ The processed price is based on equivalent returns at the processing plant door. The fresh market price is at the point of first sale. 2/ Includes both fresh marketing and processing vegetables.3/ Estimates discontinued in 2002. 4/ Estimates began in 2000 and discontinued in 2002. 5/ Includes fresh and processed. Production includes quantity harvested, but not marketed because of loss during storage (shrinkage): 2000 to 2009 ‐‐ 250,000 cwt. Storage loss amounts are excluded when computing total value. Includes some quantities not marketed and excluded in computing value. 6/ Estimates began in 2000. 7/ Included in summer storage onions. 8/ Estimates began in 1929, but were reinitiated in 2000 after being discontinued for nine years.9/ Estimates began in 2002. 10/ Miscellaneous vegetables and melons include: Green lima beans for processing, oriental vegetables, green peas, etc. The crops added in 2000 and discontinued in 2002 are excluded from the 2000 and 2001 miscellaneous totals.
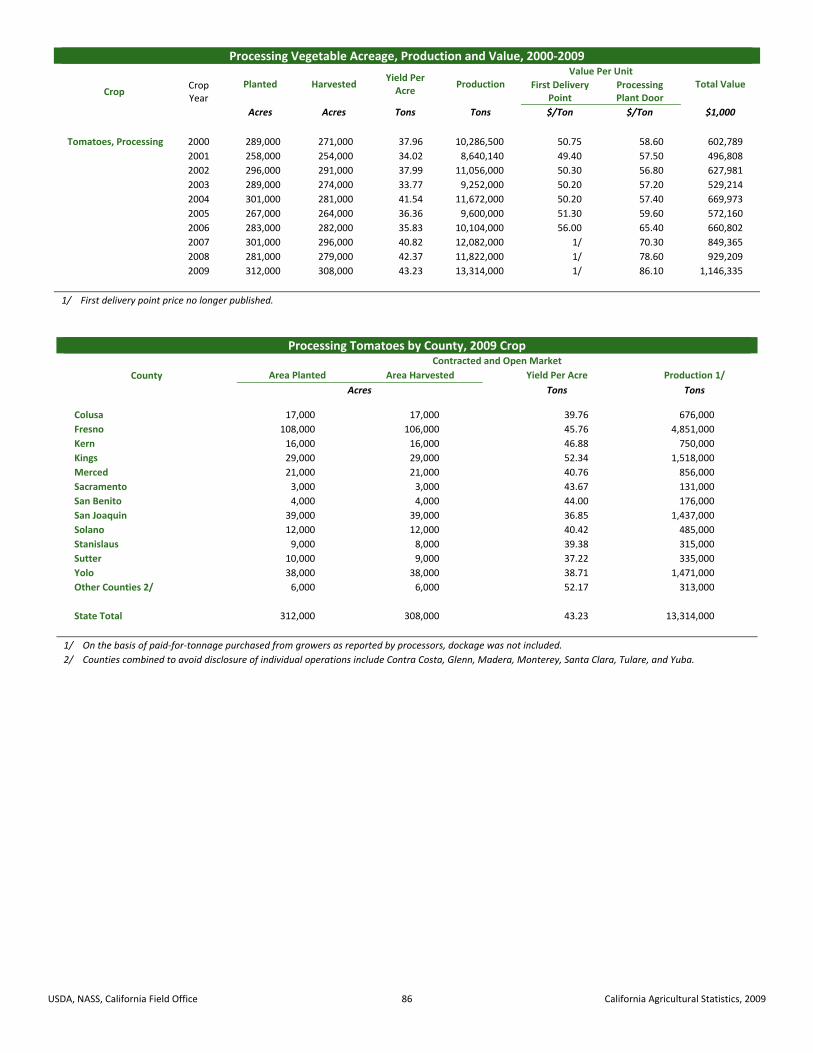
USDA, NASS, California Field Office 86 California Agricultural Statistics, 2009
Processing Vegetable Acreage, Production and Value, 2000‐2009
Crop Crop Year
Planted Harvested Yield Per Acre
Production Value Per Unit
Total Value First Delivery Point
Processing Plant Door
Acres Acres Tons Tons $/Ton $/Ton $1,000
Tomatoes, Processing 2000 289,000 271,000 37.96 10,286,500 50.75 58.60 602,789
2001 258,000 254,000 34.02 8,640,140 49.40 57.50 496,808
2002 296,000 291,000 37.99 11,056,000 50.30 56.80 627,981
2003 289,000 274,000 33.77 9,252,000 50.20 57.20 529,214
2004 301,000 281,000 41.54 11,672,000 50.20 57.40 669,973
2005 267,000 264,000 36.36 9,600,000 51.30 59.60 572,160
2006 283,000 282,000 35.83 10,104,000 56.00 65.40 660,802
2007 301,000 296,000 40.82 12,082,000 1/ 70.30 849,365
2008 281,000 279,000 42.37 11,822,000 1/ 78.60 929,209
2009 312,000 308,000 43.23 13,314,000 1/ 86.10 1,146,335
1/ First delivery point price no longer published.
Processing Tomatoes by County, 2009 Crop
County
Contracted and Open Market
Area Planted Area Harvested Yield Per Acre Production 1/
Acres Tons Tons
Colusa 17,000 17,000 39.76 676,000
Fresno 108,000 106,000 45.76 4,851,000
Kern 16,000 16,000 46.88 750,000
Kings 29,000 29,000 52.34 1,518,000
Merced 21,000 21,000 40.76 856,000
Sacramento 3,000 3,000 43.67 131,000
San Benito 4,000 4,000 44.00 176,000
San Joaquin 39,000 39,000 36.85 1,437,000
Solano 12,000 12,000 40.42 485,000
Stanislaus 9,000 8,000 39.38 315,000
Sutter 10,000 9,000 37.22 335,000
Yolo 38,000 38,000 38.71 1,471,000
Other Counties 2/ 6,000 6,000 52.17 313,000
State Total 312,000 308,000 43.23 13,314,000
1/ On the basis of paid‐for‐tonnage purchased from growers as reported by processors, dockage was not included.
2/ Counties combined to avoid disclosure of individual operations include Contra Costa, Glenn, Madera, Monterey, Santa Clara, Tulare, and Yuba.
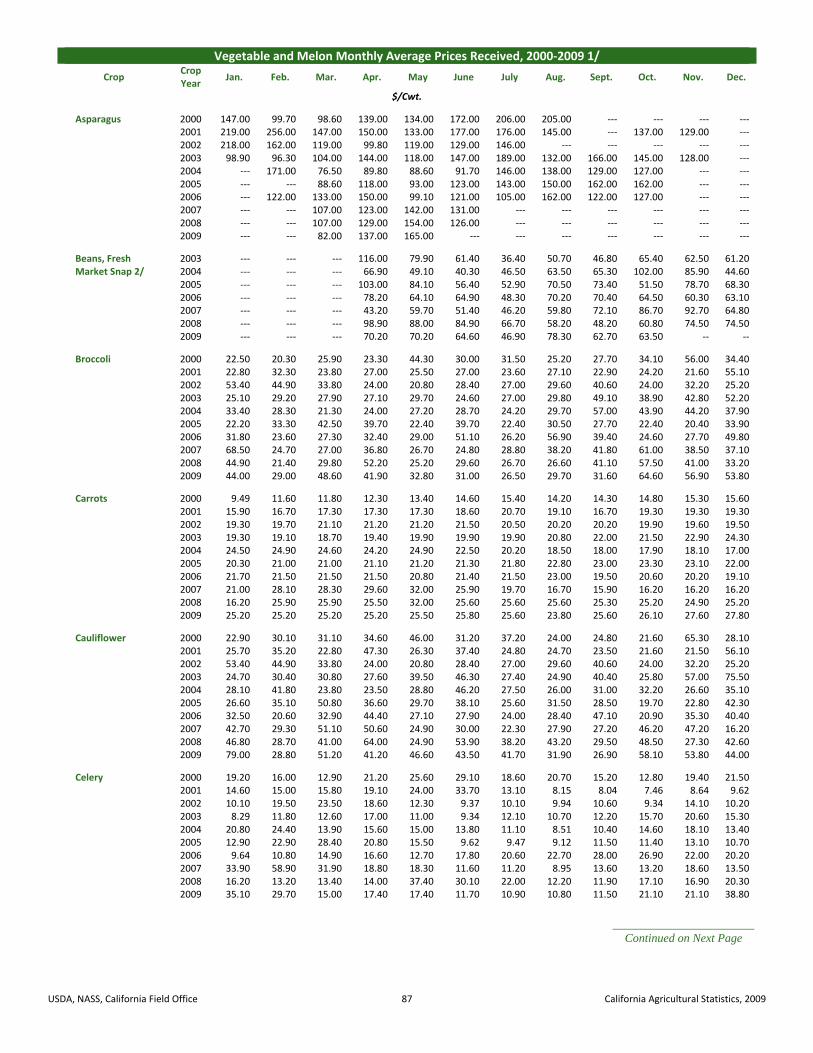
USDA, NASS, California Field Office 87 California Agricultural Statistics, 2009
Vegetable and Melon Monthly Average Prices Received, 2000‐2009 1/
Crop Crop Year
Jan. Feb. Mar. Apr. May June July Aug. Sept. Oct. Nov. Dec.
$/Cwt.
Asparagus 2000 147.00 99.70 98.60 139.00 134.00 172.00 206.00 205.00 ‐‐‐ ‐‐‐ ‐‐‐ ‐‐‐2001 219.00 256.00 147.00 150.00 133.00 177.00 176.00 145.00 ‐‐‐ 137.00 129.00 ‐‐‐2002 218.00 162.00 119.00 99.80 119.00 129.00 146.00 ‐‐‐ ‐‐‐ ‐‐‐ ‐‐‐ ‐‐‐2003 98.90 96.30 104.00 144.00 118.00 147.00 189.00 132.00 166.00 145.00 128.00 ‐‐‐2004 ‐‐‐ 171.00 76.50 89.80 88.60 91.70 146.00 138.00 129.00 127.00 ‐‐‐ ‐‐‐2005 ‐‐‐ ‐‐‐ 88.60 118.00 93.00 123.00 143.00 150.00 162.00 162.00 ‐‐‐ ‐‐‐2006 ‐‐‐ 122.00 133.00 150.00 99.10 121.00 105.00 162.00 122.00 127.00 ‐‐‐ ‐‐‐2007 ‐‐‐ ‐‐‐ 107.00 123.00 142.00 131.00 ‐‐‐ ‐‐‐ ‐‐‐ ‐‐‐ ‐‐‐ ‐‐‐2008 ‐‐‐ ‐‐‐ 107.00 129.00 154.00 126.00 ‐‐‐ ‐‐‐ ‐‐‐ ‐‐‐ ‐‐‐ ‐‐‐2009 ‐‐‐ ‐‐‐ 82.00 137.00 165.00 ‐‐‐ ‐‐‐ ‐‐‐ ‐‐‐ ‐‐‐ ‐‐‐ ‐‐‐
Beans, Fresh 2003 ‐‐‐ ‐‐‐ ‐‐‐ 116.00 79.90 61.40 36.40 50.70 46.80 65.40 62.50 61.20Market Snap 2/ 2004 ‐‐‐ ‐‐‐ ‐‐‐ 66.90 49.10 40.30 46.50 63.50 65.30 102.00 85.90 44.60
2005 ‐‐‐ ‐‐‐ ‐‐‐ 103.00 84.10 56.40 52.90 70.50 73.40 51.50 78.70 68.302006 ‐‐‐ ‐‐‐ ‐‐‐ 78.20 64.10 64.90 48.30 70.20 70.40 64.50 60.30 63.102007 ‐‐‐ ‐‐‐ ‐‐‐ 43.20 59.70 51.40 46.20 59.80 72.10 86.70 92.70 64.802008 ‐‐‐ ‐‐‐ ‐‐‐ 98.90 88.00 84.90 66.70 58.20 48.20 60.80 74.50 74.502009 ‐‐‐ ‐‐‐ ‐‐‐ 70.20 70.20 64.60 46.90 78.30 62.70 63.50 ‐‐ ‐‐
Broccoli 2000 22.50 20.30 25.90 23.30 44.30 30.00 31.50 25.20 27.70 34.10 56.00 34.402001 22.80 32.30 23.80 27.00 25.50 27.00 23.60 27.10 22.90 24.20 21.60 55.102002 53.40 44.90 33.80 24.00 20.80 28.40 27.00 29.60 40.60 24.00 32.20 25.202003 25.10 29.20 27.90 27.10 29.70 24.60 27.00 29.80 49.10 38.90 42.80 52.202004 33.40 28.30 21.30 24.00 27.20 28.70 24.20 29.70 57.00 43.90 44.20 37.902005 22.20 33.30 42.50 39.70 22.40 39.70 22.40 30.50 27.70 22.40 20.40 33.902006 31.80 23.60 27.30 32.40 29.00 51.10 26.20 56.90 39.40 24.60 27.70 49.802007 68.50 24.70 27.00 36.80 26.70 24.80 28.80 38.20 41.80 61.00 38.50 37.102008 44.90 21.40 29.80 52.20 25.20 29.60 26.70 26.60 41.10 57.50 41.00 33.202009 44.00 29.00 48.60 41.90 32.80 31.00 26.50 29.70 31.60 64.60 56.90 53.80
Carrots 2000 9.49 11.60 11.80 12.30 13.40 14.60 15.40 14.20 14.30 14.80 15.30 15.602001 15.90 16.70 17.30 17.30 17.30 18.60 20.70 19.10 16.70 19.30 19.30 19.302002 19.30 19.70 21.10 21.20 21.20 21.50 20.50 20.20 20.20 19.90 19.60 19.502003 19.30 19.10 18.70 19.40 19.90 19.90 19.90 20.80 22.00 21.50 22.90 24.302004 24.50 24.90 24.60 24.20 24.90 22.50 20.20 18.50 18.00 17.90 18.10 17.002005 20.30 21.00 21.00 21.10 21.20 21.30 21.80 22.80 23.00 23.30 23.10 22.002006 21.70 21.50 21.50 21.50 20.80 21.40 21.50 23.00 19.50 20.60 20.20 19.102007 21.00 28.10 28.30 29.60 32.00 25.90 19.70 16.70 15.90 16.20 16.20 16.202008 16.20 25.90 25.90 25.50 32.00 25.60 25.60 25.60 25.30 25.20 24.90 25.202009 25.20 25.20 25.20 25.20 25.50 25.80 25.60 23.80 25.60 26.10 27.60 27.80
Cauliflower 2000 22.90 30.10 31.10 34.60 46.00 31.20 37.20 24.00 24.80 21.60 65.30 28.102001 25.70 35.20 22.80 47.30 26.30 37.40 24.80 24.70 23.50 21.60 21.50 56.102002 53.40 44.90 33.80 24.00 20.80 28.40 27.00 29.60 40.60 24.00 32.20 25.202003 24.70 30.40 30.80 27.60 39.50 46.30 27.40 24.90 40.40 25.80 57.00 75.502004 28.10 41.80 23.80 23.50 28.80 46.20 27.50 26.00 31.00 32.20 26.60 35.102005 26.60 35.10 50.80 36.60 29.70 38.10 25.60 31.50 28.50 19.70 22.80 42.302006 32.50 20.60 32.90 44.40 27.10 27.90 24.00 28.40 47.10 20.90 35.30 40.402007 42.70 29.30 51.10 50.60 24.90 30.00 22.30 27.90 27.20 46.20 47.20 16.202008 46.80 28.70 41.00 64.00 24.90 53.90 38.20 43.20 29.50 48.50 27.30 42.602009 79.00 28.80 51.20 41.20 46.60 43.50 41.70 31.90 26.90 58.10 53.80 44.00
Celery 2000 19.20 16.00 12.90 21.20 25.60 29.10 18.60 20.70 15.20 12.80 19.40 21.502001 14.60 15.00 15.80 19.10 24.00 33.70 13.10 8.15 8.04 7.46 8.64 9.622002 10.10 19.50 23.50 18.60 12.30 9.37 10.10 9.94 10.60 9.34 14.10 10.202003 8.29 11.80 12.60 17.00 11.00 9.34 12.10 10.70 12.20 15.70 20.60 15.302004 20.80 24.40 13.90 15.60 15.00 13.80 11.10 8.51 10.40 14.60 18.10 13.402005 12.90 22.90 28.40 20.80 15.50 9.62 9.47 9.12 11.50 11.40 13.10 10.702006 9.64 10.80 14.90 16.60 12.70 17.80 20.60 22.70 28.00 26.90 22.00 20.202007 33.90 58.90 31.90 18.80 18.30 11.60 11.20 8.95 13.60 13.20 18.60 13.502008 16.20 13.20 13.40 14.00 37.40 30.10 22.00 12.20 11.90 17.10 16.90 20.302009 35.10 29.70 15.00 17.40 17.40 11.70 10.90 10.80 11.50 21.10 21.10 38.80
Continued on Next Page

USDA, NASS, California Field Office 88 California Agricultural Statistics, 2009
Vegetable and Melon Monthly Average Prices Received, 2000‐2009 1/
Crop Crop Year
Jan. Feb. Mar. Apr. May June July Aug. Sept. Oct. Nov. Dec.
$/Cwt.
Corn, Sweet 2000 ‐‐‐ ‐‐‐ ‐‐‐ 21.90 14.30 18.80 15.50 19.20 26.90 16.30 20.80 ‐‐‐2001 ‐‐‐ ‐‐‐ ‐‐‐ 28.60 29.40 18.90 18.00 18.50 24.00 26.50 23.20 20.502002 ‐‐‐ ‐‐‐ ‐‐‐ 29.60 25.00 19.40 19.00 15.70 19.50 17.40 19.00 16.702003 ‐‐‐ ‐‐‐ ‐‐‐ 27.50 21.00 23.20 17.60 16.60 22.20 24.10 31.60 43.402004 ‐‐‐ ‐‐‐ ‐‐‐ 22.20 16.90 17.70 15.20 19.50 22.10 32.50 32.20 25.402005 ‐‐‐ ‐‐‐ ‐‐‐ 30.10 24.90 26.20 16.00 16.90 25.50 25.50 25.70 18.602006 ‐‐‐ ‐‐‐ ‐‐‐ 37.60 16.00 22.70 14.60 17.30 27.40 16.60 15.80 20.802007 ‐‐‐ ‐‐‐ ‐‐‐ 34.80 22.20 19.60 19.20 26.90 31.30 36.00 30.90 34.602008 ‐‐‐ ‐‐‐ ‐‐‐ 22.60 26.20 27.10 25.00 19.10 24.60 18.80 20.00 17.602009 ‐‐‐ ‐‐‐ ‐‐‐ 37.50 19.70 24.20 33.00 25.00 22.20 24.50 25.60 ‐‐‐
Cucumbers, 2000 ‐‐‐ ‐‐‐ ‐‐‐ ‐‐‐ 23.90 28.00 35.00 28.50 28.10 33.10 28.80 ‐‐‐Fresh Market 2001 ‐‐‐ ‐‐‐ ‐‐‐ ‐‐‐ 21.50 38.60 26.10 32.50 34.60 26.00 22.20 ‐‐‐
2002 ‐‐‐ ‐‐‐ ‐‐‐ ‐‐‐ ‐‐‐ 31.30 28.80 25.20 21.70 28.30 35.90 ‐‐‐2003 ‐‐‐ ‐‐‐ ‐‐‐ ‐‐‐ ‐‐‐ 45.20 23.70 26.70 37.00 39.30 25.60 ‐‐‐2004 ‐‐‐ ‐‐‐ ‐‐‐ ‐‐‐ 11.00 16.90 18.30 33.50 33.50 24.90 ‐‐‐ ‐‐‐2005 ‐‐‐ ‐‐‐ ‐‐‐ ‐‐‐ ‐‐‐ ‐‐‐ 14.60 ‐‐‐ 25.70 30.20 28.70 ‐‐‐2006 ‐‐‐ ‐‐‐ ‐‐‐ ‐‐‐ ‐‐‐ ‐‐‐ 29.30 ‐‐‐ 24.00 18.10 20.40 ‐‐‐2007 ‐‐‐ ‐‐‐ ‐‐‐ ‐‐‐ ‐‐‐ ‐‐‐ ‐‐‐ ‐‐‐ 27.10 20.90 14.00 ‐‐‐2008 ‐‐‐ ‐‐‐ ‐‐‐ ‐‐‐ ‐‐‐ ‐‐‐ ‐‐‐ ‐‐‐ ‐‐‐ ‐‐‐ ‐‐‐ ‐‐‐2009 ‐‐‐ ‐‐‐ ‐‐‐ ‐‐‐ ‐‐‐ ‐‐‐ ‐‐‐ ‐‐‐ ‐‐‐ ‐‐‐ ‐‐‐ ‐‐‐
Lettuce, Head 2000 15.00 10.00 12.40 23.30 23.50 13.40 15.00 19.20 29.40 16.10 18.00 12.202001 14.50 24.10 15.00 21.90 18.50 12.00 16.40 26.90 26.20 11.30 10.90 29.602002 29.00 43.10 80.60 13.60 9.97 10.50 11.30 14.60 14.30 13.30 11.60 11.702003 12.60 11.60 10.10 14.20 21.20 32.20 11.90 21.50 23.90 26.30 31.70 21.302004 12.80 20.60 11.50 14.90 10.50 13.30 10.70 17.10 15.20 24.10 14.90 13.402005 11.70 12.80 34.20 30.30 13.90 17.30 11.00 13.50 12.70 12.40 10.20 15.002006 11.00 12.90 18.80 22.50 33.70 11.80 12.20 20.70 16.30 11.80 13.40 21.002007 19.50 16.00 28.80 17.90 13.60 17.80 17.30 23.10 29.20 44.40 17.80 15.002008 16.30 13.50 14.90 21.90 15.50 17.70 17.30 17.20 31.90 32.90 19.00 21.402009 26.10 17.10 18.30 27.50 18.20 18.90 16.90 16.70 16.60 27.20 48.80 31.40
Melons, 2000 ‐‐‐ ‐‐‐ ‐‐‐ ‐‐‐ 16.70 16.80 14.30 12.30 19.00 24.00 23.20 35.10Cantaloupe 2001 ‐‐‐ ‐‐‐ ‐‐‐ ‐‐‐ 27.30 13.20 14.50 17.20 13.50 16.50 20.00 23.70
2002 ‐‐‐ ‐‐‐ ‐‐‐ ‐‐‐ 21.80 12.60 14.50 10.80 14.80 21.30 16.50 20.002003 ‐‐‐ ‐‐‐ ‐‐‐ ‐‐‐ 17.60 14.10 14.30 15.80 14.40 15.20 27.70 19.802004 ‐‐‐ ‐‐‐ ‐‐‐ ‐‐‐ 15.70 12.00 10.50 14.30 15.40 13.80 22.00 33.802005 ‐‐‐ ‐‐‐ ‐‐‐ ‐‐‐ 19.10 17.60 12.50 10.20 14.90 16.10 21.20 ‐‐‐2006 ‐‐‐ ‐‐‐ ‐‐‐ ‐‐‐ 30.80 16.40 15.20 20.10 10.40 10.00 ‐‐‐ ‐‐‐2007 ‐‐‐ ‐‐‐ ‐‐‐ ‐‐‐ ‐‐‐ 11.80 11.10 13.00 13.00 18.70 ‐‐‐ ‐‐‐2008 ‐‐‐ ‐‐‐ ‐‐‐ ‐‐‐ 28.70 15.90 15.80 8.30 17.60 18.80 ‐‐‐ ‐‐‐2009 ‐‐‐ ‐‐‐ ‐‐‐ ‐‐‐ 28.60 12.50 11.20 12.60 12.90 17.80 ‐‐‐ ‐‐‐
Melons, 2000 ‐‐‐ ‐‐‐ ‐‐‐ ‐‐‐ 18.70 17.30 17.00 13.80 21.60 24.80 22.20 ‐‐‐Honeydew 3/ 2001 ‐‐‐ ‐‐‐ ‐‐‐ ‐‐‐ 30.70 19.00 18.30 17.90 16.10 14.80 20.40 ‐‐‐
2002 ‐‐‐ ‐‐‐ ‐‐‐ ‐‐‐ 22.40 17.30 19.50 12.30 11.60 17.10 13.90 15.202003 ‐‐‐ ‐‐‐ ‐‐‐ ‐‐‐ 37.00 21.30 20.40 12.40 17.30 18.10 18.00 21.502004 ‐‐‐ ‐‐‐ ‐‐‐ ‐‐‐ 18.40 17.90 14.90 19.20 17.70 18.30 26.40 29.00
Onions, Spring 2000 ‐‐‐ ‐‐‐ ‐‐‐ 12.50 9.12 10.00 13.10 ‐‐‐ ‐‐‐ ‐‐‐ ‐‐‐ ‐‐‐2001 ‐‐‐ ‐‐‐ ‐‐‐ 16.30 13.00 12.70 14.50 ‐‐‐ ‐‐‐ ‐‐‐ ‐‐‐ ‐‐‐2002 ‐‐‐ ‐‐‐ ‐‐‐ 13.70 13.70 15.00 14.20 ‐‐‐ ‐‐‐ ‐‐‐ ‐‐‐ ‐‐‐2003 ‐‐‐ ‐‐‐ ‐‐‐ 38.60 29.80 20.00 15.10 ‐‐‐ ‐‐‐ ‐‐‐ ‐‐‐ ‐‐‐2004 ‐‐‐ ‐‐‐ ‐‐‐ 10.70 10.80 9.70 9.60 ‐‐‐ ‐‐‐ ‐‐‐ ‐‐‐ ‐‐‐2005 ‐‐‐ ‐‐‐ ‐‐‐ 12.40 12.80 11.90 ‐‐‐ ‐‐‐ ‐‐‐ ‐‐‐ ‐‐‐ ‐‐‐2006 ‐‐‐ ‐‐‐ ‐‐‐ 10.70 9.10 9.30 ‐‐‐ ‐‐‐ ‐‐‐ ‐‐‐ ‐‐‐ ‐‐‐2007 ‐‐‐ ‐‐‐ ‐‐‐ 15.60 7.40 14.90 ‐‐‐ ‐‐‐ ‐‐‐ ‐‐‐ ‐‐‐ ‐‐‐2008 ‐‐‐ ‐‐‐ ‐‐‐ 6.83 7.70 9.30 ‐‐‐ ‐‐‐ ‐‐‐ ‐‐‐ ‐‐‐ ‐‐‐2009 ‐‐‐ ‐‐‐ ‐‐‐ 6.80 7.70 9.30 13.90 ‐‐‐ ‐‐‐ ‐‐‐ ‐‐‐ ‐‐‐
Continued on Next Page

USDA, NASS, California Field Office 89 California Agricultural Statistics, 2009
Vegetable and Melon Monthly Average Prices Received, 2000‐2009 1/
Crop Crop Year
Jan. Feb. Mar. Apr. May June July Aug. Sept. Oct. Nov. Dec.
$/Cwt.
Onions, 2000 ‐‐‐ ‐‐‐ ‐‐‐ ‐‐‐ ‐‐‐ ‐‐‐ 13.00 11.10 12.20 12.90 14.10 16.30Summer Storage 2001 ‐‐‐ ‐‐‐ ‐‐‐ ‐‐‐ ‐‐‐ ‐‐‐ 14.50 12.60 12.80 12.60 11.90 11.90
2002 11.60 11.20 11.20 ‐‐‐ ‐‐‐ ‐‐‐ 14.20 12.50 11.00 11.30 11.40 12.102003 18.70 22.70 33.40 ‐‐‐ ‐‐‐ ‐‐‐ 15.10 12.00 13.10 15.10 11.20 18.502004 21.50 21.00 21.40 ‐‐‐ ‐‐‐ ‐‐‐ 9.80 8.10 8.20 8.10 7.90 7.602005 11.30 11.20 10.90 ‐‐‐ ‐‐‐ ‐‐‐ 10.80 10.20 12.10 14.40 17.00 16.802006 6.40 11.70 10.60 ‐‐‐ ‐‐‐ ‐‐‐ 12.40 12.10 14.10 ‐‐‐ ‐‐‐ ‐‐‐2007 ‐‐‐ ‐‐‐ ‐‐‐ ‐‐‐ ‐‐‐ ‐‐‐ 11.50 8.50 5.50 ‐‐‐ ‐‐‐ ‐‐‐2008 ‐‐‐ ‐‐‐ ‐‐‐ ‐‐‐ ‐‐‐ ‐‐‐ 8.85 8.20 8.80 ‐‐‐ ‐‐‐ ‐‐‐2009 ‐‐‐ ‐‐‐ ‐‐‐ ‐‐‐ ‐‐‐ ‐‐‐ 9.30 6.20 ‐‐‐ ‐‐‐ ‐‐‐ ‐‐‐
Tomatoes 2000 ‐‐‐ ‐‐‐ ‐‐‐ ‐‐‐ 25.10 24.50 21.80 31.30 27.80 40.40 38.40 38.402001 ‐‐‐ ‐‐‐ ‐‐‐ ‐‐‐ 35.30 24.00 24.70 26.20 19.60 26.60 28.40 ‐‐‐2002 ‐‐‐ ‐‐‐ ‐‐‐ ‐‐‐ ‐‐‐ 27.30 24.80 22.50 21.30 25.90 38.40 ‐‐‐2003 ‐‐‐ ‐‐‐ ‐‐‐ ‐‐‐ ‐‐‐ 49.00 37.80 46.20 33.70 29.50 30.50 29.102004 ‐‐‐ ‐‐‐ ‐‐‐ ‐‐‐ ‐‐‐ 17.30 19.90 34.60 36.00 64.90 89.00 ‐‐‐2005 ‐‐‐ ‐‐‐ ‐‐‐ ‐‐‐ ‐‐‐ 32.20 25.60 23.30 39.60 35.80 30.10 ‐‐‐2006 ‐‐‐ ‐‐‐ ‐‐‐ ‐‐‐ ‐‐‐ ‐‐‐ 24.10 27.80 79.80 55.80 26.80 ‐‐‐2007 ‐‐‐ ‐‐‐ ‐‐‐ ‐‐‐ ‐‐‐ 28.10 26.50 27.60 30.30 40.70 41.50 ‐‐‐2008 ‐‐‐ ‐‐‐ ‐‐‐ ‐‐‐ ‐‐‐ 40.50 34.50 28.50 24.50 33.80 61.80 ‐‐‐2009 ‐‐‐ ‐‐‐ ‐‐‐ ‐‐‐ ‐‐‐ 59.60 28.90 32.30 32.40 38.70 ‐‐‐ ‐‐‐
1/ Prices are for fresh market vegetables at point of first sale. 2/ Snap bean program began in 2003. 3/ Estimates discontinued in 2005.

USDA, NASS, California Field Office 90 California Agricultural Statistics, 2009
California County Agricultural Commissioners
County Name Mailing Address and Website Mailing City-State-Zip Phone Fax
Alameda Dennis F. Bray 224 W. Winton Avenue, Room 184 http://www.acgov.org/cda/awm/
Hayward, CA 94544-1215 (510) 670-5232 (510) 783-3928
Alpine William J. Stephans 311 Fair Lane http://www.alpinecountyca.gov
Placerville, CA 95667-4195 (530) 621-5520 (530) 626-4756
Amador Michael E. Boitano 12200-B Airport Road http://www.co.amador.ca.us/
Jackson, CA 95642-9527 (209) 223-6487 (209) 223-3312
Butte Richard B. Price 316 Nelson Avenue http://www.buttecounty.net/agcommissioner
Oroville, CA 95965-3318 (530) 538-7381 (530) 538-7594
Calaveras Mary Mutz 891 Mountain Ranch Road http://www.co.calaveras.ca.us/
San Andreas, CA 95249-9709 (209) 754-6504 (209) 754-6521
Colusa Harry A. Krug 100 Sunrise Blvd., Suite F http://www.colusacountyclerk.com/
Colusa, CA 95932-3246 (530) 458-0580 (530) 458-5000
Contra Costa Edward P. Meyer 2366 'A' Stanwell Circle http://www.co.contra-costa.ca.us/
Concord, CA 94520-4807 (925) 646-5250 (925) 646-5732
Del Norte Kenneth Smith 2650 Washington Blvd. http://www.dnco.org/
Crescent City, CA 95531-8627 (707) 464-7235 (707) 465-6044
El Dorado Juli Jensen 311 Fair Lane http://www.co.el-dorado.ca.us/ag/
Placerville, CA 95667-4195 (530) 621-5520 (530) 626-4756
Fresno Carol Hafner 1730 S. Maple Avenue http://www.co.fresno.ca.us/
Fresno, CA 93702-4596 (559) 456-7510 (559) 456-7379
Glenn Mark D. Black P.O. Box 351 http://www.countyofglenn.net
Willows, CA 95988 (530) 934-6501 (530) 934-6503
Humboldt John E. Falkenstrom 5630 S. Broadway http://co.humboldt.ca.us/
Eureka, CA 95503-6998 (707) 441-5260 (707) 445-7220
Imperial Stephen L. Birdsall 852 Broadway http://www.imperialcounty.net/
El Centro, CA 92243-2850 (760) 482-4314 (760) 353-9420
Inyo George L. Milovich 207 W. South Street http://www.inyomonoagriculture.com/
Bishop, CA 93514-3492 (760) 873-7860 (760) 872-1610
Kern Ruben Arroyo 1001 South Mt. Vernon Avenue http://www.kernag.com/default.asp
Bakersfield, CA 93307-2851 (661) 868-6300 (661) 868-6301
Kings Timothy L. Niswander 680 N. Campus Drive, Suite B http://www.countyofkings.com/
Hanford, CA 93230-5923 (559) 582-3211 Ext. 2830
(559) 582-5251
Lake Steve Hajik 883 Lakeport Blvd. http://www.co.lake.ca.us/Home.htm
Lakeport, CA 95453-5405 (707) 263-0217 (707) 263-1052
Lassen Jim Donnelly 175 Russell Avenue http://www.co lassen.ca.us/
Susanville, CA 96130-4299 (530) 251-8110 (530) 257-6515
Los Angeles Kurt E. Floren 12300 Lower Azusa Road http://acwm.co.la.ca.us/
Arcadia, CA 91006-5872 (626) 575-5471 (626) 350-3243
Madera Robert J. Rolan 332 Madera Avenue http://www.madera-county.com/agcommissioner/
Madera, CA 93637-5499 (559) 675-7876 (559) 674-4071
Marin Stacy K. Carlsen 1682 Novato Blvd., Suite150-A http://www.co.marin.ca.us/depts/AG/main/
Novato, CA 94947-7021 (415) 499-6700 (415) 499-7543
Mariposa Cathi Boze P.O. Box 905 http://www.mariposacounty.org/
Mariposa, CA 95338-0905 (209) 966-2075 (209) 966-2056
Mendocino Tony Linegar 890 North Bush Street http://www.co.mendocino.ca.us/
Ukiah, CA 95482-3745 (707) 463-4208 (707) 463-0240
Merced David A. Robinson 2139 Wardrobe Avenue http://www.co.merced.ca.us/index.aspx
Merced, CA 95340-6495 (209) 385-7431 (209) 725-3910
Modoc Joe A. Moreo 202 West 4th Street http://www.modoccounty.us/
Alturas, CA 96101-3915 (530) 233-6401 (530) 233-5542
Mono George L. Milovich 207 W. South Street http://www.inyomonoagriculture.com/index.html
Bishop, CA 93514-3492 (760) 873-7860 (760) 872-1610
Monterey Eric Lauritzen 1428 Abbott Street http://www.co.monterey.ca.us/ag/
Salinas, CA 93901 (831) 759-7325 (831) 422-5003
Napa David R. Whitmer 1710 Soscol Avenue, Suite 3 http://www.countyofnapa.org/AgCom/
Napa, CA 94559-1315 (707) 253-4357 (707) 253-4881
Nevada Jeffrey Pylman 255 S. Auburn Street http://new.mynevadacounty.com/Home/Index.cfm
Grass Valley, CA 95945-7289 (530) 273-2648 (530) 273-1713
Continued on Next Page
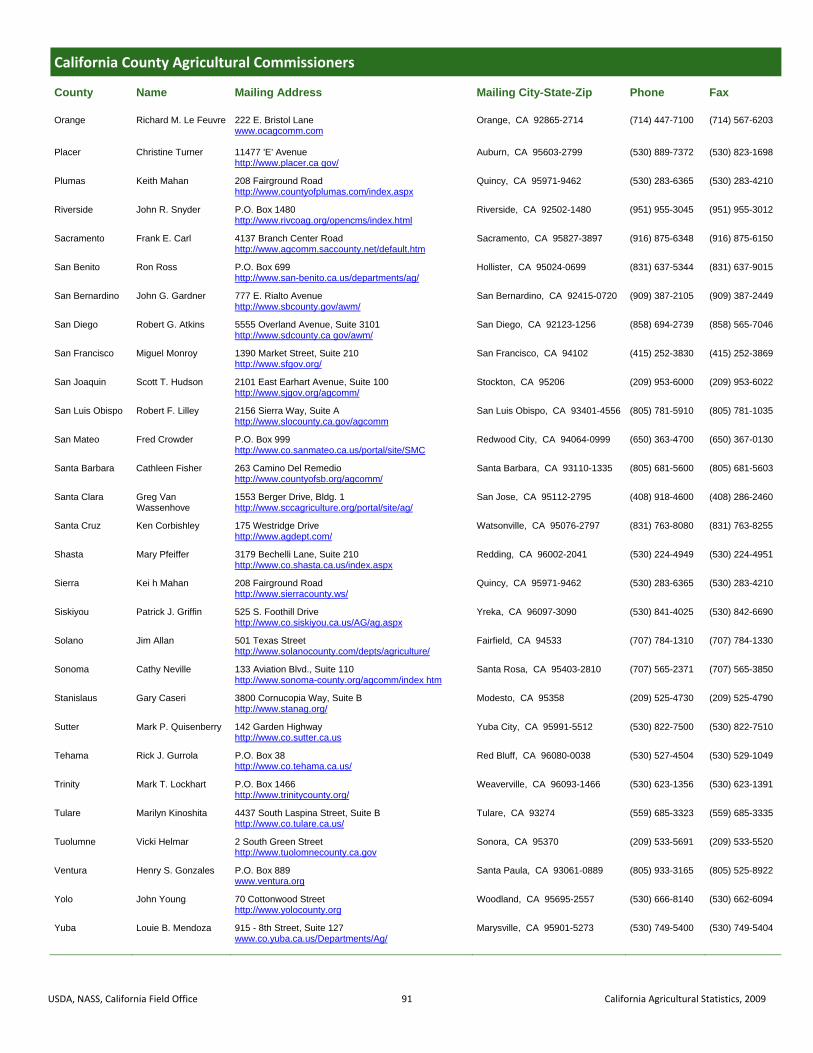
USDA, NASS, California Field Office 91 California Agricultural Statistics, 2009
California County Agricultural Commissioners
County Name Mailing Address Mailing City-State-Zip Phone Fax
Orange Richard M. Le Feuvre 222 E. Bristol Lane www.ocagcomm.com
Orange, CA 92865-2714 (714) 447-7100 (714) 567-6203
Placer Christine Turner 11477 'E' Avenue http://www.placer.ca gov/
Auburn, CA 95603-2799 (530) 889-7372 (530) 823-1698
Plumas Keith Mahan 208 Fairground Road http://www.countyofplumas.com/index.aspx
Quincy, CA 95971-9462 (530) 283-6365 (530) 283-4210
Riverside John R. Snyder P.O. Box 1480 http://www.rivcoag.org/opencms/index.html
Riverside, CA 92502-1480 (951) 955-3045 (951) 955-3012
Sacramento Frank E. Carl 4137 Branch Center Road http://www.agcomm.saccounty.net/default.htm
Sacramento, CA 95827-3897 (916) 875-6348 (916) 875-6150
San Benito Ron Ross P.O. Box 699 http://www.san-benito.ca.us/departments/ag/
Hollister, CA 95024-0699 (831) 637-5344 (831) 637-9015
San Bernardino John G. Gardner 777 E. Rialto Avenue http://www.sbcounty.gov/awm/
San Bernardino, CA 92415-0720 (909) 387-2105 (909) 387-2449
San Diego Robert G. Atkins 5555 Overland Avenue, Suite 3101 http://www.sdcounty.ca gov/awm/
San Diego, CA 92123-1256 (858) 694-2739 (858) 565-7046
San Francisco Miguel Monroy 1390 Market Street, Suite 210 http://www.sfgov.org/
San Francisco, CA 94102 (415) 252-3830 (415) 252-3869
San Joaquin Scott T. Hudson 2101 East Earhart Avenue, Suite 100 http://www.sjgov.org/agcomm/
Stockton, CA 95206 (209) 953-6000 (209) 953-6022
San Luis Obispo Robert F. Lilley 2156 Sierra Way, Suite A http://www.slocounty.ca.gov/agcomm
San Luis Obispo, CA 93401-4556 (805) 781-5910 (805) 781-1035
San Mateo Fred Crowder P.O. Box 999 http://www.co.sanmateo.ca.us/portal/site/SMC
Redwood City, CA 94064-0999 (650) 363-4700 (650) 367-0130
Santa Barbara Cathleen Fisher 263 Camino Del Remedio http://www.countyofsb.org/agcomm/
Santa Barbara, CA 93110-1335 (805) 681-5600 (805) 681-5603
Santa Clara Greg Van Wassenhove
1553 Berger Drive, Bldg. 1 http://www.sccagriculture.org/portal/site/ag/
San Jose, CA 95112-2795 (408) 918-4600 (408) 286-2460
Santa Cruz Ken Corbishley 175 Westridge Drive http://www.agdept.com/
Watsonville, CA 95076-2797 (831) 763-8080 (831) 763-8255
Shasta Mary Pfeiffer 3179 Bechelli Lane, Suite 210 http://www.co.shasta.ca.us/index.aspx
Redding, CA 96002-2041 (530) 224-4949 (530) 224-4951
Sierra Kei h Mahan 208 Fairground Road http://www.sierracounty.ws/
Quincy, CA 95971-9462 (530) 283-6365 (530) 283-4210
Siskiyou Patrick J. Griffin 525 S. Foothill Drive http://www.co.siskiyou.ca.us/AG/ag.aspx
Yreka, CA 96097-3090 (530) 841-4025 (530) 842-6690
Solano Jim Allan 501 Texas Street http://www.solanocounty.com/depts/agriculture/
Fairfield, CA 94533 (707) 784-1310 (707) 784-1330
Sonoma Cathy Neville 133 Aviation Blvd., Suite 110 http://www.sonoma-county.org/agcomm/index htm
Santa Rosa, CA 95403-2810 (707) 565-2371 (707) 565-3850
Stanislaus Gary Caseri 3800 Cornucopia Way, Suite B http://www.stanag.org/
Modesto, CA 95358 (209) 525-4730 (209) 525-4790
Sutter Mark P. Quisenberry 142 Garden Highway http://www.co.sutter.ca.us
Yuba City, CA 95991-5512 (530) 822-7500 (530) 822-7510
Tehama Rick J. Gurrola P.O. Box 38 http://www.co.tehama.ca.us/
Red Bluff, CA 96080-0038 (530) 527-4504 (530) 529-1049
Trinity Mark T. Lockhart P.O. Box 1466 http://www.trinitycounty.org/
Weaverville, CA 96093-1466 (530) 623-1356 (530) 623-1391
Tulare Marilyn Kinoshita 4437 South Laspina Street, Suite B http://www.co.tulare.ca.us/
Tulare, CA 93274 (559) 685-3323 (559) 685-3335
Tuolumne Vicki Helmar 2 South Green Street http://www.tuolomnecounty.ca.gov
Sonora, CA 95370 (209) 533-5691 (209) 533-5520
Ventura Henry S. Gonzales P.O. Box 889 www.ventura.org
Santa Paula, CA 93061-0889 (805) 933-3165 (805) 525-8922
Yolo John Young 70 Cottonwood Street http://www.yolocounty.org
Woodland, CA 95695-2557 (530) 666-8140 (530) 662-6094
Yuba Louie B. Mendoza 915 - 8th Street, Suite 127 www.co.yuba.ca.us/Departments/Ag/
Marysville, CA 95901-5273 (530) 749-5400 (530) 749-5404
USDA, NASS, California Field Office 92 California Agricultural Statistics, 2009
United States Department of Agriculture National Agricultural Statistics Service
California Field Office P.O. Box 1258 ● Sacramento, CA 95812 ● Phone: (916) 498-5161 ● Fax: (916) 498-5186
E-mail: [email protected] ● Web: www nass.usda.gov/ca
To Subscribe Subscriptions are available free-of-charge on the Internet at: http://www.nass.usda.gov/Statistics by State/California/Subscribe to CA Reports/index.asp Select the reports category you wish to subscribe to and enter your contact information in the space provided on the website.
Paper Publication Request Form Complete the PUBLICATION REQUEST and PAYMENT forms below if you would like to purchase one or more publications on a one-time basis only. Check the publications you wish to receive, enter the amount in the space provided, and total the cost of all fees. Please be sure to complete the REQUESTED BY information. Publications on this order form can be viewed free-of-charge on our web site at www.nass.usda.gov/ca or e-mailed to you upon request. Please forward any inquires or requests to our e-mail address at [email protected].
PUBLICATION REQUEST
Check Here
Paper Publication Title and Description List the Years You Are Buying
Domestic Charge 1/ 2/ Enter Amount
County Agricultural Commissioners' Data: Annual Bulletin County acreage, production and value by commodity. Crop years available: 1980-2009
$ 20.00 per year
Summary of County Agricultural Commissioners' Reports: Annual Bulletin Gross values by commodity groups. Crop years available: 1981-2009
$ 5.00 per year
Grape Crush Report (Final): Annual Bulletin Tons purchased, crushed, Brix factors and price per ton by variety and district. Crop years available: 1976-2009
$ 10.00 per year
1/ Foreign mailing is via air mail. All checks must be drawn on a U.S. bank. 2/ Mexico’s rate is the same as domestic rate.
PAYMENT
Make check or money order payable to: CDFA Send this request form with remittance to: USDA, National Agricultural Statistics Service,
California Field Office P.O. Box 1258 Sacramento, CA 95812
AMOUNT ENCLOSED:__$_________________
REQUESTED BY
Company or Firm Name:
Name:
Mailing Address:
City, State and Zip:
E-mail Address:


USDA NASS California Field Office www.nass.usda.gov/ca
P.O. Box 1258, Sacramento, CA 95812-1258
Phone: (916) 498-5161 Fax: (916) 498-5186