Embed Size (px)
Citation preview

UUpdate of Eskom’s IDM programme Eskom IDM programme :
Focus on Housing Sector of South Africa

Table of contents
2
Eskom Integrated Demand Management (IDM) Performance
Outlook for short-medium term
Conclusions
Residential Sector in SA
Table of contents
3
Eskom Integrated Demand Management (IDM) Performance
Outlook for short-medium term
Conclusions
Changes on the horizon
Table of contents
4
Eskom Integrated Demand Management (IDM) Performance
Outlook for short-medium term
Conclusions
Changes on the horizon
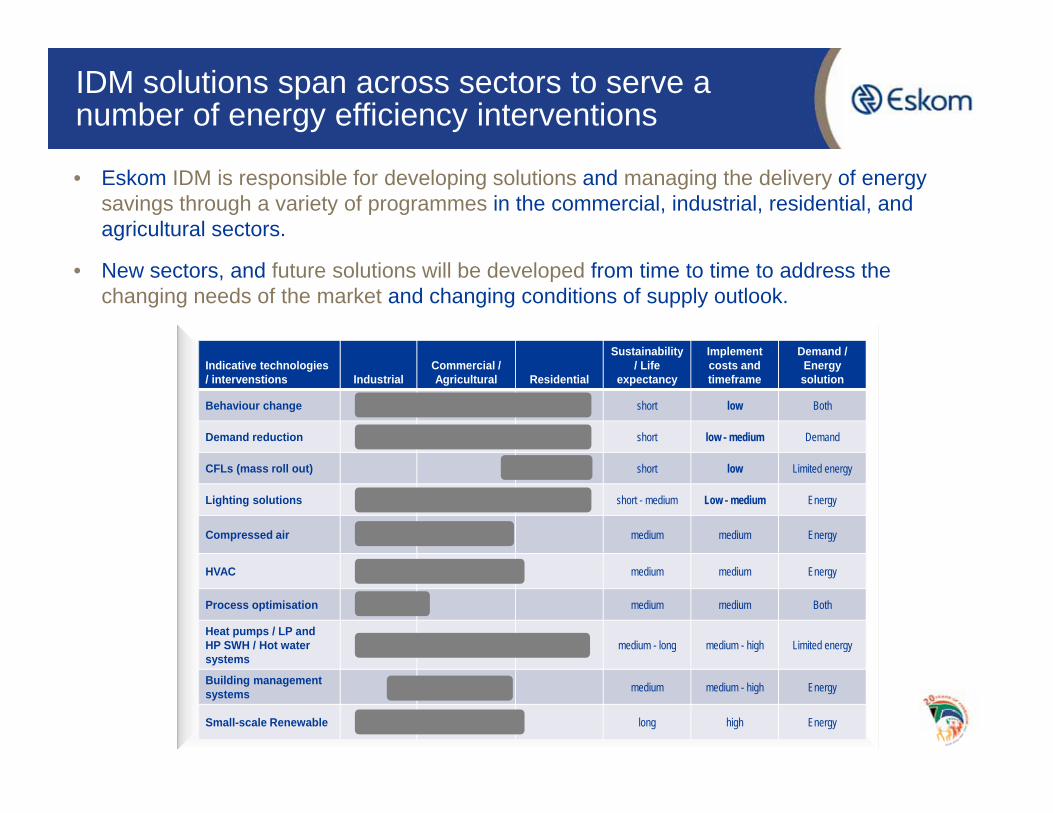
IDM solutions span across sectors to serve a number of energy efficiency interventions
• Eskom IDM is responsible for developing solutions and managing the delivery of energy savings through a variety of programmes in the commercial, industrial, residential, and agricultural sectors.
• New sectors, and future solutions will be developed from time to time to address the changing needs of the market and changing conditions of supply outlook.
5
Indicative technologies / intervenstions Industrial
Commercial / Agricultural Residential
Sustainability/ Life
expectancy
Implement costs and timeframe
Demand / Energy solution
Behaviour change short low Both
Demand reduction short low - medium Demand
CFLs (mass roll out) short low Limited energy
Lighting solutions short - medium Low - medium Energy
Compressed air medium medium Energy
HVAC medium medium Energy
Process optimisation medium medium Both
Heat pumps / LP and HP SWH / Hot water systems
medium - long medium - high Limited energy
Building management systems medium medium - high Energy
Small-scale Renewable long high Energy
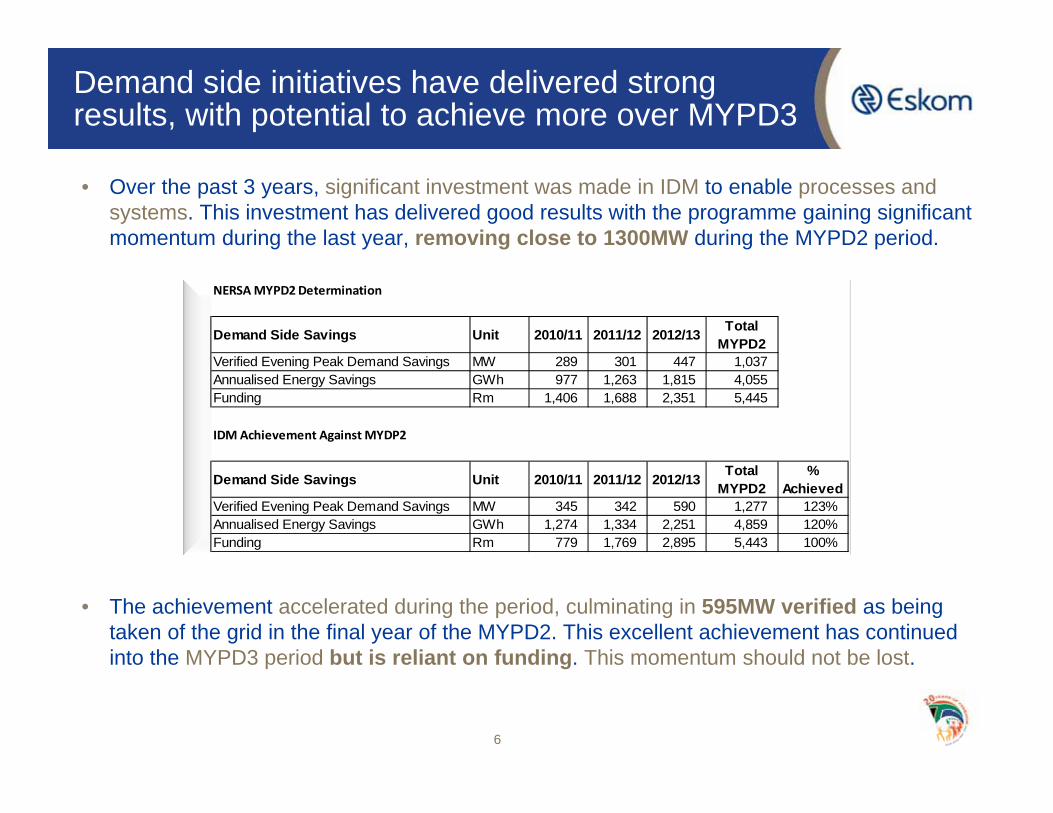
Demand side initiatives have delivered strong results, with potential to achieve more over MYPD3
• Over the past 3 years, significant investment was made in IDM to enable processes and systems. This investment has delivered good results with the programme gaining significant momentum during the last year, removing close to 1300MW during the MYPD2 period.
• The achievement accelerated during the period, culminating in 595MW verified as being taken of the grid in the final year of the MYPD2. This excellent achievement has continued into the MYPD3 period but is reliant on funding. This momentum should not be lost.
6
NERSA MYPD2 Determination
Demand Side Savings Unit 2010/11 2011/12 2012/13 Total MYPD2
Verified Evening Peak Demand Savings MW 289 301 447 1,037Annualised Energy Savings GWh 977 1,263 1,815 4,055Funding Rm 1,406 1,688 2,351 5,445
IDM Achievement Against MYDP2
Demand Side Savings Unit 2010/11 2011/12 2012/13 Total MYPD2
% Achieved
Verified Evening Peak Demand Savings MW 345 342 590 1,277 123%Annualised Energy Savings GWh 1,274 1,334 2,251 4,859 120%Funding Rm 779 1,769 2,895 5,443 100%
7
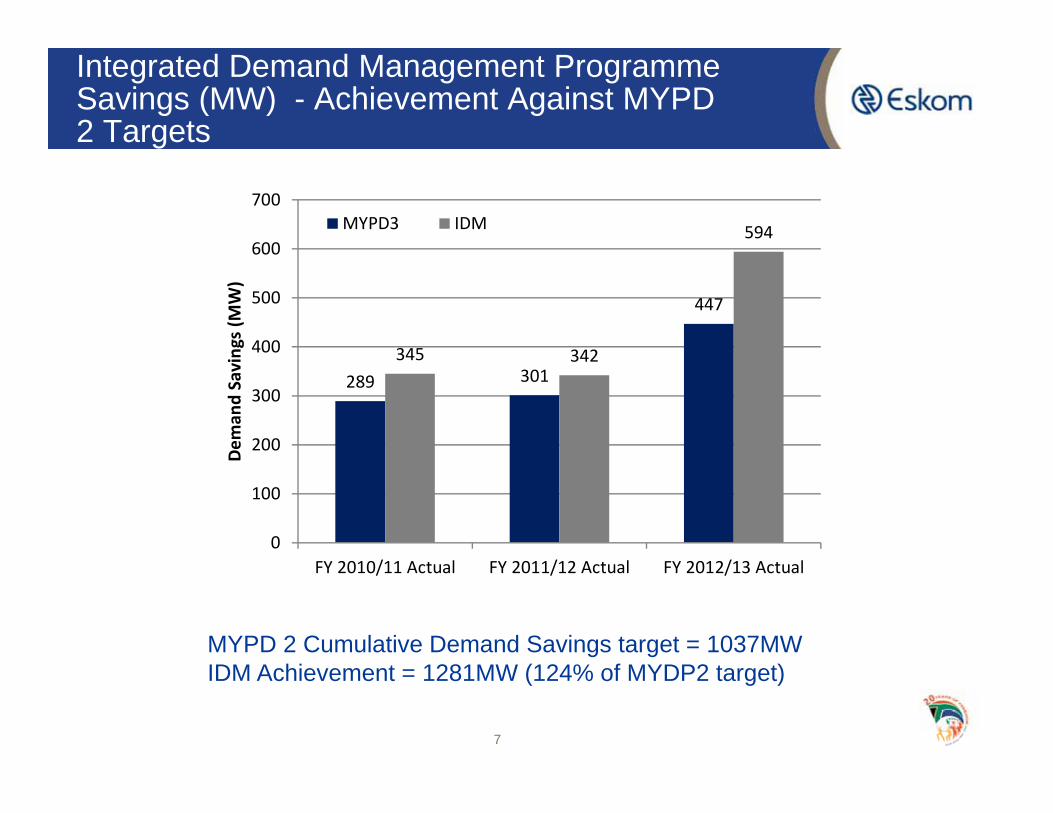
Integrated Demand Management Programme Savings (MW) - Achievement Against MYPD 2 Targets
MYPD 2 Cumulative Demand Savings target = 1037MWIDM Achievement = 1281MW (124% of MYDP2 target)
289 301
447
345 342
594
0
100
200
300
400
500
600
700
FY 2010/11 Actual FY 2011/12 Actual FY 2012/13 Actual
Dem
and Savings (M
W)
MYPD3 IDM
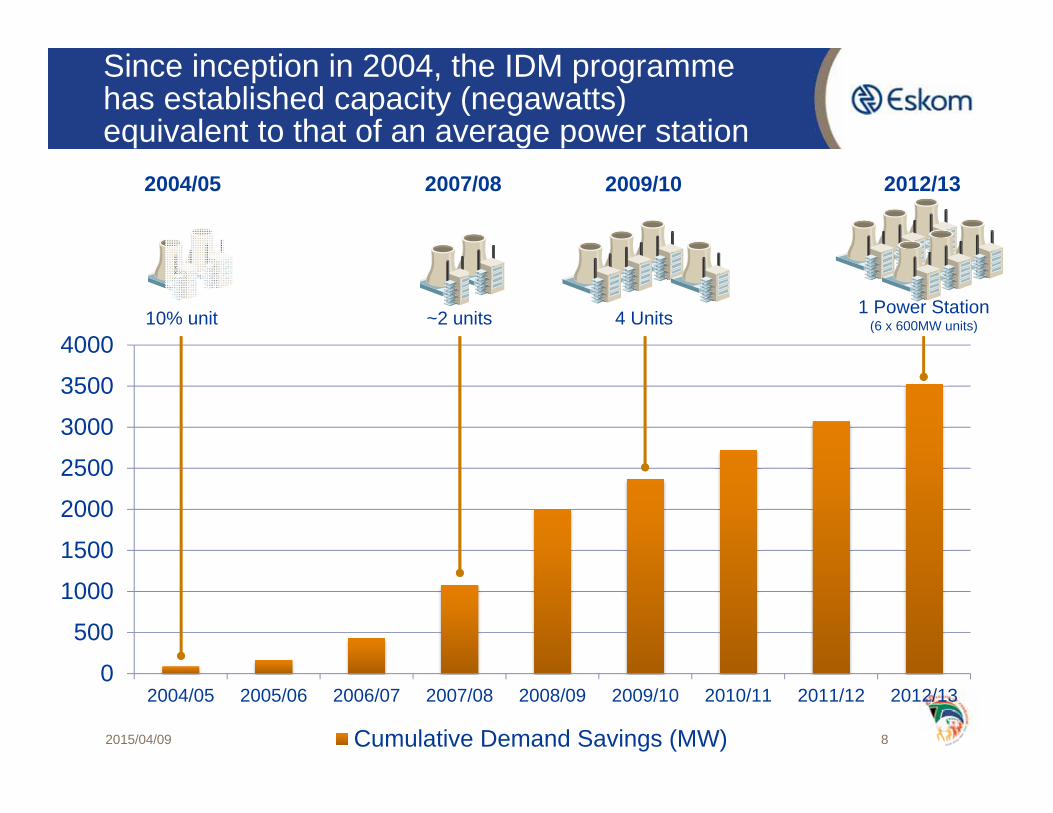
Since inception in 2004, the IDM programme has established capacity (negawatts) equivalent to that of an average power station
2015/04/09 8
0
500
1000
1500
2000
2500
3000
3500
4000
2004/05 2005/06 2006/07 2007/08 2008/09 2009/10 2010/11 2011/12 2012/13
Cumulative Demand Savings (MW)
2012/13
1 Power Station(6 x 600MW units)
2009/10
4 Units
2007/08
~2 units
2004/05
10% unit
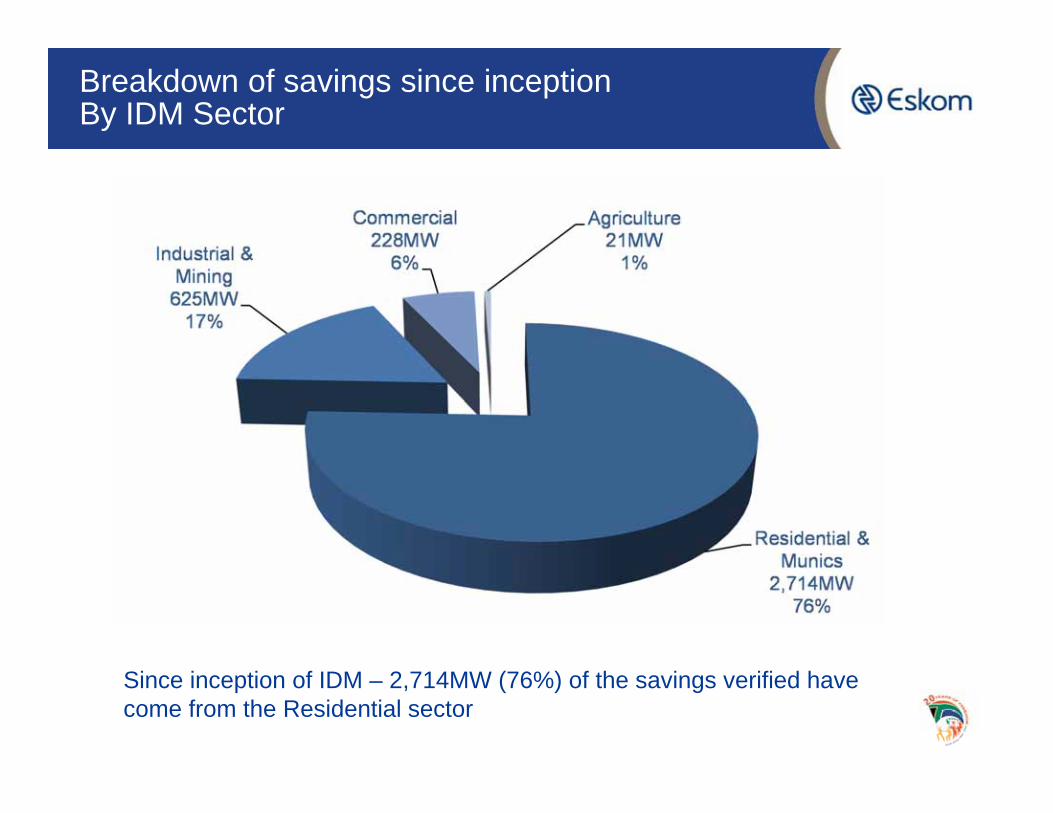
Breakdown of savings since inceptionBy IDM Sector
Since inception of IDM – 2,714MW (76%) of the savings verified have come from the Residential sector
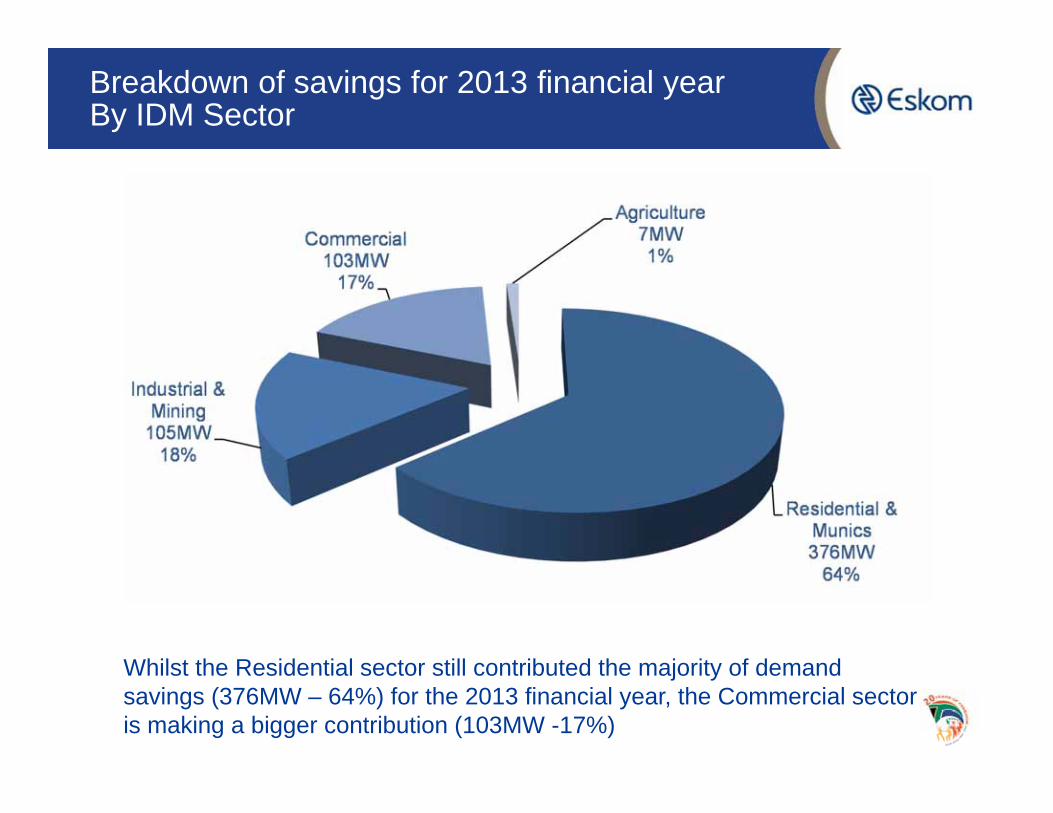
Breakdown of savings for 2013 financial yearBy IDM Sector
Whilst the Residential sector still contributed the majority of demand savings (376MW – 64%) for the 2013 financial year, the Commercial sector is making a bigger contribution (103MW -17%)
Regulatory Issues : MYPD3
11
• NERSA determined on the Eskom IDM submission for MYPD3– NERSA approved R5,183m of the R13,090m Eskom requested
– IDM needs to deliver 89% of the submitted GWh energy savings target, with only 40% of the applied for funding allowed
– The benchmark rate reduced from R5.25m/MW to R3.52m/MW (R7.57m/MW applied for)
– Technologies such as Solar Water Heating and Heat Pumps were not supported
– Focus on the large customer market reduced due to their ability to self-fund
• Eskom will continue to engage NERSA on:– Proportionality of reduction in rebate rates and savings targets
– Strategic approach to ensuring a sustainable energy efficiency market
– Decision implications to the ability to support Security of Supply– Reasoning and implications of categorising savings per technology and the
exclusion of certain markets and technologies
– Continuity of the Small Scale Renewables Programme
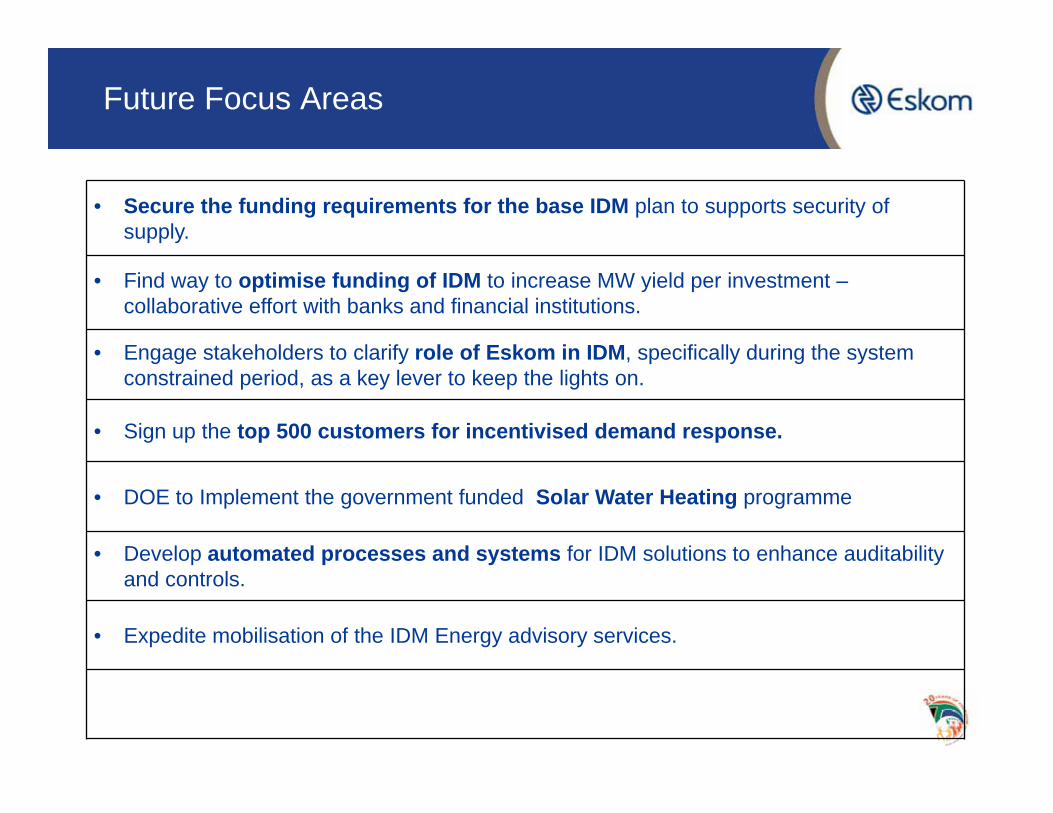
Future Focus Areas
• Secure the funding requirements for the base IDM plan to supports security of supply.
• Find way to optimise funding of IDM to increase MW yield per investment –collaborative effort with banks and financial institutions.
• Engage stakeholders to clarify role of Eskom in IDM, specifically during the system constrained period, as a key lever to keep the lights on.
• Sign up the top 500 customers for incentivised demand response.
• DOE to Implement the government funded Solar Water Heating programme
• Develop automated processes and systems for IDM solutions to enhance auditability and controls.
• Expedite mobilisation of the IDM Energy advisory services.
The role of IDM within Eskom to implement initiatives in support of Keeping the lights on
13
• Until 2010, IDM was mostly based on mass roll-out programmes and large projects in the industrial and mining sectors. IDM is currently implementing multiple products that will maximise customer uptake and ensure predictable outcomes to demand side initiatives.
• IDM has been a key focus to support the Keeping the lights on strategic initiative, and plays a significant role in implementing solutions to mitigate the risk to security of supply. Additionally the plan forms part of and is major input to the Integrated Resource Plan (IRP).
• Historically, the energy efficiency and demand-side management programme, which now forms part of IDM, largely funded its demand and energy-savings initiatives through tariff applications approved by the National Energy Regulator of South Africa (NERSA).
• The most recent approved application was MYPD2, which was applicable from 1 April 2010 to 31 March 2013. The need for continuity beyond this period to realise further demand and energy savings has been identified.
• The costs of IDM relate to peak demand savings, annualised energy savings, overhead costs and other costs. Costs are offset by the avoided costs of expensive generation options and associated environmental benefits. Cost savings
and environmental
benefits
Residential initiatives Implemented By Eskom
Energy Efficiency initiatives
• CFL Mas Rollout
• Residential Mass Rollout (Technology Basket)
• Residential Rebates Programmes
Load Management Initiatives
• Residential Load Management (RLM) Programme
• Awareness Programmes
2015/04/09 14
2015/04/09 152015/04/09
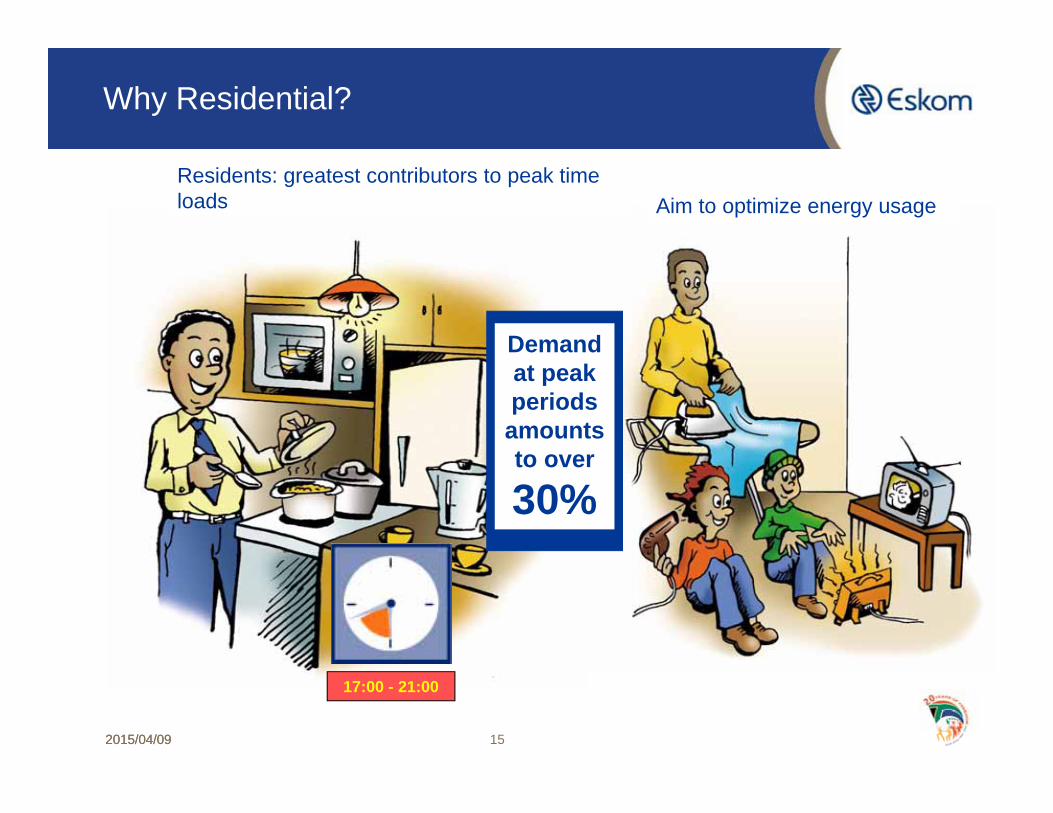
Why Residential?
17:00 - 21:00
Demand at peak periods amounts to over
30%
Residents: greatest contributors to peak time loads Aim to optimize energy usage
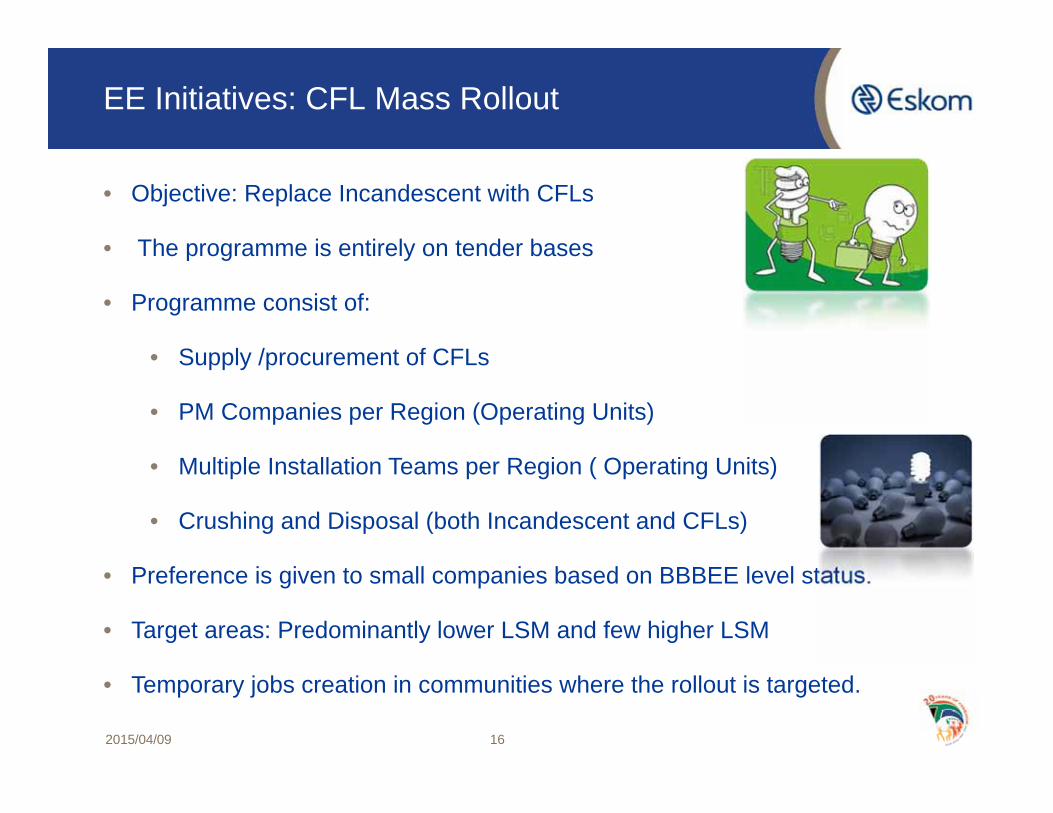
EE Initiatives: CFL Mass Rollout
2015/04/09 16
• Objective: Replace Incandescent with CFLs
• The programme is entirely on tender bases
• Programme consist of:
• Supply /procurement of CFLs
• PM Companies per Region (Operating Units)
• Multiple Installation Teams per Region ( Operating Units)
• Crushing and Disposal (both Incandescent and CFLs)
• Preference is given to small companies based on BBBEE level status.
• Target areas: Predominantly lower LSM and few higher LSM
• Temporary jobs creation in communities where the rollout is targeted.
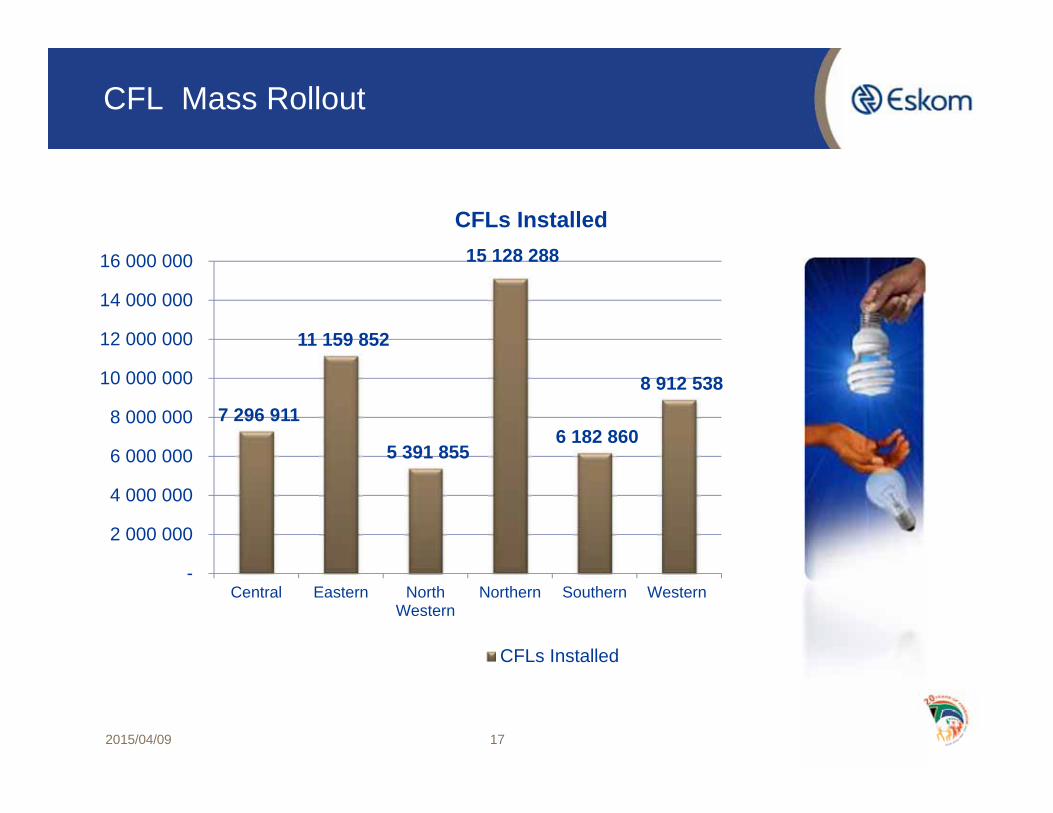
CFL Mass Rollout
2015/04/09 17
7 296 911
11 159 852
5 391 855
15 128 288
6 182 860
8 912 538
-
2 000 000
4 000 000
6 000 000
8 000 000
10 000 000
12 000 000
14 000 000
16 000 000
Central Eastern NorthWestern
Northern Southern Western
CFLs Installed
CFLs Installed
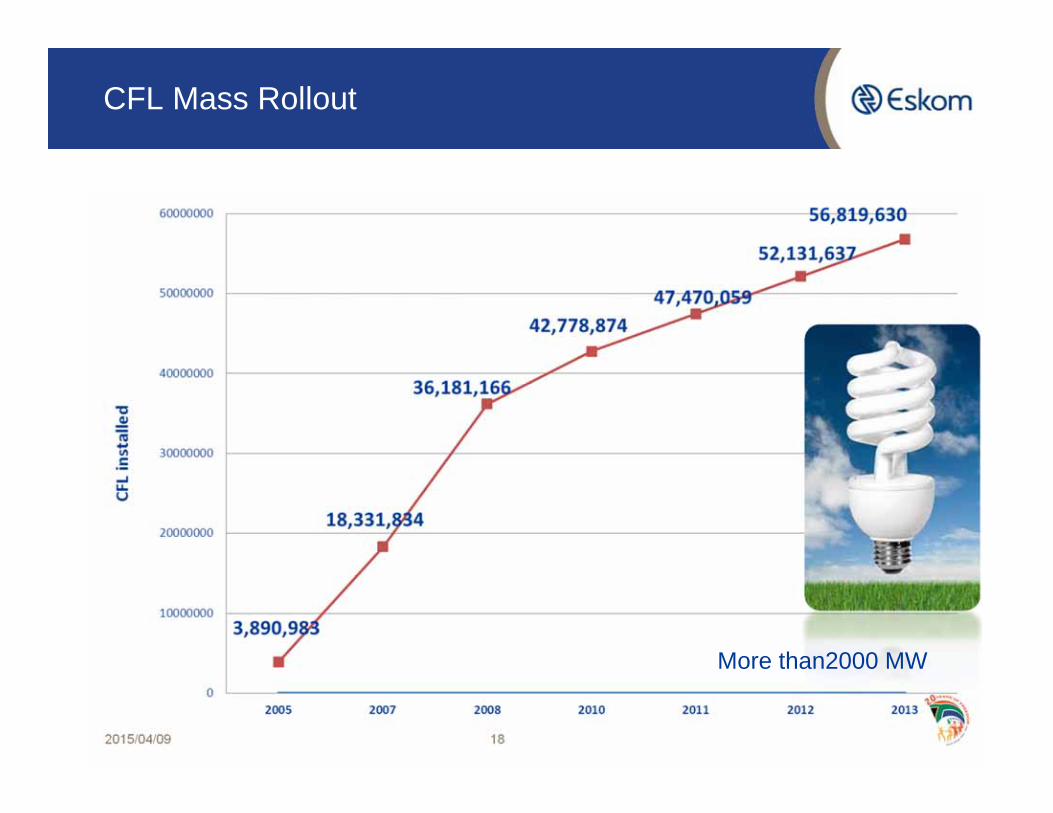
CFL Mass Rollout
2015/04/09 18
More than2000 MW
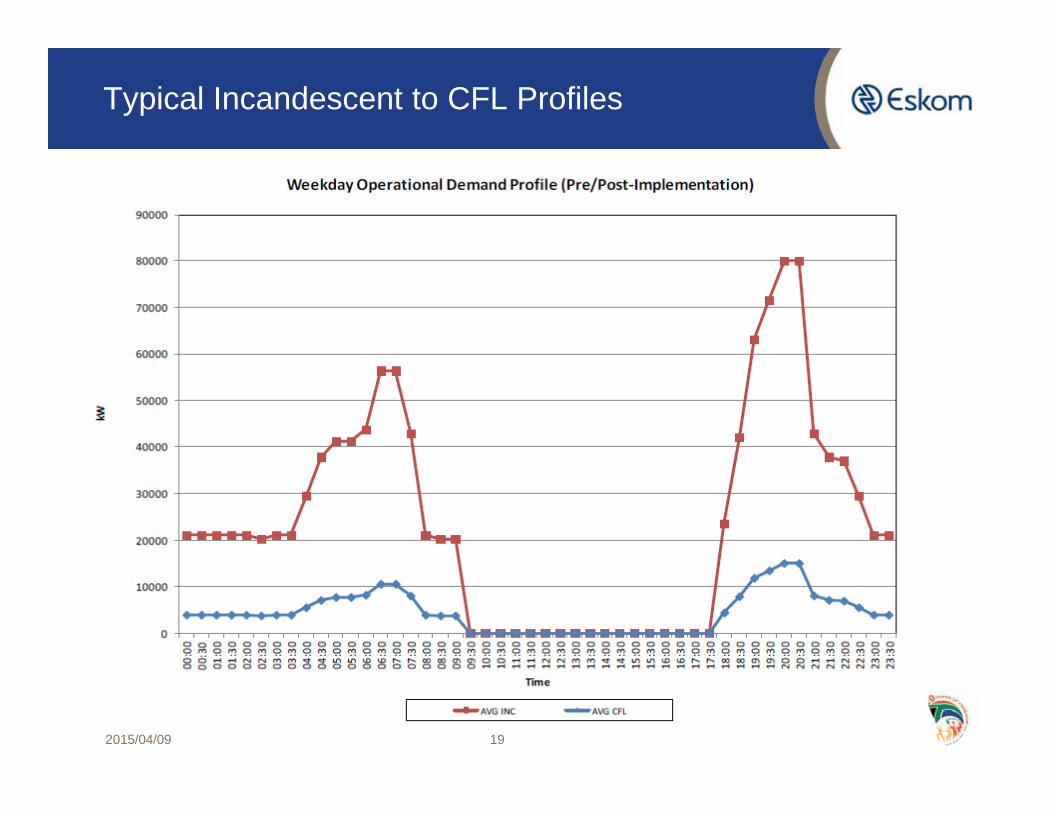
Typical Incandescent to CFL Profiles
2015/04/09 19
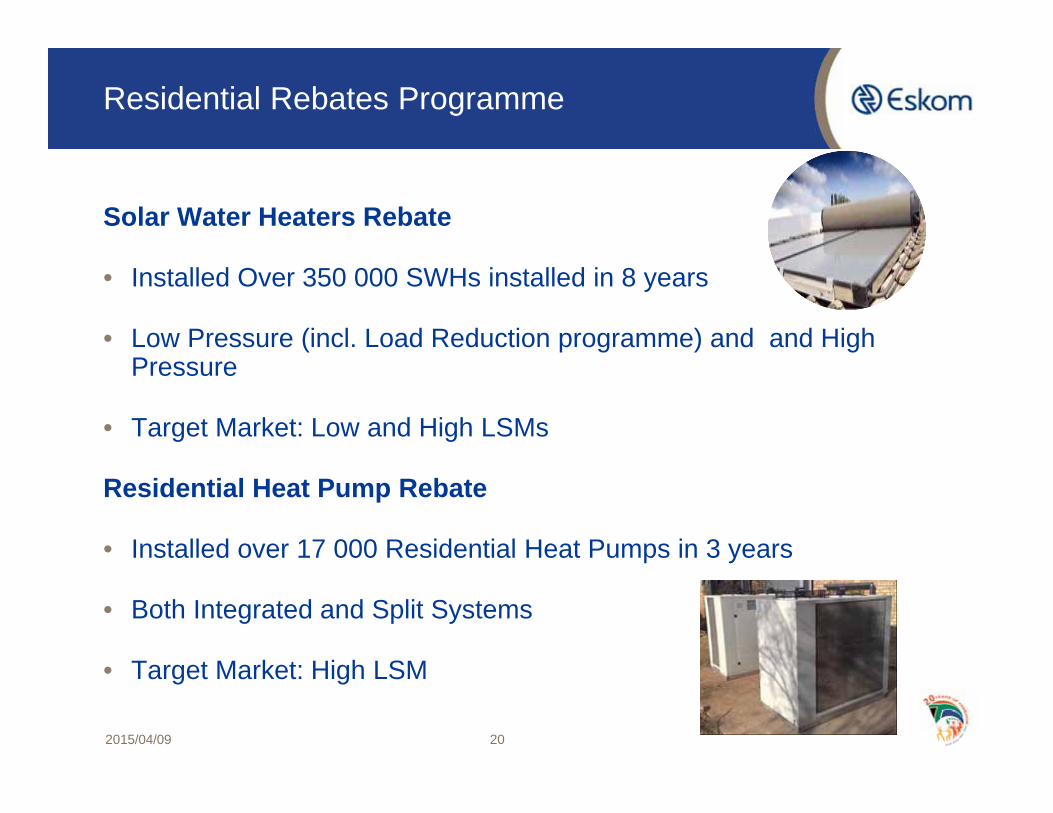
Residential Rebates Programme
Solar Water Heaters Rebate
• Installed Over 350 000 SWHs installed in 8 years
• Low Pressure (incl. Load Reduction programme) and and High Pressure
• Target Market: Low and High LSMs
Residential Heat Pump Rebate
• Installed over 17 000 Residential Heat Pumps in 3 years
• Both Integrated and Split Systems
• Target Market: High LSM
2015/04/09 20
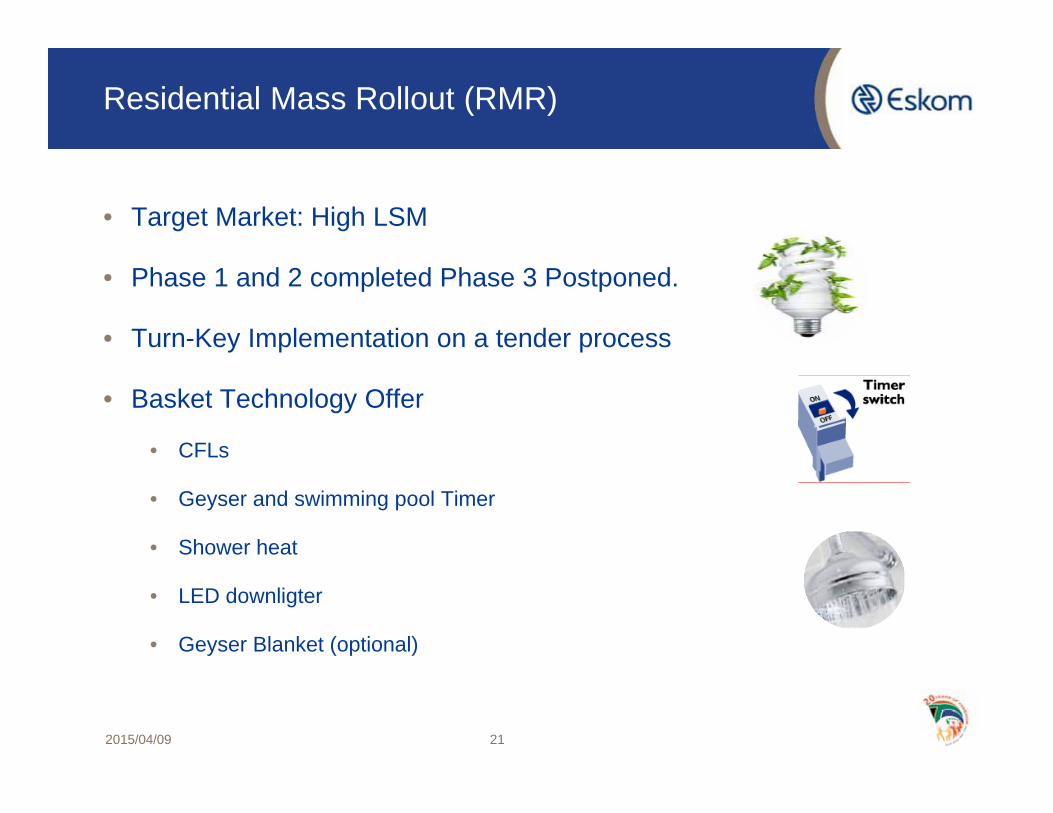
Residential Mass Rollout (RMR)
2015/04/09 21
• Target Market: High LSM
• Phase 1 and 2 completed Phase 3 Postponed.
• Turn-Key Implementation on a tender process
• Basket Technology Offer
• CFLs
• Geyser and swimming pool Timer
• Shower heat
• LED downligter
• Geyser Blanket (optional)
Residential Load Management
2015/04/09 22
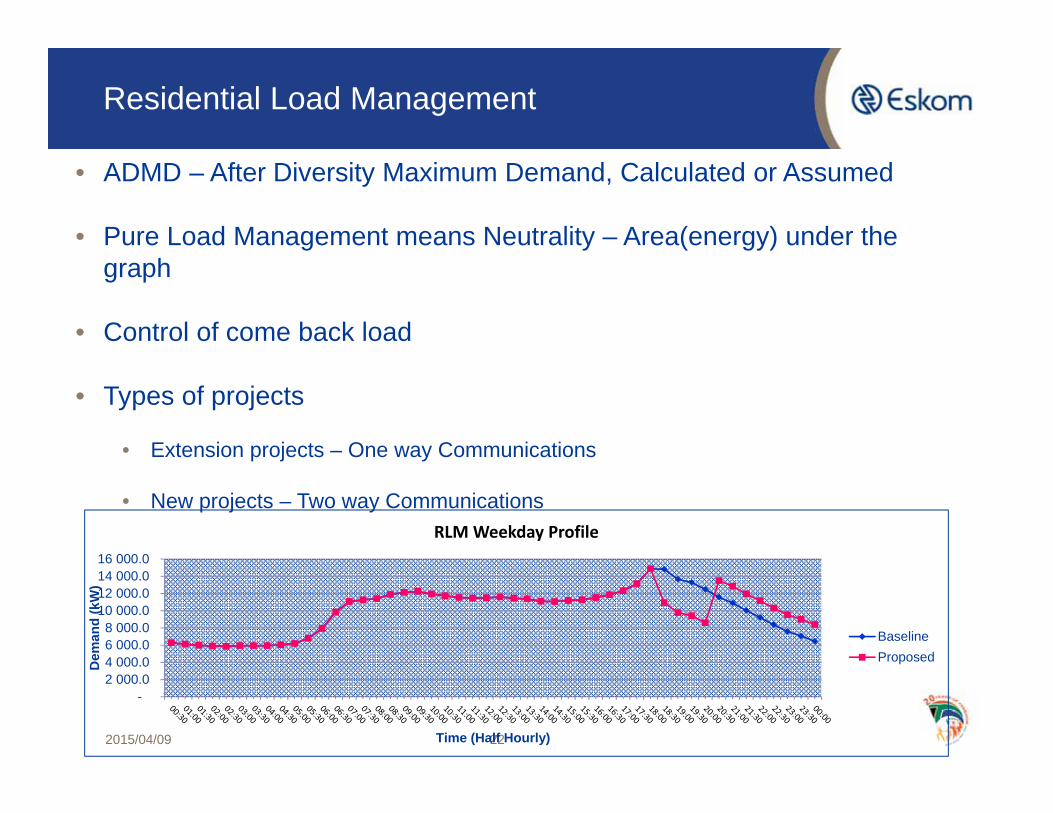
• ADMD – After Diversity Maximum Demand, Calculated or Assumed
• Pure Load Management means Neutrality – Area(energy) under the graph
• Control of come back load
• Types of projects
• Extension projects – One way Communications
• New projects – Two way Communications
- 2 000.0 4 000.0 6 000.0 8 000.0
10 000.0 12 000.0 14 000.0 16 000.0
Dem
and
(kW
)
Time (Half Hourly)
RLM Weekday Profile
BaselineProposed
Residential Load Management
2015/04/09 23
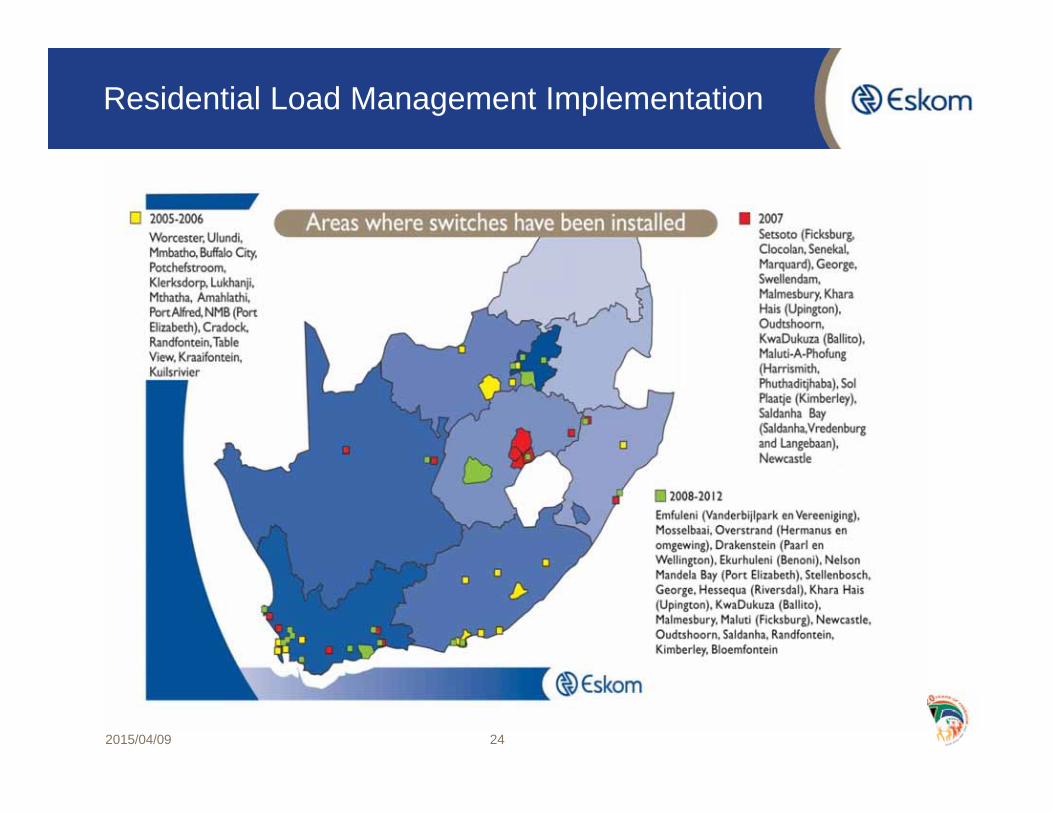
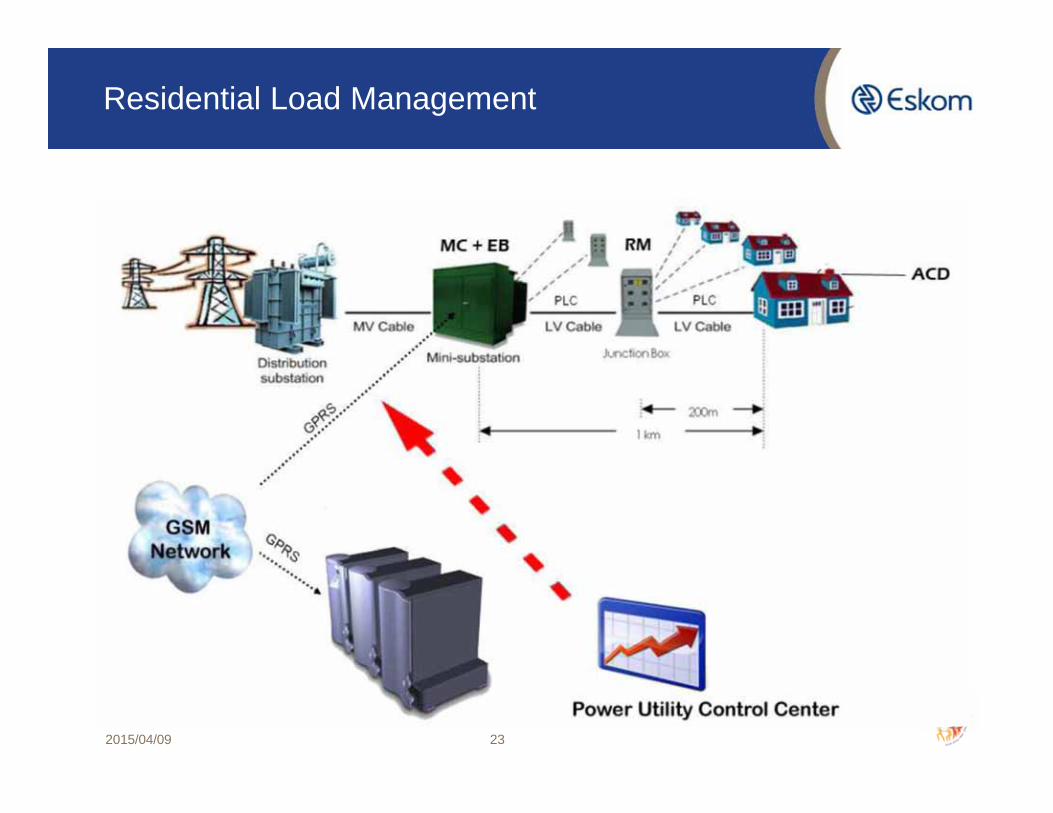
Residential Load Management Implementation
2015/04/09 24
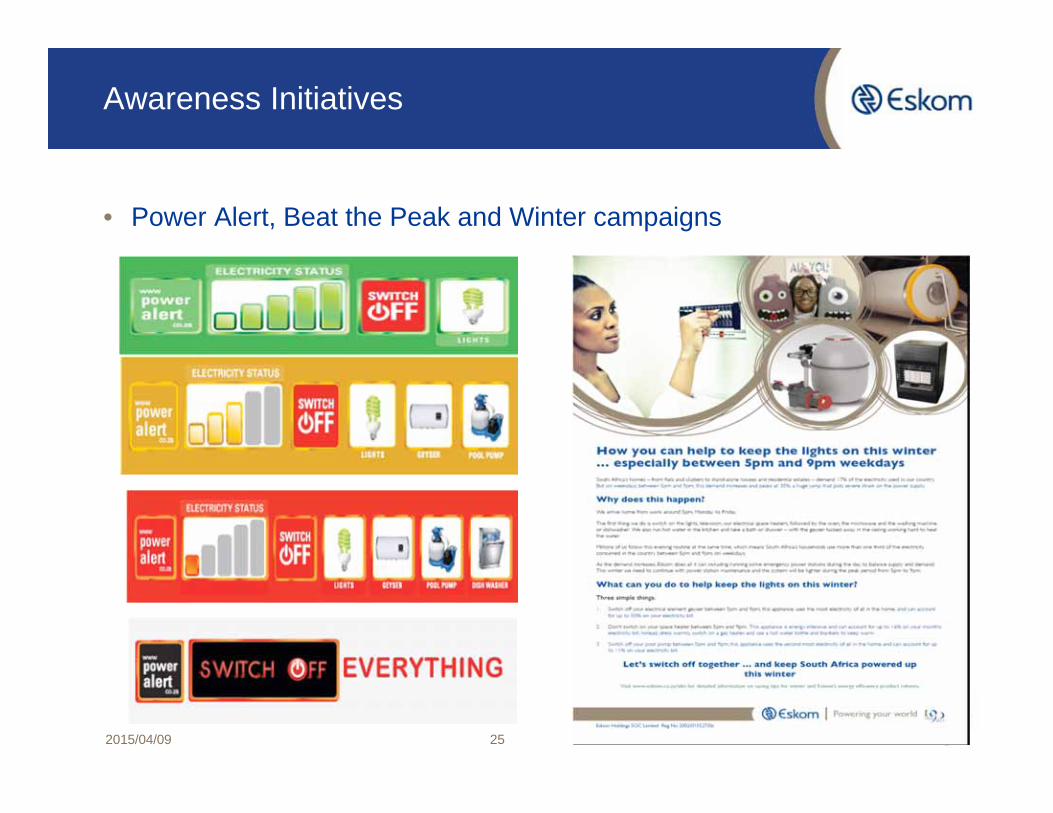
Awareness Initiatives
• Power Alert, Beat the Peak and Winter campaigns
2015/04/09 25
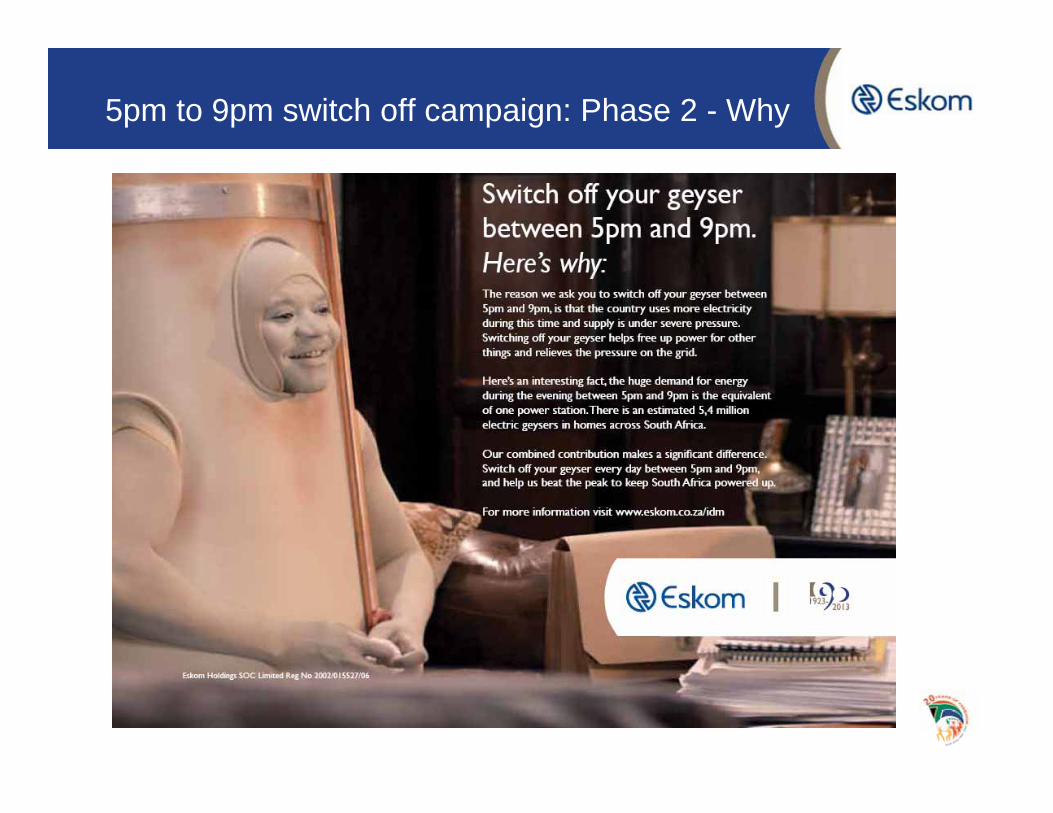
5pm to 9pm switch off campaign: Phase 2 - Why
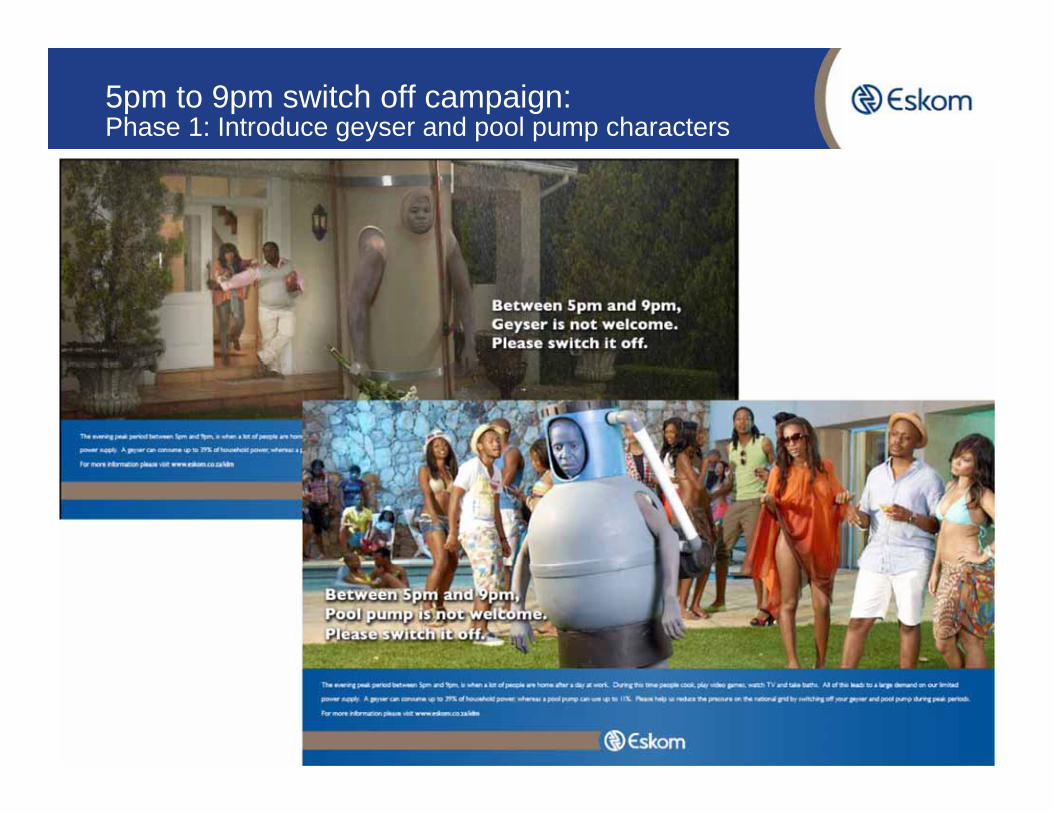
5pm to 9pm switch off campaign: Phase 1: Introduce geyser and pool pump characters


![Electrification: An Integrated Implementation Approach [Eskom’s Overview]](https://img.pdfslide.us/doc/110x75/568148e0550346895db5f927/electrification-an-integrated-implementation-approach-eskoms-overview.jpg)