Embed Size (px)
Citation preview
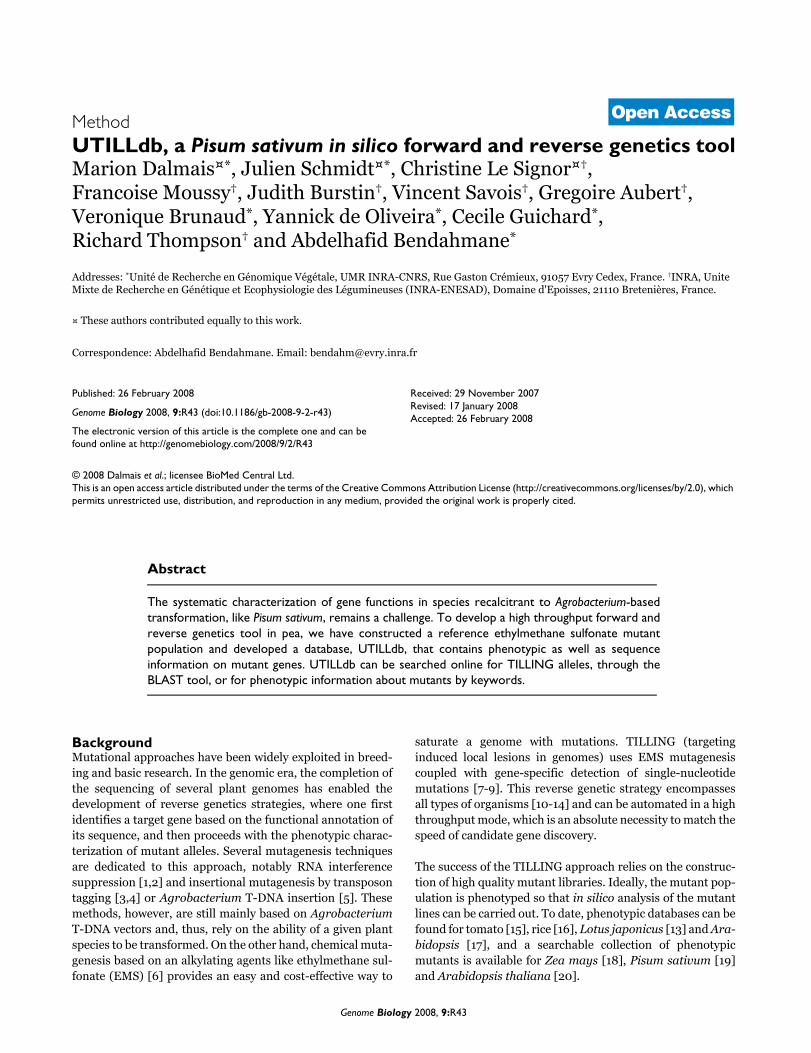
Open Access2008Dalmaiset al.Volume 9, Issue 2, Article R43MethodUTILLdb, a Pisum sativum in silico forward and reverse genetics toolMarion Dalmais¤*, Julien Schmidt¤*, Christine Le Signor¤†, Francoise Moussy†, Judith Burstin†, Vincent Savois†, Gregoire Aubert†, Veronique Brunaud*, Yannick de Oliveira*, Cecile Guichard*, Richard Thompson† and Abdelhafid Bendahmane*
Addresses: *Unité de Recherche en Génomique Végétale, UMR INRA-CNRS, Rue Gaston Crémieux, 91057 Evry Cedex, France. †INRA, Unite Mixte de Recherche en Génétique et Ecophysiologie des Légumineuses (INRA-ENESAD), Domaine d'Epoisses, 21110 Bretenières, France.
¤ These authors contributed equally to this work.
Correspondence: Abdelhafid Bendahmane. Email: [email protected]
© 2008 Dalmais et al.; licensee BioMed Central Ltd. This is an open access article distributed under the terms of the Creative Commons Attribution License (http://creativecommons.org/licenses/by/2.0), which permits unrestricted use, distribution, and reproduction in any medium, provided the original work is properly cited.Pea genetics database<p>UTILLdb is a database of phenotypic and sequence information on mutant genes from a reference Pisum sativum EMS-mutant popu-lation.</p>
Abstract
The systematic characterization of gene functions in species recalcitrant to Agrobacterium-basedtransformation, like Pisum sativum, remains a challenge. To develop a high throughput forward andreverse genetics tool in pea, we have constructed a reference ethylmethane sulfonate mutantpopulation and developed a database, UTILLdb, that contains phenotypic as well as sequenceinformation on mutant genes. UTILLdb can be searched online for TILLING alleles, through theBLAST tool, or for phenotypic information about mutants by keywords.
BackgroundMutational approaches have been widely exploited in breed-ing and basic research. In the genomic era, the completion ofthe sequencing of several plant genomes has enabled thedevelopment of reverse genetics strategies, where one firstidentifies a target gene based on the functional annotation ofits sequence, and then proceeds with the phenotypic charac-terization of mutant alleles. Several mutagenesis techniquesare dedicated to this approach, notably RNA interferencesuppression [1,2] and insertional mutagenesis by transposontagging [3,4] or Agrobacterium T-DNA insertion [5]. Thesemethods, however, are still mainly based on AgrobacteriumT-DNA vectors and, thus, rely on the ability of a given plantspecies to be transformed. On the other hand, chemical muta-genesis based on an alkylating agents like ethylmethane sul-fonate (EMS) [6] provides an easy and cost-effective way to
saturate a genome with mutations. TILLING (targetinginduced local lesions in genomes) uses EMS mutagenesiscoupled with gene-specific detection of single-nucleotidemutations [7-9]. This reverse genetic strategy encompassesall types of organisms [10-14] and can be automated in a highthroughput mode, which is an absolute necessity to match thespeed of candidate gene discovery.
The success of the TILLING approach relies on the construc-tion of high quality mutant libraries. Ideally, the mutant pop-ulation is phenotyped so that in silico analysis of the mutantlines can be carried out. To date, phenotypic databases can befound for tomato [15], rice [16], Lotus japonicus [13] and Ara-bidopsis [17], and a searchable collection of phenotypicmutants is available for Zea mays [18], Pisum sativum [19]and Arabidopsis thaliana [20].
Published: 26 February 2008
Genome Biology 2008, 9:R43 (doi:10.1186/gb-2008-9-2-r43)
Received: 29 November 2007Revised: 17 January 2008Accepted: 26 February 2008
The electronic version of this article is the complete one and can be found online at http://genomebiology.com/2008/9/2/R43
Genome Biology 2008, 9:R43
http://genomebiology.com/2008/9/2/R43 Genome Biology 2008, Volume 9, Issue 2, Article R43 Dalmais et al. R43.2
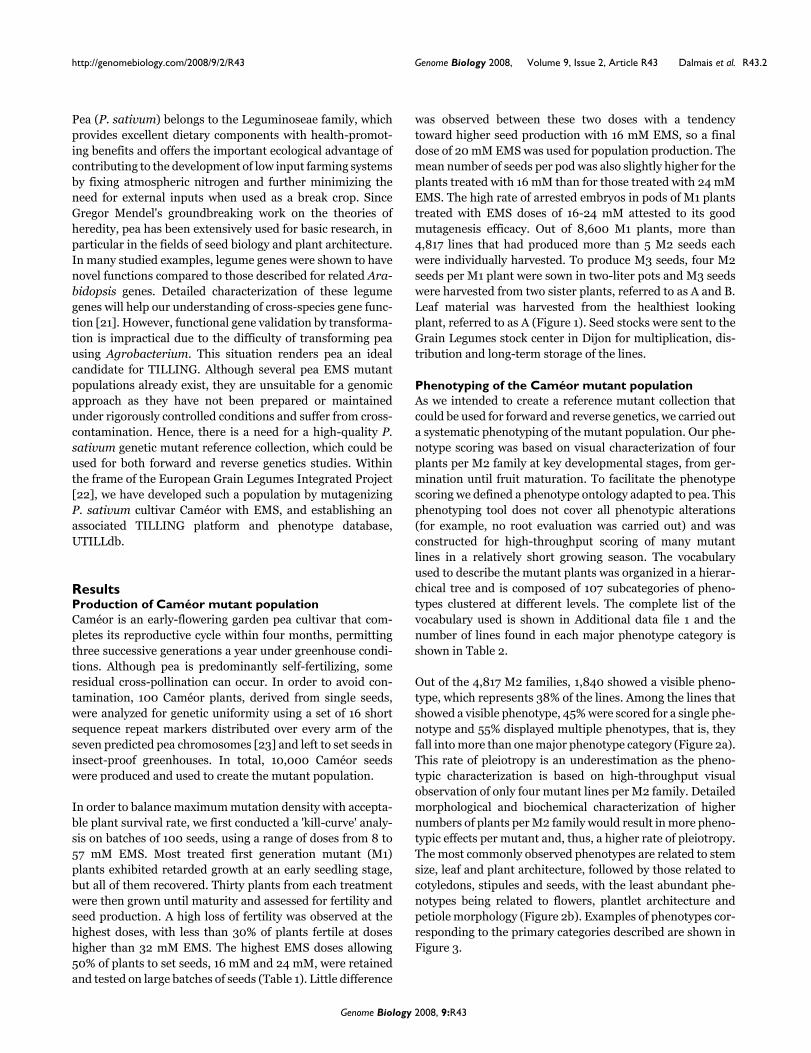
Pea (P. sativum) belongs to the Leguminoseae family, whichprovides excellent dietary components with health-promot-ing benefits and offers the important ecological advantage ofcontributing to the development of low input farming systemsby fixing atmospheric nitrogen and further minimizing theneed for external inputs when used as a break crop. SinceGregor Mendel's groundbreaking work on the theories ofheredity, pea has been extensively used for basic research, inparticular in the fields of seed biology and plant architecture.In many studied examples, legume genes were shown to havenovel functions compared to those described for related Ara-bidopsis genes. Detailed characterization of these legumegenes will help our understanding of cross-species gene func-tion [21]. However, functional gene validation by transforma-tion is impractical due to the difficulty of transforming peausing Agrobacterium. This situation renders pea an idealcandidate for TILLING. Although several pea EMS mutantpopulations already exist, they are unsuitable for a genomicapproach as they have not been prepared or maintainedunder rigorously controlled conditions and suffer from cross-contamination. Hence, there is a need for a high-quality P.sativum genetic mutant reference collection, which could beused for both forward and reverse genetics studies. Withinthe frame of the European Grain Legumes Integrated Project[22], we have developed such a population by mutagenizingP. sativum cultivar Caméor with EMS, and establishing anassociated TILLING platform and phenotype database,UTILLdb.
ResultsProduction of Caméor mutant populationCaméor is an early-flowering garden pea cultivar that com-pletes its reproductive cycle within four months, permittingthree successive generations a year under greenhouse condi-tions. Although pea is predominantly self-fertilizing, someresidual cross-pollination can occur. In order to avoid con-tamination, 100 Caméor plants, derived from single seeds,were analyzed for genetic uniformity using a set of 16 shortsequence repeat markers distributed over every arm of theseven predicted pea chromosomes [23] and left to set seeds ininsect-proof greenhouses. In total, 10,000 Caméor seedswere produced and used to create the mutant population.
In order to balance maximum mutation density with accepta-ble plant survival rate, we first conducted a 'kill-curve' analy-sis on batches of 100 seeds, using a range of doses from 8 to57 mM EMS. Most treated first generation mutant (M1)plants exhibited retarded growth at an early seedling stage,but all of them recovered. Thirty plants from each treatmentwere then grown until maturity and assessed for fertility andseed production. A high loss of fertility was observed at thehighest doses, with less than 30% of plants fertile at doseshigher than 32 mM EMS. The highest EMS doses allowing50% of plants to set seeds, 16 mM and 24 mM, were retainedand tested on large batches of seeds (Table 1). Little difference
was observed between these two doses with a tendencytoward higher seed production with 16 mM EMS, so a finaldose of 20 mM EMS was used for population production. Themean number of seeds per pod was also slightly higher for theplants treated with 16 mM than for those treated with 24 mMEMS. The high rate of arrested embryos in pods of M1 plantstreated with EMS doses of 16-24 mM attested to its goodmutagenesis efficacy. Out of 8,600 M1 plants, more than4,817 lines that had produced more than 5 M2 seeds eachwere individually harvested. To produce M3 seeds, four M2seeds per M1 plant were sown in two-liter pots and M3 seedswere harvested from two sister plants, referred to as A and B.Leaf material was harvested from the healthiest lookingplant, referred to as A (Figure 1). Seed stocks were sent to theGrain Legumes stock center in Dijon for multiplication, dis-tribution and long-term storage of the lines.
Phenotyping of the Caméor mutant populationAs we intended to create a reference mutant collection thatcould be used for forward and reverse genetics, we carried outa systematic phenotyping of the mutant population. Our phe-notype scoring was based on visual characterization of fourplants per M2 family at key developmental stages, from ger-mination until fruit maturation. To facilitate the phenotypescoring we defined a phenotype ontology adapted to pea. Thisphenotyping tool does not cover all phenotypic alterations(for example, no root evaluation was carried out) and wasconstructed for high-throughput scoring of many mutantlines in a relatively short growing season. The vocabularyused to describe the mutant plants was organized in a hierar-chical tree and is composed of 107 subcategories of pheno-types clustered at different levels. The complete list of thevocabulary used is shown in Additional data file 1 and thenumber of lines found in each major phenotype category isshown in Table 2.
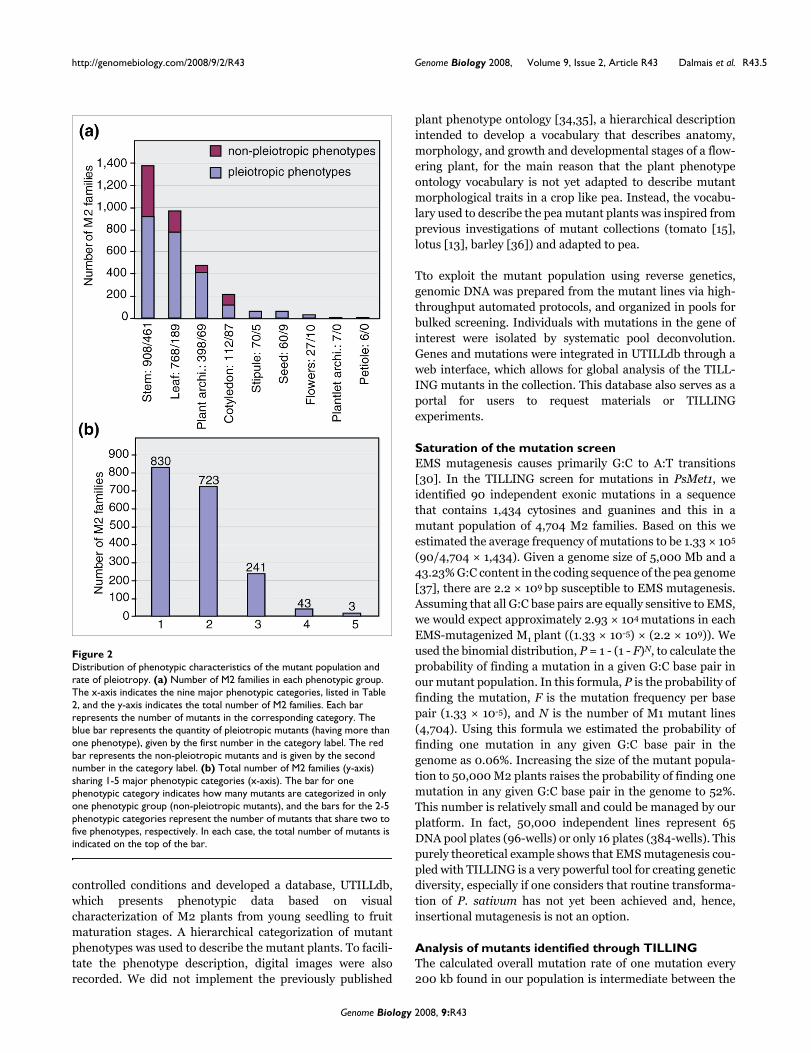
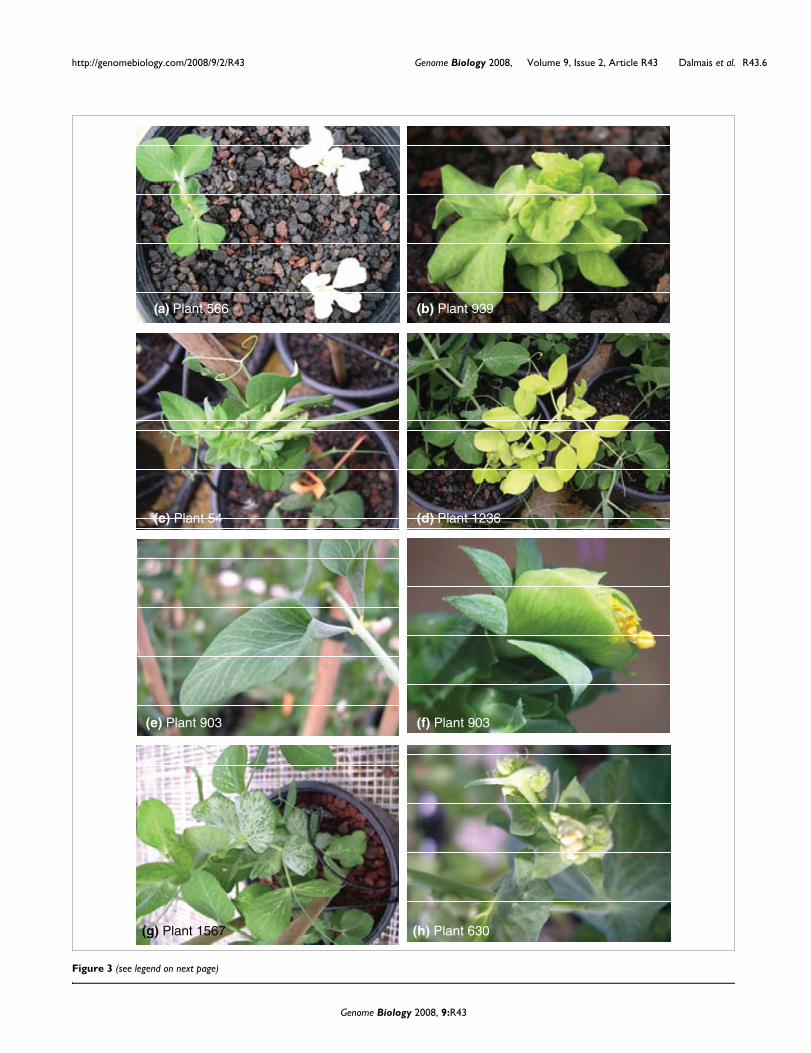
Out of the 4,817 M2 families, 1,840 showed a visible pheno-type, which represents 38% of the lines. Among the lines thatshowed a visible phenotype, 45% were scored for a single phe-notype and 55% displayed multiple phenotypes, that is, theyfall into more than one major phenotype category (Figure 2a).This rate of pleiotropy is an underestimation as the pheno-typic characterization is based on high-throughput visualobservation of only four mutant lines per M2 family. Detailedmorphological and biochemical characterization of highernumbers of plants per M2 family would result in more pheno-typic effects per mutant and, thus, a higher rate of pleiotropy.The most commonly observed phenotypes are related to stemsize, leaf and plant architecture, followed by those related tocotyledons, stipules and seeds, with the least abundant phe-notypes being related to flowers, plantlet architecture andpetiole morphology (Figure 2b). Examples of phenotypes cor-responding to the primary categories described are shown inFigure 3.
Genome Biology 2008, 9:R43
http://genomebiology.com/2008/9/2/R43 Genome Biology 2008, Volume 9, Issue 2, Article R43 Dalmais et al. R43.3
Caméor TILLING platformTo set up the pea TILLING platform, DNA samples were pre-pared from 4,704 M2 plants, each representing an independ-ent family and organized in pools of 8 M2 families. One keyfactor in TILLING is the availability of the annotated genomicsequence of the gene to be tilled. Even though the pea genome
has not yet been sequenced, acquisition of the genomicsequences of target genes is facilitated by the high degree ofsynteny between pea and the model plant Medicago truncat-ula, which is being sequenced [24]. The CODDLE program(Codons Optimized to Discover Deleterious Lesions [25,26])combined with the PRIMER3 tool [27] are used to define thebest amplicon for TILLING. PCR products used for TILLINGhave a maximum size of about 1,500 bp and, therefore, longergenes are divided into several amplicons. To reduce variationin the quality and the quantity of the PCR amplification prod-uct due to the pea genome complexity and low amount ofgenomic DNA used in PCR, nested PCR is performed. Muta-tions are detected in the amplified targets using the mis-match-specific endonuclease ENDO1, as described previously[28]. Individual mutant lines are identified following a pooldeconvolution step, and then the mutated base is identifiedby sequencing.
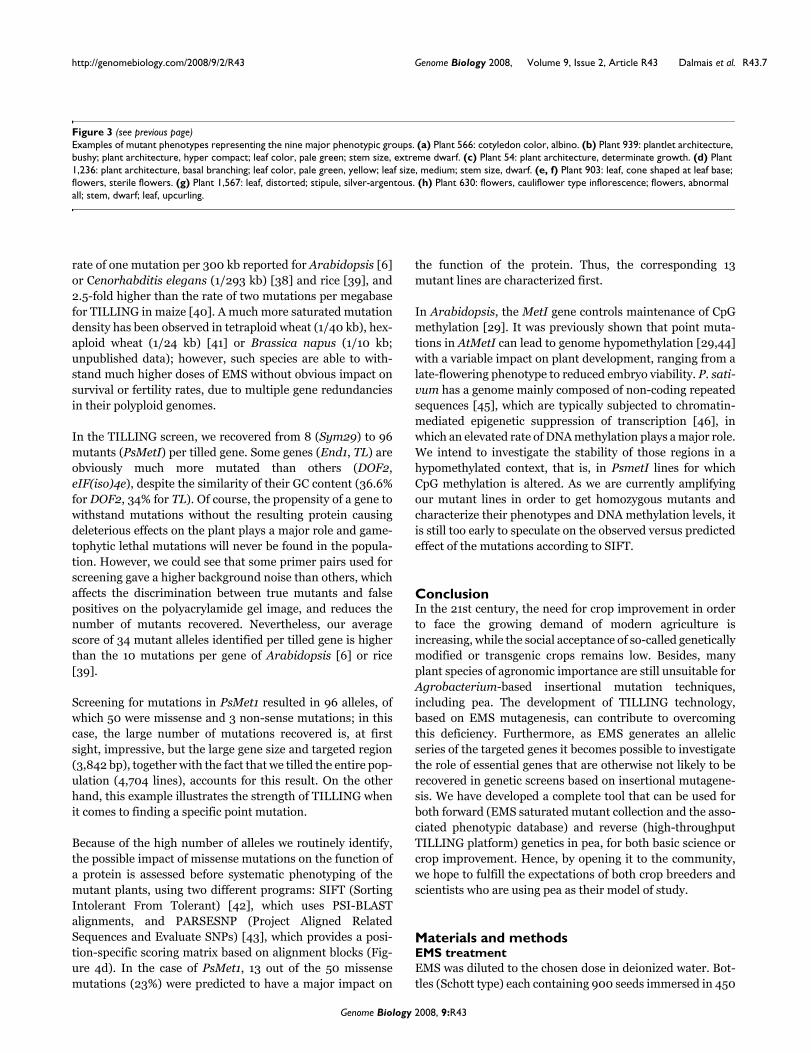
A primary objective in a mutagenesis project is to generate asaturated resource where every locus is mutated and repre-sented by multiple alleles. To evaluate the existence ofmultiple alleles per locus, we screened for mutations in thepea Methyl transferase 1 gene (PsMet1) [29]. Three ampliconsof 1,383, 1,310 and 1,149 bp were tilled (Figure 4) and 96mutants were identified (Figure 5). Sequence analysis of themutations showed that 6 were intronic, 37 silent, 50 missenseand 3 nonsense mutations (Figure 4b). Although characteri-zation of PsMet1 mutants is beyond the scope of this article,we found that retrieval of the mutant alleles from the A plantM3 seed stocks was successful, without the need to usebackup M3 seed stocks collected from the sister B plants (Fig-ure 1). The exonic mutants were mostly present as heterozy-gotes (79 out of 90 mutations), but 11 lines were homozygousfor the mutations. As expected with EMS mutagenesis, thesemutations were distributed relatively evenly within thescreened amplicons (Figure 4b).
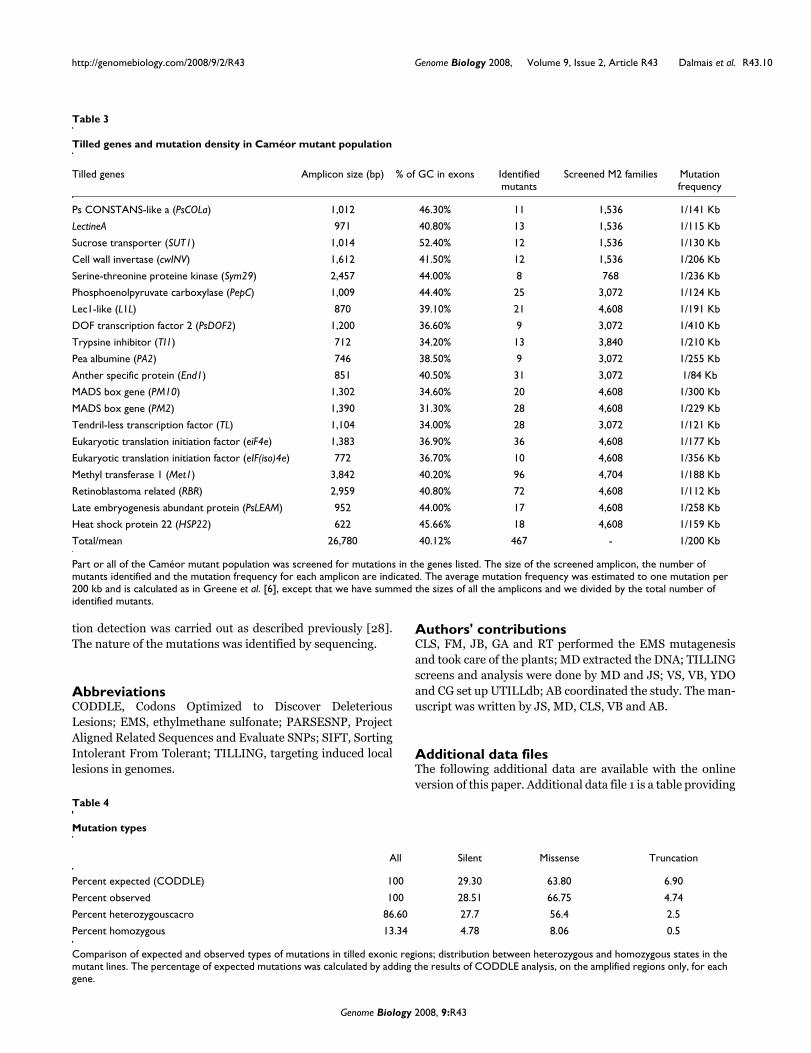
To further evaluate the quality of the mutant population, weextended the TILLING screen to another 19 genes andidentified 371 point mutations in those genes (Table 3). Asexpected for EMS, all the mutations were G:C to A:T transi-tions [6,30]. Induced mutations discovered in exons con-sisted of 66.75% missense, 28.51% silent and 4.74% stopmutations (Table 4). Although the number of observed mis-sense mutations was bigger than the amount predicted byCODDLE (63.80%), we recovered stop mutations in a slightlylower proportion than predicted (6.90%). As many tilledamplicons harbor intronic segments, some recovered muta-tions were intronic. Although some of these could potentiallyaffect the efficiency of mRNA splicing, such an impact isunpredictable. Thus, intronic mutants were not characterizedfurther. In contrast, the large number of non-synonymousmutations recovered is of interest as they may lead to gain- orloss-of-function phenotypes. Such mutations will also permitdissection of the function of the protein with respect to itssub-domain structure.
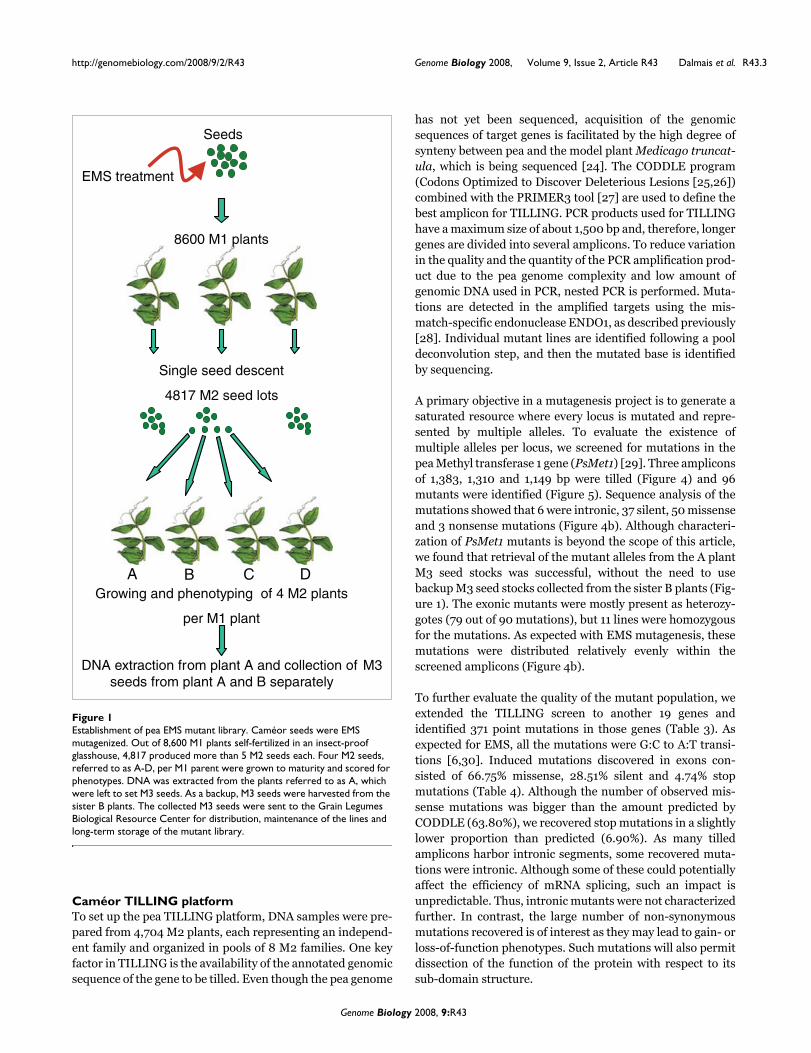
Establishment of pea EMS mutant libraryFigure 1Establishment of pea EMS mutant library. Caméor seeds were EMS mutagenized. Out of 8,600 M1 plants self-fertilized in an insect-proof glasshouse, 4,817 produced more than 5 M2 seeds each. Four M2 seeds, referred to as A-D, per M1 parent were grown to maturity and scored for phenotypes. DNA was extracted from the plants referred to as A, which were left to set M3 seeds. As a backup, M3 seeds were harvested from the sister B plants. The collected M3 seeds were sent to the Grain Legumes Biological Resource Center for distribution, maintenance of the lines and long-term storage of the mutant library.
Seeds
EMS treatment
8600 M1 plants
A B C D
Single seed descent
4817 M2 seed lots
Growing and phenotyping of 4 M2 plants
per M1 plant
DNA extraction from plant A and collection of M3 seeds from plant A and B separately
Genome Biology 2008, 9:R43
http://genomebiology.com/2008/9/2/R43 Genome Biology 2008, Volume 9, Issue 2, Article R43 Dalmais et al. R43.4
We calculated the mutation frequency in the 20 targetedgenes (Table 3) according to Greene et al. [6]: mutation fre-quency equals the size of the amplicon multiplied by the totalnumber of samples screened divided by the total number ofidentified mutants. We estimated the average mutation rateto be one mutation every 200 kb. This mutation density is 1.5times higher than the rate of one mutation per 300 kbreported for Arabidopsis, the best characterized TILLINGmutant population to date [6]. Therefore, the 16-24 mM doseof EMS used to create the pea mutant population appears tobe an adequate dose for TILLING. On average, we identified34 alleles per tilled gene (after normalization to TILLING ofthe entire population). Considering that about half of mis-sense mutations should have a deleterious effect on a typical
protein [31], 25 alleles per tilled kilobase would be sufficientfor phenotypic analyses.
Setup of the UTILLdb databaseWe scored 4,817 lines in the mutant population for pheno-typic alterations using 107 subcategories of phenotypes. InTILLING screens we searched for mutations in 20 genes andidentified 467 alleles. In order to manage and integrate theexpanding data from both the phenotype recordings andTILLING target genes, we implemented the databaseUTILLdb. UTILLdb was developed according to a relationaldatabase system, interconnecting four main modules: lines,phenotype categories, sequences and mutations. Two maintypes of data are accessible, the morphological phenotypes ofmutants and the sequences of tilled genes and correspondingalleles, when available. UTILLdb may be searched using asequence, through a BLAST tool [32] or for a phenotypic fea-ture using a keyword search. The outcome of the search isshown as a table of results that displays the phenotype of eachline, with associated pictures and mutated sequence if itexists. Thus, the user could ask whether lines that sharemutations in a specific gene share the same phenotypes andvice versa. As we expect the phenotypic characterization ofthe TILLING mutants to become more detailed as they areanalyzed by UTILLdb users, UTILLdb was designed so thatthe passport data of the mutant lines can be extended or mod-ified as needed. UTILLdb is publicly accessible through a webinterface [33]. A link is implemented to facilitate seedordering. UTILLdb serves also as an entry point for userswishing to have their favorite gene tilled on the Caméor TILL-ING platform. Results from those screens as well as the phe-notype of the mutants identified will be implemented inUTILLdb.
DiscussionMutant population for forward and reverse geneticsEMS-mutagenized populations have been created for differ-ent crops with, in many cases, multiple populations per crop.Information on the quality of the mutagenesis and theproduction and maintenance of the seed stocks are, however,often unavailable. We have constructed a reference EMSmutant population from P. sativum cultivar Caméor under
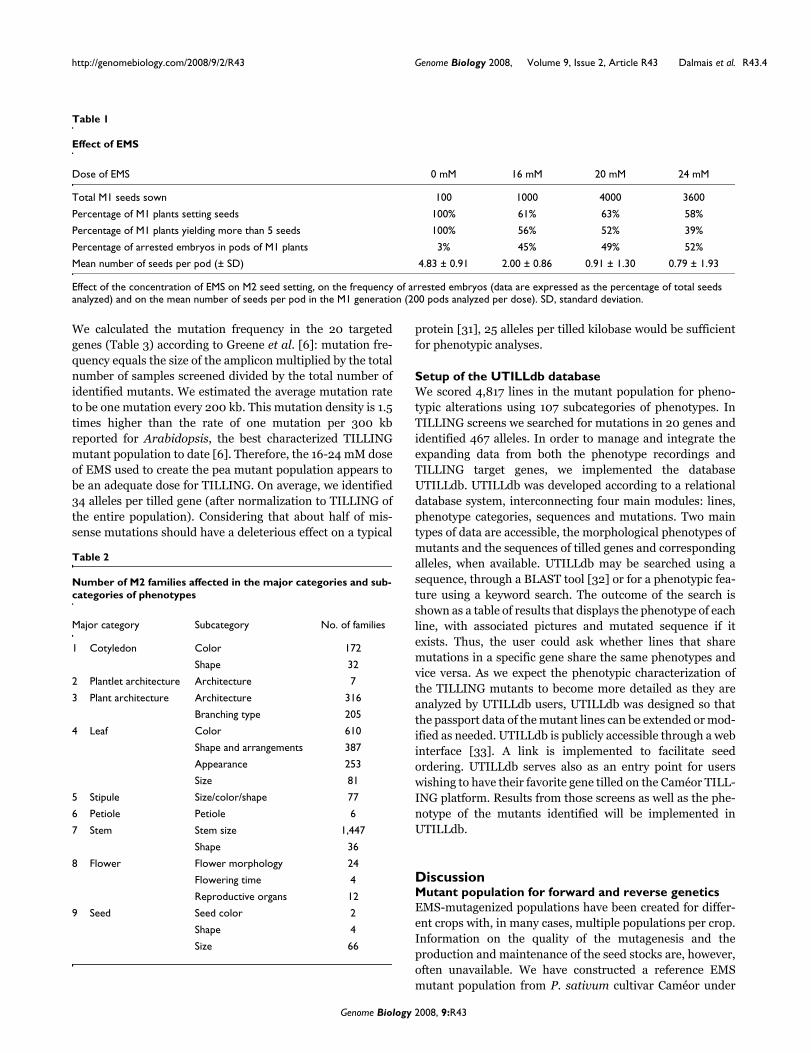
Table 1
Effect of EMS
Dose of EMS 0 mM 16 mM 20 mM 24 mM
Total M1 seeds sown 100 1000 4000 3600
Percentage of M1 plants setting seeds 100% 61% 63% 58%
Percentage of M1 plants yielding more than 5 seeds 100% 56% 52% 39%
Percentage of arrested embryos in pods of M1 plants 3% 45% 49% 52%
Mean number of seeds per pod (± SD) 4.83 ± 0.91 2.00 ± 0.86 0.91 ± 1.30 0.79 ± 1.93
Effect of the concentration of EMS on M2 seed setting, on the frequency of arrested embryos (data are expressed as the percentage of total seeds analyzed) and on the mean number of seeds per pod in the M1 generation (200 pods analyzed per dose). SD, standard deviation.
Table 2
Number of M2 families affected in the major categories and sub-categories of phenotypes
Major category Subcategory No. of families
1 Cotyledon Color 172
Shape 32
2 Plantlet architecture Architecture 7
3 Plant architecture Architecture 316
Branching type 205
4 Leaf Color 610
Shape and arrangements 387
Appearance 253
Size 81
5 Stipule Size/color/shape 77
6 Petiole Petiole 6
7 Stem Stem size 1,447
Shape 36
8 Flower Flower morphology 24
Flowering time 4
Reproductive organs 12
9 Seed Seed color 2
Shape 4
Size 66
Genome Biology 2008, 9:R43
http://genomebiology.com/2008/9/2/R43 Genome Biology 2008, Volume 9, Issue 2, Article R43 Dalmais et al. R43.5
controlled conditions and developed a database, UTILLdb,which presents phenotypic data based on visualcharacterization of M2 plants from young seedling to fruitmaturation stages. A hierarchical categorization of mutantphenotypes was used to describe the mutant plants. To facili-tate the phenotype description, digital images were alsorecorded. We did not implement the previously published
plant phenotype ontology [34,35], a hierarchical descriptionintended to develop a vocabulary that describes anatomy,morphology, and growth and developmental stages of a flow-ering plant, for the main reason that the plant phenotypeontology vocabulary is not yet adapted to describe mutantmorphological traits in a crop like pea. Instead, the vocabu-lary used to describe the pea mutant plants was inspired fromprevious investigations of mutant collections (tomato [15],lotus [13], barley [36]) and adapted to pea.
Tto exploit the mutant population using reverse genetics,genomic DNA was prepared from the mutant lines via high-throughput automated protocols, and organized in pools forbulked screening. Individuals with mutations in the gene ofinterest were isolated by systematic pool deconvolution.Genes and mutations were integrated in UTILLdb through aweb interface, which allows for global analysis of the TILL-ING mutants in the collection. This database also serves as aportal for users to request materials or TILLINGexperiments.
Saturation of the mutation screenEMS mutagenesis causes primarily G:C to A:T transitions[30]. In the TILLING screen for mutations in PsMet1, weidentified 90 independent exonic mutations in a sequencethat contains 1,434 cytosines and guanines and this in amutant population of 4,704 M2 families. Based on this weestimated the average frequency of mutations to be 1.33 × 10⁵
(90/4,704 × 1,434). Given a genome size of 5,000 Mb and a43.23% G:C content in the coding sequence of the pea genome[37], there are 2.2 × 10⁹ bp susceptible to EMS mutagenesis.Assuming that all G:C base pairs are equally sensitive to EMS,we would expect approximately 2.93 × 10⁴ mutations in eachEMS-mutagenized M1 plant ((1.33 × 10-5) × (2.2 × 109)). Weused the binomial distribution, P = 1 - (1 - F)N, to calculate theprobability of finding a mutation in a given G:C base pair inour mutant population. In this formula, P is the probability offinding the mutation, F is the mutation frequency per basepair (1.33 × 10⁻⁵), and N is the number of M1 mutant lines(4,704). Using this formula we estimated the probability offinding one mutation in any given G:C base pair in thegenome as 0.06%. Increasing the size of the mutant popula-tion to 50,000 M2 plants raises the probability of finding onemutation in any given G:C base pair in the genome to 52%.This number is relatively small and could be managed by ourplatform. In fact, 50,000 independent lines represent 65DNA pool plates (96-wells) or only 16 plates (384-wells). Thispurely theoretical example shows that EMS mutagenesis cou-pled with TILLING is a very powerful tool for creating geneticdiversity, especially if one considers that routine transforma-tion of P. sativum has not yet been achieved and, hence,insertional mutagenesis is not an option.
Analysis of mutants identified through TILLINGThe calculated overall mutation rate of one mutation every200 kb found in our population is intermediate between the
Distribution of phenotypic characteristics of the mutant population and rate of pleiotropyFigure 2Distribution of phenotypic characteristics of the mutant population and rate of pleiotropy. (a) Number of M2 families in each phenotypic group. The x-axis indicates the nine major phenotypic categories, listed in Table 2, and the y-axis indicates the total number of M2 families. Each bar represents the number of mutants in the corresponding category. The blue bar represents the quantity of pleiotropic mutants (having more than one phenotype), given by the first number in the category label. The red bar represents the non-pleiotropic mutants and is given by the second number in the category label. (b) Total number of M2 families (y-axis) sharing 1-5 major phenotypic categories (x-axis). The bar for one phenotypic category indicates how many mutants are categorized in only one phenotypic group (non-pleiotropic mutants), and the bars for the 2-5 phenotypic categories represent the number of mutants that share two to five phenotypes, respectively. In each case, the total number of mutants is indicated on the top of the bar.
Genome Biology 2008, 9:R43
http://genomebiology.com/2008/9/2/R43 Genome Biology 2008, Volume 9, Issue 2, Article R43 Dalmais et al. R43.6
Figure 3 (see legend on next page)
B. Plant 939A. Plant 566
C. Plant 54 D. Plant 1236
E. Plant 903
G. Plant 1567
F. Plant 903
H. Plant 630
(b) Plant 939(a) Plant 566
(c) Plant 54 (d) Plant 1236
(e) Plant 903
(g) Plant 1567
(f) Plant 903
(h) Plant 630
Genome Biology 2008, 9:R43
http://genomebiology.com/2008/9/2/R43 Genome Biology 2008, Volume 9, Issue 2, Article R43 Dalmais et al. R43.7
rate of one mutation per 300 kb reported for Arabidopsis [6]or Cenorhabditis elegans (1/293 kb) [38] and rice [39], and2.5-fold higher than the rate of two mutations per megabasefor TILLING in maize [40]. A much more saturated mutationdensity has been observed in tetraploid wheat (1/40 kb), hex-aploid wheat (1/24 kb) [41] or Brassica napus (1/10 kb;unpublished data); however, such species are able to with-stand much higher doses of EMS without obvious impact onsurvival or fertility rates, due to multiple gene redundanciesin their polyploid genomes.
In the TILLING screen, we recovered from 8 (Sym29) to 96mutants (PsMetI) per tilled gene. Some genes (End1, TL) areobviously much more mutated than others (DOF2,eIF(iso)4e), despite the similarity of their GC content (36.6%for DOF2, 34% for TL). Of course, the propensity of a gene towithstand mutations without the resulting protein causingdeleterious effects on the plant plays a major role and game-tophytic lethal mutations will never be found in the popula-tion. However, we could see that some primer pairs used forscreening gave a higher background noise than others, whichaffects the discrimination between true mutants and falsepositives on the polyacrylamide gel image, and reduces thenumber of mutants recovered. Nevertheless, our averagescore of 34 mutant alleles identified per tilled gene is higherthan the 10 mutations per gene of Arabidopsis [6] or rice[39].
Screening for mutations in PsMet1 resulted in 96 alleles, ofwhich 50 were missense and 3 non-sense mutations; in thiscase, the large number of mutations recovered is, at firstsight, impressive, but the large gene size and targeted region(3,842 bp), together with the fact that we tilled the entire pop-ulation (4,704 lines), accounts for this result. On the otherhand, this example illustrates the strength of TILLING whenit comes to finding a specific point mutation.
Because of the high number of alleles we routinely identify,the possible impact of missense mutations on the function ofa protein is assessed before systematic phenotyping of themutant plants, using two different programs: SIFT (SortingIntolerant From Tolerant) [42], which uses PSI-BLASTalignments, and PARSESNP (Project Aligned RelatedSequences and Evaluate SNPs) [43], which provides a posi-tion-specific scoring matrix based on alignment blocks (Fig-ure 4d). In the case of PsMet1, 13 out of the 50 missensemutations (23%) were predicted to have a major impact on
the function of the protein. Thus, the corresponding 13mutant lines are characterized first.
In Arabidopsis, the MetI gene controls maintenance of CpGmethylation [29]. It was previously shown that point muta-tions in AtMetI can lead to genome hypomethylation [29,44]with a variable impact on plant development, ranging from alate-flowering phenotype to reduced embryo viability. P. sati-vum has a genome mainly composed of non-coding repeatedsequences [45], which are typically subjected to chromatin-mediated epigenetic suppression of transcription [46], inwhich an elevated rate of DNA methylation plays a major role.We intend to investigate the stability of those regions in ahypomethylated context, that is, in PsmetI lines for whichCpG methylation is altered. As we are currently amplifyingour mutant lines in order to get homozygous mutants andcharacterize their phenotypes and DNA methylation levels, itis still too early to speculate on the observed versus predictedeffect of the mutations according to SIFT.
ConclusionIn the 21st century, the need for crop improvement in orderto face the growing demand of modern agriculture isincreasing, while the social acceptance of so-called geneticallymodified or transgenic crops remains low. Besides, manyplant species of agronomic importance are still unsuitable forAgrobacterium-based insertional mutation techniques,including pea. The development of TILLING technology,based on EMS mutagenesis, can contribute to overcomingthis deficiency. Furthermore, as EMS generates an allelicseries of the targeted genes it becomes possible to investigatethe role of essential genes that are otherwise not likely to berecovered in genetic screens based on insertional mutagene-sis. We have developed a complete tool that can be used forboth forward (EMS saturated mutant collection and the asso-ciated phenotypic database) and reverse (high-throughputTILLING platform) genetics in pea, for both basic science orcrop improvement. Hence, by opening it to the community,we hope to fulfill the expectations of both crop breeders andscientists who are using pea as their model of study.
Materials and methodsEMS treatmentEMS was diluted to the chosen dose in deionized water. Bot-tles (Schott type) each containing 900 seeds immersed in 450
Examples of mutant phenotypes representing the nine major phenotypic groupsFigure 3 (see previous page)Examples of mutant phenotypes representing the nine major phenotypic groups. (a) Plant 566: cotyledon color, albino. (b) Plant 939: plantlet architecture, bushy; plant architecture, hyper compact; leaf color, pale green; stem size, extreme dwarf. (c) Plant 54: plant architecture, determinate growth. (d) Plant 1,236: plant architecture, basal branching; leaf color, pale green, yellow; leaf size, medium; stem size, dwarf. (e, f) Plant 903: leaf, cone shaped at leaf base; flowers, sterile flowers. (g) Plant 1,567: leaf, distorted; stipule, silver-argentous. (h) Plant 630: flowers, cauliflower type inflorescence; flowers, abnormal all; stem, dwarf; leaf, upcurling.
Genome Biology 2008, 9:R43
http://genomebiology.com/2008/9/2/R43 Genome Biology 2008, Volume 9, Issue 2, Article R43 Dalmais et al. R43.8
Comparison between predicted and obtained mutationsFigure 4Comparison between predicted and obtained mutations. (a) Output of the CODDLE program using as an example the PsMetI genomic sequence. Exons are represented by white boxes and introns by red lines. The CODDLE program was used to identify those regions of the gene in which G:C to A:T transitions are most likely to result in deleterious effects on the encoded protein (represented by the probability curve traced in tourquoise). The CODDLE algorithm is based on an evaluation of protein sequence conservation from comparison of database accessions of homologous proteins. For PsMetI, three fragments were chosen based on these CODDLE results (blue lines). External and internal primers were designed to amplify each region by nested PCR. (b) Graphic representation of mutations identified in the three regions of the gene PsMetI. This drawing was made using the PARSESNP program [43], which maps the mutation on a gene model to illustrate the distribution of mutations. Purple triangles represent silent mutations and black and red triangles represent missense and truncation mutations, respectively.
b
(a) 1383 bp 1310 bp 1149 bp
(b)
Genome Biology 2008, 9:R43
http://genomebiology.com/2008/9/2/R43 Genome Biology 2008, Volume 9, Issue 2, Article R43 Dalmais et al. R43.9
ml of deionized water-EMS solution were placed on a rotaryshaker (50 rpm) overnight (15 h soaking). The EMS solutionwas then removed and seeds were rinsed extensively 12 timesfor 30 minutes with gentle shaking.
Plant growing conditionsPea (cultivar Caméor) seeds were sown in pots filled withsterile pouzzolane (inert medium, light volcanic grit) at a sow-ing depth of about 2 cm followed by abundant watering ingreenhouse conditions. Plants were then automaticallywatered with a solution of 3.5:3.1:8.6 N:P:K. The temperaturewas maintained between 14°C at night and 30°C during day-time, with supplementary lighting to provide a 16 h day.
Genomic DNA extraction and poolingFour pea leaf discs (diameter 10 mm) were collected in 96-well plates containing 2 steel beads (4 mm) per well, and tis-sues were ground using a bead mill. Genomic DNA was iso-lated using the DNeasy 96 Plant Kit (Qiagen, Hilden,Germany). All genomic DNA was quantified on a 0.8% agar-ose gel using λ DNA (Invitrogen, Carlsbad, CA, USA) as aconcentration reference. DNA samples were diluted tenfoldand pooled eightfold in a 96-well format. A population of4,704 arrayed DNAs from mutagenized individuals is pres-ently available for screening.
PCR amplification and mutation detectionPCR amplification was based on nested-PCR and universalprimers [14]. The first PCR amplification was a standard PCRreaction using target-specific primers and 4 ng of peagenomic DNA. One microliter of the first PCR served as atemplate for the second nested PCR amplification, using amix of gene-specific inner primers carrying a universal M13tail (CACGACGTTGTAAAACGAC for forward primers; GGA-TAACAATTTCACACAGG for reverse primers), in combina-tion with M13 universal primers, M13F700(CACGACGTTGTAAAACGAC) and M13R800 (GGA-TAACAATTTCACACAGG), labeled at the 5'end with infra-reddyes IRD700 and IRD800 (LI-COR®, Lincoln, NE, USA),respectively. This PCR was carried out using 0.1 μM of eachprimer, using the following two step cycling program: 94°Cfor 2 minutes, 10 cycles at 94°C for 15 s, primer-specificannealing temperature for 30 s and 72°C for 1 minute, fol-lowed by 25 cycles at 94°C for 15 s, 50°C for 30 s and 72°C for1 minute, then a final extension of 5 minutes at 72°C. Muta-
Figure 5
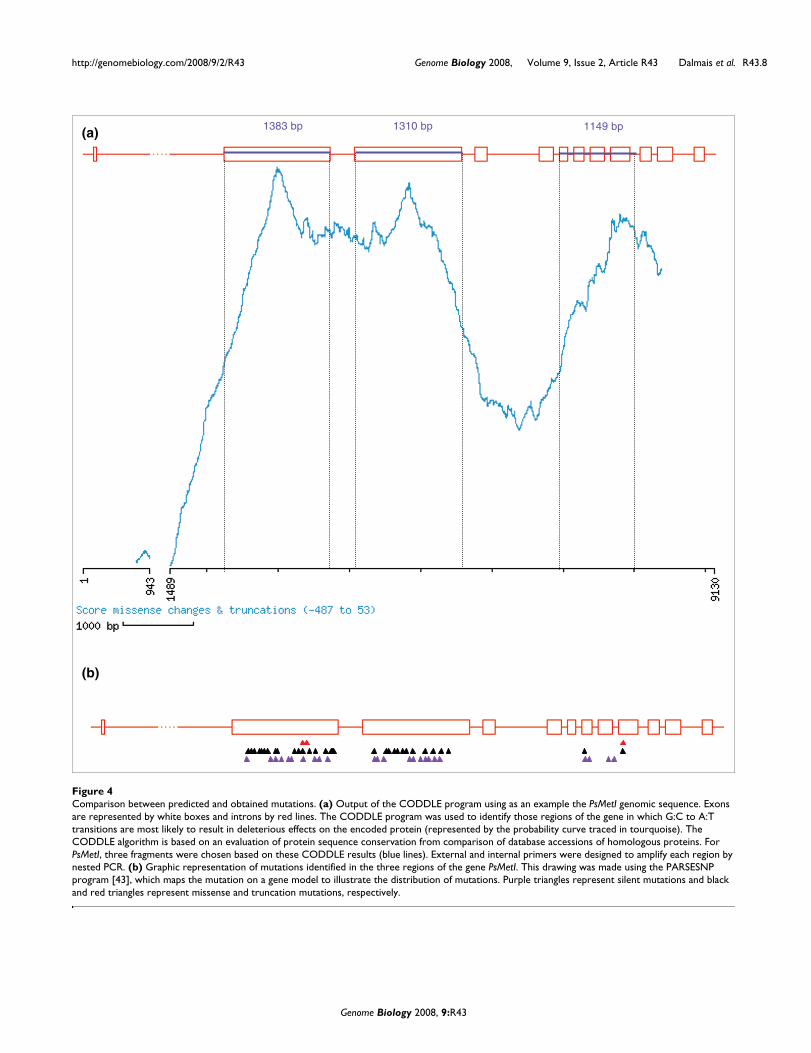
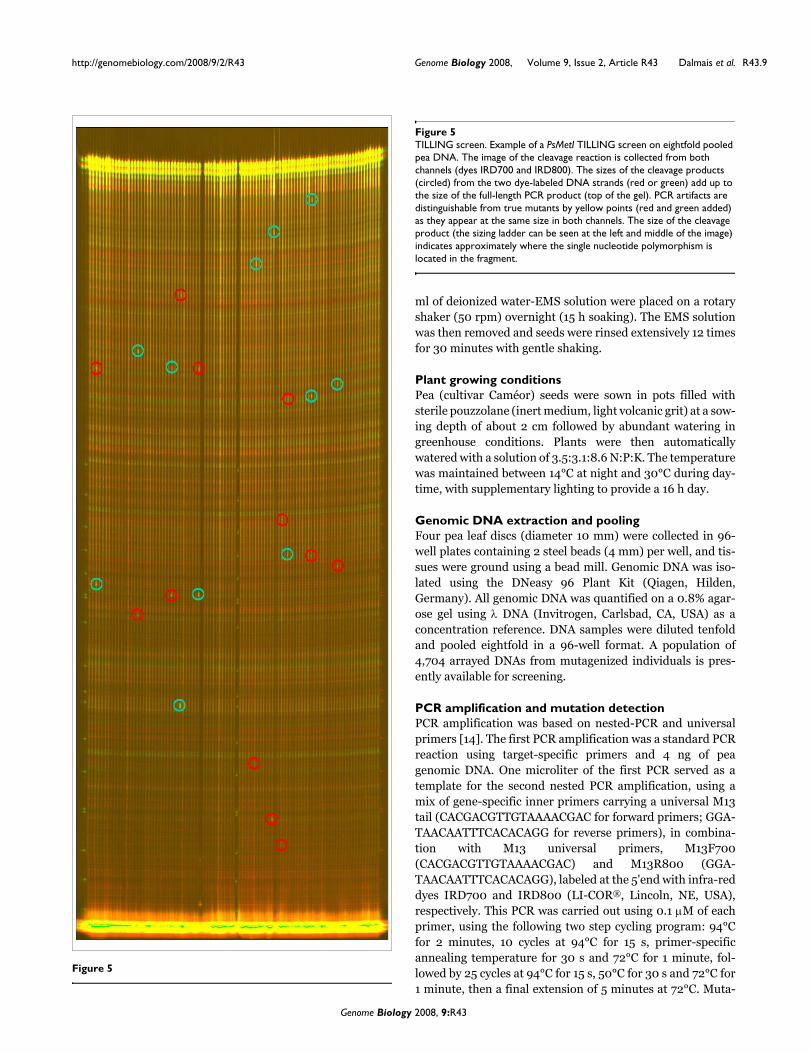
TILLING screenFigure 5TILLING screen. Example of a PsMetI TILLING screen on eightfold pooled pea DNA. The image of the cleavage reaction is collected from both channels (dyes IRD700 and IRD800). The sizes of the cleavage products (circled) from the two dye-labeled DNA strands (red or green) add up to the size of the full-length PCR product (top of the gel). PCR artifacts are distinguishable from true mutants by yellow points (red and green added) as they appear at the same size in both channels. The size of the cleavage product (the sizing ladder can be seen at the left and middle of the image) indicates approximately where the single nucleotide polymorphism is located in the fragment.
Genome Biology 2008, 9:R43
http://genomebiology.com/2008/9/2/R43 Genome Biology 2008, Volume 9, Issue 2, Article R43 Dalmais et al. R43.10
tion detection was carried out as described previously [28].The nature of the mutations was identified by sequencing.
AbbreviationsCODDLE, Codons Optimized to Discover DeleteriousLesions; EMS, ethylmethane sulfonate; PARSESNP, ProjectAligned Related Sequences and Evaluate SNPs; SIFT, SortingIntolerant From Tolerant; TILLING, targeting induced locallesions in genomes.
Authors' contributionsCLS, FM, JB, GA and RT performed the EMS mutagenesisand took care of the plants; MD extracted the DNA; TILLINGscreens and analysis were done by MD and JS; VS, VB, YDOand CG set up UTILLdb; AB coordinated the study. The man-uscript was written by JS, MD, CLS, VB and AB.
Additional data filesThe following additional data are available with the onlineversion of this paper. Additional data file 1 is a table providing
Table 3
Tilled genes and mutation density in Caméor mutant population
Tilled genes Amplicon size (bp) % of GC in exons Identified mutants
Screened M2 families Mutation frequency
Ps CONSTANS-like a (PsCOLa) 1,012 46.30% 11 1,536 1/141 Kb
LectineA 971 40.80% 13 1,536 1/115 Kb
Sucrose transporter (SUT1) 1,014 52.40% 12 1,536 1/130 Kb
Cell wall invertase (cwINV) 1,612 41.50% 12 1,536 1/206 Kb
Serine-threonine proteine kinase (Sym29) 2,457 44.00% 8 768 1/236 Kb
Phosphoenolpyruvate carboxylase (PepC) 1,009 44.40% 25 3,072 1/124 Kb
Lec1-like (L1L) 870 39.10% 21 4,608 1/191 Kb
DOF transcription factor 2 (PsDOF2) 1,200 36.60% 9 3,072 1/410 Kb
Trypsine inhibitor (TI1) 712 34.20% 13 3,840 1/210 Kb
Pea albumine (PA2) 746 38.50% 9 3,072 1/255 Kb
Anther specific protein (End1) 851 40.50% 31 3,072 1/84 Kb
MADS box gene (PM10) 1,302 34.60% 20 4,608 1/300 Kb
MADS box gene (PM2) 1,390 31.30% 28 4,608 1/229 Kb
Tendril-less transcription factor (TL) 1,104 34.00% 28 3,072 1/121 Kb
Eukaryotic translation initiation factor (eiF4e) 1,383 36.90% 36 4,608 1/177 Kb
Eukaryotic translation initiation factor (eIF(iso)4e) 772 36.70% 10 4,608 1/356 Kb
Methyl transferase 1 (Met1) 3,842 40.20% 96 4,704 1/188 Kb
Retinoblastoma related (RBR) 2,959 40.80% 72 4,608 1/112 Kb
Late embryogenesis abundant protein (PsLEAM) 952 44.00% 17 4,608 1/258 Kb
Heat shock protein 22 (HSP22) 622 45.66% 18 4,608 1/159 Kb
Total/mean 26,780 40.12% 467 - 1/200 Kb
Part or all of the Caméor mutant population was screened for mutations in the genes listed. The size of the screened amplicon, the number of mutants identified and the mutation frequency for each amplicon are indicated. The average mutation frequency was estimated to one mutation per 200 kb and is calculated as in Greene et al. [6], except that we have summed the sizes of all the amplicons and we divided by the total number of identified mutants.
Table 4
Mutation types
All Silent Missense Truncation
Percent expected (CODDLE) 100 29.30 63.80 6.90
Percent observed 100 28.51 66.75 4.74
Percent heterozygouscacro 86.60 27.7 56.4 2.5
Percent homozygous 13.34 4.78 8.06 0.5
Comparison of expected and observed types of mutations in tilled exonic regions; distribution between heterozygous and homozygous states in the mutant lines. The percentage of expected mutations was calculated by adding the results of CODDLE analysis, on the amplified regions only, for each gene.
Genome Biology 2008, 9:R43
http://genomebiology.com/2008/9/2/R43 Genome Biology 2008, Volume 9, Issue 2, Article R43 Dalmais et al. R43.11
the pea mutant phenotype list used for describing and record-ing M2 mutant plant phenotypes in UTILLdb.Additional data file 1Pea mutant phenotype list used for describing and recording M2 mutant plant phenotypes in UTILLdbPea mutant phenotype list used for describing and recording M2 mutant plant phenotypes in UTILLdb.Click here for file
AcknowledgementsThis work was supported by the European Grain Legumes IntegratedProject (FOOD-CT-2004-506223) and the European Commission FP6Framework Programme. The authors wish to thank B Darchy for takingcare of the plants; K Triques, P Audigier and S Chauvin for taking samples;M Nicolas and the GFPC TILLING team for useful discussions; and J Hoferand C Goldstein for useful comments on the manuscript. We are alsograteful to the GLIP collaborators, who permitted us to present the screen-ing data of their genes.
References1. Hilson P, Allemeersch J, Altmann T, Aubourg S, Avon A, Beynon J,
Bhalerao RP, Bitton F, Caboche M, Cannoot B, Chardakov V, Cognet-Holliger C, Colot V, Crowe M, Darimont C, Durinck S, Eickhoff H, deLongevialle AF, Farmer EE, Grant M, Kuiper MTR, Lehrach H, LeonC, Leyva A, Lundeberg J, Lurin C, Moreau Y, Nietfeld W, Paz-Ares J,Reymond P, et al.: Versatile gene-specific sequence tags for Ara-bidopsis functional genomics: transcript profiling and reversegenetics applications. Genome Res 2004, 14:2176-2189.
2. Waterhouse PM, Graham MW, Wang M-B: Virus resistance andgene silencing in plants can be induced by simultaneousexpression of sense and antisense RNA. Proc Natl Acad Sci USA1998, 95:13959-13964.
3. Long D, Coupland G: Transposon tagging with Ac/Ds in Arabi-dopsis. Methods Mol Biol 1998, 82:315-328.
4. May BP, Liu H, Vollbrecht E, Senior L, Rabinowicz PD, Roh D, Pan X,Stein L, Freeling M, Alexander D, Martienssen R: Maize-targetedmutagenesis: a knockout resource for maize. Proc Natl Acad SciUSA 2003, 100:11541-11546.
5. Alonso JM, Stepanova AN, Leisse TJ, Kim CJ, Chen H, Shinn P, Ste-venson DK, Zimmerman J, Barajas P, Cheuk R, Gadrinab C, Heller C,Jeske A, Koesema E, Meyers CC, Parker H, Prednis L, Ansari Y, ChoyN, Deen H, Geralt M, Hazari N, Hom E, Karnes M, Mulholland C,Ndubaku R, Schmidt I, Guzman P, Aguilar-Henonin L, Schmid M, et al.:Genome-wide insertional mutagenesis of Arabidopsisthaliana. Science 2003, 301:653-657.
6. Greene EA, Codomo CA, Taylor NE, Henikoff JG, Till BJ, ReynoldsSH, Enns LC, Burtner C, Johnson JE, Odden AR, Comai L, Henikoff S:Spectrum of chemically induced mutations from a large-scale reverse-genetic screen in Arabidopsis. Genetics 2003,164:731-740.
7. Henikoff S, Till BJ, Comai L: TILLING. Traditional mutagenesismeets functional genomics. Plant Physiol 2004, 135:630-636.
8. Comai L, Henikoff S: TILLING: practical single-nucleotidemutation discovery. Plant J 2006, 45:684-694.
9. McCallum CM, Comai L, Greene EA, Henikoff S: Targeting inducedlocal lesions in genomes (TILLING) for plant functionalgenomics. Plant Physiol 2000, 123:439-442.
10. Bentley A, MacLennan B, Calvo J, Dearolf CR: Targeted recoveryof mutations in Drosophila. Genetics 2000, 156:1169-1173.
11. Coghill EL, Hugill A, Parkinson N, Davison C, Glenister P, ClementsS, Hunter J, Cox RD, Brown SDM: A gene-driven approach to theidentification of ENU mutants in the mouse. Nat Genet 2002,30:255-256.
12. Colbert T, Till BJ, Tompa R, Reynolds S, Steine MN, Yeung AT, McCa-llum CM, Comai L, Henikoff S: High-throughput screening forinduced point mutations. Plant Physiol 2001, 126:480-484.
13. Perry JA, Wang TL, Welham TJ, Gardner S, Pike JM, Yoshida S, Parni-ske M: A TILLING reverse genetics tool and a web-accessiblecollection of mutants of the legume Lotus japonicus. PlantPhysiol 2003, 131:866-871.
14. Wienholds E, van Eeden F, Kosters M, Mudde J, Plasterk RHA, Cup-pen E: Efficient target-selected mutagenesis in zebrafish.Genome Res 2003, 13:2700-2707.
15. Menda N, Semel Y, Peled D, Eshed Y, Zamir D: In silico screeningof a saturated mutation library of tomato. Plant J 2004,38:861-872.
16. Miyao A, Iwasaki Y, Kitano H, Itoh J-I, Maekawa M, Murata K, YatouO, Nagato Y, Hirochika H: A large-scale collection of pheno-typic data describing an insertional mutant population to
facilitate functional analysis of rice genes. Plant Mol Biol 2007,63:625-635.
17. Kuromori T, Wada T, Kamiya A, Yuguchi M, Yokouchi T, Imura Y,Takabe H, Sakurai T, Akiyama K, Hirayama T, Okada K, Shinozaki K:A trial of phenome analysis using 4000 Ds-insertionalmutants in gene-coding regions of Arabidopsis. Plant J 2006,47:640-651.
18. Lawrence CJ, Seigfried TE, Brendel V: The Maize Genetics andGenomics Database. The community resource for access todiverse maize data. Plant Physiol 2005, 138:55-58.
19. Lee JM, Davenport GF, Marshall D, Ellis THN, Ambrose MJ, Dicks J,van Hintum TJL, Flavell AJ: GERMINATE. A generic database forintegrating genotypic and phenotypic information for plantgenetic resource collections. Plant Physiol 2005, 139:619-631.
20. Rhee SY, Beavis W, Berardini TZ, Chen G, Dixon D, Doyle A, Garcia-Hernandez M, Huala E, Lander G, Montoya M, Miller N, Mueller LA,Mundodi S, Reiser L, Tacklind J, Weems DC, Wu Y, Xu I, Yoo D,Yoon J, Zhang P: The Arabidopsis Information Resource(TAIR): a model organism database providing a centralized,curated gateway to Arabidopsis biology, research materialsand community. Nucleic Acids Res 2003, 31:224-228.
21. Domoney C, Duc G, Ellis TN, Ferrandiz C, Firnhaber C, Gallardo K,Hofer J, Kopka J, Kuster H, Madueno F, Munier-Jolain NG, Mayer K,Thompson R, Udvardi M, Salon C: Genetic and genomic analysisof legume flowers and seeds. Curr Opin Plant Biol 2006, 9:133-141.
22. The Grain Legumes Integrated Project [http://www.eugrainlegumes.org/]
23. Loridon K, McPhee K, Morin J, Dubreuil P, Pilet-Nayel M, Aubert G,Rameau C, Baranger A, Coyne C, Lejeune-Hénaut I, Burstin J: Micro-satellite marker polymorphism and mapping in pea (Pisumsativum L.). Theor Appl Genet 2005, 111:1022-1031.
24. Aubert G, Morin J, Jacquin F, Loridon K, Quillet M, Petit A, RameauC, Lejeune-Hénaut I, Huguet T, Burstin J: Functional mapping inpea, as an aid to the candidate gene selection and for inves-tigating synteny with the model legume Medicago truncatula.Theor Appl Genet 2006, 112:1024-1041.
25. Till BJ, Reynolds SH, Greene EA, Codomo CA, Enns LC, Johnson JE,Burtner C, Odden AR, Young K, Taylor NE, Henikoff JG, Comai L,Henikoff S: Large-scale discovery of induced point mutationswith high-throughput TILLING. Genome Res 2003, 13:524-530.
26. CODDLE: Codons Optimized to Discover DeleteriousLEsions [http://www.proweb.org/coddle]
27. Rozen S, Skaletsky H: Primer3 on the WWW for general usersand for biologist programmers. In Bioinformatics Methods and Pro-tocols: Methods in Molecular Biology Edited by: Krawetz SA, Misener S.Totowa, NJ: Humana Press; 2000:365-386.
28. Triques K, Sturbois B, Gallais S, Dalmais M, Chauvin S, Clepet C,Aubourg S, Rameau C, Caboche M, Bendahmane A: Characteriza-tion of Arabidopsis thaliana mismatch specific endonucleases:application to mutation discovery by TILLING in pea. Plant J2007, 51:1116-1125.
29. Kankel MW, Ramsey DE, Stokes TL, Flowers SK, Haag JR, JeddelohJA, Riddle NC, Verbsky ML, Richards EJ: Arabidopsis MET1 cyto-sine methyltransferase mutants. Genetics 2003, 163:1109-1122.
30. Krieg DR: Ethyl methanesulfonate-induced reversion of bac-teriophage T4rII mutants. Genetics 1963, 48:561-580.
31. Markiewicz P, Kleina LG, Cruz C, Ehret S, Miller JH: Genetic studiesof the lac repressor. XIV. Analysis of 4000 altered Escherichiacoli lac repressors reveals essential and non-essential resi-dues, as well as "spacers" which do not require a specificsequence. J Mol Biol 1994, 240:421-433.
32. Altschul S, Gish W, Miller W, Myers E, Lipman DJ: Basic local align-ment search tool. J Mol Biol 1990, 215:403-410.
33. UTILLdb: URGV TILLING database [http://urgv.evry.inra.fr/UTILLdb]
34. Ilic K, Kellogg EA, Jaiswal P, Zapata F, Stevens PF, Vincent LP, AvrahamS, Reiser L, Pujar A, Sachs MM, Whitman NT, McCouch SR, SchaefferML, Ware DH, Stein LD, Rhee SY: The Plant StructureOntology, a unified vocabulary of anatomy and morphologyof a flowering plant. Plant Physiol 2007, 143:587-599.
35. Jaiswal P, Avraham S, Ilic K, Kellogg E, McCouch S, Pujar A, Reiser L,Rhee S, Sachs M, Schaeffer M, Stein L, Stevens P, Vincent L, Ware D,Zapata F: Plant Ontology (PO): a controlled vocabulary ofplant structures and growth stages. Comp Funct Genomics 2005,6:388-397.
36. Caldwell DG, McCallum N, Shaw P, Muehlbauer GJ, Marshall DF,Waugh R: A structured mutant population for forward andreverse genetics in Barley (Hordeum vulgare L.). Plant J 2004,
Genome Biology 2008, 9:R43
http://genomebiology.com/2008/9/2/R43 Genome Biology 2008, Volume 9, Issue 2, Article R43 Dalmais et al. R43.12
40:143-150.37. Nakamura Y, Gojobori T, Ikemura T: Codon usage tabulated
from international DNA sequence databases: status for theyear 2000. Nucleic Acids Res 2000, 28:292.
38. Gilchrist E, O'Neil N, Rose A, Zetka M, Haughn G: TILLING is aneffective reverse genetics technique for Caenorhabditiselegans. BMC Genomics 2006, 7:262.
39. Till B, Cooper J, Tai T, Colowit P, Greene E, Henikoff S, Comai L: Dis-covery of chemically induced mutations in rice by TILLING.BMC Plant Biol 2007, 7:19.
40. Till B, Reynolds S, Weil C, Springer N, Burtner C, Young K, BowersE, Codomo C, Enns L, Odden A, Greene E, Comai L, Henikoff S: Dis-covery of induced point mutations in maize genes byTILLING. BMC Plant Biol 2004, 4:12.
41. Slade AJ, Fuerstenberg SI, Loeffler D, Steine MN, Facciotti D: Areverse genetic, nontransgenic approach to wheat cropimprovement by TILLING. Nat Biotechnol 2005, 23:75-81.
42. Ng PC, Henikoff S: SIFT: predicting amino acid changes thataffect protein function. Nucleic Acids Res 2003, 31:3812-3814.
43. Taylor NE, Greene EA: PARSESNP: a tool for the analysis ofnucleotide polymorphisms. Nucleic Acids Res 2003,31:3808-3811.
44. Xiao W, Custard KD, Brown RC, Lemmon BE, Harada JJ, GoldbergRB, Fischer RL: DNA methylation is critical for Arabidopsisembryogenesis and seed viability. Plant Cell 2006, 18:805-814.
45. Ellis THN, Poyser SJ: An integrated and comparative view ofpea genetic and cytogenetic maps. New Phytologist 2002,153:17-25.
46. Martienssen RA, Colot V: DNA methylation and epigeneticinheritance in plants and filamentous fungi. Science 2001,293:1070-1074.
Genome Biology 2008, 9:R43