Embed Size (px)
Citation preview
Project Number: CM-TAC-0021
Utilizing the Quartz Crystal Microbalance with Dissipation to Bind
Cecropin P1 to Escherichia coli
A Major Qualifying Project Report:
submitted to the Faculty
of the
WORCESTER POLYTECHNIC INSTITUTE
In partial fulfillment of the requirements for the
Degree of Bachelor of Science
by
________________________________
Christine Cronin
and
________________________________
Andrea L. Kadilak
Date: March 28, 2008
Approved:
____________________________________
Professor Terri A. Camesano, Advisor

i
Abstract The main goal of this project was to study the binding and deactivation potential of the
antimicrobial peptide (AMP) cecropin P1 with eleven strains of E. coli with varying
lipopolysaccharide (LPS) membrane structure, using the quartz crystal microblance with
dissipation (QCM-D). A decrease in frequency and an increase in dissipation from the
QCM-D indicated an increase in the mass deposited on the gold crystals. A live/dead kit
was used to determine the amount of bacteria bound to the gold crystal surface and the
percentage dead with and without cecropin P1. The QCM-D showed four of the eleven
strains preferentially bound to cecropin P1, while the live/dead kit showed six strains
preferentially bound to cecropin P1. Three strains of E. coli (O157:H7, O113:H4, and
O35:K-:H10) showed preferential binding with cecropin P1 and resulted in a higher
percentage of the bacteria dead when in the presence of the AMP.

ii
Acknowledgements We would like to begin by thanking our advisor, Professor Terri A. Camesano,
Department of Chemical Engineering at Worcester Polytechnic Institute for giving us the
opportunity to work on this interesting project and conduct our research in the new state
of the art laboratories at Gateway Park.
Also, we are very appreciative of all of the help given to us by Professor Camesano’s
graduate students Joshua Strauss, Paola Pinzon-Arango, and Yatao Liu. In particular, we
would like to especially thank Joshua Strauss for all of his guidance and teaching
throughout this project.
Finally, we would like to thank Dr. Howard Ochman of the University of Arizona and
Kim Ziebel of Health Canada for kindly donating several strains of E. coli necessary for
this research.
iii
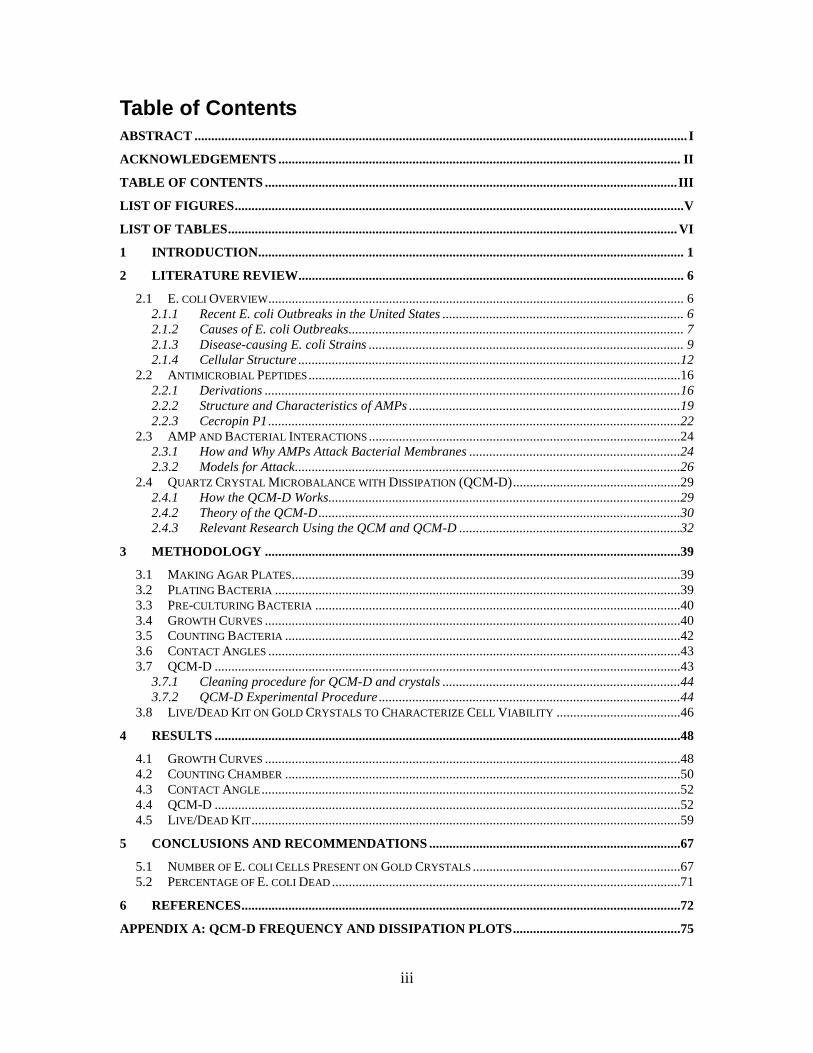
Table of Contents
ABSTRACT ................................................................................................................................................... I
ACKNOWLEDGEMENTS ........................................................................................................................ II
TABLE OF CONTENTS ........................................................................................................................... III
LIST OF FIGURES ...................................................................................................................................... V
LIST OF TABLES ...................................................................................................................................... VI
1 INTRODUCTION............................................................................................................................... 1
2 LITERATURE REVIEW................................................................................................................... 6
2.1 E. COLI OVERVIEW ............................................................................................................................ 6 2.1.1 Recent E. coli Outbreaks in the United States ........................................................................ 6 2.1.2 Causes of E. coli Outbreaks .................................................................................................... 7 2.1.3 Disease-causing E. coli Strains .............................................................................................. 9 2.1.4 Cellular Structure ..................................................................................................................12
2.2 ANTIMICROBIAL PEPTIDES ...............................................................................................................16 2.2.1 Derivations ............................................................................................................................16 2.2.2 Structure and Characteristics of AMPs .................................................................................19 2.2.3 Cecropin P1 ...........................................................................................................................22
2.3 AMP AND BACTERIAL INTERACTIONS .............................................................................................24 2.3.1 How and Why AMPs Attack Bacterial Membranes ...............................................................24 2.3.2 Models for Attack ...................................................................................................................26
2.4 QUARTZ CRYSTAL MICROBALANCE WITH DISSIPATION (QCM-D) ..................................................29 2.4.1 How the QCM-D Works.........................................................................................................29 2.4.2 Theory of the QCM-D ............................................................................................................30 2.4.3 Relevant Research Using the QCM and QCM-D ..................................................................32
3 METHODOLOGY ............................................................................................................................39
3.1 MAKING AGAR PLATES....................................................................................................................39 3.2 PLATING BACTERIA .........................................................................................................................39 3.3 PRE-CULTURING BACTERIA .............................................................................................................40 3.4 GROWTH CURVES ............................................................................................................................40 3.5 COUNTING BACTERIA ......................................................................................................................42 3.6 CONTACT ANGLES ...........................................................................................................................43 3.7 QCM-D ...........................................................................................................................................43
3.7.1 Cleaning procedure for QCM-D and crystals .......................................................................44 3.7.2 QCM-D Experimental Procedure ..........................................................................................44
3.8 LIVE/DEAD KIT ON GOLD CRYSTALS TO CHARACTERIZE CELL VIABILITY .....................................46
4 RESULTS ...........................................................................................................................................48
4.1 GROWTH CURVES ............................................................................................................................48 4.2 COUNTING CHAMBER ......................................................................................................................50 4.3 CONTACT ANGLE .............................................................................................................................52 4.4 QCM-D ...........................................................................................................................................52 4.5 LIVE/DEAD KIT ................................................................................................................................59
5 CONCLUSIONS AND RECOMMENDATIONS ...........................................................................67
5.1 NUMBER OF E. COLI CELLS PRESENT ON GOLD CRYSTALS ..............................................................67 5.2 PERCENTAGE OF E. COLI DEAD ........................................................................................................71
6 REFERENCES ...................................................................................................................................72
APPENDIX A: QCM-D FREQUENCY AND DISSIPATION PLOTS ..................................................75

iv
APPENDIX B: QCM-D FREQUENCY AND DISSIPATION SHIFTS .................................................86
APPENDIX C: LIVE/DEAD CELL COUNT RAW DATA ....................................................................88
APPENDIX D: LIVE/DEAD TABLES .....................................................................................................94
APPENDIX E: GROWTH CURVES ........................................................................................................95
APPENDIX F: FREQUENCY AND DISSIPATION RESULTS TABLE............................................101
v
List of Figures Figure 1: A simplified version of the difference between Gram-positive bacteria (left) and
Gram-negative bacteria (right)
(http://filebox.vt.edu/users/chagedor/biol_4684/Methods/bacterial.gif). ................. 13 Figure 2: Representation of the three different regions of the LPS structure. R, SR and S
refer to the LPS structure as being Rough-type, Semi-rough type and Smooth-type
(Epand et al., 1999). .................................................................................................. 14 Figure 3: Organizational chart explaining the classification of E. coli bacteria using the
O-antigen unit of the LPS. ........................................................................................ 15 Figure 4: Alpha helix structure as seen in the AMP cecropin P1
(http://www.csusm.edu/jayasinghe/MoviesAminations/files/page34-1000-
thumb.jpg). ................................................................................................................ 22 Figure 5: Carpet Model of AMP activity against bacteria (Reddy et al., 2004). .............. 27
Figure 6: "Barrel-Stave" Model for AMP activity against bacteria (Reddy et al., 2004). 28 Figure 7: Growth curve for E. coli O113:H21. ................................................................. 48
Figure 8: Semi-log plot of E. coli O113:H21. .................................................................. 49 Figure 9: Example of counting chamber image for E. coli O113:H21 at 0.495A. ........... 50
Figure 10: E. coli O113:H21 Bacteria Population Averages. ........................................... 51 Figure 11: QCM-D frequency and dissipation shifts for E. coli O157:H12 with cecropin
P1 cys on a gold crystal surface. ............................................................................... 53
Figure 12: QCM-D frequency and dissipation shifts for E. coli O55:H7 without cecropin
P1cys on a gold crystal surface. ................................................................................ 55
Figure 13: Bar graph of measured frequency shift measured in QCM-D plots when E.coli
was added, with and without cecropin P1 bound to the gold crystal surface. Note that
the error bars represent the standard deviation. ........................................................ 56
Figure 14: Bar graph of measured dissipation shift measured in QCM-D plots when
E.coli was added, with and without cecropin P1 bound to the gold crystal surface.
Note that the error bars represent the standard deviation. ........................................ 57 Figure 15: Live/Dead picture of E. coli O117:K98:H4 with (top) and without (bottom)
cecropin P1 cys on a gold QCM-D crystal. .............................................................. 61 Figure 16: Graph of the number of E. coli cells present per live/dead picture with
cecropin P1 and without cecropin P1........................................................................ 62
Figure 17: Graph of percentage of E. coli cells dead per live/dead picture with cecropin
P1 and without cecropin P1. ..................................................................................... 63 Figure 18: Amount of bacteria present per picture in live/dead kit versus frequency
change measured by QCM-D. ................................................................................... 68
vi
List of Tables Table 1: Antimicrobial peptides found in animals (Brogden et al., 2003). ...................... 18
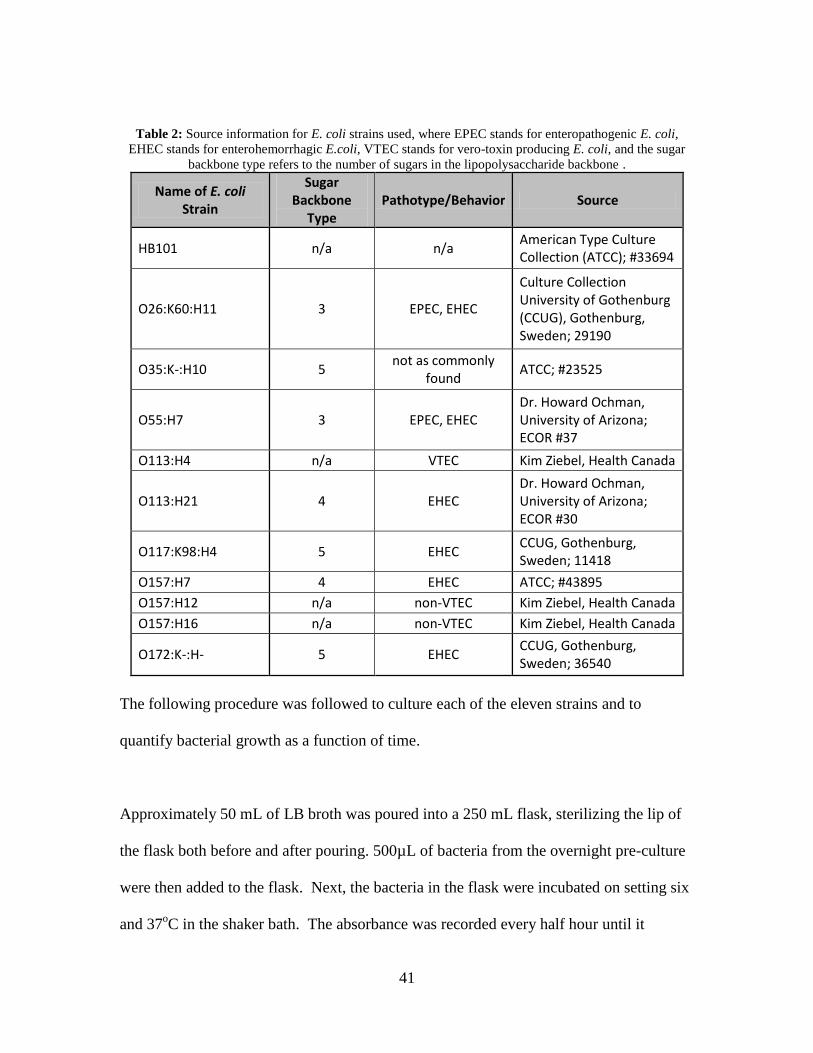
Table 2: Source information for E. coli strains used, where EPEC stands for
enteropathogenic E. coli, EHEC stands for enterohemorrhagic E.coli, VTEC stands
for vero-toxin producing E. coli, and the sugar backbone type refers to the number
of sugars in the lipopolysaccharide backbone . ........................................................ 41
Table 3: Water contact angle on gold crystals with varying concentrations of cecropin P1
cys. ............................................................................................................................ 52
Table 4: Statistical significance for results of average frequency shift in QCM-D plots
when E. coli was added, comparing crystals with and without bound cecropin P1. 58
Table 5: Statistical significance for results of average dissipation shift in QCM-D plots
when E. coli was added, comparing between crystals with and without bound
cecropin P1................................................................................................................ 59
Table 6: Statistic significance for results of average number of E. coli cells present per
live/dead picture. ....................................................................................................... 64
Table 7: Number of E. coli present on crystal per picture with cecropin P1 and without
cecropin P1................................................................................................................ 94
Table 8: Percentage of E. coli dead per picture with cecropin P1 and without cecropin P1.
................................................................................................................................... 94
1
1 Introduction Escherichia coli, commonly referred to as E. coli, is a pathogenic species of bacteria
known to many people worldwide. E. coli has been most widely recognized as a food
contaminant that can cause intestinal lesions, hemorrhaging in the digestive tract, kidney
failure, and in extreme cases death. One of the most dangerous strains identified as of yet
is E. coli O157:H7, which has caused three major outbreaks in the United States in the
past two years. In the first of these three outbreaks, nearly 200 people throughout the
United States were affected by consuming contaminated fresh spinach in September and
October of 2006 (CDC, Oct 6, 2006). Only a few months later in November and
December, over 70 Americans became ill because of shredded lettuce contaminated by E.
coli O157:H7 distributed by chains of Taco Bell (CDC, Dec 14, 2006). The most recent
outbreak was triggered by contaminated Topps Ground Beef Patties, which left 40 people
affected across eight states, 21 of whom were hospitalized, and two of whom developed
kidney failure (CDC, Oct 26, 2007).
Clearly, contamination by E. coli is a major issue that must be addressed by the American
agriculture, food, and health industries. However, despite technological advances in
agriculture, increased disease awareness in the food industry, and major medical
advancements, E. coli contamination is not easy to combat or prevent. In fact, there are
many problems in each of these sectors that may complicate or even worsen current
issues concerning E. coli outbreaks.
2
In recent years, agriculture, particularly the cattle and beef industries, has witnessed a
large increase in demand, and has expanded in order to meet this demand. However, this
expansion has caused larger, more crowded farms and slaughterhouses. These conditions
contribute a great deal of stress to the cattle, which may cause them to shed parasites and
bacteria such as E. coli in their feces (Miller et al., 1998). If E. coli are excreted during
transport or at the slaughterhouse facilities, the meat may become contaminated. This
meat is then shipped from the slaughterhouse to various locations throughout the United
States, and may possibly cause a widespread outbreak.
The food industry has also played a major role in the increasing occurrence of E. coli
outbreaks. According to recent studies, Americans are constantly consuming more of
their meals outside of their homes, most often in restaurants (Miller et al., 1998). In these
situations, consumers have even less control over how well their food is cooked, how
fresh their food is, or where the food is obtained. These factors also make outbreaks more
difficult to trace back to a single location, since consumers are not always certain of the
source of their food.
Finally, the medical industry may have also contributed to the increasing danger of E.
coli outbreaks through overuse of antibiotics. Because antibiotics are often prescribed
when it may not be a bacterial infection and many patients do not finish their antibiotics
after the full length of time, certain strains of bacteria have become resistant to these
particular treatments. Since bacteria can multiply in only 20 minutes, they undergo
mutations much more frequently and can quickly adapt to antibiotics used to kill them. In

3
fact, some strains are resistant to multiple forms of common drug treatment. Thus,
sometimes patients can become infected with a normally treatable disease, but if they
possess a resistant strain, antibiotics may be completely ineffective (Brogden et al.,
2003).
Antimicrobial peptides (AMPs) have been shown to be an effective new method to
combat certain strains of bacteria and other microbes. AMPs are naturally produced by
certain insects, amphibians, and mammals to act as a defensive agent against pathogens
(Brogden et al., 2003). An AMP that has been found to be particularly effective against
E. coli is cecropin P1, which was first derived from porcine small intestine, and therefore
this was the AMP chosen for experiments in this project (Bomen et al., 1993). It is
believed that the generally positively-charged AMPs interact with the negatively charged
bacterial membranes. Specifically, AMPs have been shown to penetrate bacterial
membranes and disrupt the ion and molecular balances of the cell, which causes the cell
to lyse and immediately die (Shai, 1999). Since AMPs fully lyse the cells, there is no way
for the bacteria to survive their attack. Furthermore, because it is the inherent structure of
the membrane which the AMPs attack, the bacteria cannot become resistant to AMP
therapy. Therefore, AMPs show much promise in the medical field to combat bacteria
that may be resistant to any antibiotics used as previous treatment.
However, not much is known about the mechanism of AMP attack, the conditions
necessary for effectiveness, and where exactly the AMPs adhere to the bacterial
membrane. Although research has been conducted concerning the effectiveness of AMPs
4
in solution against certain strains of bacteria, this may not be a feasible for applications to
the food industry. Instead, AMPs could be bound to the certain surfaces, such as stainless
steel cutting boards, and used as a preventative method against outbreaks of bacteria such
as E. coli.
This project has employed a novel technique using a quartz crystal microbalance with
dissipation (QCM-D) to study the interactions between bound AMPs and bacteria. The
QCM-D works by oscillating a quartz crystal with a gold electrode and measuring the
frequency and dissipation changes as a solution is run over the surface. Decreases in
frequency indicate an increase in mass deposited on the crystal surface, while an increase
in dissipation indicates more energy lost by the film deposited on the crystal (Q-Sense,
2007). These measurements can be used to characterize the layer adsorbed to the surface
of the crystal. Prior studies have used the QCM-D to characterize the adsorption of cells
(Fredriksson et al., 1998; Otto et al., 1999; Schofield et al., 2007), proteins (Höök et al.,
1998), and other biomolecules (Jenkins et al., 2004; Kwon et al., 2006; Carter et al.,
1995), but no previously published research has utilized the QCM-D to study AMP-
bacterial interactions.
The aim of this project was to better understand the interactions between the AMP
cecropin P1 and ten different pathogenic strains of E. coli along with one non-pathogenic
laboratory strain. This was done by binding cecropin P1 with an added cysteine group to
the surface of the gold electrode of a QCM-D crystal and then passing an E. coli culture
through the flow chamber. Change in contact angle was used to confirm that cecropin P1
5
was deposited on the crystal. For the duration of the experiment, the frequency and
dissipation changes were monitored and used to better understand the adsorption and
binding processes. Additionally, E. coli adherence to crystals with cecropin P1 was
compared to crystals without the AMP. Finally, a protocol involving a live/dead kit was
used to determine the effectiveness of bound AMPs in killing E. coli and compare its
effectiveness between all eleven strains.
This is the first study to apply the QCM-D to directly measure binding between E. coli
and AMPs, which will lead to better methods for applying AMP technology to bacterial
detection. Finally, this project may open doors for new food industry applications of
AMPs to help combat E. coli outbreaks.
6
2 Literature Review
2.1 E. coli Overview
2.1.1 Recent E. coli Outbreaks in the United States
E. coli outbreaks have become a hot topic in the media in the past few years. This has
affected many parts of the United States and several industries, including fast food and
agriculture. In October of 2007, 21.7 million pounds of frozen Topp’s ground beef
patties contaminated with E. coli O157:H7 were recalled (CDC, Oct 26, 2007). E. coli
outbreaks have the potential to affect a large area since products are routinely shipped
from state to state. This Topp’s outbreak infected 40 people in eight states (Connecticut,
Florida, Indiana, Maine, New Jersey, New York, Ohio and Pennsylvania), hospitalized 21
people, and resulted in the kidney failure of two patients (CDC, Oct 26, 2007).
Another E. coli O157:H7 outbreak occurred almost a year earlier from November-
December of 2006 at Taco Bell Restaurants and affected the East coast of the United
States. In this case, it was not tainted beef that was the problem, but contaminated lettuce
that the restaurant chain used. This outbreak affected 71 people in five states (New
Jersey, New York, Pennsylvania, Delaware and South Carolina) leaving fifty-three
people hospitalized and eight people who developed kidney failure (CDC, Dec 14, 2006).
The contamination of raw, packaged spinach, which was perhaps one of the most severe
cases of E. coli contamination, occurred only months before the Taco Bell incident
during the months of September and October of 2006. This outbreak of E. coli O157:H7
left 199 people ill throughout 26 states, hospitalized 102 of those affected, resulted in
7
kidney failure for 31 of those ill, and caused the death of three people (CDC, Oct 6,
2006). These are just a few of the many examples that show how E. coli contamination
poses a serious health risk to consumers.
2.1.2 Causes of E. coli Outbreaks
Large-scale E. coli outbreaks that infect people throughout the United States have
become more common in the past 20 years, and because of this, the CDC has declared E.
coli O157:H7 and other enterohemorrhagic E. coli (EHEC) strains to be “emerging
pathogens” (CDC, 1994). However, evidence has shown that this emergence is not
merely caused by natural evolution of the species, but may have been triggered by human
behaviors. Miller et al. (1998) attribute the increasing prevalence of E. coli outbreaks to
changes in the cattle industry and consumer eating habits in recent decades.
With growing demand for beef products in the United States, the cattle industry has
expanded significantly in recent years, and because of this, many practices have changed
to account for the increased supply of cattle. Bacterial infection problems might begin
with the location and climate of the farm itself. Miller et al. (1998) state that many dairy
and other cattle farms are moving from the upper Midwestern states to lower Midwestern
or Southwestern states that have a warmer climate which might better support the growth
of E. coli bacteria. Additionally, on the farms it is theorized that wild birds that come in
contact with infected manure and then cattle could cause disease in the live animals
(Miller et al., 1998). These issues are often compounded by ill-treatment of the cattle on
the farms, where feedlots are considerably more crowded on modern cattle farms than

8
previously. This crowding on the farms and subsequent crowding in trucks while the
cattle are being transported to slaughterhouses can cause a significant amount of stress
for the animals, which could in turn “allow cattle to shed E. coli in feces” (Miller et al.,
1998).
Modern practices in cattle slaughtering, meat processing, and meat distribution may also
be contributing to E. coli outbreaks occurring in the United States. The actual number of
slaughterhouses in the United States has decreased in recent years, and therefore the size
of remaining slaughterhouses has increased considerably in order to keep up with the
supply of cattle and demand for meat (Miller et al., 1998). Because of this enlargement of
sites, slaughterhouses encounter problems similar to cattle farms concerning the stress of
animals. Additionally, because there are fewer slaughterhouses, each site receives
animals from a larger area (Miller et al., 1998). Thus, the animals often have a much
longer trip on over-crowded trucks during which they are deprived of food. This stressful
environment could cause the cattle to excrete E. coli in their manure, which could
contaminate the carcasses before they even reach the facility. Once the cattle reach the
slaughterhouse, there are even more vectors of disease transport. For instance, beef
grinding facilities often receive beef from multiple suppliers, and often grind unused
meat from the previous day with fresh meat, which could mix contaminated meat with
uncontaminated meat and make the origin of contamination more difficult to trace (Miller
et al., 1998). Finally, once again because there are fewer slaughterhouses in the country, a
single site may transport meat to many regions of the country, and thus contamination
could affect a larger amount of people than it would have in the past.
9
Finally, consumer habits have evolved considerably in modern society, which could
make many people more vulnerable to infection by E. coli. According to Jensen and
Unnevehr (1995), half of all meals eaten by Americans are consumed away from home,
most of which are eaten at a restaurant. When eating at a restaurant, consumers are not
actively involved in the preparation of the food, and don’t have as much control over how
well their food is cooked. In addition, approximately 25% of American survey
participants responded that they prefer hamburgers rare or medium rare (Miller et al.,
1998). Although rare or medium rare steaks are safe to eat because cooking the surface
kills the microorganisms, eating rare or medium rare hamburgers is dangerous because
microorganisms can penetrate the surface of ground beef hamburgers. Since such a small
amount of E. coli O157:H7 is required to cause an infection, it is even easier for
consumers to become ill if they are not diligent about their eating habits.
2.1.3 Disease-causing E. coli Strains
While some strains of Echerichia coli aid digestion and naturally reside in the intestinal
tracts of animals, certain strains are highly pathogenic to humans and have caused several
outbreaks in the United States, such as the Topps Ground Beef, Taco Bell and Spinach
outbreaks discussed earlier. Strains of E. coli that have been found to be particularly
harmful to the human digestive system are those categorized as enteropathogenic E. coli
or EPEC. EPEC strains can cause intestinal lesions in humans and perpetuate infection in
the intestinal system by adhering to the membranes of microvilli (Mouenuddin et al.,
1989). Several strains or serotypes of E. coli used in the experiments detailed in this
10
paper, specifically E. coli O55:H7 and O26:K60:H11, have been characterized as EPEC.
According the Mouenuddin et al. (1989), who studied data and analyzed samples
submitted to the United States Center for Disease Control (CDC) for 50 outbreaks of
diarrheal disease in American infants between the years of 1934 and 1987, EPEC strains
accounted for 56% of these disease outbreaks. Additionally, they found that 64% of these
EPEC strains were resistant to multiple antibiotics (Mouenuddin et al., 1989). Thus, it is
quite clear that EPEC strains of E. coli are prevalent amongst cases of outbreak and may
be difficult to treat due to resistance to typical drug therapy that might be used on
affected patients. Because of this, these strains of E. coli are good candidates for our
study concerning antimicrobial peptide (AMP) treatment, since AMPs such as cecropin
P1 used in our research completely lyse the cells and bacteria can develop no resistance
to them.
In addition to EPEC strains, enterohemorrhagic E. coli (EHEC) strains can commonly
cause disease outbreaks. EHEC strains are often even more dangerous than EPEC
because they can cause internal hemorrhaging of the intestinal lining (Miller et al., 1998).
Six out of the eleven strains used in our experiments with cecropin P1 are categorized as
EHEC, specifically O26:K60:H11, O55:H7, O113:H21, O117:K98:H4, O157:H7, and
O172:K-. Since E. coli O157:H7 is so widely found in outbreak samples, it is defined by
the CDC as an emerging pathogen, or “an infectious agent whose incidence in humans
has increased dramatically within the past 20 years or one that has the probability of
increasing in the future” (CDC, 1994). E. coli O157:H7 is so dangerous because it
possesses “hypermutable genetic sequences,” so the bacteria can vary and diversify
11
greatly even within a single population, and possibly become resistant to antibiotics used
to treat it (Miller et al., 1998). Furthermore, since O157:H7 is naturally found in the
acidic fore-stomachs of cattle where fermentation occurs, it can withstand acidic
environments, thrive on acidic foods, and can produce Shiga-like toxin which is
extremely dangerous to those infected (Miller et al., 1998). As is quite evident, EHEC
strains such as O157:H7 are often the culprits of widespread E. coli outbreaks and are
capable of antibiotic resistance, and therefore valid candidates for AMP and cecropin P1
treatment.
Strains of E. coli can also be classified as verotoxin producing Escherichia coli (VTEC).
VTEC strains are considered to be major causes of disease, especially in developing
countries, as they result in contamination of food and are a food-borne illness (Stephan et
al., 2000). Three of the strains used in this project can be classified as VTEC: O113:H4,
O113:H21 and O157:H7 (the latter two are also EHEC strains). VTEC strains are very
harmful to people and can lead to watery or bloody diarrhea, hemorrhagic colitis,
thrombotic-thrombocytopenic purpura (a rare blood clotting disorder) and haemolytic-
uraemic syndrome (HUS) (Stephan et al., 2000). In research done on VTEC strains by
Stephen et al., the researches found that those exposed to an environment more prone to
VTEC strains were more likely to be carriers of the bacteria. The research showed that
6% of a Canadian farming family were VTEC carriers where as 9% of slaughter house
workers were carriers of the a VTEC strain (Stephan et al., 2000).
12
2.1.4 Cellular Structure
In order to better understand the reasons why certain strains of E. coli are pathogenic and
can cause illness in humans, it is important to understand the cellular structure of E. coli.
Several molecules of the E. coli cell wall are believed to play a role in pathogenic activity
of certain strains and also the interactions between these strains and AMPs, specifically
the cell wall or membrane, lipopolysaccharide, fimbriae, and pili.
2.1.4.1 Cell Wall and Cell Membrane
Due to their size, E. coli, like many prokaryotes, do not have the ability to engulf
particulate matter for nourishment. Instead, the bacteria are dependent on the diffusion of
solutes across their boundary layer. This is accomplished by ensuring that there is
efficient diffusion of nutrients and waste by having a high surface area to volume ratio
(Beveridge and Graham, 1991). The boundary layer of the bacterial cell is an important
component in the survival of the bacteria and makes up a large portion of the cell’s mass.
The cell wall is the prime stress bearing structure that resides above the plasma
membrane (Beveridge and Graham, 1991). Gram-positive and Gram-negative are the two
different classifications of bacterial cell wall formations. The outer layer of the Gram-
negative bacteria cell, known as the outer membrane, surrounds the peptidoglycan layer,
which surrounds the periplasm layer. These three layers are called the cell wall. The
plasma membrane and the cell wall are what constitute the makeup of Gram-negative
bacteria (Beveridge, 1999). In contrast, Gram-positive bacteria contain only one lipid
bilayer, the plasma membrane (Beveridge and Graham, 1991). Figure 1 is a simplified
13
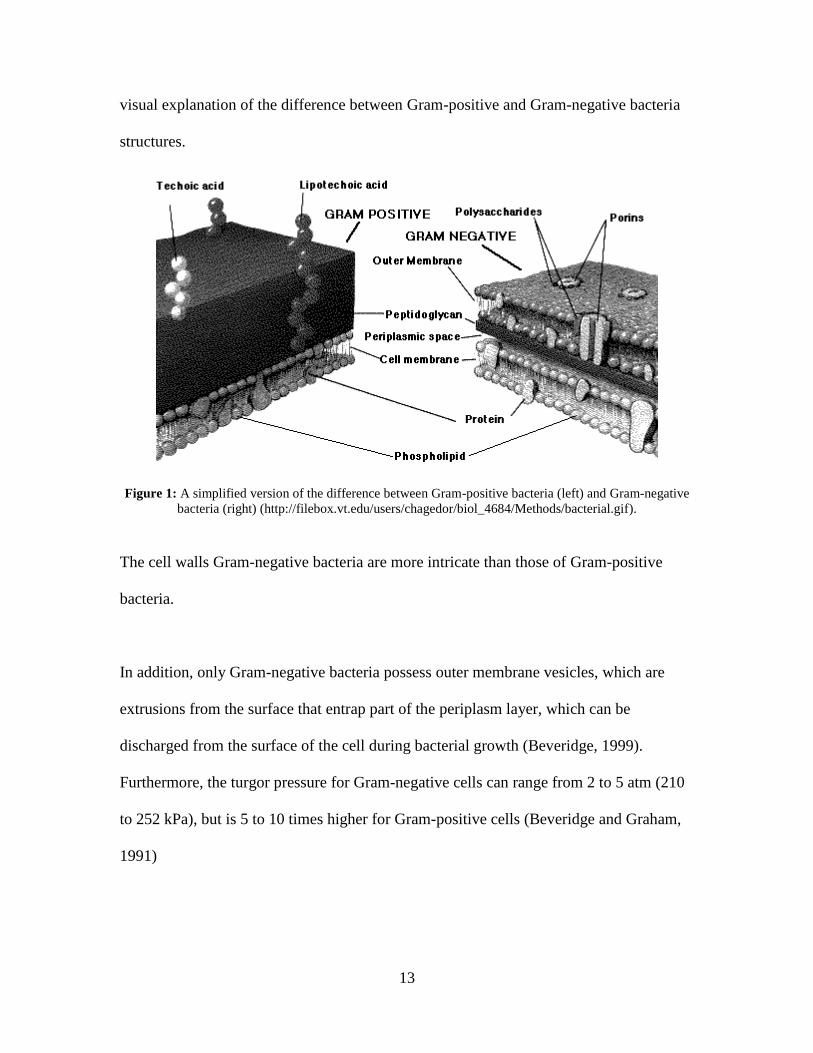
visual explanation of the difference between Gram-positive and Gram-negative bacteria
structures.
Figure 1: A simplified version of the difference between Gram-positive bacteria (left) and Gram-negative
bacteria (right) (http://filebox.vt.edu/users/chagedor/biol_4684/Methods/bacterial.gif).
The cell walls Gram-negative bacteria are more intricate than those of Gram-positive
bacteria.
In addition, only Gram-negative bacteria possess outer membrane vesicles, which are
extrusions from the surface that entrap part of the periplasm layer, which can be
discharged from the surface of the cell during bacterial growth (Beveridge, 1999).
Furthermore, the turgor pressure for Gram-negative cells can range from 2 to 5 atm (210
to 252 kPa), but is 5 to 10 times higher for Gram-positive cells (Beveridge and Graham,
1991)
14
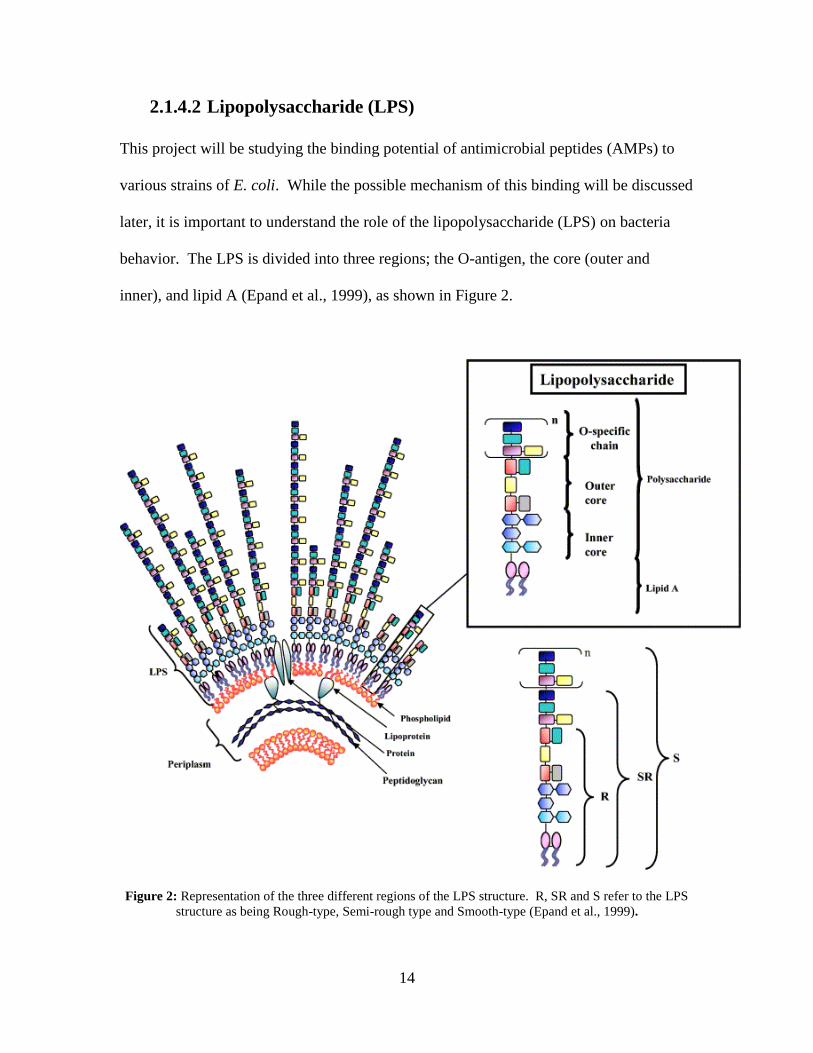
2.1.4.2 Lipopolysaccharide (LPS)
This project will be studying the binding potential of antimicrobial peptides (AMPs) to
various strains of E. coli. While the possible mechanism of this binding will be discussed
later, it is important to understand the role of the lipopolysaccharide (LPS) on bacteria
behavior. The LPS is divided into three regions; the O-antigen, the core (outer and
inner), and lipid A (Epand et al., 1999), as shown in Figure 2.
Figure 2: Representation of the three different regions of the LPS structure. R, SR and S refer to the LPS
structure as being Rough-type, Semi-rough type and Smooth-type (Epand et al., 1999).
15
Both the O-antigen and the core regions are made up of polysaccharide chains, whereas
lipid A is primarily made up of fatty acids and phosphate groups that are bonded to a
carbohydrate backbone. The charge on the lipid A molecules is negative which makes
the Gram-negative bacteria likely to bind to cationic peptides (Epand et al., 1999). It
would then make sense to hypothesize that the charged interaction at this outer membrane
of the bacteria plays a role in the binding and potentially deactivation of the bacteria.
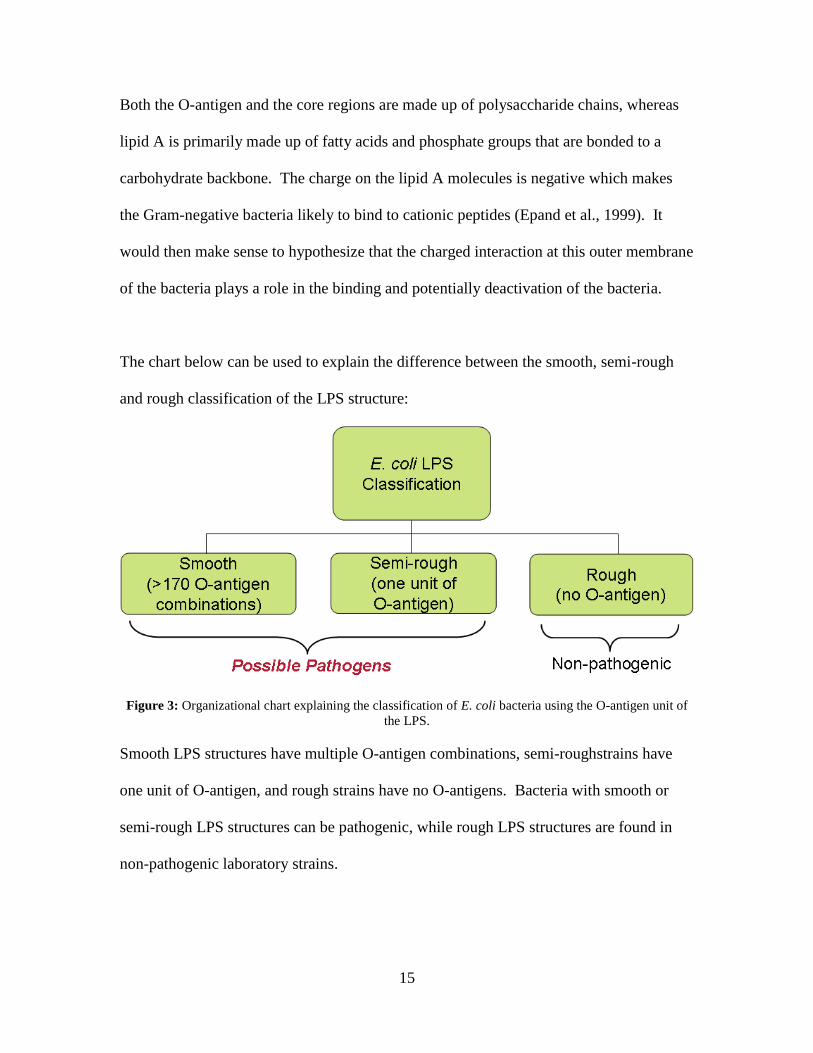
The chart below can be used to explain the difference between the smooth, semi-rough
and rough classification of the LPS structure:
Figure 3: Organizational chart explaining the classification of E. coli bacteria using the O-antigen unit of
the LPS.
Smooth LPS structures have multiple O-antigen combinations, semi-roughstrains have
one unit of O-antigen, and rough strains have no O-antigens. Bacteria with smooth or
semi-rough LPS structures can be pathogenic, while rough LPS structures are found in
non-pathogenic laboratory strains.
16
2.1.4.3 Fimbriae and Pili
Since this project is studying the binding potential of various strains of E. coli with
cecropin P1, it is worth noting the pili (fimbriae) are believed to be the major structure
that causes bacterial adhesion. Fimbriae, which are also referred to as pili, are rigid,
straight, filamentous motility appendages found on the surface of certain bacteria and are
generally between 4 and 7 nm in diameter and between 0.2 and 20 mm in length (An and
Friedman, 1998). Therefore, these appendages are much longer than they are wide. It is
believed that the fimbriae will be responsible for binding to the cecropin coated gold
surface of the crystals.
2.2 Antimicrobial Peptides
Antimicrobial peptides (AMPs) are one method of defense against pathogens (such as E.
coli) that are found in organisms including humans, other mammals, amphibians, insects,
and plants. As Reddy et al. (2004) explain, most AMPs share several common properties
such as a net positive charge or net negative charge, hydrophobicity, an active membrane,
and are less than 10kDa in size. However, there are also many differences between
AMPs that can be used to classify these peptides.
2.2.1 Derivations
Since they were first discovered, AMPs have been isolated from many species of plants
and animals, serving as natural defense agents against microorganisms. In 1981, Bozman
and his colleagues isolated and characterized the first AMP, known as cecropin, from the
pupae of the moth Hyalophora cecropia (Bulet et al., 1999). Following this discovery,
researchers isolated many of the first AMPs from other insect samples. AMPs from
17
insects are typically grouped into three categories; peptides with intramolecular disulfide
bonds forming hairpin-like β-sheets or α-helical-β-sheet mixed structures, peptides
forming amphipathic α-helices and peptides with an overrepresentation in proline and/or
glycine residues. Thanatin, which is an antimicrobial peptide derived from the bug
Podisus maculiventris, is an example of this first category and it contains cysteine
residues that a part of the disulfide bridge. The second set of insect AMPS are usually
proline rich, like abaecin, which is found in the honeybee Apis mellifera. An example of
the last category for insect AMPs is diptericin from the black blowfly P. terranovae,
which is gyceine-rich (Bulet et al., 1999).
Currently, the most promise for AMP use in replacement of traditional drug therapy
exists with AMPs derived from domesticated animals. Domesticated animals such as
cattle, sheep, goats, pigs, horses, and poultry are the source of nearly 50 AMPs that have
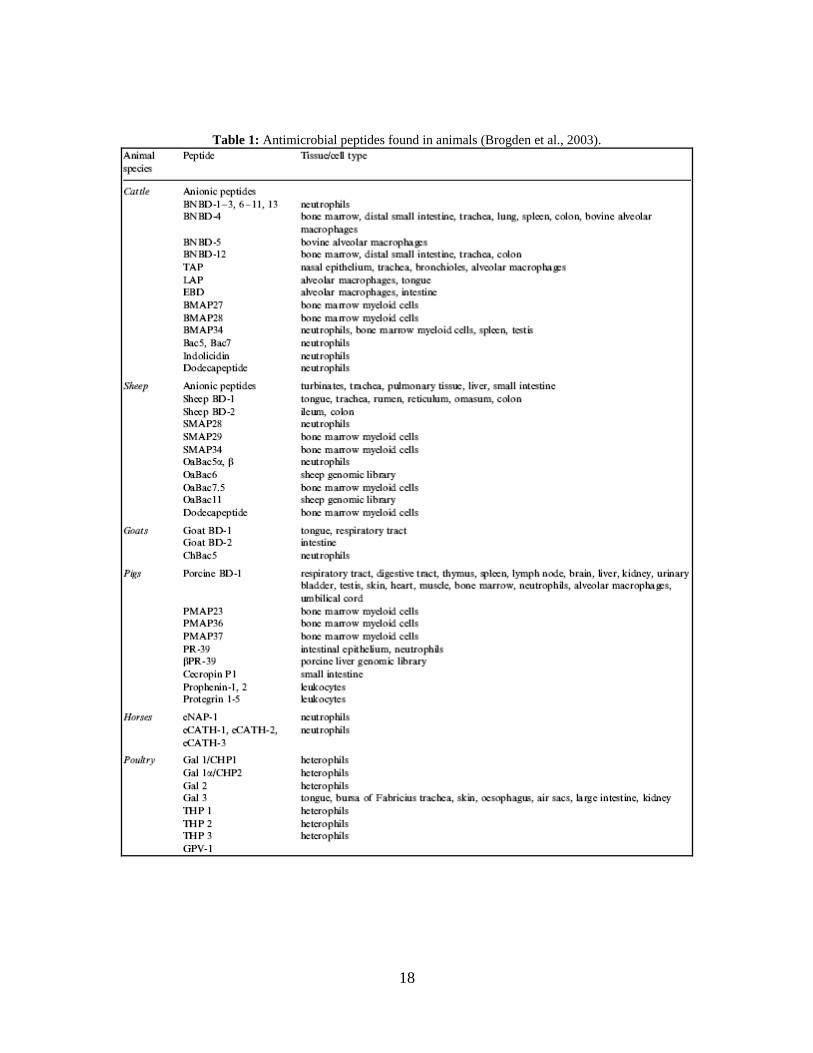
been recently isolated, which can be viewed in Table 1 (Brogden et al., 2003). These
AMPs serve as a natural defense against microorganisms occurring in the wild, and are
often found in bone marrow cells, such as polymorhponuclear leukocytes; white blood
cells, specifically macrophages; and in the mucosal epithelial cells of the intestinal tract
and respiratory system (Brogden et al., 2003). In bone marrow and white blood cells,
AMPs may act in conjunction with antibodies to counteract microorganisms that could
infect the animal. In the respiratory system and digestive tract, the AMPs provide a
barrier against any microorganisms that might be breathed in or consumed. Cecropin P1
is found naturally in the mucosal epithelial cells of the small intestine of pigs (Brogden et
al., 2003).
18
Table 1: Antimicrobial peptides found in animals (Brogden et al., 2003).
19
Many AMPs derived from domestic animal are the basis upon which synthetic AMPs are
being manufactured (Brogden et al., 2003). Additionally, research is being conducted
concerning methods to trigger production of AMPs within animal subjects, either for
humans to consume directly as food products, such as milk or meat, or so the AMPs can
be isolated and administered as treatment separately (Brogden et al., 2003). Finally, not
only do these domestic animals serve as a source of AMPs, but also act as models
concerning how mammalian systems may react to AMP therapy. One study infected
lambs with acute pneumonia and treated the lambs in vivo with the AMP SMAP29
derived from sheep bone marrow, which is cationic and has an α-helical shape similar to
cecropin-P1. Researchers found that lung tissue of the lambs treated with SMAP29
contained a much lower concentration of bacteria than untreated lambs (Brogden et al.,
2003). Thus, AMPs derived from domestic animals are a very practical source of the
peptides and also show considerable promise for applications to medical treatment for
humans.
2.2.2 Structure and Characteristics of AMPs
Although all AMPs have essentially the same purpose of acting as a defensive agent
against micriobial infection, each AMP is unique in its structure and effectiveness.
Because of this, and since so many AMPs have been already been isolated while more are
constantly discovered, researchers have developed several categories for these specialized
peptides.
2.2.2.1 Cationic AMPs
Cationic AMPs, or AMPs with a net positive charge, are much more commonly found
than anionic AMPs, particularly in domestic animals. Since so many cationic AMPs have
20
been isolated, a number of classification systems have been proposed by researchers
studying the nuclear magnetic resonance (NMR) structures of the peptides, but most of
the systems have similar main groups. For example, Reddy et al. (2004) classify the
AMPs into five groups: (1) α-Helical AMPs, (2) cysteine rich AMPs, (3) β-Sheet AMPs,
(4) AMPs rich in regular amino acids, and (5) AMPs with rare modified amino acids.
Brogden et al. (2003) similarly list linear, amphipathic α-helical peptides as a main
group, but group cysteine-rich and β-sheet AMPs together and have a separate group for
praline-rich linear peptides. In either case, AMPs are generally categorized by their
secondary structure, particularly α-helices or β-sheets, and amino acids common in the
AMP’s sequence.
An example of an α-helical AMP is cecropin P1, which is the AMP used in the
experiments disucssed in this report. The structure and effectiveness of cecropin P1 will
be discussed in the following section. Cysteine rich AMPs contain many cysteine
residues and can be found in many organisms, including humans. Similarly, praline rich
AMPs contain multiple praline residues in the peptide sequence. β-Sheet AMPs form a
single β-hairpin structure and usually contain disulfide bonds. Horseshoe crab peptides,
tachyplesins and polyphemusin II are examples of β-Sheet AMPs. AMPs that are rich in
regular amino acids contain a large number of regular amino acids. Histatin (which is a
peptide found in human saliva) is an example of an AMP that is rich in regular amino
acids. The last classification of AMPs is those with rare modified amino acids. An
example of this would be Nisin, which is a protein produced by the bacteria Lactococcus
lactis as a defensive agent against other types of bacteria (Reddy et al., 2003).
21
Additionally, Epand et al. (1999) defined categories for AMPs with thio-ether rings and
peptaibols. Peptides with thio-ether rings contain a small ring-like structure that is
enclosed by a thio-ether bond, while peptaibols have a high amount of α-amino-
isobutyric acid (Aib) residues.
2.2.2.2 Anionic AMPs
Anionic AMPs are defined as AMPs with a net negative charge. Although less common
than cationic AMPs, which have a net positive charge, anionic AMPs have also been
shown to be effective against various microbes. Specifically, in 1992 researchers found
an anionic AMP, ovine pulmonary surfactant, to be effective against the bacteria
Mennheimia haemolytica, Escherichia coli, and Klebsiella pneumonaie (Brogden et al.,
2003). Anionic AMPs have also been found in samples of cattle bronchoalveolar lavage
fluid in neonatal calves (Brogden et al., 2003). In these animals, it is believed that a
number of anionic AMPs have a “regulatory role in pulmonary metabolism… via
negative feedback inhibition” (Brogden et al., 2003).
Although the mechanism for anionic AMP activity is not as clear as that for cationic
AMPs, it is theorized that the zinc which activates the anionic AMPs forms a cationic salt
bridge across the cell membrane (Brogden et al., 2003). This salt bridge allows the AMPs
to pass through the membranes of the bacteria and into the cytoplasm, where they
interrupt protein formation by possibly attaching to the ribosomes (Brogden et al., 2003).
22
2.2.2.3 Insect-derived AMPs
There are also many peptides derived from insects. Therfore, AMPs derived from insects
are often classified separately. Bulet et al. (1999) divided the peptides from insects into
three categories: cysteine-containing peptides (such as insect defensins, drosomycin and
thanatin), proline-rich peptides with emphasis on the O-glycosylated antimicrobial
peptides (like drosocin, lebocins and formaecins), and glycine-rich molecules (gloverins)
(Bulet et al., 1999).
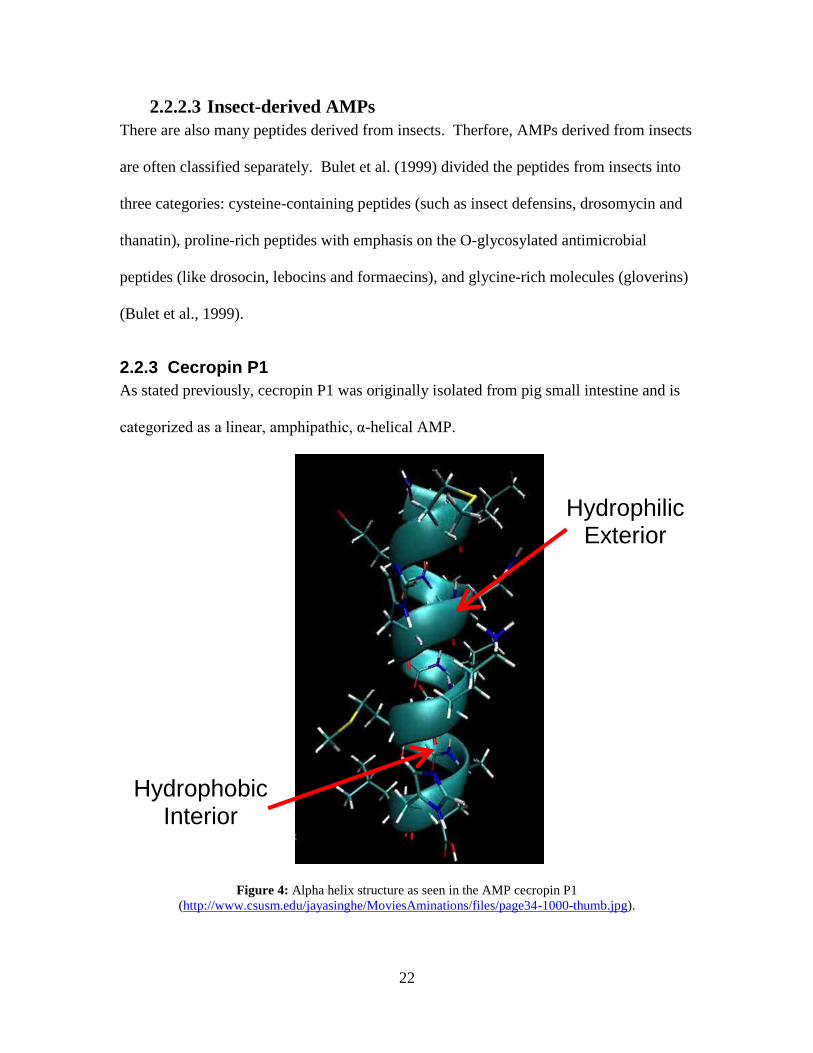
2.2.3 Cecropin P1
As stated previously, cecropin P1 was originally isolated from pig small intestine and is
categorized as a linear, amphipathic, α-helical AMP.
Figure 4: Alpha helix structure as seen in the AMP cecropin P1
(http://www.csusm.edu/jayasinghe/MoviesAminations/files/page34-1000-thumb.jpg).
Hydrophilic Exterior
Hydrophobic Interior
23
The α-helix is arranged with hydrophobic amino acids on the inside and hydrophilic
amino acids on the outside of the structure, and it is believed that this amphipathic helix
is what allows the AMP to pass through the bacterial membranes (Brogden et al., 2003).
Cecropin P1 also possesses a Ser-Glu-Gly sequence which is believed to act as a hinge-
like mechanism to help the AMP come in contact with microorganisms (Brogden et al.,
2003). Furthermore, cecropin P1 has a basic N-terminus and a hydrophobic C-terminus,
the carboxyl group of which is believed to be the main cause of its high effectiveness
against Gram negative bacteria such as E. coli (Brogden et al., 2003). According to
Reddy et al. (2004), cecropin P1 is active against many parasites in addition to bacteria.
Additionally,cecropin P1 has potent and rapid antibacterial activity (Brogden et al.,
2003). Cecropin P1’s swift action against bacteria was shown by Bomen et al. (1993),
who compared the activity of cecropin P1 and PR-39 on three different strains of E. coli.
Both cecropin P1 and PR-39 are AMPs found in the upper small intestine of pigs and
both are most effective against Gram negative bacteria, such as E. coli, and also effective
against some Gram positive bacteria. Bomen et al. (1993) found that cecropin P1
completely lysed the bacteria instantaneously, while PR-39 experienced an eight minute
lag time before it affected the bacteria and only caused the cells to swell, not completely
lyse. It has been shown that cecropins, including cecropin P1, form channels with their
amphipathic α-helices as stated previously, which are believed to be the reason cecropin
P1 was found to penetrate both the inner and the outer membranes of the E. coli (Bomen
et al., 1993). Furthermore, this study found that cecropin P1 was not only more effective
than the other AMP tested, PR-39, but was also more effective than treatment using a
24
traditional antibiotic, tetracycline (Bomen et al., 1993). This study showed that cecropin
P1 is a fast-acting AMP and was highly effective against E. coli, a major cause of food-
related illness in the United States.
Although the preliminary studies on AMP inactivation of E. coli were useful, no one has
directly proven the binding between E. coli and AMPs directly. Bomen et al. (1993)
applied the AMP solution to a well in a media plate seeded with E. coli so the AMPs
could dissolve through the agar. However, in our study we are employing a novel
technique of binding cecropin P1 with an added cysteine group to a gold crystal using a
quartz crystal microbalance with dissipation (QCM-D). This technique allows us to study
how site-bound AMPs interact with bacteria, specifically several strains of E. coli, not
just how AMPs behave in solution.
2.3 AMP and Bacterial Interactions
Not all strains of bacteria will readily bind to AMPs. One study found that some AMPs
are active against one bacterial strain, but not against others (Hancock et al., 2000). As
discussed earlier in the E. coli overview section, the major component of the outer
membrane of Gram-negative bacteria is the LPS. Studies by Rosenfeld et al. (2006)
showed that in order to promote bacteria binding and death, the AMPs have to pass
through the outer membrane and reach the inner phospholipid layer where the binding
and deactivation can occur.
2.3.1 How and Why AMPs Attack Bacterial Membranes
25
While a substantial amount is known about bacteria and AMPs, there has not been much
research into the interactions between the two and therefore the mechanisms of their
interaction are not well understood.
Rosenfeld et al. (2006) found no correlation between the AMP’s antimicrobial activity
and its ability to specifically bind to the LPS of the bacterial membrane. However, a
correlation can be made between AMP activity and other bacteria characteristics. For
example, research by Epand et al. (1999) concluded that peptides have an affinity for
binding to membrane lipids and that, in many cases, the magnitude of this binding is
believed to be affected by the positive charge on the peptide interacting with the anionic
lipid of the bacteria. In the case of cecropin P1, the net positive charge is caused by basic
amino acids along the outer, hydrophilic face of the α-helix (Shai, 1999). Furthermore,
Shai (1999) explains that this net positive charge of cationic AMPs not only causes its
affinity for binding to negatively-charged bacterial membranes, but also prevents them
from attacking normal, zwitterionic mammalian cells, making them ideal for human
medical applications.
Since bacteria cannot change the charge on their outer membrane in the same way that
they can mutate their DNA, bacteria and other microbes cannot become resistant to the
defense provided by AMPs. This is very important when considering medical
applications, since many strains of bacteria have become resistant to commonly used
drug treatments because of overuse of antibiotic medications. However, since bacteria are
completely lysed by AMPs effective against the given strain and even mutations cannot
26
change their fundamental membrane structure, there is no chance for resistance against
AMPs to occur. These characteristics indicate that AMPs could possibly be used as a
weapon against dangerous drug-resistant bacteria.
2.3.2 Models for Attack
No single mechanism can explain all AMP and bacterial interactions, and it is possible
that there are numerous modes of action for different peptides and bacteria strains. One
theory propsed is that the peptide attacks the lipid bilayer of the bacterial membrane.
Also, charge may be a contributing factor. For example, most peptides are cationic and
in Gram-negative bacteria, such as E. coli, the outer membrane contains anionic
molecules (Epand et al., 1999). This is one possible explanation as to why some AMPs
seem to have an affinity for binding to bacteria. However, a conclusion has been reached
regarding how the peptides penetrate the membrane.
In a study by Rosenfeld et al. (2006), the authors refer to two previously suggested
mechanisms for the AMP-LPS interaction. The first possible mechanism to explain the
AMP attack on bacterial membranes is that the peptides directly bind to the LPS, making
the LPS unavailable to the LPS binding protein and therefore the LPS is unable to the
transfer to its primary receptor (Scott et al., 2000). The second possible mechanism is
that the peptide binds directly to the primary receptor which prevents the LPS from
binding to the receptor (Scott et al., 2000).

27
Research by Vunnam et al. (1997) was conducted on the effect that chirality of the
peptide has on its binding activity. However, this research showed no chiral selectivity
with E. coli.
2.3.2.1 Carpet Model
There are two models used to explain the binding of AMPs: the Carpet Model and the
Barrel Stave Model. Below is Figure 4 from Reddy et al. (2004) which illustrates the
Carpet Model as a possible mechanism for AMP and bacteria interaction:
Figure 5: Carpet Model of AMP activity against bacteria (Reddy et al., 2004).
As Reddy et al. (2004) explain, first the peptide monomers bind to the phospholipid head
groups (a). Next, the peptide monomers align on the membrane surface so that the
hydrophilic residues face the phospholipid head group (b). Then the peptides face the
hydrophobic core of the membrane (c) before disintegration of the membrane occurs (d).
However, in order for the disruption of the membrane to occur, the peptide must reach
relatively high concentrations at certain areas of the membrane to form the micelles
(Shai, 1999). If the peptide does not reach the minimum inhibitory concentration (MIC),
28
then the AMP will only disrupt ion concentrations within the cell, but not directly cause
the cell to lyse (Shai, 1999).
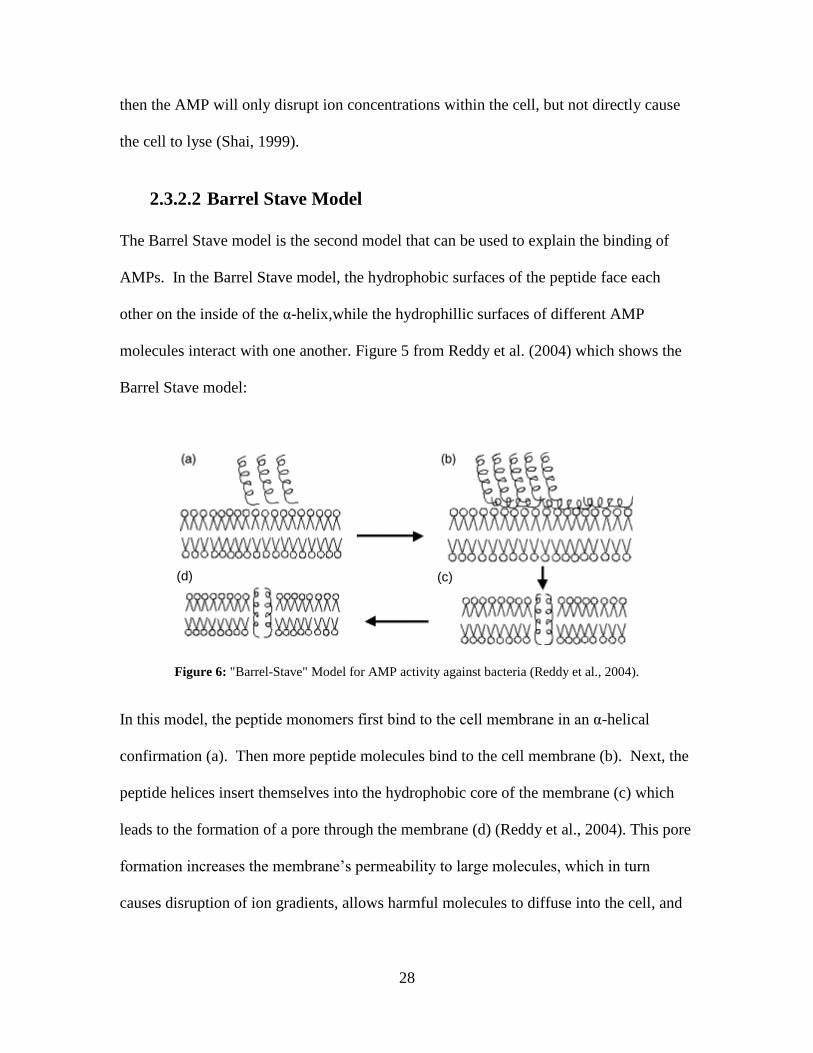
2.3.2.2 Barrel Stave Model
The Barrel Stave model is the second model that can be used to explain the binding of
AMPs. In the Barrel Stave model, the hydrophobic surfaces of the peptide face each
other on the inside of the α-helix,while the hydrophillic surfaces of different AMP
molecules interact with one another. Figure 5 from Reddy et al. (2004) which shows the
Barrel Stave model:
Figure 6: "Barrel-Stave" Model for AMP activity against bacteria (Reddy et al., 2004).
In this model, the peptide monomers first bind to the cell membrane in an α-helical
confirmation (a). Then more peptide molecules bind to the cell membrane (b). Next, the
peptide helices insert themselves into the hydrophobic core of the membrane (c) which
leads to the formation of a pore through the membrane (d) (Reddy et al., 2004). This pore
formation increases the membrane’s permeability to large molecules, which in turn
causes disruption of ion gradients, allows harmful molecules to diffuse into the cell, and
(c) (d)
29
allows important molecules and cellular structures to leave the cell (Shai, 1999).
Combined, all of these factors cause the cell to lyse and die.
2.4 Quartz Crystal Microbalance with Dissipation (QCM-D)
The quartz crystal microbalance with dissipation (QCM-D) is a relatively new
technology, receiving its patent as recently as 1996. The QCM-D is based on the quartz
crystal microbalance (QCM), which was first developed in 1921 and first used with a
liquid substrate in 1980 (Rodahl et al., 1997). The QCM has increasingly been used by
researchers to monitor the formation of biofilms (Fredriksson et al., 1998; Otto et al.,
1999; Schofield et al., 2007) and adsorption of proteins (Höök et al., 1998) and other
biomolecules (Jenkins et al., 2004; Kwon et al., 2006; Carter et al., 1995). These
researchers needed an instrument that could also measure dissipation so they could more
accurately interpret results when the Sauerbrey relation was not valid, and thus the QCM-
D was developed. The following section discusses how the QCM-D operates, the theories
needed to interpret its data output, and previous research using the QCM and QCM-D.
2.4.1 How the QCM-D Works
The QCM and QCM-D work by using a piezoelectric crystal oscillator which shuts on
and off as a liquid solution is running through the chamber containing the crystal. This
allows the instrument to determine the decay of the frequency (∆f) of the crystal by
measuring the voltage across electrodes on the crystal (Rodahl et al., 1997). The change
in frequency the QCM or QCM-D measures is then used to calculate the mass deposited
on the surface of the crystal according to the Sauerbrey relation discussed in the
following section.

30
The QCM-D, however, also measures the change in dissipation (∆D). The dissipation
factor (D) is defined as the energy dissipated per oscillation divided by the total energy
stored in the system (Q). The dissipation relates to the stiffness or rigidity of the layer
deposited on the crystal, where a small ∆D indicates slow energy dissipation and a rigid
film, and a large ∆D indicates rapid energy dissipation and a soft film (Q-Sense, Inc.,
2007). Dissipation is important to record, particularly for QCM-D experiments using
biomolecules, because if ∆D is larger, the layer is less rigid and the Sauerbrey relation is
not applicable. Thus, the D factor is relevant for four reasons: to verify the validity of the
Sauerbrey relation, monitor swelling/hydration, viscoelastic modeling and for insight into
structural changes (Q-Sense, Inc., 2007).
All experiments reported in this paper were conducted using the Q-Sense (Gothenburg,
Sweden) Model E-4 QCM-D equipped with gold crystals that measured 14 mm in
diameter and had a resonance frequency of 5 MHz.
2.4.2 Theory of the QCM-D
The theory of the QCM-D is described by the Sauerbrey equation (1) shown below,
fn
Cm (1)
where ∆m is the adsorbed mass on the crystal, C is the mass sensitivity constant, n is the
overtone number and ∆f is the change in frequency (Sauerbrey, 1959). Essentially, the
Sauerbrey equation states that the change in mass on the surface is directly proportional
31
to the change in frequency of the oscillating crystal multiplied by negative one. Thus, a
negative change frequency would indicate an increase in the mass deposited on the
crystal surface and vice versa (Kwon et al., 2006).
Additionally, the dissipation factor (D) discussed previously is mathematically expressed
as,
QD
1 (2)
which is defined as the energy dissipated per oscillation divided by 2п times the total
energy stored in the system (Q-Sense, Inc., 2007). This dissipation factor can also be
understood as the sum of all energy losses of the system. Therefore, a higher D would
indicate more energy lost by the system and a soft film, which a lower D would indicate
less energy lost by the system and a relatively rigid film deposited on the crystal surface.
It is very important that this dissipation factor is recorded along with the frequency
because the Sauerbrey relation is not always valid, particularly for the deposition of cells
or other biomolecules. According to Höök et al (1998), the Sauerbrey relation is often not
valid for these biological applications because cell or biomolecule layers aren’t rigid,
may trap liquid between their molecules, and may slip on the electrode surface as it
oscillates. All of these conditions may cause a dissipation of energy not taken into
account by the Sauerbrey relation.
These two relationships are the basis for interpreting the data obtained from the QCM-D
and will be important in understanding the results and discussion portion of this paper.
32
2.4.3 Relevant Research Using the QCM and QCM-D
Although QCM-D is relatively new, researchers have quickly adopted the technology due
to its extreme sensitivity in the range (Jenkins et al, 2004). Thus, the QCM-D is easily
applicable as a biosensor, whether this is to detect cells or other biomolecules. Recently,
the QCM-D has been used to better understand the stages of cell adhesion to a surface
and biofilm formation. QCM-D has also been utilized in research concerning adsorption
of biomolecules such as starches, biopolymers, proteins, and antibodies (Jenkins et al,
2004).
2.4.3.1 Cell Adhesion and Biofilm Formation
QCM and QCM-D can be used to study cellular adhesion to surfaces. These techniques
are particularly useful for this application because adhesion can be measured without
disturbing the cells system (Otto et al., 1999). Fredricksson et al. (1998) studied how
effectively the QCM could measure the E.coli cellular adhesion to the surface of the gold
crystal. At this time, it was known that the QCM could detect the adhesion of 105
or 106
cells to the crystal surface, but Fredricksson et al. (1998) wanted to determine whether
the QCM was sensitive enough to detect adhesion of a very small number of cells. For
each experiment, between 70 and 80 monkey kidney eptithelial (MKE) cells or Chinese
hamster ovary (CHO) cells were attached to either hydrophilic or hydrophobic surfaces,
and both the frequency and dissipation changes were measured. Since the Sauerbrey
relation is only valid when the surface is covered by an evenly distributed monolayer, and
the small number of cells used in this study did not constitute a monolayer, the researches
recognized that it was important to monitor the dissipation of the system. By plotting the
change in frequency (∆f) and the change in dissipation (∆D) in relation to each other, they
33
were able to determine that the QCM was not only able to detect the cells adhering to the
surface, but was also able to detect differences in binding between cell types and surface
types.
The QCM-D has also been an integral part of research concerning the phases of cell
adhesion at a liquid-solid interface. Otto et al. (1999) researched whether the two main
theories used to explain bacterial adhesion, DLVO theory and thermodynamics, were
accurate when compared to experimental results. DLVO theory, which stands for the
names of its creators Derjaguin, Landau, Verwey and Overbeek, describes intermolecular
forces as a function of the separation distance between the cell and the surface, in terms
of the balance between van der Waals forces and repulsive electrostatic interactions (Otto
et al., 1999). Although DLVO theory is accurate at low ionic strengths, body fluids and
environmental systems often exhibit higher ionic strengths, where it is much more
difficult to predict cell-surface interactions. Meanwhile, the thermodynamic model
considers the balance between the interfacial free energies of the surfaces and media
(Otto et al., 1999). To determine whether these theories accurately predicted cell
adhesion behavior experimental results, Otto et al. (1999) studied the frequency and
dissipation changes observed when fimbriated and non-fimbriated E. coli strains were
adsorbed to surfaces of varying hydophicities and ionic strengths. The cells bound more
favorably with increasing media ionic strength between 0.06M and 0.1225M, but
adsorption decreased at higher values of ionic strength (Otto et al., 1999). Further, more
cells attached to the hydrophilic portions of the hydrophobicity gradient on the crystal
surface and the effect of the hydrophobicity was more pronounced (Otto et al., 1999).
34
Finally, using D/f plots, the researchers were able to propose five phases of cell adhesion
detected by the QCM-D: (1) cell binding, or initial cell contact with the surface; (2)
secretion of microexudates, proteins that aid adhesion; (3) spreading of the cell surface,
causing increased contact area; (4) Modification of adhesion properties, such as strength
of adhesion; and (5) changes in the rigidity of the cytoskeleton, which causes change in
dissipation (Otto et al., 1999).
The effectiveness of the QCM-D as a means of studying cell adhesion has been well-
documented in preliminary studies, but this work is still in the early stages. Few
researched to date have used QCM-D to investigate microbial biofilms. Biofilms are
attached communities of microbes that form on medical implant devices, in the
environment, or even in industrial settings. As stated previously, the QCM-D provides
the ability to monitor the formation of these biofilms at a solid-liquid interface without
disturbing the system. Schofield et al. (2007) used the QCM-D to monitor the biofilm
formation of Streptococcus mutans, bacteria often found as a biofilm in dental plaque, on
gold crystals under both continuous flow and “attach and flow” conditions. For
continuous flow conditions, they passed S. mutans cells continuously through the QCM-
D chamber for 120 minutes, but for “attach and flow” conditions, they pumped S. mutans
for 20 minutes and then turned the pump off for 120 minutes to allow cells to attach via
passive diffusion (Schofield et al., 2007). Growth media was passed through flow
chamber overnight for both flow conditions (Schofield et al., 2007). Biofilms formed
under continuous flow systems were more dissipative per unit mass, meaning that they
experienced a greater change in dissipation per frequency change, and thus were more
35
complex than the “attach and flow” biofilms. Also, there was a greater increase in
frequency when the “attach and flow” biofilms were rinsed with water, which indicates
that more cells washed away, and therefore continuous flow biofilms were more stable
(Schofield et al., 2007). As this study demonstrates, the frequency and dissipation
measurements taken by the QCM-D can potentially provide useful qualitative data to
better understand the process of bacterial biofilm formation.
2.4.3.2 Biomolecule Adsorption
The QCM is useful for detecting biomolecule adsorption and for studying degradation of
biomolecules deposited to the crystal surface. Jenkins et al. (2004) used QCM to detect
the biodegradation of starch due to Bacillus subtilis bacteria. Previously, carbon dioxide
meters had been used to measure the biodegradability of biopolymers such as starch, but
they were not sensitive enough to pick up very small mass changes in the beginning of
the degradation process (Jenkins et al., 2004). Using QCM, Jenkins et al. (2004) could
detect very small changes in mass on the crystal surface. They first applied and dried the
starch to the crystal surface, and then deposited the bacteria on the crystal by submersing
the crystal in a bioreactor. The change in frequency was measured and correlated to the
amount of starch remaining, assuming that an increase in frequency meant a decrease in
the mass on the crystals, vice versa. The researchers suggested that the QCM might play
a role in future experiments geared at investigating how organisms break down different
biopolymers, thus extending the utility of this technique.
In another biopolymer study, Kwon et al. (2006) used the QCM-D to monitor the
adsorption of dextran to silica and alumina surfaces. The researchers intended to use
36
these experiments to better understand the interactions between minerals in the
environment and extracellular polymeric substances (EPS), which are biopolymers
secreted by microbes to aid in adhesion, biofilm formation, and mineral binding (Kwon et
al., 2006). EPS play a role in heavy metals mobilization and in the fate of chlorinated
hydrocarbons in soils and aquifers. To mimic the surfaces of the minerals found in the
environment, they used aluminum oxide (Al2O3) and silicon dioxide (SiO2) crystals
instead of the gold crystals generally used in experiments involving the adsorption of
biomolecules. Since a QCM-D was used in this experiment, the frequency and the
dissipation were measured, while in the previous study by Jenkins et al. (2003) only the
frequency was measured by the QCM. The dextran QCM-D experiments showed that as
higher concentrations of dextran were applied, there were larger changes in frequency
and dissipation, indicating more mass attached to the crystal surfaces (Kwon et al., 2006).
Particularly, more dextran was adsorbed to the alumina surface whereas more dextran
was washed from the silica surface during rinsing, suggesting the dextran was more
strongly attached to the alumina surface. Additionally, they compared the changes in
dissipation to the changes in frequency (∆D/∆f) and found this ratio to be considerably
different between alumina and silica, suggesting that dextran had altered conformation on
the two substrates. Specifically, only one general trend for silica was observed in the
ΔD/Δf plot, while there were multiple slopes for the alumina plot, suggesting differences
in adsorption mechanisms and the conformation of dextran (Kwon et al., 2006). This was
a ground breaking study for each surface since it showed that very subtle changes in
biopolymer properties could be accurately detected.
37
The QCM and QCM-D have also been widely used in experiments concerning protein
adsorption at solid-liquid interfaces. Höök et al. (1998) utilized the QCM to measure
frequency and dissipation changes during the adsorption of four different proteins:
myoglobin, hemoglobin, human serum albumin (HSA), and ferritin. They recognized the
limitations of the Sauerbrey relation and the QCM which only measured frequency to
biomolecule adsorption applications. In an effort to solve this problem, they researched
and developed a mechanism to measure and record instantaneous dissipation much like in
the modern QCM-D. Their main finding was that for all proteins deposited and adsorbed
on the crystal surface, the QCM recorded a rapid initial frequency decrease, indicating a
large bulk deposition, followed by a slower frequency decrease as the surface is saturated
with the proteins (Höök et al., 1998). However, when the change in frequency (Δf) and
the change in dissipation (ΔD) were plotted in relation to each other, the behavior varied
between proteins. The D-f plots for hemoglobin were very simple, with one obvious trend
while the plots for ferritin and HSA were much more complex. This complexity was
attributed to the various stages of protein adsorption that the QCM is able to distinguish.
From this study, one can conclude that by measuring both frequency and dissipation, the
QCM-D is sensitive enough to differentiate between different stages of protein adsorption
and differenced among proteins. Therefore, the QCM-D is an important tool to better
understand the mechanisms of protein adsorption at solid-liquid interfaces and is useful
for applications including the biocompatibility of implant materials and biofouling (Höök
et al., 1998).
38
Finally, the QCM and QCM-D have been very important in better understanding the
interactions between antibodies and antigens. The QCM was particularly important in
research concerning the development of a short-term vaccine for Vibrio cholera O139.
O139 is particularly virulent strain of cholera that recently appeared in India in 1992
(Carter et al., 1995). This strain has a different LPS structure than the O1 serotype
commonly associated with the worldwide pandemic and possesses the same cholera toxin
as the O1 strain, but much more of it, and the toxin is encoded in different chromosomal
locations (Carter et al., 1995). Thus, drugs that work against the O1 serotype are not
effective against O139 and those who are immune to O1 through vaccines or previous
infection are not immune to O139 (Carter et al., 1995). Through their research, Carter et.
al (1995) aimed to create a short-term vaccine for the dangerous O139 cholera serotype
by using the QCM to differentiate between strains. They did so by adsorbing the antibody
anti-V. cholerae O139 derived from rabbit serum, which would only bind to the O139
serotype and not the O1 serotype, to the crystal surface of the QCM and then incubating
at 37°C for an hour (Carter et al., 1995). Carter et al. (1995) were able to successfully
identify cholera O139, and suggested that crystals be pre-coated with the antibody so they
are faster and easier to use in the field. Thus, QCM and QCM-D are not only valuable
technology in research labs, but also in the field, since they are portable, easy to operate,
and much faster than traditional assay techniques.
39
3 Methodology
3.1 Making Agar Plates
Agar plates containing the growth media Luria-Bertani (LB) agar (Sigma, St. Louis, MO)
were used to culture the bacteria used in this experiment. The same procedure was
followed when making plates for all eleven strains of bacteria.
First, the chosen media (for example: LB) was measured out to 35 g/L and the
appropriate amount was chosen assuming approximately 20 mL per plate. A flask was
filled with a small amount of MilliQ water and media was added. The remainder of the
flask was filled with water and mixed on magnetic stirrer on low heat until the media was
dissolved. Aluminum foil was taped over the top of the flask and placed in autoclave on
setting 1 for 20 minutes. After the cycle was finished, the flask was cooled for
approximately 10 minutes in the autoclave. LB media was poured into Petri dishes,
ensuring that there were no bubbles, without putting arms or hands over the dish to avoid
contamination. Once cooled, the top was placed on the Petri dishes and the plates were
placed, inverted, in the hood overnight.
3.2 Plating Bacteria
Bacteria were maintained on agar plates, using the following protocol.
The bacteria were cultured and allowed to grow to an absorbance of 0.3 at a wavelength
of 600nm. Under the hood, the plastic inoculation loop was shaken out of container,
making sure not reach inside container. Next, the lid from the plate was removed
40
carefully, making sure not to hold hands or arms over the plate. The inoculation loop was
briefly submerged in the culture broth and used to spread the bacteria on the plate. The
plates were then covered with Parafilm around the edges and incubated inverted at 37°C
for approximately 24 hours.
3.3 Pre-culturing Bacteria
Experiments were run with eleven different strains of bacteria. The night before a growth
curve, counting chamber, or QCM-D experiment was to be conducted, the particular
strain to be used was pre-cultured using the method outlined below.
First, 10 mL of LB broth was placed in a 250 mL flask and the edge of the flask was
flamed both before and after and poured under the hood. Still under the hood, a plastic
inoculation loop was shaken out of the container, while making sure not to reach inside
container to avoid contamination. Next, the lid of the Petri dish was removed, making
sure not to cross arms or hands over the opened Petri dish, to avoid contamination. A
single colony was scraped off with the inoculation loop and mixed around inside the
flask. The Petri dish was then covered and the pre-culture flask was allowed to incubate
overnight at 37oC in an agitator.
3.4 Growth Curves
Eleven different strains of E. coli were used in this project (Table 2).
41
Table 2: Source information for E. coli strains used, where EPEC stands for enteropathogenic E. coli,
EHEC stands for enterohemorrhagic E.coli, VTEC stands for vero-toxin producing E. coli, and the sugar
backbone type refers to the number of sugars in the lipopolysaccharide backbone .
Name of E. coli Strain
Sugar Backbone
Type Pathotype/Behavior Source
HB101 n/a n/a American Type Culture Collection (ATCC); #33694
O26:K60:H11 3 EPEC, EHEC
Culture Collection University of Gothenburg (CCUG), Gothenburg, Sweden; 29190
O35:K-:H10 5 not as commonly
found ATCC; #23525
O55:H7 3 EPEC, EHEC Dr. Howard Ochman, University of Arizona; ECOR #37
O113:H4 n/a VTEC Kim Ziebel, Health Canada
O113:H21 4 EHEC Dr. Howard Ochman, University of Arizona; ECOR #30
O117:K98:H4 5 EHEC CCUG, Gothenburg, Sweden; 11418
O157:H7 4 EHEC ATCC; #43895
O157:H12 n/a non-VTEC Kim Ziebel, Health Canada
O157:H16 n/a non-VTEC Kim Ziebel, Health Canada
O172:K-:H- 5 EHEC CCUG, Gothenburg, Sweden; 36540
The following procedure was followed to culture each of the eleven strains and to
quantify bacterial growth as a function of time.
Approximately 50 mL of LB broth was poured into a 250 mL flask, sterilizing the lip of
the flask both before and after pouring. 500µL of bacteria from the overnight pre-culture
were then added to the flask. Next, the bacteria in the flask were incubated on setting six
and 37oC in the shaker bath. The absorbance was recorded every half hour until it
42
reached 0.25A. Then the absorbance was recorded every 10 minutes until it reached
approximately 0.8A. After this point, the absorbance was recorded every 15-20 minutes
until the growth slowed. Finally, the measured absorbance was plotted versus time.
3.5 Counting Bacteria
A counting chamber was used to determine the population of bacteria at various points in
time during the exponential stage of growth. Samples of each strain of E. coli at 5
different absorbance values (ranging from approximately 0.2 to 0.9) were counted. A
PBS (phosphate buffer saline) solution was used to keep cells alive, but prevent further
growth. The following procedure was used to conduct counting chamber experiments.
10 mL of bacteria culture was centrifuged at approximately 4000 RPM for 10 minutes.
The LB media was then removed and replaced with 10 mL of phosphate buffered saline
(PBS) at pH 7.4 (Sigma, St. Louis, MO). The bacteria/PBS solution was then vortexed
until the pellet in the bottom of the centrifuge was dissolved. This cleaning process was
repeated three times to ensure that all growth media had been removed.
Next, the counting chamber slide was cleaned and assembled with a cover slip fastened
on top. Approximately 20 μL of culture was then injected into the well. The counting
chamber was placed under a microscope where the bacteria and grid were found. The
bacteria were counted in ten random locations on the grid. After this was completed, the
counting chamber was cleaned by sonication for 10 minutes in MilliQ water and this was
done for each absorbance of each strain of E. coli. A spreadsheet program (in this case,
43
Microsoft Excel) was used to graph the average bacteria population per grid square
versus absorbance.
3.6 Contact Angles
Contact angle is a common technique from physical chemistry that can be used to
characterize the uniformity and hydrophobicity of a substrate. The contact angle for the
gold crystals used in this experiment was determined by the procedure below. For this
experiment, a Ramé-Hart model 100-00 (Mountain Lakes, NJ) goniometer was used
along with the accompanying DROPimage (Noetcong, NJ) software.
The contact angle was found by placing the gold crystal on the goniometer and filling the
device with 40 μL of water. 2 µL of water was dropped on the crystal and the more the
drop was spread out, the greater the hydrophilic tendencies of the gold crystal, which
means a lower contact angle. This process was repeated with a minimum for 4 drops in 4
different locations on the gold crystals and the results were recorded.
3.7 QCM-D
QCM-D was the major experimental technique used for this project. In order to keep the
QCM-D running smoothly, the cleanliness of the gold crystals and the machine were
maintained on a daily basis. A Q-Sense, Inc (Gothenburg, Sweden) model E-4 QCM-D
was used for all experiments along with a software package including Q-Soft 401 and Q-
Tools to record and analyze results. 5 MHz gold crystals that were 14 mm in diameter
were used for all QCM-D experiments. Additionally, the cecropin P1 modified with an
extra cysteine group that was deposited on certain crystals was obtained from New
England Peptide (Gardner, MA).
44
3.7.1 Cleaning procedure for QCM-D and crystals
The QCM-D and the crystals were cleaned in order to remove any organic and biological
before and after each experiment under a chemical fume hood.
3.7.1.1 Cleaning the Gold Crystals (Ammonia Peroxide Mix)
The crystals first underwent UV (which is ultraviolet light at a wavelength of 285 nm)
treatment for 5-10 minutes by placing the crystals in the Petri dish, removing the lid,
placing under the hood and then turning on the UV light. Next, a 5:1:1 mixture of
MilliQ-water, ammonia (25%) (Sigma, St. Lous, MO) and hydrogen peroxide (30%)
(Sigma, St. Louis, MO) was heated to 75°C. The crystals were then placed in the heated
solution for 5 minutes and then thoroughly rinsed with MilliQ water. The crystals were
dried with nitrogen gas and then underwent another 5-10 minutes of UV treatment.
3.7.1.2 Cleaning the QMC-D
When cleaning the QCM-D, specified cleaning crystals were first mounted into the
chambers. Approximately 10 mL of 2% Hellmanex (Hellma GmbH and Co., Germany)
solution was pumped through at a flow of 300 µL/min followed by approximately 20 mL
of MilliQ water. Air was allowed to run through the chambers to rid any excess liquid
and then the chambers were emptied and dried completely with nitrogen air.
3.7.2 QCM-D Experimental Procedure
Each of the eleven strains of E. coli was tested in the QCM-D using the same protocol.
First, the gold crystals were placed in the chambers and all appropriate connections were
made. MilliQ water was passed through all four chambers at 100µL/min for

45
approximately 10 minutes to allow the QCM-D to equilibrate. The computer was then
turned on and the program QSoft 401 was opened, and the temperature control was set to
23°C. The frequency and dissipation plots were given time to stabilize and then
measurement was stopped and restarted.
MilliQ water was passed through the machine for approximately 5 minutes with stable
plots and then the QCM-D pump was stopped and the MilliQ water was replaced with
PBS. The flow was reversed for approximately 30 seconds, before being run in the
forward direction, in order to prevent air bubbles from disrupting the sensitive
measurement devices. PBS was run through all four chambers of the QCM-D at
50µL/min until the frequency and dissipation plots stabilized, which generally took
approximately 30 minutes. Once this stabilization occurred, the QMC-D pump was
stopped again and the PBS was replaced with 10µM cecropin-P1 cys solution for two out
of the four chambers at a flow rate of 50µL/min and run for approximately 120 minutes.
The 10µM cecropin-P1 cys solution was made from 1mL of 100µM Cecropin-P1 cys
solution diluted in 13mL of PBS. Again, the flow was reversed, before being run in the
forward direction, for approximately 30 seconds in order to prevent air bubbles.
Approximately 2 hours after the addition of the cecropin-P1 cys solution and after the
plot had stabilized, the QCM-D pump was stopped and PBS was run through all four
chambers, again reversing the flow first in order to prevent air bubbles. The PBS was run
through the chambers at a flow of 50µL/min to wash off any excess cecropin-P1 cys that
did not bind to the gold surface until the frequency and dissipation plots stabilized, or for

46
approximately 30 minutes. At this point, the QCM-D pump was stopped and the PBS
was replaced with 1x10⁸ cells/mL of E. coli in PBS, which was passed through all four
chambers at 50µL/min for approximately 120 minutes. Again, the flow was reversed first
in order to prevent any air bubbles.
After the E. coli in PBS solution was passed through the QCM-D and the frequency and
dissipation graphs stabilized, PBS was run through all four chambers at 50µL/min for
approximately 30 minutes to wash off any excess E. coli cells that were not firmly
deposited. Next, the measurement was stopped in QSoft, the QCM-D pump was stopped,
and the gold crystals were removed from all four chambers in order to use the live/dead
kit to evaluate the presence of live/dead bacteria on the crystals. Once the experiments
were completed, the crystals and the QCM-D was cleaned and discussed previously.
3.8 Live/Dead Kit on Gold Crystals to Characterize Cell Viability
After the QCM-D experiment was run, a live/dead kit was used to determine the fraction
of bacteria alive on all four of the crystals. The dyes used were 20μM propidium iodide
and 5μM Syto 9 (Molecular Probes, Eugene, OR) and were diluted using dimethyl
sulfoxide (DMSO) (Sigma, St. Louis, MO). The microscope used was a Nikon Eclipse
E400, specifically the 60x objective, equipped with FITC and Texas Red filters attached
to the Mercury-100W lamp (Chiu, Technical Corp). The Syto 9 dyed all cells, alive and
dead, green when viewed under the FITC filter, whereas the propidium iodide dyed all
dead cells red when viewed under the Texas Red filter. Additionally, the accompanying
software Spot Advanced was used to capture and merge the pictures.
47
First, each gold crystal was placed in a small Petri dish with approximately 3 mL of PBS,
enough to cover the crystal, and the live/dead kit was removed from the freezer and
allowed to defrost. Syto 9 (5.01 μL) and propidium iodide (7.5 µL) were added to the
crystals in the microscope room, making sure to block as much light as possible because
Syto 9 and propidium iodide are light sensitive. The concentrations of Syto 9 and
propidium iodide that were added to the Petri dish were determined by the given
manufacturer’s data. Next, the Mercury Lamp was turned on and the crystals were
viewed under both FITC and Texas Red filters. Images were taken at fifteen randomly
selected locations, once under each filter. These images were then overlapped and the
amounts of live and dead bacteria were counted. When there were multiple crystals with
cecropin P1 and multiple crystals without cecropin P1, the average of the live/dead values
were calculated.
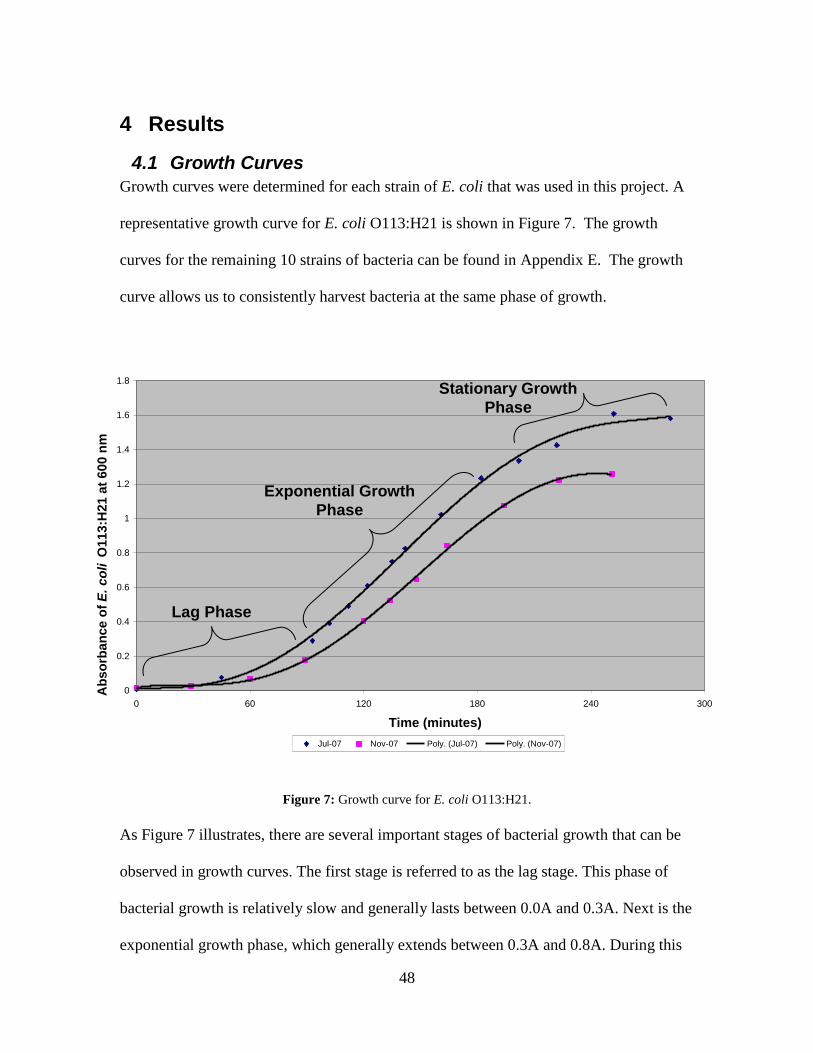
48
4 Results
4.1 Growth Curves
Growth curves were determined for each strain of E. coli that was used in this project. A
representative growth curve for E. coli O113:H21 is shown in Figure 7. The growth
curves for the remaining 10 strains of bacteria can be found in Appendix E. The growth
curve allows us to consistently harvest bacteria at the same phase of growth.
Figure 7: Growth curve for E. coli O113:H21.
As Figure 7 illustrates, there are several important stages of bacterial growth that can be
observed in growth curves. The first stage is referred to as the lag stage. This phase of
bacterial growth is relatively slow and generally lasts between 0.0A and 0.3A. Next is the
exponential growth phase, which generally extends between 0.3A and 0.8A. During this
0
0.2
0.4
0.6
0.8
1
1.2
1.4
1.6
1.8
0 60 120 180 240 300
Time (minutes)
Ab
so
rban
ce o
f E
. co
li O
113:H
21 a
t 600 n
m
Jul-07 Nov-07 Poly. (Jul-07) Poly. (Nov-07)
Lag Phase
Exponential Growth
Phase
Stationary Growth
Phase
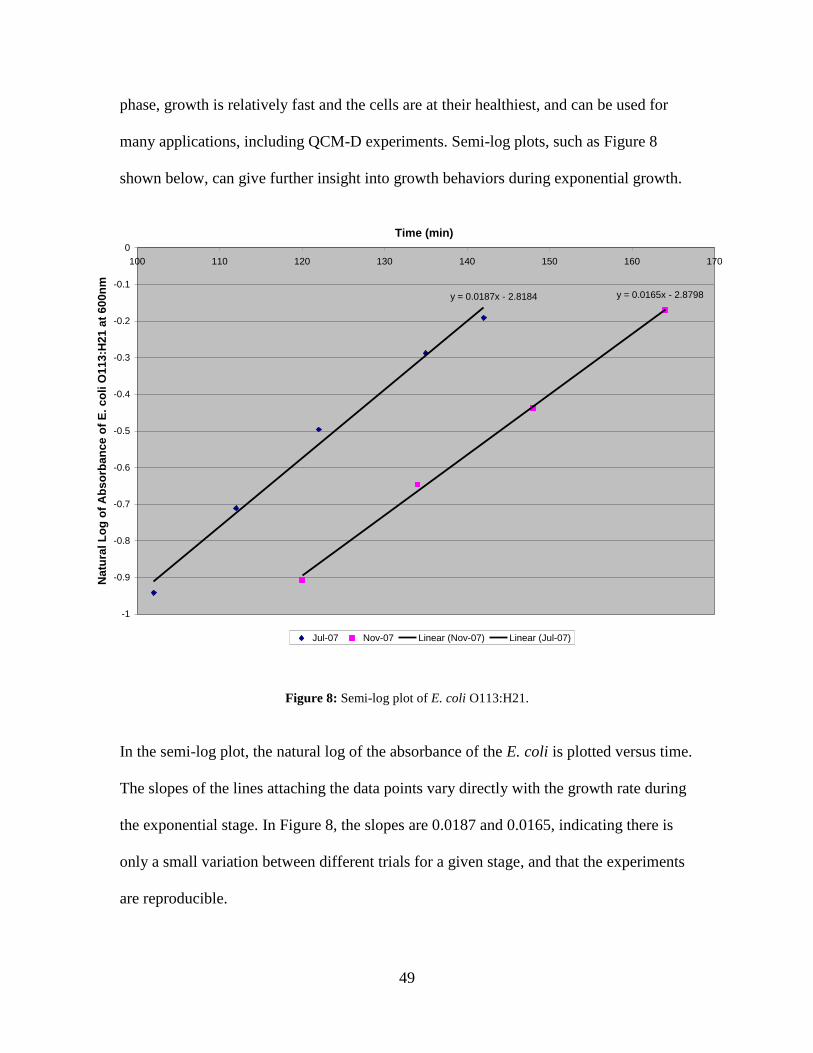
49
phase, growth is relatively fast and the cells are at their healthiest, and can be used for
many applications, including QCM-D experiments. Semi-log plots, such as Figure 8
shown below, can give further insight into growth behaviors during exponential growth.
Figure 8: Semi-log plot of E. coli O113:H21.
In the semi-log plot, the natural log of the absorbance of the E. coli is plotted versus time.
The slopes of the lines attaching the data points vary directly with the growth rate during
the exponential stage. In Figure 8, the slopes are 0.0187 and 0.0165, indicating there is
only a small variation between different trials for a given stage, and that the experiments
are reproducible.
y = 0.0165x - 2.8798y = 0.0187x - 2.8184
-1
-0.9
-0.8
-0.7
-0.6
-0.5
-0.4
-0.3
-0.2
-0.1
0
100 110 120 130 140 150 160 170
Time (min)
Natu
ral
Lo
g o
f A
bs
orb
an
ce
of
E.
co
li O
11
3:H
21
at
60
0n
m
Jul-07 Nov-07 Linear (Nov-07) Linear (Jul-07)
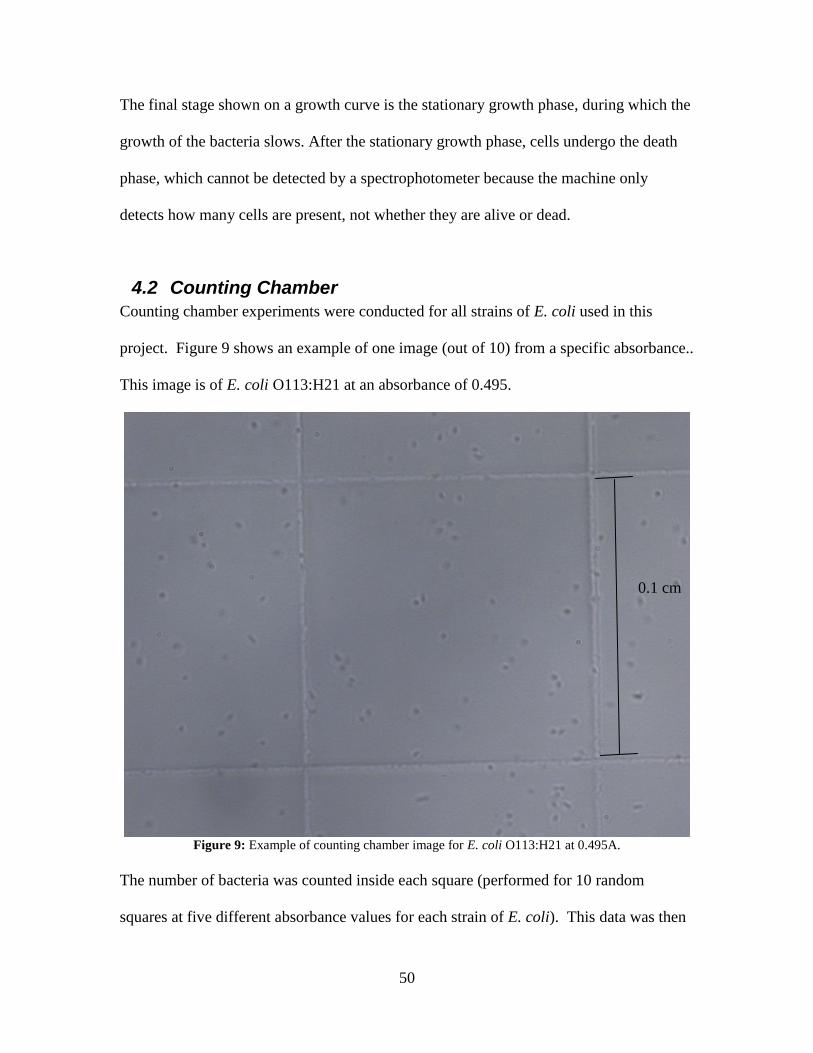
50
The final stage shown on a growth curve is the stationary growth phase, during which the
growth of the bacteria slows. After the stationary growth phase, cells undergo the death
phase, which cannot be detected by a spectrophotometer because the machine only
detects how many cells are present, not whether they are alive or dead.
4.2 Counting Chamber
Counting chamber experiments were conducted for all strains of E. coli used in this
project. Figure 9 shows an example of one image (out of 10) from a specific absorbance..
This image is of E. coli O113:H21 at an absorbance of 0.495.
Figure 9: Example of counting chamber image for E. coli O113:H21 at 0.495A.
The number of bacteria was counted inside each square (performed for 10 random
squares at five different absorbance values for each strain of E. coli). This data was then
0.1 cm
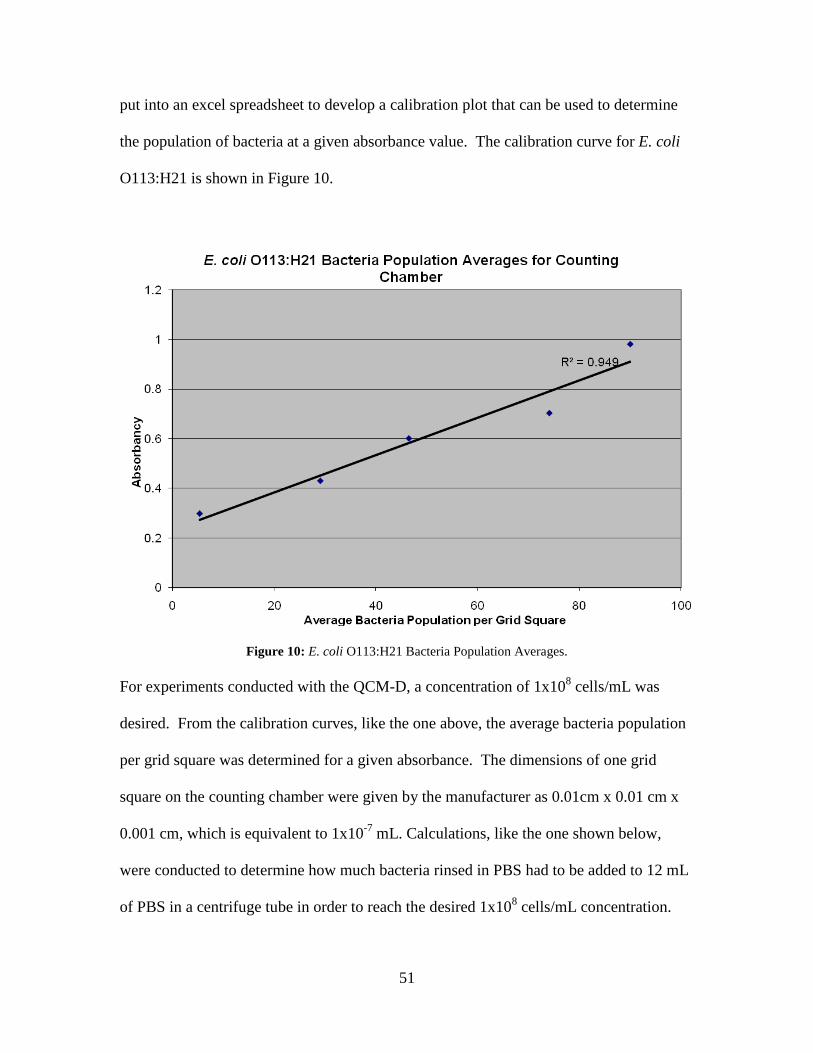
51
put into an excel spreadsheet to develop a calibration plot that can be used to determine
the population of bacteria at a given absorbance value. The calibration curve for E. coli
O113:H21 is shown in Figure 10.
Figure 10: E. coli O113:H21 Bacteria Population Averages.
For experiments conducted with the QCM-D, a concentration of 1x10⁸ cells/mL was
desired. From the calibration curves, like the one above, the average bacteria population
per grid square was determined for a given absorbance. The dimensions of one grid
square on the counting chamber were given by the manufacturer as 0.01cm x 0.01 cm x
0.001 cm, which is equivalent to 1x10⁻⁷
mL. Calculations, like the one shown below,
were conducted to determine how much bacteria rinsed in PBS had to be added to 12 mL
of PBS in a centrifuge tube in order to reach the desired 1x10⁸ cells/mL concentration.
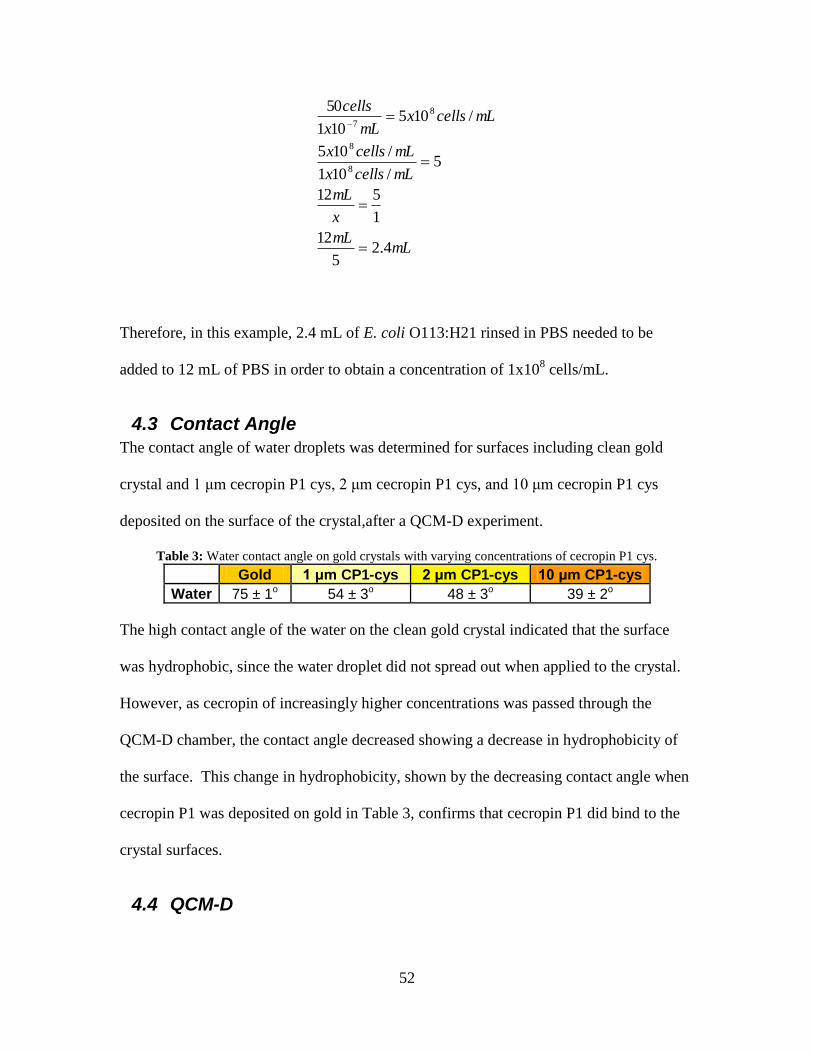
52
mLmL
x
mL
mLcellsx
mLcellsx
mLcellsxmLx
cells
4.25
12
1
512
5/101
/105
/105101
50
8
8
8
7
Therefore, in this example, 2.4 mL of E. coli O113:H21 rinsed in PBS needed to be
added to 12 mL of PBS in order to obtain a concentration of 1x10⁸ cells/mL.
4.3 Contact Angle
The contact angle of water droplets was determined for surfaces including clean gold
crystal and 1 μm cecropin P1 cys, 2 μm cecropin P1 cys, and 10 μm cecropin P1 cys
deposited on the surface of the crystal,after a QCM-D experiment.
Table 3: Water contact angle on gold crystals with varying concentrations of cecropin P1 cys.
Gold 1 μm CP1-cys 2 μm CP1-cys 10 μm CP1-cys
Water 75 ± 1o 54 ± 3o 48 ± 3o 39 ± 2o
The high contact angle of the water on the clean gold crystal indicated that the surface
was hydrophobic, since the water droplet did not spread out when applied to the crystal.
However, as cecropin of increasingly higher concentrations was passed through the
QCM-D chamber, the contact angle decreased showing a decrease in hydrophobicity of
the surface. This change in hydrophobicity, shown by the decreasing contact angle when
cecropin P1 was deposited on gold in Table 3, confirms that cecropin P1 did bind to the
crystal surfaces.
4.4 QCM-D
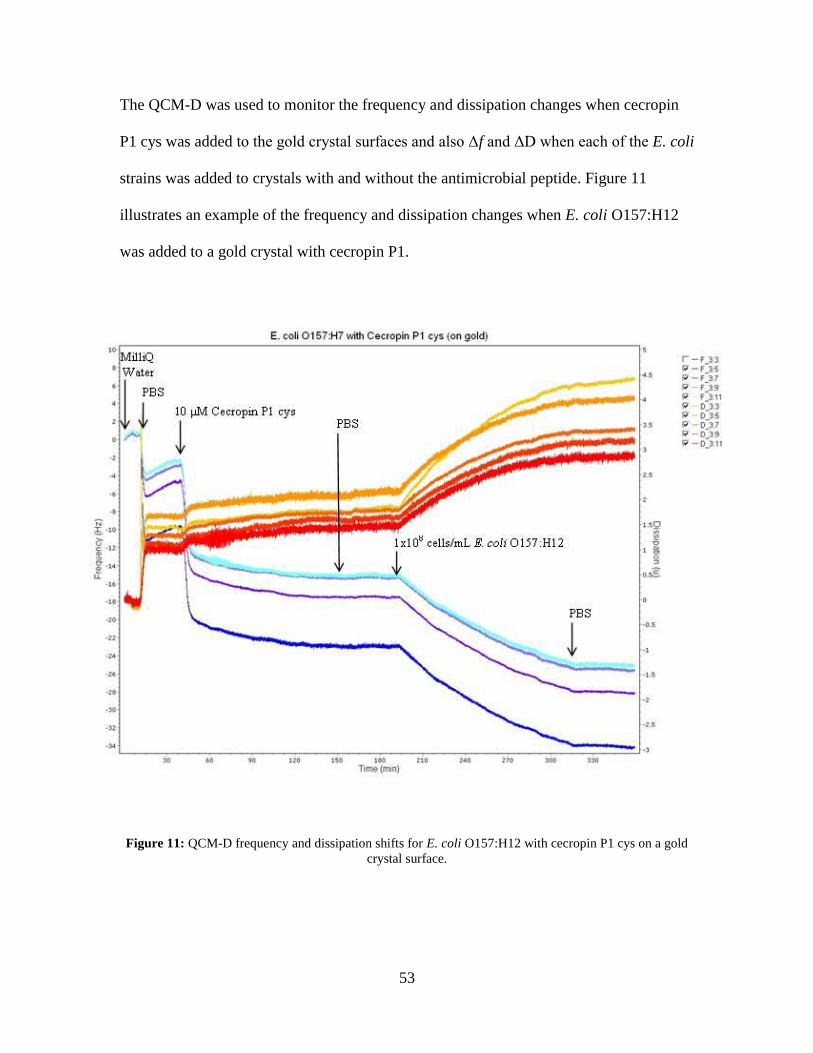
53
The QCM-D was used to monitor the frequency and dissipation changes when cecropin
P1 cys was added to the gold crystal surfaces and also Δf and ΔD when each of the E. coli
strains was added to crystals with and without the antimicrobial peptide. Figure 11
illustrates an example of the frequency and dissipation changes when E. coli O157:H12
was added to a gold crystal with cecropin P1.
Figure 11: QCM-D frequency and dissipation shifts for E. coli O157:H12 with cecropin P1 cys on a gold
crystal surface.
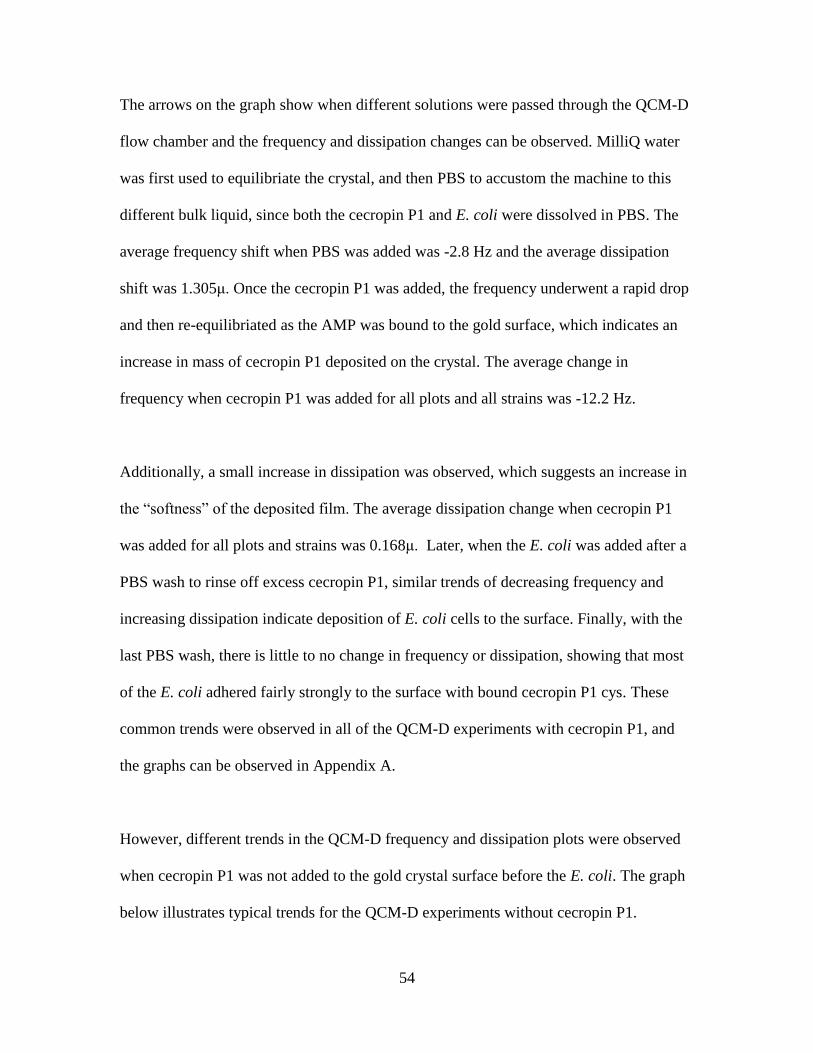
54
The arrows on the graph show when different solutions were passed through the QCM-D
flow chamber and the frequency and dissipation changes can be observed. MilliQ water
was first used to equilibriate the crystal, and then PBS to accustom the machine to this
different bulk liquid, since both the cecropin P1 and E. coli were dissolved in PBS. The
average frequency shift when PBS was added was -2.8 Hz and the average dissipation
shift was 1.305μ. Once the cecropin P1 was added, the frequency underwent a rapid drop
and then re-equilibriated as the AMP was bound to the gold surface, which indicates an
increase in mass of cecropin P1 deposited on the crystal. The average change in
frequency when cecropin P1 was added for all plots and all strains was -12.2 Hz.
Additionally, a small increase in dissipation was observed, which suggests an increase in
the “softness” of the deposited film. The average dissipation change when cecropin P1
was added for all plots and strains was 0.168μ. Later, when the E. coli was added after a
PBS wash to rinse off excess cecropin P1, similar trends of decreasing frequency and
increasing dissipation indicate deposition of E. coli cells to the surface. Finally, with the
last PBS wash, there is little to no change in frequency or dissipation, showing that most
of the E. coli adhered fairly strongly to the surface with bound cecropin P1 cys. These
common trends were observed in all of the QCM-D experiments with cecropin P1, and
the graphs can be observed in Appendix A.
However, different trends in the QCM-D frequency and dissipation plots were observed
when cecropin P1 was not added to the gold crystal surface before the E. coli. The graph
below illustrates typical trends for the QCM-D experiments without cecropin P1.
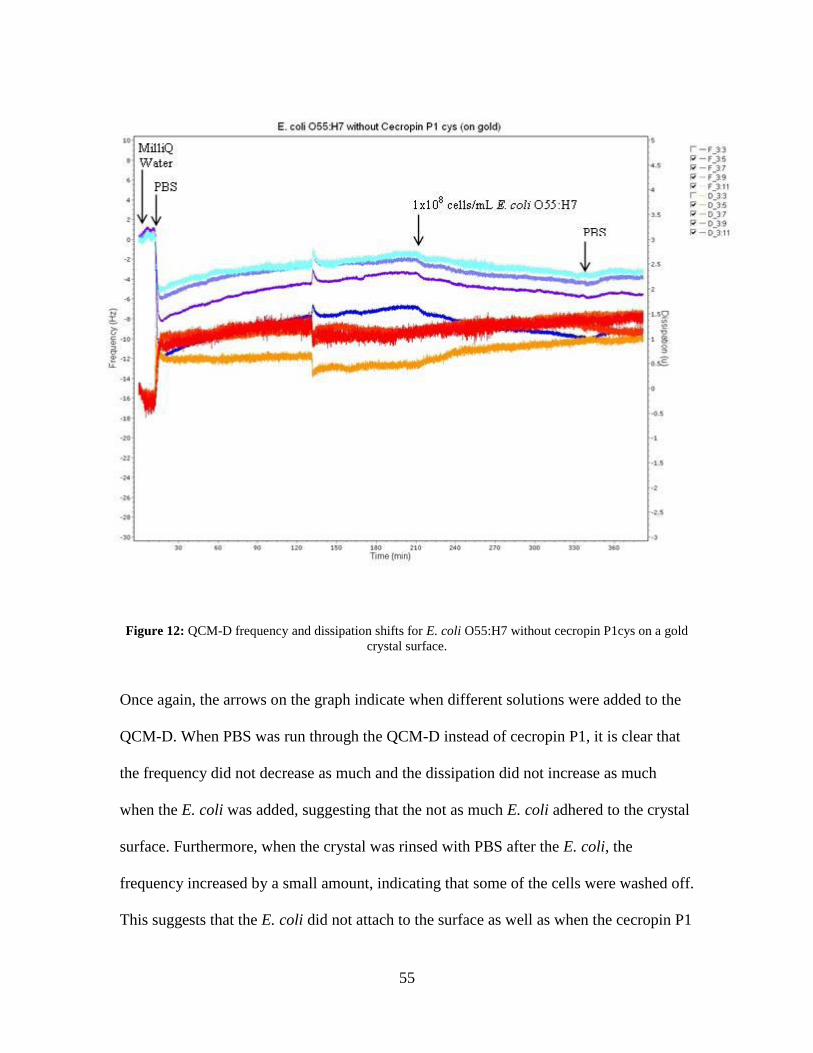
55
Figure 12: QCM-D frequency and dissipation shifts for E. coli O55:H7 without cecropin P1cys on a gold
crystal surface.
Once again, the arrows on the graph indicate when different solutions were added to the
QCM-D. When PBS was run through the QCM-D instead of cecropin P1, it is clear that
the frequency did not decrease as much and the dissipation did not increase as much
when the E. coli was added, suggesting that the not as much E. coli adhered to the crystal
surface. Furthermore, when the crystal was rinsed with PBS after the E. coli, the
frequency increased by a small amount, indicating that some of the cells were washed off.
This suggests that the E. coli did not attach to the surface as well as when the cecropin P1
56
was bound to the gold crystal first. These frequency and dissipation changes were similar
for all of the other QCM-D experiments conducted without cecropin P1, and these graphs
can be observed in Appendix A.
The frequency and dissipation changes observed in the QCM-D plots were measured and
recorded for all experiments, and the shifts for every solution change can be seen in
Appendix B. The most important frequency and dissipation measurements were the shifts
once the E. coli was added, because these showed whether more E. coli cells adhered to
the surfaces with bound cecropin P1 cys than the surfaces without the AMP.
-40.0
-35.0
-30.0
-25.0
-20.0
-15.0
-10.0
-5.0
0.0
5.0
HB101
O26:K60:H
11
O35:K-:H
10
O55:H7
O113:H4
O113:H21
O117:K98:H
4
O157:H7
O157:H12
O157:H16
O172:K-:H
-
E. coli Serotype
Fre
qu
en
cy
Ch
an
ge
(H
z)
With CP1 No CP1
Figure 13: Bar graph of measured frequency shift measured in QCM-D plots when E.coli was added, with
and without cecropin P1 bound to the gold crystal surface. Note that the error bars represent the standard
deviation.
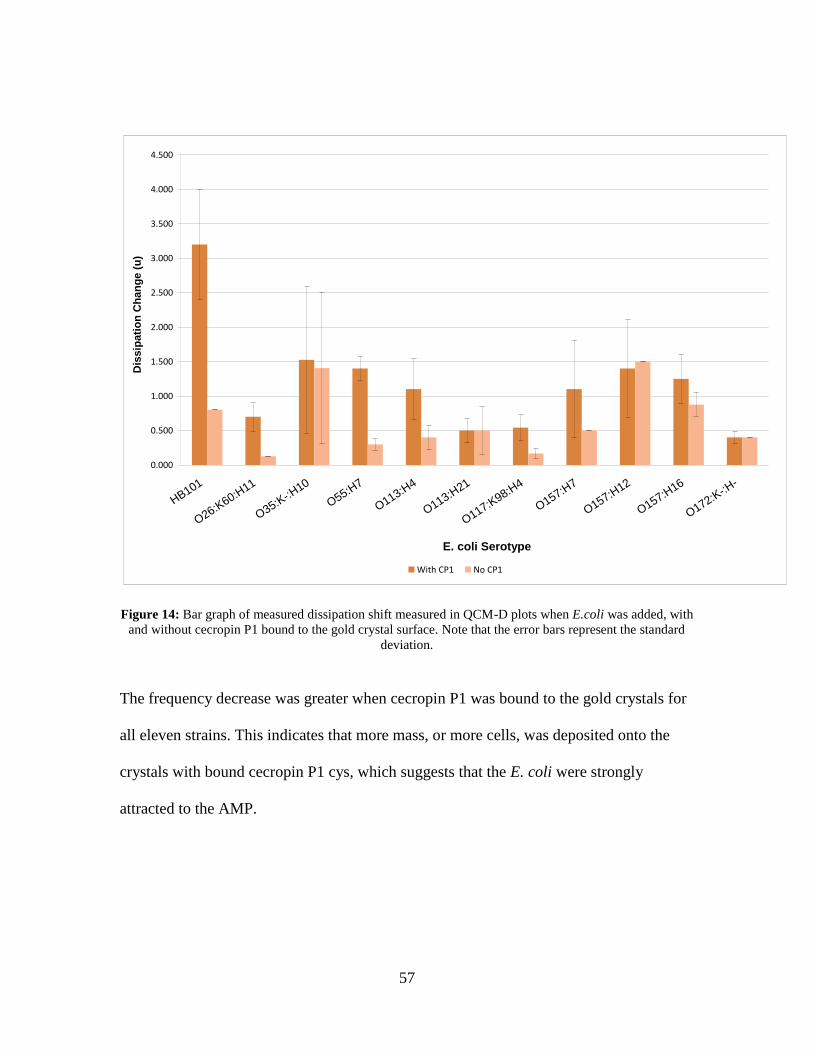
57
0.000
0.500
1.000
1.500
2.000
2.500
3.000
3.500
4.000
4.500
HB101
O26:K60:H
11
O35:K-:H
10
O55:H7
O113:H4
O113:H21
O117:K98:H
4
O157:H7
O157:H12
O157:H16
O172:K-:H
-
E. coli Serotype
Dis
sip
ati
on
Ch
an
ge
(u
)
With CP1 No CP1
Figure 14: Bar graph of measured dissipation shift measured in QCM-D plots when E.coli was added, with
and without cecropin P1 bound to the gold crystal surface. Note that the error bars represent the standard
deviation.
The frequency decrease was greater when cecropin P1 was bound to the gold crystals for
all eleven strains. This indicates that more mass, or more cells, was deposited onto the
crystals with bound cecropin P1 cys, which suggests that the E. coli were strongly
attracted to the AMP.
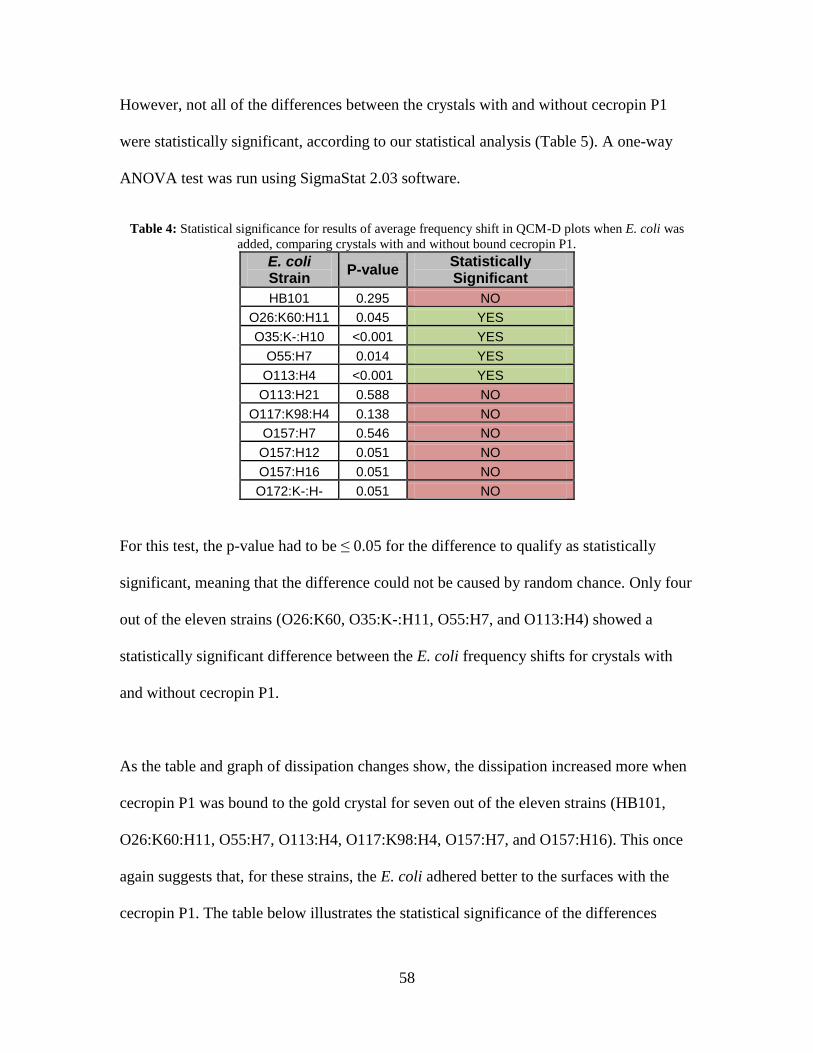
58
However, not all of the differences between the crystals with and without cecropin P1
were statistically significant, according to our statistical analysis (Table 5). A one-way
ANOVA test was run using SigmaStat 2.03 software.
Table 4: Statistical significance for results of average frequency shift in QCM-D plots when E. coli was
added, comparing crystals with and without bound cecropin P1.
E. coli Strain
P-value Statistically Significant
HB101 0.295 NO
O26:K60:H11 0.045 YES
O35:K-:H10 <0.001 YES
O55:H7 0.014 YES
O113:H4 <0.001 YES
O113:H21 0.588 NO
O117:K98:H4 0.138 NO
O157:H7 0.546 NO
O157:H12 0.051 NO
O157:H16 0.051 NO
O172:K-:H- 0.051 NO
For this test, the p-value had to be ≤ 0.05 for the difference to qualify as statistically
significant, meaning that the difference could not be caused by random chance. Only four
out of the eleven strains (O26:K60, O35:K-:H11, O55:H7, and O113:H4) showed a
statistically significant difference between the E. coli frequency shifts for crystals with
and without cecropin P1.
As the table and graph of dissipation changes show, the dissipation increased more when
cecropin P1 was bound to the gold crystal for seven out of the eleven strains (HB101,
O26:K60:H11, O55:H7, O113:H4, O117:K98:H4, O157:H7, and O157:H16). This once
again suggests that, for these strains, the E. coli adhered better to the surfaces with the
cecropin P1. The table below illustrates the statistical significance of the differences
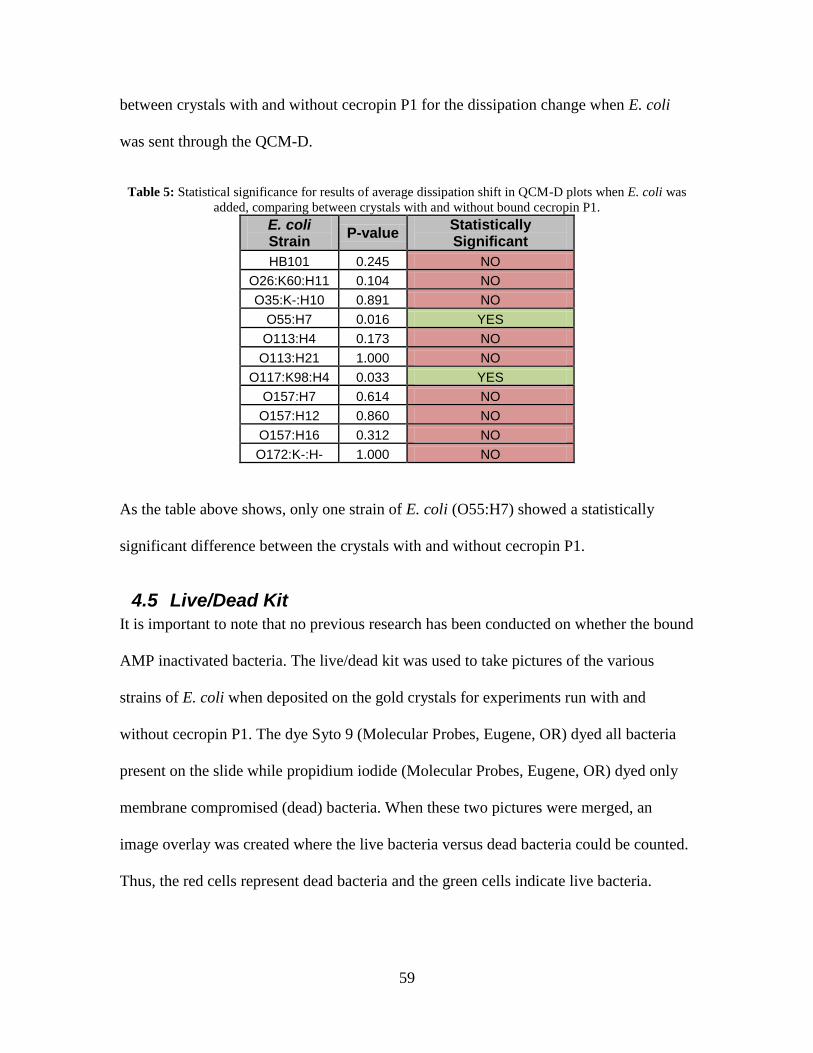
59
between crystals with and without cecropin P1 for the dissipation change when E. coli
was sent through the QCM-D.
Table 5: Statistical significance for results of average dissipation shift in QCM-D plots when E. coli was
added, comparing between crystals with and without bound cecropin P1.
E. coli Strain
P-value Statistically Significant
HB101 0.245 NO
O26:K60:H11 0.104 NO
O35:K-:H10 0.891 NO
O55:H7 0.016 YES
O113:H4 0.173 NO
O113:H21 1.000 NO
O117:K98:H4 0.033 YES
O157:H7 0.614 NO
O157:H12 0.860 NO
O157:H16 0.312 NO
O172:K-:H- 1.000 NO
As the table above shows, only one strain of E. coli (O55:H7) showed a statistically
significant difference between the crystals with and without cecropin P1.
4.5 Live/Dead Kit
It is important to note that no previous research has been conducted on whether the bound
AMP inactivated bacteria. The live/dead kit was used to take pictures of the various
strains of E. coli when deposited on the gold crystals for experiments run with and
without cecropin P1. The dye Syto 9 (Molecular Probes, Eugene, OR) dyed all bacteria
present on the slide while propidium iodide (Molecular Probes, Eugene, OR) dyed only
membrane compromised (dead) bacteria. When these two pictures were merged, an
image overlay was created where the live bacteria versus dead bacteria could be counted.
Thus, the red cells represent dead bacteria and the green cells indicate live bacteria.

60
Images, representative ones in Figure 13, which are of E. coli O117:K98:H4 with (top)
and without (bottom) cecropin P1, were yielded using this method.
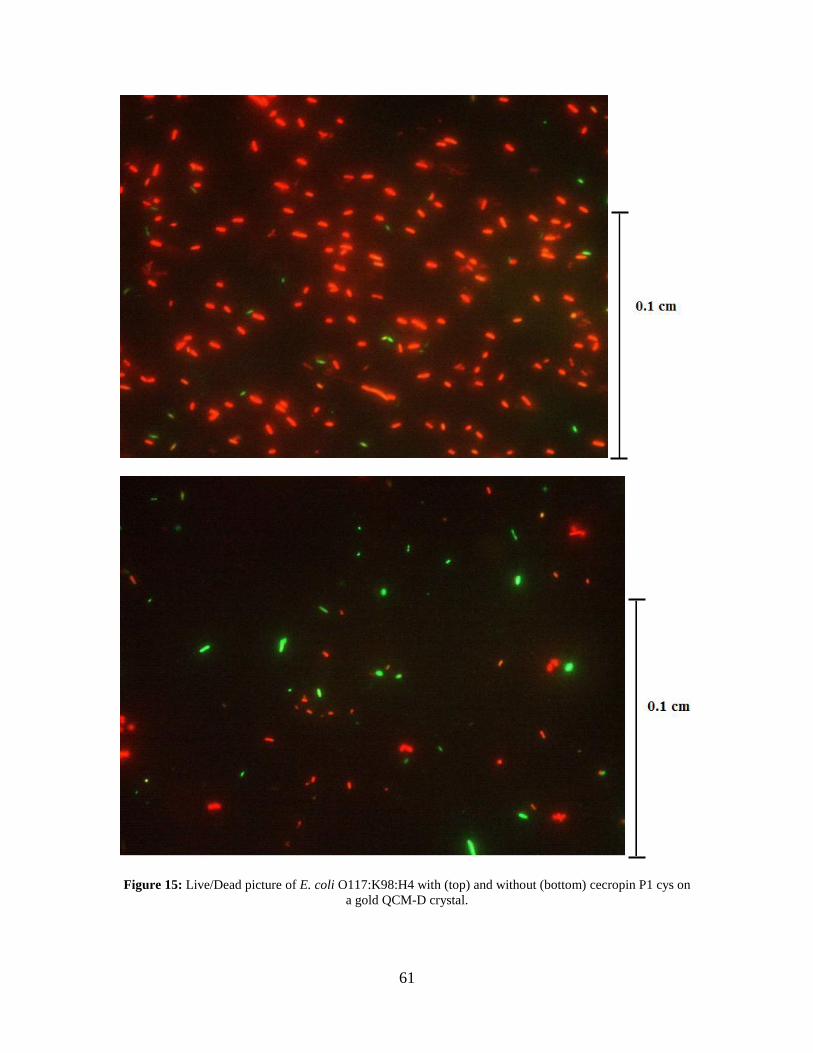
61
Figure 15: Live/Dead picture of E. coli O117:K98:H4 with (top) and without (bottom) cecropin P1 cys on
a gold QCM-D crystal.
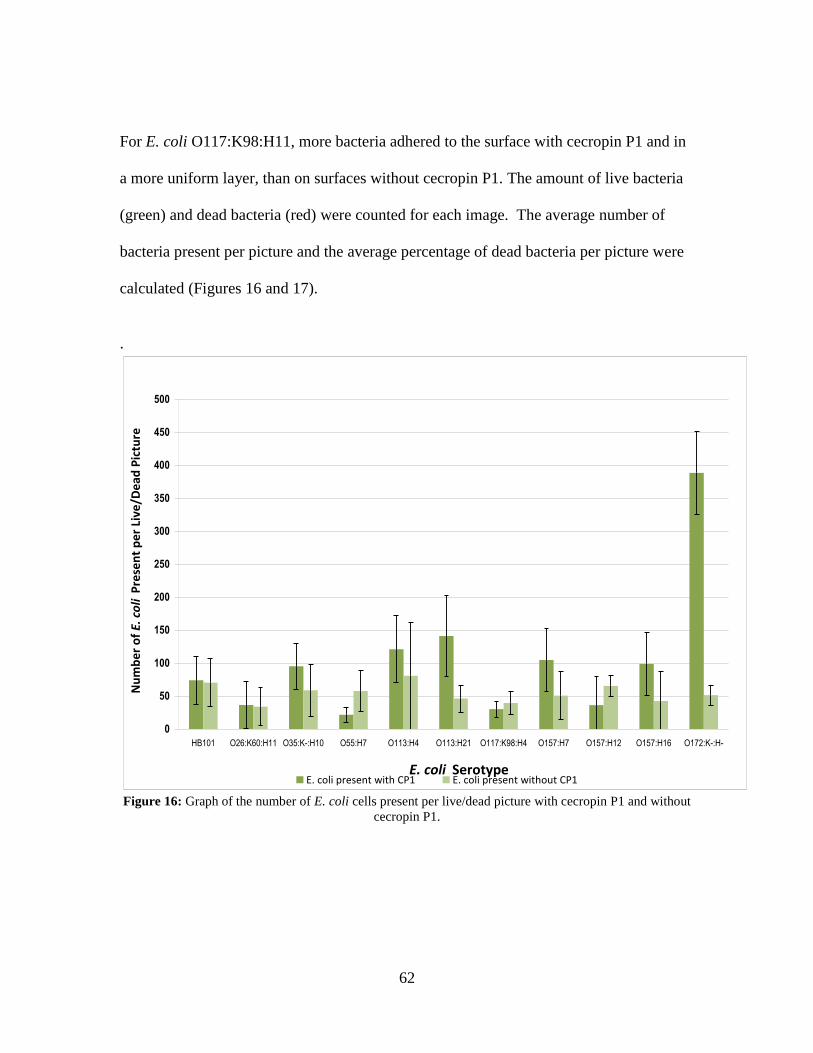
62
For E. coli O117:K98:H11, more bacteria adhered to the surface with cecropin P1 and in
a more uniform layer, than on surfaces without cecropin P1. The amount of live bacteria
(green) and dead bacteria (red) were counted for each image. The average number of
bacteria present per picture and the average percentage of dead bacteria per picture were
calculated (Figures 16 and 17).
.
0
50
100
150
200
250
300
350
400
450
500
HB101 O26:K60:H11 O35:K-:H10 O55:H7 O113:H4 O113:H21 O117:K98:H4 O157:H7 O157:H12 O157:H16 O172:K-:H-
E. coli Serotype
Nu
mb
er
of
E. c
oli
Pre
sen
t p
er
Live
/De
ad P
ictu
re
E. coli present with CP1 E. coli present without CP1
Figure 16: Graph of the number of E. coli cells present per live/dead picture with cecropin P1 and without
cecropin P1.

63
0
10
20
30
40
50
60
70
80
90
100
HB101 O26:K60:H11 O35:K-:H10 O55:H7 O113:H4 O113:H21 O117:K98:H4 O157:H7 O157:H12 O157:H16 O172:K-:H-
E. coli Serotype
% E
. co
li D
ead
% E. coli dead with CP1 % E. coli dead without CP1
Figure 17: Graph of percentage of E. coli cells dead per live/dead picture with cecropin P1 and without
cecropin P1.
One of the goals of this project was to examine the binding potential of different strains
of E. coli to the AMP cecropin P1. Nine out of the eleven strains of bacteria (O35:K-
:H10, O113:H21, O157:H7, O157:H16, O113:H4, HB101, O26:K60:H11, O117:K98:H4
and O172:K-:H-) yielded a higher amount of bacteria per picture present on the gold
crystal when cecropin P1 was used as opposed to control experiments in the absence of
cecropin P1. However, the amount of bacteria that bound to the cecropin P1 was not the
same for all of the strains. E. coli O172:K-:H- had the highest amount of bacteria present
with cecropin P1. Surprising results were those of E. coli O55:H7 and O157:H12, where
the experiments done without cecropin P1 yielded more bacteria per picture than the
experiments run with cecropin P1.
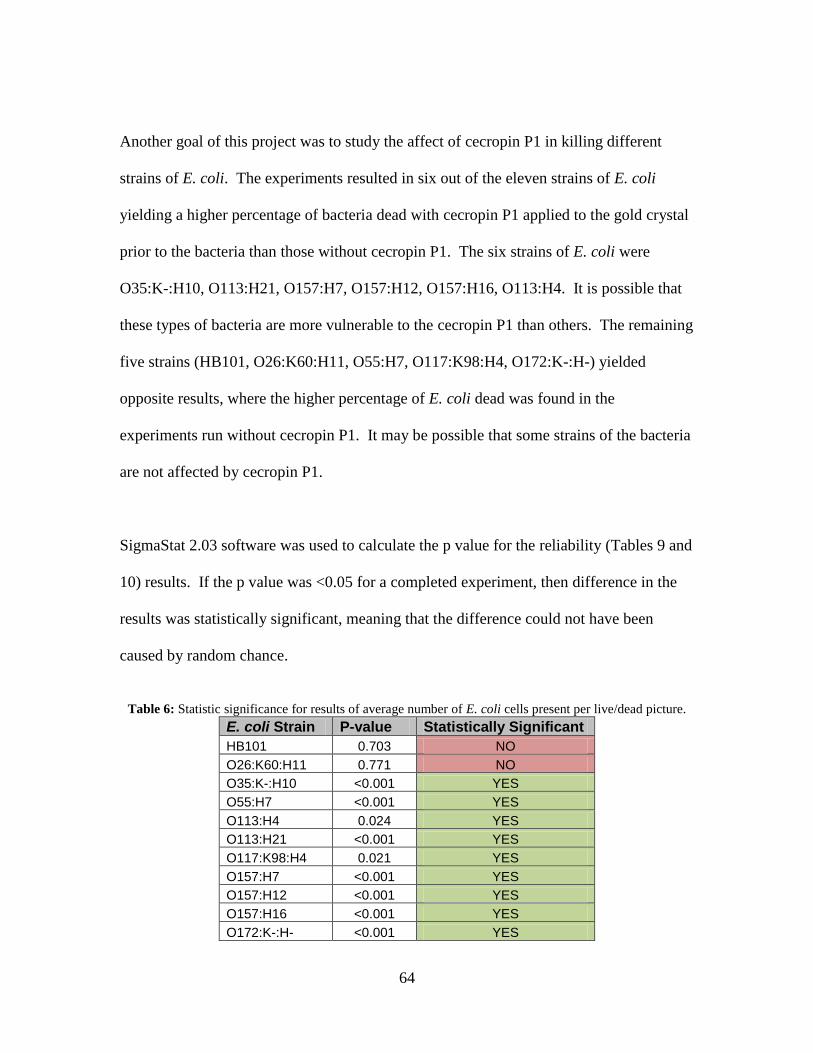
64
Another goal of this project was to study the affect of cecropin P1 in killing different
strains of E. coli. The experiments resulted in six out of the eleven strains of E. coli
yielding a higher percentage of bacteria dead with cecropin P1 applied to the gold crystal
prior to the bacteria than those without cecropin P1. The six strains of E. coli were
O35:K-:H10, O113:H21, O157:H7, O157:H12, O157:H16, O113:H4. It is possible that
these types of bacteria are more vulnerable to the cecropin P1 than others. The remaining
five strains (HB101, O26:K60:H11, O55:H7, O117:K98:H4, O172:K-:H-) yielded
opposite results, where the higher percentage of E. coli dead was found in the
experiments run without cecropin P1. It may be possible that some strains of the bacteria
are not affected by cecropin P1.
SigmaStat 2.03 software was used to calculate the p value for the reliability (Tables 9 and
10) results. If the p value was <0.05 for a completed experiment, then difference in the
results was statistically significant, meaning that the difference could not have been
caused by random chance.
Table 6: Statistic significance for results of average number of E. coli cells present per live/dead picture.
E. coli Strain P-value Statistically Significant
HB101 0.703 NO
O26:K60:H11 0.771 NO
O35:K-:H10 <0.001 YES
O55:H7 <0.001 YES
O113:H4 0.024 YES
O113:H21 <0.001 YES
O117:K98:H4 0.021 YES
O157:H7 <0.001 YES
O157:H12 <0.001 YES
O157:H16 <0.001 YES
O172:K-:H- <0.001 YES
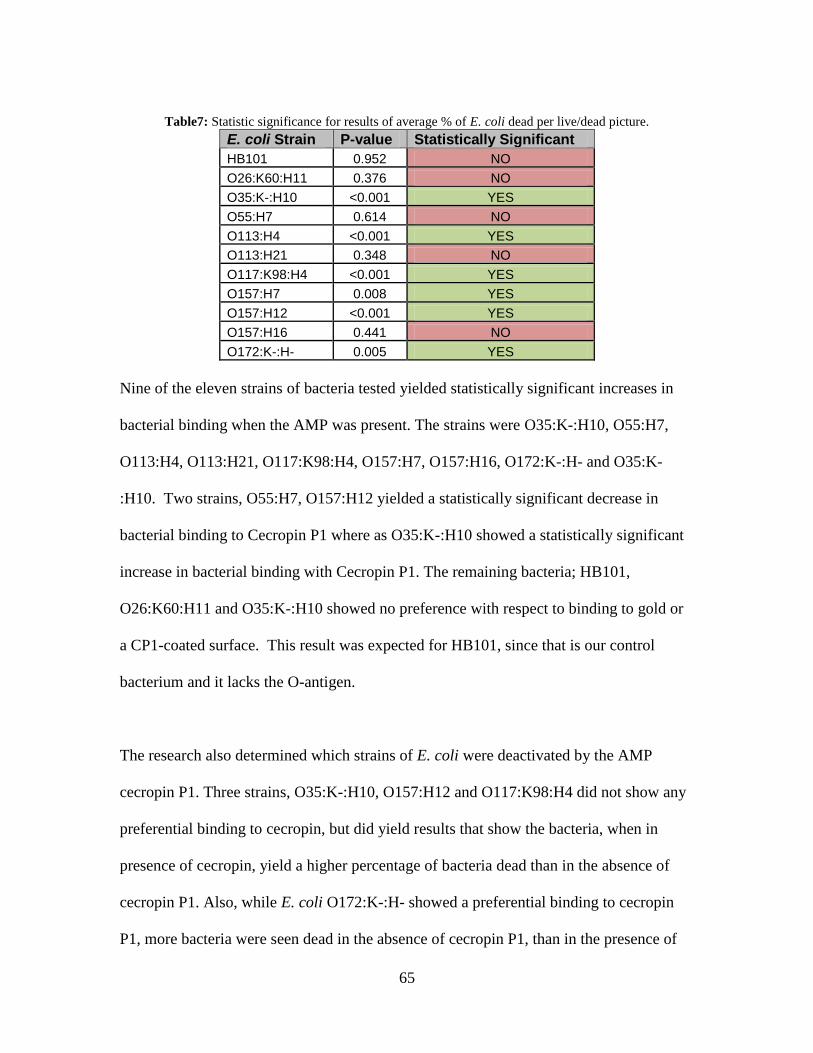
65
Table7: Statistic significance for results of average % of E. coli dead per live/dead picture.
E. coli Strain P-value Statistically Significant
HB101 0.952 NO
O26:K60:H11 0.376 NO
O35:K-:H10 <0.001 YES
O55:H7 0.614 NO
O113:H4 <0.001 YES
O113:H21 0.348 NO
O117:K98:H4 <0.001 YES
O157:H7 0.008 YES
O157:H12 <0.001 YES
O157:H16 0.441 NO
O172:K-:H- 0.005 YES
Nine of the eleven strains of bacteria tested yielded statistically significant increases in
bacterial binding when the AMP was present. The strains were O35:K-:H10, O55:H7,
O113:H4, O113:H21, O117:K98:H4, O157:H7, O157:H16, O172:K-:H- and O35:K-
:H10. Two strains, O55:H7, O157:H12 yielded a statistically significant decrease in
bacterial binding to Cecropin P1 where as O35:K-:H10 showed a statistically significant
increase in bacterial binding with Cecropin P1. The remaining bacteria; HB101,
O26:K60:H11 and O35:K-:H10 showed no preference with respect to binding to gold or
a CP1-coated surface. This result was expected for HB101, since that is our control
bacterium and it lacks the O-antigen.
The research also determined which strains of E. coli were deactivated by the AMP
cecropin P1. Three strains, O35:K-:H10, O157:H12 and O117:K98:H4 did not show any
preferential binding to cecropin, but did yield results that show the bacteria, when in
presence of cecropin, yield a higher percentage of bacteria dead than in the absence of
cecropin P1. Also, while E. coli O172:K-:H- showed a preferential binding to cecropin
P1, more bacteria were seen dead in the absence of cecropin P1, than in the presence of
66
the AMP. Therefore, while cecropin P1 has the ability to bind a certain strain of bacteria,
the ability to bind necessarily influence the effectiveness of killing the bacterium.
This means that binding alone cannot be used as a way to characterize the effectiveness
of an AMP against a potential pathogen. Three out of the six strains of bacteria that
bound to the cecropin P1 also yielded higher percentages of dead bacteria when the
cecropin P1 was present. These strains were O113:H4, O157:H7 and O35:K-:H10.
Therefore, using cecropin P1 with these three types of E. coli has the potential to be the
most successful method for binding and deactivating the bacteria. This result is
particularly exciting since E. coli O157:H7 is one of the most serious food borne
pathogens we face.
67
5 Conclusions and Recommendations Using the data obtained from both QCM-D plots and live/dead kit cell counts, the
following conclusions concerning how cecropin P1 affected cell adherence to the gold
crystal surface were made. Additionally, results from the live/dead kit were used to
determine the AMP’s effectiveness in killing each strain of E. coli. Finally,
recommendations on improving the procedure and future research are discussed in this
section.
5.1 Number of E. coli Cells Present on Gold Crystals
The two methods used to determine the presence of E. coli cells on the gold crystals,
QCM-D and live/dead kit, yielded results that did not always agree. In figure 18, the blue
points represent bacteria deposited on crystals with cecropin P1 while the pink points
represent bacteria deposited on crystals without cecropin P1.
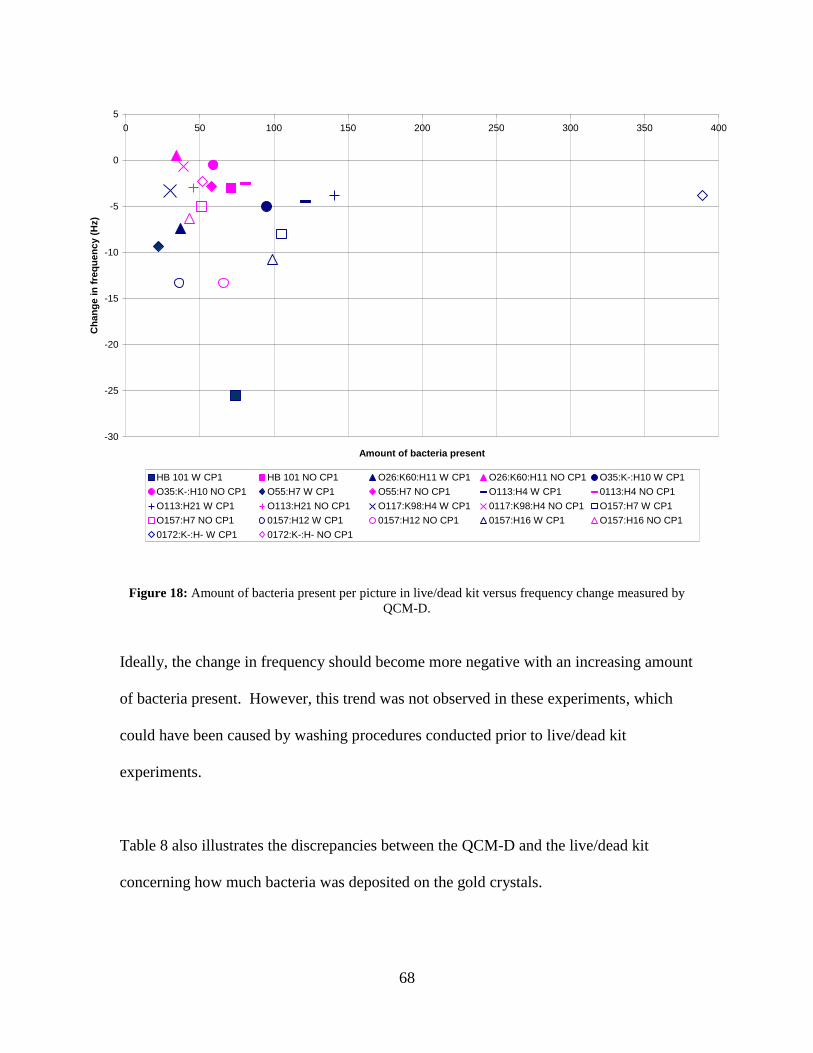
68
Figure 18: Amount of bacteria present per picture in live/dead kit versus frequency change measured by
QCM-D.
Ideally, the change in frequency should become more negative with an increasing amount
of bacteria present. However, this trend was not observed in these experiments, which
could have been caused by washing procedures conducted prior to live/dead kit
experiments.
Table 8 also illustrates the discrepancies between the QCM-D and the live/dead kit
concerning how much bacteria was deposited on the gold crystals.
-30
-25
-20
-15
-10
-5
0
5
0 50 100 150 200 250 300 350 400
Amount of bacteria present
Ch
an
ge
in
fre
qu
en
cy
(H
z)
HB 101 W CP1 HB 101 NO CP1 O26:K60:H11 W CP1 O26:K60:H11 NO CP1 O35:K-:H10 W CP1
O35:K-:H10 NO CP1 O55:H7 W CP1 O55:H7 NO CP1 O113:H4 W CP1 0113:H4 NO CP1
O113:H21 W CP1 O113:H21 NO CP1 O117:K98:H4 W CP1 0117:K98:H4 NO CP1 O157:H7 W CP1
O157:H7 NO CP1 0157:H12 W CP1 0157:H12 NO CP1 0157:H16 W CP1 O157:H16 NO CP1
0172:K-:H- W CP1 0172:K-:H- NO CP1
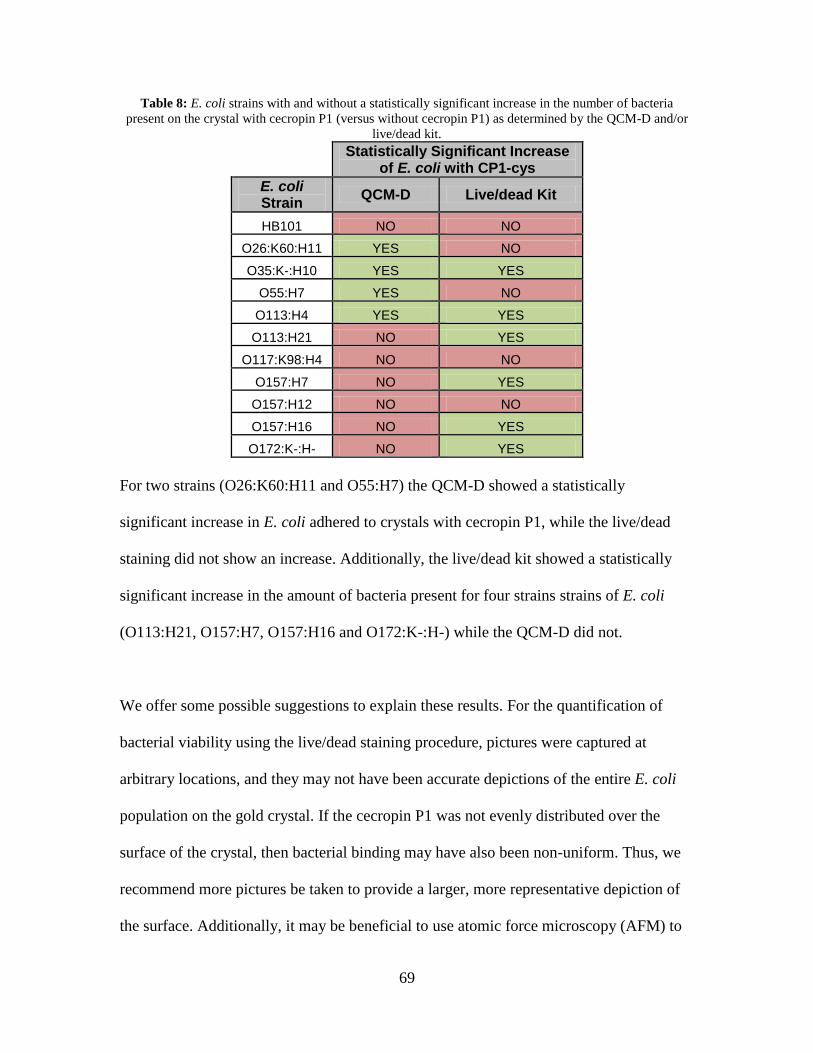
69
Table 8: E. coli strains with and without a statistically significant increase in the number of bacteria
present on the crystal with cecropin P1 (versus without cecropin P1) as determined by the QCM-D and/or
live/dead kit.
Statistically Significant Increase
of E. coli with CP1-cys
E. coli Strain
QCM-D Live/dead Kit
HB101 NO NO
O26:K60:H11 YES NO
O35:K-:H10 YES YES
O55:H7 YES NO
O113:H4 YES YES
O113:H21 NO YES
O117:K98:H4 NO NO
O157:H7 NO YES
O157:H12 NO NO
O157:H16 NO YES
O172:K-:H- NO YES
For two strains (O26:K60:H11 and O55:H7) the QCM-D showed a statistically
significant increase in E. coli adhered to crystals with cecropin P1, while the live/dead
staining did not show an increase. Additionally, the live/dead kit showed a statistically
significant increase in the amount of bacteria present for four strains strains of E. coli
(O113:H21, O157:H7, O157:H16 and O172:K-:H-) while the QCM-D did not.
We offer some possible suggestions to explain these results. For the quantification of
bacterial viability using the live/dead staining procedure, pictures were captured at
arbitrary locations, and they may not have been accurate depictions of the entire E. coli
population on the gold crystal. If the cecropin P1 was not evenly distributed over the
surface of the crystal, then bacterial binding may have also been non-uniform. Thus, we
recommend more pictures be taken to provide a larger, more representative depiction of
the surface. Additionally, it may be beneficial to use atomic force microscopy (AFM) to
70
characterize the surface roughness, which can be related to the coverage of both E. coli
and cecropin P1 deposited on each surface.
Despite the exhibited discrepancies, both methods showed that both E. coli O113:H4 and
E. coli O35:K-:H10 exhibited a statistically significant increase in bacterial cells
deposited on the crystal surface with cecropin P1 compared to crystals without the AMP.
Thus, these experiments confirm that O113:H4 and O35:K-:H10 adhered to cecropin P1.
One goal of these experiments was to determine which portion of the E. coli
lipopolysaccharide interacted with cecropin P1. One theory was that the number of sugars
in the LPS might affect the binding capabilities of the bacteria, but this was not shown by
the data. Of the two strains that most clearly adhered to the cecropin were E. coli
O113:H4 and O35:K-:H10, the former has an indeterminable sugar backbone, while the
latter has a five sugar backbone. Of the strains that exhibited preferential binding either in
QCM-D experiments or through the live/dead kit, all had LPS backbones made up of
various numbers of sugars, and thus no relationship between the number of sugars and
binding efficiency was found. However, there was a difference between HB101, the
laboratory strain without an O-antigen, and the majority of the pathogenic strains with an
O-antigen. HB101 did not exhibit preferential binding with cecropin P1 in the QCM-D or
live/dead kit experiments, indicating that it did not adhere to crystals with cecropin P1
any better than those without the AMP. This suggests that cecropin P1 may bind with
some portion of the O-antigen, but the location has yet to be determined.
71
5.2 Percentage of E. coli Dead
The primary purpose of the live/dead kit was to determine the percentage of dead E. coli
found on the gold crystals with and without exposure to cecropin P1. Four strains
(O35:K-:H10, O157:H7, O157:H12 and O113:H4) showed a statistically significant
increase in the percentage of dead bacteria on the crystals with cecropin P1, compared to
those without the AMP. Of those four strains, O157:H12 did not show preferential
binding to cecropin P1 crystals in either the QCM-D or live/dead experiments. O157:H7
showed preferential binding to crystals with cecropin P1 in live/dead experiments, but not
in those using the QCM-D. Thus, for these three strains, it can be concluded that even
though the adherence mechanism is not fully known or understood, the AMPs are
effective in killing these particular types of E.coli.
However, E. coli O113:H4 and O35:K-:H10 indicated preferential binding in both QCM-
D and live/dead experiments and also showed an increase in the percentage of bacteria
dead on gold crystals where cecropin P1 was bound to the surface. Therefore, it can be
concluded that, out of the eleven strains, E. coli O113:H4 and O35:K-:H10 were bound
by cecropin P1 and also killed by the AMP. As stated previously, O113:H4 is categorized
as verotoxin producing E. coli, which can lead to hemorrhaging of the intestinal tract and
blood clotting disorders, and although O35:K-:H10 is less common, it still can cause food
contamination and cause illness in humans. The results of this project show potential for
cecropin P1’s activity against E. coli, and therefore further experimentation should be
conducted to definitively determine if cecropin P1 adheres and kills the remaining strains.
72
6 References
An, Y.H. and Friedman, R.J. 1998. Concise Review of Mechanisms of Bacterial
Adhesion. Journal of Biomedical Research; 43: 338-348
Beveridge, T.J. 1999. Structures of Gram-Negative Cell Walls and Their Derived
Membrane Vesicles. Journal of Bacteriology; 181: 4725-4733
Beveridge, T.J. and Graham, L.L. 1991. Surface Layers of Bacteria. Microbiological
Reviews; 55: 684-705
Boman, H.G., Agerberth, B., and Boman, A. 1993. Mechanisms of Action on
Escherichia coli of Cecropin P1 and PR-39, Two Antimicrobial Peptides from
Pig Intestine. Infection and Immunity; 61: 2978-2984
Brogden, K.A., Ackermann, M., McCray Jr., P.B., and Tack, B.F. 2003. Antimicrobial
peptides in animals and their role in host defenses. International Journal of
Antimicrobial Agents; 22: 465-478
Bulet, P., Hetru, C., Dimarcq, J., and Hoffman, D. 1999. Antimicrobial peptides in
insects; structure and function. Developmental and Comparative Immunology;
23: 329-344
Caroff, M., and Karibian, D. 2003. Structure of bacterial lipopolysaccharides.
Carbohydrate Research; 338: 2431-2447
Carter, R.M., Mekalanos, J.J., Jacobs, M.B., Lubrano, G.J., and Guilbault, G.G. 1995.
Quartz crystal microbalance detection of Vibrio cholera O139 serotype.
Journal of Immunological Methods; 187: 121-125
Center for Disease Control and Prevention. 1994. Addressing Emerging Infectious
Disease Threats: A Prevention Strategy for the United States. U.S. Dept.
Health and Human Services, Public Health Service, Atlanta, GA, USA
Center for Disease Control and Prevention. Multistate Outbreak of E. Coli O157
Infections Linked to Topp's Brand Ground Beef Patties. 26 Oct. 2007.
http://www.cdc.gov/ecoli/2007/october/100207.html
Center for Disease Control and Prevention (CDC). Multistate Outbreak of E. coli O157
Infections, November-December 2006. 14 Dec 2006.
http://www2a.cdc.gov/HAN/ArchiveSys/ViewMsgV.asp?AlertNum=00255
73
Center for Disease Control and Prevention (CDC). Update of Multi-State Outbreak of
E.coli O157:H7 Infections from Fresh Spinach. 6 Oct 2006.
http://www.cdc.gov/ecoli/2006/september/updates/100606.htm
Epand, R. and Vogel, H. 1999. Diversity of Antimicrobial Peptides and their
Mechanisms of Action. Biochimica et Biophysics Acta; 1462: 11-28
Fredriksson, C., Kihlman, S., Rodahl, M., and Kasemo, B. 1998. The Piezoelectric
Quartz Crystal Mass and Dissipation Sensor: A Means of Studying Cell
Adhesion. Langmuir; 14: 249-251
Hancock, R.E. and Diamond, G. 2000. The Role of Cationic Antimicrobial Peptides in
Innate Host Defenses. Trends Microbiol; 8: 402-410
Höök, F., Rodahl, M., Brzezinski, P., and Kasemo, B. 1998. Energy Dissipation
Kinetics for Protein and Antibody-Antigen Adsorption under Shear
Oscillation on a Quartz Crystal Microbalance. Langmuir; 14: 729-734
Izadpanah, A. and Galla, R.L. 2005. Antimicrobial Peptides. Continuing Medical
Education: Journal of the American Academy of Dermatology; 25: 381-390
Jenkins, M., Horsfall, M., Mathew, D., Scanlon M., Jayasekara, R. and Lonergan, G.
2004. Application of a Quartz Crystal Microbalance to Evaluate
Biodegradability of Starch by Bacillus Subtilis. Biotechnology Letters; 26:
1095-1099
Jensen, H., and Unnevehr, L. 1995. The economics of regulation and information
related to foodborne microbial pathogens. Tracking Foodborne Pathogens
from Farm to Table: Data Needs to Evaluate Control Options, USDA, Economic
Research Service, Food and Consumer Economics Division; 125-133
Kwon, K.D., Green H., Bjöörn, P., and Kubicki, J.D. 2006. Model Bacterial
Extracellular Polysachharide Adsorption Onto Silica and Alumina: Quartz
Crystal Microbalance with Dissipation Monitoring of Dextran Adsorption. Environmental Science & Technology; 40: 7739-7744
Miller, A.J., Smith, J.L., and Buchanan, R.L. 1998. Factors affecting the emergence of
new pathogens and research strategies leading to their control. Journal of
Food Safety; 18: 243-263
Mouenuddin, M., Wachsmuth, I.K., Moseley, S.L., Bopp, C.A., and Blake, P.A. 1989.
Serotype, Antimicrobial Resistance, and Adherence Properties of Escherichia
coli Strains Associated with Outbreaks of Diarrheal Illness in Children in the
United States. Journal of Clinical Microbiology; 27: 2234-2239
74
Otto, K., Elwing, O., and Hermansson, M. 1999. Effect of Ionic Strength on Initial
Interactions of Escherichia coli with Surfaces, Studied On-Line by a Novel
Quartz Crystal Microbalance Technique. Journal of Bacteriology; 181: 5210-
5218
Q-Sense, Inc. 2007. QCM-D Basic Training Course. The New Jersey Center for
Biomaterials, Rutgers University
Reddy, K.V.R., Yedery, R.D., and Aranha, C. 2004. Antimicrobial Peptides: Premises
and Promises. International Journal of Antimicrobial Agents; 24: 536-547
Rodahl, M., Höök, F., Fredriksson, C., Keller, C.A., Krozer, A., Brzezinski, P., Voinova,
M., and Kasemo, B. 1997. Simultaneous frequency and dissipation factor
QCM measurements of biomolecular adsorption and cell adhesion. Faraday
Discussions; 107: 229-246
Rosenfeld, Y., Shai, Y. 2006. Lipopolysaccaride (Endotoxin)- Host Defense
Antibacterial Peptides Interaction: Role in Bacterial Resistance and
Prevention of Sepsis. Biochimica er Biophysics Acta; 1756: 1513-1522
Sauerbrey, G. 1959. Verwendung von Schwingquarzen zur Wägung Dünner
Schichten und zur Mikrowägung. Zeitschrift für Physik; 155: 206–222
Schofield, A.L., Rudd, T.R., Martin, D.S., Fernig, D.G., and Edwards, C. 2007. Real-
time monitoring of the development and stability of biofilms of Streptococcus
mutans using the quartz crystal microbalance with dissipation monitoring.
Biosensors and Bioelectronics; 23: 407-413
Scott, M.G., Vreugdenhil, A.C., Buurman, W.A., Hancock, R.E., and Gold, M.R. 2000.
Cutting Edge: Cationic Antimicrobial Peptides Block the Binding of
Lipopolysaccharide (LPS) to LPS Binding Protein. J. Immunology; 164: 549-
553
Shai, Y. 1999. Mechanism of the binding, insertion, and destabilization of
phospholipids bilayer membranes by α-helical antimicrobial and cell non-
selective membrane-lytic peptides. Biochimica et Biophysica Acta; 1462: 55-70
Stephan, R., Ragettli, S. and Untermann, F. 2000. Prevalence and characteristics of
verotoxin-producing Echerichia coli (VTEC) in stool samples from
asymptomatic human carriers working in the meat processing industry in
Switzerland. Journal of Applied Microbiology; 82: 335-341.
Vunnam, S., Juvvadi, P., and Merrifield, R.B. 1997. Synthesis and antibacterial action
of cecropin and proline-arginine-rich peptides from pig intestine. The Journal
of Peptide Research; 49: 59-66
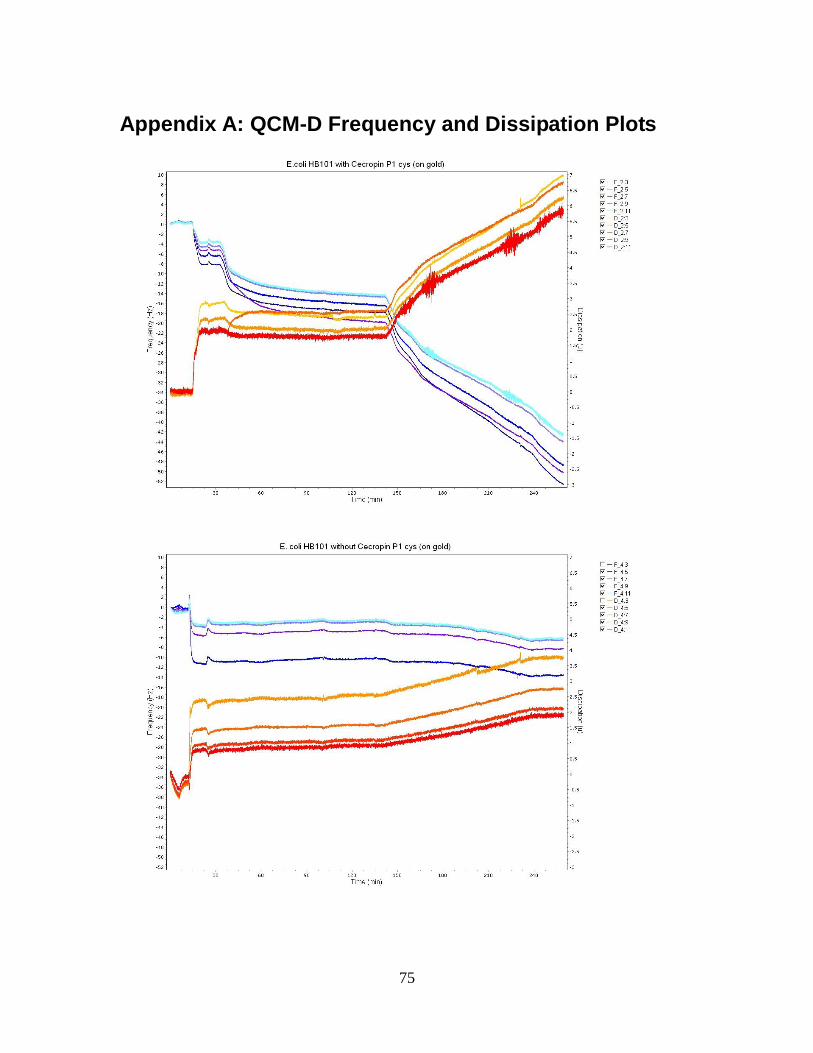
75
Appendix A: QCM-D Frequency and Dissipation Plots

76
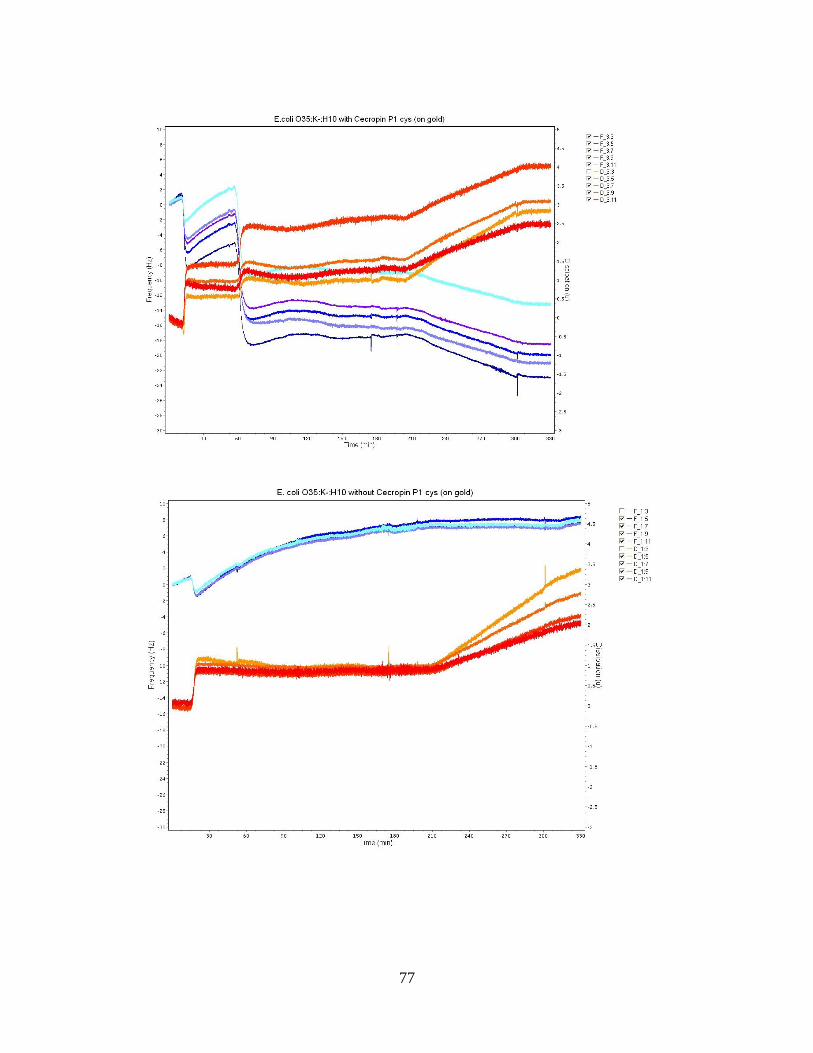
77
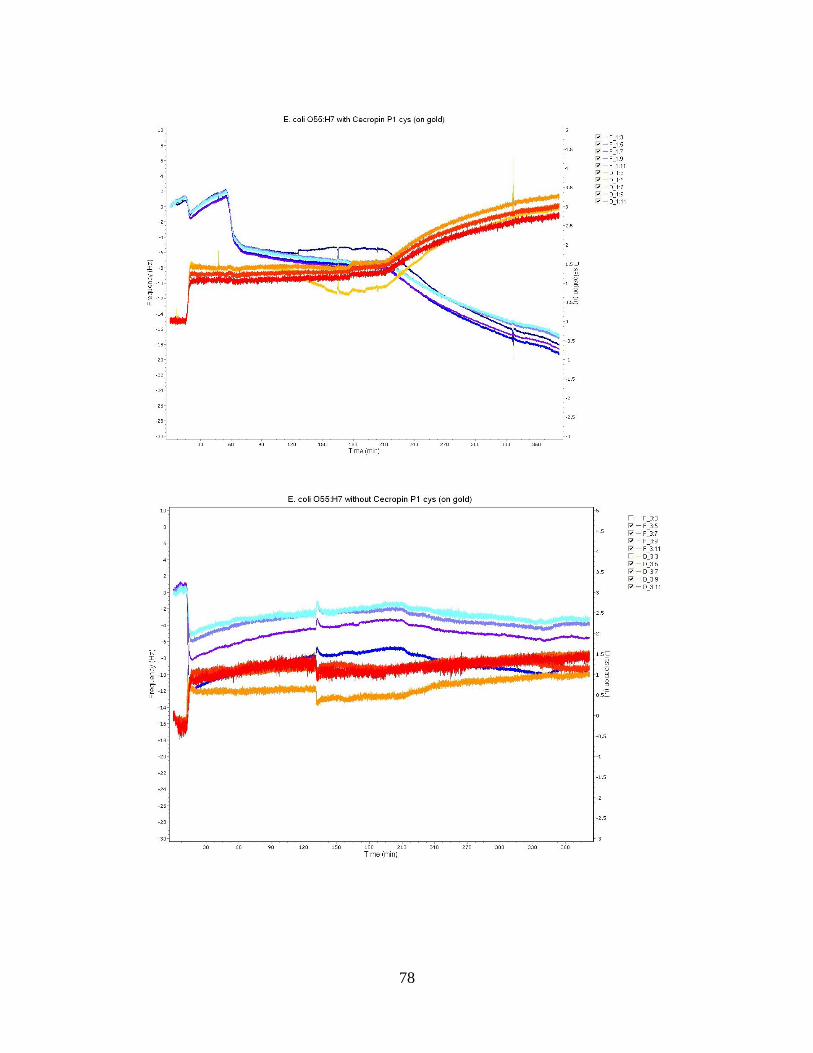
78
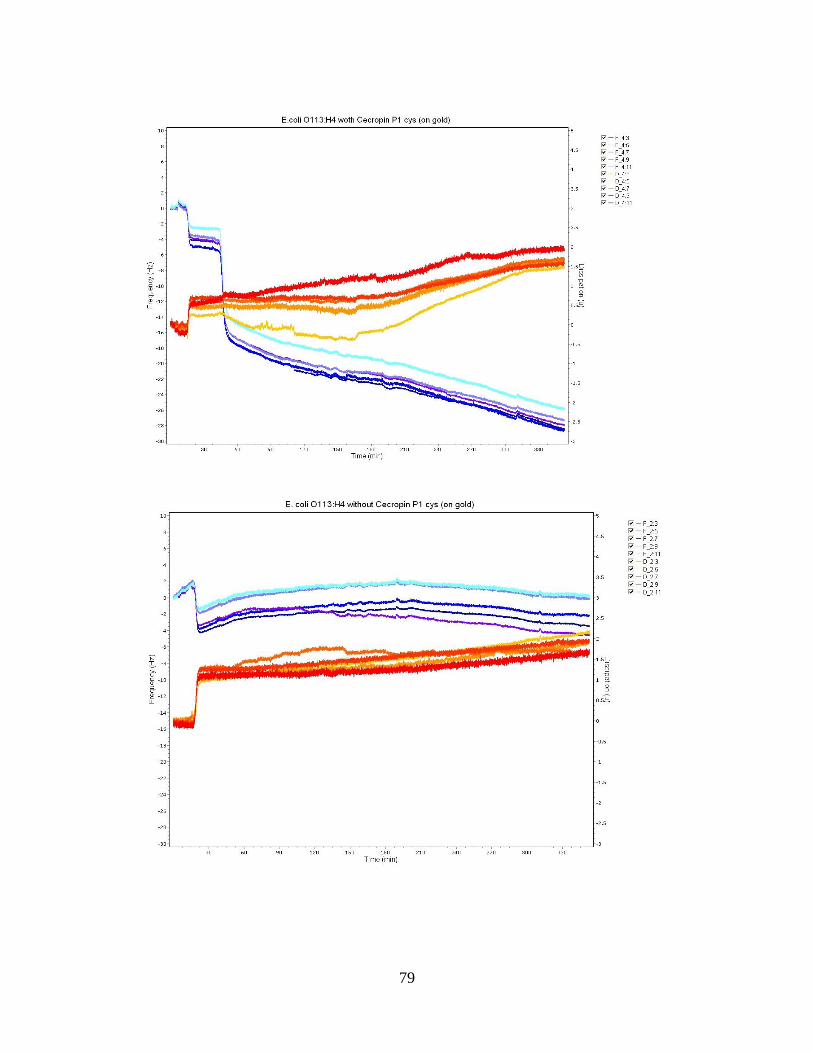
79
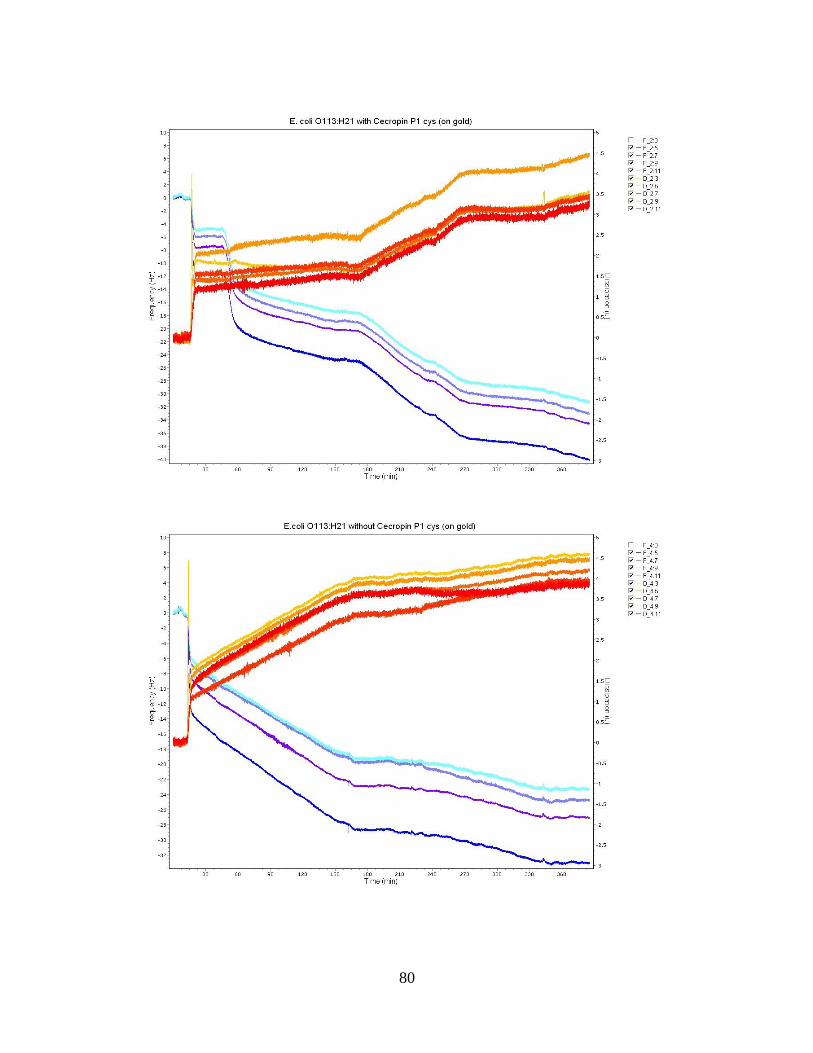
80
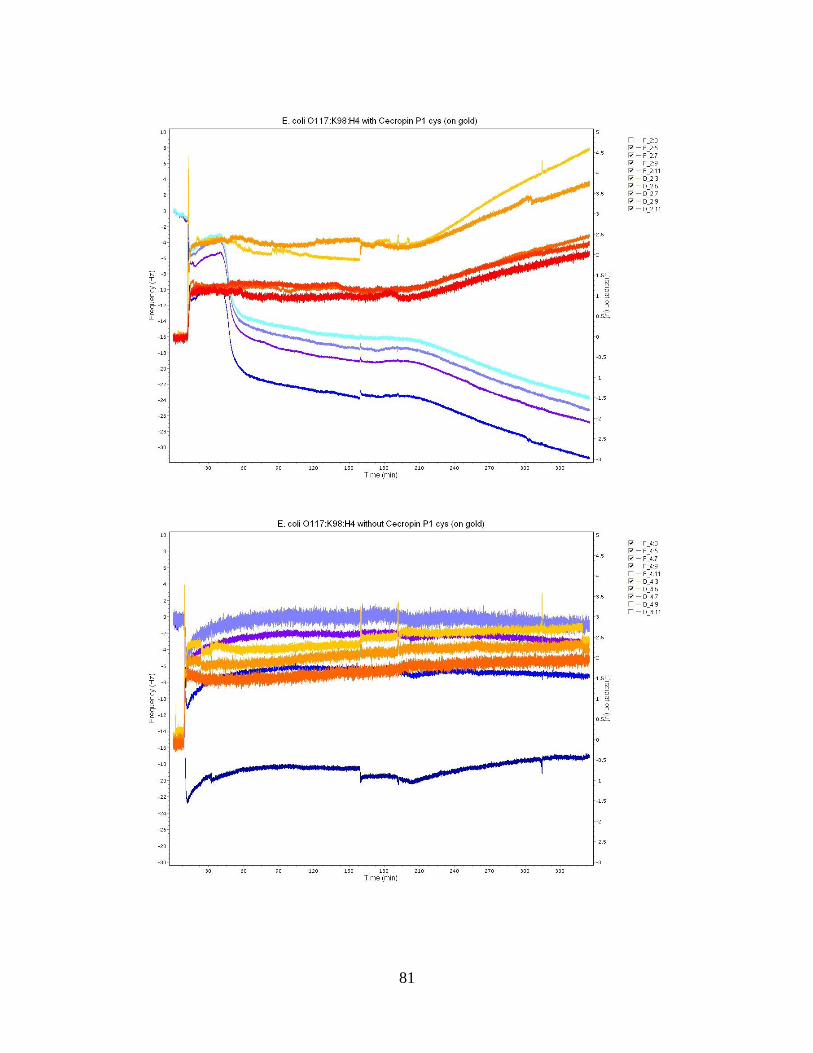
81
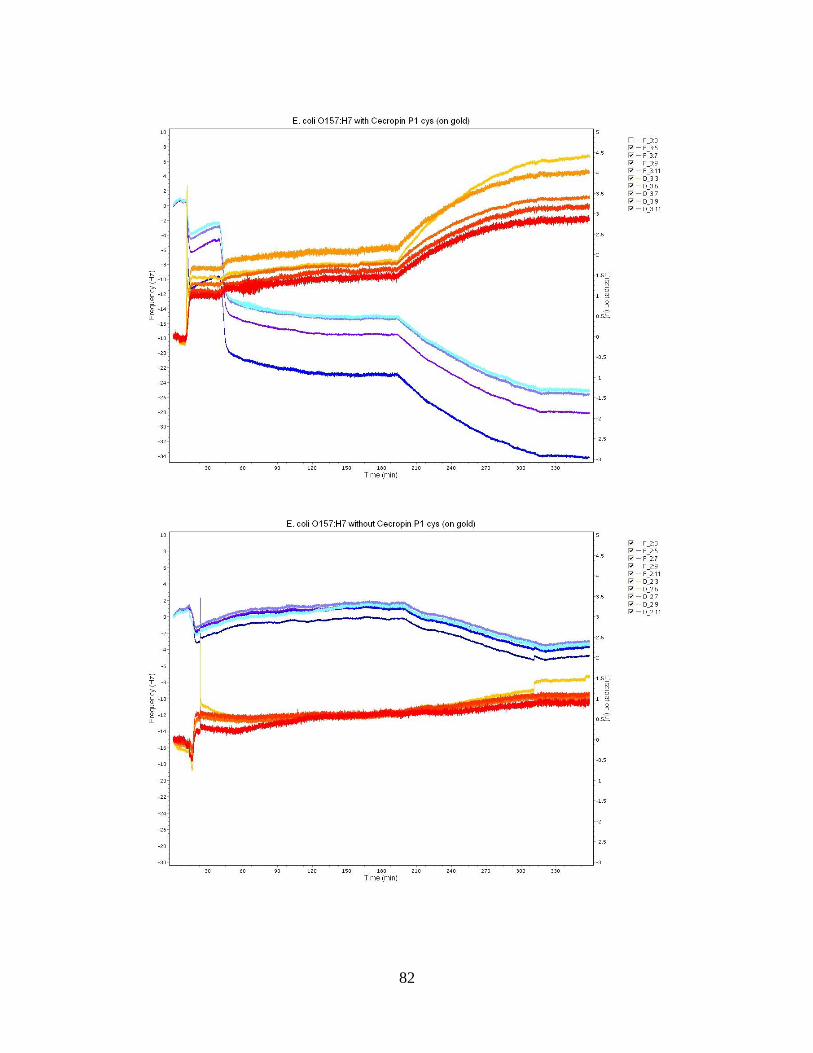
82

83
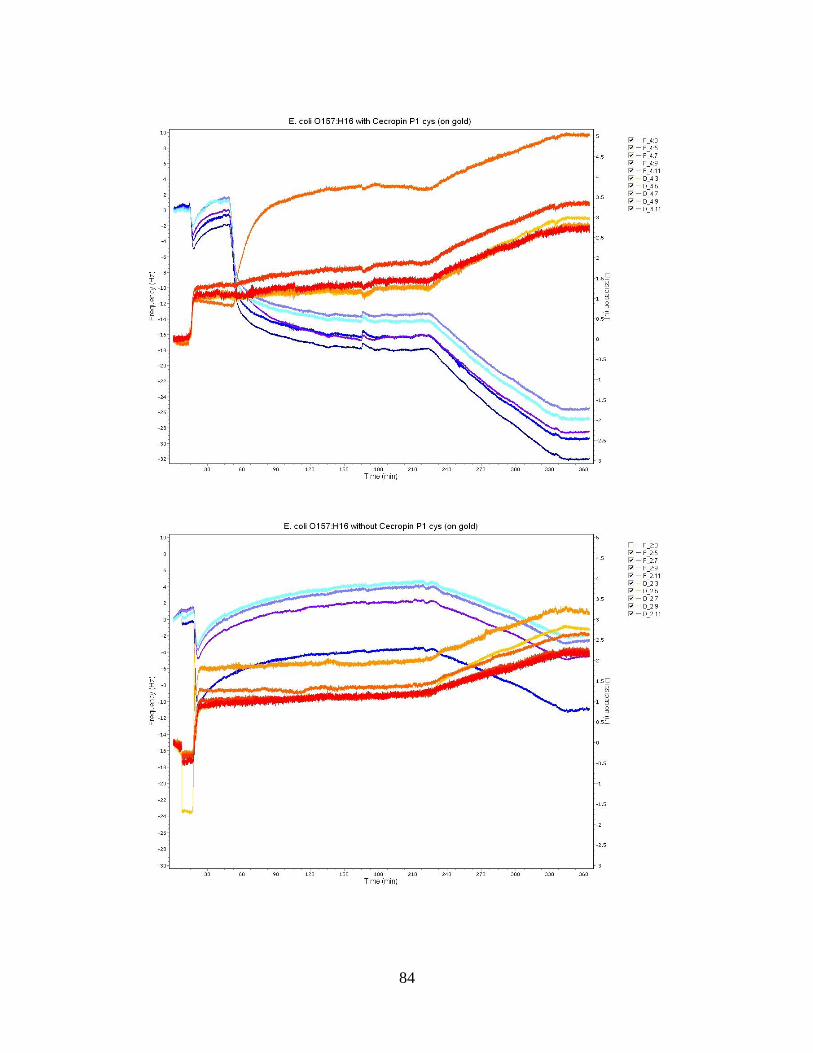
84
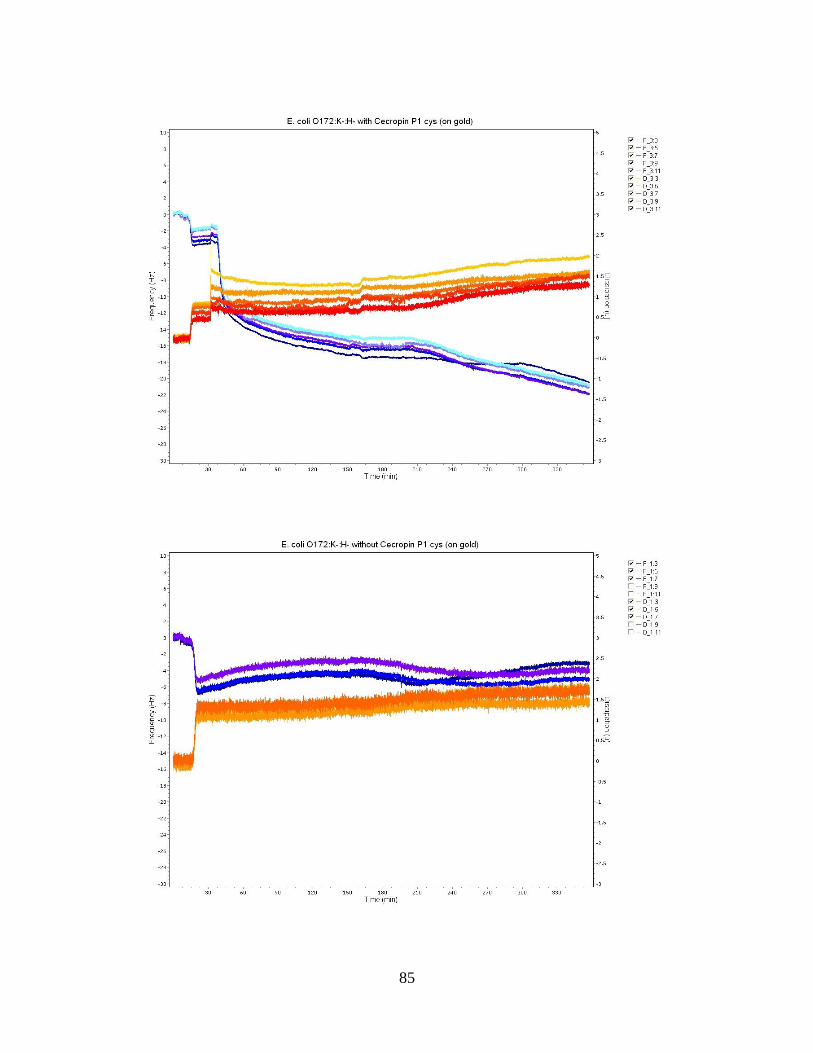
85
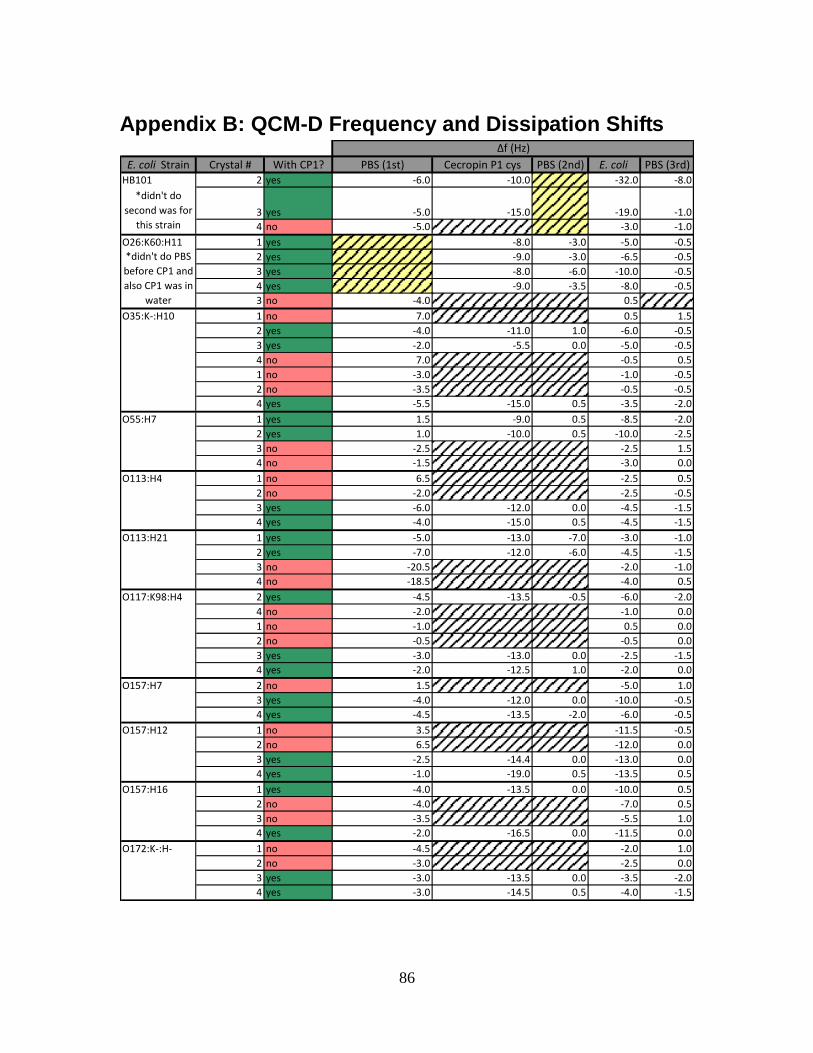
86
Appendix B: QCM-D Frequency and Dissipation Shifts
E. coli Strain Crystal # With CP1? PBS (1st) Cecropin P1 cys PBS (2nd) E. coli PBS (3rd)HB101 2 yes -6.0 -10.0 -32.0 -8.0
3 yes -5.0 -15.0 -19.0 -1.0
4 no -5.0 -3.0 -1.0
O26:K60:H11 1 yes -8.0 -3.0 -5.0 -0.5
2 yes -9.0 -3.0 -6.5 -0.5
3 yes -8.0 -6.0 -10.0 -0.5
4 yes -9.0 -3.5 -8.0 -0.5
3 no -4.0 0.5
O35:K-:H10 1 no 7.0 0.5 1.5
2 yes -4.0 -11.0 1.0 -6.0 -0.5
3 yes -2.0 -5.5 0.0 -5.0 -0.5
4 no 7.0 -0.5 0.5
1 no -3.0 -1.0 -0.5
2 no -3.5 -0.5 -0.5
4 yes -5.5 -15.0 0.5 -3.5 -2.0
O55:H7 1 yes 1.5 -9.0 0.5 -8.5 -2.0
2 yes 1.0 -10.0 0.5 -10.0 -2.5
3 no -2.5 -2.5 1.5
4 no -1.5 -3.0 0.0
O113:H4 1 no 6.5 -2.5 0.5
2 no -2.0 -2.5 -0.5
3 yes -6.0 -12.0 0.0 -4.5 -1.5
4 yes -4.0 -15.0 0.5 -4.5 -1.5
O113:H21 1 yes -5.0 -13.0 -7.0 -3.0 -1.0
2 yes -7.0 -12.0 -6.0 -4.5 -1.5
3 no -20.5 -2.0 -1.0
4 no -18.5 -4.0 0.5
O117:K98:H4 2 yes -4.5 -13.5 -0.5 -6.0 -2.0
4 no -2.0 -1.0 0.0
1 no -1.0 0.5 0.0
2 no -0.5 -0.5 0.0
3 yes -3.0 -13.0 0.0 -2.5 -1.5
4 yes -2.0 -12.5 1.0 -2.0 0.0
O157:H7 2 no 1.5 -5.0 1.0
3 yes -4.0 -12.0 0.0 -10.0 -0.5
4 yes -4.5 -13.5 -2.0 -6.0 -0.5
O157:H12 1 no 3.5 -11.5 -0.5
2 no 6.5 -12.0 0.0
3 yes -2.5 -14.4 0.0 -13.0 0.0
4 yes -1.0 -19.0 0.5 -13.5 0.5
O157:H16 1 yes -4.0 -13.5 0.0 -10.0 0.5
2 no -4.0 -7.0 0.5
3 no -3.5 -5.5 1.0
4 yes -2.0 -16.5 0.0 -11.5 0.0
O172:K-:H- 1 no -4.5 -2.0 1.0
2 no -3.0 -2.5 0.0
3 yes -3.0 -13.5 0.0 -3.5 -2.0
4 yes -3.0 -14.5 0.5 -4.0 -1.5
∆f (Hz)
*didn't do
second was for
this strain
*didn't do PBS
before CP1 and
also CP1 was in
water
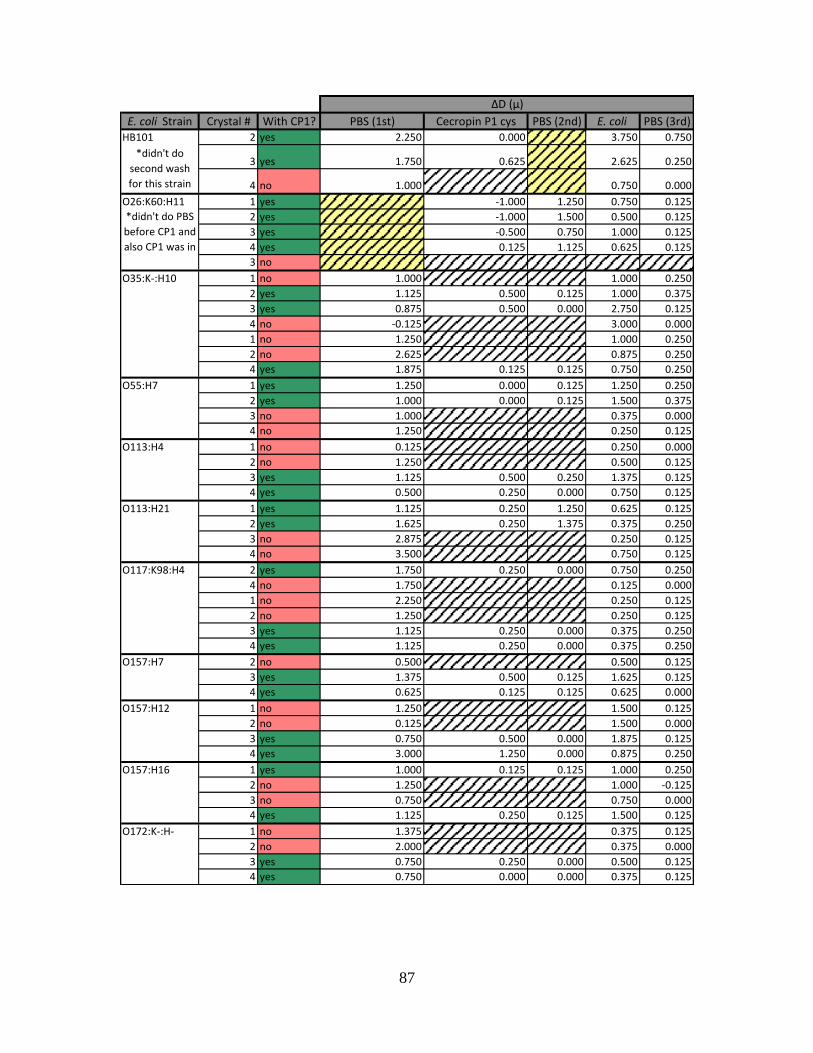
87
E. coli Strain Crystal # With CP1? PBS (1st) Cecropin P1 cys PBS (2nd) E. coli PBS (3rd)HB101 2 yes 2.250 0.000 3.750 0.750
3 yes 1.750 0.625 2.625 0.250
4 no 1.000 0.750 0.000
O26:K60:H11 1 yes -1.000 1.250 0.750 0.125
2 yes -1.000 1.500 0.500 0.125
3 yes -0.500 0.750 1.000 0.125
4 yes 0.125 1.125 0.625 0.125
3 no
O35:K-:H10 1 no 1.000 1.000 0.250
2 yes 1.125 0.500 0.125 1.000 0.375
3 yes 0.875 0.500 0.000 2.750 0.125
4 no -0.125 3.000 0.000
1 no 1.250 1.000 0.250
2 no 2.625 0.875 0.250
4 yes 1.875 0.125 0.125 0.750 0.250
O55:H7 1 yes 1.250 0.000 0.125 1.250 0.250
2 yes 1.000 0.000 0.125 1.500 0.375
3 no 1.000 0.375 0.000
4 no 1.250 0.250 0.125
O113:H4 1 no 0.125 0.250 0.000
2 no 1.250 0.500 0.125
3 yes 1.125 0.500 0.250 1.375 0.125
4 yes 0.500 0.250 0.000 0.750 0.125
O113:H21 1 yes 1.125 0.250 1.250 0.625 0.125
2 yes 1.625 0.250 1.375 0.375 0.250
3 no 2.875 0.250 0.125
4 no 3.500 0.750 0.125
O117:K98:H4 2 yes 1.750 0.250 0.000 0.750 0.250
4 no 1.750 0.125 0.000
1 no 2.250 0.250 0.125
2 no 1.250 0.250 0.125
3 yes 1.125 0.250 0.000 0.375 0.250
4 yes 1.125 0.250 0.000 0.375 0.250
O157:H7 2 no 0.500 0.500 0.125
3 yes 1.375 0.500 0.125 1.625 0.125
4 yes 0.625 0.125 0.125 0.625 0.000
O157:H12 1 no 1.250 1.500 0.125
2 no 0.125 1.500 0.000
3 yes 0.750 0.500 0.000 1.875 0.125
4 yes 3.000 1.250 0.000 0.875 0.250
O157:H16 1 yes 1.000 0.125 0.125 1.000 0.250
2 no 1.250 1.000 -0.125
3 no 0.750 0.750 0.000
4 yes 1.125 0.250 0.125 1.500 0.125
O172:K-:H- 1 no 1.375 0.375 0.125
2 no 2.000 0.375 0.000
3 yes 0.750 0.250 0.000 0.500 0.125
4 yes 0.750 0.000 0.000 0.375 0.125
∆D (μ)
*didn't do
second wash
for this strain
*didn't do PBS
before CP1 and
also CP1 was in
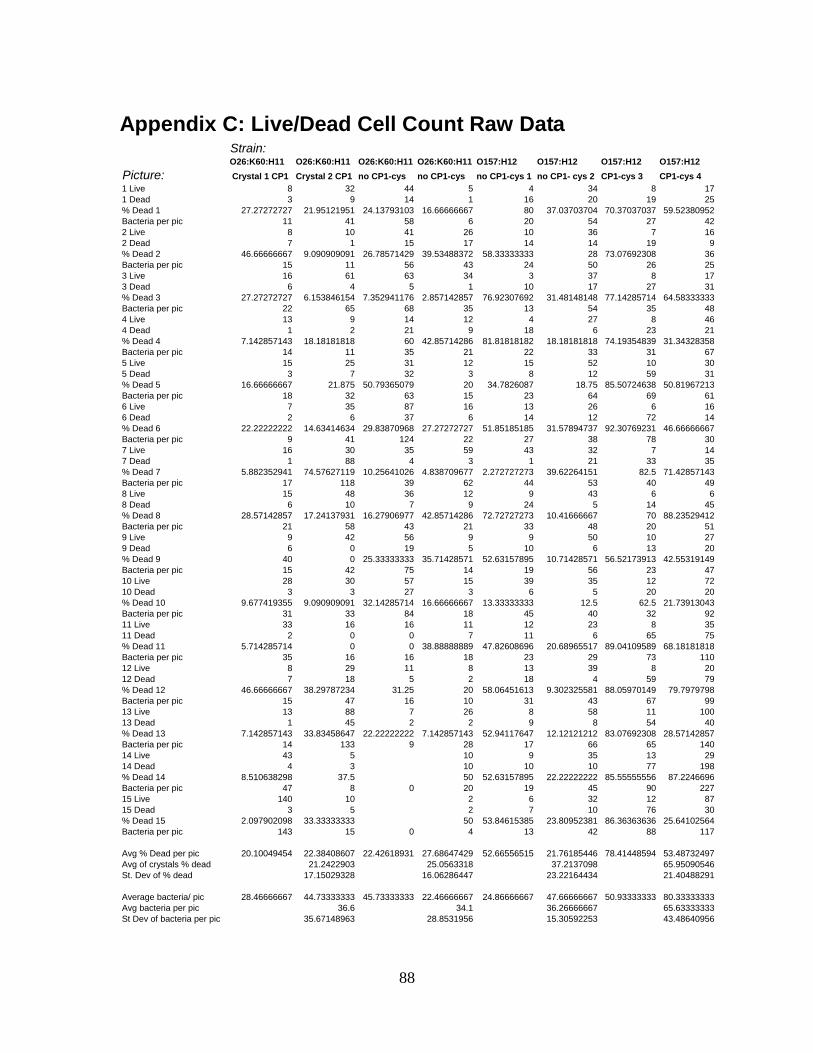
88
Appendix C: Live/Dead Cell Count Raw Data Strain:O26:K60:H11 O26:K60:H11 O26:K60:H11 O26:K60:H11 O157:H12 O157:H12 O157:H12 O157:H12
Picture: Crystal 1 CP1 Crystal 2 CP1 no CP1-cys no CP1-cys no CP1-cys 1 no CP1- cys 2 CP1-cys 3 CP1-cys 4
1 Live 8 32 44 5 4 34 8 17
1 Dead 3 9 14 1 16 20 19 25
% Dead 1 27.27272727 21.95121951 24.13793103 16.66666667 80 37.03703704 70.37037037 59.52380952
Bacteria per pic 11 41 58 6 20 54 27 42
2 Live 8 10 41 26 10 36 7 16
2 Dead 7 1 15 17 14 14 19 9
% Dead 2 46.66666667 9.090909091 26.78571429 39.53488372 58.33333333 28 73.07692308 36
Bacteria per pic 15 11 56 43 24 50 26 25
3 Live 16 61 63 34 3 37 8 17
3 Dead 6 4 5 1 10 17 27 31
% Dead 3 27.27272727 6.153846154 7.352941176 2.857142857 76.92307692 31.48148148 77.14285714 64.58333333
Bacteria per pic 22 65 68 35 13 54 35 48
4 Live 13 9 14 12 4 27 8 46
4 Dead 1 2 21 9 18 6 23 21
% Dead 4 7.142857143 18.18181818 60 42.85714286 81.81818182 18.18181818 74.19354839 31.34328358
Bacteria per pic 14 11 35 21 22 33 31 67
5 Live 15 25 31 12 15 52 10 30
5 Dead 3 7 32 3 8 12 59 31
% Dead 5 16.66666667 21.875 50.79365079 20 34.7826087 18.75 85.50724638 50.81967213
Bacteria per pic 18 32 63 15 23 64 69 61
6 Live 7 35 87 16 13 26 6 16
6 Dead 2 6 37 6 14 12 72 14
% Dead 6 22.22222222 14.63414634 29.83870968 27.27272727 51.85185185 31.57894737 92.30769231 46.66666667
Bacteria per pic 9 41 124 22 27 38 78 30
7 Live 16 30 35 59 43 32 7 14
7 Dead 1 88 4 3 1 21 33 35
% Dead 7 5.882352941 74.57627119 10.25641026 4.838709677 2.272727273 39.62264151 82.5 71.42857143
Bacteria per pic 17 118 39 62 44 53 40 49
8 Live 15 48 36 12 9 43 6 6
8 Dead 6 10 7 9 24 5 14 45
% Dead 8 28.57142857 17.24137931 16.27906977 42.85714286 72.72727273 10.41666667 70 88.23529412
Bacteria per pic 21 58 43 21 33 48 20 51
9 Live 9 42 56 9 9 50 10 27
9 Dead 6 0 19 5 10 6 13 20
% Dead 9 40 0 25.33333333 35.71428571 52.63157895 10.71428571 56.52173913 42.55319149
Bacteria per pic 15 42 75 14 19 56 23 47
10 Live 28 30 57 15 39 35 12 72
10 Dead 3 3 27 3 6 5 20 20
% Dead 10 9.677419355 9.090909091 32.14285714 16.66666667 13.33333333 12.5 62.5 21.73913043
Bacteria per pic 31 33 84 18 45 40 32 92
11 Live 33 16 16 11 12 23 8 35
11 Dead 2 0 0 7 11 6 65 75
% Dead 11 5.714285714 0 0 38.88888889 47.82608696 20.68965517 89.04109589 68.18181818
Bacteria per pic 35 16 16 18 23 29 73 110
12 Live 8 29 11 8 13 39 8 20
12 Dead 7 18 5 2 18 4 59 79
% Dead 12 46.66666667 38.29787234 31.25 20 58.06451613 9.302325581 88.05970149 79.7979798
Bacteria per pic 15 47 16 10 31 43 67 99
13 Live 13 88 7 26 8 58 11 100
13 Dead 1 45 2 2 9 8 54 40
% Dead 13 7.142857143 33.83458647 22.22222222 7.142857143 52.94117647 12.12121212 83.07692308 28.57142857
Bacteria per pic 14 133 9 28 17 66 65 140
14 Live 43 5 10 9 35 13 29
14 Dead 4 3 10 10 10 77 198
% Dead 14 8.510638298 37.5 50 52.63157895 22.22222222 85.55555556 87.2246696
Bacteria per pic 47 8 0 20 19 45 90 227
15 Live 140 10 2 6 32 12 87
15 Dead 3 5 2 7 10 76 30
% Dead 15 2.097902098 33.33333333 50 53.84615385 23.80952381 86.36363636 25.64102564
Bacteria per pic 143 15 0 4 13 42 88 117
Avg % Dead per pic 20.10049454 22.38408607 22.42618931 27.68647429 52.66556515 21.76185446 78.41448594 53.48732497
Avg of crystals % dead 21.2422903 25.0563318 37.2137098 65.95090546
St. Dev of % dead 17.15029328 16.06286447 23.22164434 21.40488291
Average bacteria/ pic 28.46666667 44.73333333 45.73333333 22.46666667 24.86666667 47.66666667 50.93333333 80.33333333
Avg bacteria per pic 36.6 34.1 36.26666667 65.63333333
St Dev of bacteria per pic 35.67148963 28.8531956 15.30592253 43.48640956
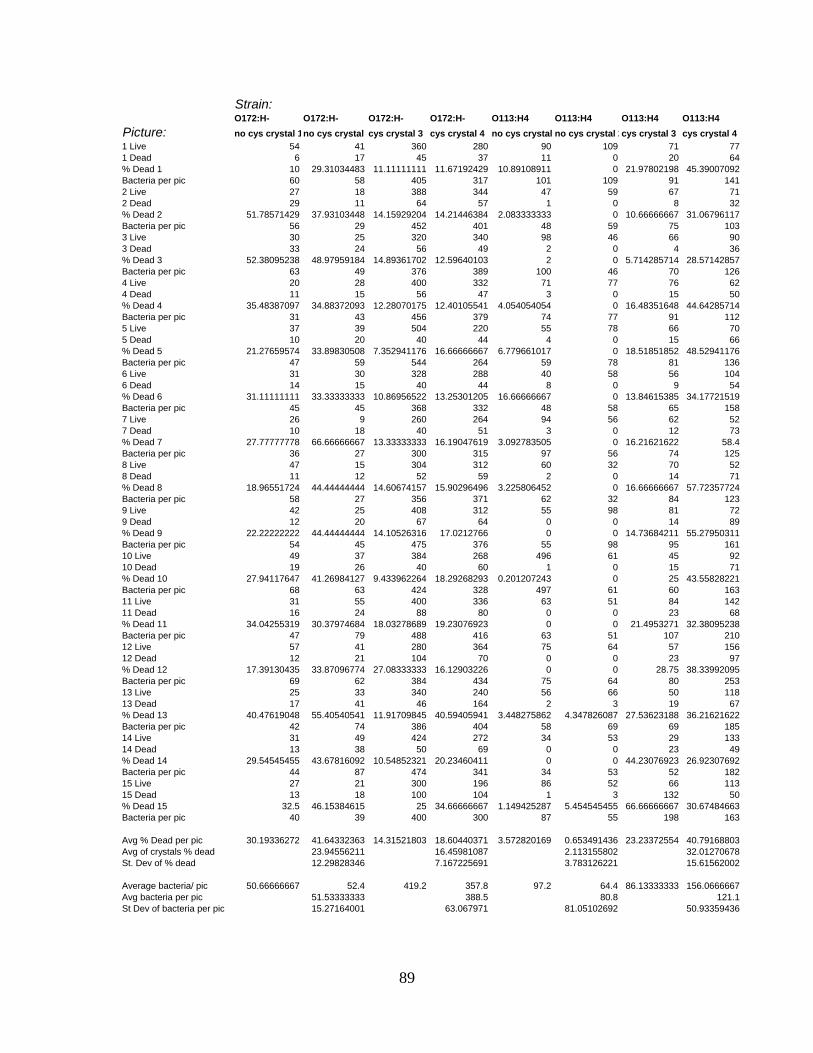
89
Strain:O172:H- O172:H- O172:H- O172:H- O113:H4 O113:H4 O113:H4 O113:H4
Picture: no cys crystal 1no cys crystal 2cys crystal 3 cys crystal 4 no cys crystal 1no cys crystal 2cys crystal 3 cys crystal 4
1 Live 54 41 360 280 90 109 71 77
1 Dead 6 17 45 37 11 0 20 64
% Dead 1 10 29.31034483 11.11111111 11.67192429 10.89108911 0 21.97802198 45.39007092
Bacteria per pic 60 58 405 317 101 109 91 141
2 Live 27 18 388 344 47 59 67 71
2 Dead 29 11 64 57 1 0 8 32
% Dead 2 51.78571429 37.93103448 14.15929204 14.21446384 2.083333333 0 10.66666667 31.06796117
Bacteria per pic 56 29 452 401 48 59 75 103
3 Live 30 25 320 340 98 46 66 90
3 Dead 33 24 56 49 2 0 4 36
% Dead 3 52.38095238 48.97959184 14.89361702 12.59640103 2 0 5.714285714 28.57142857
Bacteria per pic 63 49 376 389 100 46 70 126
4 Live 20 28 400 332 71 77 76 62
4 Dead 11 15 56 47 3 0 15 50
% Dead 4 35.48387097 34.88372093 12.28070175 12.40105541 4.054054054 0 16.48351648 44.64285714
Bacteria per pic 31 43 456 379 74 77 91 112
5 Live 37 39 504 220 55 78 66 70
5 Dead 10 20 40 44 4 0 15 66
% Dead 5 21.27659574 33.89830508 7.352941176 16.66666667 6.779661017 0 18.51851852 48.52941176
Bacteria per pic 47 59 544 264 59 78 81 136
6 Live 31 30 328 288 40 58 56 104
6 Dead 14 15 40 44 8 0 9 54
% Dead 6 31.11111111 33.33333333 10.86956522 13.25301205 16.66666667 0 13.84615385 34.17721519
Bacteria per pic 45 45 368 332 48 58 65 158
7 Live 26 9 260 264 94 56 62 52
7 Dead 10 18 40 51 3 0 12 73
% Dead 7 27.77777778 66.66666667 13.33333333 16.19047619 3.092783505 0 16.21621622 58.4
Bacteria per pic 36 27 300 315 97 56 74 125
8 Live 47 15 304 312 60 32 70 52
8 Dead 11 12 52 59 2 0 14 71
% Dead 8 18.96551724 44.44444444 14.60674157 15.90296496 3.225806452 0 16.66666667 57.72357724
Bacteria per pic 58 27 356 371 62 32 84 123
9 Live 42 25 408 312 55 98 81 72
9 Dead 12 20 67 64 0 0 14 89
% Dead 9 22.22222222 44.44444444 14.10526316 17.0212766 0 0 14.73684211 55.27950311
Bacteria per pic 54 45 475 376 55 98 95 161
10 Live 49 37 384 268 496 61 45 92
10 Dead 19 26 40 60 1 0 15 71
% Dead 10 27.94117647 41.26984127 9.433962264 18.29268293 0.201207243 0 25 43.55828221
Bacteria per pic 68 63 424 328 497 61 60 163
11 Live 31 55 400 336 63 51 84 142
11 Dead 16 24 88 80 0 0 23 68
% Dead 11 34.04255319 30.37974684 18.03278689 19.23076923 0 0 21.4953271 32.38095238
Bacteria per pic 47 79 488 416 63 51 107 210
12 Live 57 41 280 364 75 64 57 156
12 Dead 12 21 104 70 0 0 23 97
% Dead 12 17.39130435 33.87096774 27.08333333 16.12903226 0 0 28.75 38.33992095
Bacteria per pic 69 62 384 434 75 64 80 253
13 Live 25 33 340 240 56 66 50 118
13 Dead 17 41 46 164 2 3 19 67
% Dead 13 40.47619048 55.40540541 11.91709845 40.59405941 3.448275862 4.347826087 27.53623188 36.21621622
Bacteria per pic 42 74 386 404 58 69 69 185
14 Live 31 49 424 272 34 53 29 133
14 Dead 13 38 50 69 0 0 23 49
% Dead 14 29.54545455 43.67816092 10.54852321 20.23460411 0 0 44.23076923 26.92307692
Bacteria per pic 44 87 474 341 34 53 52 182
15 Live 27 21 300 196 86 52 66 113
15 Dead 13 18 100 104 1 3 132 50
% Dead 15 32.5 46.15384615 25 34.66666667 1.149425287 5.454545455 66.66666667 30.67484663
Bacteria per pic 40 39 400 300 87 55 198 163
Avg % Dead per pic 30.19336272 41.64332363 14.31521803 18.60440371 3.572820169 0.653491436 23.23372554 40.79168803
Avg of crystals % dead 23.94556211 16.45981087 2.113155802 32.01270678
St. Dev of % dead 12.29828346 7.167225691 3.783126221 15.61562002
Average bacteria/ pic 50.66666667 52.4 419.2 357.8 97.2 64.4 86.13333333 156.0666667
Avg bacteria per pic 51.53333333 388.5 80.8 121.1
St Dev of bacteria per pic 15.27164001 63.067971 81.05102692 50.93359436
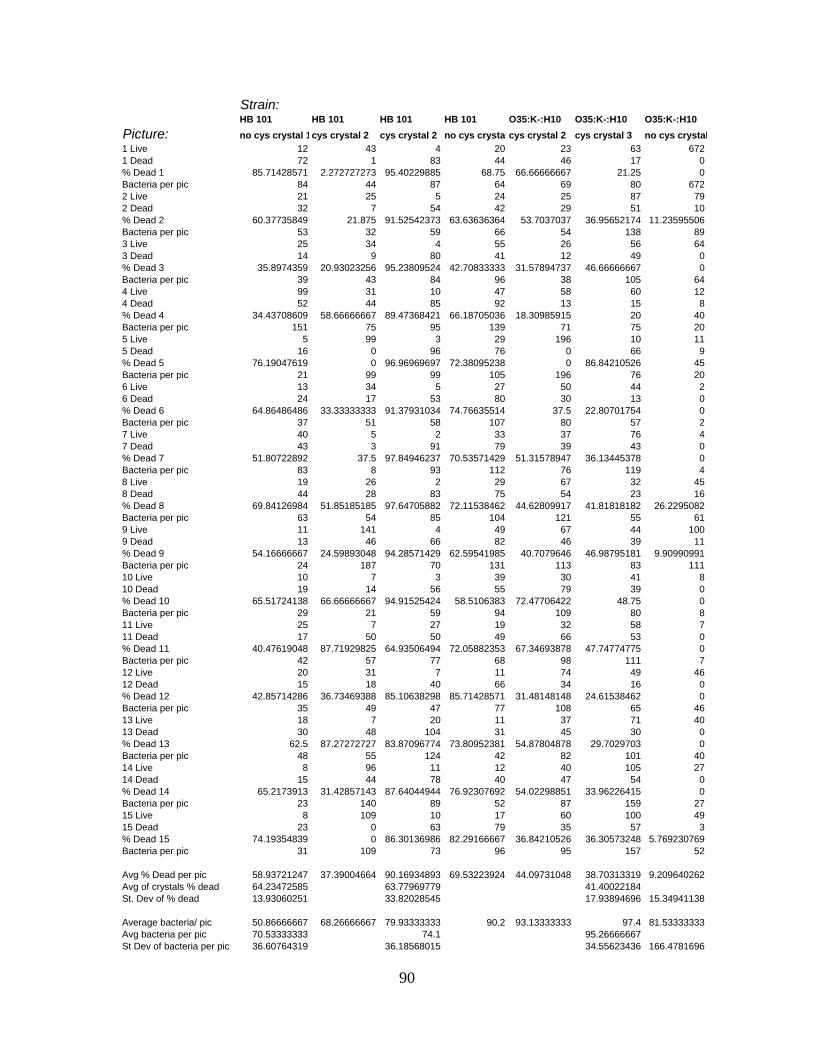
90
Strain:HB 101 HB 101 HB 101 HB 101 O35:K-:H10 O35:K-:H10 O35:K-:H10
Picture: no cys crystal 1cys crystal 2 cys crystal 2 no cys crystal 4cys crystal 2 cys crystal 3 no cys crystal 4
1 Live 12 43 4 20 23 63 672
1 Dead 72 1 83 44 46 17 0
% Dead 1 85.71428571 2.272727273 95.40229885 68.75 66.66666667 21.25 0
Bacteria per pic 84 44 87 64 69 80 672
2 Live 21 25 5 24 25 87 79
2 Dead 32 7 54 42 29 51 10
% Dead 2 60.37735849 21.875 91.52542373 63.63636364 53.7037037 36.95652174 11.23595506
Bacteria per pic 53 32 59 66 54 138 89
3 Live 25 34 4 55 26 56 64
3 Dead 14 9 80 41 12 49 0
% Dead 3 35.8974359 20.93023256 95.23809524 42.70833333 31.57894737 46.66666667 0
Bacteria per pic 39 43 84 96 38 105 64
4 Live 99 31 10 47 58 60 12
4 Dead 52 44 85 92 13 15 8
% Dead 4 34.43708609 58.66666667 89.47368421 66.18705036 18.30985915 20 40
Bacteria per pic 151 75 95 139 71 75 20
5 Live 5 99 3 29 196 10 11
5 Dead 16 0 96 76 0 66 9
% Dead 5 76.19047619 0 96.96969697 72.38095238 0 86.84210526 45
Bacteria per pic 21 99 99 105 196 76 20
6 Live 13 34 5 27 50 44 2
6 Dead 24 17 53 80 30 13 0
% Dead 6 64.86486486 33.33333333 91.37931034 74.76635514 37.5 22.80701754 0
Bacteria per pic 37 51 58 107 80 57 2
7 Live 40 5 2 33 37 76 4
7 Dead 43 3 91 79 39 43 0
% Dead 7 51.80722892 37.5 97.84946237 70.53571429 51.31578947 36.13445378 0
Bacteria per pic 83 8 93 112 76 119 4
8 Live 19 26 2 29 67 32 45
8 Dead 44 28 83 75 54 23 16
% Dead 8 69.84126984 51.85185185 97.64705882 72.11538462 44.62809917 41.81818182 26.2295082
Bacteria per pic 63 54 85 104 121 55 61
9 Live 11 141 4 49 67 44 100
9 Dead 13 46 66 82 46 39 11
% Dead 9 54.16666667 24.59893048 94.28571429 62.59541985 40.7079646 46.98795181 9.90990991
Bacteria per pic 24 187 70 131 113 83 111
10 Live 10 7 3 39 30 41 8
10 Dead 19 14 56 55 79 39 0
% Dead 10 65.51724138 66.66666667 94.91525424 58.5106383 72.47706422 48.75 0
Bacteria per pic 29 21 59 94 109 80 8
11 Live 25 7 27 19 32 58 7
11 Dead 17 50 50 49 66 53 0
% Dead 11 40.47619048 87.71929825 64.93506494 72.05882353 67.34693878 47.74774775 0
Bacteria per pic 42 57 77 68 98 111 7
12 Live 20 31 7 11 74 49 46
12 Dead 15 18 40 66 34 16 0
% Dead 12 42.85714286 36.73469388 85.10638298 85.71428571 31.48148148 24.61538462 0
Bacteria per pic 35 49 47 77 108 65 46
13 Live 18 7 20 11 37 71 40
13 Dead 30 48 104 31 45 30 0
% Dead 13 62.5 87.27272727 83.87096774 73.80952381 54.87804878 29.7029703 0
Bacteria per pic 48 55 124 42 82 101 40
14 Live 8 96 11 12 40 105 27
14 Dead 15 44 78 40 47 54 0
% Dead 14 65.2173913 31.42857143 87.64044944 76.92307692 54.02298851 33.96226415 0
Bacteria per pic 23 140 89 52 87 159 27
15 Live 8 109 10 17 60 100 49
15 Dead 23 0 63 79 35 57 3
% Dead 15 74.19354839 0 86.30136986 82.29166667 36.84210526 36.30573248 5.769230769
Bacteria per pic 31 109 73 96 95 157 52
Avg % Dead per pic 58.93721247 37.39004664 90.16934893 69.53223924 44.09731048 38.70313319 9.209640262
Avg of crystals % dead 64.23472585 63.77969779 41.40022184
St. Dev of % dead 13.93060251 33.82028545 17.93894696 15.34941138
Average bacteria/ pic 50.86666667 68.26666667 79.93333333 90.2 93.13333333 97.4 81.53333333
Avg bacteria per pic 70.53333333 74.1 95.26666667
St Dev of bacteria per pic 36.60764319 36.18568015 34.55623436 166.4781696
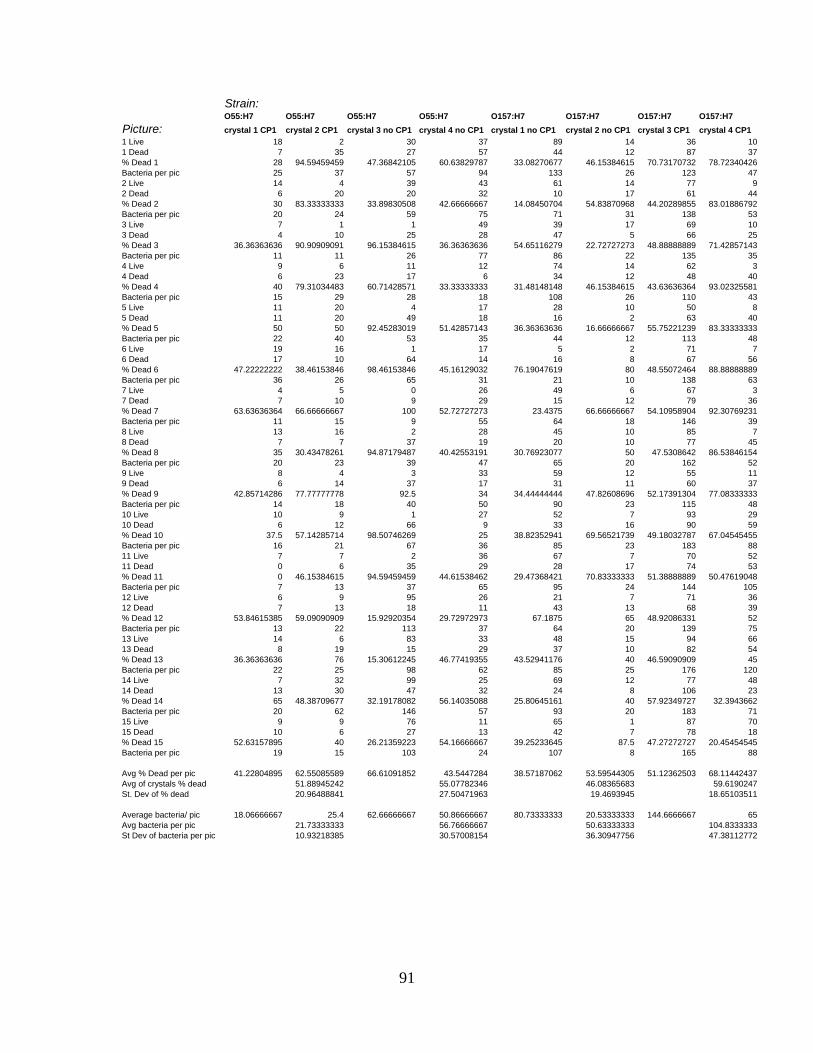
91
Strain:O55:H7 O55:H7 O55:H7 O55:H7 O157:H7 O157:H7 O157:H7 O157:H7
Picture: crystal 1 CP1 crystal 2 CP1 crystal 3 no CP1 crystal 4 no CP1 crystal 1 no CP1 crystal 2 no CP1 crystal 3 CP1 crystal 4 CP1
1 Live 18 2 30 37 89 14 36 10
1 Dead 7 35 27 57 44 12 87 37
% Dead 1 28 94.59459459 47.36842105 60.63829787 33.08270677 46.15384615 70.73170732 78.72340426
Bacteria per pic 25 37 57 94 133 26 123 47
2 Live 14 4 39 43 61 14 77 9
2 Dead 6 20 20 32 10 17 61 44
% Dead 2 30 83.33333333 33.89830508 42.66666667 14.08450704 54.83870968 44.20289855 83.01886792
Bacteria per pic 20 24 59 75 71 31 138 53
3 Live 7 1 1 49 39 17 69 10
3 Dead 4 10 25 28 47 5 66 25
% Dead 3 36.36363636 90.90909091 96.15384615 36.36363636 54.65116279 22.72727273 48.88888889 71.42857143
Bacteria per pic 11 11 26 77 86 22 135 35
4 Live 9 6 11 12 74 14 62 3
4 Dead 6 23 17 6 34 12 48 40
% Dead 4 40 79.31034483 60.71428571 33.33333333 31.48148148 46.15384615 43.63636364 93.02325581
Bacteria per pic 15 29 28 18 108 26 110 43
5 Live 11 20 4 17 28 10 50 8
5 Dead 11 20 49 18 16 2 63 40
% Dead 5 50 50 92.45283019 51.42857143 36.36363636 16.66666667 55.75221239 83.33333333
Bacteria per pic 22 40 53 35 44 12 113 48
6 Live 19 16 1 17 5 2 71 7
6 Dead 17 10 64 14 16 8 67 56
% Dead 6 47.22222222 38.46153846 98.46153846 45.16129032 76.19047619 80 48.55072464 88.88888889
Bacteria per pic 36 26 65 31 21 10 138 63
7 Live 4 5 0 26 49 6 67 3
7 Dead 7 10 9 29 15 12 79 36
% Dead 7 63.63636364 66.66666667 100 52.72727273 23.4375 66.66666667 54.10958904 92.30769231
Bacteria per pic 11 15 9 55 64 18 146 39
8 Live 13 16 2 28 45 10 85 7
8 Dead 7 7 37 19 20 10 77 45
% Dead 8 35 30.43478261 94.87179487 40.42553191 30.76923077 50 47.5308642 86.53846154
Bacteria per pic 20 23 39 47 65 20 162 52
9 Live 8 4 3 33 59 12 55 11
9 Dead 6 14 37 17 31 11 60 37
% Dead 9 42.85714286 77.77777778 92.5 34 34.44444444 47.82608696 52.17391304 77.08333333
Bacteria per pic 14 18 40 50 90 23 115 48
10 Live 10 9 1 27 52 7 93 29
10 Dead 6 12 66 9 33 16 90 59
% Dead 10 37.5 57.14285714 98.50746269 25 38.82352941 69.56521739 49.18032787 67.04545455
Bacteria per pic 16 21 67 36 85 23 183 88
11 Live 7 7 2 36 67 7 70 52
11 Dead 0 6 35 29 28 17 74 53
% Dead 11 0 46.15384615 94.59459459 44.61538462 29.47368421 70.83333333 51.38888889 50.47619048
Bacteria per pic 7 13 37 65 95 24 144 105
12 Live 6 9 95 26 21 7 71 36
12 Dead 7 13 18 11 43 13 68 39
% Dead 12 53.84615385 59.09090909 15.92920354 29.72972973 67.1875 65 48.92086331 52
Bacteria per pic 13 22 113 37 64 20 139 75
13 Live 14 6 83 33 48 15 94 66
13 Dead 8 19 15 29 37 10 82 54
% Dead 13 36.36363636 76 15.30612245 46.77419355 43.52941176 40 46.59090909 45
Bacteria per pic 22 25 98 62 85 25 176 120
14 Live 7 32 99 25 69 12 77 48
14 Dead 13 30 47 32 24 8 106 23
% Dead 14 65 48.38709677 32.19178082 56.14035088 25.80645161 40 57.92349727 32.3943662
Bacteria per pic 20 62 146 57 93 20 183 71
15 Live 9 9 76 11 65 1 87 70
15 Dead 10 6 27 13 42 7 78 18
% Dead 15 52.63157895 40 26.21359223 54.16666667 39.25233645 87.5 47.27272727 20.45454545
Bacteria per pic 19 15 103 24 107 8 165 88
Avg % Dead per pic 41.22804895 62.55085589 66.61091852 43.5447284 38.57187062 53.59544305 51.12362503 68.11442437
Avg of crystals % dead 51.88945242 55.07782346 46.08365683 59.6190247
St. Dev of % dead 20.96488841 27.50471963 19.4693945 18.65103511
Average bacteria/ pic 18.06666667 25.4 62.66666667 50.86666667 80.73333333 20.53333333 144.6666667 65
Avg bacteria per pic 21.73333333 56.76666667 50.63333333 104.8333333
St Dev of bacteria per pic 10.93218385 30.57008154 36.30947756 47.38112772
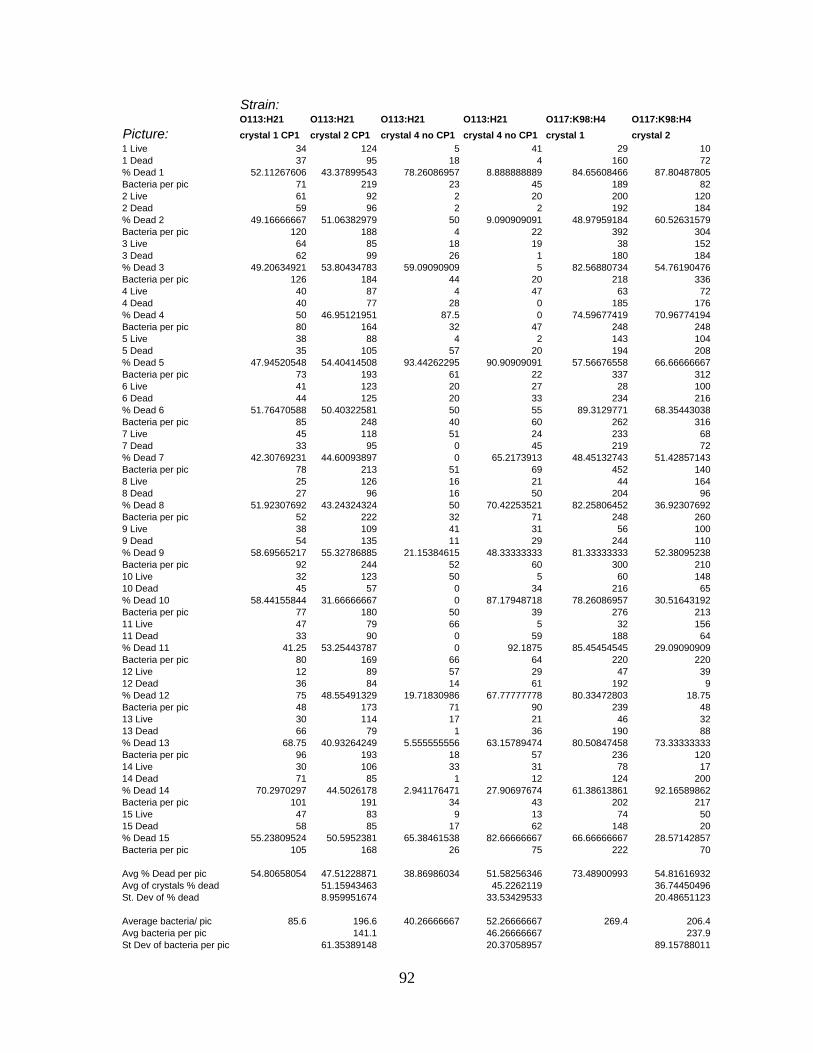
92
Strain:O113:H21 O113:H21 O113:H21 O113:H21 O117:K98:H4 O117:K98:H4
Picture: crystal 1 CP1 crystal 2 CP1 crystal 4 no CP1 crystal 4 no CP1 crystal 1 crystal 2
1 Live 34 124 5 41 29 10
1 Dead 37 95 18 4 160 72
% Dead 1 52.11267606 43.37899543 78.26086957 8.888888889 84.65608466 87.80487805
Bacteria per pic 71 219 23 45 189 82
2 Live 61 92 2 20 200 120
2 Dead 59 96 2 2 192 184
% Dead 2 49.16666667 51.06382979 50 9.090909091 48.97959184 60.52631579
Bacteria per pic 120 188 4 22 392 304
3 Live 64 85 18 19 38 152
3 Dead 62 99 26 1 180 184
% Dead 3 49.20634921 53.80434783 59.09090909 5 82.56880734 54.76190476
Bacteria per pic 126 184 44 20 218 336
4 Live 40 87 4 47 63 72
4 Dead 40 77 28 0 185 176
% Dead 4 50 46.95121951 87.5 0 74.59677419 70.96774194
Bacteria per pic 80 164 32 47 248 248
5 Live 38 88 4 2 143 104
5 Dead 35 105 57 20 194 208
% Dead 5 47.94520548 54.40414508 93.44262295 90.90909091 57.56676558 66.66666667
Bacteria per pic 73 193 61 22 337 312
6 Live 41 123 20 27 28 100
6 Dead 44 125 20 33 234 216
% Dead 6 51.76470588 50.40322581 50 55 89.3129771 68.35443038
Bacteria per pic 85 248 40 60 262 316
7 Live 45 118 51 24 233 68
7 Dead 33 95 0 45 219 72
% Dead 7 42.30769231 44.60093897 0 65.2173913 48.45132743 51.42857143
Bacteria per pic 78 213 51 69 452 140
8 Live 25 126 16 21 44 164
8 Dead 27 96 16 50 204 96
% Dead 8 51.92307692 43.24324324 50 70.42253521 82.25806452 36.92307692
Bacteria per pic 52 222 32 71 248 260
9 Live 38 109 41 31 56 100
9 Dead 54 135 11 29 244 110
% Dead 9 58.69565217 55.32786885 21.15384615 48.33333333 81.33333333 52.38095238
Bacteria per pic 92 244 52 60 300 210
10 Live 32 123 50 5 60 148
10 Dead 45 57 0 34 216 65
% Dead 10 58.44155844 31.66666667 0 87.17948718 78.26086957 30.51643192
Bacteria per pic 77 180 50 39 276 213
11 Live 47 79 66 5 32 156
11 Dead 33 90 0 59 188 64
% Dead 11 41.25 53.25443787 0 92.1875 85.45454545 29.09090909
Bacteria per pic 80 169 66 64 220 220
12 Live 12 89 57 29 47 39
12 Dead 36 84 14 61 192 9
% Dead 12 75 48.55491329 19.71830986 67.77777778 80.33472803 18.75
Bacteria per pic 48 173 71 90 239 48
13 Live 30 114 17 21 46 32
13 Dead 66 79 1 36 190 88
% Dead 13 68.75 40.93264249 5.555555556 63.15789474 80.50847458 73.33333333
Bacteria per pic 96 193 18 57 236 120
14 Live 30 106 33 31 78 17
14 Dead 71 85 1 12 124 200
% Dead 14 70.2970297 44.5026178 2.941176471 27.90697674 61.38613861 92.16589862
Bacteria per pic 101 191 34 43 202 217
15 Live 47 83 9 13 74 50
15 Dead 58 85 17 62 148 20
% Dead 15 55.23809524 50.5952381 65.38461538 82.66666667 66.66666667 28.57142857
Bacteria per pic 105 168 26 75 222 70
Avg % Dead per pic 54.80658054 47.51228871 38.86986034 51.58256346 73.48900993 54.81616932
Avg of crystals % dead 51.15943463 45.2262119 36.74450496
St. Dev of % dead 8.959951674 33.53429533 20.48651123
Average bacteria/ pic 85.6 196.6 40.26666667 52.26666667 269.4 206.4
Avg bacteria per pic 141.1 46.26666667 237.9
St Dev of bacteria per pic 61.35389148 20.37058957 89.15788011
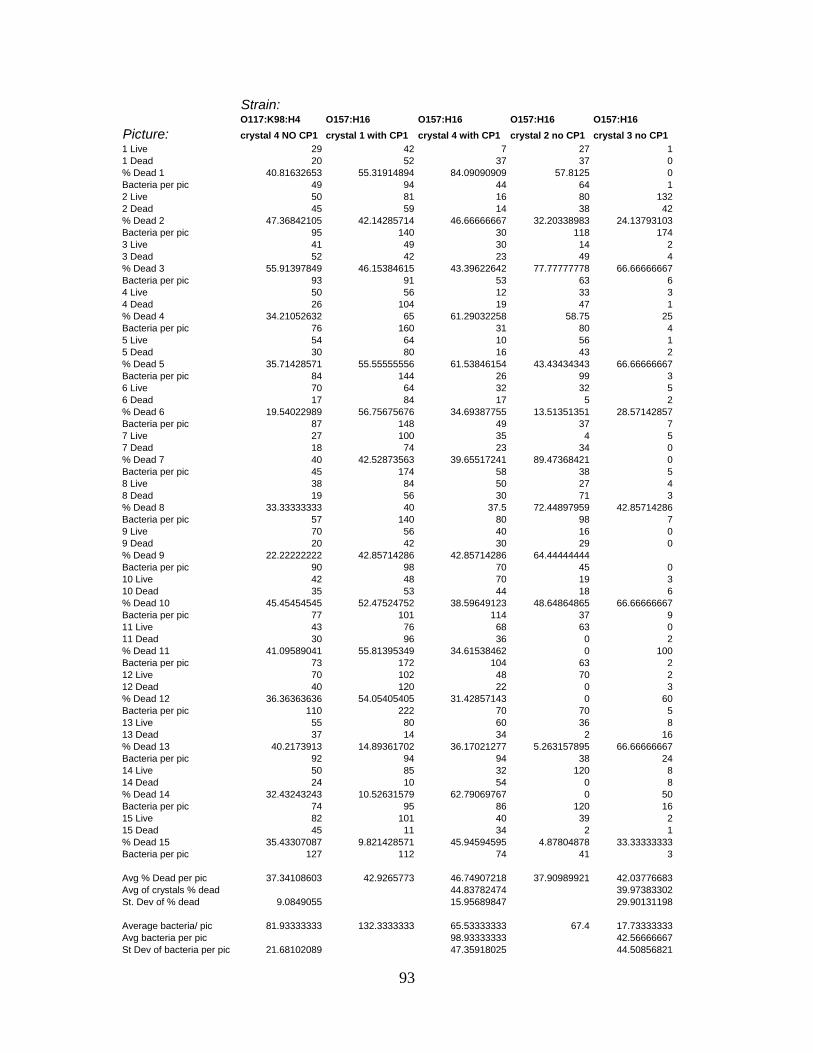
93
Strain:O117:K98:H4 O157:H16 O157:H16 O157:H16 O157:H16
Picture: crystal 4 NO CP1 crystal 1 with CP1 crystal 4 with CP1 crystal 2 no CP1 crystal 3 no CP1
1 Live 29 42 7 27 1
1 Dead 20 52 37 37 0
% Dead 1 40.81632653 55.31914894 84.09090909 57.8125 0
Bacteria per pic 49 94 44 64 1
2 Live 50 81 16 80 132
2 Dead 45 59 14 38 42
% Dead 2 47.36842105 42.14285714 46.66666667 32.20338983 24.13793103
Bacteria per pic 95 140 30 118 174
3 Live 41 49 30 14 2
3 Dead 52 42 23 49 4
% Dead 3 55.91397849 46.15384615 43.39622642 77.77777778 66.66666667
Bacteria per pic 93 91 53 63 6
4 Live 50 56 12 33 3
4 Dead 26 104 19 47 1
% Dead 4 34.21052632 65 61.29032258 58.75 25
Bacteria per pic 76 160 31 80 4
5 Live 54 64 10 56 1
5 Dead 30 80 16 43 2
% Dead 5 35.71428571 55.55555556 61.53846154 43.43434343 66.66666667
Bacteria per pic 84 144 26 99 3
6 Live 70 64 32 32 5
6 Dead 17 84 17 5 2
% Dead 6 19.54022989 56.75675676 34.69387755 13.51351351 28.57142857
Bacteria per pic 87 148 49 37 7
7 Live 27 100 35 4 5
7 Dead 18 74 23 34 0
% Dead 7 40 42.52873563 39.65517241 89.47368421 0
Bacteria per pic 45 174 58 38 5
8 Live 38 84 50 27 4
8 Dead 19 56 30 71 3
% Dead 8 33.33333333 40 37.5 72.44897959 42.85714286
Bacteria per pic 57 140 80 98 7
9 Live 70 56 40 16 0
9 Dead 20 42 30 29 0
% Dead 9 22.22222222 42.85714286 42.85714286 64.44444444
Bacteria per pic 90 98 70 45 0
10 Live 42 48 70 19 3
10 Dead 35 53 44 18 6
% Dead 10 45.45454545 52.47524752 38.59649123 48.64864865 66.66666667
Bacteria per pic 77 101 114 37 9
11 Live 43 76 68 63 0
11 Dead 30 96 36 0 2
% Dead 11 41.09589041 55.81395349 34.61538462 0 100
Bacteria per pic 73 172 104 63 2
12 Live 70 102 48 70 2
12 Dead 40 120 22 0 3
% Dead 12 36.36363636 54.05405405 31.42857143 0 60
Bacteria per pic 110 222 70 70 5
13 Live 55 80 60 36 8
13 Dead 37 14 34 2 16
% Dead 13 40.2173913 14.89361702 36.17021277 5.263157895 66.66666667
Bacteria per pic 92 94 94 38 24
14 Live 50 85 32 120 8
14 Dead 24 10 54 0 8
% Dead 14 32.43243243 10.52631579 62.79069767 0 50
Bacteria per pic 74 95 86 120 16
15 Live 82 101 40 39 2
15 Dead 45 11 34 2 1
% Dead 15 35.43307087 9.821428571 45.94594595 4.87804878 33.33333333
Bacteria per pic 127 112 74 41 3
Avg % Dead per pic 37.34108603 42.9265773 46.74907218 37.90989921 42.03776683
Avg of crystals % dead 44.83782474 39.97383302
St. Dev of % dead 9.0849055 15.95689847 29.90131198
Average bacteria/ pic 81.93333333 132.3333333 65.53333333 67.4 17.73333333
Avg bacteria per pic 98.93333333 42.56666667
St Dev of bacteria per pic 21.68102089 47.35918025 44.50856821
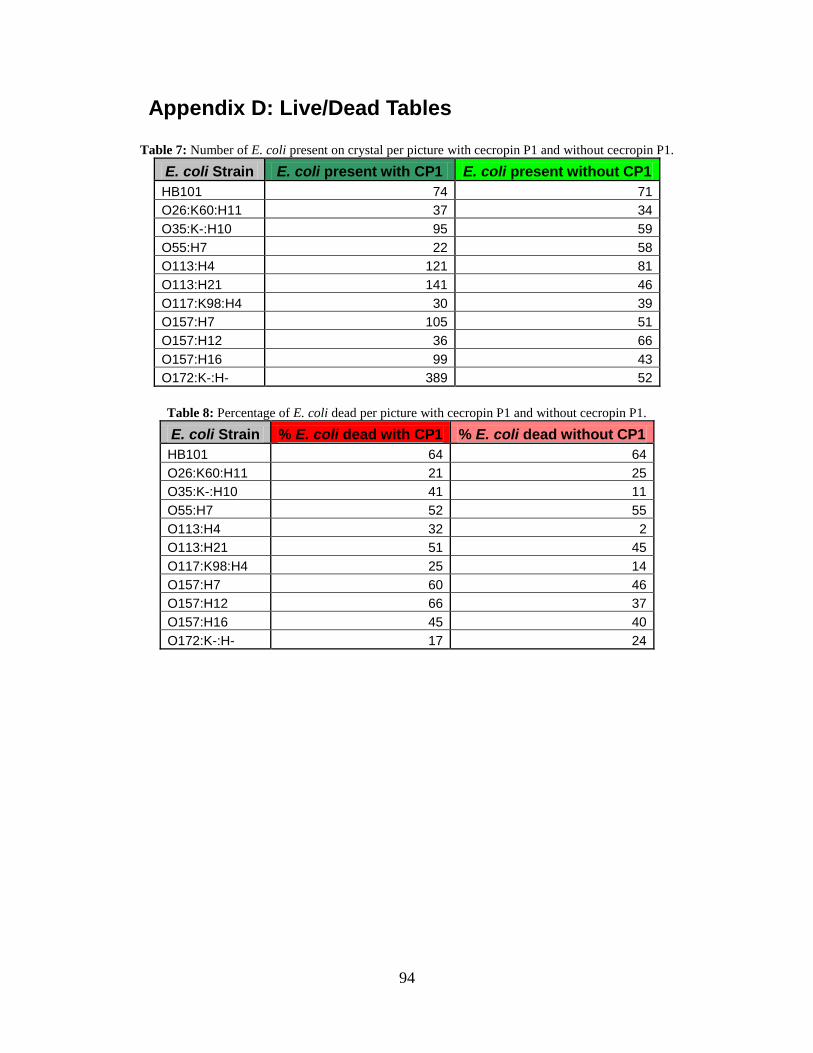
94
Appendix D: Live/Dead Tables
Table 7: Number of E. coli present on crystal per picture with cecropin P1 and without cecropin P1.
E. coli Strain E. coli present with CP1 E. coli present without CP1
HB101 74 71
O26:K60:H11 37 34
O35:K-:H10 95 59
O55:H7 22 58
O113:H4 121 81
O113:H21 141 46
O117:K98:H4 30 39
O157:H7 105 51
O157:H12 36 66
O157:H16 99 43
O172:K-:H- 389 52
Table 8: Percentage of E. coli dead per picture with cecropin P1 and without cecropin P1.
E. coli Strain % E. coli dead with CP1 % E. coli dead without CP1
HB101 64 64
O26:K60:H11 21 25
O35:K-:H10 41 11
O55:H7 52 55
O113:H4 32 2
O113:H21 51 45
O117:K98:H4 25 14
O157:H7 60 46
O157:H12 66 37
O157:H16 45 40
O172:K-:H- 17 24
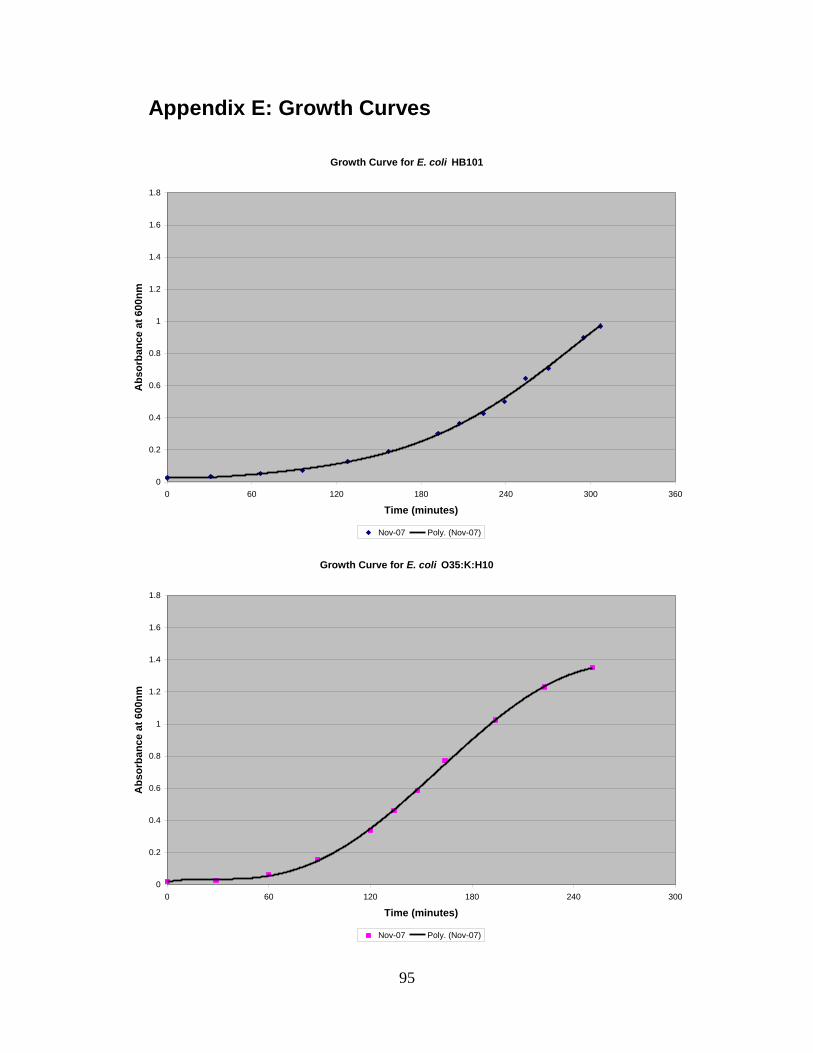
95
Appendix E: Growth Curves
Growth Curve for E. coli HB101
0
0.2
0.4
0.6
0.8
1
1.2
1.4
1.6
1.8
0 60 120 180 240 300 360
Time (minutes)
Ab
so
rba
nc
e a
t 6
00
nm
Nov-07 Poly. (Nov-07)
Growth Curve for E. coli O35:K:H10
0
0.2
0.4
0.6
0.8
1
1.2
1.4
1.6
1.8
0 60 120 180 240 300
Time (minutes)
Ab
so
rba
nc
e a
t 6
00
nm
Nov-07 Poly. (Nov-07)
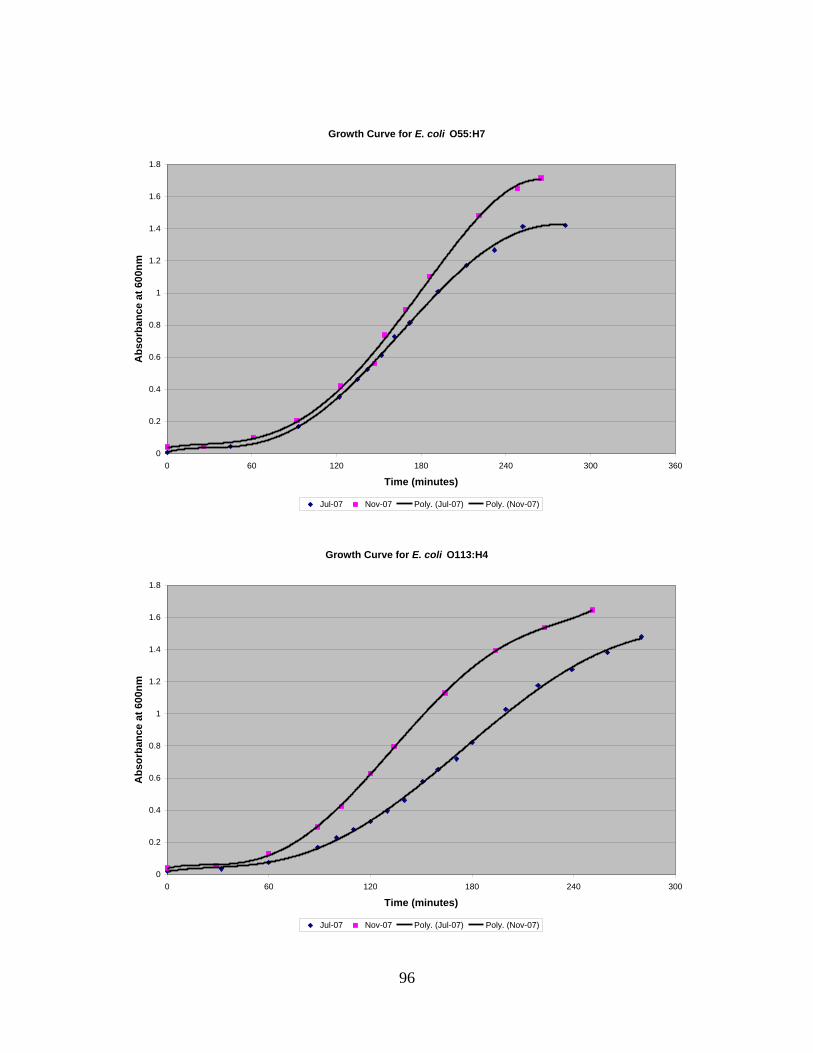
96
Growth Curve for E. coli O55:H7
0
0.2
0.4
0.6
0.8
1
1.2
1.4
1.6
1.8
0 60 120 180 240 300 360
Time (minutes)
Ab
so
rba
nc
e a
t 6
00
nm
Jul-07 Nov-07 Poly. (Jul-07) Poly. (Nov-07)
Growth Curve for E. coli O113:H4
0
0.2
0.4
0.6
0.8
1
1.2
1.4
1.6
1.8
0 60 120 180 240 300
Time (minutes)
Ab
so
rba
nc
e a
t 6
00
nm
Jul-07 Nov-07 Poly. (Jul-07) Poly. (Nov-07)
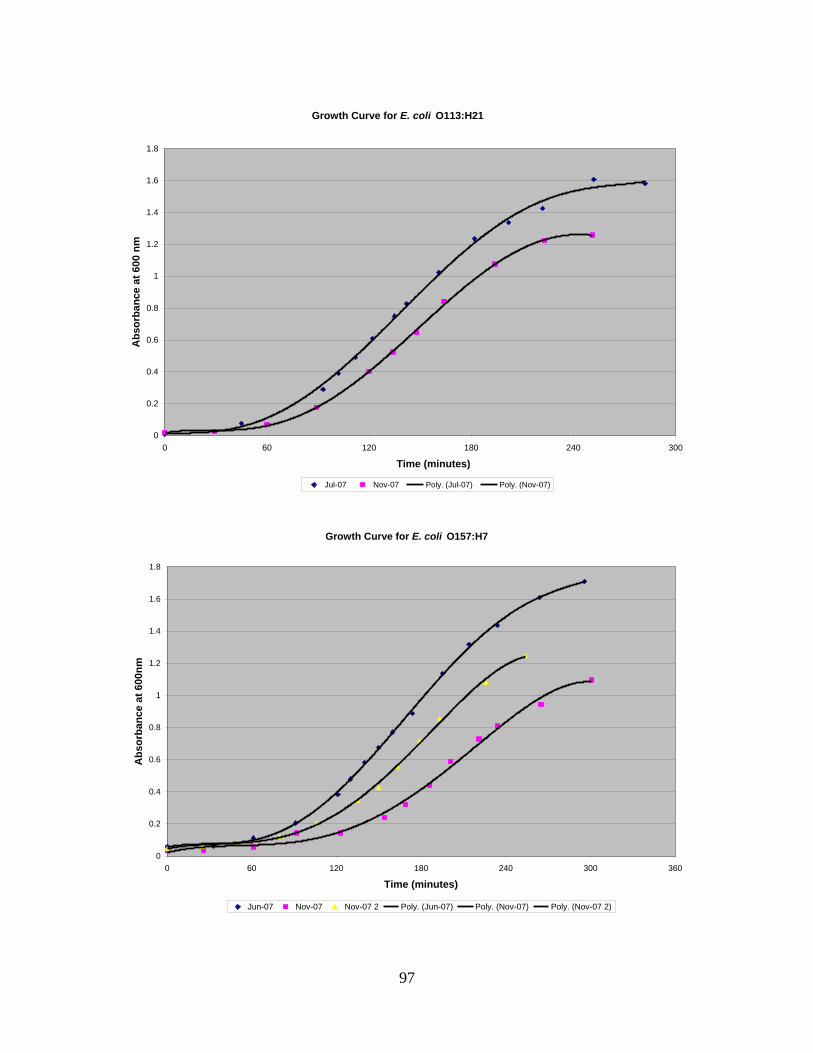
97
Growth Curve for E. coli O113:H21
0
0.2
0.4
0.6
0.8
1
1.2
1.4
1.6
1.8
0 60 120 180 240 300
Time (minutes)
Ab
so
rba
nc
e a
t 6
00
nm
Jul-07 Nov-07 Poly. (Jul-07) Poly. (Nov-07)
Growth Curve for E. coli O157:H7
0
0.2
0.4
0.6
0.8
1
1.2
1.4
1.6
1.8
0 60 120 180 240 300 360
Time (minutes)
Ab
so
rba
nc
e a
t 6
00
nm
Jun-07 Nov-07 Nov-07 2 Poly. (Jun-07) Poly. (Nov-07) Poly. (Nov-07 2)
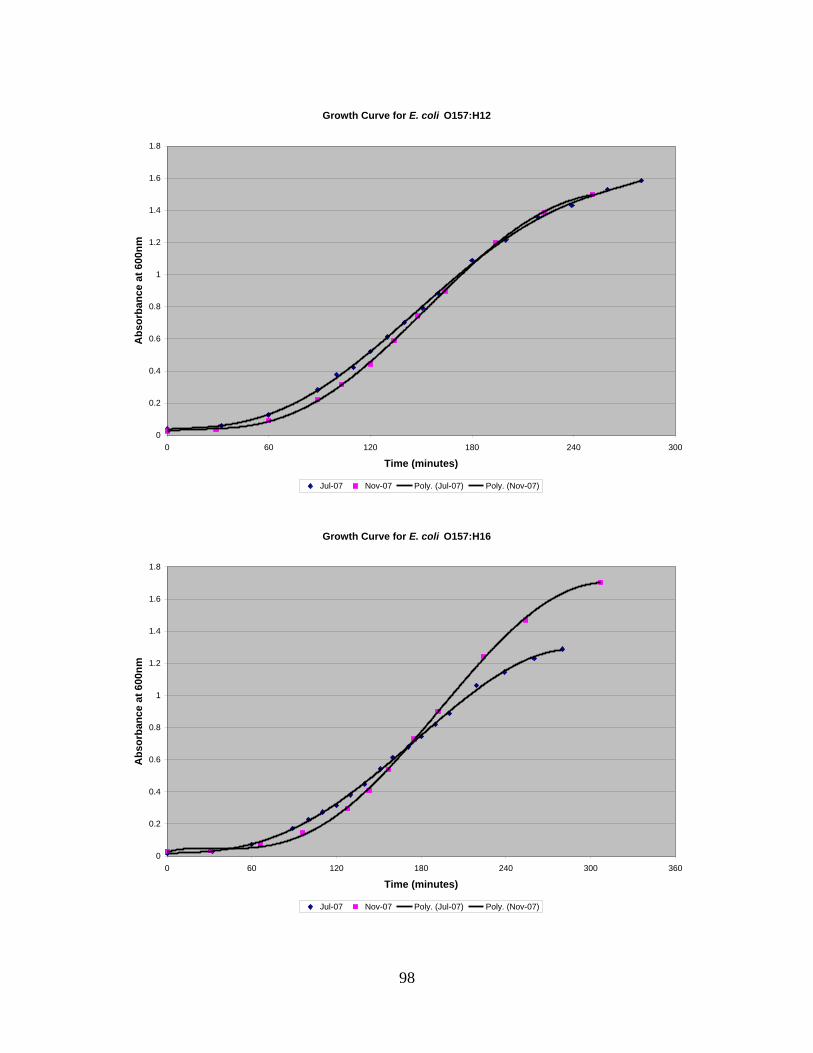
98
Growth Curve for E. coli O157:H12
0
0.2
0.4
0.6
0.8
1
1.2
1.4
1.6
1.8
0 60 120 180 240 300
Time (minutes)
Ab
so
rba
nc
e a
t 6
00
nm
Jul-07 Nov-07 Poly. (Jul-07) Poly. (Nov-07)
Growth Curve for E. coli O157:H16
0
0.2
0.4
0.6
0.8
1
1.2
1.4
1.6
1.8
0 60 120 180 240 300 360
Time (minutes)
Ab
so
rba
nc
e a
t 6
00
nm
Jul-07 Nov-07 Poly. (Jul-07) Poly. (Nov-07)
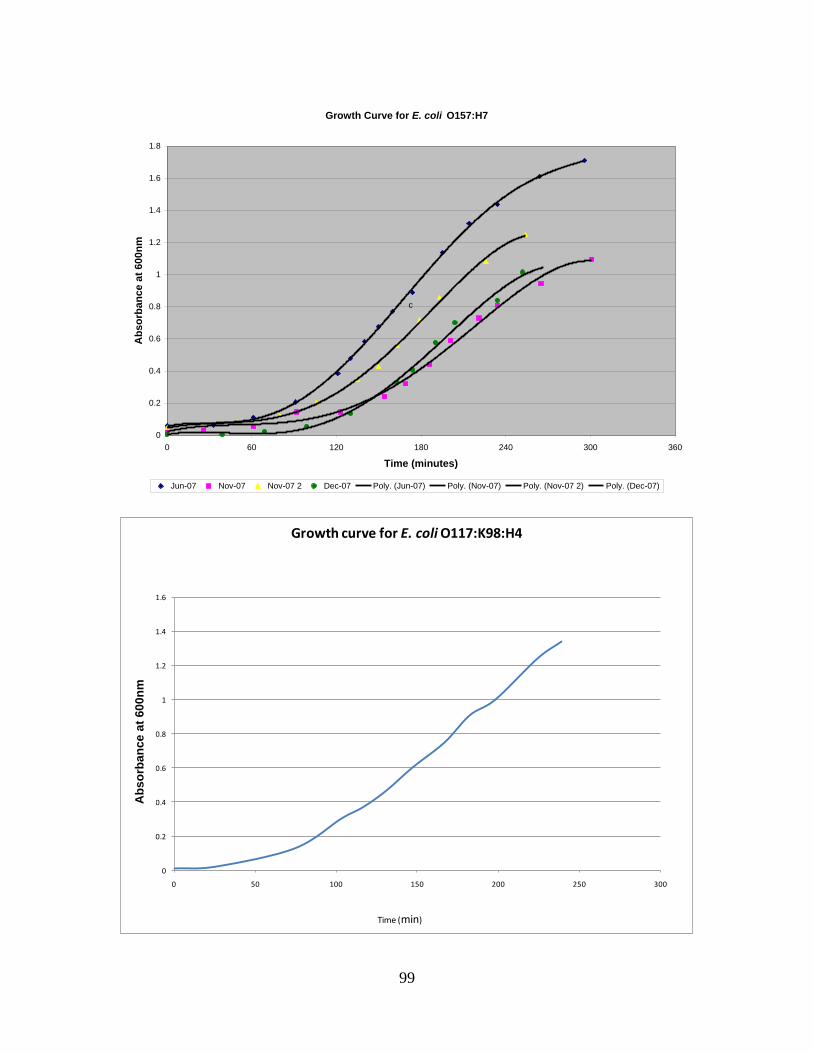
99
Growth Curve for E. coli O157:H7
0
0.2
0.4
0.6
0.8
1
1.2
1.4
1.6
1.8
0 60 120 180 240 300 360
Time (minutes)
Ab
so
rba
nc
e a
t 6
00
nm
Jun-07 Nov-07 Nov-07 2 Dec-07 Poly. (Jun-07) Poly. (Nov-07) Poly. (Nov-07 2) Poly. (Dec-07)
c
0
0.2
0.4
0.6
0.8
1
1.2
1.4
1.6
0 50 100 150 200 250 300
Growth curve for E. coli O117:K98:H4
Time (min)
Ab
sorb
ance
Ab
so
rba
nce
at
60
0n
m
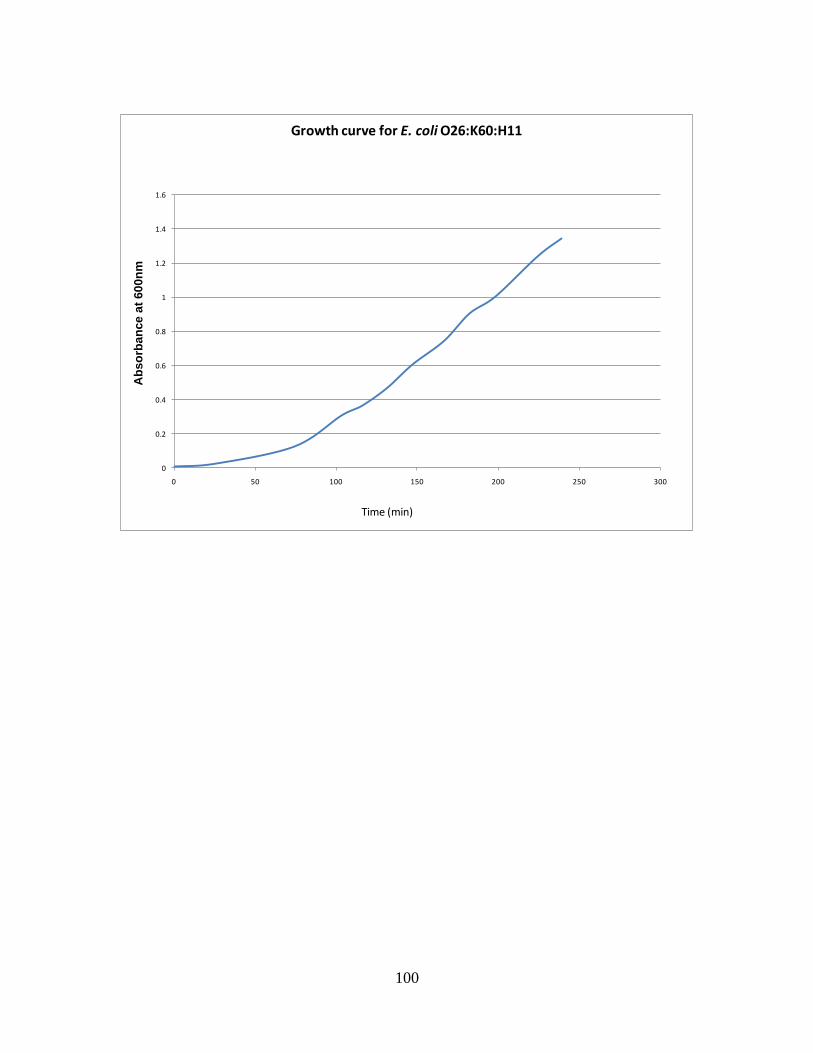
100
0
0.2
0.4
0.6
0.8
1
1.2
1.4
1.6
0 50 100 150 200 250 300
Growth curve for E. coli O26:K60:H11
Time (min)
Ab
sorb
ance
Ab
so
rba
nce
at
60
0n
m
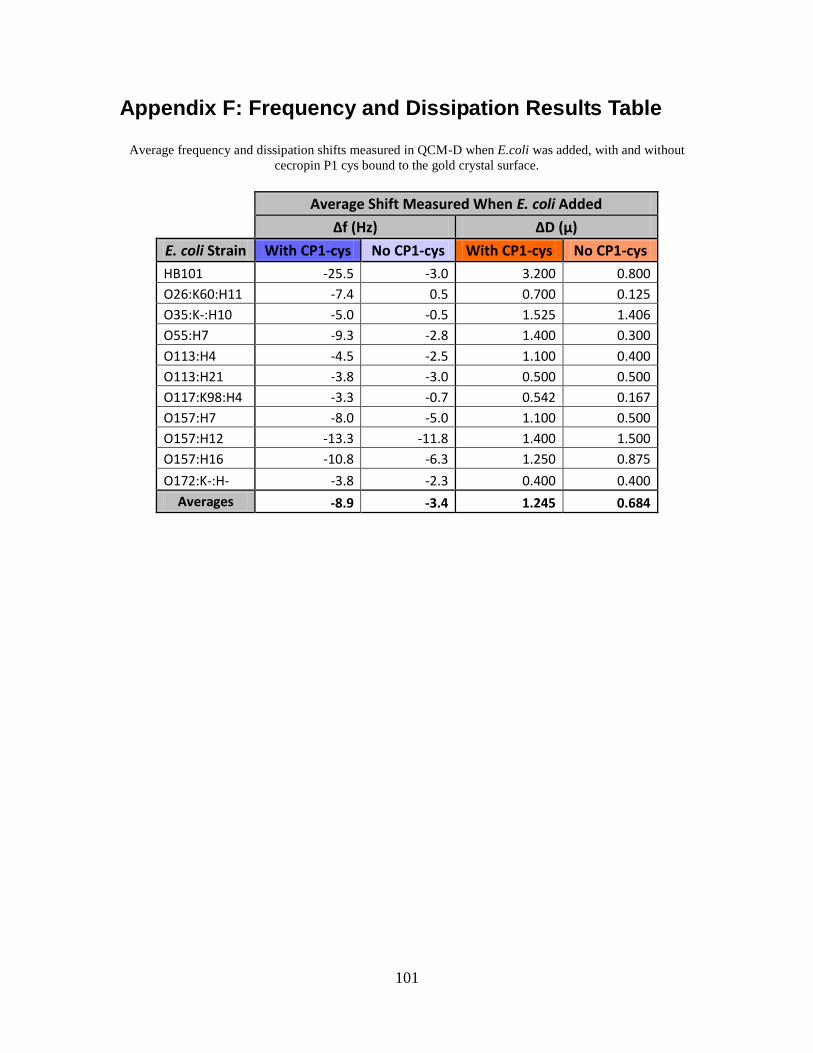
101
Appendix F: Frequency and Dissipation Results Table
Average frequency and dissipation shifts measured in QCM-D when E.coli was added, with and without
cecropin P1 cys bound to the gold crystal surface.
Average Shift Measured When E. coli Added
∆f (Hz) ∆D (μ)
E. coli Strain With CP1-cys No CP1-cys With CP1-cys No CP1-cys
HB101 -25.5 -3.0 3.200 0.800
O26:K60:H11 -7.4 0.5 0.700 0.125
O35:K-:H10 -5.0 -0.5 1.525 1.406
O55:H7 -9.3 -2.8 1.400 0.300
O113:H4 -4.5 -2.5 1.100 0.400
O113:H21 -3.8 -3.0 0.500 0.500
O117:K98:H4 -3.3 -0.7 0.542 0.167
O157:H7 -8.0 -5.0 1.100 0.500
O157:H12 -13.3 -11.8 1.400 1.500
O157:H16 -10.8 -6.3 1.250 0.875
O172:K-:H- -3.8 -2.3 0.400 0.400
Averages -8.9 -3.4 1.245 0.684