Embed Size (px)
Citation preview

Please cite this article in press as: Jiang et al., Utilizing Population Controls in Rare-Variant Case-Parent Association Tests, The AmericanJournal of Human Genetics (2014), http://dx.doi.org/10.1016/j.ajhg.2014.04.014
ARTICLE
Utilizing Population Controlsin Rare-Variant Case-Parent Association Tests
Yu Jiang,1 Glen A. Satten,2 Yujun Han,3 Michael P. Epstein,4 Erin L. Heinzen,3 David B. Goldstein,3
and Andrew S. Allen1,3,*
There is great interest in detecting associations between human traits and rare genetic variation. To address the low power implicit in
single-locus tests of rare genetic variants, many rare-variant association approaches attempt to accumulate information across a gene,
often by taking linear combinations of single-locus contributions to a statistic. Using the right linear combination is key—an optimal
test will up-weight true causal variants, down-weight neutral variants, and correctly assign the direction of effect for causal variants.
Here, we propose a procedure that exploits data from population controls to estimate the linear combination to be used in an case-parent
trio rare-variant association test. Specifically, we estimate the linear combination by comparing population control allele frequencies
with allele frequencies in the parents of affected offspring. These estimates are then used to construct a rare-variant transmission
disequilibrium test (rvTDT) in the case-parent data. Because the rvTDT is conditional on the parents’ data, using parental data in
estimating the linear combination does not affect the validity or asymptotic distribution of the rvTDT. By using simulation, we show
that our new population-control-based rvTDT can dramatically improve power over rvTDTs that do not use population control infor-
mation across a wide variety of genetic architectures. It also remains valid under population stratification. We apply the approach to
a cohort of epileptic encephalopathy (EE) trios and find that dominant (or additive) inherited rare variants are unlikely to play a
substantial role within EE genes previously identified through de novo mutation studies.
Introduction
Genome wide association studies (GWASs) have identified
thousands of disease-associated variants. Though these
variants have often informed on biologic processes
involved in disease, they have explained only a small frac-
tion of the genetic variance of most disease phenotypes.1
Researchers have proposed that rare variants of large effect
may account for this ‘‘missing heritability.’’2,3 Because rare
variants are generally not present in GWAS platforms
and as next-generation sequencing technologies become
economical, many research groups are transitioning
to whole-genome or whole-exome sequencing as their
primary approach to measuring genetic variation.
Compared to common variants, rare variants are more
likely to be mutations of recent origin and therefore
more likely to be population specific. If differences in dis-
ease risk also occur between populations, a strong correla-
tion can be induced between rare variation and disease
risk, even when there is no causal relationship between
variants and disease. This can lead to spurious associations
when analyzing case-control studies of unrelated indi-
viduals. Although various methods have been proposed
to adjust for such spurious correlations in the context of
common variation,4–6 Mathieson and McVean7 have
shown that in certain situations these methods may fail
to correct for spurious association in the context of rare
variation. An alternative strategy to dealing with con-
founding due to population structure is to employ
family-based tests of association such as the transmission
1Department of Biostatistics and Bioinformatics, Duke University, Durham, N
30333, USA; 3Center for Human Genome Variation, Duke University School
Emory University School of Medicine, Atlanta, GA 30322, USA
*Correspondence: [email protected]
http://dx.doi.org/10.1016/j.ajhg.2014.04.014. �2014 by The American Societ
disequilibrium test (TDT). The TDT compares alleles that
are transmitted from parents to an affected offspring
to the alleles that are untransmitted. Deviation from
Mendelian transmission rates is evidence that the site
being tested either is itself a disease locus or is in linkage
disequilibrium with a disease locus. An important
feature of this analysis is that the comparison is within
a family—comparing transmitted to untransmitted
alleles—making the TDT robust to confounding due to
population stratification.
Like other single-locus methods, single-locus TDT
analyses will have low power when the disease-associated
allele is rare. In order to address this problem, current
approaches to analyzing rare genetic variation accumulate
information across a gene or other genetic unit, often by
taking a weighted combination of single-locus contribu-
tions to a score test or other statistic. Using the ‘‘right’’
weighted combination is critical; an optimal test will
up-weight true causal variants and down-weight neutral
variants. Because the true causal loci are unknown, much
of the rare-variant association literature involves identi-
fying flexible approaches to weighting individual loci.8–11
Similar methods have been applied in the context of
rare-variant analyses in family-based designs.12,13
In this manuscript, we propose a rare-variant TDT
(rvTDT) that employs a novel approach to estimating
powerful linear combinations of variants, within a genetic
unit, by utilizing data from population controls. Specif-
ically, we weight loci based on comparing variant fre-
quencies observed in the parents of affected offspring
C 27710, USA; 2Centers for Disease Control and Prevention, Atlanta, GA
of Medicine, Durham, NC 27708, USA; 4Department of Human Genetics,
y of Human Genetics. All rights reserved.
The American Journal of Human Genetics 94, 1–9, June 5, 2014 1

Please cite this article in press as: Jiang et al., Utilizing Population Controls in Rare-Variant Case-Parent Association Tests, The AmericanJournal of Human Genetics (2014), http://dx.doi.org/10.1016/j.ajhg.2014.04.014
with those observed population controls. Because the
rvTDT is conditional on parental genotype, using parental
data in deriving these weights does not affect the validity
or asymptotic distribution of the rvTDT.
In the next section we present a general framework for
deriving rvTDTs.We showhowthis framework leads to stan-
dard burden aswell as ‘‘directionless’’ rare-variant tests anal-
ogous to the sequence kernel association test (SKAT).
Locus-specific coefficients are a feature of each of these tests
and we show how powerful linear combinations can be
derived by comparing parental data with population con-
trols. In the results section, using simulation, we show that
our approach can dramatically improve the power both of
burden and ‘‘directionless’’ rvTDTs across a wide range of
genetic architectures. Finally, we apply these methods to
149 epileptic encephalopathy (EE [MIM 308350]) trios by
using ~6,500 samples from the Exome Sequencing Project
(National Heart, Lung and Blood Institute [NHLBI] Exome
Sequencing Project, Seattle, WA) as population controls.
Material and Methods
A General Framework for Rare-Variant Transmission
Disequilibrium TestsWe begin by characterizing the standard conditional-on-parental-
genotype likelihood14,15 for a single (jth) locus. Thismodel specifies
the distribution of offspring genotypes conditional on parent ge-
notypes and the affection status of the child in terms of a relative
risk disease model that is a function of the child’s genotype and
Mendelian transmission probabilities. Throughout, we will denote
random variables with uppercase letters and realizations of those
random variables by lowercase. We assume that we have a sample
of n parent-offspring trios in which the offspring is affected by
the disorder being studied. Let cij,mij, pij denote the ith trio’s child,
maternal, andpaternal genotypes, respectively, for the jth locus.We
will assume that these will be encoded in terms of the number of
minor alleles observed, so that each genotype can be 0, 1, or 2.
Let A¼ 1 indicate that the offspring is affected and let x be a design
vector that encodes thegenetic effect of theoffspring’s genotypeon
disease risk. In all analyses reported here, we will assume an addi-
tive model, so that x(c) is simply the number of mutant alleles
observed, i.e., x(c) ¼ c. We note that when variants are rare, the
additive and dominant models will approximate each other. Let
Pr(A ¼ 1jC ¼ c)/Pr(A ¼ 1jC ¼ 0) be the risk of an offspring being
affected given they have c copies of the mutant allele relative to
their risk when they have no copies. If we model this relative risk
through the parameter b via Pr(A ¼ 1jC ¼ c)/Pr(A ¼ 1jC ¼ 0) ¼exp[b,x(c)], then the ith trio’s contribution to the conditional-on-
parent likelihood for the jth locus can be written as
LijðbÞ ¼exp
�b,x
�cij��Pr�C ¼ cij jM ¼ mij; P ¼ pij
�P
c0 exp½b,xðc0 Þ�Pr
�C ¼ c0 jM ¼ mij;P ¼ pij
�;where the probability Pr(C ¼ cjM ¼ m, P ¼ p) is the Mendelian
probability of an offspring having genotype c given parental geno-
types m and p and, thus, is made up of known constants.
Differentiating the log-likelihood log [Lij(b)] with respect to b
and evaluating at b¼ 0 gives the ith trio’s contribution to the score
for the jth locus
2 The American Journal of Human Genetics 94, 1–9, June 5, 2014
uij ¼ X�cij��X
c0X�c0�Pr�C ¼ c
0 jM ¼ mij;P ¼ pij�:
A score test for the jth locus can then be formed as
tj ¼�Pn
i¼1uij
�2Pni¼1u
2ij
;
which is a realization of a random variable that asymptotically,
under the null hypothesis (b ¼ 0), will be distributed as chi-square
on 1 degree of freedom.
When variants are rare, single-marker tests will have low power.
A standard approach is to accumulate information across a gene or
other genetic unit.8,9,16,17 One way to do this is to create a gene-
level test by taking linear combinations of score contributions
across a gene. Specifically, assume there are k variants within a
gene and let
ui, ¼Xk
j¼1
ajuij;
where the ajs are coefficients that define the linear combination
and, for now, are assumed to be fixed. A gene-level test statistic
is given by
tLC ¼�Pn
i¼1ui,
�2Pni¼1u
2i,
;
where LC is ‘‘linear combination.’’ Under the global null
hypothesis that none of the k loci in the gene are associated
with the affection status of the offspring, tLC is a realization of
TLC � c21 as n / N.
An alternative approach to accumulating information across a
gene into a gene-level test begins by first summing score contribu-
tions across individuals, i.e., by forming u,j ¼Pn
i¼1uij, and then
taking a linear combination of the resulting squared statistics, i.e.,
tK ¼Xk
j¼1
�aju,j
�2:
The K in tK denotes ‘‘kernel’’ and this statistic is similar in struc-
ture to SKAT and other kernel-based rare-variant association
methods.11,13 As such, it can be shown that, under the global
null hypothesis, tK is a realization of
TK �Xk
j¼1
ljc21;
where lj is the jth eigenvalue of the k 3 k covariance matrix of the
U.js. We can estimate this covariance matrix empirically by
DUTUD;
where U is the n3 kmatrix with i, j component uij and D is the k3
k diagonal matrix with diagonal elements a1,., ak. We use Davies
method to approximate the null distribution of TK.18,19 Note that
both statistics (TLC and TK) are functions of a vector of coefficients
a ¼ (a1, ., ak)T. To make this explicit, we will write TLC(a)
and TK(a).
Incorporating Information from Population ControlsThe power of TLC(a), TK(a), and similar gene-level rare-variant
tests are critically dependent on the choice of a. An optimal test
will up-weight true causal variants, down-weight neutral variants,
and correctly assign the direction of the effect for causal variants.
Previous approaches to choose a have attempted to leverage

Please cite this article in press as: Jiang et al., Utilizing Population Controls in Rare-Variant Case-Parent Association Tests, The AmericanJournal of Human Genetics (2014), http://dx.doi.org/10.1016/j.ajhg.2014.04.014
hypothesized relationships between penetrance and variant fre-
quency8 or have estimated the optimal linear combination from
the data.20 Here we also take a data-driven approach and estimate
a by direct comparison of variant frequencies in parents to those
in a large population control databases. Intuitively, this is exploit-
ing the fact that if a variant is associated with a child being
affected, it will tend to be enriched not only in the offspring but
also in the parents (because all variants found among offspring
must also be present in their parents). Thus this comparison will
be informative for determining which variants are likely to be
important and which are not. However, unlike other methods
that attempt to estimate an optimal linear combination from the
data, the parent/population-control comparison used to estimate
a is orthogonal to the final test and therefore does not affect the
validity or asymptotic distribution of TLC(a) and TK(a) regardless
of whether a is ‘‘correctly’’ estimated or not. A detailed proof of
this claim can be found in Appendix A.
There are many ways one could estimate a from the control/
parent comparison. When individual-level data are available,
one could estimate the coefficients jointly by, for example, fitting
a regularized multivariable logistic regression model, with con-
trol/parent as the outcome, to all the variants being considered
at once. However, there are very large publically available data
sets for which only aggregated summary statistics at each variant
site are given. For example, the Exome Sequencing Project (ESP)
data contain well-characterized, deep coverage, whole-exome
sequencing data on more than 6,500 individuals. However, until
recently, ESP reported only overall genotype counts at each variant
site. This necessitates a marginal approach to estimating the coef-
ficients, where the population controls and the parents’ allele fre-
quencies are compared site-by-site. In simulations (not shown) we
found that the jointly estimated coefficients performed slightly
better than themarginally estimated coefficients when the control
sample size for both analyses was the same. However, themarginal
analysis currently allows the incorporation of much larger control
sets and this was the dominant factor in these analyses, i.e., the
marginal estimates had much higher power when the size of the
control sample size was on the order of ESP than that observed
from a joint analysis applied to the smaller control samples con-
taining individual-level data that are currently available. For this
reason we focus on the marginal estimation of a such that, for
the jth locus, aj is simply a signed value of the Cochran-Armitage
trend test statistic,21 obtained by comparing parents to population
controls. The sign is given by the direction of any allele frequency
differences between cases and controls: when mutations at the jth
locus are more frequent in parents, aj remains positive; when they
are less frequent in parents, aj is made to be negative. We denote
this estimate of a by aPC. We note that individual-level ESP data
are now available through dbGAP.We intend to conduct a detailed
investigation into methods for jointly estimating a in a future
manuscript.
SimulationWe compared the performance of our proposed approach to
several existing tests for rare variant association in parent-
offspring trios by using simulated data. In order to obtain simu-
lated data having linkage disequilibrium patterns that are similar
to true whole-exome sequences, we used a coalescent-based
approach. Specifically, we simulated 100,000 haplotypes of a 20
kb sequence using COSI22 representing the complete sequence
of a gene (i.e., both exons and introns). Because we are attempting
to mimic data generated from a whole-exome sequencing experi-
ment, we extract from these 20 kb sequences 5 randomly located
subregions representing ‘‘captured coding sequences’’ for a total
‘‘coding’’ length of 1.5 kb. We formed genotypes of founders by
randomly sampling haplotypes from this pool. The affection
status (A) of each simulated sample was determined based on its
simulated genotype by randomly sampling from a Bernoulli
random variable with disease probability (i.e., Pr(A ¼ 1)) given
by exp(b0 þ XTb)/(1þ exp(b0 þ XTb)), where X represents a design
vector involving a set of disease-causal variants and b is a vector
encoding the effect of these variants on disease. We assumed a
model in which variants at each locus have the same population
attributable fraction (PAF). This model allows us to control the
fraction of cases whose disease is explained bymutations at a locus
while also parameterizing b in terms of variant frequency. Specif-
ically, this model corresponds to choosing the elements of b to
be jbkj ¼ log(1þ h/(2MAFk)) (see Appendix B), where h is the per-lo-
cusPAFandMAFdenotes theminor allele frequency. The signofb is
chosen so that risk alleles are given a positive sign andprotective al-
leles are given a negative sign. The intercept b0 is related
to the prevalence of disease and is taken to be log(0.05/1�0.05) ¼�2.94. Controls are selected from samples with A ¼ 0. For trios,
we generate parents’ genotypes as above, and then, assuming no
crossover within the gene, generate offspring’s genotype by
randomly selecting one haplotype from each parent. Once the off-
spring’s genotype is generated, we determine the affection status of
the offspring as above and keep only those trios in which the
offspring is affected. We continue this process until we obtain a
sample comprised of 500 trios and 5,000 population controls. We
considered analyses involving both the rare (variants with MAF
less than 0.01) and common (up to a MAF of 0.05) variants. Each
simulation conducted assuming the null hypothesis was based on
10,000 replicates and each simulation conducted assuming an
alternative hypothesis was based on 1,000 replicates.
To confirm that test size is well maintained in the presence of
population stratification as well as population admixture, we
simulated, using COSI,22 two populations: European and African.
We induced confounding due to population stratification by simu-
lating different disease prevalences in the two populations: 0.05
for Europeans and 0.01 for Africans. Following the simulation
scheme detailed above, we simulated 500 case-parent trios and
5,000 population controls, under two scenarios. In the first, we
sampled both trios and controls from a parent population in
which Africans and Europeans were represented in equal propor-
tions, i.e., 50% African and 50% European. In the second, in order
to generate more pronounced bias in estimated coefficients due to
population structure, we simulated a scenario where the popula-
tion control source population had very different population
structure from the parent population from which the trios were
sampled. In particular, we assume the control source population
was comprised of a 20:80 mix of Europeans to Africans, and the
trio-parent population was comprised of an 80:20 mix. We also
simulated admixture. Similar to the second population stratifica-
tion scenario, we generate large differences in admixture propor-
tions between population controls and trios by sampling controls
from a source population in which individuals have an average
admixture proportion that is 80% African and 20% European,
while we sample trios from a parent population in which these
proportions are reversed, i.e., 20% African and 80% European.
Prevalence was taken to be 0.01 in the control source population
and 0.05 in the trio source population. In order to further illustrate
that our approach maintains the correct size even in this extreme
The American Journal of Human Genetics 94, 1–9, June 5, 2014 3
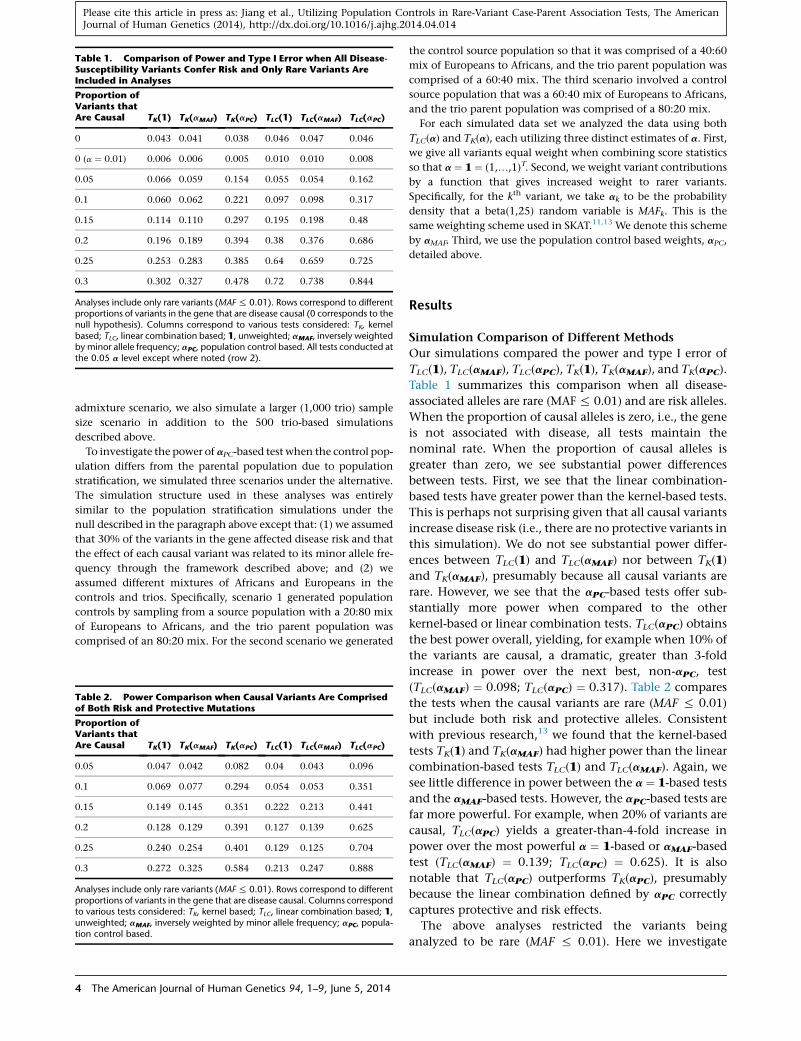
Table 1. Comparison of Power and Type I Error when All Disease-Susceptibility Variants Confer Risk and Only Rare Variants AreIncluded in Analyses
Proportion ofVariants thatAre Causal TK(1) TK(aMAF) TK(aPC) TLC(1) TLC(aMAF) TLC(aPC)
0 0.043 0.041 0.038 0.046 0.047 0.046
0 (a ¼ 0.01) 0.006 0.006 0.005 0.010 0.010 0.008
0.05 0.066 0.059 0.154 0.055 0.054 0.162
0.1 0.060 0.062 0.221 0.097 0.098 0.317
0.15 0.114 0.110 0.297 0.195 0.198 0.48
0.2 0.196 0.189 0.394 0.38 0.376 0.686
0.25 0.253 0.283 0.385 0.64 0.659 0.725
0.3 0.302 0.327 0.478 0.72 0.738 0.844
Analyses include only rare variants (MAF% 0.01). Rows correspond to differentproportions of variants in the gene that are disease causal (0 corresponds to thenull hypothesis). Columns correspond to various tests considered: TK, kernelbased; TLC, linear combination based; 1, unweighted; aMAF, inversely weightedby minor allele frequency; aPC, population control based. All tests conducted atthe 0.05 a level except where noted (row 2).
Please cite this article in press as: Jiang et al., Utilizing Population Controls in Rare-Variant Case-Parent Association Tests, The AmericanJournal of Human Genetics (2014), http://dx.doi.org/10.1016/j.ajhg.2014.04.014
admixture scenario, we also simulate a larger (1,000 trio) sample
size scenario in addition to the 500 trio-based simulations
described above.
To investigate the power of aPC-based test when the control pop-
ulation differs from the parental population due to population
stratification, we simulated three scenarios under the alternative.
The simulation structure used in these analyses was entirely
similar to the population stratification simulations under the
null described in the paragraph above except that: (1) we assumed
that 30% of the variants in the gene affected disease risk and that
the effect of each causal variant was related to its minor allele fre-
quency through the framework described above; and (2) we
assumed different mixtures of Africans and Europeans in the
controls and trios. Specifically, scenario 1 generated population
controls by sampling from a source population with a 20:80 mix
of Europeans to Africans, and the trio parent population was
comprised of an 80:20 mix. For the second scenario we generated
Table 2. Power Comparison when Causal Variants Are Comprisedof Both Risk and Protective Mutations
Proportion ofVariants thatAre Causal TK(1) TK(aMAF) TK(aPC) TLC(1) TLC(aMAF) TLC(aPC)
0.05 0.047 0.042 0.082 0.04 0.043 0.096
0.1 0.069 0.077 0.294 0.054 0.053 0.351
0.15 0.149 0.145 0.351 0.222 0.213 0.441
0.2 0.128 0.129 0.391 0.127 0.139 0.625
0.25 0.240 0.254 0.401 0.129 0.125 0.704
0.3 0.272 0.325 0.584 0.213 0.247 0.888
Analyses include only rare variants (MAF% 0.01). Rows correspond to differentproportions of variants in the gene that are disease causal. Columns correspondto various tests considered: TK, kernel based; TLC, linear combination based; 1,unweighted; aMAF, inversely weighted by minor allele frequency; aPC, popula-tion control based.
4 The American Journal of Human Genetics 94, 1–9, June 5, 2014
the control source population so that it was comprised of a 40:60
mix of Europeans to Africans, and the trio parent population was
comprised of a 60:40 mix. The third scenario involved a control
source population that was a 60:40 mix of Europeans to Africans,
and the trio parent population was comprised of a 80:20 mix.
For each simulated data set we analyzed the data using both
TLC(a) and TK(a), each utilizing three distinct estimates of a. First,
we give all variants equal weight when combining score statistics
so that a ¼ 1 ¼ (1,.,1)T. Second, we weight variant contributions
by a function that gives increased weight to rarer variants.
Specifically, for the kth variant, we take ak to be the probability
density that a beta(1,25) random variable is MAFk. This is the
same weighting scheme used in SKAT.11,13 We denote this scheme
by aMAF. Third, we use the population control based weights, aPC,
detailed above.
Results
Simulation Comparison of Different Methods
Our simulations compared the power and type I error of
TLC(1), TLC(aMAF), TLC(aPC), TK(1), TK(aMAF), and TK(aPC).
Table 1 summarizes this comparison when all disease-
associated alleles are rare (MAF % 0.01) and are risk alleles.
When the proportion of causal alleles is zero, i.e., the gene
is not associated with disease, all tests maintain the
nominal rate. When the proportion of causal alleles is
greater than zero, we see substantial power differences
between tests. First, we see that the linear combination-
based tests have greater power than the kernel-based tests.
This is perhaps not surprising given that all causal variants
increase disease risk (i.e., there are no protective variants in
this simulation). We do not see substantial power differ-
ences between TLC(1) and TLC(aMAF) nor between TK(1)
and TK(aMAF), presumably because all causal variants are
rare. However, we see that the aPC-based tests offer sub-
stantially more power when compared to the other
kernel-based or linear combination tests. TLC(aPC) obtains
the best power overall, yielding, for example when 10% of
the variants are causal, a dramatic, greater than 3-fold
increase in power over the next best, non-aPC, test
(TLC(aMAF) ¼ 0.098; TLC(aPC) ¼ 0.317). Table 2 compares
the tests when the causal variants are rare (MAF % 0.01)
but include both risk and protective alleles. Consistent
with previous research,13 we found that the kernel-based
tests TK(1) and TK(aMAF) had higher power than the linear
combination-based tests TLC(1) and TLC(aMAF). Again, we
see little difference in power between the a ¼ 1-based tests
and the aMAF-based tests. However, the aPC-based tests are
far more powerful. For example, when 20% of variants are
causal, TLC(aPC) yields a greater-than-4-fold increase in
power over the most powerful a ¼ 1-based or aMAF-based
test (TLC(aMAF) ¼ 0.139; TLC(aPC) ¼ 0.625). It is also
notable that TLC(aPC) outperforms TK(aPC), presumably
because the linear combination defined by aPC correctly
captures protective and risk effects.
The above analyses restricted the variants being
analyzed to be rare (MAF % 0.01). Here we investigate

Table 3. Comparison of Power and Type I Error when All Disease-Susceptibility Variants Confer Risk and Both Rare and CommonVariants Are Included in Analyses
Proportion ofVariants thatAre Causal TK(1) TK(aMAF) TK(aPC) TLC(1) TLC(aMAF) TLC(aPC)
0 0.050 0.048 0.050 0.052 0.049 0.050
0(a ¼ 0.01) 0.009 0.009 0.010 0.010 0.009 0.011
0.05 0.059 0.064 0.260 0.054 0.051 0.200
0.1 0.060 0.080 0.387 0.058 0.085 0.438
0.15 0.077 0.175 0.559 0.059 0.154 0.706
0.2 0.090 0.216 0.584 0.098 0.288 0.781
0.25 0.167 0.708 0.931 0.244 0.624 0.975
0.3 0.205 0.749 0.931 0.404 0.805 0.977
Analyses include rare and common variants (MAF% 0.05). Rows correspond todifferent proportions of variants in the gene that are disease causal (0 corre-sponds to the null hypothesis). Columns correspond to various tests consid-ered: TK, kernel based; TLC, linear combination based; 1, unweighted; aMAF,inversely weighted by minor allele frequency; aPC, population control based.All tests conducted at the 0.05 a level except where noted (row 2).
Table 5. Power Comparison under Population Stratification
Scenario TK(1) TK(aMAF) TK(aPC) TLC(1) TLC(aMAF) TLC(aPC)
1 0.566 0.625 0.508 0.761 0.783 0.693
2 0.201 0.232 0.383 0.485 0.525 0.696
3 0.231 0.264 0.447 0.464 0.509 0.735
Scenarios are as follows: 1, population stratification with 80% Africans and20% Europeans in controls and 20% Africans and 80% Europeans in trios; 2,population stratification with 60% Africans and 40% Europeans in controlsand 40% Africans and 60% Europeans in trios; 3, population stratificationwith 40% Africans and 60% Europeans in controls and 20% Africans and80% Europeans in trios. TK, kernel-based test; TLC, linear-combination-based test.
Please cite this article in press as: Jiang et al., Utilizing Population Controls in Rare-Variant Case-Parent Association Tests, The AmericanJournal of Human Genetics (2014), http://dx.doi.org/10.1016/j.ajhg.2014.04.014
the effect of analyzing both rare and common variants, but
where the common variants are in fact neutral. For
simplicity, we simulated under the scenario when all dis-
ease-associated variants are risk alleles. As shown in Table
3, when introducing common neutral variants, TLC(aMAF)
and TK(aMAF) had higher power than the unweighted tests
TLC(1) and TK(1). Because all common variants are neutral
variants, aMAF down-weights these common variants,
minimizing the ‘‘noise’’ that results from analyzing a large
number of neutral variants. However, even so, the aPC-
based test still beat all other methods by a significant
margin. For example, when 10% of variants are causal,
TLC(aPC) showed a greater-than-5-fold increase in power
over the unweighted and aMAF-based tests (TLC(aMAF) ¼0.085; TLC(aPC) ¼ 0.438).
Table 4 summarizes type I error rates for TLC(aPC) and
TK(aPC) for null simulations in the presence of confound-
ing due to population stratification and admixture
Table 4. Type I Error Rate of aPC-Based Tests under PopulationStratification and Population Admixture
Scenario
a ¼ 0.05 a ¼ 0.01
TK(aPC) TLC(aPC) TK(aPC) TLC(aPC)
PS1 0.049 0.048 0.010 0.010
PS2 0.047 0.051 0.011 0.011
ADMIX1 0.053 0.052 0.011 0.010
ADMIX2 0.048 0.049 0.009 0.010
Scenarios are as follows: PS1, population stratification with 50% African and50% European individuals in both controls and trios; PS2, population strati-fication with 80% Africans and 20% Europeans in controls and 20% Africansand 80% Europeans in trios; ADMIX1, population admixture with 500 trios;ADMIX2, population admixture with 1,000 trios. TK, kernel-based test; TLC,linear-combination-based test.
(QQ-plots of these analyses can be seen in Figure S1 avail-
able online). As expected, type I error is well controlled
throughout, further illustrating that utilizing the popula-
tion control based coefficients (aPC) does not affect the
robustness of the rvTDT to population stratification.
Table 5 compares the power of the various tests in the
presence of population stratification. In the extreme
example where 80% of the controls are African (the rest
being European) and the trios were 20% African (the rest
being European), there is a slight loss of power of the
aPC-based tests relative to those tests that do not use pop-
ulation control information. However, even in the pres-
ence of substantial stratification (scenarios 2 and 3), we
see a power gain in using the aPC-based tests, even though
the population control based coefficients (aPC) are prob-
ably biased.
Application to Epileptic Encephalopathy
The epileptic encephalopathies (EEs [MIM 308350]) are a
group of devastating childhood seizure disorders, charac-
terized by early seizure onset and cognitive and behavioral
features associated with ongoing seizure activity. Though
large genetic risk factors have been identified,23 EE is
known to be heterogeneous and is clearly a complex
trait.24 Recent work has pointed to a role for de novo
mutations (i.e., mutations that are present in the affected
child but absent in both parents) in EE etiology.23 Though
such work has identified a number of new EE genes, most
of the trios studied are not explained by de novomutations
in these or other known EE genes. Thus, if these unex-
plained trios have a genetic cause, it is due either to muta-
tions in other ‘‘unknown’’ EE genes or to inherited muta-
tions within the known EE genes. Here, by using the
approach detailed above, we test the second of these possi-
bilities: that inherited variants within known EE genes
contribute to EE risk.
The study was comprised of 264 whole-exome-
sequenced EE trios. This study was carried out in com-
pliance with the institutional review board at Duke Univer-
sity and the relevant ethics boards at the collection sites.
Informed consent was obtained from all study participants
or their legal guardians. For 41 trios, at least one family
member was sequenced via lymphoblastoid cell lines
The American Journal of Human Genetics 94, 1–9, June 5, 2014 5

Table 6. Analysis Results for ‘‘Known’’ Autosomal EpilepticEncephalopathy Genes
SampleSize n-snv
p Values
TK(1) TK(aMAF) TK(aPC) TLC(1) TLC(aMAF) TLC(aPC)
149 109 0.32 0.34 0.34 0.29 0.39 0.38
Columns correspond to various tests considered: TK, kernel based; TLC, linearcombination based; 1, unweighted; aMAF, inversely weighted by minor allelefrequency; aPC, population control based.
Please cite this article in press as: Jiang et al., Utilizing Population Controls in Rare-Variant Case-Parent Association Tests, The AmericanJournal of Human Genetics (2014), http://dx.doi.org/10.1016/j.ajhg.2014.04.014
(LCLs). It is well known that sequence differences can arise
as part of the LCL immortalization process. This was not an
issue for the original study, which focused on de novo
variants, each of which were confirmed via Sanger
sequencing of whole blood. However, confirming all
inherited variants via Sanger sequencing is unrealistic,
and so we restrict our analysis to the 223 trios sequenced
entirely from whole blood. We further restricted our
analysis by excluding trios whose disease was probably
explained by de novo mutations in known EE genes,
resulting in a final analysis data set of 149 trios.
To avoid transmission bias introduced by jointly calling
trio genotypes (i.e., transmitted genotypes would be more
likely to be called), each sample was called separately by
GATK.25 The entire set of 6,503 samples from the exome-
sequencing project (ESP) data set was used as population
controls.14 Before our analysis, we applied a series of qual-
ity control steps. Variants were removed when more than
20% of families had coverage of less than 20 in at least
one family member. Trios were included in analyses of a
given site only if all three family members had 20-fold or
greater coverage at that site.
Because we lack the power to detect reasonable effects
on a per-gene basis, we formed a single test by combining
variants across all the known autosomal EE genes:
SCN1A (MIM 182389), SCN2A (MIM 182390), MAPK10
(MIM 602897), STXBP1 (MIM 602926), SPTAN1 (MIM
182810), KCNT1 (MIM 608167), SLC25A22 (MIM
609302), SCN8A (MIM 600702), GABRB3 (MIM 137192),
PNKP (MIM 605610), KCNQ2 (MIM 602235), and PLCB1
(MIM 607120). Thus we are addressing the question of
whether there is increased transmission of inherited rare
variants across the entire collection of EE genes. We found
no evidence of such increased transmission (Table 6). To
illustrate that our approach controls size in a real data
example, we applied the proposed methods to each
gene in the exomes of these 149 trios. Due to the small
number of trios and the very few number of variants
within each gene, the asymptotic approximation may
not be accurate. Thus, in this analysis, we employ a per-
mutation approach in which recombinations are assumed
not to occur within a gene and transmitted and untrans-
mitted alleles are randomly permuted (this is the same
permutation strategy used in Ionita-Laza et al.13). No
inflation is observed (Figure S2).
Given the null result obtained from this analysis, the
question immediately arises concerning the types of effect
6 The American Journal of Human Genetics 94, 1–9, June 5, 2014
that would have been likely to be detected in the analysis
above. To address this question, with respect to this
particular data set, we conducted a power analysis that
conditioned on the observed parental data but where
transmission from parent to offspring at a collection of
randomly chosen sites was govern by the log relative risk
parameter, via the conditional-on-parent-genotype likeli-
hood. Specifically, we randomly selected a proportion of
rare variants (MAF % 1% in general population) as the
disease-causal alleles. The odds ratios for these variants
were determined by their minor allele frequencies in the
exome-sequencing project, i.e., we let OR ¼ 1 þ h/2MAF,
where h is the per-locus population attributable fraction
(PAF). Transmission from parent to offspring was random,
but we generated the disease status of children by a logistic
model with additive effects of all alleles and retrospectively
selected the affected children for each family. During this
simulation, we assume the transmissions are independent
between each variant.
We would expect that the allele frequency at a true
causal variant would be elevated among both affected
offspring and their parents. Use of the logistic model to
simulate disease status among offspring ensures that causal
allele is more common in affected offspring than it is in
their parents. To model the fact that causal variants will
appear to be enriched in parents relative to population
controls, we note that for low-frequency alleles, the allele
frequency in affected persons should be elevated by a fac-
tor of eb compared to that in population controls. Further,
the allele frequency in parents of affected offspring should
be the average of that in offspring and population controls.
Because we are conditioning our simulation of offspring
genotypes on the parental genotypes in the EE trio data,
this implies that rather than sample population control
alleles according to the allele frequencies in the ESP, we
should instead sample population control data using the
allele frequencies
pPC ¼ pESP2
ð1þ ebÞ
where pESP are the original allele frequencies observed in
the exome sequencing project data and pPC are the allele
frequencies for controls used in our simulation. Note that
when b ¼ 0 (i.e., when the variant is not causal), pPC ¼pESP. We identified which combinations of PAF and causal
allele proportions led to 80% power to detect increased
transmission. As can be seen from Figure 1, this analysis
can exclude genetic architectures comprised of a moderate
proportion of rare variants of large affect. Further, the
power boost obtained by utilizing the population controls
is quite apparent. Though this analysis constitutes the best
powered interrogation of rare inherited risk factors in EE
genes previously identified through de novo mutation
studies, larger sample sizes will be needed to fully
address whether inherited variants within these genes
play an important role in EE etiology.
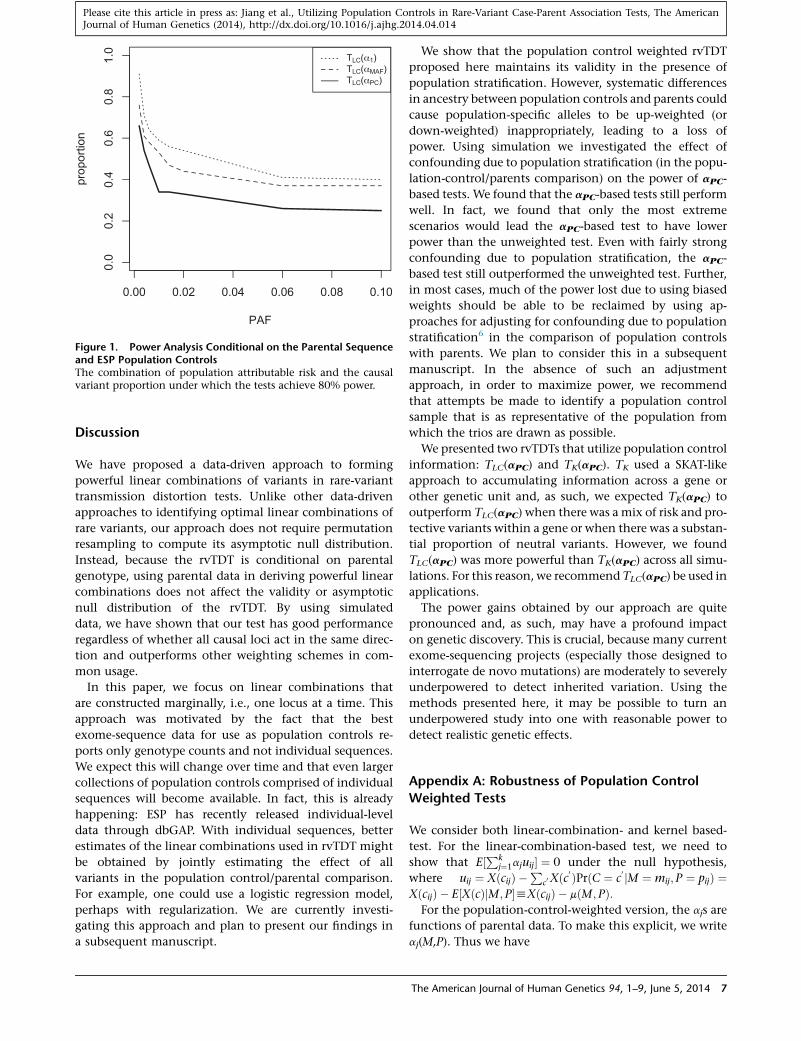
Figure 1. Power Analysis Conditional on the Parental Sequenceand ESP Population ControlsThe combination of population attributable risk and the causalvariant proportion under which the tests achieve 80% power.
Please cite this article in press as: Jiang et al., Utilizing Population Controls in Rare-Variant Case-Parent Association Tests, The AmericanJournal of Human Genetics (2014), http://dx.doi.org/10.1016/j.ajhg.2014.04.014
Discussion
We have proposed a data-driven approach to forming
powerful linear combinations of variants in rare-variant
transmission distortion tests. Unlike other data-driven
approaches to identifying optimal linear combinations of
rare variants, our approach does not require permutation
resampling to compute its asymptotic null distribution.
Instead, because the rvTDT is conditional on parental
genotype, using parental data in deriving powerful linear
combinations does not affect the validity or asymptotic
null distribution of the rvTDT. By using simulated
data, we have shown that our test has good performance
regardless of whether all causal loci act in the same direc-
tion and outperforms other weighting schemes in com-
mon usage.
In this paper, we focus on linear combinations that
are constructed marginally, i.e., one locus at a time. This
approach was motivated by the fact that the best
exome-sequence data for use as population controls re-
ports only genotype counts and not individual sequences.
We expect this will change over time and that even larger
collections of population controls comprised of individual
sequences will become available. In fact, this is already
happening: ESP has recently released individual-level
data through dbGAP. With individual sequences, better
estimates of the linear combinations used in rvTDT might
be obtained by jointly estimating the effect of all
variants in the population control/parental comparison.
For example, one could use a logistic regression model,
perhaps with regularization. We are currently investi-
gating this approach and plan to present our findings in
a subsequent manuscript.
We show that the population control weighted rvTDT
proposed here maintains its validity in the presence of
population stratification. However, systematic differences
in ancestry between population controls and parents could
cause population-specific alleles to be up-weighted (or
down-weighted) inappropriately, leading to a loss of
power. Using simulation we investigated the effect of
confounding due to population stratification (in the popu-
lation-control/parents comparison) on the power of aPC-
based tests. We found that the aPC-based tests still perform
well. In fact, we found that only the most extreme
scenarios would lead the aPC-based test to have lower
power than the unweighted test. Even with fairly strong
confounding due to population stratification, the aPC-
based test still outperformed the unweighted test. Further,
in most cases, much of the power lost due to using biased
weights should be able to be reclaimed by using ap-
proaches for adjusting for confounding due to population
stratification6 in the comparison of population controls
with parents. We plan to consider this in a subsequent
manuscript. In the absence of such an adjustment
approach, in order to maximize power, we recommend
that attempts be made to identify a population control
sample that is as representative of the population from
which the trios are drawn as possible.
We presented two rvTDTs that utilize population control
information: TLC(aPC) and TK(aPC). TK used a SKAT-like
approach to accumulating information across a gene or
other genetic unit and, as such, we expected TK(aPC) to
outperform TLC(aPC) when there was a mix of risk and pro-
tective variants within a gene or when there was a substan-
tial proportion of neutral variants. However, we found
TLC(aPC) was more powerful than TK(aPC) across all simu-
lations. For this reason, we recommend TLC(aPC) be used in
applications.
The power gains obtained by our approach are quite
pronounced and, as such, may have a profound impact
on genetic discovery. This is crucial, because many current
exome-sequencing projects (especially those designed to
interrogate de novo mutations) are moderately to severely
underpowered to detect inherited variation. Using the
methods presented here, it may be possible to turn an
underpowered study into one with reasonable power to
detect realistic genetic effects.
Appendix A: Robustness of Population Control
Weighted Tests
We consider both linear-combination- and kernel based-
test. For the linear-combination-based test, we need to
show that E½Pkj¼1ajuij� ¼ 0 under the null hypothesis,
where uij ¼ XðcijÞ �P
c0Xðc0 ÞPrðC ¼ c
0 jM ¼ mij;P ¼ pijÞ ¼XðcijÞ � E½XðcÞjM;P�hXðcijÞ � mðM; PÞ:For the population-control-weighted version, the ajs are
functions of parental data. To make this explicit, we write
aj(M,P). Thus we have
The American Journal of Human Genetics 94, 1–9, June 5, 2014 7

Please cite this article in press as: Jiang et al., Utilizing Population Controls in Rare-Variant Case-Parent Association Tests, The AmericanJournal of Human Genetics (2014), http://dx.doi.org/10.1016/j.ajhg.2014.04.014
E
"Xk
j¼1
ajuij
#¼
Xk
j¼1
E�ajðM;PÞ�X�cij�� mðM;PÞ�
¼Xk
j¼1
E�E�ajðM;PÞ�X�cij�� mðM;PÞ jM;P
��
¼Xk
j¼1
E�ajðM;PÞE�X�cij�� mðM;PÞ jM; P��
¼Xk
j¼1
E�ajðM;PÞfmðM;PÞ � mðM;PÞg� ¼ 0
Note that this result holds regardless of the weight
function aj(M,P) or whether these weights are ‘‘correctly’’
estimated. The kernel-based test can be written as
Xk
j¼1
�aju,j
�2 ¼ 1TnUDDUT1n
where U is the n 3 kmatrix with i,j component uij and D is
the k3 k diagonal matrix with diagonal elements a1, a2,.ak. Using standard theory of quadratic forms in normal
variables, we can show that the asymptotic distribution
of this statistic will follow a mixture of c2 distribution, un-
der the null hypothesis, as long as DUT1n has expectation
0 (the k dimensional zero vector).
E�DUT1n
� ¼ E
""Xni¼1
a1ui1;Xni¼1
a2ui2;.;Xni¼1
akuik
#T#
However, it is easy to show that E½Pni¼1ajuij� ¼ 0 for all
j with the same conditional expectation argument as
above. Note, again, that this result holds regardless of the
weight function aj(M,P) or whether these weights are
‘‘correctly’’ estimated.
Appendix B: Relationship between Odds Ratio
and PAF
The population attributable risk fraction (PAF) is used to
describe the proportion of disease that can be attributed
to exposure.26,27
PAF ¼ PeðRR� 1Þ1þ PeðRR� 1Þ
where RR is the relative risk of the exposure and Pe is the
prevalence of exposure among the controls. Solving the
equation for RR:
RR ¼ 1þ 1
Pe
PAF
1� PAF
�:
Assuming Hardy-Weinberg equilibrium, let p represented
the frequency of causal alleles,
Pe ¼ 1� ð1� pÞ2z2p
8 The American Journal of Human Genetics 94, 1–9, June 5, 2014
similarly if PAF is small, 1 � PAF z 1, with these two
approximations, we have
RR ¼ 1þ PAF
2p:
When the disease is rare, the odds ratio approximates the
relative risk. In our simulation setting b ¼ log OR gives
b ¼ log
1þ PAF
2p
�:
Supplemental Data
Supplemental Data include two figures and can be found with this
article online at http://dx.doi.org/10.1016/j.ajhg.2014.04.014.
Acknowledgments
We thank the patients and investigators of Epi4k and the Epilepsy
Phenome/Genome project for access to the epileptic encephalo-
pathy data. This work was supported by grants from the National
Institute of Neurological Disorders and Stroke (The Epilepsy
Phenome/Genome Project NS053998; Epi4K Project 1 – Epileptic
Encephalopathies NS077364; Epi4K – Administrative Core
NS077274; Epi4K Sequencing, Biostatistics and Bioinformatics
Core NS077303; and Epi4K – Phenotyping and Clinical Infor-
matics Core NS077276). M.P.E. is a consultant for Amnion Labora-
tories and was also supported by a grant from the National Human
Genome Research Institute (HG007508). The findings and conclu-
sions in this report are those of the authors and do not necessarily
represent the official position of the Centers for Disease Control
and Prevention.
Received: December 31, 2013
Accepted: April 24, 2014
Published: May 15, 2014
Web Resources
The URLs for data presented herein are as follows:
Genetic Analyses in Epileptic Encephalopathies, http://www.ncbi.
nlm.nih.gov/projects/gap/cgi-bin/study.cgi?
study_id¼phs000654.v1.p1
NHLBI Exome Sequencing Project (ESP) Exome Variant Server,
http://evs.gs.washington.edu/EVS/
Online Mendelian Inheritance in Man (OMIM), http://www.
omim.org/
rvTDT package on the Comprehensive R Archive Network, http://
cran.us.r-project.org/web/packages/rvTDT/index.html
References
1. Maher, B. (2008). Personal genomes: The case of the missing
heritability. Nature 456, 18–21.
2. Cirulli, E.T., and Goldstein, D.B. (2010). Uncovering the roles
of rare variants in common disease through whole-genome
sequencing. Nat. Rev. Genet. 11, 415–425.
3. Gibson, G. (2011). Rare and common variants: twenty argu-
ments. Nat. Rev. Genet. 13, 135–145.

Please cite this article in press as: Jiang et al., Utilizing Population Controls in Rare-Variant Case-Parent Association Tests, The AmericanJournal of Human Genetics (2014), http://dx.doi.org/10.1016/j.ajhg.2014.04.014
4. Bacanu, S.A., Devlin, B., and Roeder, K. (2000). The power of
genomic control. Am. J. Hum. Genet. 66, 1933–1944.
5. Kang, H.M., Zaitlen, N.A., Wade, C.M., Kirby, A., Heckerman,
D., Daly, M.J., and Eskin, E. (2008). Efficient control of popu-
lation structure in model organism association mapping. Ge-
netics 178, 1709–1723.
6. Price, A.L., Patterson, N.J., Plenge, R.M., Weinblatt, M.E.,
Shadick, N.A., and Reich, D. (2006). Principal components
analysis corrects for stratification in genome-wide association
studies. Nat. Genet. 38, 904–909.
7. Mathieson, I., and McVean, G. (2012). Differential confound-
ing of rare and common variants in spatially structured popu-
lations. Nat. Genet. 44, 243–246.
8. Madsen, B.E., and Browning, S.R. (2009). A groupwise associa-
tion test for rare mutations using a weighted sum statistic.
PLoS Genet. 5, e1000384.
9. Morgenthaler, S., and Thilly, W.G. (2007). A strategy to
discover genes that carry multi-allelic or mono-allelic risk for
common diseases: a cohort allelic sums test (CAST). Mutat.
Res. 615, 28–56.
10. Neale, B.M., Rivas, M.A., Voight, B.F., Altshuler, D., Devlin, B.,
Orho-Melander, M., Kathiresan, S., Purcell, S.M., Roeder, K.,
and Daly, M.J. (2011). Testing for an unusual distribution of
rare variants. PLoS Genet. 7, e1001322.
11. Wu, M.C., Lee, S., Cai, T., Li, Y., Boehnke, M., and Lin, X.
(2011). Rare-variant association testing for sequencing data
with the sequence kernel association test. Am. J. Hum. Genet.
89, 82–93.
12. De, G., Yip, W.K., Ionita-Laza, I., and Laird, N. (2013).
Rare variant analysis for family-based design. PLoS ONE 8,
e48495.
13. Ionita-Laza, I., Lee, S., Makarov, V., Buxbaum, J.D., and Lin, X.
(2013). Family-based association tests for sequence data, and
comparisons with population-based association tests. Eur. J.
Hum. Genet. 21, 1158–1162.
14. Schaid, D.J., and Sommer, S.S. (1993). Genotype relative risks:
methods for design and analysis of candidate-gene association
studies. Am. J. Hum. Genet. 53, 1114–1126.
15. Self, S.G., Longton, G., Kopecky, K.J., and Liang, K.Y. (1991).
On estimating HLA/disease association with application to a
study of aplastic anemia. Biometrics 47, 53–61.
16. Li, B., and Leal, S.M. (2008). Methods for detecting
associations with rare variants for common diseases: applica-
tion to analysis of sequence data. Am. J. Hum. Genet. 83,
311–321.
17. Price, A.L., Kryukov, G.V., de Bakker, P.I., Purcell, S.M., Staples,
J., Wei, L.J., and Sunyaev, S.R. (2010). Pooled association tests
for rare variants in exon-resequencing studies. Am. J. Hum.
Genet. 86, 832–838.
18. Duchesne, P., and De Micheaux, P.L. (2010). Computing the
distribution of quadratic forms: Further comparisons between
the Liu-Tang-Zhang approximation and exact methods. Com-
put. Stat. Data Anal. 54, 858–862.
19. Davies, R.B. (1980). Algorithm AS 155: The distribution of a
linear combination of chi-square random variables. J. R. Stat.
Soc. Ser. C Appl. Stat. 29, 323–333.
20. Lin, D.Y., and Tang, Z.Z. (2011). A general framework for de-
tecting disease associations with rare variants in sequencing
studies. Am. J. Hum. Genet. 89, 354–367.
21. Guedj, M., Nuel, G., and Prum, B. (2008). A note on allelic
tests in case-control association studies. Ann. Hum. Genet.
72, 407–409.
22. Schaffner, S.F., Foo, C., Gabriel, S., Reich, D., Daly, M.J., and
Altshuler, D. (2005). Calibrating a coalescent simulation of
human genome sequence variation. Genome Res. 15, 1576–
1583.
23. Allen, A.S., Berkovic, S.F., Cossette, P., Delanty, N., Dlugos, D.,
Eichler, E.E., Epstein, M.P., Glauser, T., Goldstein, D.B., Han,
Y., et al.; Epi4K Consortium; Epilepsy Phenome/Genome Proj-
ect (2013). De novo mutations in epileptic encephalopathies.
Nature 501, 217–221.
24. Poduri, A., and Lowenstein, D. (2011). Epilepsy genetics—
past, present, and future. Curr. Opin. Genet. Dev. 21, 325–332.
25. McKenna, A., Hanna, M., Banks, E., Sivachenko, A., Cibul-
skis, K., Kernytsky, A., Garimella, K., Altshuler, D., Gabriel,
S., Daly, M., and DePristo, M.A. (2010). The Genome
Analysis Toolkit: a MapReduce framework for analyzing
next-generation DNA sequencing data. Genome Res. 20,
1297–1303.
26. Choi, B.C. (2010). Population attributable fraction: com-
parison of two mathematical procedures to estimate the
annual attributable number of deaths. Epidemiol. Perspect.
Innov. 7, 8.
27. Northridge, M.E. (1995). Public health methods—attributable
risk as a link between causality and public health action. Am.
J. Public Health 85, 1202–1204.
The American Journal of Human Genetics 94, 1–9, June 5, 2014 9