Embed Size (px)
Citation preview
Mälardalen University Press Licentiate ThesesNo. 200
UTILIZING HARDWARE MONITORING TO IMPROVETHE PERFORMANCE OF INDUSTRIAL SYSTEMS
Marcus Jägemar
2016
School of Innovation, Design and Engineering
Mälardalen University Press Licentiate ThesesNo. 200
UTILIZING HARDWARE MONITORING TO IMPROVETHE PERFORMANCE OF INDUSTRIAL SYSTEMS
Marcus Jägemar
2016
School of Innovation, Design and Engineering

Copyright © Marcus Jägemar, 2016ISBN 978-91-7485-203-5ISSN 1651-9256Printed by Arkitektkopia, Västerås, Sweden
Abstract
THE drastically increasing use of Information and Communications Tech-nology has resulted in a growing demand for network capacity. In thisLicentiate thesis, we show how to monitor, model and finally improve
network performance for large industrial systems. We also show how to usemodeling techniques to move performance testing to an earlier design phase,with the aim to reduce the total development time of large systems. Our firstcontribution is a low-intrusive method for long-term hardware characteristicmeasurements of production nodes located at customer sites. Our second con-tribution is a technique to mimic the hardware usage of a production envi-ronment by creating a characteristics model. The cloned environment makesfunction test suites more realistic. The goal when creating the model is to re-duce the system development time by moving late-stage performance testingto early design phases thereby improving the quality of the test environment.The third and final contribution is a network performance improvement wherewe dynamically trade computational capacity for a message round-trip timereduction when there are CPU cycles to spare. We have implemented an au-tomatic feedback controlled mechanism for transparent message compressionresulting in improved messaging performance between interconnected networknodes. Our mechanism continuously evaluates eleven compression algorithmson message stream content and network congestion level. The message sub-system will use the compression algorithm that provides the lowest messagingtime. If the message content or network load change, a new evaluation is per-formed. We have conducted several case studies in an industrial environmentand verified all contributions on a large telecommunication system manufac-tured by Ericsson. System engineers frequently use the monitoring and model-ing functionality for debugging purposes in production environments. We havedeployed all techniques in a complicated industrial legacy system with minimalimpact. We show that we can provide not only a solution but a cost-effectivesolution, which is an important requirement for industrial systems.
i

Sammanfattning
TELEKOMMUNIKATIONSBRANCHEN star just nu infor en stor utmaningdar kommunikationsprestanda och snabba leveranstider blir allt merviktiga for att positionera sig i den okande konkurrensen. I denna li-
centiatavhandling beskriver vi hur man kan observera, modellera och slutligenforbattra kommunikationsprestandan pa telekommunikationssystem och andrastora industriella datorsystem. Vi visar ocksa hur man kan korta ner den totalautvecklingstiden genom att anvanda modellsystem for prestandautvardering itidiga delar av utvecklingsprocessen.
Det forsta forskningsbidraget ar en fallstudie med en effektiv metod foratt kontinuerligt lasa ut hardvarukaraktaristik fran ett produktionssatt telekom-system. Vi har inriktat oss mot tekniker med lag paverkan pa det system somobserveras, vilket ar lampligt for undersokningar i prestandakritisk produktion-smiljo. Den hardvarukaraktaristik som lasts ut anvander vi i vart andra forskn-ingsbidrag dar vi har skapat en exekveringsmodell som kor pa ett mindre lab-system. Malet med modellen ar 1) att korta ner tiden mellan utvecklingsstartoch prestandatester samt 2) skapa en battre testmiljo for karaktaristiktester. Idet tredje och sista forskningsbidraget presenterar vi en metod for prestanda-forbattringar genom att selektivt komprimera meddelanden om det ger en snab-bare overforingstid i kommunikationssystemet. Flera komprimeringsalgorit-mer utvarderas kontinuerligt och den kompressionsalgoritm som ger kortastoverforingstid anvands for en majoritet av meddelandena. Forandringar i med-delandestrommen eller natverkets utnyttjandegrad overvakas lopande och an-vands vid utvarderingen av de tillgangliga kompressionsalgoritmerna.
All programvaruutveckling och test har genomforts pa ett industriellt tele-kommunikationssystem tillverkat av Ericsson. Alla tekniker ar implementer-ade for bruk i produktionsmiljo och monitorerings- och modelleringsfunktion-aliteten anvands kontinuerligt i felsokningsysfte av produktionssystemet. Detekniker vi presenterar i denna avhandling ger ocksa en kostnadseffektiv los-ning, vilket ar en viktigt krav for industriella system.
iii

To Karolinn

To Karolinn

Acknowledgements
FIRST of all, I would like to thank my supervisors and co-authors, BjornLisper, Sigrid Eldh and Andreas Ermedahl for your patience and help-ful discussions during my studies. I would also like to express grat-
itude towards my manager, Magnus Schlyter, who has always supported methroughout the work on this thesis. The work presented in this Licentiate the-sis has been funded by Ericsson and the Swedish Knowledge Foundation (KKstiftelsen) through the ITS-EASY program at Malardalen University.
Furthermore, thanks to all students in the ITS-EASY research group, we allshare the ups and downs of studying for a PhD; Apala Ray, Daniel Hallmans,Daniel Kade, David Rylander, Eduard Paul Eniou, Fredrik Ekstrand, GaetanaSapienza, Kristian Wiklund, Markus Wallmyr, Mehrdad Saadatmand, MelikaHozhabri, Sara Dersten, Stephan Baumgart, and Tomas Olsson.
I would also like to thank my additional co-authors: Bjorn Lisper, Sigrid Eldh,Andreas Ermedahl, Gordana Dodig-Crnkovic, Rafia Inam, Mikael Sjodin, DanielHallmans, Stig Larsson and Thomas Nolte. I really enjoyed working with you.
I have the greatest gratitude to my parents; my mother and father who alwayswanted me to study hard to become something they never could.
Finally and foremost, I want to express my endless love for Karolinn and ourthree daughters, Amelie, Lovisa and Elise. I would not have been able to writethis thesis without your support and encouragement.
Marcus Jagemar
Sigtuna, May 2016
vii

List of Publications
Included PublicationsA Marcus Jagemar, Sigrid Eldh, Andreas Ermedahl, Bjorn Lisper and
Gabor Andai. Automatic Load Synthesis for Performance Verifica-tion in Early Design Phases. Technical Report, 2016. [68].This technical report, quoted in Chapter 7, is an extension of the al-ready published papers C [64], E [65] and the technical report I [63].
B Marcus Jagemar, Sigrid Eldh, Andreas Ermedahl and Bjorn Lisper.Automatic Message Compression with Overload Protection. In press:Journal of Systems and Software, 2016. [67].This paper, quoted in Chapter 8, is an extension of the already pub-lished paper G [66].
Changes to Included PublicationsPapers A and B are quoted in full but have been reformatted to fit the layoutof this thesis. Chapter 5, includes related work sections of both papers. In asimilar fashion, Chapter 6 contains future work from both papers.
ix
x
Other PublicationsC Marcus Jagemar, Sigrid Eldh, Andreas Ermedahl and Bjorn Lisper.
Towards Feedback-Based Generation of Hardware Characteristics.In Proceedings of the International Workshop on Feedback Comput-ing, 2012. [64]
D Rafia Inam, Mikael Sjodin and Marcus Jagemar. Bandwidth Mea-surement using Performance Counters for Predictable Multicore Soft-ware. Proceedings of the International Conference on Emerging Tech-nologies and Factory Automation (ETFA12), 2012. [58]
E Marcus Jagemar, Sigrid Eldh, Andreas Ermedahl and Bjorn Lisper.Automatic Multi-Core Cache Characteristics Modelling. In Proceed-ings of the Swedish Workshop on Multicore Computing, Halmstad,2013. [65]
F Daniel Hallmans, Marcus Jagemar, Stig Larsson and Thomas Nol-te. Identifying Evolution Problems for Large Long Term IndustrialEvolution Systems. In Proceedings of IEEE International Workshopon Industrial Experience in Embedded Systems Design, Vasteras,2014. [54]
G Marcus Jagemar, Sigrid Eldh, Andreas Ermedahl and Bjorn Lisper.Autonomous Feedback Controlled Message Compression. In Pro-ceedings of Computers, Software and Applications Conference(COMPSAC), Vasteras, 2014. [66]
H Marcus Jagemar and Gordana Dodig-Crnkovic Cognitively Sustain-able ICT with Ubiquitous Mobile Services - Challenges and Oppor-tunities. In Proceedings of the International Conference on SoftwareEngineering (ICSE), Firenze, Italy, 2015. [62]
Other Technical ReportsI Marcus Jagemar, Sigrid Eldh, Andreas Ermedahl and Bjorn Lisper.
Technical Report : Feedback-Based Generation of Hardware Char-acteristics, 2012. [63].

Key Concepts
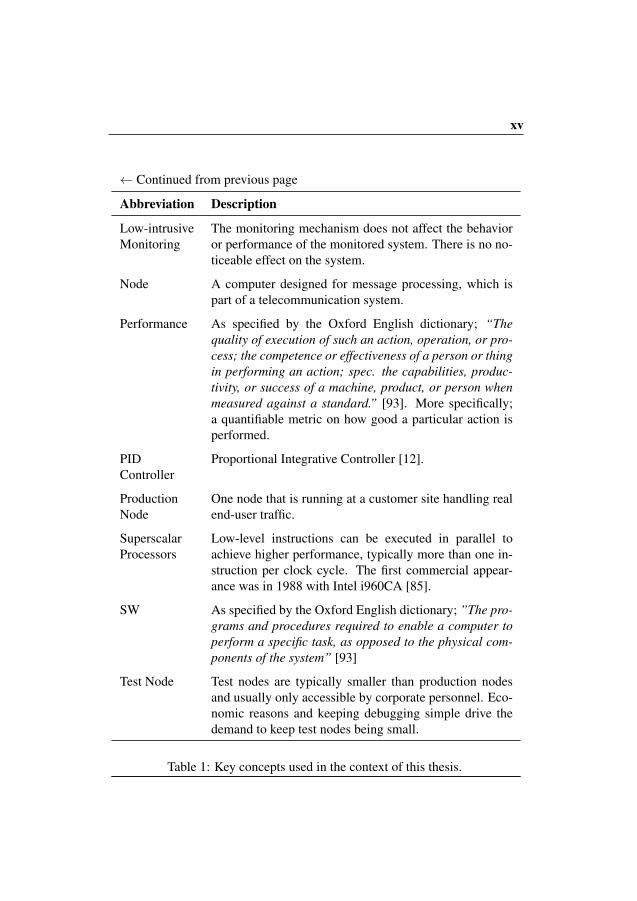
Table 1 lists the most common abbreviations used throughout this thesis.
Key Concept Description
2G (GSM) The second generation telecom network, 1991, intro-duced digital communication.
3G The third telecom network generation, 1998, enabledlarge scale digital communication with increased band-width and service availability.
3GPP 3GPP is a standardization organization created by thetelecommunication industry. 3GPP aims to create aglobal standard that is used for development and main-tenance of telecommunication systems.
4G (LTE) Long Term Evolution is the fourth generation telecom-munication network, 2008, with increased capacity.
Action Re-search (AR)
A research method where the researcher is an active partof an incremental procedure (plan, act/observe and re-flect), which is repeatedly used to improve the objectbeing investigated. AR was first expressed in 1946 byLewin [83]
ASIC Application Specific Integrated Circuits are circuits thatcan be pre-programmed with specific functionality
Continued on next page →
xiii

Key Concepts
Table 1 lists the most common abbreviations used throughout this thesis.
Key Concept Description
2G (GSM) The second generation telecom network, 1991, intro-duced digital communication.
3G The third telecom network generation, 1998, enabledlarge scale digital communication with increased band-width and service availability.
3GPP 3GPP is a standardization organization created by thetelecommunication industry. 3GPP aims to create aglobal standard that is used for development and main-tenance of telecommunication systems.
4G (LTE) Long Term Evolution is the fourth generation telecom-munication network, 2008, with increased capacity.
Action Re-search (AR)
A research method where the researcher is an active partof an incremental procedure (plan, act/observe and re-flect), which is repeatedly used to improve the objectbeing investigated. AR was first expressed in 1946 byLewin [83]
ASIC Application Specific Integrated Circuits are circuits thatcan be pre-programmed with specific functionality
Continued on next page →
xiii
xiv
← Continued from previous page
Abbreviation Description
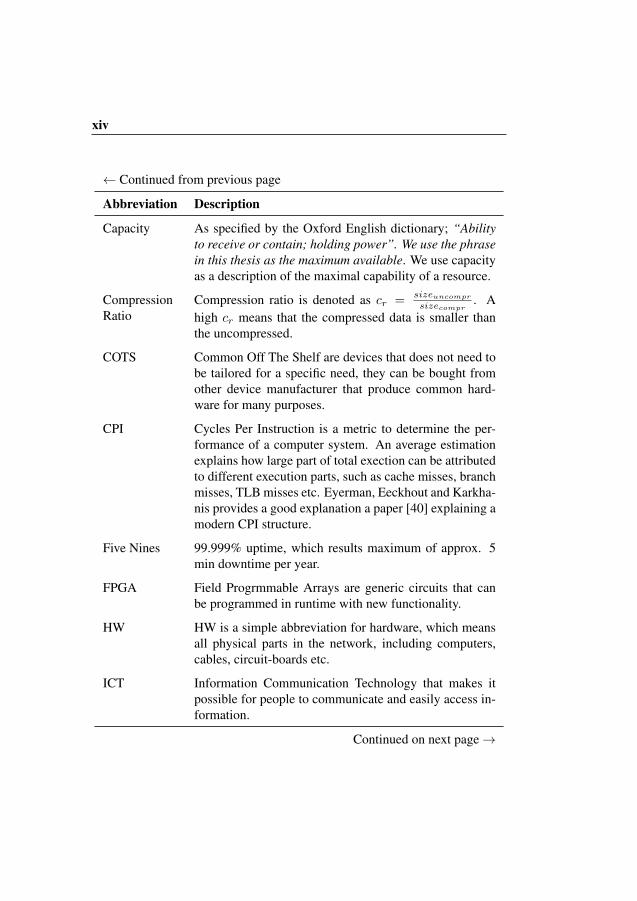
Capacity As specified by the Oxford English dictionary; “Abilityto receive or contain; holding power”. We use the phrasein this thesis as the maximum available. We use capacityas a description of the maximal capability of a resource.
CompressionRatio
Compression ratio is denoted as cr =sizeuncompr
sizecompr. A
high cr means that the compressed data is smaller thanthe uncompressed.
COTS Common Off The Shelf are devices that does not need tobe tailored for a specific need, they can be bought fromother device manufacturer that produce common hard-ware for many purposes.
CPI Cycles Per Instruction is a metric to determine the per-formance of a computer system. An average estimationexplains how large part of total exection can be attributedto different execution parts, such as cache misses, branchmisses, TLB misses etc. Eyerman, Eeckhout and Karkha-nis provides a good explanation a paper [40] explaining amodern CPI structure.
Five Nines 99.999% uptime, which results maximum of approx. 5min downtime per year.
FPGA Field Progrmmable Arrays are generic circuits that canbe programmed in runtime with new functionality.
HW HW is a simple abbreviation for hardware, which meansall physical parts in the network, including computers,cables, circuit-boards etc.
ICT Information Communication Technology that makes itpossible for people to communicate and easily access in-formation.
Continued on next page →
xv
← Continued from previous page
Abbreviation Description
Low-intrusiveMonitoring
The monitoring mechanism does not affect the behavioror performance of the monitored system. There is no no-ticeable effect on the system.
Node A computer designed for message processing, which ispart of a telecommunication system.
Performance As specified by the Oxford English dictionary; “Thequality of execution of such an action, operation, or pro-cess; the competence or effectiveness of a person or thingin performing an action; spec. the capabilities, produc-tivity, or success of a machine, product, or person whenmeasured against a standard.” [93]. More specifically;a quantifiable metric on how good a particular action isperformed.
PIDController
Proportional Integrative Controller [12].
ProductionNode
One node that is running at a customer site handling realend-user traffic.
SuperscalarProcessors
Low-level instructions can be executed in parallel toachieve higher performance, typically more than one in-struction per clock cycle. The first commercial appear-ance was in 1988 with Intel i960CA [85].
SW As specified by the Oxford English dictionary; ”The pro-grams and procedures required to enable a computer toperform a specific task, as opposed to the physical com-ponents of the system” [93]
Test Node Test nodes are typically smaller than production nodesand usually only accessible by corporate personnel. Eco-nomic reasons and keeping debugging simple drive thedemand to keep test nodes being small.
Table 1: Key concepts used in the context of this thesis.
xiv
← Continued from previous page
Abbreviation Description
Capacity As specified by the Oxford English dictionary; “Abilityto receive or contain; holding power”. We use the phrasein this thesis as the maximum available. We use capacityas a description of the maximal capability of a resource.
CompressionRatio
Compression ratio is denoted as cr =sizeuncompr
sizecompr. A
high cr means that the compressed data is smaller thanthe uncompressed.
COTS Common Off The Shelf are devices that does not need tobe tailored for a specific need, they can be bought fromother device manufacturer that produce common hard-ware for many purposes.
CPI Cycles Per Instruction is a metric to determine the per-formance of a computer system. An average estimationexplains how large part of total exection can be attributedto different execution parts, such as cache misses, branchmisses, TLB misses etc. Eyerman, Eeckhout and Karkha-nis provides a good explanation a paper [40] explaining amodern CPI structure.
Five Nines 99.999% uptime, which results maximum of approx. 5min downtime per year.
FPGA Field Progrmmable Arrays are generic circuits that canbe programmed in runtime with new functionality.
HW HW is a simple abbreviation for hardware, which meansall physical parts in the network, including computers,cables, circuit-boards etc.
ICT Information Communication Technology that makes itpossible for people to communicate and easily access in-formation.
Continued on next page →
xv
← Continued from previous page
Abbreviation Description
Low-intrusiveMonitoring
The monitoring mechanism does not affect the behavioror performance of the monitored system. There is no no-ticeable effect on the system.
Node A computer designed for message processing, which ispart of a telecommunication system.
Performance As specified by the Oxford English dictionary; “Thequality of execution of such an action, operation, or pro-cess; the competence or effectiveness of a person or thingin performing an action; spec. the capabilities, produc-tivity, or success of a machine, product, or person whenmeasured against a standard.” [93]. More specifically;a quantifiable metric on how good a particular action isperformed.
PIDController
Proportional Integrative Controller [12].
ProductionNode
One node that is running at a customer site handling realend-user traffic.
SuperscalarProcessors
Low-level instructions can be executed in parallel toachieve higher performance, typically more than one in-struction per clock cycle. The first commercial appear-ance was in 1988 with Intel i960CA [85].
SW As specified by the Oxford English dictionary; ”The pro-grams and procedures required to enable a computer toperform a specific task, as opposed to the physical com-ponents of the system” [93]
Test Node Test nodes are typically smaller than production nodesand usually only accessible by corporate personnel. Eco-nomic reasons and keeping debugging simple drive thedemand to keep test nodes being small.
Table 1: Key concepts used in the context of this thesis.

Contents
I Thesis 3
1 Introduction 71.1 Monitoring a Production System . . . . . . . . . . . . . . . . 81.2 Modeling a Production System . . . . . . . . . . . . . . . . . 81.3 Improving the Communication System . . . . . . . . . . . . . 91.4 Outline . . . . . . . . . . . . . . . . . . . . . . . . . . . . . 10
2 Background 152.1 Telecommunication Standards . . . . . . . . . . . . . . . . . 172.2 Telecommunication Services . . . . . . . . . . . . . . . . . . 192.3 Industrial Systems . . . . . . . . . . . . . . . . . . . . . . . . 202.4 Deploying Our Target System . . . . . . . . . . . . . . . . . 232.5 System Details . . . . . . . . . . . . . . . . . . . . . . . . . 25
3 Research Summary 333.1 Research Questions . . . . . . . . . . . . . . . . . . . . . . . 34
3.1.1 System Monitoring . . . . . . . . . . . . . . . . . . . 343.1.2 System Modeling . . . . . . . . . . . . . . . . . . . . 343.1.3 Improving System Performance . . . . . . . . . . . . 35
3.2 Delimitations . . . . . . . . . . . . . . . . . . . . . . . . . . 363.3 Achievements . . . . . . . . . . . . . . . . . . . . . . . . . . 37
3.3.1 System Monitoring . . . . . . . . . . . . . . . . . . . 373.3.2 System Modeling . . . . . . . . . . . . . . . . . . . . 413.3.3 System Improvement . . . . . . . . . . . . . . . . . . 433.3.4 Message Compression . . . . . . . . . . . . . . . . . 44
3.4 Research Methodology . . . . . . . . . . . . . . . . . . . . . 46
xvii
xviii Contents
3.5 Threats to Validity . . . . . . . . . . . . . . . . . . . . . . . . 473.5.1 Construct Validity . . . . . . . . . . . . . . . . . . . 483.5.2 Internal Validity . . . . . . . . . . . . . . . . . . . . 483.5.3 Conclusion Validity . . . . . . . . . . . . . . . . . . . 493.5.4 Method Applicability . . . . . . . . . . . . . . . . . . 49
4 Contributions 534.1 Publication Mapping . . . . . . . . . . . . . . . . . . . . . . 544.2 Publication Hierarchy and Timeline . . . . . . . . . . . . . . 554.3 Paper A (Based on Papers C, E and I) . . . . . . . . . . . . . 564.4 Paper B (Based on Paper G) . . . . . . . . . . . . . . . . . . 57
5 Related Work 615.1 System Monitoring . . . . . . . . . . . . . . . . . . . . . . . 625.2 System Modeling . . . . . . . . . . . . . . . . . . . . . . . . 635.3 Message and Data Compression . . . . . . . . . . . . . . . . 655.4 Adaptive Compression . . . . . . . . . . . . . . . . . . . . . 66
6 Conclusion and Future Work 716.1 Conclusion . . . . . . . . . . . . . . . . . . . . . . . . . . . 726.2 Future Work . . . . . . . . . . . . . . . . . . . . . . . . . . . 73
Bibliography 74
II Included Papers 89
7 Automatic Load Synthesis for Performance Verification in EarlyDesign Phases 937.1 Introduction . . . . . . . . . . . . . . . . . . . . . . . . . . . 957.2 Background . . . . . . . . . . . . . . . . . . . . . . . . . . . 967.3 Method . . . . . . . . . . . . . . . . . . . . . . . . . . . . . 99
7.3.1 Method Details . . . . . . . . . . . . . . . . . . . . . 1017.4 Target System . . . . . . . . . . . . . . . . . . . . . . . . . . 102
7.4.1 Target System Details . . . . . . . . . . . . . . . . . 1037.5 Implementation . . . . . . . . . . . . . . . . . . . . . . . . . 104
7.5.1 The Characteristics Monitor . . . . . . . . . . . . . . 1057.5.2 The CPI Stack . . . . . . . . . . . . . . . . . . . . . 1067.5.3 The Load Controller . . . . . . . . . . . . . . . . . . 1077.5.4 Generating L1 I-cache Misses . . . . . . . . . . . . . 110
Contents xix
7.5.5 Generating L1 and L2 Data Cache Misses . . . . . . . 1107.5.6 Experimental Setup . . . . . . . . . . . . . . . . . . . 111
7.6 Results . . . . . . . . . . . . . . . . . . . . . . . . . . . . . . 1117.6.1 Running The Test Application With The Load Generator1137.6.2 Production vs. Modeled Characteristics . . . . . . . . 1137.6.3 System Performance Measurement . . . . . . . . . . . 1167.6.4 Performance Prediction When Switching OS . . . . . 117
7.7 Related Work . . . . . . . . . . . . . . . . . . . . . . . . . . 1227.8 Future Work . . . . . . . . . . . . . . . . . . . . . . . . . . . 1247.9 Conclusions . . . . . . . . . . . . . . . . . . . . . . . . . . . 126References . . . . . . . . . . . . . . . . . . . . . . . . . . . . . . . 126
8 Automatic Message Compression with Overload Protection 1328.1 Introduction . . . . . . . . . . . . . . . . . . . . . . . . . . . 134
8.1.1 Definitions . . . . . . . . . . . . . . . . . . . . . . . 1368.2 Problem Formulation and System Model . . . . . . . . . . . . 1368.3 Adaption . . . . . . . . . . . . . . . . . . . . . . . . . . . . 139
8.3.1 The Communication Procedure . . . . . . . . . . . . 1408.3.2 Network Measurements . . . . . . . . . . . . . . . . 1418.3.3 Compression Measurements . . . . . . . . . . . . . . 1418.3.4 Selecting the Best Compression Algorithm . . . . . . 1428.3.5 Compression Throttling . . . . . . . . . . . . . . . . 143
8.4 Test System Setup . . . . . . . . . . . . . . . . . . . . . . . . 1458.4.1 The Test System . . . . . . . . . . . . . . . . . . . . 1458.4.2 Compression Algorithms . . . . . . . . . . . . . . . . 1468.4.3 Putting it All Together . . . . . . . . . . . . . . . . . 1488.4.4 Real-World Compression Throttling . . . . . . . . . . 150
8.5 Results . . . . . . . . . . . . . . . . . . . . . . . . . . . . . . 1518.5.1 Automatic Compression . . . . . . . . . . . . . . . . 1518.5.2 Algorithm Selection Methods . . . . . . . . . . . . . 1538.5.3 Automatic Algorithm Selection for Changing Message
Streams . . . . . . . . . . . . . . . . . . . . . . . . . 1548.5.4 Overload Handling . . . . . . . . . . . . . . . . . . . 156
8.6 Related Work . . . . . . . . . . . . . . . . . . . . . . . . . . 1578.7 Future Work . . . . . . . . . . . . . . . . . . . . . . . . . . . 1608.8 Conclusions . . . . . . . . . . . . . . . . . . . . . . . . . . . 161References . . . . . . . . . . . . . . . . . . . . . . . . . . . . . . . 162


I
Thesis
3

I
Thesis
3

More and better collaboration between academia and the softwareindustry is an important means of achieving the goals of morestudies with high quality and relevance and better transfer of re-search results.
— D. Sjøberg, T. Dyba , M. Jørgensen [111]

More and better collaboration between academia and the softwareindustry is an important means of achieving the goals of morestudies with high quality and relevance and better transfer of re-search results.
— D. Sjøberg, T. Dyba , M. Jørgensen [111]

1Introduction
WE have investigated how to improve the communication performanceof a large-scale telecommunication system [13] with a major marketshare [121]. Our most important driving force is the ever increasing
demand for higher communication capacity. Mobile operators are compelledto make significant investments in more efficient and powerful telecommuni-cation equipment to meet the requests from end-users. As a telecommunica-tion equipment manufacturer, it is getting increasingly important to enhancethe system performance continuously, both for current implementations andby developing new infrastructure. We describe the findings from our work onincreasing the capacity of a large-scale telecommunication system. We havefocused on two ways to improve the communication performance.
The first improvement area investigated by us is how to achieve higher sys-tem capacity by increasing the release rate for new software and hardware. Ourmethod is to reduce the development time by running performance verificationearlier in the development process. Many development processes do perfor-mance verification at the end of the development phase. Our suggestion is tomonitor the hardware characteristics of production systems, Section 1.1, andthen synthesize a hardware usage model, Section 1.2. By using this model, itis possible to test a large part of the performance of newly developed softwareduring the design phase, thus reducing the total development time.
As a second improvement area, we have designed, implemented and useda characteristics measurement tool to systematically monitor and improve theperformance of selected subsystems. In this thesis, we have addressed one per-formance problem where we have reduced the round-trip message time throughselective message compression, Section 1.3.
7
8 Chapter 1. Introduction
1.1 Monitoring a Production System
We have implemented a characteristics monitoring tool aimed for running atcustomer sites. Our goal with the monitoring tool was to get a better under-standing of real-world systems by sampling hardware (HW) characteristics.
Our monitor samples HW events from the CPU or any other low-level HWcomponents. We have grouped these events into sets that represent a certaintype of behavior, for example, cache-usage, TLB-usage, cycles per instruction.
Running a monitoring tool in a production environment pose special re-strictions and requirements such as:
• It must be possible to run the monitor simultaneously to the productionsystem.
• The monitor must have a low probe-effect [43] since it is not allowed toaffect the behavior and performance of production system.
• The monitor must be able to capture long time intervals because the sys-tem behavior changes slowly depending on end-customer usage.
We have addressed the production environment constraints by being very re-strictive when implementing the monitoring application. First, we implementedour application as simple as possible. It is vital that no undesired behavior orfaults occur when running in a sensitive environment. Secondly, we have cho-sen a low HW event sample frequency (1Hz) to reduce the probe effect. Thesampling frequency is sufficient for the slowly changing behavior of our targetsystem.
1.2 Modeling a Production System
We have devised a method that automatically synthesize an HW characteristicsmodel from data obtained by the monitoring tool, see Section 1.1. The modelcan replicate the HW usage of the production system.
Our goal was to create an improved test suite consisting of an HW charac-teristics model together with a functional test suite. Our assumption was thata test suite covering both the functional- and the characteristics perspectiveshould improve testing in the early stages of system development. Improvingthe test suite should also make it possible to discover, primarily performancerelated, bugs earlier in the development process. Finding bugs in the early
1.3 Improving the Communication System 9
design phases adheres well to the desire of reducing the total system develop-ment time since bug-fixing becomes much more difficult and time-consumingfurther from the introduction of the bug.
Our method uses a Proportional Integrative Derivative (PID) controller [12]to synthesize automatically the model from the HW characteristics data ob-tained through our monitoring tool. No manual intervention is needed. Theoverall method is generic and supports any hardware characteristics. The sys-tem we have investigated is IO-bound and mostly limited by cache and memorybandwidth. We have implemented one PID-control loop per characteristics en-tity. In our model, we have used L1-Instruction, L1-Data and L2-Data cacheusage to represent the behavior of the system.
We have evaluated our monitoring and modeling method by synthesizinga model for L1 Instruction-, L1 Data-, and L2 Data cache misses according tothe hardware characteristics extracted from a running production system. Wehave successfully tested the model on a test node together with an unmodi-fied functional test suite. Our experiments show that using our characteristicsmodel during the test of a production system bug fix causes the detected mes-sage round-trip time to increase by 10.8%. Using the traditional performancemeasurement tests results in a 0.75% RTT increase, which may be a too smallchange to be detectable in an automated test suite.
1.3 Improving the Communication System
We have contrived and implemented a mechanism to automatically find anduse a compression algorithm that provides the shortest message Round-TripTime (RTT).
Our goal, when performing this work, was to improve the communicationperformance of our target system. We had already implemented the monitoringtool, Section 1.1, and the characteristics model, Section 1.2 and could use thesetools for performance measurements.
We added a software metric to our monitoring tool, measuring messageRTT. We could deduce that 1) The message RTT varied depending on the net-work congestion levels and 2) The hardware usage varied but was relatively lowin certain conditions. Our assumption was that we could trade computationalcapacity for an increased messaging capacity by using message compression.We defined some critical considerations such as:
10 Chapter 1. Introduction
• The compression algorithm must be selected automatically because themessage content can change over time and depend on the location ofsystem deployment.
• Our mechanism should only use message compression if there are com-putational resources to spare since other co-located services should notstarve.
• Our mechanism must handle overload situations with grace and messagecompression can be resumed when the system has returned to normaloperation.
Our implementation automatically selects the most efficient compressionalgorithm depending on the current message content, CPU-load and networkcongestion level. We have evaluated our implementation by using productionsystem communication data gathered at customer sites and replayed it in a lab(with explicit customer concent). Our experiment shows that the automaticcompression mechanism produces a 9.6% reduction in RTT and that it is re-silient to manually induced overload situations.
1.4 OutlineThe thesis consists of two major parts. The first part puts our research into itscontext and explains the method we have used. The second part contains thescientific papers covered in the thesis.
Part I starts at Chapter 1 with an introduction to performance benchmarkingand modeling of hardware behavior of industrial systems. The thesis continuesin Chapter 2 with further explanations of our target system. We describe stan-dards and functionality supported by the telecommunication system we haveinvestigated. We also describe system setup, design, and structure.
In Chapter 3 we give a detailed summary of our research problems, re-search questions, and research methodology. A summary of our contributionsis presented in Chapter 4. We further contextualize this thesis by reviewing re-lated work in Chapter 5. Chapter 6 concludes part I of the thesis by describingfindings and references to future work.
Part II begins with Chapter 7 where Paper A describes how to monitor andmodel parts of a large scale industrial system. Chapter 8 includes Paper B thatdescribe how to improve the performance of a telecommunication system byusing online message compression.

I believe that many events in my work and life have been a matterof luck or accident. But I am also aware of several occasions onwhich I explicitly made choices to step off the obvious path, anddo something that others thought odd or worse. . . I have come tothink of these events as ’detours’ from the obvious career pathsstretching before me. Frequently these detours have become themain road for me. There are obvious costs to such detours. Otherchoices might have made me richer, more influential, more famous,more productive, and so on. But I like what I am doing, eventhough the path has involved a lot of wandering through unchartedterritory.
— L.D. Brown1
1Quoted from the book by M. Brydon-Miller, D. Greenwood and P. Maguire [20]

2Background
IN this chapter, we will further describe our target system. We start by list-ing telecommunication standards, Section 2.1, and how they relate to cur-rent and future telecommunication services, Section 2.2. The platform we
have worked with supports various standards spanning from 2G (GSM) via 3G(UMTS, WCDMA) and 4G (LTE) and further towards the current 5G standard.The main driver for new communication standards is the growing demand forhigher communication bandwidth. Both traffic applications and remote controlof equipment require low message latency and power efficient communication.
We continue, in Section 2.3, by defining our view of large-scale industrialsystems. Such systems have common attributes such as 1) low acceptance forsystem faults, 2) many simultaneously deployed software and hardware gen-erations within one system, 3) long lifetime spanning several decades, 4) verylarge size and complexity, and 5) continuous development over the completesystem lifespan.
Section 2.4 illustrates our production system, which is an example of alarge-scale industrial system. We show several deployment scenarios and theeffect on system complexity. A complete production system spans from singlecircuit boards with one CPU up to multiple circuit boards with a total of severalthousand of CPU’s.
We conclude this chapter, Section 2.5, with a detailed description of ourtarget system. The system we have investigated has a layered structure usingmany different programming languages and has continuously been developedduring several decades. It is a very large system that is fault-tolerant with highrequirements on uptime and robustness.
15

16 Chapter 2. Background
Telecom.Standard
Max DownLink Speed
FirstIntrod.
Main Features
1G (NMT,C-Nets,AMPS,TACS)
- Early1980
Several different analog stan-dards for mobile voice tele-phony.
2G (GSM) 14.4kbit/scircuit switched,22.8kbit/spacket data [45]
1991 The first mobile phone networkusing digital radio. Introducedservices such as SMS.
→ GPRS 30–100kbit/s 2000 Increased bandwidth over GSM.
→ EDGE 236,8 kbit/s 2003 Increased bandwidth over GSM-GPRS.
3G(UMTS,WCDMA)
384kbit/s 2001 Mobile music and other typesof smart-phone apps started tobe used through more advancedsmart-phones, which changedawareness and increased com-munication bandwidth.
→ HSPA 14.4–672Mbit/s [90] 2010 Increased bandwidth over 3G.
4G (LTE) 100Mbit/s–1Gbit/ 2009 Mobile video.
5G 1Gbit/s to many userssimultaneously
2018 Massive deployment of highbandwidth to mobile users,smart homes, high definitionvideo transmission.
Table 2.1: The most important telecommunication standards and their commu-nication bandwidth linked to the main features introduced by the standard..
2.1 Telecommunication Standards 17
2.1 Telecommunication StandardsTelecommunication systems are complex because they implement several com-munication standards. Standards define how systems should interact and is afundamental tool when connecting different manufacturer’s systems. The stan-dards continuously evolve to reflect customer demands, which drive equipmentmanufacturer to continually develop new features and system improvements.Several standards execute concurrently for efficiency reasons. See Table 2.1for a list of telecommunication standards and their main features.
Groupe Special Mobile (GSM) [120] (2G) was introduced in 1991 and pro-vided the second generation of mobile communication. It was the first commer-cial and widely available mobile communication system that supported digitalcommunication [97]. Needless to say, the GSM system was an astonishingcommercial success with 1B subscribers in 2002 [123] and 3.5B [52] in 2009.The introduction of GSM changed the way people communicate by allowing asignificant portion of the population in industrialized countries to use mobilephones. Several extensions to the GSM standard, GPRS, and EDGE, furtherincreased the communication bandwidth, thus allowing the implementation ofeven more complex services.
In 2001, the third generation (3G) standard was introduced as a responseto customer demands for further increased bandwidth. The 3G standard is alsoknown as Universal Mobile Telecommunication System (UMTS).
A fourth increment (4G) of the telecommunication standard, also calledLong Term Evolution (LTE) [61], was introduced to the market in 2009. At thispoint, a large part of the industrialized world had adapted the “always-online”paradigm. The society, as a whole, looks favorably on mobile broadband andsocial networking services [62] demanding higher capacity in the telecommu-nication infrastructure.
Today, in 2016, we are standing on the brink of the next telecommunicationstandard to be implemented (5G). It is estimated to be released to the market in2020 with substantial improvements compared to LTE [14]. The first improve-ment is a massive increase in bandwidth when there are many simultaneoususers. A drastically reduced latency (below 1ms) is needed to support trafficsafety and industrial infrastructure processes [36]. There is also an increasingdemand for a reduction of energy consumption [21] so that it is environmen-tally friendly [37], while also making it possible to install network nodes inremote places [38] with scarce power supply.
18 Chapter 2. Background
0
2
4
6
8
10
12
2010
2011
2012
2013
2014
2015
2016
2017
2018
2019
Traffi
c [E
xaBy
tes]
Voice CommunicationMobile Phone DataMobile Computer Data
(a) Voice and data traffic.
0
2
4
6
8
10
12
14
16
18
20
2010
2011
2012
2013
2014
2015
2016
2017
2018
2019
Traffi
c [E
xaBy
tes]
SumVideoAudio,Web,File sharing,Social Networking Services
(b) Mobile application traffic.
Figure 2.1: World-wide market outlook for mobile traffic 2010 – 2019 [34].Previously published in Paper H [62].
0.2
0.4
0.6
0.8
1
1.2
Jan-
2008
Jul-2
008
Jan-
2009
Jul-2
009
Jan-
2010
Jul-2
010
Jan-
2011
Jul-2
011
Jan-
2012
Jul-2
012
Jan-
2013
Jul-2
013
Jan-
2014
Jul-2
014
0
20
40
60
80
100
Avai
labl
e Ap
ps [M
x#]
Dow
nloa
ded
Apps
[Bx#
]Available Apple AppsAvailable Google AppsApple DownloadsGoogle Downloads
Figure 2.2: Download-statistics for mobile phone application [1,9,10,59,118].Previously published in Paper H [62].
2.2 Telecommunication Services 19
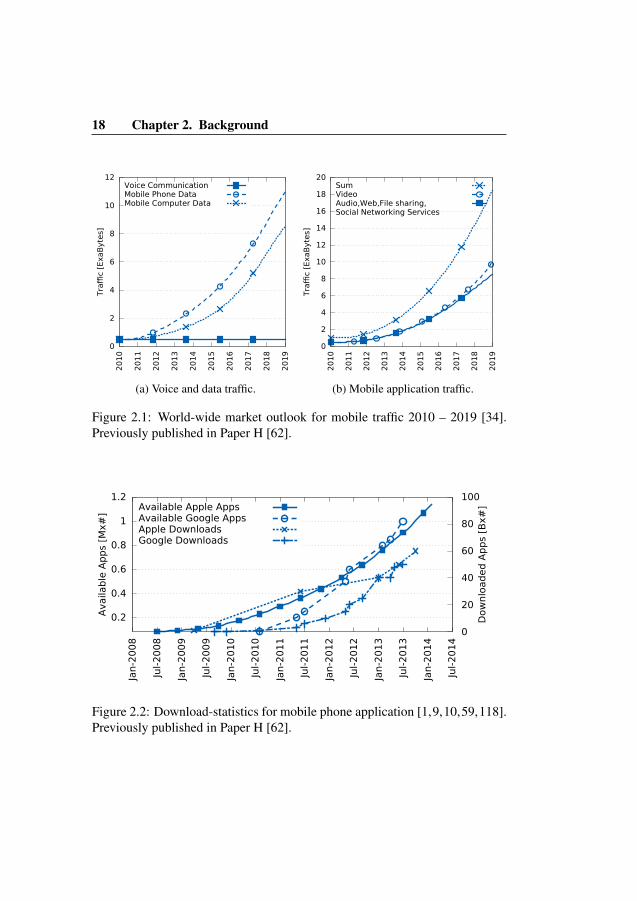
2.2 Telecommunication ServicesThe introduction of mobile phones quicky made voice communication the mostimportant service. It was the natural way to extend the already existing wirebound voice service into the mobile era. Voice services have now reached itspeak from a capacity perspective [34], see Figure 2.1a. It is also apparent thatdata communication is rapidly increasing for both mobile phones and mobilecomputers. A report [35] by Ericsson Consumer Lab attributes the increaseddata usage to three main usage areas:
• Streaming services are quickly gaining acceptance among the populationand include on-demand services such as music, pay-per-view TV andmovies. Ericsson estimates that mobile video will be one of the mostrequested services in the coming years (2010–2019), see Figure 2.1b.
• Home appliance monitoring is increasing rapidly. For example waterflood monitoring, heat and light control, refrigerator warning systems,coffee-machine refill sensors, entry and leave detection and much more.
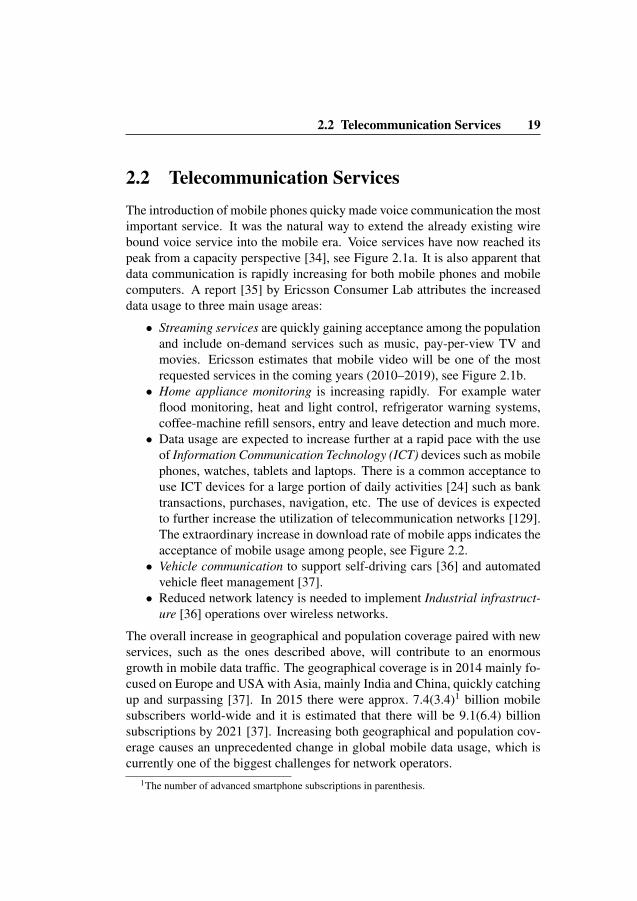
• Data usage are expected to increase further at a rapid pace with the useof Information Communication Technology (ICT) devices such as mobilephones, watches, tablets and laptops. There is a common acceptance touse ICT devices for a large portion of daily activities [24] such as banktransactions, purchases, navigation, etc. The use of devices is expectedto further increase the utilization of telecommunication networks [129].The extraordinary increase in download rate of mobile apps indicates theacceptance of mobile usage among people, see Figure 2.2.
• Vehicle communication to support self-driving cars [36] and automatedvehicle fleet management [37].
• Reduced network latency is needed to implement Industrial infrastruct-ure [36] operations over wireless networks.
The overall increase in geographical and population coverage paired with newservices, such as the ones described above, will contribute to an enormousgrowth in mobile data traffic. The geographical coverage is in 2014 mainly fo-cused on Europe and USA with Asia, mainly India and China, quickly catchingup and surpassing [37]. In 2015 there were approx. 7.4(3.4)1 billion mobilesubscribers world-wide and it is estimated that there will be 9.1(6.4) billionsubscriptions by 2021 [37]. Increasing both geographical and population cov-erage causes an unprecedented change in global mobile data usage, which iscurrently one of the biggest challenges for network operators.
1The number of advanced smartphone subscriptions in parenthesis.
18 Chapter 2. Background
0
2
4
6
8
10
12
2010
2011
2012
2013
2014
2015
2016
2017
2018
2019
Traffi
c [E
xaBy
tes]
Voice CommunicationMobile Phone DataMobile Computer Data
(a) Voice and data traffic.
0
2
4
6
8
10
12
14
16
18
20
2010
2011
2012
2013
2014
2015
2016
2017
2018
2019
Traffi
c [E
xaBy
tes]
SumVideoAudio,Web,File sharing,Social Networking Services
(b) Mobile application traffic.
Figure 2.1: World-wide market outlook for mobile traffic 2010 – 2019 [34].Previously published in Paper H [62].
0.2
0.4
0.6
0.8
1
1.2
Jan-
2008
Jul-2
008
Jan-
2009
Jul-2
009
Jan-
2010
Jul-2
010
Jan-
2011
Jul-2
011
Jan-
2012
Jul-2
012
Jan-
2013
Jul-2
013
Jan-
2014
Jul-2
014
0
20
40
60
80
100
Avai
labl
e Ap
ps [M
x#]
Dow
nloa
ded
Apps
[Bx#
]Available Apple AppsAvailable Google AppsApple DownloadsGoogle Downloads
Figure 2.2: Download-statistics for mobile phone application [1,9,10,59,118].Previously published in Paper H [62].
2.2 Telecommunication Services 19
2.2 Telecommunication ServicesThe introduction of mobile phones quicky made voice communication the mostimportant service. It was the natural way to extend the already existing wirebound voice service into the mobile era. Voice services have now reached itspeak from a capacity perspective [34], see Figure 2.1a. It is also apparent thatdata communication is rapidly increasing for both mobile phones and mobilecomputers. A report [35] by Ericsson Consumer Lab attributes the increaseddata usage to three main usage areas:
• Streaming services are quickly gaining acceptance among the populationand include on-demand services such as music, pay-per-view TV andmovies. Ericsson estimates that mobile video will be one of the mostrequested services in the coming years (2010–2019), see Figure 2.1b.
• Home appliance monitoring is increasing rapidly. For example waterflood monitoring, heat and light control, refrigerator warning systems,coffee-machine refill sensors, entry and leave detection and much more.
• Data usage are expected to increase further at a rapid pace with the useof Information Communication Technology (ICT) devices such as mobilephones, watches, tablets and laptops. There is a common acceptance touse ICT devices for a large portion of daily activities [24] such as banktransactions, purchases, navigation, etc. The use of devices is expectedto further increase the utilization of telecommunication networks [129].The extraordinary increase in download rate of mobile apps indicates theacceptance of mobile usage among people, see Figure 2.2.
• Vehicle communication to support self-driving cars [36] and automatedvehicle fleet management [37].
• Reduced network latency is needed to implement Industrial infrastruct-ure [36] operations over wireless networks.
The overall increase in geographical and population coverage paired with newservices, such as the ones described above, will contribute to an enormousgrowth in mobile data traffic. The geographical coverage is in 2014 mainly fo-cused on Europe and USA with Asia, mainly India and China, quickly catchingup and surpassing [37]. In 2015 there were approx. 7.4(3.4)1 billion mobilesubscribers world-wide and it is estimated that there will be 9.1(6.4) billionsubscriptions by 2021 [37]. Increasing both geographical and population cov-erage causes an unprecedented change in global mobile data usage, which iscurrently one of the biggest challenges for network operators.
1The number of advanced smartphone subscriptions in parenthesis.
20 Chapter 2. Background
Node
Node
Node
Node
Node
Node Node
Node
NodeNode
Node
Node
Node
Inte
rfac
e
Interface
Stan
dard
ized
Stan
dard
ized
Inte
rfac
e
Stan
dard
ized
Industrial System
InterfacesInternal
Internet
Standardized
Interface
Other Industrial System
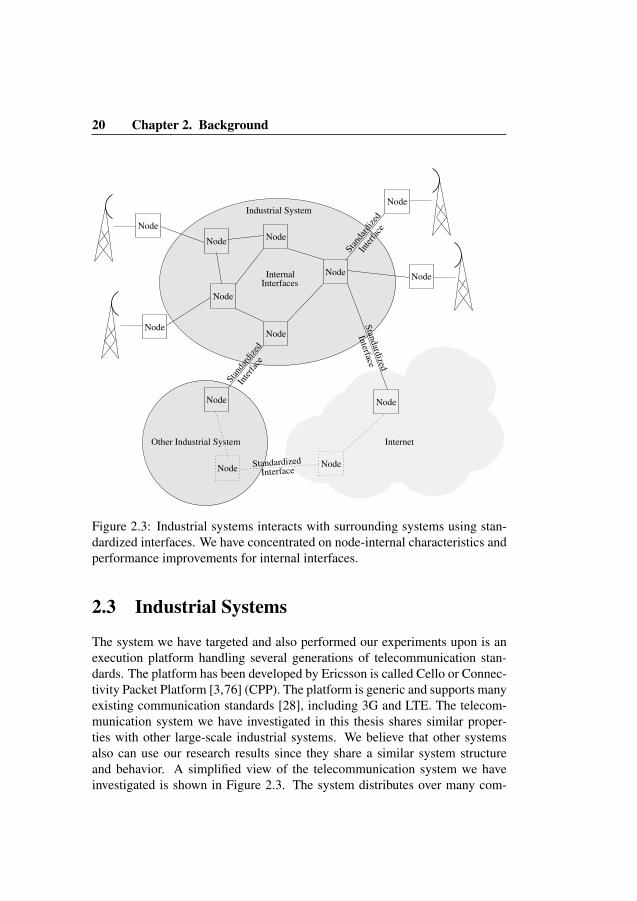
Figure 2.3: Industrial systems interacts with surrounding systems using stan-dardized interfaces. We have concentrated on node-internal characteristics andperformance improvements for internal interfaces.
2.3 Industrial Systems
The system we have targeted and also performed our experiments upon is anexecution platform handling several generations of telecommunication stan-dards. The platform has been developed by Ericsson is called Cello or Connec-tivity Packet Platform [3,76] (CPP). The platform is generic and supports manyexisting communication standards [28], including 3G and LTE. The telecom-munication system we have investigated in this thesis shares similar proper-ties with other large-scale industrial systems. We believe that other systemsalso can use our research results since they share a similar system structureand behavior. A simplified view of the telecommunication system we haveinvestigated is shown in Figure 2.3. The system distributes over many com-
2.3 Industrial Systems 21
puters, denoted nodes. Internal nodes that implement a subset of the systemfunctionality does not necessarily use standardized communication protocols.Performance improvements can, therefore, be achieved using proprietary pro-tocol implementations. Standardized communication is, of course, necessaryfor external communication. We have defined [54] behavioral patterns that arecommon to industrial and telecommunication systems, for example:
• There is a low acceptance for system downtime.
• There are multiple concurrent hardware and software generations.
• The lifetime spans over several decades.
• The size and system complexity causes long lead-times when developingnew functionality.
• Substantial internal communication between nodes inside the industrialsystem. External connections are often using standardized protocols, forexample 3GPP for telecommunication systems, Figure 2.3.
We have tried to generalize our research results as far as possible. In general,our research results should be applicable for many other systems sharing thesame structure and behavior as the telecommunication system we have investi-gated. Some industrial systems are located in large server facilities, providingeasy access for engineers and scientists. Other industrial systems are locatedin “friendly” places where a support engineer can access them and extract anyinformation needed. Telecommunication systems are typically deployed in adifferent environment. Most network operators have their own infrastructurewhere the telecommunication nodes are located. Support and maintenance per-sonnel is often employed by the operator. In the rare cases when the operatorreceives support help from the equipment manufacturer, they are not given fullaccess to the nodes. Such restrictions makes it difficult to monitor hardwarecharacteristics for production nodes. Operators are traditionally very restric-tive towards running diagnostics, test programs or monitoring tools that are notverified as production level software.
Physical access restrictions also make it vital to have adequate error han-dling that gathers enough information when a fault occurs. It is not possibleto retrieve additional troubleshooting information at a later time meaning thatall necessary information must be packaged together with the trouble report.The scenario of restricted node access is one aspect we have tried to address inthe work leading up to this thesis. System developers have always demandedhardware characteristics measurements for production nodes, but it has beenhard to obtain such information.
20 Chapter 2. Background
Node
Node
Node
Node
Node
Node Node
Node
NodeNode
Node
Node
Node
Inte
rfac
e
Interface
Stan
dard
ized
Stan
dard
ized
Inte
rfac
e
Stan
dard
ized
Industrial System
InterfacesInternal
Internet
Standardized
Interface
Other Industrial System
Figure 2.3: Industrial systems interacts with surrounding systems using stan-dardized interfaces. We have concentrated on node-internal characteristics andperformance improvements for internal interfaces.
2.3 Industrial Systems
The system we have targeted and also performed our experiments upon is anexecution platform handling several generations of telecommunication stan-dards. The platform has been developed by Ericsson is called Cello or Connec-tivity Packet Platform [3,76] (CPP). The platform is generic and supports manyexisting communication standards [28], including 3G and LTE. The telecom-munication system we have investigated in this thesis shares similar proper-ties with other large-scale industrial systems. We believe that other systemsalso can use our research results since they share a similar system structureand behavior. A simplified view of the telecommunication system we haveinvestigated is shown in Figure 2.3. The system distributes over many com-
2.3 Industrial Systems 21
puters, denoted nodes. Internal nodes that implement a subset of the systemfunctionality does not necessarily use standardized communication protocols.Performance improvements can, therefore, be achieved using proprietary pro-tocol implementations. Standardized communication is, of course, necessaryfor external communication. We have defined [54] behavioral patterns that arecommon to industrial and telecommunication systems, for example:
• There is a low acceptance for system downtime.
• There are multiple concurrent hardware and software generations.
• The lifetime spans over several decades.
• The size and system complexity causes long lead-times when developingnew functionality.
• Substantial internal communication between nodes inside the industrialsystem. External connections are often using standardized protocols, forexample 3GPP for telecommunication systems, Figure 2.3.
We have tried to generalize our research results as far as possible. In general,our research results should be applicable for many other systems sharing thesame structure and behavior as the telecommunication system we have investi-gated. Some industrial systems are located in large server facilities, providingeasy access for engineers and scientists. Other industrial systems are locatedin “friendly” places where a support engineer can access them and extract anyinformation needed. Telecommunication systems are typically deployed in adifferent environment. Most network operators have their own infrastructurewhere the telecommunication nodes are located. Support and maintenance per-sonnel is often employed by the operator. In the rare cases when the operatorreceives support help from the equipment manufacturer, they are not given fullaccess to the nodes. Such restrictions makes it difficult to monitor hardwarecharacteristics for production nodes. Operators are traditionally very restric-tive towards running diagnostics, test programs or monitoring tools that are notverified as production level software.
Physical access restrictions also make it vital to have adequate error han-dling that gathers enough information when a fault occurs. It is not possibleto retrieve additional troubleshooting information at a later time meaning thatall necessary information must be packaged together with the trouble report.The scenario of restricted node access is one aspect we have tried to address inthe work leading up to this thesis. System developers have always demandedhardware characteristics measurements for production nodes, but it has beenhard to obtain such information.
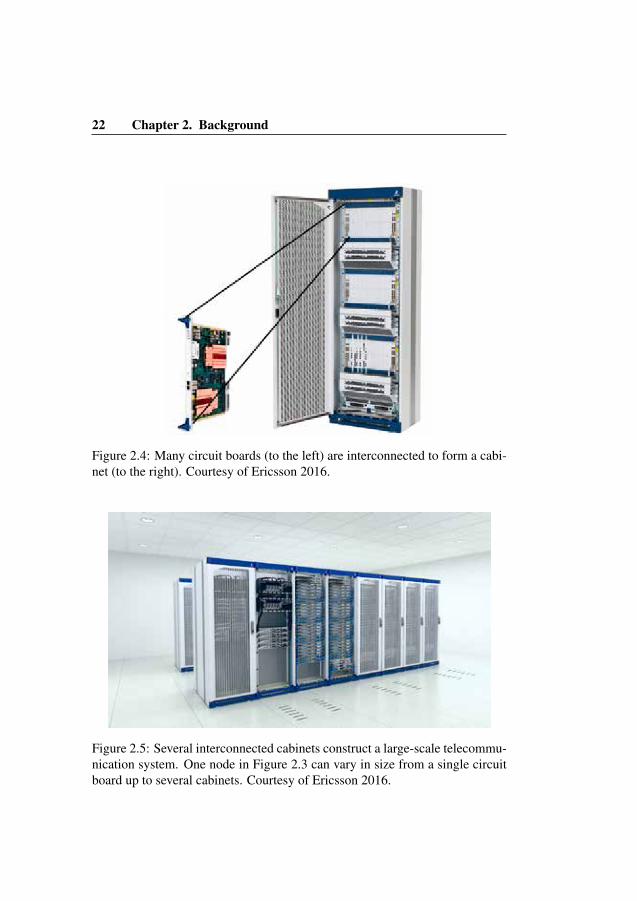
22 Chapter 2. Background
Figure 2.4: Many circuit boards (to the left) are interconnected to form a cabi-net (to the right). Courtesy of Ericsson 2016.
Figure 2.5: Several interconnected cabinets construct a large-scale telecommu-nication system. One node in Figure 2.3 can vary in size from a single circuitboard up to several cabinets. Courtesy of Ericsson 2016.
2.4 Deploying Our Target System 23
Figure 2.6: Complex lab test environment. Courtesy of Ericsson 2016.
2.4 Deploying Our Target SystemThe physical layout of a telecommunication system is governed by strict rules.One cabinet, to the right in Figure 2.4, consists of three vertically mountedsub-racks. Each sub-rack holds up to 20 circuit boards, illustrated to the left inFigure 2.4. In total, a cabinet sums up to approximately 20 ∗ 3 = 60 circuitboards, depending on the desired configuration. Several cabinets can be con-nected to form a large-scale node, see Figure 2.5. Each circuit board can haveseveral CPUs with multiples of 10’s of cores each. In total the largest systemscan consists of thousands of CPU’s.
It is possible to deploy the system in several different levels, which is par-ticularly useful for testing purposes. Running one board by itself provides themost basic level of system used for low-level testing. A slightly bigger systemis achieved when at least two boards are interconnected to form a small cluster.This level of system is useful for verifying cluster functionality. Much morecomplex testing scenarios can be formed by configuring larger nodes, suchas Figure 2.6. These type of nodes are seldom available for software designpurposes since they are very costly. Large-scale nodes are mainly used whentesting complex traffic scenarios and for performance related verification.
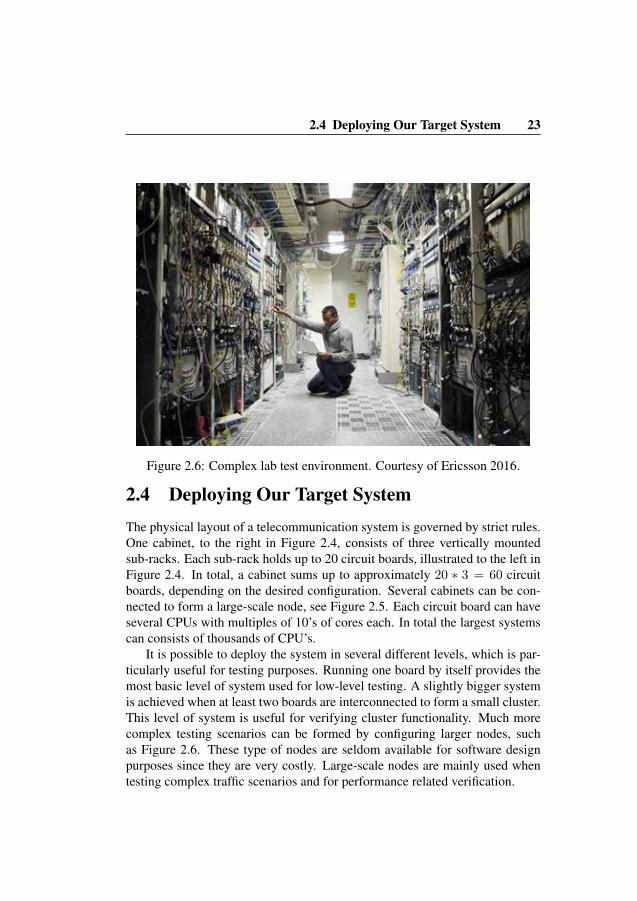

24 Chapter 2. Background
3
5
4
Lo
gic
Bu
sin
ess
2
Har
dw
are
1
Pla
tfo
rm
BA C
Latest
Local Adjustments
Legacy
Cluster Functions
Application
Operating System
Target Specific Drivers
Generic Drivers
Figure 2.7: There are five abstraction levels (right) implementing the completesystem spanning from hardware to business logic (left). There are multiplehardware implementations (bottom) spanning from legacy single-core proces-sors (1–A) to advanced multi-core processors (1–C). The same platform (2-4)and application (5) supports all hardware implementations.
2.5 System Details 25
2.5 System Details
We have followed the guidelines presented by Peterson [96] to contextualizeour investigated system. We have investigated a large telecommunication sys-tem [13,121] where each node in the system overview, Figure 2.3, is describedinternally as in Figure 2.7. From a high-level perspective there are five abstrac-tion levels (to the right in figure) that are structured in three functional parts (tothe left in figure).
The hardware (level 1) is implemented with custom made circuit boardswith varying performance capabilities depending on desired functionality andyear of manufacture. The performance spans from older single-core boardsup to several CPU’s, each utilizing 10’s of cores. Memory capacity is varyingfrom a few MB’s up to many GB’s per CPU.
Hardware variations put great emphasis on designing drivers (level 2) thatmust be generic as well as provide support target specific functionality. Thedrivers must maintain a stable legacy interface towards the Operating Sys-tem (OS). Application programming interface stability is vital in large scalesystem development.
Third party vendors deliver the Operating System (level 3) and dependingon the use-case it is either a specifically tailored proprietary real-time OS orLinux. The API-functionality supplied by the OS must be both backward andforward compatible regardless of changes to the OS and the HW. Changinglow-level functionality should not be propagated upwards to higher levels.
Cluster functionality is implemented (level 4) to support board interoper-ability, communication mechanisms, initial configuration, error management,error recovery and much more. The majority of the platform source code isimplemented at this level. It is a complex part of the platform (levels 2–4) withcomplicated system functionality to maintain high-availability. Sharing theplatform between multiple hardware platforms is vital for the maintainabilityof the complete system.
The application runs on the uppermost level of the system (level 5). It isby far the largest portion of all layers when comparing computational capacity,memory footprint and any functional metric. There are several applications thateach implement a complete telecommunication standard, such as GSM [120],WCDMA [56, p 1–10] or LTE [61]. Several high-level modeling languageshave been used to model these applications in combination to low-level nativecode. The model is, in some cases, used to generate low-level programmingcode that is natively compiled for a specific target. The resulting code is com-plex to debug, especially from a performance perspective. One issue is the
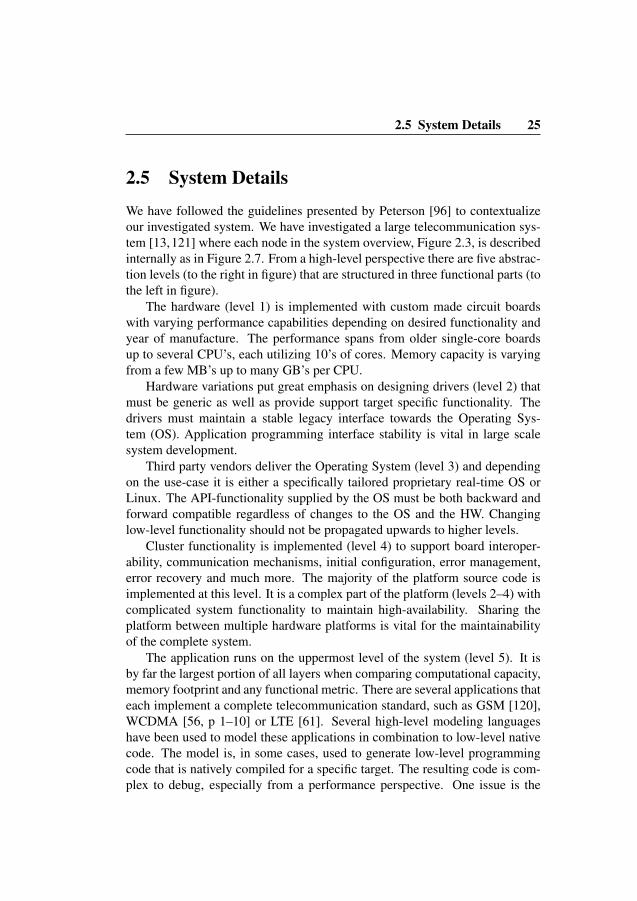
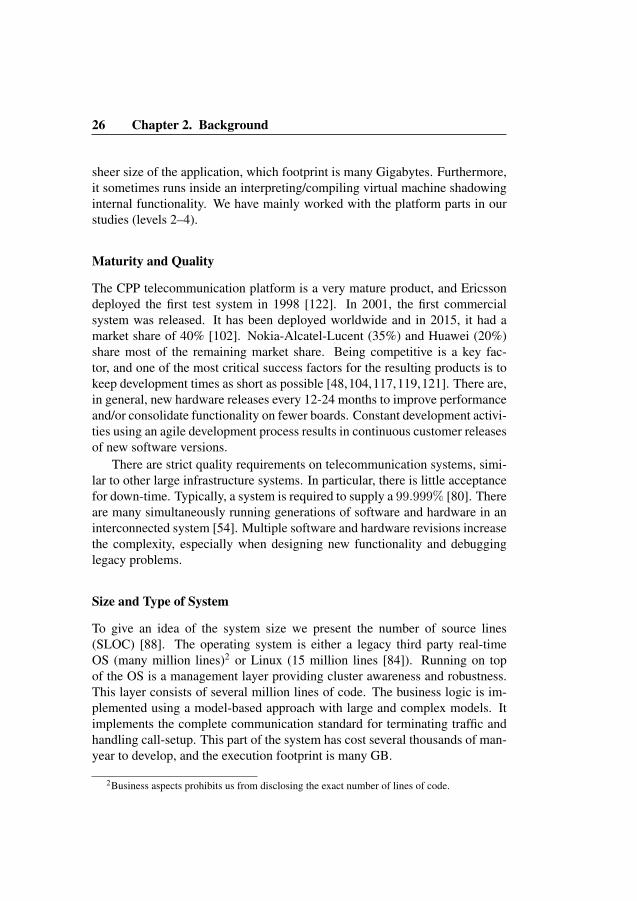
26 Chapter 2. Background
sheer size of the application, which footprint is many Gigabytes. Furthermore,it sometimes runs inside an interpreting/compiling virtual machine shadowinginternal functionality. We have mainly worked with the platform parts in ourstudies (levels 2–4).
Maturity and Quality
The CPP telecommunication platform is a very mature product, and Ericssondeployed the first test system in 1998 [122]. In 2001, the first commercialsystem was released. It has been deployed worldwide and in 2015, it had amarket share of 40% [102]. Nokia-Alcatel-Lucent (35%) and Huawei (20%)share most of the remaining market share. Being competitive is a key fac-tor, and one of the most critical success factors for the resulting products is tokeep development times as short as possible [48,104,117,119,121]. There are,in general, new hardware releases every 12-24 months to improve performanceand/or consolidate functionality on fewer boards. Constant development activi-ties using an agile development process results in continuous customer releasesof new software versions.
There are strict quality requirements on telecommunication systems, simi-lar to other large infrastructure systems. In particular, there is little acceptancefor down-time. Typically, a system is required to supply a 99.999% [80]. Thereare many simultaneously running generations of software and hardware in aninterconnected system [54]. Multiple software and hardware revisions increasethe complexity, especially when designing new functionality and debugginglegacy problems.
Size and Type of System
To give an idea of the system size we present the number of source lines(SLOC) [88]. The operating system is either a legacy third party real-timeOS (many million lines)2 or Linux (15 million lines [84]). Running on topof the OS is a management layer providing cluster awareness and robustness.This layer consists of several million lines of code. The business logic is im-plemented using a model-based approach with large and complex models. Itimplements the complete communication standard for terminating traffic andhandling call-setup. This part of the system has cost several thousands of man-year to develop, and the execution footprint is many GB.
2Business aspects prohibits us from disclosing the exact number of lines of code.
2.5 System Details 27
The system is an extensive embedded distributed system [113]. Each exe-cution unit (board) runs a (soft) real-time OS. The boards are interconnected toform a large distributed system. Processes executing on one board can easilyconnect to processes executing on another. Interconnect poses many practicaldifficulties for standard OS:s, for example, the vast number of concurrentlyrunning processes. Furthermore, the system is designed to be both robust andscalable [49]. Customizing a telecommunication platform is a significant andchallenging task. There is an operational and maintenance interface contain-ing literary thousands of possible customization options. To further add to theoverall complexity, it is also possible to make individual choices on how toconnect each physical node in the network, see Figure 2.3.
Programming Languages
The system is built using many different programming paradigms. Drivers,abstraction level 2 in Figure 2.7, are implemented in either assembler or C.The operating system (OS), level 3, is also implemented in C and assemblerwhere high performance is needed. The rationale for selecting C as the mainprogramming language is historical but knowledge (at the time) and executionefficiency was the main reasons for the decision. The OS, level 3, is suppliedby a third party company. For maintainability reasons, the surrounding codeimplements local OS adjustments. During our research, we have mainly im-plemented functionality in level 3.
Moving the abstraction further from the hardware changes the program-ming paradigm to support higher level programming languages. For clusterfunctionality, level 4, several programming languages are used, such as C andC++ for legacy code. Depending on requirements, recent functional additionsmay be implemented in either Java or Erlang.
Various model-based approaches have been used when implementing theapplication layer, level 5. There are several applications implementing differ-ent parts of the telecommunication standards described in Section 2.2. Theapplications share the common execution environment provided by lower lev-els (1–4).
Hardware
Message processing system usually consists of two parts [108, p1], the controlsystem and the data plane. The control system implements functionality forconfiguring and maintaining an operational system. The data plane is mainly
28 Chapter 2. Background
concerned with payload handling, i.e. routing messages towards their destina-tion. In our system, the control system HW is different from the data planeHW. The former is partially implemented with common off-the-shelf hard-ware while the latter uses tailored CPU’s with specialized hardware supportfor packet handling. We have investigated the control system, which has acommunication rate in the range of Gbit/second. The traffic terminates at thedestination node where the CPU performs some message processing. We havenot investigated the data plane.
The CPP system runs on more than 20 [13] different hardware platforms de-pending on the required performance. Low-power boards may be using ARMCPUs while high-end circuit boards aimed towards heavier calculations mayuse powerful PowerPC or x86 CPUs. Using multiple hardware architectures isa challenging task. Platform code from level 4 and upwards, Figure 2.7, mustbe HW agnostic to be easily portable and efficiently maintained. The sameapplies to the application software, level 5, executing on top of the platform.
Development Process
Developing an extensive infrastructure system puts great effort into develop-ment tools and development flow. Tracking each code change must be pos-sible. Customers require continuous improvements with little or no regard tothe age of the hardware. It is hard to support systems with mixed hardwaregenerations, and each software release must support several simultaneouslyrunning hardware generations. As an indication of the system size, thousandsof skilled engineers [54] have spent decades implementing the system. Thedesign organization is distributed over many geographic locations, requiringintense coordination.

Du ska alltid tanka: Jag ar har pa jorden denna enda gang! Jagkan aldrig komma hit igen! Och detsamma sa Sigfrid till sig sjalv:Tag vara pa ditt liv! Akta det val! Slarva inte bort det! For nu ardet din stund pa jorden!.
My own translation:
You should always think: I am here on earth only once! I cannever get back here again! Sigfrid said the same thing to himself:Take care of your life! Take care of it! Don’t waste it! For this isyour moment on earth!
— Moberg V. [87]

3Research Summary
DURING the work on this thesis, we have had a large-scale telecommu-nication system at our disposal. The needs of that particular systeminfluenced us when we formulated the three research questions pre-
sented in Section 3.1. We have tried to express the research questions generi-cally to ensure that they can address issues that are problematic for many otherlarge-scale communication systems. We have also clarified some essential re-quirements related to each research question.
Closely related to the research questions are the delimitations we havemade when performing our research. We have listed several significant de-limitations in Section 3.2. Section 3.3 summarizes our achievements for thethree research areas: monitoring, modeling and improving.
We have done several case studies during the monitoring- and modelingphases to explore and describe our environment. In the performance improve-ment phase, we have adopted a more hands-on approach to solving a particularproblem. We list the research method in Section 3.4. The chapter is concludedin Section 3.5 by listing validity threats.

34 Chapter 3. Research Summary
3.1 Research QuestionsThe goal of our research is a systematic collection of characteristics data thatcan be used to model the hardware usage of the system and to find performanceimprovement areas. We present these three research questions in the followingsubsections.
3.1.1 System MonitoringThe telecommunication system we have focused on in this thesis is well un-derstood and thoroughly tested from a functional perspective. The system hasnot reached the same level of maturity with respect to characteristics testing.New functionality is well defined and implemented according to detailed spec-ifications by engineers with long experience in system development. However,the system complexity and difficulty to monitor behavior and hardware usagemakes it difficult to understand what impact new software changes will haveon the system behavior. This leads to the first research question:
Q1 How is it possible to monitor the hardware and software char-acteristics of a production system?
We refine the research question, Q1 with additional constraints so that it com-plies with general requirements for our industrial system:
• The probe-effect must be negligible for admitting the tool to run in aproduction environment.
• Sustained monitoring times, several days or weeks, is favored in com-parison to high-frequency sampling.
• The monitoring mechanism must be easily adaptable to different systemsand scenarios.
• We must have complete control over the source code to guarantee secu-rity and quality of service.
3.1.2 System ModelingAs a continuation of our work with characteristics monitoring, see Section 3.1.1,we understood that our monitoring method could be useful for other purposes
3.1 Research Questions 35
than only characteristics monitoring. The design organisation where we per-formed our tests had for a long time struggled with the problem of havinglong lead times between platform development and characteristics testing. Ac-cording to system architects the long lead-time results in difficult and time-consuming bug fixes. Early error detection is very difficult [4], but when suc-cessful it allows software errors to be corrected sooner than previously possi-ble [116] leading to a reduction in development cost [17, 18]. This reasoningleads up to the second research question:
Q2 How to correctly model hardware characteristics of a produc-tion system based on data collected from production nodes?
We refine the research question, Q2 with additional constraints so that it com-plies with general requirements for our industrial system:
• The use of the synthesize-mechanism should be fully automatic becausewe want to include it in the automated test framework.
• The synthesize-mechanism should be generic for most types of industrialsystems, which should then apply to our telecommunication system.
3.1.3 Improving System PerformanceOur first two research questions targeted characteristics monitoring of a pro-duction system and performance bottlenecks. The natural next step is to targetperformance improvements for the system. How to use the extracted charac-teristics information to identify improvement areas where the communicationperformance of our target system can be improved? This reasoning leads to thethird and last research question:
Q3 How can the communication performance of a large productionsystem be improved based on a model derived from hardwareand software monitoring?
We refine the research question, Q3 with additional constraints so that it com-plies with general requirements for our industrial system:
• Performance improvements must be fully automatic and non-manualsince network operators do not allow access to the system after deploy-ment.
36 Chapter 3. Research Summary
• Network congestion level and CPU utilization are different for variousdeployment scenarios and also changes over time due to alternating us-age patterns. Any communication improvement method must automati-cally adapt to a changing environment, and it is therefore not possible tooptimize it for a specific scenario.
• The system must handle multiple concurrent communication streams.
• Other co-located services, such as databases, JAVA machines, SFTP,SSH- and Telnet servers, should not be negatively affected by the com-munication improvements.
• Robustness and automaticity have higher priority than pure performance.
Improving the performance of our investigated system is the overall goal ofthis thesis. The target is to design an automatic mechanism that is robust andworks well in an industrial environment.
3.2 DelimitationsWe have chosen to limit the scope of our investigation to one particular indus-trial system, which is the telecommunication systems where we have privilegedaccess. It is hard to gain access to other industrial systems since we need tomodify the investigated system to perform our research. We have performedour experiments on one type of system, but we believe that our results apply tomany other large-scale industrial systems. We believe that the general methodsare applicable for many other systems, although the specific results are uniquefor our target system.
We have implemented and tested our achievements in a particular telecom-munication system. By using one system for testing we have made some spe-cific limitations to the research questions:
• We have not yet explicitly verified that characteristics testing in earlydesign phases reduce the total system development time but earlier re-search [17, 18, 116] strongly implies that.
• The telecommunication system we have investigated is IO-bound, andwe have therefore mostly focused on modeling the low-level cache us-age.
• We have opted to use a low sample frequency (1Hz) that may be insuffi-cient in some cases. We think that it is sufficient for our static model syn-thesis procedure. The characteristics of our target system are relatively
3.3 Achievements 37
static where the resource usage slowly changes depending on end-userbehavior. The reason for this was that operator requirements forced usto guarantee that the production environment would not experience anyperformance impact.
Most limitations stem from the fact that it is challenging to get customer con-sent to access production nodes. Customers are very concerned that any systemchange may affect stability, security or performance, and it is usually difficultto run any monitoring tool at a customer site.
We have merged the two steps of synthesizing a model and load-replicationinto one concept that we call modeling because we did not make this distinctionfor our first papers. We will define the two steps in future publications.
3.3 Achievements
We have tried to observe the system as a whole [112] when improving thesystem performance, instead of diving into the details of each implementation.We have devised a systematic approach to finding performance problems inthe early stages of the system development process. The following subsectionsdescribe our achievements.
3.3.1 System MonitoringNo system monitoring tool was available for our legacy OS in 2011, at the startof our investigation. At the same time there were some tools for Linux, forexample Perf [25], that implemented a subset of our requirements. Because ofthe GPL-license it is politically difficult to port Perf to a proprietary OS. Weopted to implement a tailored monitoring tool to support all requirements.
Our first contribution is a low-intrusive method for long-term monitoring ofhardware (HW) characteristics in production environments. The characteristicsprofile is used to understand and investigate system behavior for different usagescenarios. It is vital to understand the behavior of the target system when tryingto improve the performance [8].
We have implemented a tool called Charmon to monitor SW and HW char-acteristics of our target system. Charmon currently runs on two different oper-ating systems, namely Enea’s OSE for the legacy system, and Linux for currentand future platforms. We use Charmon for long-term monitoring, and it runscontinuously while sampling various type of HW metrics through the Perfor-mance Monitor Counters (PMC) [33] with some frequency. PMCs can also
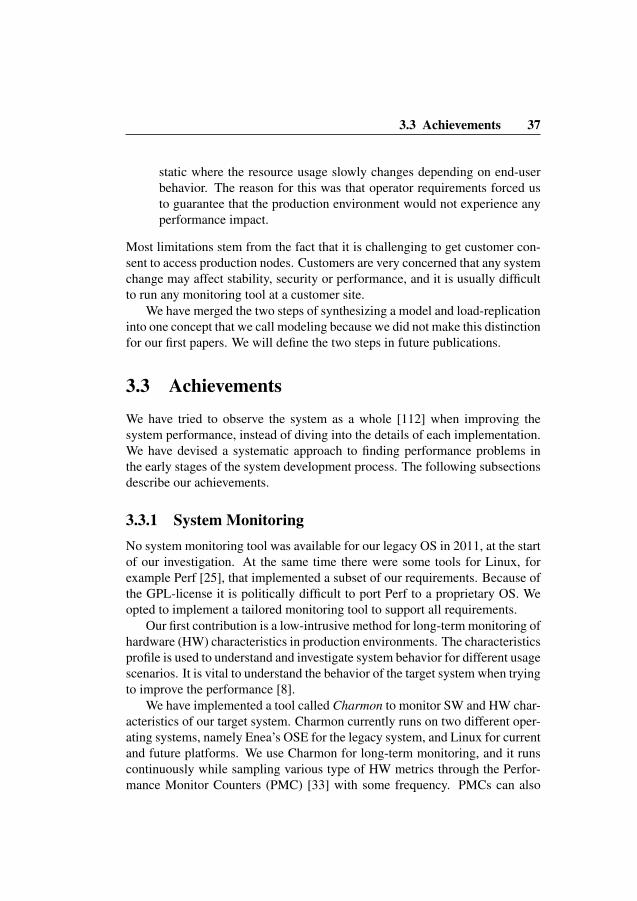
38 Chapter 3. Research Summary
Local Database
3 ... ... ...3 ... ... ......
Charmon
Time
Performance Monitor Counters (PMC)
Act
ion
cpu_load_fcn
Nr ctx switches
CPU load
Signal RTT
Set
0
1
2
nr:ctx_fcn
sig_rtt_fcn
L1−I cache0
Set
Name
L1−D cache1
2 L2−Common 461 462
9
9
463
10
2
41
60
464
1
1
0 1 2 3
Hardware PMCSoftwareCounterName
5. W
rite
2. R
ead
3. S
tore
mea
s.
4. G
et n
ext
counte
r se
t
6. R
eturn
1. IR
Q
Figure 3.1: HW Characteristics measurements using Charmon.
be denoted Performance Monitor Unit (PMU). A PMC is an HW implementedevent counter, and it can autonomously count the occurrences of the specifiedevent after it has been programmed. PMC events [44] that are common formany HW architectures are for example cache misses, RAM accesses, branchmisses and similar issues. There are also other types of events that are uniquefor each architecture, for instance, related to the execution pipeline, memorysubsystems and similar.
Charmon iterates over a list of PMC event sets that is each programmedto the PMC for a period. As shown in Figure 3.1 Charmon is awoken (1) bya timer interrupt at fixed intervals and sleeps in between. Charmon starts byreading (2) the resulting values for the previous HW counter set. Reading HWcounters is, for the legacy OS, low-intrusive by utilizing the mfspr assem-bly instruction. The PowerPC instruction set defines this particular instruction,but there are similar instructions for other architectures. On Linux, we usethe Perf-API [25] for reading HW metrics and our implementation for readingSW metrics. The logical functionality, which is the major part of the Charmonapplication, is the same for both OSes. For both OSes, the measurements arestored (3) in a local database (DB). Next, the subsequent HW performancecounter set is read (4) from a table and programmed (5) into the PMC regis-
3.3 Achievements 39
ters. The PMC programming is similar to reading, mtspr for the legacy OSand Perf-API for Linux. It is also possible to add any other SW metrics, suchas CPU-load, context switches, signal turn around time. Our implementationuses CPU-load, which is supplied by the OS, and round-trip message time,which is supplied by the messaging application. Measurements for SW met-rics are stored in the DB to provide a contextualized and time-stamped log ofboth HW and SW utilization. Charmon provides the possibility to have a mixof both low-level and high-level metrics, which is useful when debugging/in-vestigating performance related problems. After setting a new set (5) of HWcounters, Charmon sleeps for a predefined interval, then restarts at step (1).When using multi-core CPUs we follow a similar procedure where Charmonsimultaneously programs all cores with the same counter set.
Charmon implements two types of counter sets. The first and by far largestset uses HW PMC counters. The second set uses SW counters. We startedby investigating the first set that contains HW metrics describing the systemperformance, for example, instructions per second and cycles per second. Byusing these two metrics, it is possible to calculate Cycles Per Instruction (CPI),which to some extent describes the efficiency of the system [40]. The nextarea of interest is to understand where the system loses performance. It iswell-known from interviewing senior technicians within the organization webelong to that the target system we are investigating is very IO-bound. There-fore, we implemented several counter sets to observe all cache usage regard-less of the cache level. Using the CPI-metrics [40, 41] as a guideline we im-plemented many more metrics, such as counters for Translation LookasideBuffers (TLBs), branches, floating point units and other. We know that wemust be careful when using CPI-stacks since they can be misleading [5], es-pecially for multi-core CPUs. We also include counters for all pipeline stagessince that is helpful to gain further knowledge of where stalls could occur.
The second type of counter set utilized by Charmon is SW counters. ASW counter can in practice be anything that is countable, but the two primarysoftware metrics monitored in Charmon are CPU-load, supplied by the OS, andmessage round trip time.
Charmon has been designed and implemented to allow easy addition ofmore counter sets. Our aim has been to ease the extension of Charmon withadditional counter sets whenever the need arise. In the future, we expect thatmemory subsystem metrics may be of specific interest because new HW archi-tectures introduce more multi-level cache hierarchies, non-uniform memoryaccesses, and other complex techniques.

40 Chapter 3. Research Summary
Act
ivit
y
Time
Platform
Application
Delivery
Continuous testing throughoutthe design phase
Act
ivit
y
Characteristics Test
Platform
Application
Delivery
Time
iterations betweenLate stage
design and test
Lead−Time Reduction
effort varies over timeThe characteristics test
Test phase Development phase
a) Characteristics testing and corrections are iteratively performed atthe end of the design process.
b) Performing characteristics testing throughout the developmentprocess shortens the total development time.
Figure 3.2: Two different processes for characteristics verification 1.
The development organization at Ericsson uses Charmon as their preferredhardware usage monitoring tool, especially when running long-term perfor-mance evaluations on large-scale systems. The sampling rate of the monitor-ing tool is deliberately configured to operate at a low pace, typically 1 sampleper second, to not affect the node operation. It was an explicit design choicebecause network operators are very restrictive of any tool that has the slightestimpact on the production environment. The sampling rate of the monitoringtool is configurable and supports much higher sampling frequencies.
1The original figure has previously been published in Paper A [68].
3.3 Achievements 41
3.3.2 System Modeling
Characteristics modeling of systems is difficult [72, 73, 91]. It is even harderto model large industrial systems running in a production environment. As afirst obstacle, it is hard to get network operator consent to access the system.Second, the size of the system makes it problematic to evaluate the productionsystem manually and synthesize a model. Some earlier approaches like Belland John [11] are similar to ours but creates the model manually. Alameldeenet al. [4] describe the need for cheap models of expensive large-scale systems.
We want to overcome the problems of modeling large industrial systems.The resulting model should be sufficiently accurate, so that is possible to mea-sure system performance in the early stages of the system development pro-cess. Figure 3.2a depicts the current, sequential, development process withonly a slight overlap in the development activities. Ending the developmentphase with characteristics testing often results in long lead-times between thestart of platform development and when the system is finished. According toBoehm [16] it is expensive to perform corrections late in the development pro-cess:
Finding and fixing software problems after delivery is often 100times more expensive than finding and fixing it during the require-ments and design phase.
For industrial systems with long lead-times, it can even be harder to implementcorrections because the responsible engineers may have moved on to other de-velopment projects. Using our approach, depicted in Figure 3.2b, we shouldbe able to reduce the overall development time and cost by finding and fix-ing bugs earlier [17, 18, 116]. Reducing the total development time shouldalso reduce the Time-To-Market, which is a critical factor in the highly com-petitive telecommunication market [104, 117, 119, 121]. Our idea is to moveperformance verification earlier in the development process. As depicted inFigure 3.2b the characteristics testing effort is similar to that of the originaldesign process but started substantially earlier. We also try to avoid costly lateprocess stage iterations between testers and developers by using a character-istics model of the production system before finalizing the complete system.For more details of our contributions see Section 4.3. Using our method makesit possible to start incremental performance verification at the earliest possi-ble stage and continue throughout the development project. Such developmentprocess change should shorten the lead-time and provides earlier feedback todevelopers concerning potential performance problems.
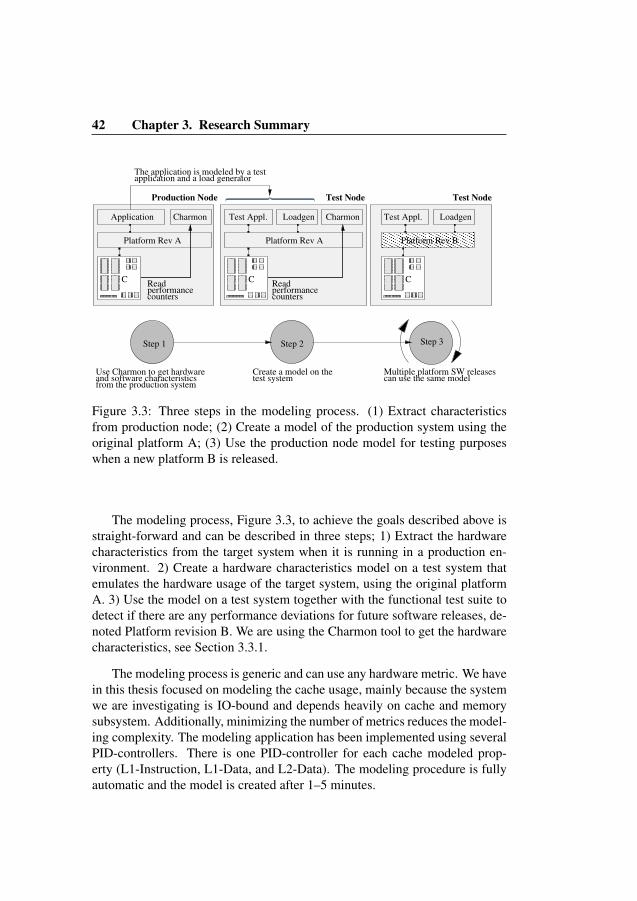
42 Chapter 3. Research Summary
Step 1
Loadgen Charmon
Platform Rev A
Test Appl. LoadgenTest Appl.
performancecounters
Application Charmon
Platform Rev A
performance
The application is modeled by a testapplication and a load generator
counters
Production Node Test Node Test Node
Create a model on thetest system
Use Charmon to get hardwareand software characteristics
Read Read
from the production systemcan use the same modelMultiple platform SW releases
CC C
Step 3Step 2
Platform Rev B
Figure 3.3: Three steps in the modeling process. (1) Extract characteristicsfrom production node; (2) Create a model of the production system using theoriginal platform A; (3) Use the production node model for testing purposeswhen a new platform B is released.
The modeling process, Figure 3.3, to achieve the goals described above isstraight-forward and can be described in three steps; 1) Extract the hardwarecharacteristics from the target system when it is running in a production en-vironment. 2) Create a hardware characteristics model on a test system thatemulates the hardware usage of the target system, using the original platformA. 3) Use the model on a test system together with the functional test suite todetect if there are any performance deviations for future software releases, de-noted Platform revision B. We are using the Charmon tool to get the hardwarecharacteristics, see Section 3.3.1.
The modeling process is generic and can use any hardware metric. We havein this thesis focused on modeling the cache usage, mainly because the systemwe are investigating is IO-bound and depends heavily on cache and memorysubsystem. Additionally, minimizing the number of metrics reduces the model-ing complexity. The modeling application has been implemented using severalPID-controllers. There is one PID-controller for each cache modeled prop-erty (L1-Instruction, L1-Data, and L2-Data). The modeling procedure is fullyautomatic and the model is created after 1–5 minutes.
3.3 Achievements 43
The characteristics model maps hardware characteristics from the produc-tion node to a smaller test node. The main goal is to provide a similar, andmore realistic, execution environment for the test node similar to the produc-tion node environment. It is well-known in the industry, that functional testsuites are good at testing the required functions, but they do not stress thesystem in the same way as the real production system. Running tests whilestressing the system increases the ability to provoke congestion scenarios thatmay lead to the detection of hidden bugs.
3.3.3 System ImprovementThe concluding part of our three-step procedure is to reduce the effects of thesystem bottleneck identified in Section 3.3.1 and modeled in Section 3.3.2. Wehave used the following method in our work with performance improvements:
1. Start the procedure by measuring production environment characteristicsfor the desired use-case.
2. Evaluate the characteristics metrics obtained in step (1). Modify themetrics set if additional characteristics information is needed and rerunstep (1). If it is possible to find the problem by viewing the characteris-tics data, a software fix can directly be implemented, and we can jumpto step (4).
3. If necessary, the production node can be modeled by a test node to reducedebugging lead-time. We should start by implementing a tailored test-suite covering the desired services in the same way as the productionsystem. By simultaneously running the function test and load generatorthe execution environment is similar to the production system.
4. Implement a fix for the performance bottleneck.
5. Rerun the test with the new software release using the same test setup asin step (3). Release the software if the test is satisfactory, otherwise, re-implement another solution in step (4). This step in the method can alsobe used to select the best out of several possible fixes, which providesthe best characteristics result.
The general methodology, outlined above, can easily be adapted to fit any othertest or debugging scenario. The most important task is to find a characteristicsmetric set that matches the scenario where the problem occurs. The metricset should map the performance related problem so that it is possible to detectmetric changes when altering the code.
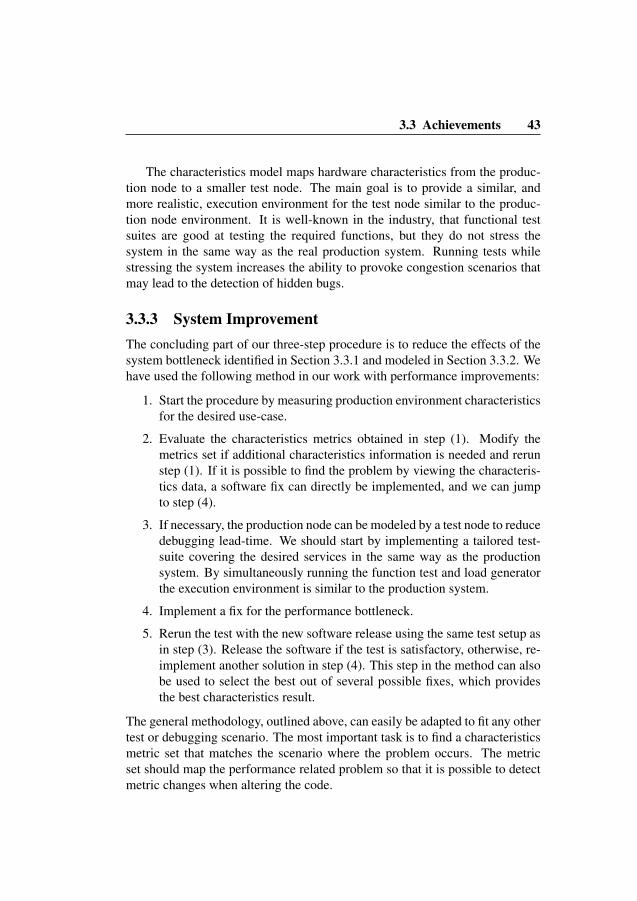
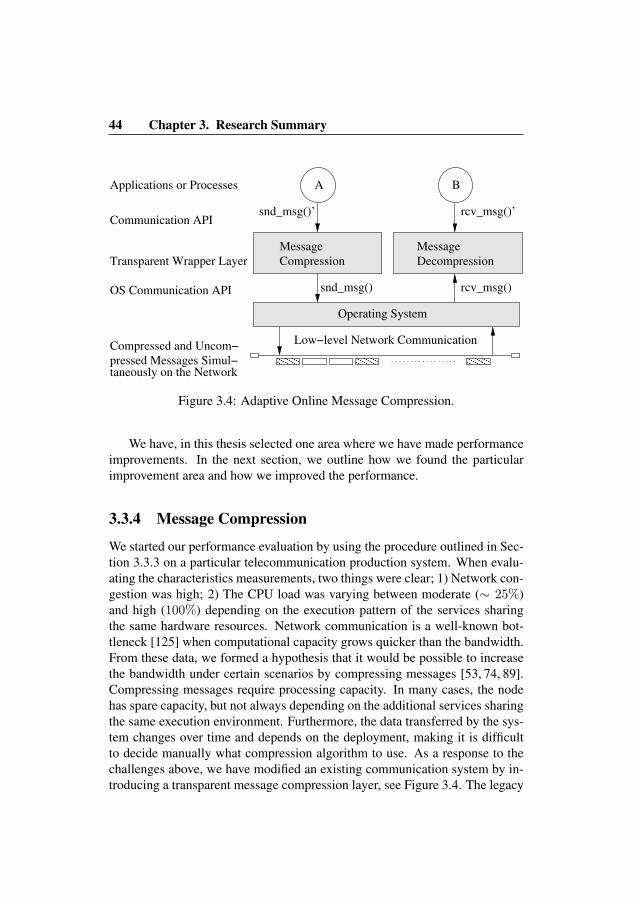
44 Chapter 3. Research Summary
Communication API
Operating System
Message
Compression
Message
Decompression
rcv_msg()snd_msg()
snd_msg()’ rcv_msg()’
Low−level Network Communication
Transparent Wrapper Layer
OS Communication API
Compressed and Uncom−
pressed Messages Simul−taneously on the Network
A BApplications or Processes
Figure 3.4: Adaptive Online Message Compression.
We have, in this thesis selected one area where we have made performanceimprovements. In the next section, we outline how we found the particularimprovement area and how we improved the performance.
3.3.4 Message Compression
We started our performance evaluation by using the procedure outlined in Sec-tion 3.3.3 on a particular telecommunication production system. When evalu-ating the characteristics measurements, two things were clear; 1) Network con-gestion was high; 2) The CPU load was varying between moderate (∼ 25%)and high (100%) depending on the execution pattern of the services sharingthe same hardware resources. Network communication is a well-known bot-tleneck [125] when computational capacity grows quicker than the bandwidth.From these data, we formed a hypothesis that it would be possible to increasethe bandwidth under certain scenarios by compressing messages [53, 74, 89].Compressing messages require processing capacity. In many cases, the nodehas spare capacity, but not always depending on the additional services sharingthe same execution environment. Furthermore, the data transferred by the sys-tem changes over time and depends on the deployment, making it is difficultto decide manually what compression algorithm to use. As a response to thechallenges above, we have modified an existing communication system by in-troducing a transparent message compression layer, see Figure 3.4. The legacy
3.3 Achievements 45
1
Ove
rload
Thre
shol
dCP
U Us
age
Ratio
Com
pr./
Unco
mpr
.
2 3 4 5
System CPU overload
6
0%
100%
Time
The ratio of messages compressedas a function of CPU usage.
System-wide CPU-usage
Avg
Mes
sage
Late
ncy
High
LowAverage message latency.
Figure 3.5: Adaptive online message compression overload protection.
communication API containing snd msg() and rcv msg() is wrapped bysnd msg()’ and rcv msg()’ to capture the message data. Our imple-mentation of the API will transparently compress messages and then use thestandard communication API supplied by the OS.
Our implementation of the adaptive online message compression mech-anism consists of three parts; 1) A selection mechanism that finds the bestcompression algorithm with regards to the lowest message RTT. 2) A system-level overload handler to keep the CPU-usage below a threshold. 3) A set ofcompression algorithms that may be used to compress messages.
Our online mechanism continuously compresses message using all avail-able algorithms. The distribution of used compression algorithms for a givenset of messages depend on the measured round-trip time. The selection mech-anism uses the best performing algorithm for bulk compression. By continu-ously using all compression algorithms we trade some performance to gain theadvantage of automatically detecting changes in the communication stream.
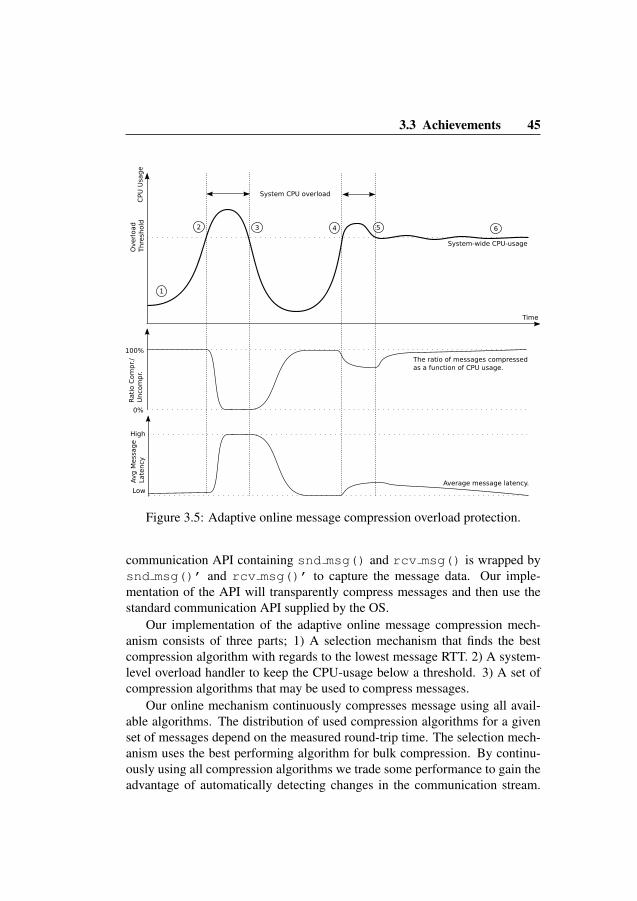

46 Chapter 3. Research Summary
Automatic selection is a major advantage over manual selection because it canadapt to a changing environment.
The overload mechanism is illustrated in Figure 3.5. The CPU load is, inthe left part of the figure, well below (1) the threshold. A temporary load-increase (2) surpasses the threshold, and our mechanism reduces the compres-sion quota resulting in fewer compressed messages. Message compression isresumed when the system load is reduced (3). Our overload mechanism alsohandles scenarios with partially compressed message streams. If the total CPUload caused by message compression and other services are above the thresh-old (4), our mechanism reduces the compression quota. A quota reduction maylead to a partially compressed message stream with compressed messages in-termixed with uncompressed. Message compression is gradually resumed (5)as the total system load converges to the overload threshold (6).
We have integrated eleven state-of-the-art compression algorithms in thetelecommunication system we have investigated. Each algorithm has specialcompression properties. One algorithm can, for example, provide high com-pression ratio but require much CPU time (LZMA [94]), which may be suitablefor networks experiencing high congestion. Other algorithms may have specialtarget areas, such as efficient text compression (SNAPPY [50]) or being fast butnot so high compression ratio (QLZ [99]).
Our implementation requires the same communication API for both thesender and the receiver. The snd msg()’ function prepends a new headerto each transmitted message. The header contains information on the com-pression algorithms used for compressing the particular message. When thereceiving node calls the rcv msg()’ function, the API implements a trans-parent decompression of the message. The API sends decompression statisticsto each sender making it possible to calculate the complete compression →transmission → decompression time.
3.4 Research Methodology
We have used two qualitative methods [109] to obtain the research resultspresented in this thesis. We have used case studies [105, 106, 128] to ex-plore and describe the investigated object. Similarly, we have used actionresearch [83] when iteratively implementing improvements in an industrial en-vironment. Our technical report A [68] includes previously published casestudies reported in papers C [64], E [65] and I [63]. We used the case studymethod to get a better understanding of the system characteristics and to de-
3.5 Threats to Validity 47
scribe the system behavior. We were active participants of the design organi-zation [95] during the research for paper B [66], which extends paper G [66].Changing the position from an observatory view to participatory role allowedus to switch method towards action research or an improvement-centric view.Table 3.1 relates each research question to publication and research method.
ResearchQuestion
Sect. Publ. Type of Question ResearchMethod
Q1 3.1.1 A (C, E, I) Exploratory/Descriptive Case study
Q2 3.1.2 A (C,E, I) Exploratory/Descriptive Case study
Q3 3.1.3 B (G) Problem Solving/Improvement Actionresearch
Table 3.1: Mapping the research questions to methods [101, 106].
3.5 Threats to Validity
We have performed all our research withing the scope of an industrial envi-ronment. One of the benefits is that an industrial environment provides greatinsight into a real production system with customers and user scenarios. Forexample, the data we have used in Papers A and B has been gathered at cus-tomer sites running production systems with real traffic.
However, performing research in the scope of an industrial system intro-duces some difficulties normally not seen in pure academic environments. Forexample, it is hard to obtain the scientific rigor needed for academic publica-tions, and it is challenging to publish raw data or implementation details dueto corporate secrecy. It is also difficult to get extensive access to a productionsystem for unrestricted testing. We have often been allowed a very limitedtime-frame for running our implementations on production nodes and with far-reaching limitations on capacity usage.
We have followed the guidelines by Runeson [106] and Wohlin [127] tocategorize and describe how we have performed our experiments. We dividethe validity discussion into subcategories described in the following sections.
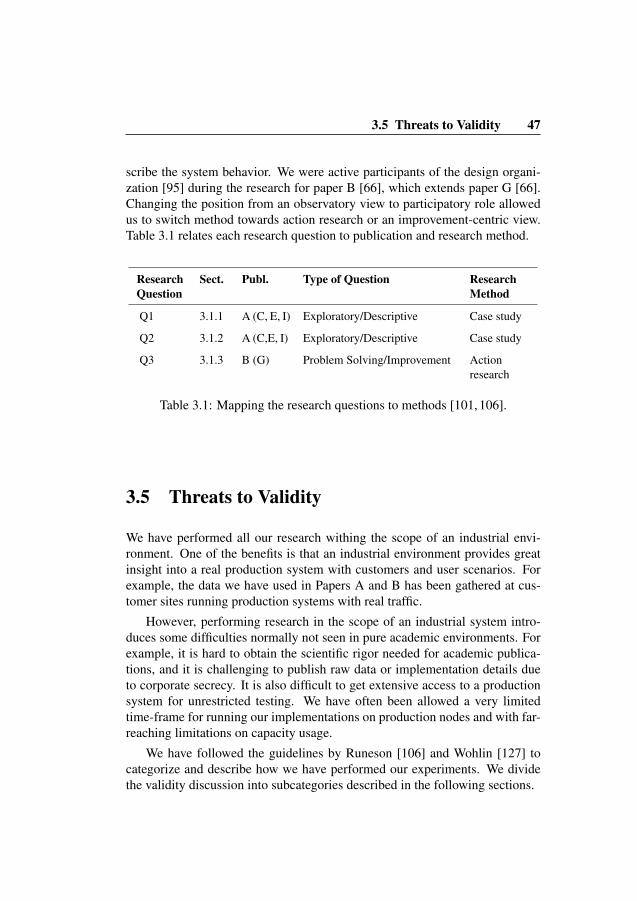
48 Chapter 3. Research Summary
3.5.1 Construct Validity
The construct validity [127, p108] describes the relationship between theoryand observation, for example if our test design has captured the theoreticalrequirements.
Our test design for Paper A was to 1) Extract characteristics data from aproduction system running at a customer site and 2) Synthesize a model us-ing a production test system 3) Test the model using a customer bug fix. Wetried to duplicate the real development process in our test design, which in-dicates that our early-stage performance benchmarking approach works in areal-world application. We have also assumed, according to earlier research byBoehm [17, 18], and Tassey [116], that it is economically beneficial to catchbugs in the initial phases of the development process. They state that the costof fixing a bug increases with a further distance between where a bug wereintroducing to where it is fixed. We have not tested this ourselves.
For Paper B we sampled communication data from a production system,which a test system replayed. We also added synthetic data to force the testsystem into corner-cases where our automatic compression algorithm mecha-nism temporarily selects other compression algorithms than the one used forproduction system messages. We also introduced synthetic overload to mimican overload scenario.
3.5.2 Internal Validity
The internal validity [19] reflects the quality of the data analysis, in otherwords: Is the data we have gathered relevant for the outcome?
Before starting our research, several senior system architects stated that thesystem we are investigating is IO-bound and memory-bound, which in effectare the system bottlenecks. We empirically verified their statement by usingour characteristics monitor to investigate the system characteristics. We haverun our tests on one telecommunication system that is similar to other large-scale systems, see Section 2.3.
For Paper A we synthesized a model for L1-Instruction, L1-Data and L2-Data cache miss ratio. The model was then used to clone the production systemhardware usage on a test node. We believe that the model is sufficiently accu-rate by verifying that the performance impact of a real bug fix is similar in themodel environment and the production environment
For Paper B we have sampled production system message data for use withthe automatic compression mechanism.
3.5 Threats to Validity 49
3.5.3 Conclusion ValidityThe conclusion validity describes the relationship between the treatment andthe outcome [127, p104]. We have identified some threats to the conclusionvalidity for Paper A. We have tested our monitoring and modeling method onone production system. Considering all type of systems the statistical testingset is too small, which forces us to limit our conclusions to the particular typeof system we have investigated. Our target system has the highest market share(40% [102]) among telecommunication systems, which strengthen our beliefthat the research is representable for this particular system type. It is verydifficult to get operator consent to verify our modeling mechanism on othermanufacturers equipment. However, we believe that the generic mechanism isusable for other types of systems with minor modifications. Adapting our mod-eling method requires the cache generator functions to be adapted to differentcache structures.
We have implemented the automatic message compression mechanism de-scribed in Paper B on the same system as Paper A. We extracted our test datafrom a running production system, but we believe our mechanism is sufficientlygeneric and can be utilized on any system. Migrating the mechanism would, ofcourse, require minor modifications such as modifying the set of compressionalgorithms suitable for the new system.
3.5.4 Method ApplicabilityWe argue that the findings in Paper A provides great insight into the behavior ofour investigated telecommunication system. Paper B has improved the messag-ing performance by applying selective compression when there are CPU-cyclesto spare. We have implemented our ideas in one particular telecommunicationsystem but also published the results in the academic community. Our contri-butions are now part of the corporate product portfolio, which further indicatesthat our research is needed and valuable. Our belief is that our target systemis representative of other large-scale systems and especially systems with ex-tensive communication. We think therefore that the research results we presentshould apply to other systems.

Det har ar inget man kan diskutera, jag har ratt och du har fel.2
My own translation:
This isn’t something to discuss, I am right and you are wrong.
— H. Rosling [103]
2Hans Rosling exclaims during a danish DR2 TV-interview, when the program leader says thatworld is in chaos with regards to war and refugees.

4Contributions
WE present several contributions in this thesis. The contributions orig-inates from several published papers that are consolidated in pub-lications A (C, E, I) and B (G). The main contributions and their
corresponding research questions (Q) are:
• A low-intrusive characteristics monitoring application (Q1).
• An automatic production node characteristics modeling mechanism (Q2).
• An automatic message compression mechanism reducing the messageround-trip time (Q3).
The monitoring and modeling techniques are implemented and incorporated inthe industrial production environment. The first of our tools provide monitor-ing functionality useful for understanding system behaviour. The industrial de-velopment environment is currently testing our modeling tool. Our automaticmessage compression mechanism is implemented and tested using productionnode data.
We continue this chapter by mapping each publication towards the re-search questions, Section 4.1. We show, in Section 4.2, the relationship be-tween the two contributing publications (A, B) and the already published pa-pers (C, E, I, G). The chapter concludes by a detailed desciption of the contri-butions in Paper A (Section 4.3) and Paper B (Section 4.4).
53

54 Chapter 4. Contributions
E
2
3
1
Q2
Q1
Q3
A
C
E
Model
Improve
Monitor
I
I
C
A
G
B
Figure 4.1: The three steps of this thesis mapped towards the research questions(Q) and to our published papers (A, B, C, E, G, I).
4.1 Publication Mapping
Figure 4.1 shows the procedure we have followed in this thesis together witheach corresponding research question (Q) and publication. Starting with mon-itoring (Q1), the first step resulted in the contributions presented in Papers A,C, E, I. The second step, modeling (Q2), describes the ability to model a pro-duction system on smaller test systems, which is described in Papers A, E. Inthe third and final step, Papers B, G, we show how to improve the performanceof messaging systems (Q3).
4.2 Publication Hierarchy and Timeline 55
G BE
A
I
CMessage Compressionand Load Replication
Characteristics Measurements Adaptive Online
Figure 4.2: We present two major research areas in this thesis. The first area isdescribed in Paper A, which incrementally embrace earlier publications C, Eand I. The second area, published in Paper B, extends the previously publishedpaper G.
4.2 Publication Hierarchy and TimelineThis thesis consists of two major areas, A and B in Figure 4.2. The first arearelates to characteristics measurements and modeling, described in Section 7.The characteristics and modeling section is based on paper A [68], which inturn supersedes the sequence of earlier publications; papers C [64], E [65] andthe technical report I [63].
2012 2013 2014 2015 2016
Monitoring
Improvement
Information Communication Technology
Large−scale Systems
E
H
G
F
A
B
AC, D, I
Modeling C, I
Figure 4.3: Publication order.
Adaptive online message compression is the second technical area describedin this thesis, see Section 8. The message compression section is based on thejournal Paper B [67], which in turn is an incremental extension of the publishedconference paper G [66]. The order of publication is depicted in Figure 4.3.Paper A and C cover several areas and is therefore presented in multiple rows.
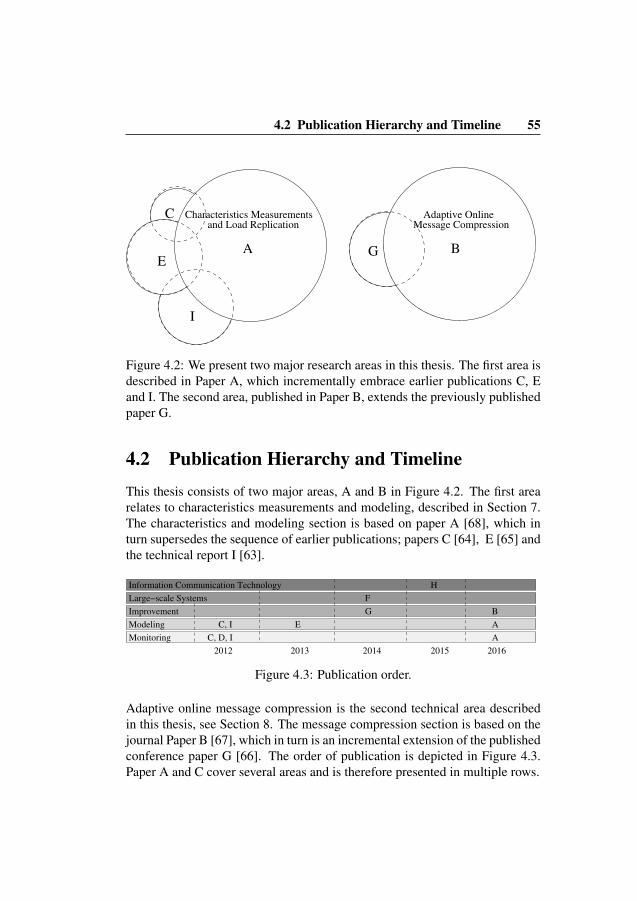
56 Chapter 4. Contributions
4.3 Paper A (Based on Papers C, E and I)We have addressed research questions Q1 (Section 3.1.1) and Q2 (Section 3.1.2)in:
Marcus Jagemar, Sigrid Eldh, Andreas Ermedahl, Bjorn Lisper and GaborAndai. Automatic Load Synthesis for Performance Verification in EarlyDesign Phases. Technical Report, 2016. [68]
Paper abstractThis paper describes a method to extract hardware characteristics and synthe-size a model of a system running in a production environment. It is common toperform characteristics testing at the end of the development process, resultingin complex and costly bug fixes. Using our characteristics model makes it pos-sible to implement continuous performance testing throughout the whole devel-opment process. Early characteristics testing is important because it improvessystem-development efficiency by shortening the total development time. Thereduced lead time is an advantage in a competitive market, such as for thetelecommunication system we have investigated in this paper. The modelingmethod is generic and supports any hardware metric. We have modeled the L1-instruction, L1-data and L2-data cache in our experiment. We have applied ourmethod to a large-scale telecommunication system and verified that it is possi-ble to detect performance-related problems during the design phase rather thanat the end of the product development cycle.
My ContributionI am the main author of Paper A and also the earlier papers on which it is based.Paper A expands Papers C, E, and I concerning characteristics measurements,by providing a more detailed and theoretical explanation of the monitoring andmodeling mechanisms. I have also supervised a master thesis [7] investigatingthe possibility to use our monitoring-modeling mechanism when predicting theperformance impact of migrating a telecommunication system from a legacyOS to Linux.
I am also the main author of Papers C, E, and I. My contribution is the ideato model the hardware characteristics of production nodes on test nodes. I havealso implemented all functionality in a telecommunication system.
4.4 Paper B (Based on Paper G) 57
4.4 Paper B (Based on Paper G)We have addressed research question Q3 (Section 3.1.3) in:
Marcus Jagemar, Sigrid Eldh, Andreas Ermedahl, and Bjorn Lisper.Online Message Compression with Overload Protection. In press: Journalof Systems and Software, 2016. [67]
Paper abstractIn this paper, we show that it is possible to increase the message throughputof a large-scale industrial system by selectively compress messages. The de-mand for new high-performance message processing systems conflicts with thecost effectiveness of legacy systems. The result is often a mixed environmentwith several concurrent system generations. Such a mixed environment doesnot allow a complete replacement of the communication backbone to providethe increased messaging performance. Thus, performance-enhancing softwaresolutions are highly attractive. Our contribution is 1) an online compressionmechanism that automatically selects the most appropriate compression algo-rithm to minimize the message round trip time; 2) a compression overloadmechanism that ensures ample resources for other processes sharing the sameCPU. We have integrated 11 well-known compression algorithms/configura-tions and tested them with production node traffic. In our target system, au-tomatic message compression results is a 9.6% reduction of message roundtrip time. The selection procedure is fully automatic and does not require anymanual intervention. The automatic behavior makes it particularly suitable forlarge systems where it is difficult to predict future system behavior.
My ContributionI am the main author of Papers B and G [66]. My main contribution is the ideato compress selectively messages depending on network congestion level, mes-sage content, and current CPU usage. I have also implemented and evaluatedthe complete message compression selection mechanism in a telecommunica-tion system. This journal article is an extension of conference Paper G [66].I have extended Paper G by adding additional compression algorithms and athorough rework of the paper structure. I have also elaborated on a scenariowhere the content of a message-stream changes.

Never, for the sake of peace and quiet, deny your own experienceor convictions.
— D. Hammarskjold1
1Secretary-General of the United Nations 1955-61, Nobel prize winner 1961.

Never, for the sake of peace and quiet, deny your own experienceor convictions.
— D. Hammarskjold1
1Secretary-General of the United Nations 1955-61, Nobel prize winner 1961.

5Related Work
THIS chapter contextualize our research by listing the most important re-lated publications. We have divided the chapter into four subsectionsthat each describes one aspect of our work. The sections represent sys-
tem monitoring, system modeling, message and data compression and adaptivecompression. The two last sections relates to system performance improve-ments.
Section 5.1 describes the state of the art for systems monitoring. We arein particular interested in continuous long-term observation and monitoring oflarge-scale industrial systems. The research has used system monitoring for along time, and there are several research results of particular interest to us.
Second, in Section 5.2, we have addressed system modeling. There havebeen several efforts to synthesize models of the system execution environment,using several methods.
The third, Section 5.3 and fourth, Section 5.4, sections of this chapter re-lates to performance improvements. When investigating performance bottle-necks we have focused on the messaging performance. Section 5.3 details thecompression algorithms we have evaluated during our work. The typical us-age of a compression algorithm is to select the best algorithm statically usingoff-line evaluations. Since we have used an automatic mechanism to evalu-ate continuously and choose the best algorithm we have investigated adaptivecompression in Section 5.4,
61
62 Chapter 5. Related Work
5.1 System Monitoring
Understanding hardware utilisation is, according to Eranian [33], normally akey factor when improving the performance of a computer system. As stated byEyerman, Eeckhout and Karkhanis [40] it is hard to understand hardware met-rics for modern superscalar [85] processors with out-of-order execution [57].Eyerman, Eeckhout, and Karkhanis also state that it is difficult to get CyclesPer Instruction (CPI) information from hardware counters in what they denote“naive” processors. In their opinion, a CPU like the IBM Power 5 providesmuch better CPI measurement capabilities than “simple” CPUs since it con-siders the effect of superscalar pipelines. The main benefit comes from non-overlapping counters that provide a more accurate CPI calculation.
Allam, Eyerman, and Eeckhout [6] have implemented hardware function-ality to measure directly the CPI stack, which leads to even more improvedmonitoring capabilities. The scenario described by these papers and authors ishighly accurate for the industrial environment we have worked within. The keyissue is to extract vital hardware usage information without any probe effect.
In a subsequent publication by Eyerman and Eeckhout [39] they questionthe validity of CPI comparisons when evaluating multi-core CPUs. The mainproblem is related to shared resources where different applications and multiplecores will compete for hardware resources. The authors suggest applicationlevel metrics instead of low-level metrics. In our work, we have tried to bridgethis gap by using system-level metrics such as signal round-trip-time vs. cacheusage. For our purposes of achieving a test environment, we have succeededin this task. Eyerman and Michaud expands system monitoring into the multi-core era. In their paper [42] they express critical opinions and motivations onwhat type of metric can be used to measure the performance and characteristicsof multi-core systems. We have selected message round-trip time as a systemlevel metric.
An early paper by Anderson, Berc and Dean [8] describes continuous sys-tem monitoring by implemented a low-intrusive (1%-3%) interrupt triggeredsample based mechanism to gather system-wide information. An interrupt isgenerated after a predefined number of events, which triggers a sample of theprogram-counter as well as additional Performance Monitor Counter (PMC)register information. Our method reduces the probe effect further by less fre-quent PMC sampling. One of the standard work when measuring systems isthe LM-Bench suite by Mcvoy and Staelin [86]. It is useful to measure andcalculate cache and memory timings with a standard tool because it is easy tocompare our tests with the result from other already existing platforms.
5.2 System Modeling 63
5.2 System Modeling
System modeling is within the research community also known as system syn-thesis and dimensioning. A characteristics model can be created to act as areplacement for the original system, with respect to some characteristics met-rics. In our investigation, we have modeled the cache characteristics but intheory, any metric can be monitored and modeled. There can be many pur-poses of such a tool, such as improved test environment, overload testing orother similar tasks.
Eeckhout et al. [29] describes that there are several types of simulationand modeling techniques. The first is functional-simulation, which tests thefunctional aspects of an application. Our legacy test application is a functionalsimulator. Specialized cache and predictor simulation try to synthesize andmodel cache usage. According to Eeckhout et al. this technique may by itselfbe too simple to provide accurate results [29]. We have combined both thesetechniques to provide an execution environment that is similar to the productionenvironment.
Bell and John [11] describes a similar approach to ours. They define amethod to model an application by synthesising low-level parts of the targetapplication and inserting inline assembly instructions into the synthesis code.They use the model to create a synthetic test application with similar charac-teristics to the original one. They have applied this method on the SPEC2000benchmark suite, and the result shows that Instructions Per Cycle (IPC) dif-fers on average 2.4% between the original applications and the model appli-cations. Other metrics differ a degree slightly higher than ours, I-Cache 8.6%L2 cache misses to a large extent. We use a feedback control loop to modelthe system while Bell and John [11] use statistical simulation with instructiontraces for the synthesize procedure, as described by Nussbaum and Smith [91].Bell and John’s synthesis procedure is semi-automatic, and an average of tenpasses with some manual intervention is needed to tune the synthesis param-eters. As a comparison, our feedback controller allows the synthesis proce-dure to converge with no user interaction at all. Additionally, the model inour case is described by configuration parameters fed to a generic application.For Bell and John, the configuration parameters are evaluated at compile time,which requires repeated application re-compilations. Another difference in ourapproaches is that we use system-level message round-trip time to detect anyperformance changes between releases while Bell and John use low-level IPC.Joshi et al. [72] have formulated a concept called performance cloning that canbe used to synthesize application characteristics from a proprietary application

64 Chapter 5. Related Work
and create a model that mimics a similar behavior. In effect, Joshi et al. im-plements a similar methodology as Bell and John in [11], but have refined thememory and branching model to be hardware agnostic.
Doucette and Fedorova [27] have implemented a similar functionality toours by generating cache misses to determine application sensitiveness for dif-ferent architectures. They try to forecast the application behavior when movingfrom one hardware platform to another without actually running the target ap-plication on the new hardware.
Our load generator steals hardware resources from other applications shar-ing the same common resource, which is L1-instruction, L1-data and L2 cachein our implementation. The main idea is to starve the target application in thesame way as done by the Cache Pirate [30] and the Bandwidth Bandit [31,32].In our work, we act on the core private cache instead of a shared cache. Saave-dra and Smith [107] explain how to understand cache memory structure andhow to generate misses, associativity and more.
Alameldeen et al. [4] investigate server platforms and come to an inter-esting conclusion that it is quite difficult to create simulations of productionsystems. In their work they model the desired characteristics by using a tai-lored workload suite. Our approach is similar, but since they have shown somedifficulties to model a similar hardware-load profile, we use feedback-basedload generator to achieve an approximation of the production application.
Examining the paper by Diniz et al. [26] shows how they have investigatedthe use of feedback mechanisms to improve program execution. They havemodified a compiler to accept performance feedback result automatically fromtest running the application. Their feedback method allows the compiler toutilize the underlying mechanisms that are not possible to determine by usingstatic methods at compile-time. Lau et al. [82] extends earlier work by investi-gating how feedback control techniques can improve the performance of JAVAprograms executing in a Virtual Machine (VM). Lau et al. state that there areplenty of known optimization techniques available, but it is hard for a VM toidentify which one to use. Sometimes a function optimization decrease theperformance rather than improve it because the data set varies over time.
The paper by Kim et al. [75] present a method to sample characteristicsmetrics such as L1D, branch misses, and other metrics. They use perf [25]for monitoring purposes. Their implementation gathers characteristics metricsthat are used to mimic the dynamic target system behavior. We have chosena much lower sampling frequency in our implementation because we want tohave a lower probe effect.
5.3 Message and Data Compression 65
5.3 Message and Data Compression
In this thesis we suggest to use message compression as a means to improvecommunication performance. There are numerous compression techniqueswithin the research community, many with radically different characteristicsand implementations [74]. Many of these techniques have open source imple-mentations allowing them to be easily used and evaluated in research projects.We have investigated several compression algorithms LZFX [23], LZO [92],LZO-SAFE which is a safe configuration of LZO, LZMA [94], LZW [124],BZ2 [110], LZ4 [22], FastLZ level 1 and 2 [55], Snappy [50], and QLZ [99] forinclusion into the selection mechanism described in Section 5.4. Ringwelski,Renner, Reinhardt, Weigel and Turau [100] manually investigates a numberof compression techniques with regard to compression ratio and computationalresources. The manual labor of investigating compression techniques is thestarting point for our investigation. We asked ourselves how it was possibleto evaluate and select the most appropriate compression algorithm without anyoff-line measurements and calculations.
During the work with this thesis we have initiated several MSc thesis.One of them, Karlsson and Hansson [74], provides an investigation of typi-cal characteristics for certain compression techniquesm, considering compres-sion/decompression rate, compression ratio and resource usage. Their workalso shows the suitability for each algorithm in the context of communicationscenarios. Gutwin, Fedak, Watson, Dyck and Bell describes in their paper [53]transparent message compression Groupware. The framework support bothtext and serialized objects. The method to apply compression to cloud com-puting and storage is investigated in the paper [89] by Nicolae. The smallcomputational overhead is justified by the gain when using message compres-sion for network communication. An interesting part of this paper is that itapplies a practical implementation on the Grid5000 research network to obtainresults. A significant reduction of network traffic has been detected using bothLZO and BZIP2 compression algorithms.
In recent CPUs, there is a trend to include hardware support for compres-sion. Intel has released hardware support for LZO [60] and the AHA companyhas implemented specific circuitry for 80Gbps Gzip [46], Zlib [47], LZS 1 com-pression as well as separate cores for inclusion in customer ASIC/FPGA [2].The benefit is that tailored HW offloads the CPU with the heavy burden of
1Lempel-Zif-Stac (LZS) compression technique. It was created by Stac Electronics and hasbeen widely used for tape and disk compression.
66 Chapter 5. Related Work
compressing messages. In our investigation, this means that such an algorithmwill have the special characteristics of relatively low compression ratio but veryfast compression rate.
5.4 Adaptive Compression
In traditional message compression systems, a compression algorithm is man-ually selected by a system designer. Our implementation automates the selec-tion mechanism by continuously evaluating several compression algorithms. Amessage stream will, therefore, contain messages compressed with several al-gorithms when using our automatic compression selection mechanism. In thissection, we list some publications related to automatic algorithm selection. Thepaper [126] by Wiseman et al. investigate loss-less compression of communi-cation systems. By running a micro benchmark they can pre-generate an off-line data representation of each supported compression algorithm. When send-ing messages the most appropriate compression algorithm grade is selectedaccording to the pre-generated algorithm characteristics.
There is a series of related papers written by a group of researchers inter-ested in message compression. In the first paper by Knutsson and Bjorkman [78]closely followed by Knutsson [77] they have included Zlib [47] functionality inthe Linux kernel. To support an adaptive scheme they monitor the length of thesend-queue and if it grows, the outgoing messages should be compressed moreefficiently. The opposite applies when the send-queue length is reduced. Thesuite of papers continues with Knutsson and Bjorkman [79] where they deducethat there is no performance gain when compressing messages smaller than4kB, for the system they have investigated. The paper was published in 1999so the measurements may have changed with the introduction of modern CPUsand communication equipment. Our communication mechanism handles allsizes of messages. If the compression gain is too small, our selection mech-anism will stop message compression and send the messages uncompressed.To continue the suite of papers, Jeannot, Knutsson, Bjorkman [71] revisits theadaptive compression algorithm and expands it to be more generally available.Kernel internal code is replaced with more portable user-mode implementation.This is also the first release of the freely available and portable version of Adap-tive Online Data Compression (AdOC) [70]. The final paper by Jeannot [69]related to this topic is a rebuttal to critical opinions by other researchers, forexample, the request for an increased adaptiveness to CPU usage and networkusage by Wiseman, Schwan, and Widener [126]. The reply is a new version
5.4 Adaptive Compression 67
of AdOC with improved handling of small messages, compression-send paral-lelism and other.
Sucu and Krintz [115] expands previous discoveries by creating a commu-nication environment called the Adaptive Compression Environment (ACE).It aims to change the behavior of socket communication by introducing mes-sage compression. Only messages larger than 32kB are affected, while smallermessages are sent uncompressed. Sucu and Krintz also expand their previouspaper by a new paper [81], in which they have added additional compressionalgorithms such as Bzip2 [110], zlib [47] and LZO [92].
Pu and Singaravelu [98] discuss the trade-off between available band-width and the required computational capacity when compressing messages.They present a thorough investigation of fundamental compression schemessuch as “compress-all messages” or “compress-none” with algorithms such asBzip2 [110], gzip [46] and LZO [92]. Furthermore, they investigate the effectsof mixed messaging, which they define as a messaging stream containing both(denoted Fine-Grained mixing) compressed and uncompressed messages. Puand Singaravelu’s message mixing technique is similar to our solution, but ourmechanism automatically evaluates the full message transit time and select themost appropriate compression algorithm. Gray, Peterson and Reiher [51] ex-pands the earlier work by Pu and Singaravelu and discuss problems on how todecide when to compress messages or not.
A patent by Biederman [15] shows a general idea of receiving, compress-ing and sending messages. Biederman’s method is similar to ours but differs inthe following aspects: 1) We adopt a feedback control loop to control the CPUresources spent compressing. Controlling the allocated CPU load allows otherservices to coexist with the message compression functionality. Further, 2)Biederman uses different levels of compression. We suggest to simultaneouslyevaluate several compression algorithms to let the best algorithm dominate.

[Speaking of computers] But they are useless. They can only giveyou answers.
— P. Picasso

[Speaking of computers] But they are useless. They can only giveyou answers.
— P. Picasso

6Conclusion and Future Work
WE will, in this chapter, briefly answer the research questions askedin Section 3.1. We give our answers in the frame of the telecom-munication system we have defined in Section 2.5, and delimited,
Section 3.2. We believe that our research has lead to some advances in the in-dustrial use of automated synthesis of characteristics modeling. The softwaredesign and test organisation within Ericsson use our characteristics monitoringtool when evaluating production system performance.
Our thoughts related to future work concludes this thesis. We try to answerquestions like: What do we think is the future of the area we have investi-gated? What would we do to investigate further issues that were left behinddue to time restrictions? The answer is to improve the modeling mechanismby several actions, such as higher sampling frequency to support a dynamicmodel, modeling of more hardware metrics, test the modeling mechanism onmany other types of systems.
71
72 Chapter 6. Conclusion and Future Work
6.1 ConclusionIn this thesis, we have formulated three research questions. To answer the firstresearch question (Q1), Section 3.1.1, we have implemented a characteristicsmonitoring application that can observe large industrial systems in a produc-tion environment. The monitoring application periodically samples hardwarecharacteristics information with low impact on the system behavior.
As a response to the second question (Q2), Section 3.1.2, we have deviseda method to automate the synthesis process when modeling the hardware us-age of a production system. We have tested our method by using hardwarecharacteristics information sampled by our monitoring application to create anexecution model on a much smaller and cheaper test system. The character-istics model makes it possible to run performance tests 1) without using thebusiness logic of the production system and 2) much earlier in the develop-ment process. Both approaches aim to reduce the overall development timeand cost.
To answer the third and final question (Q3), Section 3.1.3, we needed tounderstand how the performance of our target communication system could beimproved. As a first step, we implemented a message compression mechanismthat automatically selects the most appropriate compression algorithm depend-ing on the network congestion level, message content, and CPU load. Ourmechanism uses the compression algorithm that provides the shortest round-trip message time for bulk message transmission while continuously assessingthe performance of all supported compression algorithms. We plan to continueusing the monitor-model-improve methodology to find additional performanceimprovements.
We have implemented and tested all of our research results using a telecom-munication system. We believe that our generic methods are usable for othersystems although we have only tested them on one particular system. Thecorporate test department currently uses the monitoring and modeling tool forearly-stage performance testing. We are currently evaluating the automaticmessage compression mechanism for possible inclusion in the communicationsubsystem.
6.2 Future WorkEvery researcher knows that it is difficult to delimit one’s work when perform-ing research. Plunging deeper into a problem and investigating it more thor-oughly is always interesting and gratifying but as all researchers know theremust always be an end to the study. In this section, we list some areas wherewe would like to investigate further, given the time and resources.
We think that adding model support for dynamic behavior would make themodel more accurate. Currently, we use the mean value of a metric whencreating the model, which is sufficient for our current purposes. Adding thepossibility to model dynamic memory usage would make it possible to investi-gate additional areas, for example, undesirable memory bus side-effects causedby data bursts. It would also be useful to add additional hardware metrics tothe mode, such as branch misses, last level caches, and TLB misses. Addi-tionally, we think that we think that it is possible to increase further the usageof the monitoring functionality, which is currently limited to the test organiza-tion. Our belief is that the design organization would also benefit from an earlyunderstanding of the system behavior and performance bottlenecks.
We have assumed that finding performance related bugs in the initial phasesof the development process will reduce the total development time. We wouldlike to perform a study to investigate that our assumptions are correct. Wewould also like to implement and test our methods on a wider range of systemsto verify that they support varying types of systems.
Another suggestion is to add additional features to the automatic messagecompression mechanism. The natural extension of the current mechanism isto add additional compression techniques. It would be interesting to evaluatehardware supported compression algorithms included in recent processors. Itwould also be interesting to add machine learning techniques to predict recur-ring changes to the message stream, and consequently also predict the com-pression algorithm to use.
When writing this thesis, we have concluded that there is an infinite de-mand for performance investigations and improvements within the industry.We believe that there continue to be a demand for more advanced monitor-ing techniques, allowing system engineers to understand and draw conclusionsregarding system characteristics and performance. The continuous need forincreased bandwidth is promising for the development of more advanced andefficient adaptive message compression techniques. We estimate that modernCPUs will increasingly support hardware acceleration for compression algo-rithms.

Bibliography
[1] 148Apps. Count of Active Applications in the App Store. http:
//148apps.biz/app-store-metrics/?mpage=appcount, 2014. [Ac-cessed 2015-03-04].
[2] AHA. AHA378 Gzip/Zlib/LZS compression/decompression hardware.http://www.aha.com, 2014. [Accessed 2015-03-04].
[3] Goran Ahlforn and Erik Ornulf. Ericsson’s family of carrier-class tech-nologies. Technical Report 4, Ericsson, 2001.
[4] Alaa R. Alameldeen, Milo Martin, Carl J. Mauer, Kevin E. Moore, andMin Xu. Simulating a 2MCommercialServerona2K PC. IEEE Com-puter, 36(2):50–57, 2003.
[5] Alaa R. Alameldeen and David A. Wood. IPC considered harmful formultiprocessor workloads. IEEE Micro, pages 8–17, 2006.
[6] Osman Allam, Stijn Eyerman, and Lieven Eeckhout. An efficient CPIstack counter architecture for superscalar processors. Proceedings of theGreat Lakes Symposium on VLSI, pages 55–58, 2012.
[7] Gabor Andai. Performance monitoring on high-end general processingboards. Master thesis, KTH Royal Institute of Technology, 2014.
[8] Jennifer M. Anderson, Lance M. Berc, Jeffrey Dean, Sanjay Ghemawat,Monika R. Henzinger, Shun-Tak A. Leung, Richard L. Sites, Mark T.Vandevoorde, Carl A. Waldspurger, and William E. Weihl. Continuousprofiling: where have all the cycles gone? ACM SIGOPS, 15(4):357–390, 1997.
[9] Apple. Apples Revolutionary App Store Downloads Top One Billion inJust Nine Months. www.apple.com, 2009. [Accessed 2015-03-04].
75
76 Bibliography
[10] Apple. App Store Tops 40 Billion Downloads with Almost Half in 2012.www.apple.com, 2013. [Accessed 2015-03-04].
[11] Robert H. Bell and Lizy K. John. Improved automatic testcase synthe-sis for performance model validation. In Proceedings of InternationalConference on Supercomputing, pages 111–120. 2005.
[12] S. Bennett. Nicolas Minorsky and the Automatic Steering of Ships.IEEE Control Systems Magazine, 4(4):10–15, 1984.
[13] Mikael Bergqvist, Jakob Engblom, Mikael Patel, and Lars Lundegard.Some experience from the development of a simulator for a telecomcluster (CPPemu). In Proceedings of the International Association ofScience and Technology for Development, pages 13–21. 2006.
[14] JO Best. The race to 5G Inside the fight for the future of mobile as weknow it - Feature - TechRepublic. URL http://www.techrepublic.
com/article/does-the-world-really-need-5g/.
[15] Daniel Biederman. Communication system with content-based datacompression. US Patent 7069342, 2001.
[16] Barry Boehm. The Incremental Comitment Spiral Model. Principles andPractices for Successful Systems and Software. Technical report, 2013.
[17] Barry Boehm and Victor R. Basil. Software Defect Reduction Top 10List. Computer Journal, 34(1):135–137, 2001.
[18] Barry Boehm and Philip N. Papaccio. Understanding and control-ling software costs. IEEE Transactions on Software Engineering,14(10):1462–1477, 1988.
[19] Marilynn B. Brewer. Research design and issues of validity. Handbookof research methods in social and personality psychology. 2000.
[20] Mary Brydon-Miller, Davydd Greenwood, and Patricia Maguire. WhyAction Research? Action Research, 1(1):9–28, jul 2003.
[21] R. L. G. Cavalcante, S. Stanczak, M. Schubert, a. Eisenblatter, andU. Turke. Toward Energy-Efficient 5G Wireless Communications Tech-nologies. IEEE Signal Processing Magazine, accepted f(October):24–34, 2014.
Bibliography 77
[22] Yann Collet. lz4 Data Compression Library. http://fastcompression.blogspot.se/p/lz4.html, 2013. [Accessed 2015-03-04].
[23] Andrew Collette. LZFX Data Compression Library. http://code.
google.com/p/lzfx/, 2013. [Accessed 2015-03-28].
[24] Ericsson Consumerlab. Hot Consumer Trends 2016. Technical ReportDecember 2015, Ericsson Consumer Lab, 2016.
[25] Arnaldo Carvalho de Melo. The New Linux ’perf’ Tools. LinuxKongress, 2010.
[26] Pedro C. Diniz and Martin C. Rinard. Dynamic feedback: An EffectiveTechnique for Adaptive Computing. ACM SIGPLAN Notices, 32(5):71–84, may 1997.
[27] Daniel Doucette and Alexandra Fedorova. Base vectors: A potentialtechnique for microarchitectural classification of applications. In Pro-ceedings of the Workshop on the Interaction between Operating Systemsand Computer Architecture. 2007.
[28] Denis Duka. Connectivity packet platform in the GSM/WCDMA net-work. Proceedings Elmar - International Symposium Electronics in Ma-rine, pages 163–166, 2006.
[29] Lieven Eeckhout, Sebastien Nussbaum, James E. Smith, and Koen DeBosschere. Statistical Simulation: Adding Efficiency to the ComputerDesigner’s Toolbox. IEEE Micro, 23(5):26–38, 2003.
[30] David Eklov, Nikos Nikoleris, David Black-Schaffer, and Erik Hager-sten. Cache Pirating: Measuring the Curse of the Shared Cache. InProceedings of International Conference on Parallel Processing, pages165–175. sep 2011.
[31] David Eklov, Nikos Nikoleris, David Black-Schaffer, and Erik Hager-sten. Bandwidth bandit: Understanding memory contention. ISPASS2012 - IEEE International Symposium on Performance Analysis of Sys-tems and Software, pages 116–117, 2012.
[32] David Eklov, Nikos Nikoleris, David Black-Schaffer, and Erik Hager-sten. Bandwidth Bandit: Quantitative characterization of memory con-tention. Proceedings of the 2013 IEEE/ACM International Symposiumon Code Generation and Optimization, CGO 2013, 2013.
78 Bibliography
[33] Stephane Eranian. What can performance counters do for memory sub-system analysis? In Proceedings of the ACM SIGPLAN workshop onMemory Systems Performance and Correctness, pages 26–30. 2008.
[34] Ericsson. Market Outlook. Technical report, Ericsson, 2013.
[35] Ericsson. Ericsson Consumer Lab: 10 Hot Consumer Trends 2014.Technical report, Ericsson Consumer Lab, 2014.
[36] Ericsson. 5G Radio Access - Technology and Capabilities. TechnicalReport February, Ericsson White Paper, 2015.
[37] Ericsson. Ericsson Mobility Report November 2015. Technical ReportNovember, Ericsson Consumer Lab, 2015.
[38] Ericsson AB. 5G Energy Performance - Key Technologies and DesignPrinciples. Technical Report April, Ericsson White Paper, 2015.
[39] Stijn Eyerman and Lieven Eeckhout. System-level performance metricsfor multiprogram workloads. IEEE Micro, 28(3):42–53, 2008.
[40] Stijn Eyerman, Lieven Eeckhout, Tejas Karkhanis, and James E. Smith.A Top-Down Approach to Architecting CPI Component PerformanceCounters. IEEE Micro, 27(1):84–93, 2007.
[41] Stijn Eyerman, K. Hoste, and Lieven Eeckhout. Mechanistic-empiricalprocessor performance modeling for constructing CPI stacks on realhardware. In International Symposium on Performance Analysis of Sys-tems and Software (ISPASS), pages 216–226. 2011.
[42] Stijn Eyerman and Pierre Michaud. Defining metrics for multicorethroughput on multiprogrammed workloads. Technical report, GhentUniversity - Team ALF, 2013.
[43] Colin Fidge. Fundamentals of distributed system observation. IEEESoftware, 13(6), 1996.
[44] Freescale. Advanced QorIQ Debug and Performance Monitoring. Rev.d edition, 2011.
[45] Anders Furuskar, Jonas Naslund, and Hakan Olofsson. Edge - enhanceddata rates for GSM and TDMA/136 evolution. Ericsson Review (EnglishEdition), 76(1):28–37, 1999.
Bibliography 79
[46] Jean-loup Gailly and Mark Adler. gzip. http://gzip.org, 2014. [Ac-cessed 2015-03-04].
[47] Jean-loup Gailly and Mark Adler. zlib. http://www.zlib.net/, 2014.[Accessed 2015-03-04].
[48] Gartner. High Tech and Telecom Providers. http://www.gartner.com/technology/consulting/high-tech-telecom-providers.jsp, 2012.[Accessed 2015-03-04].
[49] Adithya Gollapudi and Arvind Ojha. Comparing Applicability of TestDesign Techniques for Telecom systems. Ph.D. thesis, Malardalen Uni-versity, 2009.
[50] Google. Snappy Compression Library. https://code.google.com/p/
snappy, 2013. [Accessed 2015-03-28].
[51] Michael Gray, Peter Peterson, and Peter Reiher. Scaling Down Off-The-Shelf Data Compression : Backwards-Compatible Fine-Grain Mix-ing. In Proceedings of Distributed Computing Systems, pages 112 – 121.2012.
[52] GSM World. GSM Market Data Report. Technical report, 2009.
[53] Carl Gutwin, Christopher Fedak, Mark Watson, Jeff Dyck, and TimBell. Improving network efficiency in real-time groupware with gen-eral message compression. In Proceedings of Conference on ComputerSupported Cooperative Work, pages 119–128. ACM Press, New York,USA, 2006.
[54] Daniel Hallmans, Marcus Jagemar, Stig Larsson, and Thomas Nolte.Identifying Evolution Problems for Large Long Term Industrial Evo-lution Systems. In Proceedings of IEEE International Workshop onIndustrial Experience in Embedded Systems Design (COMPSAC14).Vasteras, 2014.
[55] Ariya Hidayat. FastLZ. http://fastlz.org/, 2014. [Accessed 2015-03-28].
[56] Harri Holma and Antti Toskala. WCDMA for UMTS, 3rd edition. JohnWiley & Sons Ltd., 2004.
80 Bibliography
[57] Wen-Mei Hwu and Yale N. Patt. HPSm, a high performance restricteddata flow architecture having minimal functionality. ACM SIGARCHComputer Architecture News, 14(2):297–306, 1986.
[58] Rafia Inam, Mikael Sjodin, and Marcus Jagemar. Bandwidth Measure-ment using Performance Counters for Predictable Multicore Software.In Proceedings of the International Conference on Emerging Technolo-gies and Factory Automation (ETFA12). 2012.
[59] Nathan Ingraham. Apple by the numbers: 30 billion app downloads,650,000 apps available in the App Store. http://www.theverge.
com/2012/6/11/3077792/apple-wwdc-2012-stats-ios-mac-growth,2012. [Accessed 2015-03-04].
[60] Intel. LZO hardware compression. http://software.intel.com/en-
us/articles/lzo-data-compression-support-in-intel-ipp, 2013.[Accessed 2015-03-04].
[61] Anand Padmanabha Iyer, Li Erran Li, and Ion Stoica. CellIQ : Real-Time Cellular Network Analytics at Scale. In Nsdi, pages 218–234.2015.
[62] Marcus Jagemar and Gordana Dodig-Crnkovic. Cognitively SustainableICT with Ubiquitous Mobile Services - Challenges and Opportunities.In Proceedings of International Conference on Software Engineering(ICSE15). 2015.
[63] Marcus Jagemar, Sigrid Eldh, Andreas Ermedahl, and Bjorn Lisper.Technical Report : Feedback-Based Generation of Hardware Charac-teristics. Technical report, Malardalen University, 2012.
[64] Marcus Jagemar, Sigrid Eldh, Andreas Ermedahl, and Bjorn Lisper. To-wards Feedback-Based Generation of Hardware Characteristics. In Pro-ceedings of the 7th International Workshop on Feedback Computing.2012.
[65] Marcus Jagemar, Sigrid Eldh, Andreas Ermedahl, and Bjorn Lisper. Au-tomatic Multi-Core Cache Characteristics Modelling. In Proceedingsof the Swedish Workshop on Multicore Computing (MCC13), page 4.Halmstad, 2013.
Bibliography 81
[66] Marcus Jagemar, Sigrid Eldh, Andreas Ermedahl, and Bjorn Lisper.Adaptive Online Feedback Controlled Message Compression. In Pro-ceedings of Computers, Software and Applications Conference (COMP-SAC14). Vasteras, 2014.
[67] Marcus Jagemar, Sigrid Eldh, Andreas Ermedahl, and Bjorn Lisper. Au-tomatic Message Compression with Overload Protection. In press: TheJournal of Systems and Software, 2016.
[68] Marcus Jagemar, Sigrid Eldh, Andreas Ermedahl, Bjorn Lisper, and Ga-bor Andai. Automatic Load Synthesis for Performance Verification inEarly Design Phases. Technical report, Malardalen University, 2016.
[69] Emmanuel Jeannot. Improving Middleware Performance with AdOC:an Adaptive Online Compression Library for Data Transfer. In Proceed-ings of International Parallel and Distributed Processing Symposium,page 70. 2005.
[70] Emmanuel Jeannot. ADOC homepage. http://www.labri.fr/perso/ejeannot/adoc/adoc.html, 2012. [Accessed 2015-03-04].
[71] Emmanuel Jeannot, Bjorn Bjorn Knutsson, Mats Bjorkman, and MatsBjorkman. Adaptive online data compression. In IEEE High Perfor-mance Distributed Computing. 2002.
[72] Ajay Joshi, Lieven Eeckhout, Robert H. Bell, and Lizy K. John. Dis-tilling the essence of proprietary workloads into miniature benchmarks.ACM Transactions on Architecture and Code Optimization, 5(2):1–33,aug 2008.
[73] Ajay Joshi, Lieven Eeckhout, Robert H Bell Jr, I B M Corp, and LizyJohn. Performance Cloning : A Technique for Disseminating Propri-etary Applications as Benchmarks Background and Motivation. Inter-national Symposium on Workload Characterization, 2006.
[74] Stefan Karlsson and Erik Hansson. Lossless Message Compression.Bachelor thesis, Malardalen University, 2013.
[75] Keunsoo Kim, Changmin Lee, Jung Ho Jung, and Won Woo Ro. Work-load synthesis: Generating benchmark workloads from statistical exe-cution profile. In 2014 IEEE International Symposium on WorkloadCharacterization (IISWC), pages 120–129. 2014.
82 Bibliography
[76] Lars-orjan Kling, Ake Lindholm, Lars Marklund, and Gunnar B Nils-son. CPP Cello packet platform. Technical Report 2, Ericsson Review,2002.
[77] Bjorn Knutsson. Increasing Communication Performance via AdaptiveCompression. In Proceedings of the Seventh Swedish Workshop on Com-puter Systems Architecture. Gothenburg, Sweden, 1998.
[78] Bjorn Knutsson and Mats Bjorkman. Trading Computation for Com-munication by End-to-End Compression. In Proceedings of the Interna-tional Workshop on High Performance Protocol Architectures. 1997.
[79] Bjorn Knutsson and Mats Bjorkman. Adaptive end-to-end compres-sion for variable-bandwidth communication. Computer Networks,31(7):767–779, apr 1999.
[80] N Krajnovic. The design of a highly available enterprise ip telephonynetwork for the power utility of Serbia company. Communications Mag-azine, IEEE, 47(4):118–122, apr 2009.
[81] Chandra Krintz and Sezgin Sucu. Adaptive on-the-fly compression.IEEE Transactions on Parallel and Distributed Systems, 17(1):15 – 24,jan 2006.
[82] Jeremy Lau, Matthew Arnold, Michael Hind, and Brad Calder. Onlineperformance auditing. In Proceedings of ACM SIGPLAN Conference onProgramming language design and implementation, pages 239–251. jun2006.
[83] Kurt Lewin. Action research and minority problems. Journal of SocialIssues, 2(4):34–46, 1946.
[84] Linuxcounter. Lines of code of the Linux Kernel Versions. URL https:
//www.linuxcounter.net/statistics/kernel.
[85] Steven McGeady, Randy Steck, Glenn Hinton, and Atiq Bajwa. Perfor-mance enhancements in the superscalar i960MM embedded micropro-cessor. COMPCON Spring ’91 Digest of Papers, 1991.
[86] Larry Mcvoy and Carl Staelin. lmbench : Portable Tools for Perfor-mance Analysis. In Proceedings of the USENIX Annual Technical Con-ference, pages 279–294. 1996.
Bibliography 83
[87] Vilhelm Moberg. Din stund pa jorden. 1963.
[88] Vu Nguyen, Sophia Deeds-Rubin, Thomas Tan, and Barry Boehm. ASLOC Counting Standard. pages 1–15, 2007.
[89] Bogdan Nicolae. On the benefits of transparent compression for cost-effective cloud data storage. In Proceedings of Transactions on LargeScale Data and Knowledge Centered Systems, volume 3, pages 167–184. 2011.
[90] Nokia Siemens Networks. Long Term HSPA Evolution: Mobile Broad-band Evolution beyond 3GPP Release 10 HSPA has Transformed Mo-bile Networks. Technical report, Nokia Siemens Networks, 2010.
[91] S. Nussbaum and J.E. Smith. Modeling superscalar processors via sta-tistical simulation. In Proceedings of the International Conference onParallel Architectures and Compilation Techniques, pages 15–24. 2001.
[92] Markus Oberhumer. LZO (Lempel-Ziv-Oberhumer) Data CompressionLibrary. http://www.oberhumer.com/opensource/lzo/, 2013. [Ac-cessed 2015-03-04].
[93] Oxford. English Dictionary (online), 2014.
[94] Igor Pavlov. LZMA Software Development Kit. http://www.7-zip.
org/sdk.html, 2013. [Accessed 2015-03-27].
[95] Kai Petersen, C Gencel, and N Asghari. Action research as a model forindustry-academia collaboration in the software engineering context. InProceedings of the 2014 international workshop on Long-term indus-trial collaboration on software engineering, pages 55–62. 2014.
[96] Kai Petersen and Claes Wohlin. Context in industrial software engi-neering research. In International Symposium on Empirical SoftwareEngineering and Measurement, pages 401–404. Orlando, Florida, USA,2009.
[97] Ian Poole. Cellular Communications Explained : From Basics to 3G.Elsevier, 1st edition, 2006.
[98] Calton Pu and Lenin Singaravelu. Fine-Grain Adaptive Compressionin Dynamically Variable Networks. In Proceedings of the InternationalConference on Distributed Computing Systems, pages 685–694. 2005.
84 Bibliography
[99] Lasse Mikkel Reinhold. QuickLZ - Fast compression library for C, C#and Java. http://www.quicklz.com/, 2011. [Accessed 2013-05-31].
[100] Martin Ringwelski, Christian Renner, Andreas Reinhardt, AndreasWeigel, and Volker Turau. The hitchhiker’s guide to choosing the com-pression algorithm for your smart meter data. In 2nd IEEE ENERGY-CON Conference & Exhibition, pages 935–940. 2012.
[101] Colin Robson. Real world research. Blackwell, Oxford, 2nd edition,2002.
[102] Jussi Rosendahl and Leila Abboud. Nokia buys Alcatel to take on Eric-sson in telecom equipment. http://www.reuters.com/article/2015/04/15/nokia-alcatel-lucent-ma-idUSL5N0XC0X220150415, 2015.
[103] Hans Rosling. Hans Rosling is lecturing the Danish Radio Channel 2program (deadline) host Adam Holm, sep 2015.
[104] Kim Rowe. Time to market is a critical consideration.http://www.embedded.com/electronics-blogs/industry-
comment/4027610/Time-to-market-is-a-critical-consideration,2010. [Accessed 2015-03-04].
[105] Per Runeson. Case Study Research or Anecdotal Evicende? Technicalreport, 2010.
[106] Per Runeson and Martin Host. Guidelines for conducting and reportingcase study research in software engineering. Empirical Software Engi-neering, 14(2):131–164, dec 2008.
[107] Rafael H. Saavedra and Alan J. Smith. Measuring cache and TLB per-formance and their effect on benchmark runtimes. IEEE Transactionson Computers, 44(10):1223–1235, 1995.
[108] Max Schuchard, Eugene Y. Vasserman, Abedelaziz Mohaisen, De-nis Foo Kune, Nicholas Hopper, and Yongdae Kim. Losing Controlof the Internet: Using the Data Plane to Attack the Control Plane. InComputer and Communications Security, pages 726–728. 2010.
[109] Carolyn B. Seaman. Qualitative methods in empirical studies ofsoftware engineering. IEEE Transactions on Software Engineering,25(4):557–572, 1999.
Bibliography 85
[110] Julian Seward. BZIP2, a program and library for data compression com-pression. http://www.bzip.org, 2013. [Accessed 2015-03-04].
[111] Dag Sjøberg, Tore Dyba, and Magne Jørgensen. The Future of Em-pirical Methods in Software Engineering Research. Future of SoftwareEngineering, SE-13(1325):358–378, 2007.
[112] Jan Christiaan Smuts. Holism and Evolution, volume 119. Macmillianand Co., London, 2nd edition, 1927.
[113] Niklas Stahle. Implementing Transaction Tracing in Real-Time SystemsMaster of Science Thesis Implementing Transaction Tracing in Real-Time Systems. Ph.D. thesis, Royal Institute of Technology, 2009.
[114] Jorgen Stenmark. Intellectual property rights and copyright laws versusfile-sharing in Cyberspace.
[115] Sezgin Sucu and Chandra Krintz. Ace: A resource-aware adaptive com-pression environment. In Proceedings of International Conference of In-formation Technology: Coding and Computing, pages 183 – 188. 2003.
[116] Gregory Tassey. The economic impacts of inadequate infrastructure forsoftware testing. Technical Report 7007, National Institute of Standardsand Technology, 2002.
[117] Paul Taylor. Battle lines are drawn for the future of 4G.http://www.ft.com/intl/cms/s/0/399b1508-d9d8-11dc-bd4d-
0000779fd2ac.html{#}axzz1va5rEtRx, 2008. [Accessed 2015-03-04].
[118] Techcrunch. Apples App Store Hits 50 Billion Downloads, 900K Apps.http://techcrunch.com/2013/06/10/apples-app-store-hits-50-
billion-downloads-paid-out-10-billion-to-developers/, 2013.[Accessed 2015-03-04].
[119] Telecomasia. Faster time to market with next-gen OSS.http://www.telecomasia.net/content/faster-time-market-
next-gen-oss, 2012. [Accessed 2015-03-04].
[120] Ericsson Nikola Tesla, Denis Duka, and Keywords Cpp. ConnectivityPacket Platform in the GSMIWCDMA Network. In Access, June, pages7–9. 2006.
86 Bibliography
[121] Hans Vestberg. Ericsson unveils new products, partnerships and in-creased market share. In Proceedings of at Mobile World Conference.2012.
[122] Wan Vinny. CPP in LTE Overview. Technical report, Ericsson, 2014.
[123] Johan De Vriendt, Philippe Laine, Christophe Lerouge, and XiaofengXu. Mobile network evolution: a revolution on the move. IEEE Com-munications magazine, (April):104–111, 2002.
[124] Terry A Welch. A Technique for High-Performance Data Compression.Computer, 17(6):8–19, 1984.
[125] Benjamin Welton, Dries Kimpe, Jason Cope, Christina M. Patrick,Kamil Iskra, and Robert Ross. Improving I/O Forwarding Through-put with Data Compression. 2011 IEEE International Conference onCluster Computing, pages 438–445, sep 2011.
[126] Y. Wiseman, K. Schwan, and P. Widener. Efficient end to end data ex-change using configurable compression. ACM SIGOPS Operating Sys-tems Review, pages 4–23, 2005.
[127] Claes Wohlin, Per Runeson, Martin Host, Magnus C. Ohlsson, BjornRegnell, and Anders Wesslen. EXPERIMENTATION IN SOFTWAREAn Introduction. Springer Science+Business Media LLC, Lund, 2000.
[128] Robert K. Yin. Case study research: Design and methods, volume 5.Sage, 2nd edition, 1994.
[129] Li Zhang, Dhruv Gupta, and Prasant Mohapatra. How expensive are freesmartphone apps? ACM SIGMOBILE Mobile Computing and Commu-nications Review, 16(3):21–32, dec 2012.