Embed Size (px)
Citation preview
Utilizing Flow and Packet Data to Troubleshoot Network Performance and Security Issues
Utilizing Flow and Packet Data to Troubleshoot Network Performance and Security Issues | 2
Utilizing Flow and Packet Data to Troubleshoot Network Performanceand Security Issues
What is Flow and Packet Data?
Flow and Packet Data - How They Measure Up
Pros and Cons of Flow and Packet Data
Using Monitoring Software to Troubleshooting Network Performance Issues
Useful Features that Provide Exceptional Insight Into Networks
Utilizing Flow and Packet Analysis for Troubleshooting
Improve Network Troubleshooting with LiveAction
Table of Contents
3
4
6
7
8
9
10
11
Utilizing Flow and Packet Data to Troubleshoot Network Performance and Security Issues | 3
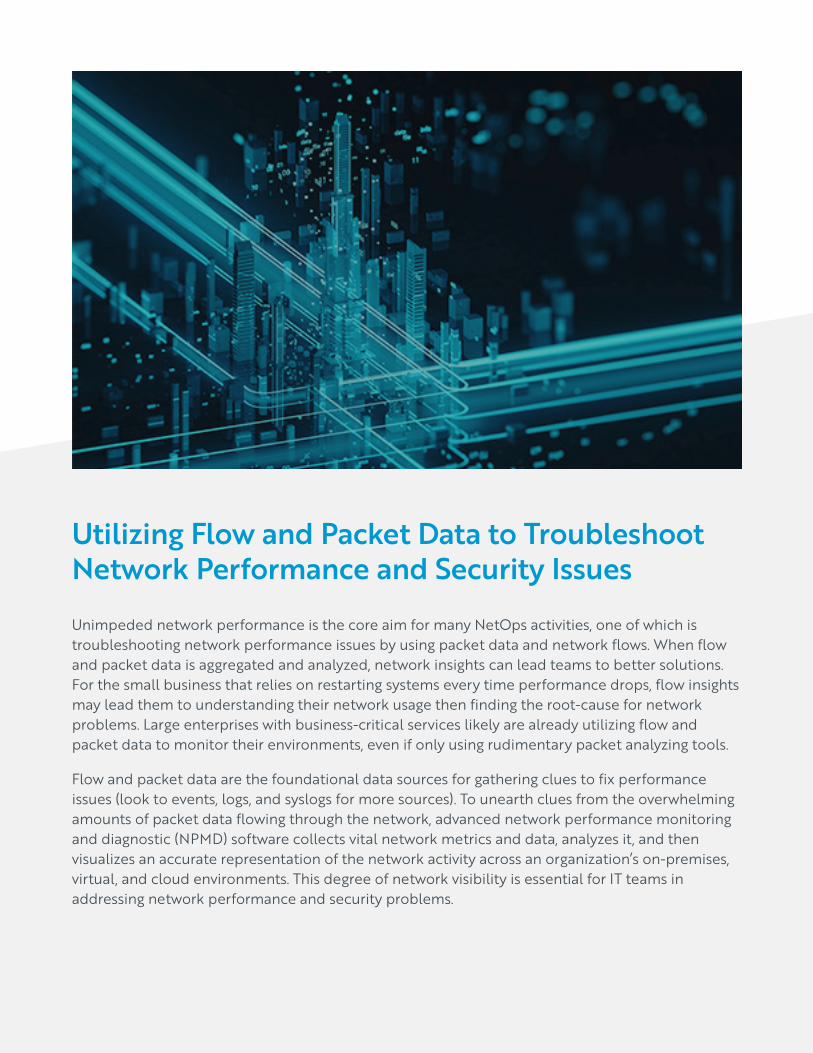
Unimpeded network performance is the core aim for many NetOps activities, one of which is troubleshooting network performance issues by using packet data and network flows. When flow and packet data is aggregated and analyzed, network insights can lead teams to better solutions. For the small business that relies on restarting systems every time performance drops, flow insights may lead them to understanding their network usage then finding the root-cause for network problems. Large enterprises with business-critical services likely are already utilizing flow and packet data to monitor their environments, even if only using rudimentary packet analyzing tools.
Flow and packet data are the foundational data sources for gathering clues to fix performance issues (look to events, logs, and syslogs for more sources). To unearth clues from the overwhelming amounts of packet data flowing through the network, advanced network performance monitoring and diagnostic (NPMD) software collects vital network metrics and data, analyzes it, and then visualizes an accurate representation of the network activity across an organization’s on-premises, virtual, and cloud environments. This degree of network visibility is essential for IT teams in addressing network performance and security problems.
Utilizing Flow and Packet Data to Troubleshoot Network Performance and Security Issues
Utilizing Flow and Packet Data to Troubleshoot Network Performance and Security Issues | 4
What is Flow and Packet Data?
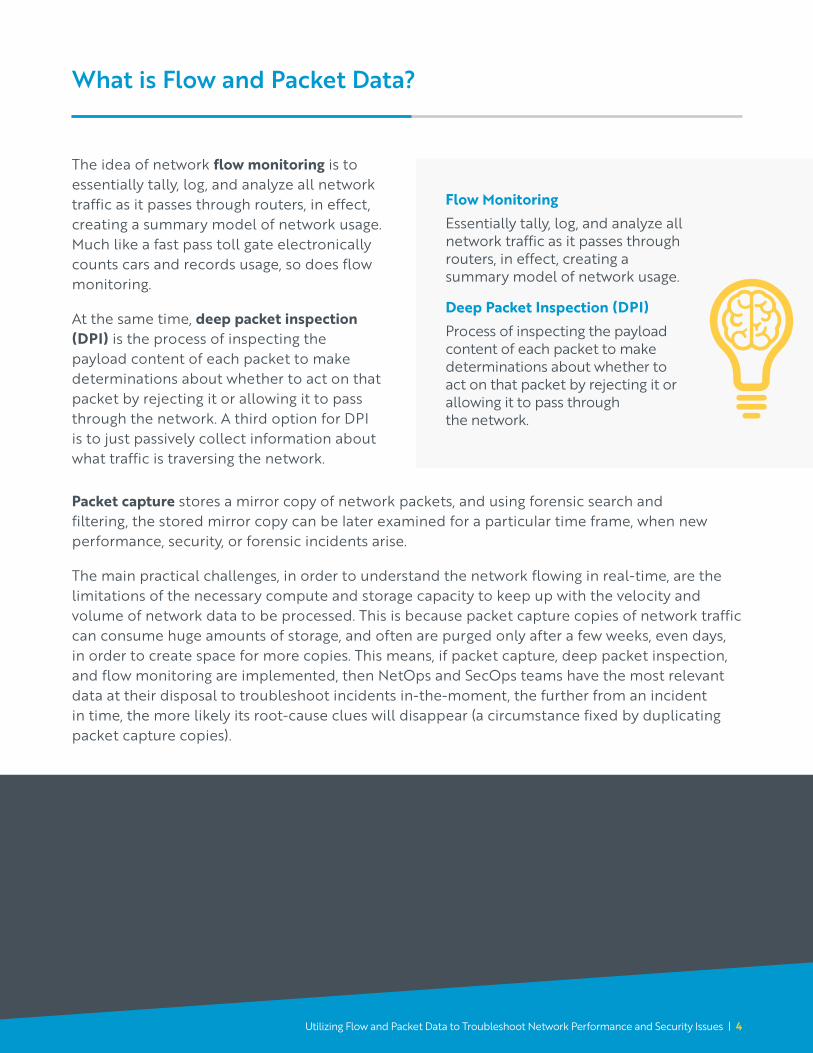
The idea of network flow monitoring is to essentially tally, log, and analyze all network traffic as it passes through routers, in effect, creating a summary model of network usage. Much like a fast pass toll gate electronically counts cars and records usage, so does flow monitoring.
At the same time, deep packet inspection (DPI) is the process of inspecting the payload content of each packet to make determinations about whether to act on that packet by rejecting it or allowing it to pass through the network. A third option for DPI is to just passively collect information about what traffic is traversing the network.
Flow MonitoringEssentially tally, log, and analyze all network traffic as it passes through routers, in effect, creating a summary model of network usage.
Deep Packet Inspection (DPI)Process of inspecting the payload content of each packet to make determinations about whether to act on that packet by rejecting it or allowing it to pass through the network.
Packet capture stores a mirror copy of network packets, and using forensic search and filtering, the stored mirror copy can be later examined for a particular time frame, when new performance, security, or forensic incidents arise.
The main practical challenges, in order to understand the network flowing in real-time, are the limitations of the necessary compute and storage capacity to keep up with the velocity and volume of network data to be processed. This is because packet capture copies of network traffic can consume huge amounts of storage, and often are purged only after a few weeks, even days, in order to create space for more copies. This means, if packet capture, deep packet inspection, and flow monitoring are implemented, then NetOps and SecOps teams have the most relevant data at their disposal to troubleshoot incidents in-the-moment, the further from an incident in time, the more likely its root-cause clues will disappear (a circumstance fixed by duplicating packet capture copies).
Utilizing Flow and Packet Data to Troubleshoot Network Performance and Security Issues | 4
Utilizing Flow and Packet Data to Troubleshoot Network Performance and Security Issues | 5
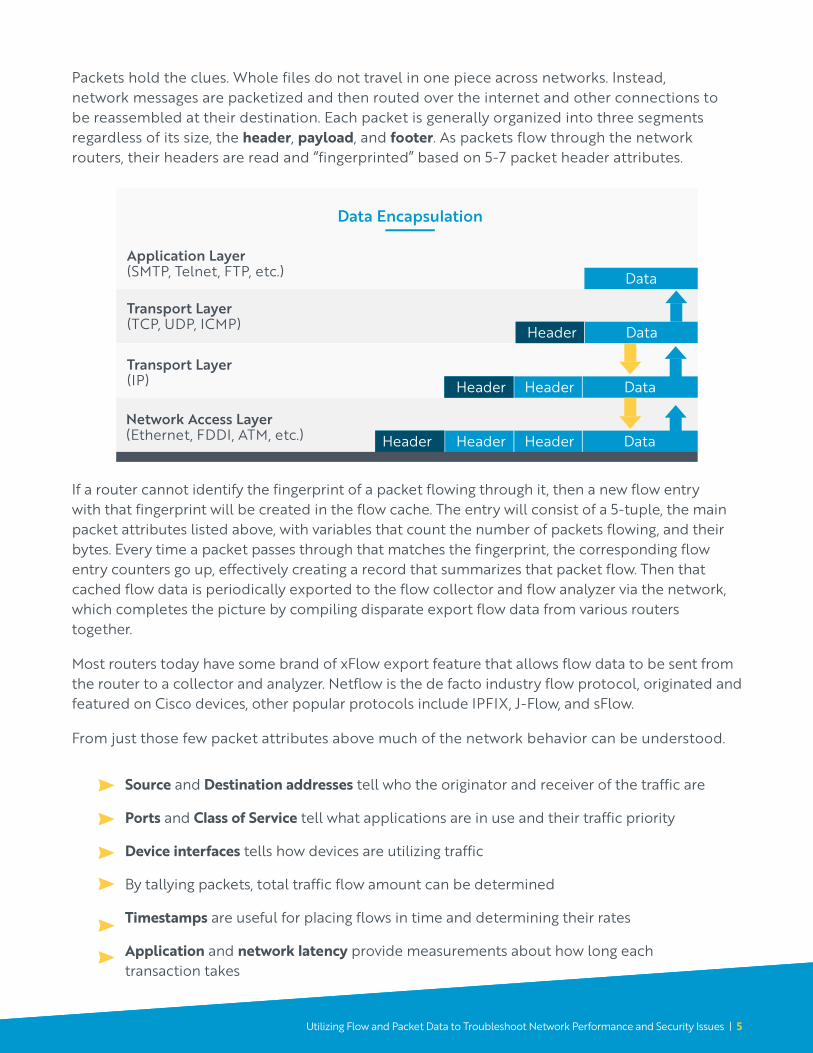
Packets hold the clues. Whole files do not travel in one piece across networks. Instead, network messages are packetized and then routed over the internet and other connections to be reassembled at their destination. Each packet is generally organized into three segments regardless of its size, the header, payload, and footer. As packets flow through the network routers, their headers are read and “fingerprinted” based on 5-7 packet header attributes.
Source and Destination addresses tell who the originator and receiver of the traffic are
Ports and Class of Service tell what applications are in use and their traffic priority
Device interfaces tells how devices are utilizing traffic
By tallying packets, total traffic flow amount can be determined
Timestamps are useful for placing flows in time and determining their rates
Application and network latency provide measurements about how long each transaction takes
Utilizing Flow and Packet Data to Troubleshoot Network Performance and Security Issues | 5
If a router cannot identify the fingerprint of a packet flowing through it, then a new flow entry with that fingerprint will be created in the flow cache. The entry will consist of a 5-tuple, the main packet attributes listed above, with variables that count the number of packets flowing, and their bytes. Every time a packet passes through that matches the fingerprint, the corresponding flow entry counters go up, effectively creating a record that summarizes that packet flow. Then that cached flow data is periodically exported to the flow collector and flow analyzer via the network, which completes the picture by compiling disparate export flow data from various routers together.
Most routers today have some brand of xFlow export feature that allows flow data to be sent from the router to a collector and analyzer. Netflow is the de facto industry flow protocol, originated and featured on Cisco devices, other popular protocols include IPFIX, J-Flow, and sFlow.
From just those few packet attributes above much of the network behavior can be understood.
Utilizing Flow and Packet Data to Troubleshoot Network Performance and Security Issues | 6
Because they summarize instead of drill down into details, flows are limited in diagnosing and troubleshooting configuration issues or error conditions. What they excel at is providing insight into traffic by application, protocol, domain, ports, and source and destination IPs. This means that a bandwidth problem that once seemed like one solid mass of traffic is suddenly dissected into its flows. This quickly and effectively highlights bandwidth hogs. Furthermore, flow bandwidth representations come with which devices are running those hogs, and whether it is the application or device itself that is doing the hogging. This level of visibility can be exceptionally useful in developing usage policies based on network and user behaviors.
With the mirrored copies of network traffic that packet capture stores, historic flows can be recreated, and also detailed clues can be uncovered within the data to troubleshoot more specific technical problems hidden in the details, like evidence of misconfigurations, outside intrusion, or faulty hardware.
Further with deep packet inspection, packets are judged (filtered) against a set of tailored rules created by the NetOps and/or SecOps team. By whitelisting or blacklisting certain traffic, say by allowing only critical protocols, or by rejecting patterns of packets based on a matching signature from a database known previously to be a threats, DPI can be used in intrusion detection systems (IDS) and intrusion prevention systems (IPS) to prevent worms, viruses, and spyware from entering the network, and alert teams to when there are network problems.
Flow and Packet Data — How They Measure Up
Utilizing Flow and Packet Data to Troubleshoot Network Performance and Security Issues | 6
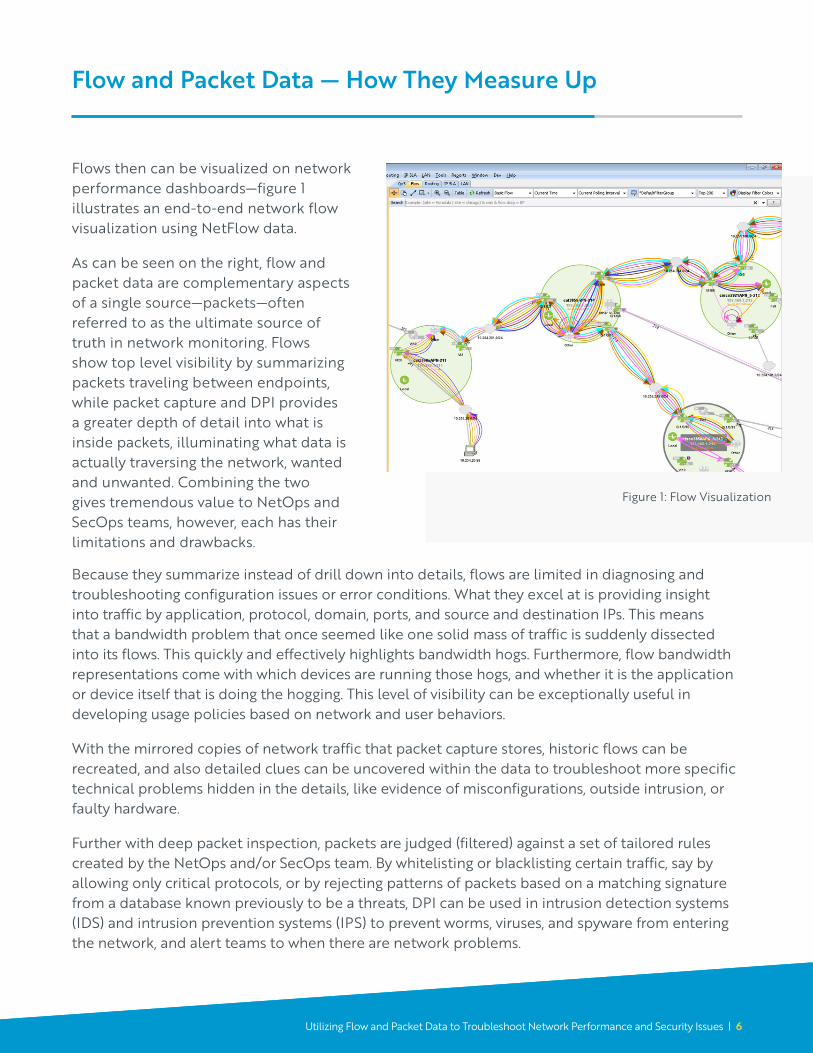
Flows then can be visualized on network performance dashboards—figure 1 illustrates an end-to-end network flow visualization using NetFlow data.
As can be seen on the right, flow and packet data are complementary aspects of a single source—packets—often referred to as the ultimate source of truth in network monitoring. Flows show top level visibility by summarizing packets traveling between endpoints, while packet capture and DPI provides a greater depth of detail into what is inside packets, illuminating what data is actually traversing the network, wanted and unwanted. Combining the two gives tremendous value to NetOps and SecOps teams, however, each has their limitations and drawbacks.
Figure 1: Flow Visualization
Utilizing Flow and Packet Data to Troubleshoot Network Performance and Security Issues | 7
Pros and Cons of Flow and Packet Data
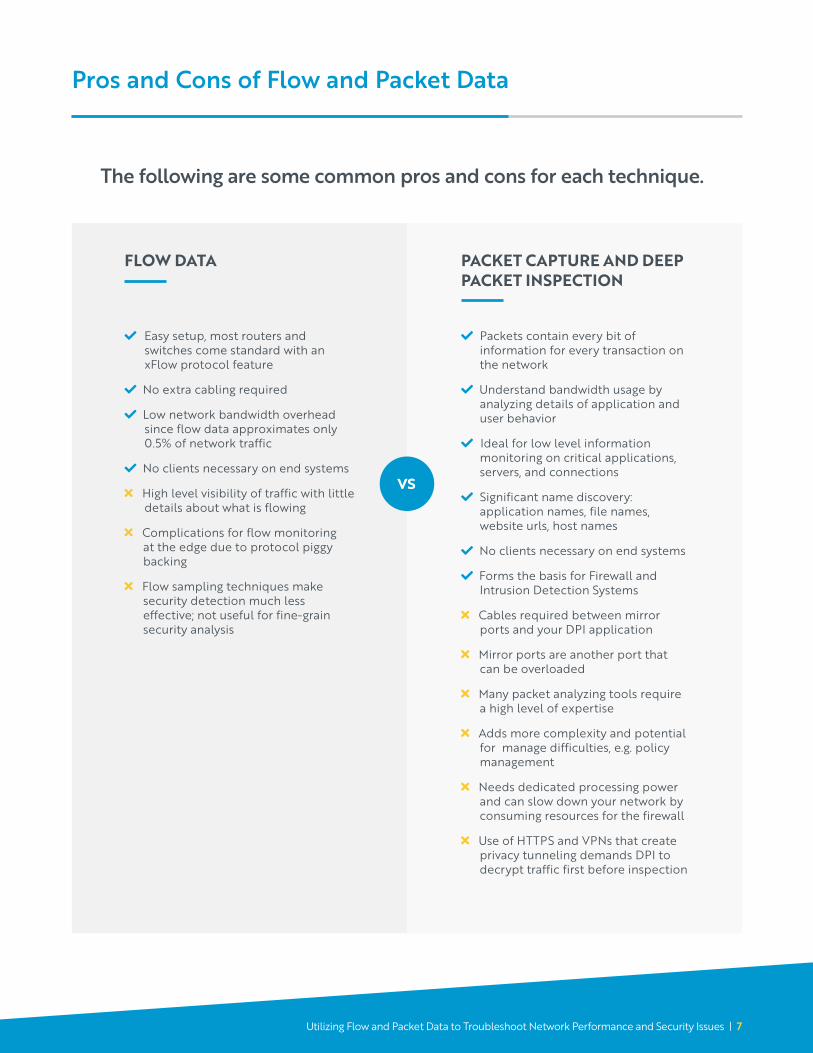
The following are some common pros and cons for each technique.
vs
FLOW DATA PACKET CAPTURE AND DEEP PACKET INSPECTION
Easy setup, most routers and switches come standard with an xFlow protocol feature
No extra cabling required
Low network bandwidth overhead since flow data approximates only 0.5% of network traffic
No clients necessary on end systems
High level visibility of traffic with little details about what is flowing
Complications for flow monitoring at the edge due to protocol piggy backing
Flow sampling techniques make security detection much less effective; not useful for fine-grain security analysis
Packets contain every bit of information for every transaction on the network
Understand bandwidth usage by analyzing details of application and user behavior
Ideal for low level information monitoring on critical applications, servers, and connections
Significant name discovery: application names, file names, website urls, host names
No clients necessary on end systems
Forms the basis for Firewall and Intrusion Detection Systems
Cables required between mirror ports and your DPI application
Mirror ports are another port that can be overloaded
Many packet analyzing tools require a high level of expertise
Adds more complexity and potential for manage difficulties, e.g. policy management
Needs dedicated processing power and can slow down your network by consuming resources for the firewall
Use of HTTPS and VPNs that create privacy tunneling demands DPI to decrypt traffic first before inspection
Utilizing Flow and Packet Data to Troubleshoot Network Performance and Security Issues | 8
Using Monitoring Software to Troubleshooting Network Performance Issues
Troubleshooting network performance issues is a process of sleuthing out relevant data clues that can lead to a reasonable assessment of the underlying problem. Sometimes problems are simple, for instance, routers may become congested, but the problem doesn’t have to be faulty equipment, rather understanding network traffic usage may lead to a reconfiguration fix that prioritizes business critical traffic over personal-use traffic that leads to over-consuming bandwidth resources. This conclusion can be quickly found if network traffic is monitored, and even more quickly if the monitoring software is capable of clearly visualizing flows, or generating alerts.
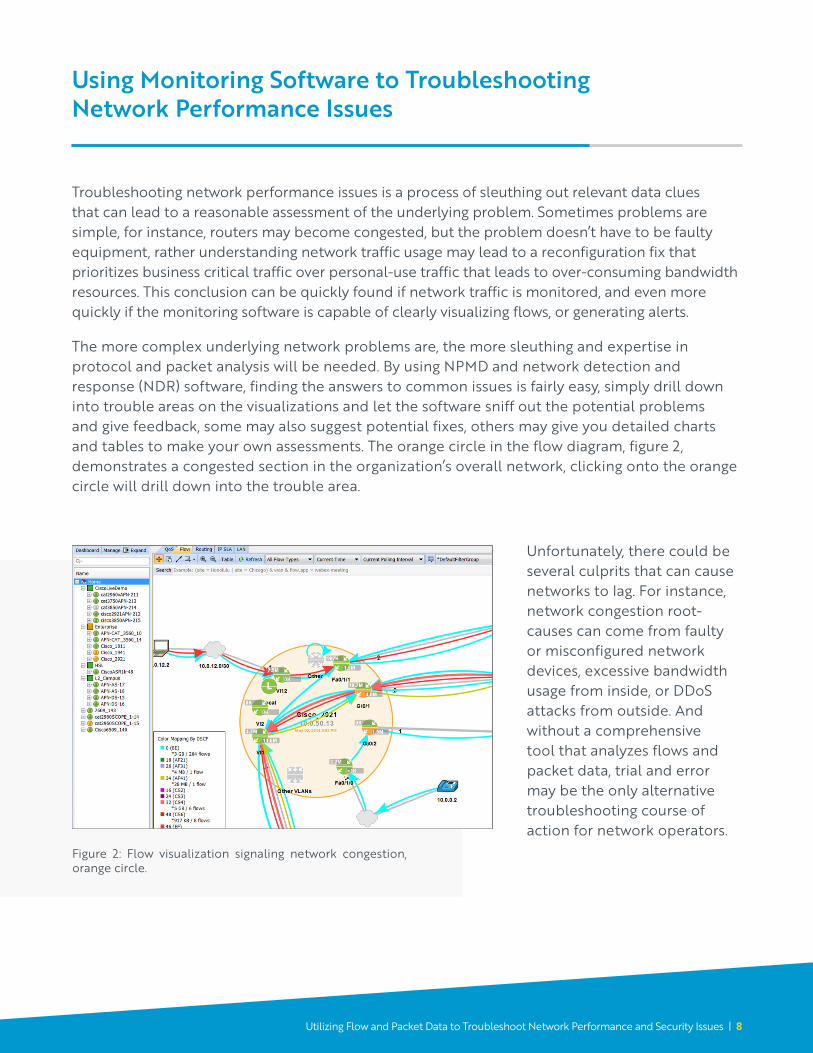
The more complex underlying network problems are, the more sleuthing and expertise in protocol and packet analysis will be needed. By using NPMD and network detection and response (NDR) software, finding the answers to common issues is fairly easy, simply drill down into trouble areas on the visualizations and let the software sniff out the potential problems and give feedback, some may also suggest potential fixes, others may give you detailed charts and tables to make your own assessments. The orange circle in the flow diagram, figure 2, demonstrates a congested section in the organization’s overall network, clicking onto the orange circle will drill down into the trouble area.
Figure 2: Flow visualization signaling network congestion, orange circle.
Unfortunately, there could be several culprits that can cause networks to lag. For instance, network congestion root-causes can come from faulty or misconfigured network devices, excessive bandwidth usage from inside, or DDoS attacks from outside. And without a comprehensive tool that analyzes flows and packet data, trial and error may be the only alternative troubleshooting course of action for network operators.
Utilizing Flow and Packet Data to Troubleshoot Network Performance and Security Issues | 9
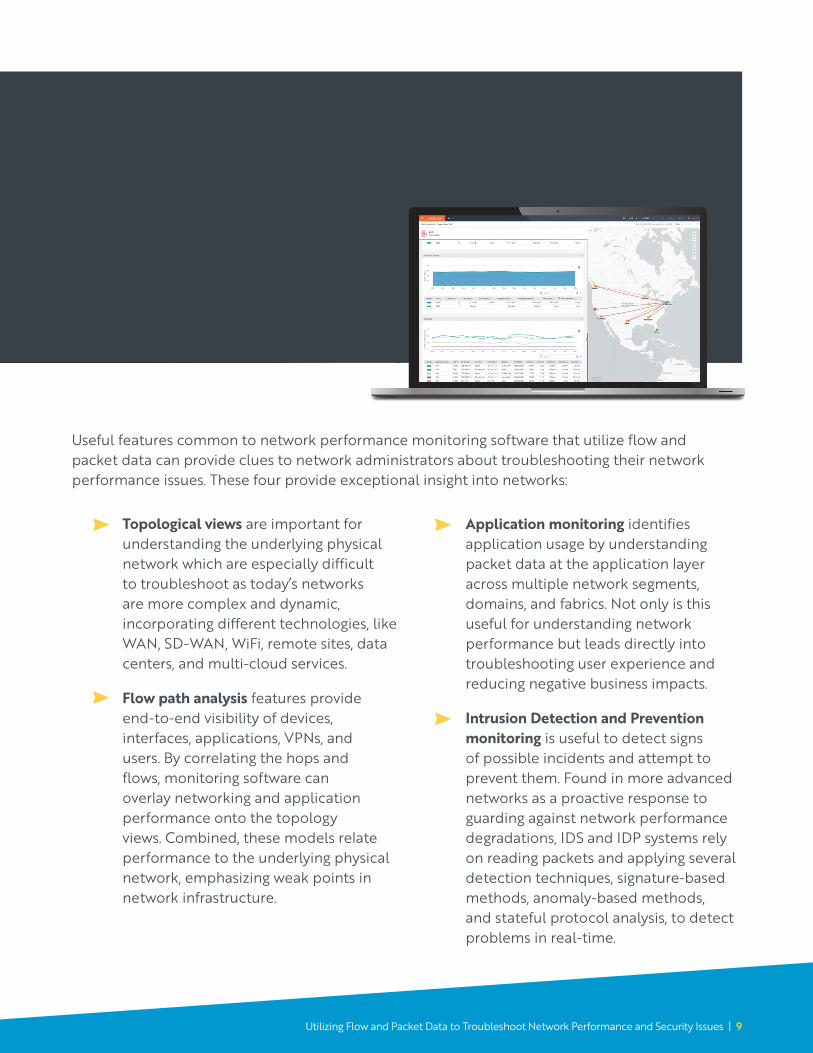
Topological views are important for understanding the underlying physical network which are especially difficult to troubleshoot as today’s networks are more complex and dynamic, incorporating different technologies, like WAN, SD-WAN, WiFi, remote sites, data centers, and multi-cloud services.
Flow path analysis features provide end-to-end visibility of devices, interfaces, applications, VPNs, and users. By correlating the hops and flows, monitoring software can overlay networking and application performance onto the topology views. Combined, these models relate performance to the underlying physical network, emphasizing weak points in network infrastructure.
Application monitoring identifies application usage by understanding packet data at the application layer across multiple network segments, domains, and fabrics. Not only is this useful for understanding network performance but leads directly into troubleshooting user experience and reducing negative business impacts.
Intrusion Detection and Prevention monitoring is useful to detect signs of possible incidents and attempt to prevent them. Found in more advanced networks as a proactive response to guarding against network performance degradations, IDS and IDP systems rely on reading packets and applying several detection techniques, signature-based methods, anomaly-based methods, and stateful protocol analysis, to detect problems in real-time.
Useful features common to network performance monitoring software that utilize flow and packet data can provide clues to network administrators about troubleshooting their network performance issues. These four provide exceptional insight into networks:
Utilizing Flow and Packet Data to Troubleshoot Network Performance and Security Issues | 10
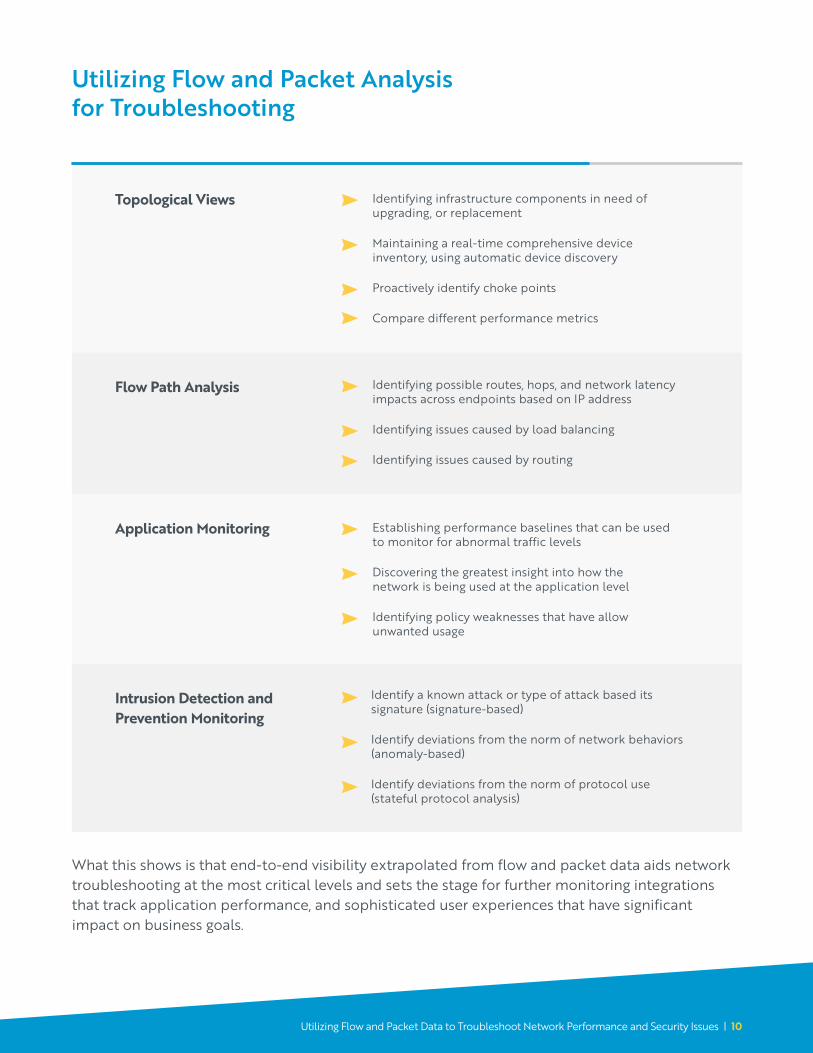
Utilizing Flow and Packet Analysis for Troubleshooting
Topological Views
Application Monitoring
Flow Path Analysis
Intrusion Detection and Prevention Monitoring
Identifying infrastructure components in need of upgrading, or replacement
Maintaining a real-time comprehensive device inventory, using automatic device discovery
Proactively identify choke points
Compare different performance metrics
Establishing performance baselines that can be used to monitor for abnormal traffic levels
Discovering the greatest insight into how the network is being used at the application level
Identifying policy weaknesses that have allow unwanted usage
Identifying possible routes, hops, and network latency impacts across endpoints based on IP address
Identifying issues caused by load balancing
Identifying issues caused by routing
Identify a known attack or type of attack based its signature (signature-based)
Identify deviations from the norm of network behaviors (anomaly-based)
Identify deviations from the norm of protocol use (stateful protocol analysis)
What this shows is that end-to-end visibility extrapolated from flow and packet data aids network troubleshooting at the most critical levels and sets the stage for further monitoring integrations that track application performance, and sophisticated user experiences that have significant impact on business goals.
Utilizing Flow and Packet Data to Troubleshoot Network Performance and Security Issues | 11
Oftentimes, enterprises have seen flow and packet data as mutually exclusive, that one can be utilized without the need for the other, but the truth remains that when combined you can gain complete visibility – even in the darkest corners of the network. NetOps teams can protect against security threats, investigate alerts, and ensure the overall performance of the network and applications. Most organizations use a host of network monitoring tools to analyze flow and packet data. Disparate tools create additional time and effort when a problem needs to be fixed – and fast.
That’s where we come in.
Get visibility where there is none today with LiveWire. With LiveWire, IT professionals can enable real-time and post-event analytics up to 20Gbps and is perfect for generating flow data directly from network packets from virtually anywhere in the network. With LiveAction teams can easily go from a global view of the network and drill down to individual packets when it is necessary to solve problems. This unmatched network visibility is why LiveAction is unrivaled in reducing MTTR.
Improve Network Troubleshooting with LiveAction
Learn how enterprise network operations teams can optimize application performance in Application Performance Insight Requires Deep, End-to-End Network Insight.
Learn how the future network landscape is changing due to pandemic demand in The Importance of Advanced Analytics for NetOps.
Learn more about network forensics tools in Performing Network Forensics with Packet Data.
Utilizing Flow and Packet Data to Troubleshoot Network Performance and Security Issues | 11
Utilizing Flow and Packet Data to Troubleshoot Network Performance and Security Issues | 12
About LiveActionLiveAction provides end-to-end visibility of network and application performance from a single pane of glass. This gives enterprises confidence that the network is meeting business objectives offers IT administrators full visibility for better decision making and reduces the overall cost of operations. By unifying and simplifying the collection, correlation and presentation of application and network data, LiveAction empowers network professionals to proactively identify, troubleshoot and resolve issues across increasingly large and complex networks proactively and quickly. To learn more and see how LiveAction delivers unmatched network visibility, visit www.liveaction.com
© Copyright 2021 - LiveAction. All Rights Reserved.
960 San Antonio Rd, Suite 200, Palo Alto, CA 94303, USA · +1 (888) 881-1116