Embed Size (px)
Citation preview
Utilizing Data Trend Evaluations in Method Audits and Regulations
Development
National Environmental Monitoring and
The NELAC Institute (TNI) Conference 8/09/2018
Presented byCornelius (Andy) Valkenburg
Energy Laboratories, Inc.‐ Billings, MT1

DISCLAIMER
• The material given in this presentation is the professional opinion and interpretations of the presenter only.
2
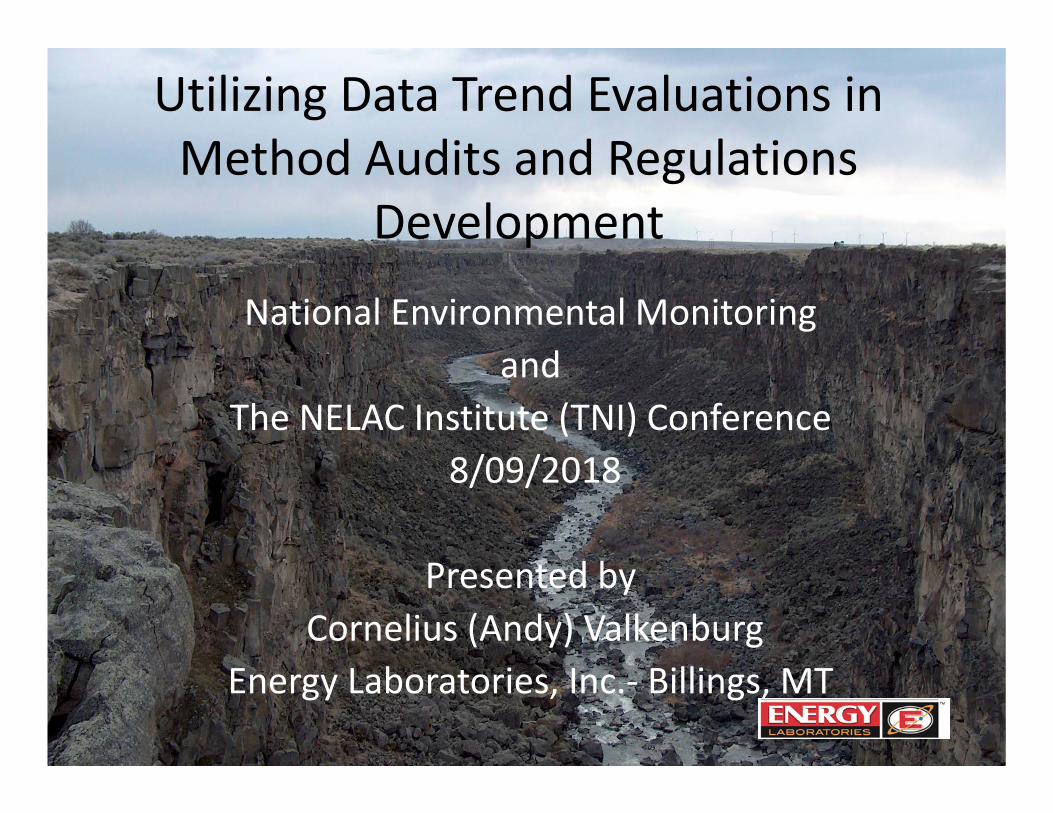
EPA 300.0 – NITRITE‐ICV % Recovery
3
FRESH ICV STANDARD (Same Stock)
Preventative Maintenance and CALIBRATION
‐
PT Studies
|‐‐‐‐‐‐‐‐‐‐‐‐‐‐‐‐‐‐‐‐‐‐‐‐‐‐‐TIME = RUN DATES over 6 MONTHS‐‐‐‐‐‐‐‐‐‐‐‐‐‐‐‐‐‐‐‐‐‐‐‐‐‐‐‐‐|
100%
110%
90%
% Recovery
FRESH CAL Stock Std FRESH CAL Stock Std
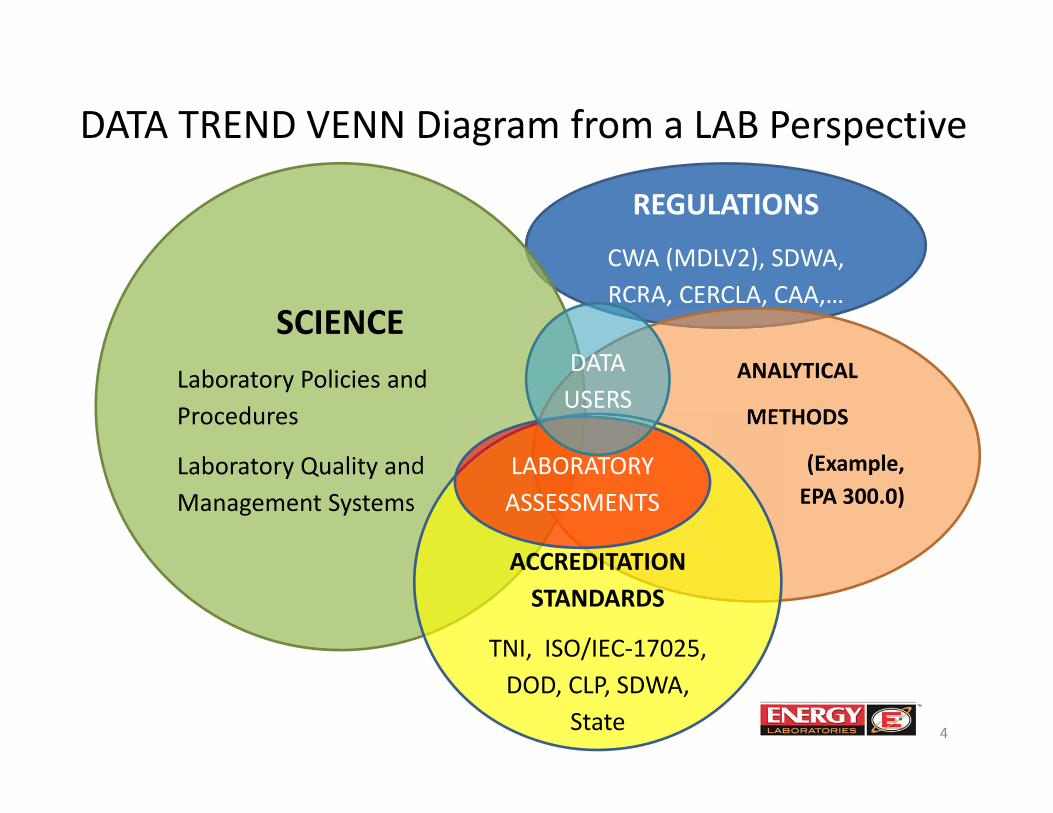
DATA TREND VENN Diagram from a LAB Perspective
4
REGULATIONS
CWA (MDLV2), SDWA, RCRA, CERCLA, CAA,…
SCIENCE Laboratory Policies and Procedures
Laboratory Quality and Management Systems
ANALYTICAL
METHODS
(Example, EPA 300.0)
ACCREDITATION STANDARDS
TNI, ISO/IEC‐17025, DOD, CLP, SDWA,
State
LABORATORY ASSESSMENTS
DATA USERS
PT Studies
–WS Studies Anions: Fluoride +/‐ 10% Accuracy• CFR Part 141 Specified
–WP Studies ‐ Fluoride • PT Study is statistically based ‐ approx. +/‐ 15% Accuracy, and with concentration dependent criteria
– For Direct Analysis Methods ‐ A PT sample is Equivalent to a Third Source Calibration Standard • Can be utilized to evaluate the stability and accuracy of Primary and Secondary standards ‐ Calculate % recovery
5
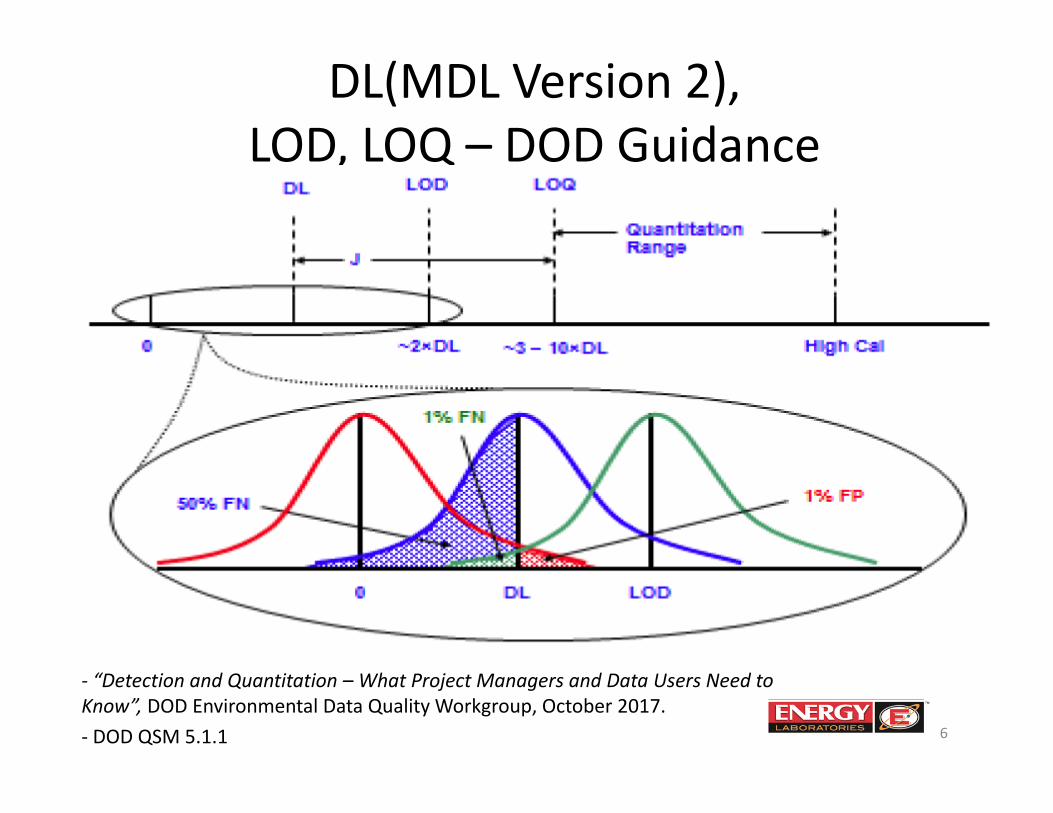
DL(MDL Version 2), LOD, LOQ – DOD Guidance
6
‐ “Detection and Quantitation – What Project Managers and Data Users Need to Know”, DOD Environmental Data Quality Workgroup, October 2017.‐ DOD QSM 5.1.1
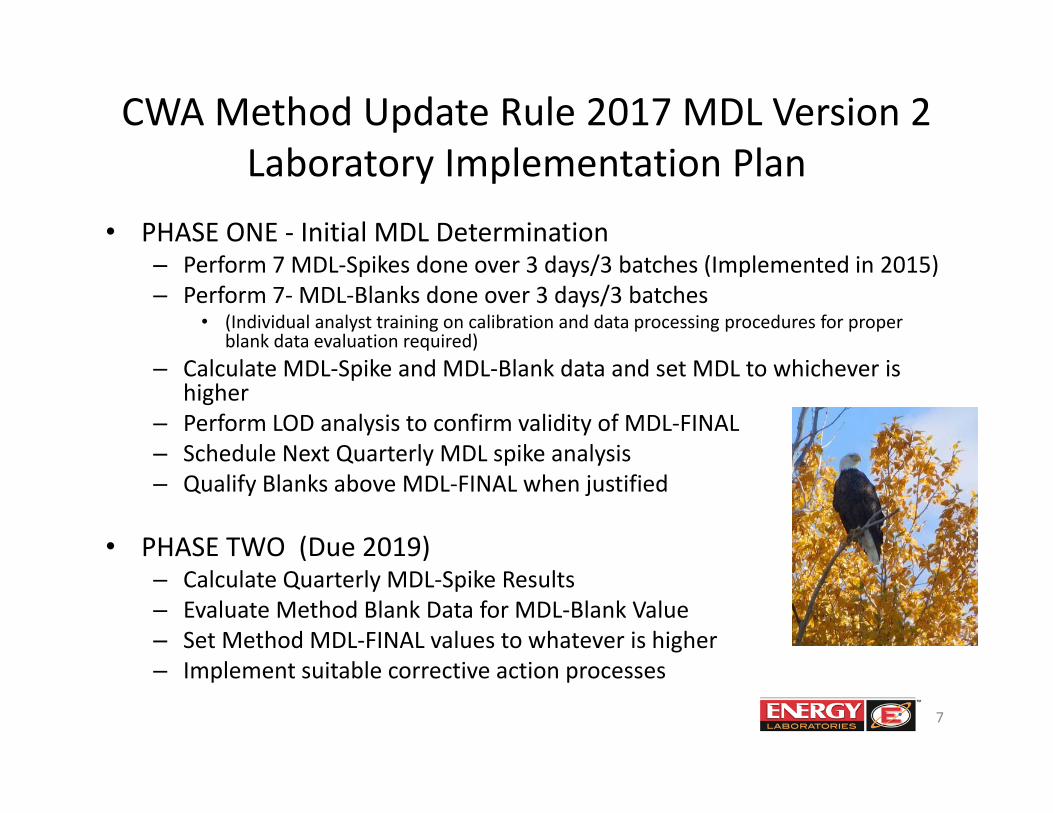
CWA Method Update Rule 2017 MDL Version 2Laboratory Implementation Plan
• PHASE ONE ‐ Initial MDL Determination– Perform 7 MDL‐Spikes done over 3 days/3 batches (Implemented in 2015)– Perform 7‐ MDL‐Blanks done over 3 days/3 batches
• (Individual analyst training on calibration and data processing procedures for proper blank data evaluation required)
– Calculate MDL‐Spike and MDL‐Blank data and set MDL to whichever is higher
– Perform LOD analysis to confirm validity of MDL‐FINAL– Schedule Next Quarterly MDL spike analysis– Qualify Blanks above MDL‐FINAL when justified
• PHASE TWO (Due 2019)– Calculate Quarterly MDL‐Spike Results– Evaluate Method Blank Data for MDL‐Blank Value– Set Method MDL‐FINAL values to whatever is higher– Implement suitable corrective action processes
7
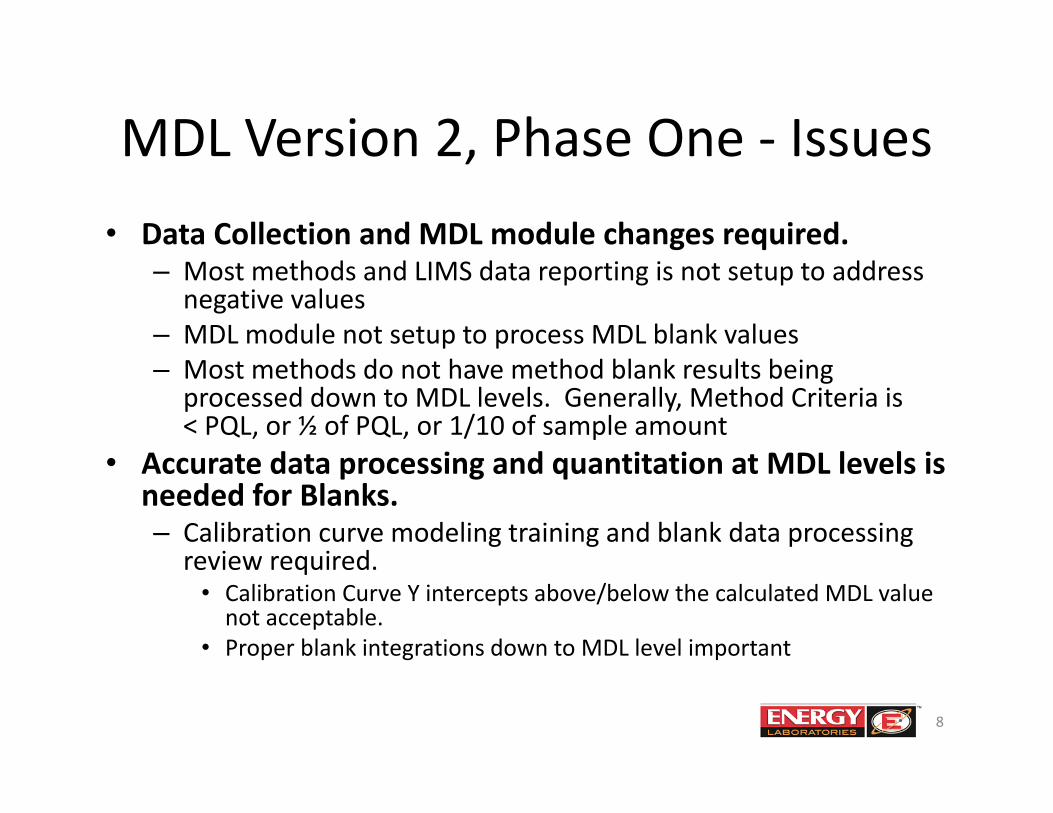
MDL Version 2, Phase One ‐ Issues• Data Collection and MDL module changes required.
– Most methods and LIMS data reporting is not setup to address negative values
– MDL module not setup to process MDL blank values– Most methods do not have method blank results being
processed down to MDL levels. Generally, Method Criteria is < PQL, or ½ of PQL, or 1/10 of sample amount
• Accurate data processing and quantitation at MDL levels is needed for Blanks.– Calibration curve modeling training and blank data processing
review required.• Calibration Curve Y intercepts above/below the calculated MDL value not acceptable.
• Proper blank integrations down to MDL level important
8
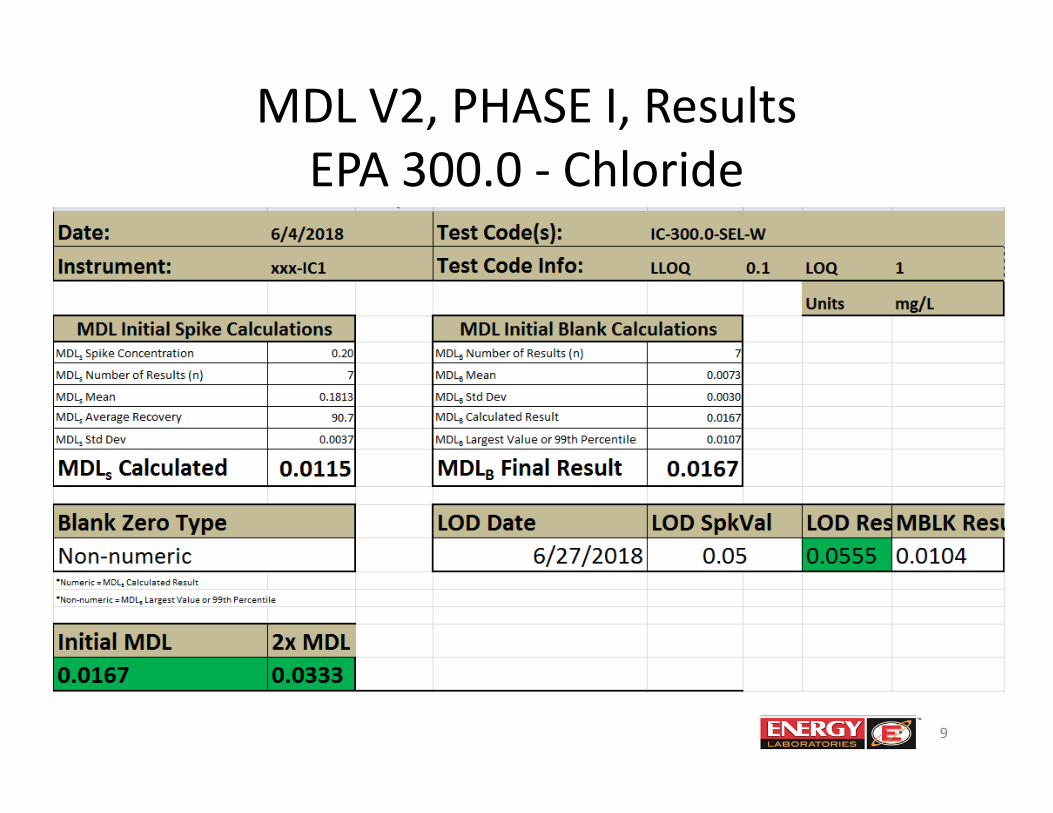
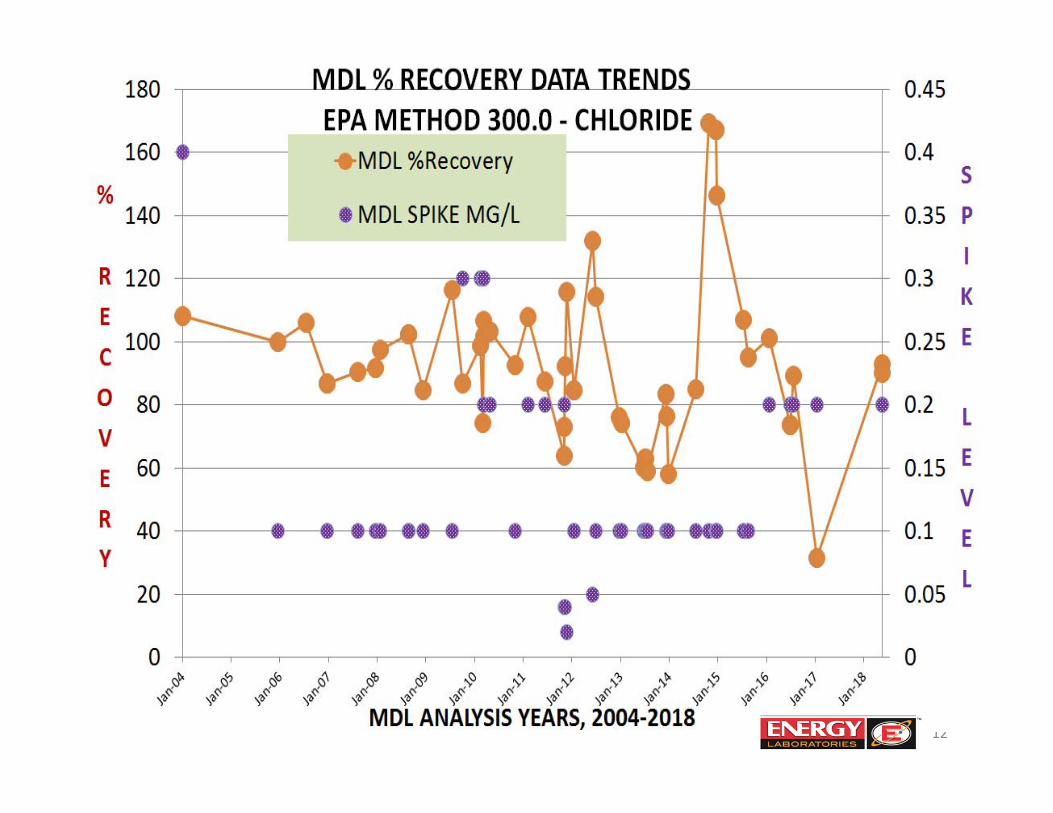
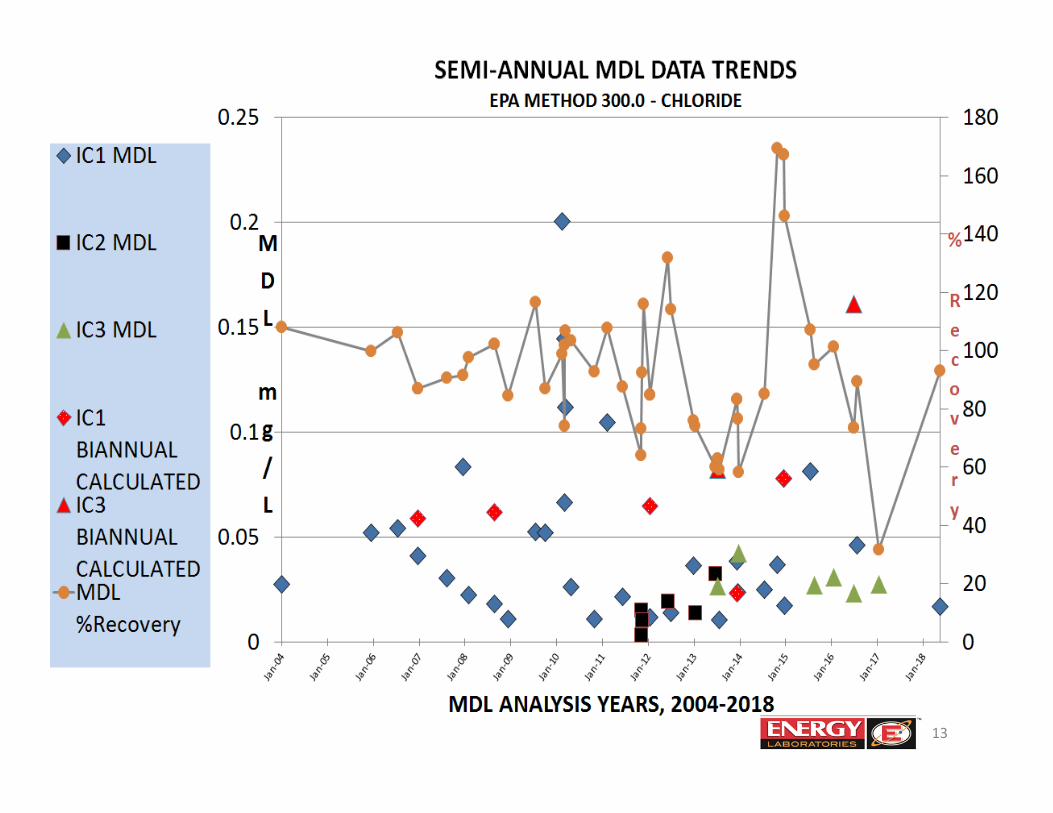
MDL V2, PHASE I, ResultsEPA 300.0 ‐ Chloride
9
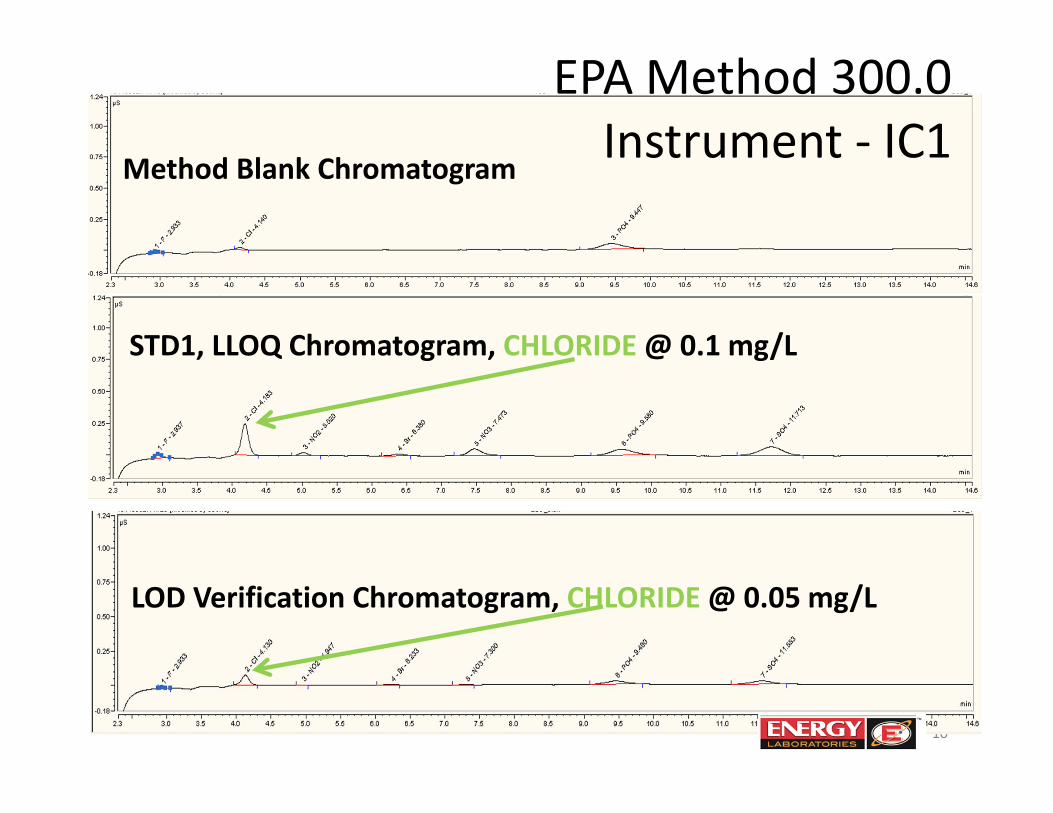
EPA Method 300.0Instrument ‐ IC1
10
STD1, LLOQ Chromatogram, CHLORIDE @ 0.1 mg/L
LOD Verification Chromatogram, CHLORIDE @ 0.05 mg/L
Method Blank Chromatogram
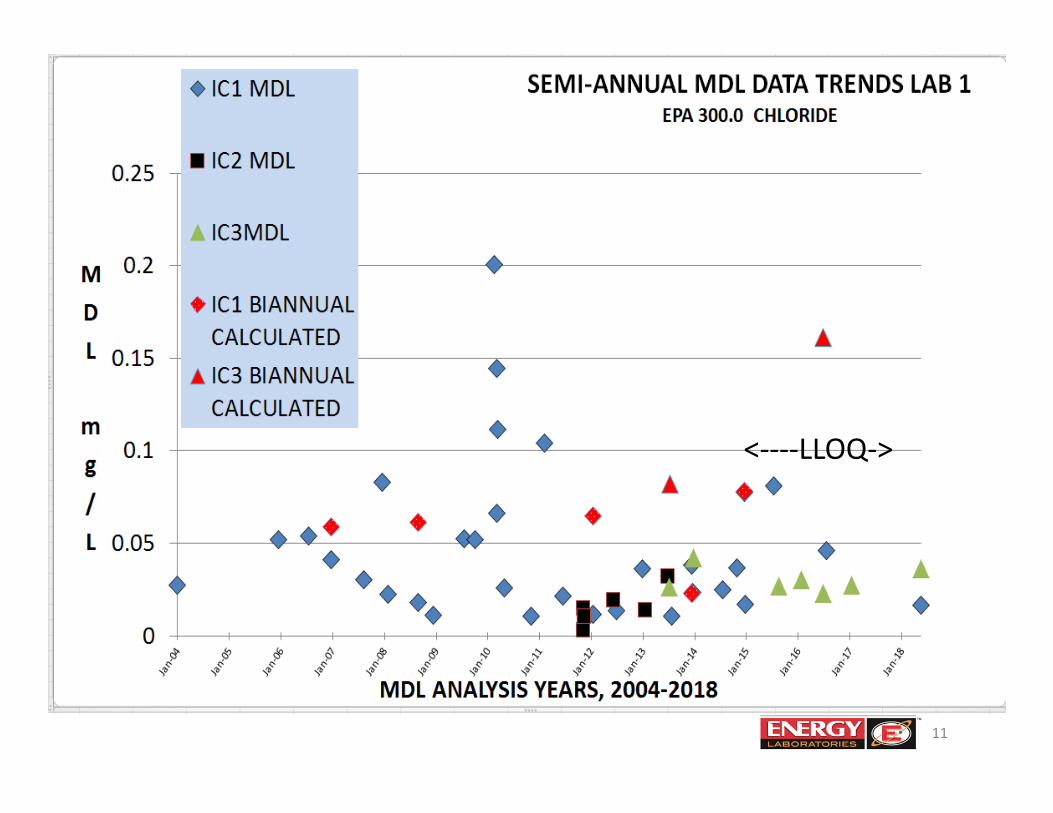
11
<‐‐‐‐LLOQ‐>
12
13
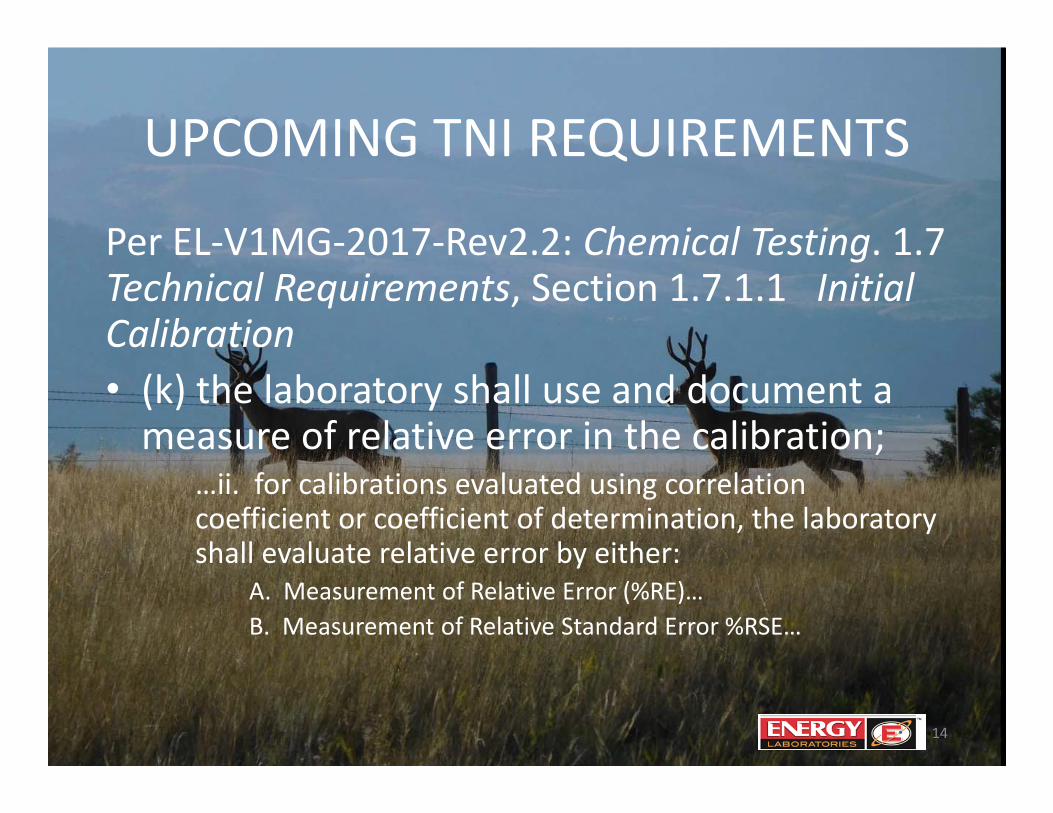
UPCOMING TNI REQUIREMENTS
Per EL‐V1MG‐2017‐Rev2.2: Chemical Testing. 1.7 Technical Requirements, Section 1.7.1.1 Initial Calibration • (k) the laboratory shall use and document a measure of relative error in the calibration;
…ii. for calibrations evaluated using correlation coefficient or coefficient of determination, the laboratory shall evaluate relative error by either:
A. Measurement of Relative Error (%RE)…B. Measurement of Relative Standard Error %RSE…
14
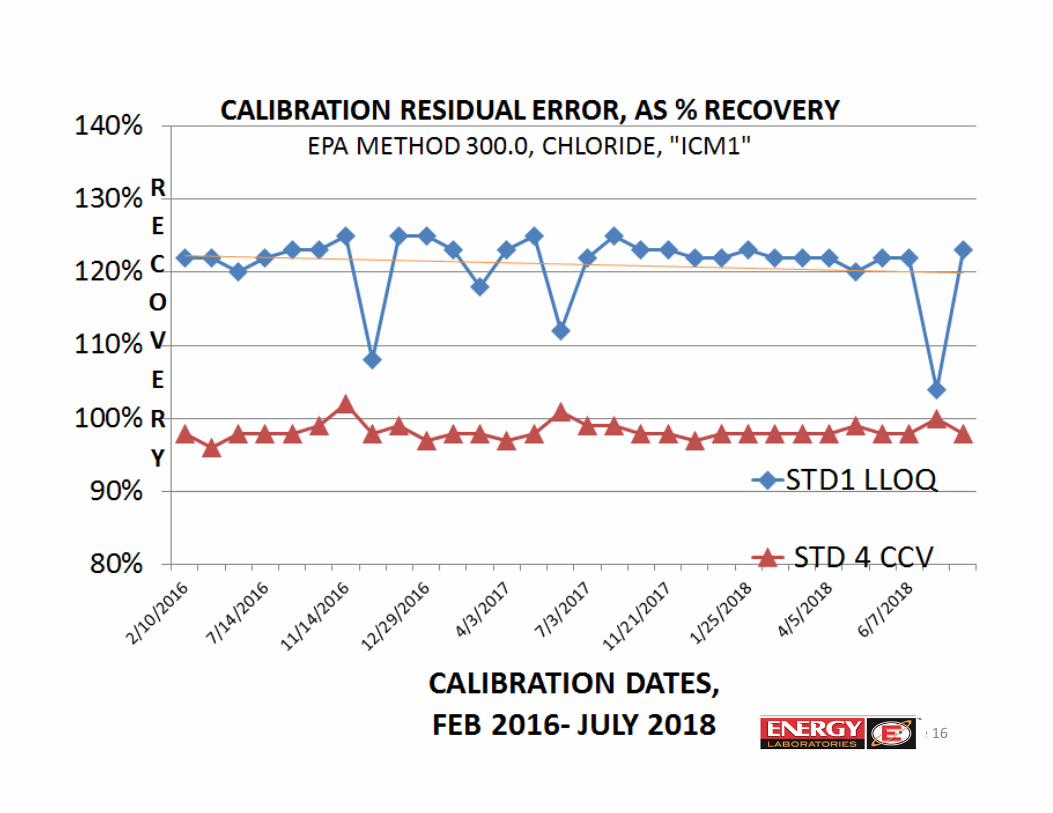
15
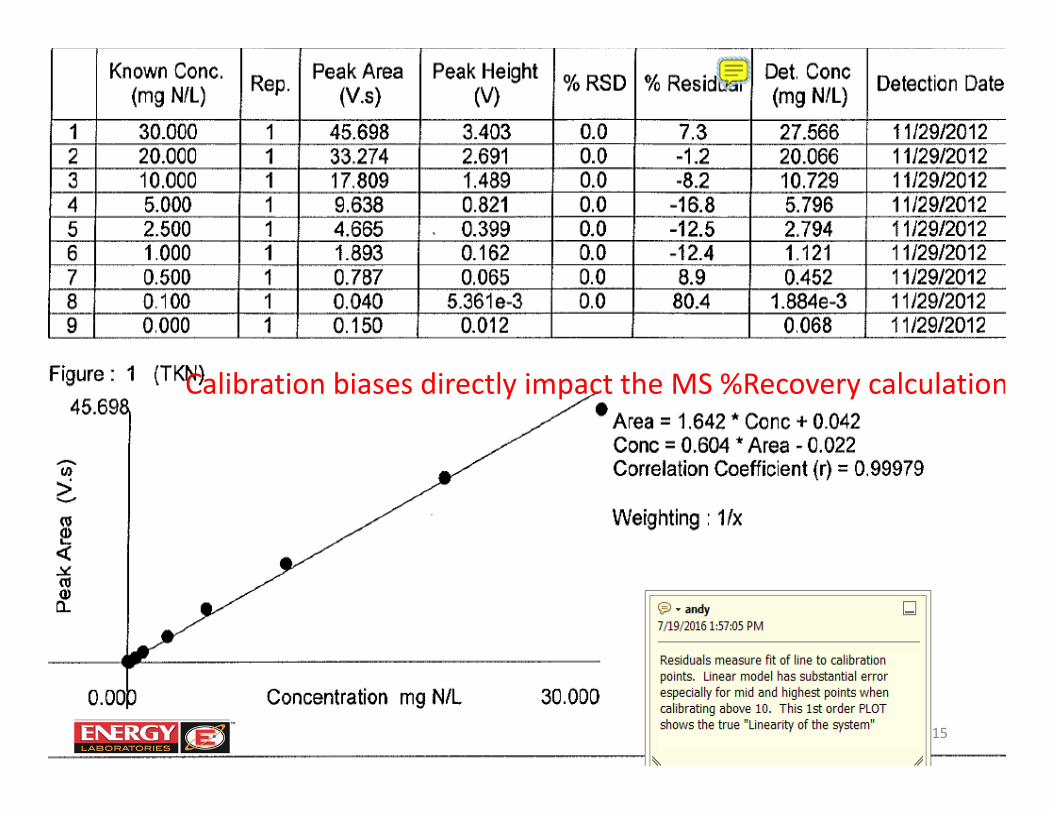
Calibration biases directly impact the MS %Recovery calculation
Page 16
17
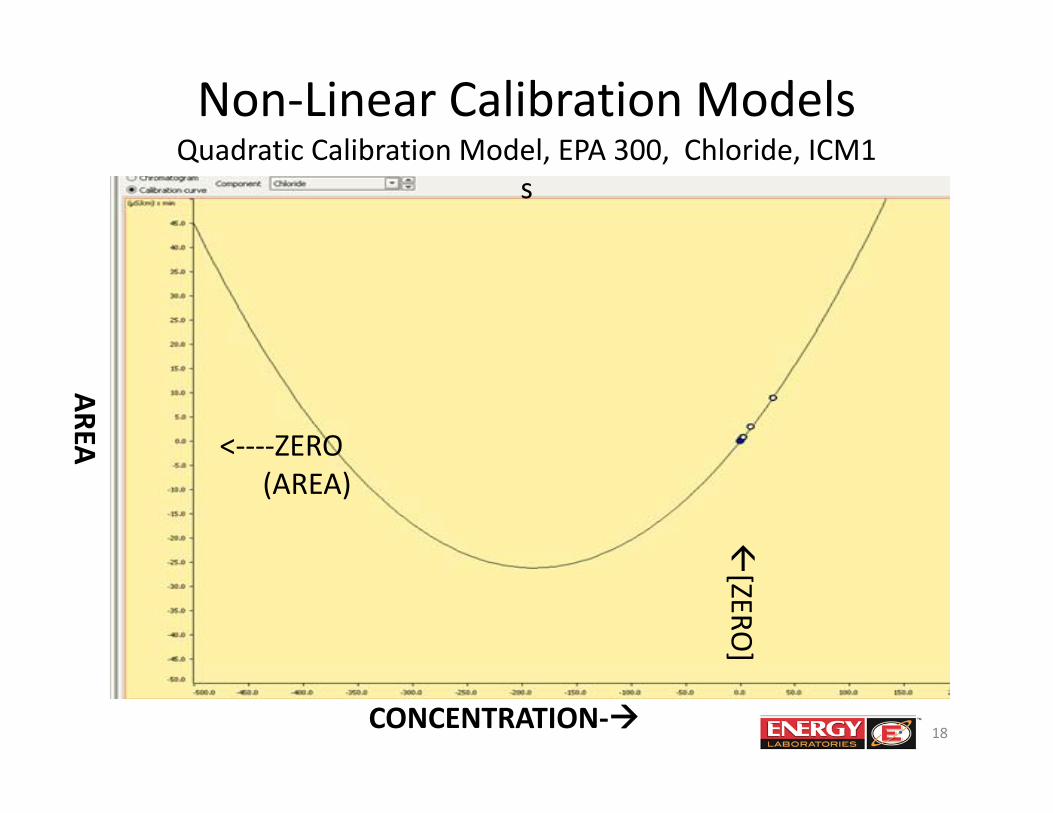
Non‐Linear Calibration ModelsQuadratic Calibration Model, EPA 300, Chloride, ICM1
s
18CONCENTRATION‐
AREA <‐‐‐‐ZERO (AREA)
[ZERO
]
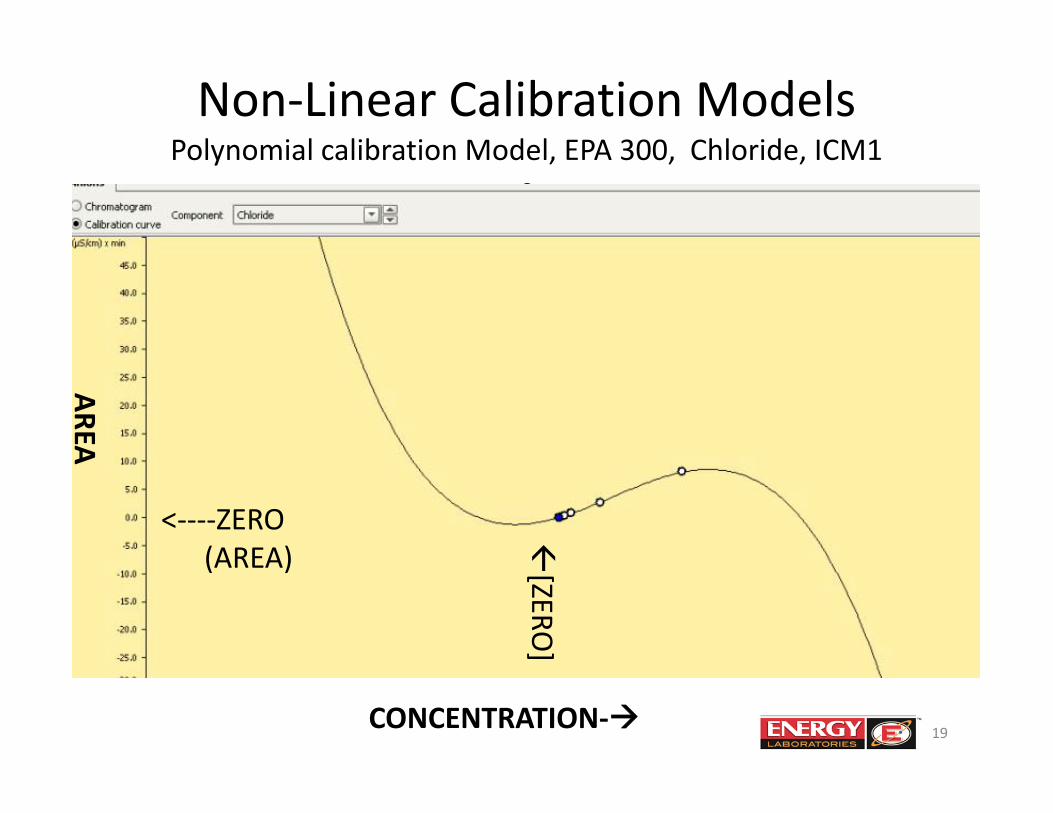
Non‐Linear Calibration ModelsPolynomial calibration Model, EPA 300, Chloride, ICM1
s
19CONCENTRATION‐
AREA
<‐‐‐‐ZERO (AREA)
[ZERO
]
20
21
22
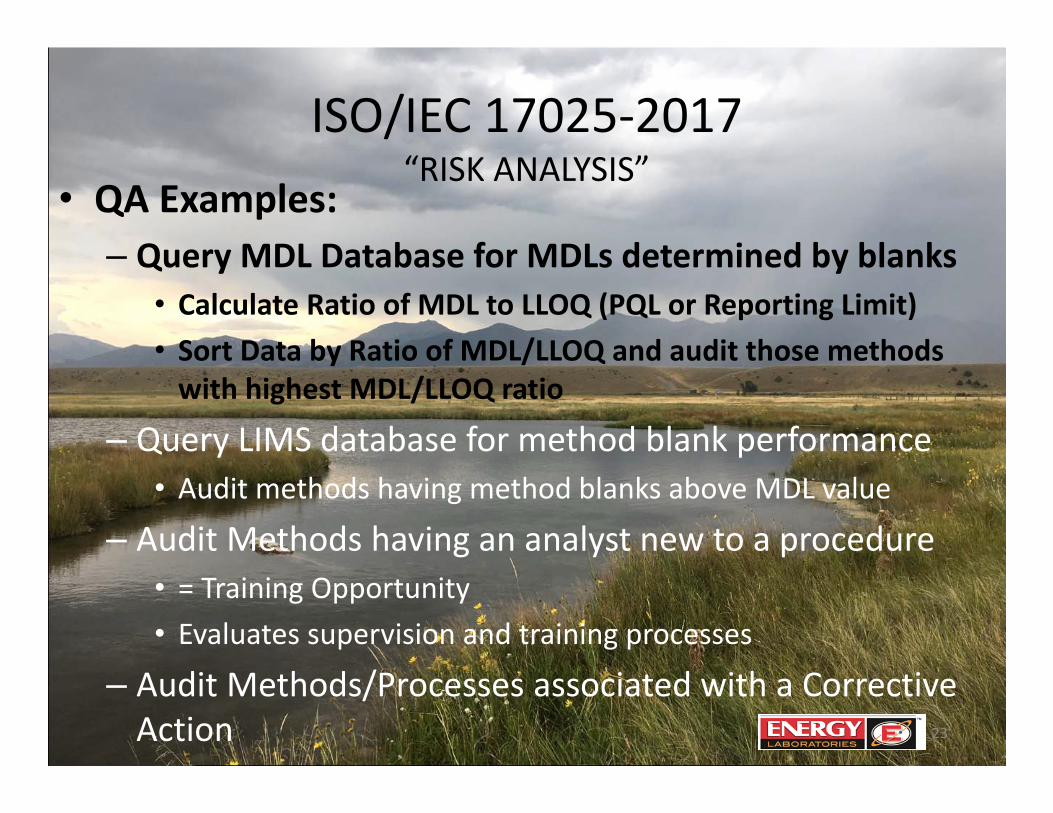
ISO/IEC 17025‐2017“RISK ANALYSIS”
23
• QA Examples:– Query MDL Database for MDLs determined by blanks
• Calculate Ratio of MDL to LLOQ (PQL or Reporting Limit)• Sort Data by Ratio of MDL/LLOQ and audit those methods with highest MDL/LLOQ ratio
– Query LIMS database for method blank performance• Audit methods having method blanks above MDL value
– Audit Methods having an analyst new to a procedure• = Training Opportunity• Evaluates supervision and training processes
– Audit Methods/Processes associated with a Corrective Action
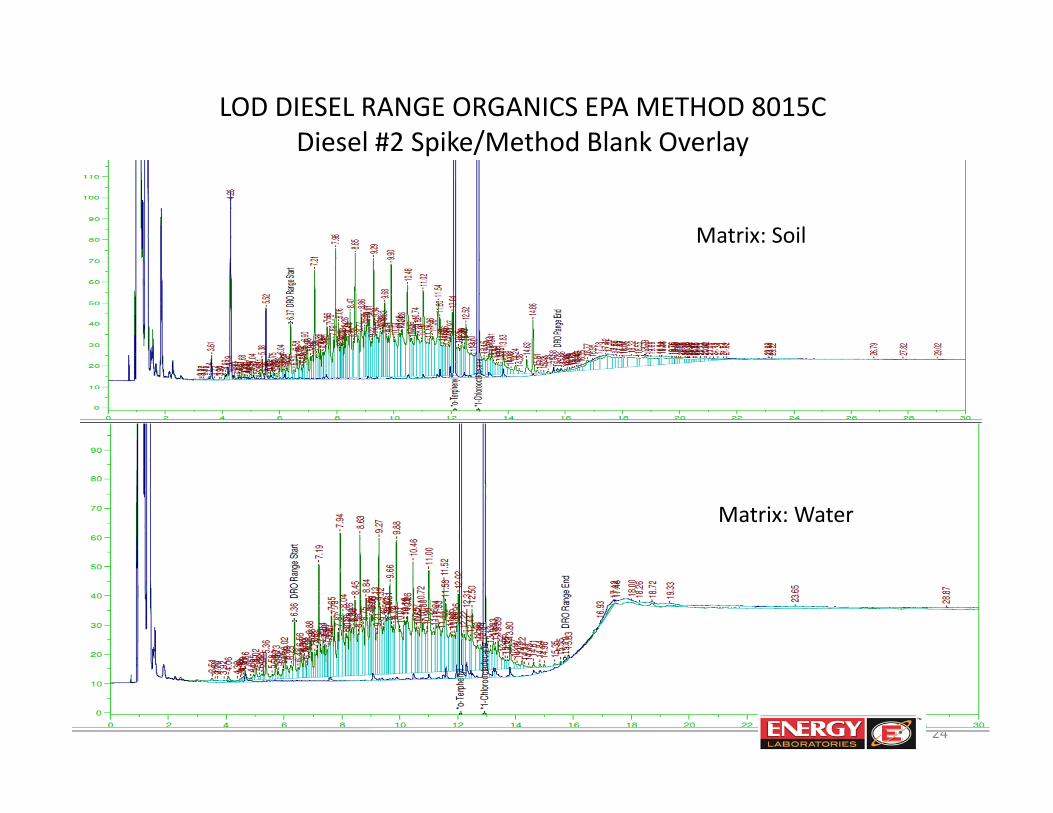
LOD DIESEL RANGE ORGANICS EPA METHOD 8015CDiesel #2 Spike/Method Blank Overlay
24
Matrix: Soil
Matrix: Water
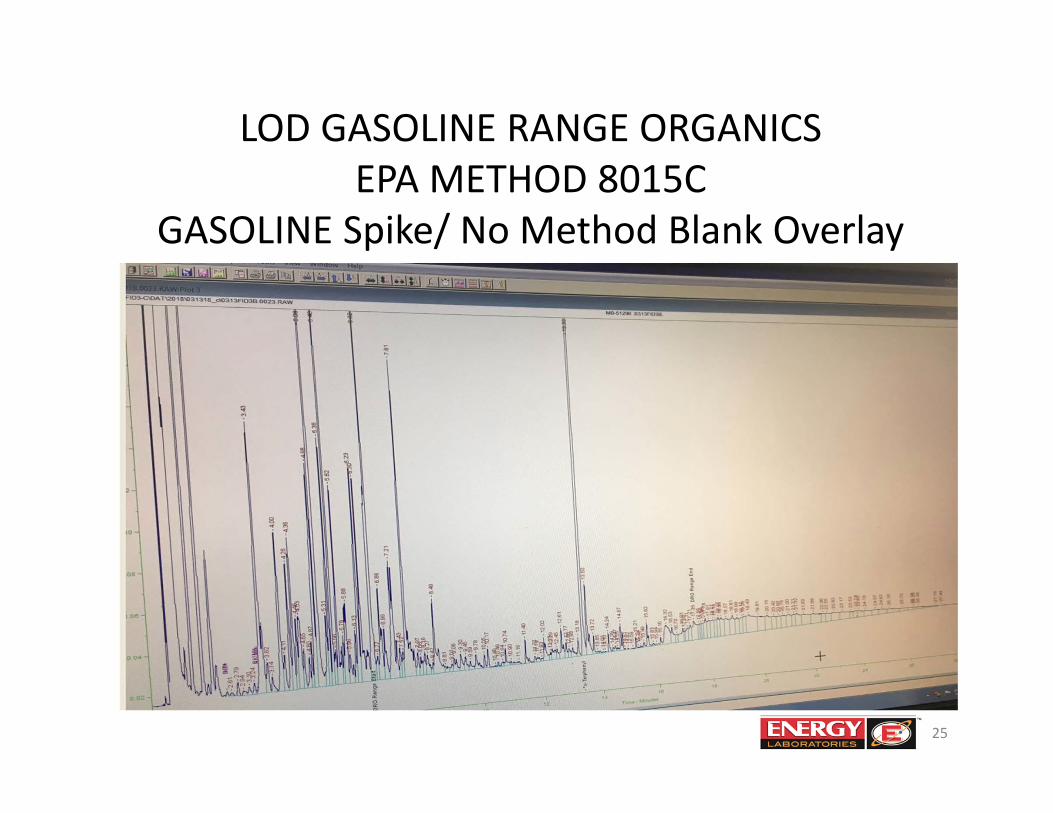
LOD GASOLINE RANGE ORGANICS EPA METHOD 8015C
GASOLINE Spike/ No Method Blank Overlay
25

99% Rule?
26
EPA 200.7/200.2 Method Blank Data Control Chart – Raw Values
MDL ‐ V2, 99% Rule Working Well Here
27
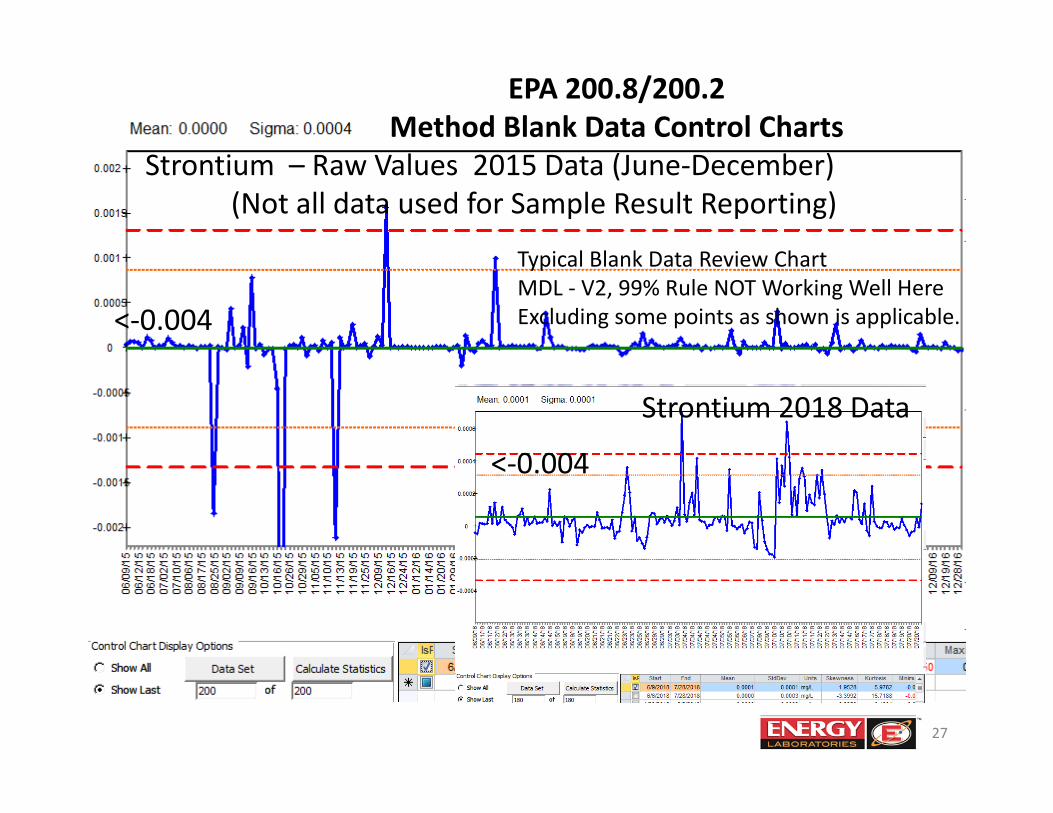
EPA 200.8/200.2 Method Blank Data Control Charts
Strontium – Raw Values 2015 Data (June‐December)(Not all data used for Sample Result Reporting)
Typical Blank Data Review ChartMDL ‐ V2, 99% Rule NOT Working Well HereExcluding some points as shown is applicable.<‐0.004
<‐0.004
Strontium 2018 Data
Other Data Trend Evaluations …from Part 1, 2016 TNI Presentation
• Evaluate Instrument Stability– Plot area or area response factors– Internal Standard Areas
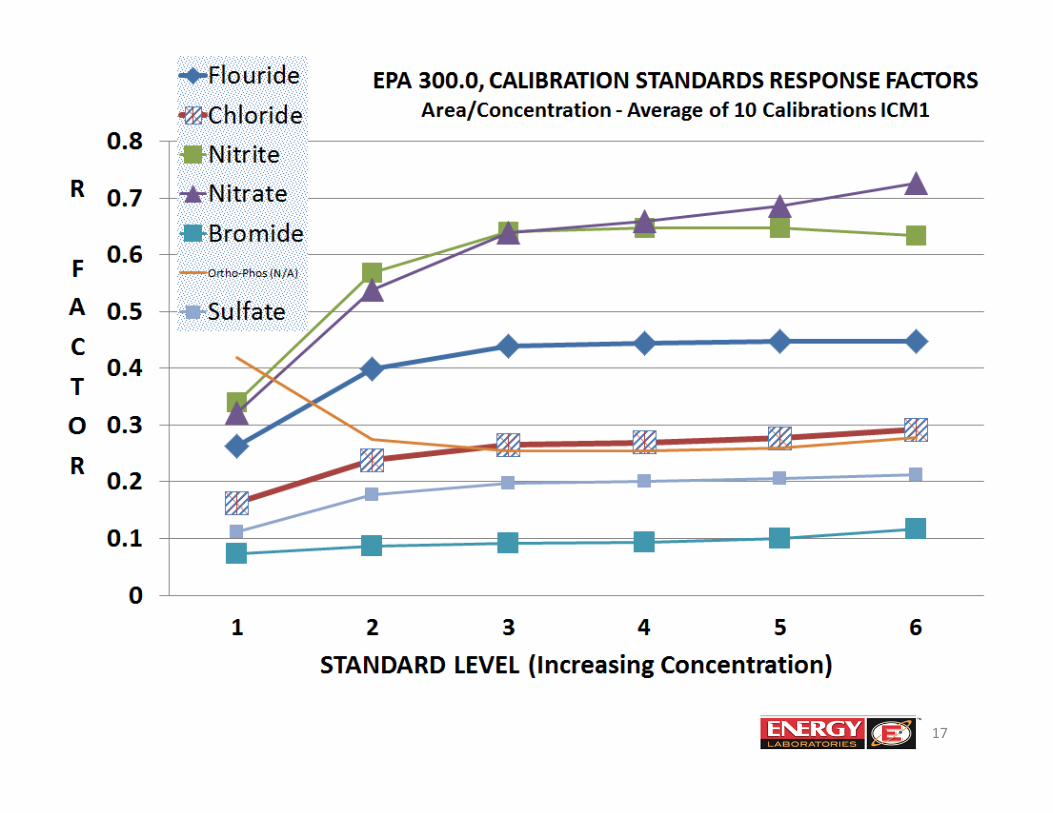
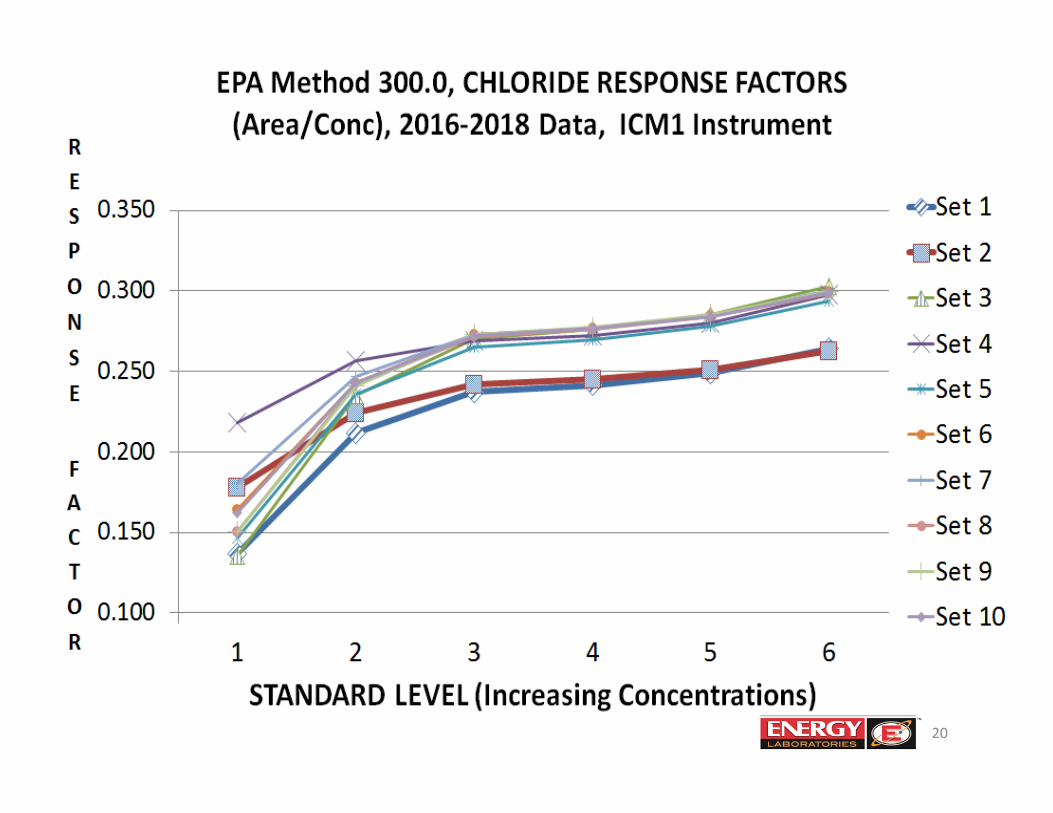
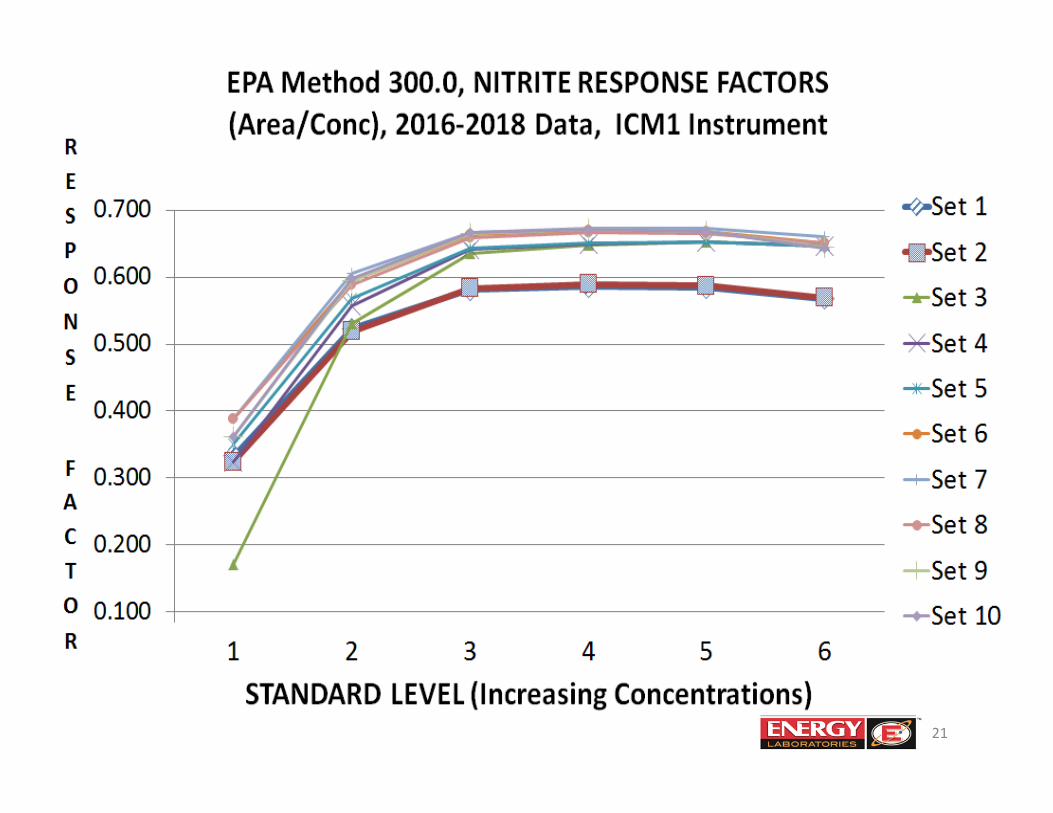
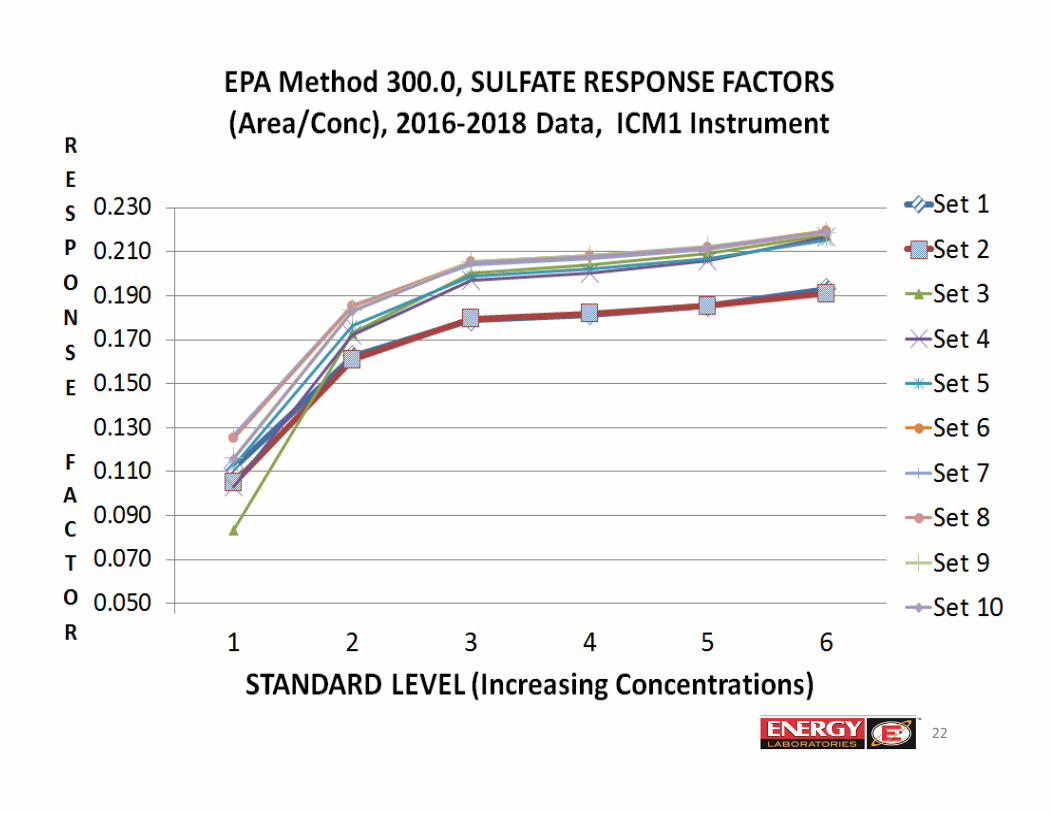
• Evaluate Calibration Curve Accuracy and Models• 2016 NELAC Standard Requirement• Plot Response Factors to determine applicable calibration models
• Evaluate each Method QC Type– Blanks (MUR 2015 Proposed), CCVs, low‐level CCVs, MS/MSDs,
Dups, Tune, MDLs, ICSA, etc.– Correlate CCVs to LCSs
• Related to Calibration Frequency• PT Study results against assigned nominals. PT precision
data.• ...Trends per Method Specifications
28
SUMMARYIn Support of:
• TNI NELAP Program, Changes in 2016 Pending Standard are complimented.– DOD –
• MDL/LOD/LOQ Guidance• TNI Interpretations
• CWA MURs – 12 Essential Quality Control Steps– MUR MDL V2 – 3‐Day/3Batches, Implementation of Blank data review in establishing method MDLs
• Environmental Regulations • PT Studies• External Assessor Guidance
29
AREAS TO BE ADDRESSED• CWA MUR 2017
– 600 Series Methods – Update methods to address reviewer comments• Allow higher order polynomial calibration models• Revise language regarding CCV monitoring with ICV standard
– MDL V2• MDL‐Blanks
– Numeric negative values –Address Single versus Two tail Student T values
• Quarterly MDL‐Spike Calculation– Provide Corrective Action Steps Guidance
» Recommend performing initial MDL‐Spikes and MDL‐Blanks for MDL‐Quarterly Calculated Results of Concern based on detailed review of method
• Specify MDL‐FINAL Confirmation by LOD Analysis
30
31
Thank You for your time!
OTHER AREAS TO BE ADDRESSEDEPA 300 and 400 Series Methods – Update Methods, remove LDR requirement Language.– Allow LCS Statistical Control Limits to be used for MS analysis
TNI Standards– Implement Risk Based QA Process requirements
• Provide training– Require MDL/LOD analysis for all methods (if spike is applicable)
– Create General Standardized Application Form using TNI Method and Analyte Codes and suitable to generate Certificates for State Certifications • Useful for State reciprocity applications. Standardizes compound naming conventions and method referencing.
32