Embed Size (px)
Citation preview

Asia-Pacific Research and Training Network on Trade Working Paper Series, No. 29, January 2007
Utilization of Preferential Trade Arrangements:
Sri Lanka’s Experience with the EU and US GSP Schemes
By
Janaka Wijayasiri *
* Janaka Wijayasiri is Research Economist, Institute of Policy Studies (IPS), Sri Lanka. The views presented in this paper are those of the author and do not necessarily reflect the views of IPS, ARTNeT members, partners and the United Nations. This study was conducted as part of the Asia-Pacific Research and Training Network on Trade (ARTNeT) initiative, aimed at building regional trade policy and facilitation research capacity in developing countries. This work was carried out with the aid of a grant from the International Development Research Centre, Ottawa, Canada. The technical support of the United Nations Economic and Social Commission for Asia and the Pacific is gratefully acknowledged. Any remaining errors are the responsibility of the author. The author may be contacted at [email protected]
The Asia-Pacific Research and Training Network on Trade (ARTNeT) aims at building regional trade policy and facilitation research capacity in developing countries. The ARTNeT Working Paper Series disseminates the findings of work in progress to encourage the exchange of ideas about trade issues. An objective of the series is to get the findings out quickly, even if the presentations are less than fully polished. ARTNeT working papers are available online at: www.artnetontrade.org. All material in the working papers may be freely quoted or reprinted, but acknowledgment is requested, together with a copy of the publication containing the quotation or reprint. The use of the working papers for any commercial purpose, including resale, is prohibited.

Table of Contents
Executive Summary .............................................................................................. ii
1. Introduction ........................................................................................................ 1
2. Literature Survey............................................................................................... 3
3. GSP Schemes of the US and the EU........................................................... 7
3.1 EU-GSP Scheme ....................................................................................... 7
3.2 US-GSP Scheme ..................................................................................... 11
4. Imports to the US and EU from Sri Lanka under the GSP schemes...... 13
4.1 Imports to the EU under GSP Scheme......................................................... 20
4.2 Imports to the US under GSP Scheme ......................................................... 25
4.3 Utilization Rates of the EU and US GSP Schemes: A Comparison ........... 29
5. What are the Main Reasons for the Low Utilization of Trade
Preferences under the EU and US GSP Schemes? ..................................... 30
5.1 Rules of Origin ............................................................................................. 31
5.2 Product Coverage ........................................................................................ 37
5.3 Awareness or Knowledge Amongst Exporters ............................................ 38
5.4 Administration and Issuance of Certificates ................................................ 39
5.5 Other Problems............................................................................................. 40
6. Conclusion ....................................................................................................... 41
References ........................................................................................................... 43
Appendices........................................................................................................... 46
Appendix 1: List of Interviewees........................................................................... 46
Appendix 2: Questionnaire .................................................................................... 48

List of Charts Chart 1: Market Access Conditions in the EU and US, 2004 17 Chart 2: Total and Preferential Imports from Sri Lanka to the EU, 2000-04 20 Chart 3: Coverage, Utilization and Utility Rates of EU-GSP Scheme 21 Chart 4: Utilization rate (%) under the EU GSP Scheme, 2004 22 Chart 5: US Imports from Sri Lanka, 2000-04 25 Chart 6: Coverage, Utilization and Utility Rates of US-GSP Scheme 26 Chart 7: Utilization Rate of EU and US GSP Scheme, by Sector, 2004 29 Chart 8: Value of Fabric Imports from SAARC, ASEAN and EU (%) 33 List of Tables Table 1: Imports to the EU from Sri Lanka by HS Section-wise, 2000-04 15 Table 2: Imports to the US from Sri Lanka by HS Section-wise, 2000-04 16 Table 3: Distribution of Products Offered Concessions by the US and EU under the GSP Scheme 18 Table 4: EU GSP Imports and Utilization, 2000-04 21 Table 5: EU: GSP Imports and Utilization for Sri Lanka (by HS section) 2004 23 Table 6: Top Ten Products to the EU, Chapter-wise (at HS 2 digit level), 2004 24 Table 7: US GSP Imports and Utilization, 2000-04 26 Table 8: US: GSP Imports and Utilization for Sri Lanka (by HS section, 2004) 27 Table 9: Top Ten products to the US, Chapter-wise (at HS 2 digit level), 2004 28 Table 10: Summary of the Main Reasons Identified for Low Utilization of EU and US GSP Schemes, Top Ten Export Sector 30 Table 11: EU Rules of Origin for HS61 and HS62 31 Table 12: Fabric Imports by Sri Lanka, by Source, 2005 32 List of Boxes Box 1: Measuring the Utilization of Preferences 5 Box 2: Proposed Changes in the EU’s Preferential Rules of Origin 11 Box 3: Summary of Key Findings of the EU Green Paper on the ‘Future of Rules of Origin in Preferential Trade Arrangements 35
i

Executive Summary
The GSP scheme was initiated by UNCTAD in 1968 with the objective of
enabling developing country exports to enter developed country markets under preferential rates. Sri Lanka has been a beneficiary under the GSP scheme over the last three decades. However, meeting the scheme’s objective of export expansion seems to have fallen short and Sri Lanka has not been able to export effectively under the EU and US GSP schemes, which are the most important non-reciprocal preference arrangements providing access to Sri Lanka’s main export markets. The paper using three indicators (coverage, utilization and utility rates) assesses the usefulness of the EU and US GSP schemes for Sri Lanka and discusses Sri Lanka’s performance under both schemes while suggesting possible measures that can be taken to improve the schemes.
In the case of the EU GSP scheme, a substantial proportion of exports are covered: as much as 98 per cent of exports from Sri Lanka to the EU are eligible for preferential treatment. Though the product coverage is high under the EU scheme, Sri Lanka records low utilization and utility rates of about 40 per cent, highlighting that the scheme has been of limited use. The study finds that some sectors such as textile and textile articles, which is the main export sector from Sri Lanka to the EU, are unable to fulfill the Rules of Origin (RoO) requirements, highlighting the need to simplify the existing RoO criteria in the EU to improve the usage of the scheme. The facility allowing for the use of inputs from South Asia to meet the RoO requirements i.e., the regional cumulation rule, has proved useful only for a limited number of sectors and the extension of the idea beyond South Asia under the proposed super-regional cumulation together with simplification of the RoO criteria could substantially improve Sri Lanka’s utilization of the EU scheme.
While the coverage rate is low in the case of the US GSP scheme (about 8 per cent), Sri Lanka records high utilization rate of 89 per cent but a low utility rate of 7 per cent. The US scheme has been of limited use to Sri Lanka due the exclusion of textile and textile articles from preferential treatment. One way to increase the real benefits of the US scheme is to improve the product coverage of the scheme.
Interviews of exporters and other stakeholders reveal several reasons for the
limited use of trade preferences under the EU and US GSP Schemes. These include low product coverage (in the case of the US scheme), strict rules of origin criteria (in the case of EU scheme), and weak supply capacity of the country. Lack of awareness of the schemes and understanding the conditions attached to the scheme on the part of exporters do not seem to have been a significant factor in explaining limited usage. Neither have exporters encountered any significant problems in obtaining certificates of origin.
ii

1. Introduction Over the years Sri Lanka has entered into a number of bilateral and regional trade
agreements and has negotiated and exchanged tariff concessions to obtain better market access for its produce abroad whilst participating in multilateral negotiations. Sri Lanka is a party to the Asia Pacific Trade Agreement (1975),1 Global System of Trade Preferences (1988), South Asia Preferential Trade Agreement (1995), Indo-Lanka Free Trade Agreement (2001), and Pakistan-Sri Lanka Free Trade Agreement (2005). Following the success of the Indo-Lanka Free Trade Agreement (ILFTA), Sri Lanka and India are in the process of converting the FTA into a comprehensive economic partnership agreement (CEPA) covering trade in services and investment, whilst South Asia Free Trade Agreement (SAFTA) in 2006 replaced SAPTA, which has been in place since 1995 and BIMSTEC2 is slated to form a free trade area. Sri Lanka has also engaged in the recent past of negotiating an FTA with the US, Singapore and Egypt to name a few, each at different stages of consideration and negotiation. The India Ocean Rim Association for Regional Cooperation (IOR-ARC), which Sri Lanka is a participating member, is also studying the feasibility of a preferential trade agreement amongst the member countries. While the above agreements have been reciprocal in nature, Sri Lanka has also been a beneficiary of non-reciprocal trade arrangements such as the Generalized System of Preferences (GSP), which has been providing preferences to exports from developing countries for over three decades.3
Whilst the purpose of such agreements was to provide greater access abroad for Sri Lankan exports, most of them seem to have fallen short of their expectations. International experience from trade agreements show that granting preferential market access does not necessarily translate into full utilization of the agreements nor does it result in increased exports for all countries. Several reasons could be attributed to the low levels of the utilization of preferences in the agreements. These include low product coverage, low preference margins, weak supply capacities, strict rules of origin criteria, non-tariff barriers, non related trade conditions linked to labour standards, environment, and governance, etc. Rules of Origin have been largely demonstrated to be one of the main obstacles to a better utilization rate of the available trade preferences in most agreements. Other reasons are weak institutional capacity to effectively administer these agreements and lack of knowledge about preferences on the part of exporters. To take advantage of preferential agreements, recipients also need to understand the complicated tariff structures, and conditions attached. Moreover, trade preferences have eroded over time with unilateral, regional and multilateral trade liberalization.
The purpose of this study is twofold. First, the study would empirically assess Sri Lanka’s experience in utilizing trade preferences. As mentioned above Sri Lanka is a beneficiary to a number of trade agreements but its use of these agreements has been less 1 Prior to November 2005 the agreement was known as Bangkok Agreement. 2 Now called the Bay of Bengal Initiative for Multi-Sectoral Technical and Economic Cooperation. 3 While being ‘non-reciprocal’ in terms of granting of tariff preferences, these arrangements are tied up with non-trade
related issues such as labour standards, environment, and governance and thus not strictly speaking non-reciprocal in nature.
1

than satisfactory – that is, preferences have remained largely underutilized by exporters. Whilst there have been a number of studies and work carried on these individual arrangements, no single study has empirically estimated the utilization rates of these agreements and explained for the variation of rates across sectors and between the agreements. A possible reason for this might have been the lack of readily available data for calculating the utilization rate.4 The present study would be confined to examining the performance of two non-reciprocal trade agreements which Sri Lanka is currently a beneficiary – that is, the EU and US Generalized System of Preferences (GSP).
There are several GSP schemes in the world but those of the US and EU are the most important ones for developing countries including Sri Lanka. The EU GSP is the most widely used of all developed country GSP schemes. The volume of imports to the EU from developing countries under the GSP is greater than the combined volume of imports under the US, Canadian and Japanese GSP systems. The US GSP scheme is the world’s second most widely used. Moreover, the EU and US are Sri Lanka’s main export markets and better access to them under the GSP scheme is considered important. Sri Lanka has been a beneficiary of both the EU and US schemes since their inception in the late 1970s but they have not been properly examined, especially the US GSP scheme with respect to Sri Lanka due to lack of readily available data. The present study overcomes this problem by drawing on secondary data from the UNCTAD database, which keeps a record of utilization rates of beneficiary countries under various GSP schemes. The quantitative analysis is supplemented with qualitative analysis of the utilization rates across sectors and across schemes (EU and US) based on discussions with stakeholders (government officials of various departments/institutions, chambers/associations and top exporters) to obtain their points of view on the performance of Sri Lanka under both schemes.
Second, the study will suggest possible measures that can be taken to improve the schemes given that they are up for revision in the near future (in the case of the US as early as December 2006 and in the case of the EU towards the end of 2008). Thus, a closer examination of these two agreements and their effectiveness in providing market access to Sri Lankan exports is both pertinent and timely.
The remainder of the paper is organized as follows. First, the paper provides a literature survey of studies on non-reciprocal trade agreements and their respective results. Second, the paper discusses the US and the EU GSP schemes and highlights the main features of both schemes. Third, the paper assesses the performance of Sri Lanka under both schemes using a number of variables. Fourth, a brief comparison of the utilization rates of Sri Lanka under the EU and US GSP schemes is also presented. Fifth, the paper discusses some of the problems which have constrained the use of the schemes and in conclusion, suggests possible measures to address them.
4 The Department of Commerce of Sri Lanka, which is the competent authority to conduct international trade
relations, trade negotiations and act as trade policy advisory and implementation arm of the Ministry of Trade, Commerce & Consumer Affairs, has just begun to electronically document the utilization of preferential agreements by Sri Lanka by recording the number of certificates of origin issued. The database was unavailable at the time of writing of this paper.
2

2. Literature Survey
The purpose of this section is to review available evidence regarding utilization of preferences of non-reciprocal trade agreements. The evaluation of preference utilization across markets is difficult not only because there is a lack of widely available data on preference utilization by scheme but also due to important difference between various schemes in terms of rules of origin, country eligibility and depth of preferences given to eligible countries. In addition to data issues, there are two methods available to estimate preference utilization (see Box 1) and comparing results across studies should be treated with caution. Nevertheless, it is possible to highlight four characteristics regarding the utilization of non-reciprocal schemes from the available literature (WTO, 2004): a) Utilization of non-reciprocal preferences is less than 100 per cent
A number of studies suggest that the utilization rates of non-reciprocal agreements are consistently below 100 per cent and usually low. According UNCTAD (2003), the aggregates utilization of GSP schemes of the QUAD countries (Canada, EU, Japan and US) by LDCs varied from a low of 26 per cent in the EU in 1998 to a high of 96 per cent in the US in 2001. Low utilization rates appear to be a cross cutting problem affecting all schemes and this issue is particularly important for markets such as the EU and to a lesser extent Japan. Although both Canada and US record relatively higher utilization rates, the figures may be misleading as a large amount of LDC exports are excluded by these schemes – important export items such as textiles and clothing.
Utilization rates of other non-reciprocal preferences schemes such as Cotonou Agreement, and AGOA also confirm that utilization rates are less than 100 per cent (UNCTAD, 2003). However, one needs to bear in mind that measuring utilization rates of preferential schemes in isolation to one another may be misleading because exporting countries may have access to the same markets through a number of preferential schemes. This is especially true in the case of Sub-Saharan African countries, which have access to the EU either through the Everything But Arms (EBA) initiative or the Cotonou agreement, which predates the EBA. Candau and Jean (2005) find that when all EU preference schemes are examined together, rather than in isolation to one another, utilization rates are considerably better (but still low). b) Utilization of preferences varies by product within a scheme
Many reasons exist as to why utilization rates vary across products for a given scheme but the most studies identify rules of origin as one of the main reasons for the variation in the utilization rates under a scheme. For GSP schemes offered by the QAUD, UNCTAD (2003) estimates show that the utilization rate is above 90 per cent in certain products but as low as 56 per cent in others for some LDC beneficiaries across HS product sections (1-21). c) Utilization of preferences varies across beneficiaries within a scheme and across schemes
3

Breton and Ikezuki (2005) find for example, that Madagascar and Ivory Coast utilized 86 and 58 per cent, respectively of preferences extended under the US GSP scheme while exporters from Mali received preferential treatment for 66.8, 87.5 and 49.8 per cent of exports in the EU, US and Japanese markets respectively. d) Utilization of preferences varies within a market for given LDCs
LDCs face different market access conditions in a given market under different preference schemes. Two such schemes are EU’s Everything But Arms (EBA) initiative and the US’s African Growth and Opportunity Act (AGOA). AGOA is a regionally based non-reciprocal preferential agreement and its beneficiaries are located in Sub-Saharan Africa while non-African LCDs are not eligible to benefit from improved market access offered by the US under the scheme – though they are eligible for LDC specific preferences under the US GSP scheme.
Box 1 Measuring the Utilization of Preferences
There are two methods for measuring the utilization rates, each with different data requirements. The most commonly used method in calculating the utilization rate, which is used in this study, is based on customs data while the other one is based on the total customs revenue collected. The method for calculating the first indicator is straightforward and is given by the value of imports receiving preferential treatment divided by the total value of imports eligible for preferences. Despite the simplicity of the method, it is not easy to estimate it in practice. Official data on the duty paid on a specific import originating from a specific exporter is not readily available. Even if available, it is based on information of requests submitted by exporters for preferential duties. Whether or not a duty is applied depends on the evaluation by customs officials and as such information based on request data may be biased. This method also assumes that the exporter is aware about the preference scheme and applicable preferential duties, which may not be the case. It is quite possible that customs officials might apply the preferential duty on an import even though when it is not requested by the exporter. Despite the difficulties associated with this method, such request data is available for major preference granting countries. This study relies on request data obtained from the UNCTAD. The second method based on revenue collection is much more reliable and is given by total customs revenue collected from a preference beneficiary country divided by total imports from that country. This estimate is in effect the average ad valorem duty paid on imports and can be compared with the average MFN tariff and average preferential tariff to determine the utilization rate.
Source: WTO 2004.
4

In the case of EU, the EBA scheme is open to all LDCs while LDCs from the ACP region are also eligible to export under Cotonou Arrangement. While ACP LDCs have the option of exporting under Cotonou Agreement or EBA, non-ACP LDC countries can export only under the EBA. While both schemes provide duty free and quota free access to the EU market, the rules governing their access is different and as a result utilization rates vary across LDC beneficiaries though all of them face the same preferential duty rate. For example, the utilization rate for textiles and clothing in the EU for ACP LDCs was about 95 per cent while the rate was about 50 per cent for non-ACP LDCs (WTO, 2004).
Most studies identify rules of origin (RoO) as one of the main reasons for the low utilization rates, variation of rates across sectors, beneficiary countries and preferential schemes. Rules of origin are used in preferential trade agreements in order to ensure that there is minimum level of domestic value addition in the product exported and to promote backward linkages. They also help ensure that the products exported under preferences schemes are not merely transshipped from non-eligible countries through eligible countries with little or no value addition. In other words, RoO play an important role in ensuring that intended beneficiaries benefit from the preferential schemes.
While RoO is intended to promote domestic valuation and encourage backward linkages in the economy, strict rules can impose significant additional costs on exporters and reduce the usefulness of preference schemes. Additional production costs may be incurred by exporters as a result of an obligation to source inputs from high cost suppliers (i.e.,) from donor countries under bilateral cumulation rule or to design production structures to comply with origin requirements. In fact, restrictive rules of origin may affect exporter’s decision to use preferences or not, and if compliance costs exceed the margin of preference, exporters may choose to forgo duty preferences altogether – that is, exporters are likely to source inputs on the basis of cost considerations and export at MFN rates (Low, Piermartini, and Richtering, 2005). In fact, Anson and Baccheta find a clear inverse relationship between the restrictiveness of rules of origin and utilization rates by LDCs in the textile and clothing sector. They show that higher utilization rates tend to be associated with lower local content requirements, less complex rules and liberal cumulation requirements.
Other factors affecting the utilization of non-reciprocal preferences include (UNCTAD, 2001):
Lack of security of access - Over the years there have been several changes made to the GSP schemes by including and excluding products/countries through graduation or revision of the schemes. Under certain schemes quantitative limits in preferential treatment have been applied limiting the predictability of preferences. These have brought about an element of uncertainty due to their unilateral and autonomous nature of the schemes. An exception to this is the EBA arrangement, which extends duty/quota free treatment for an unlimited period of time and is not subjected to periodic GSP renewals. Nonetheless, the scheme is still subjected to various limitations of the GSP scheme such
5

as its unilateral character, provision on temporary withdrawal of preferences, strengthened safeguard measures and rules of origin.
Insufficient coverage - Although comprehensive, product coverage under some of the schemes has been limited due to exclusion of certain products of interests to beneficiary countries, which has reduced their usefulness. For example, textiles and clothing products in the case of US and Canada (up to 2003) and some agricultural/fishery products in the case of Japan are not covered under their respective GSP schemes.
Lack of understanding/awareness of the preferences available and conditions - One of the main reasons for low utilization has been lack of knowledge of preferential advantages available under the preferential arrangements on the part of exporters. More often than not, exporters as well as trade officials are also unaware of the conditions which are attached to these arrangements and the lack of knowledge could be costly in terms of unnecessary payment of MFN duties, rejected exports, origin verification, unnecessary testing, spoilage, legal fees and forgone opportunities.
Lack of capacity to supply - This has been one of the main reasons for the limited export performance and utilization of preferences.
Non-trade related conditionalities - In the case of the GSP scheme of the US, certain non-trade related conditionalities have existed since its inception. The EU too maintains similar conditionalities under the EBA and GSP-plus schemes.
While there are a number of studies which have assessed the utilization of preferences under GSP schemes, there are hardly any such studies on Sri Lanka’s performance under these schemes. Weeraratne (2005) in her study on ‘Labour Standards and International Trade: The Case of EU GSP Concessions to Sri Lanka’, finds that the utilization of preferences by Sri Lanka under the EU GSP scheme was low – she observes a rate of 52.5 per cent in 2002. Since the study focused on labour concessions and the textile and clothing industry in Sri Lanka in particular, the main reason identified for low rates of utilization was the difficulty of meeting the strict rules of origin criteria under the GSP scheme. Under the EU GSP scheme, she notes that bilateral cumulation is allowed whereby inputs originating in EU, Norway or Switzerland are considered to be originating in that particular country if such inputs are further worked or processed in a beneficiary country claiming the GSP concessions. However, the author finds that utilization of preferences has not improved under the bilateral cumulation rule or with the introduction of regional cumulation within South Asian Association for Regional Cooperation (SAARC) due to quality and buyer restrictions of sourcing within the region. The present study would further examine the EU GSP scheme in terms of Sri Lanka’s utilization rate over time and sectors other than the textile and clothing industry, and compare with the US scheme, which has not been examined before with regard to Sri Lanka
6

3. GSP Schemes of the US and the EU In 1968, the United Nations Conference on Trade and Development (UNCTAD)
recommended the creation of a "Generalized System of Tariff Preferences" (GSP) under which industrialized countries would grant trade preferences to all developing countries. The “enabling clause” passed in 1971 authorized developed countries to establish individual GSP schemes which exempted them from the MFN principle of the WTO (former GATT). The overall objectives of the GSP scheme in favour of developing countries were: 1) to increase their export earnings, 2) to promote their industrialization, 3) to accelerate their rates of economic growth. The three basic guiding principles of GSP were:
• Generality - a common scheme to be applied by all preference giving countries to all developing countries
• Non-discrimination - all developing countries should be covered and treated equally under the scheme
• Non-reciprocity - beneficiaries do not have to make corresponding concessions in exchange for preferences granted5
To this end industrialized countries offered developing countries preferential access to their markets through lower duties. There are currently a number of national GSP schemes notified to the UNCTAD secretariat. The countries that grant GSP preferences to Sri Lanka include: Belarus, Canada, the European Union, Japan, New Zealand, Norway, the Russian Federation, Turkey, Switzerland, and the United States of America (UNCTAD, 2005). Of all the GSP schemes, those of the EU and the US are the most widely used. 3.1 EU-GSP Scheme
Through its Generalized System of Preferences the EU extends preferential access to its market to all developing countries, a total of 178 countries at present (EU, 2006). The EU GSP scheme is the most generous of all developed country GSP schemes.6 The European Community was the first to implement a GSP scheme in 1971 and it was first implemented for a period of ten years, from 1971 to 1981. A second ten-year term was implemented from 1981 to 1991, and extended until the conclusion of the Uruguay Round in 1994. During this period annual reviews of the scheme were conducted with changes being made to product and country coverage, quotas, ceilings and the depth of tariff cuts. The structure of the scheme was substantially altered in 1995 to reflect the results of the Uruguay Round and was made simpler and more predictable, with quantitative restrictions being replaced by tariffs, the introduction of a graduation mechanism and “incentive clauses”, validity of schemes being extended for three/four years within a ten year period and all products being covered by a single regulation.
5 However, these principles have not been observed from the inception of the schemes in the 1970s. 6 Recently both Australia and Canada have offered duty-free and quota free access for LDCs in all products
(SWATEE, 2005).
7

The most recent scheme, adopted in June 2005 through Council Regulation (EC)
No. 980/2005, came into effect on 1 January 2006 and will be in place until 31 December 2008. The present scheme is designed to be more simple, stable and transparent. The objectives of the scheme are to maximize the benefits to the most disadvantaged countries (small economies, land-locked countries, small island states and low income countries) and provide a clearer graduation mechanism. The new scheme is made fairer by focusing preferential access on countries that have a lower share of EU imports, while graduation takes place when a group of products in a given sector from a beneficiary country exceed 15 per cent of total imports to the EU from GSP countries.7
The types of arrangements provided by the EU GSP have been reduced from five8 to three. At present they are: • General Agreement - Under the General Arrangement, duty free access is given to
3300 non-sensitive products, while for 3900 sensitive products, there is a duty reduction of 3.5 percentage points from the MFN rate and 30 per cent from the specific duties.9 For textile and apparel products, 20 per cent tariff reduction from MFN rates are granted. All beneficiary countries enjoy benefits under the General Agreement.
• The “special incentive” arrangement for Sustainable Development and Good Governance (the GSP+) provides additional benefits to countries implementing certain international standards in human and labour rights, environmental protection, fight against drugs, and good governance. Sri Lanka is the only South Asian country enjoying the benefits of the “GSP+” scheme, which ensures duty free access to the EU market for 7200 products.10 In addition to Sri Lanka, the Commission granted GSP+ status to 5 Andean Countries (Bolivia, Columbia, Ecuador, Peru and Venezuela), six Central American countries (Costa Rica, El Salvador, Guatemala, Honduras, Nicaragua, Panama), Moldova, Georgia and Mongolia (EU, 2006).11
7 In the case of textiles and clothing, the graduation threshold was set at 12.5 per cent. 8 These include: General Scheme; Special Scheme for the protection of labour rights (only two beneficiaries Moldova
and Sri Lanka); Special Scheme for the protection of the environment (no beneficiaries); Special Scheme to combat drug production and trafficking (all Central American countries belonging to the Andean Community and Pakistan); and the Special Scheme for LDCs – “Everything but Arms” (allows duty-free and quota-free access to all products but arms from the world’s 50 poorest countries). Both Bangladesh and Nepal are EBA beneficiaries since 2001 and are eligible to duty and quota free access to the EU market. The special arrangement for countries combating drug production and trafficking (of which Pakistan was a beneficiary) was removed from the new arrangement due to the lack of objective criteria in selecting beneficiary countries in a manner compatible with WTO rules. Pakistan which was a beneficiary of this special programme did not qualify for the GSP+ scheme as its share was more than one per cent of EU’s total imports.
9 For textile and clothing, the duty reduction is 20 per cent off the MFN rate. 10 The implementation date of the scheme was accelerated to April 2005 so that countries severely affected by the
tsunami, such as Sri Lanka and Thailand, could reap benefits of the scheme sooner. 11 To qualify under the GSP scheme, the following conditions have to be met. First, a country must prove that it is
‘vulnerable’ – that is, the top 5 GSP covered imports to the EU account for more than 75 per cent of the total GSP covered imports, and GSP covered imports from the country account for less than 1 per cent of total EU imports under GSP scheme. Second, a country needs to ratify 27 international conventions on sustainable development and good governance. Immediate preferences are available to countries that have ratified and implemented 16 core
8

• The special arrangement for LDCs, also known as the “Everything But Arms” (EBA) initiative, grants LDCs “duty-free and quota-free” access to the EU’s market with the exception of rice, bananas and sugar, which were given longer implementation periods.The EBA for the 50 least-developed countries covers about 9800 products.
Fundamental to any GSP scheme are its Rules of Origin and the EC has its own
RoO for countries receiving preferential market access. All exporting countries must fulfill obligations under Article 81 of the EC GSP RoO. The three main conditions required are that the exported products: 1) must originate in the beneficiary country, 2) must be transported directly to the EC from the beneficiary country, and 3) be accompanied by proof of their originating status.
In order to satisfy the first condition the product must meet one of two criteria – the goods must be either ‘wholly obtained’ in the country or ‘sufficiently worked or processed’. The criteria required to satisfy the ‘sufficiently worked or processed’ clause may be met in one of three ways, or a combination of two of the three clauses: 1) the change of heading criterion (a different heading under 4 digit HS level), 2) the value (ad valorem) criterion, and 3) the specific process criterion.
The EC allows for ‘Bi-lateral Cumulation’ (also known as ‘Donor Country Content’) and ‘Regional Cumulation’, which allow beneficiary countries to use inputs from the EC, Norway, Switzerland and any of the designated regional groupings to meet the RoO criteria, respectively. ‘Regional Cumulation’ is intended to promote regional cooperation. Regional Cumulation is permitted among members of the Andean Group, ASEAN, CACM and SAARC. The EC also allows derogation from the GSP rules to LDCs for a specified period of time.
EU is in the process of reforming its Rules of Origin criteria which governs the GSP eligibility. The objective is to simplify and relax these rules to provide better access to developing countries (Box 2).
conventions on human and labour rights and 7 of the international conventions on good governance and protection of the environment. Third, countries must engage in ratifying and implementing other international conventions which they have not yet signed by December 2008 (UNCTAD, 2005).
9

Box 2 Proposed Changes in the EU’s Preferential Rules of Origin
On March 2005, the European Commission adopted a Communication (COM(2005) 100 final) which outlines the broad direction of reforms of rules of origin. The reform indicates a simplification of origin criteria and cumulation rules and formalities and controls. Specifically, for wholly obtained products, the Communication notes the need to improve the origin of fishery products through the nationality vessels by basing the determination on the flag, registration, simplified but adequate conditions regarding property and the crew conditions. With regard to ‘sufficiently worked or processed products’, the Communication notes that the rules should reflect the production capacity of countries and processing operations and suggest the use of a single across the board criterion based on value addition as opposed to the current system of multipilicty of different rules varying from product to product. The Communication does not specify a level of value addition required to obtain origin status. The Communication notes that developing countries’ current level of access to the EU market should not be reduced by the new rules of origin. Thus there is a possibility that different per centages being assigned for different sectors so that they do not exceed the production capacities of developing countries. Specific levels are being considered for LDCs under the EBA. For certain sectors such as agriculture, fishery and textiles, the Communication suggests that there may be a need to adopt approaches other than value addition. On cumulation of origin, the Communication notes the willingness of the Commission to examine requests for establishing a wider group for cumulation. It proposes to replace the current double conditions for the allocation of origin to a member country of a group by a single condition based on value addition criteria. Under the double condition: 1) the value added in the country claiming origin status must be greater than the highest value of the materials used originating in any other countries of the group; and 2) the processing carried out in that country must be more than ‘insufficient working or processing’. According to the proposal, a product will be considered as originating in the country of the group where the final processing on materials takes place if the value added in that country is higher than a percentage of value addition to be fixed. The percentage is expected to be lower than the one required for the same product which is produced from non-originating inputs. The Communication also proposes to introduce efficient procedures and clearer responsibilities of operators and authorities in establishing and controlling origin. It also proposes to establish a secured environment by adopting a number of measures that would support compliance by authorities and to fully cooperate in preventing and fighting abuse.
Source: UNCTAD, 2005
10

3.2 US-GSP Scheme
The U.S. Generalized System of Preferences is designed to promote economic growth in the developing world by providing eligible beneficiary countries with preferential duty-free and quota-free entry of eligible products. Under the authorization of the Trade Act of 1974, the GSP programme was instituted on January 1, 1976. Since then it has been in operation initially for two 10-year periods and thereafter been renewed every one or two years. The US scheme has consecutively been renewed without any amendments. These reauthorized renewals were made in December 1999 through to September 2001 with retroactive effect from June 1999 and most recently in 2002 under the Trade Act of 2002 whereby, President Bush signed legislation reauthorizing the programme through to December 2006.
Under the US scheme 139 countries are eligible for GSP benefits of which 98 are developing countries and 41 are LDCs. 12Approximately 4,600 articles are eligible for duty-free treatment from all GSP beneficiaries (at 8 digit level of HS code). In 1997 an additional 1,783 articles originating in LDCs became available only to them under the scheme. This was seen as a significant improvement in the US scheme as it resulted in an increase in product coverage for LDCs from less than 2 per cent in 1996 to over 60 per cent in 1997. Product coverage of goods from beneficiary countries other than LDCs also expanded from 41.2 per cent to 54.9 per cent between 1996 and 199713.
Eligible products under the US GSP scheme include most dutiable manufactures, semi-manufactures and selected agricultural, fishery and primary industrial products. Products excluded from GSP eligibility include most textiles, watches, footwear, handbags, luggage, flat goods, work gloves, other leather apparel and any article determined to be import sensitive such as steel, glass and electronic equipment.14
Eligibility for duty-free treatment under the scheme is based on the provision that the countries: 1) do not exceed the Competitive Needs Limit (CNL); 2) have not yet achieved graduate status with respect to the product; 3) imports meet the value-added requirements; 4) have fully completed the relevant documentation; and 5) imports comply with other custom requirements.
The Competitive Needs Limit (CNL) provides a ceiling on GSP benefits for each product and eligible country. This is intended to prevent the extension of preferential treatment to countries that are already competitive in the production of that product. Developing countries will automatically lose its GSP eligibility on a product if the
12 Some developing countries and LDCs have been removed from GSP beneficiary eligibility in the past due to country
practice petitions on concerns such as worker rights and intellectual property. 13 A closer examination of the extended list of products indicates that it mostly benefited one country and one product:
Angola and petroleum oil (UNCTAD, 2003). 14 Products are also removed from GSP eligibility under three circumstances. Firstly, products may be removed in
response to petitions submitted by interested parties; secondly, by designation of new products; and thirdly, by the re-designation of specific articles as GSP eligible and denying re-designation to certain developing countries.
11

competitive needs limit is exceeded when the country’s exports: (1) account for more than 50 per cent of the total value of US imports for that product, or (2) exceed a certain dollar value which is increased by $5 million annually and stood at $120 million in 2005. Under special circumstances the Competitive Needs Limit can be waived. This limit is automatically waived for all LDCs eligible for GSP benefits.
Under the graduation mechanism of the US scheme, a country would lose its GSP benefits when it is determined as sufficiently developed or competitive, and therefore no longer requires GSP benefits as a whole or with respect to one or more products. The conditions considered for the graduation of a country are: the country’s level of development; its competitiveness in the particular product; its practices relating to trade, investment and worker rights and the overall economic interests of the US such as the effect of continued GSP treatment on relevant US producers, workers and consumers.
For an article to be GSP eligible under the US scheme, the beneficiary country also has to comply with the rules of origin requirements. These requirements state that the article must have 35 per cent of value-added local content – that is, imported materials can also be counted toward the 35 per cent value added requirement only if they are “substantially transformed” into new and different constituent materials which are then used to produce the eligible article. The item must also be directly shipped to the US from the beneficiary country. US Customs has the authority in determining whether an article meets the GSP rules of origin.
For GSP member countries that have regional associations, the US GSP scheme allows special provisions such that the association will be considered as one country for the purpose of GSP Rules of Origin. Associations that are currently eligible to benefit from the special provisions are: the Andean Group; the Association of Southeast Asian Nations (ASEAN) except Brunei and Singapore; the Caribbean Common Market (CARICOM); the Southern African Development Community (SADC); West African Economic and Monetary Union (WAEMU). South Asian Association for Regional Cooperation (SAARC) has not been recognized for cumulation purpose under the US scheme.
The US scheme expires on 31 December 2006 but unlike other years, there is considerable debate regarding renewal of the scheme this time around largely due to the current impasse in the multilateral trade talks and due to Congressional concerns regarding the inclusion of certain advanced developing countries such as India and Brazil in the scheme (Jones, 2006). Currently the Office of the United States Trade Representative (USTR) is reviewing whether to limit, suspend or withdraw the eligibility of 13 major GSP beneficiaries15. It is also reviewing whether the current waivers to automatic Competitive Need Limits (CNL) should be withdrawn. Several options appear available with respect to the treatment of the GSP scheme. The Congress could allow the programme to expire after December 31, 2006; scrap GSP in favour of reciprocal bilateral and regional trade agreements; renew the GSP for LDCs only; renew the 15 These include: Argentina, Brazil, Croatia, India, Indonesia, Kazakhstan, Philippines, Romania, Russia, South Africa,
Thailand, Turkey, and Venezuela.
12

existing programme without major amendments or extend the programme in a modified form. 4. Imports to the US and EU from Sri Lanka under the GSP
schemes Sri Lanka is highly dependent on both the US and EU as markets for its exports.
The US and the EU account for 34 and 31 per cent, respectively of Sri Lanka’s total exports in 2004.16 As it can be seen from Table 1 and 2, not only are exports from Sri Lanka concentrated in two markets, exports to the US and EU from Sri Lanka are highly concentrated in one or three sectors, with textiles and textile articles accounting for a substantial proportion in both markets – as high as 82 per cent in the case of the US, reflecting the undiversified nature of the export structure of the economy. Plastics and rubber, and precious stones are other important export categories to the EU and US. The respective export shares of these product categories have remained stable over the years, except in the case of transport equipment exports to the EU from Sri Lanka, which accounted for 17 per cent of total in 2000. This seems to be an exceptional year as its share in imports subsequently fell to 1 per cent.17
16 Of the 4 QUAD countries, Sri Lanka’s exports to Japan and Canada are much less than its exports to either the US or
the EU. In 2004, Japan and Canada accounted for 2.8 and 1.3 per cent, respectively of Sri Lanka’s total exports. 17 The high share of transport equipment exports in 2004 seems to be associated with imports of aircraft from France to
Sri Lanka during the same year (EU, 2003).
13

Table 1 Imports to the EU from Sri Lanka by HS Section-wise
(as a percentage of total imports from Sri Lanka), 2000-04
Section Description 2000 2001 2002 2003 2004i Live animals & products 0.9 1.3 1.6 2.1 1.9
ii Vegetable products 5.5 6.2 5.9 6.0 6.3iii Fats and oils 0.1 0.0 0.0 0.0 0.0
iv Prepared foodstuffs,beverages,etc. 1.6 2.4 2.5 2.6 2.8
v Mineral products 0.1 0.1 0.1 0.2 0.2vi Chemical products 0.7 0.6 0.7 0.5 0.4
vii Plastics & rubber 6.2 7.9 9.0 11.2 11.4viii Hides and skins, leather, etc. 0.5 0.8 0.8 1.0 0.8
ix Wood & articles of wood 0.4 0.6 0.5 0.4 0.5
x Pulp of wood, paper, books, etc. 0.6 0.7 0.8 0.9 0.8
xi Textile & textile articles 46.6 52.5 53.8 50.8 52.3
xii Footwear, headgear, umbrellas,etc. 1.7 1.8 1.4 1.3 1.2
xiii Articles of stone, cement, etc. 0.8 0.8 0.9 1.1 1.1xiv Precious stones, etc 8.6 10.1 12.4 13.1 11.9xv Base metals & products 0.6 0.7 0.7 0.8 0.7
xvi Machinery & electrical equipment 3.3 3.5 4.6 4.2 3.7
xvii Transport equipment 17.0 5.8 0.7 0.9 1.1
xviii Optical & precision instruments 2.5 1.2 0.9 0.5 0.5
xx Miscellaneous manufact. Articles 2.2 2.8 2.6 2.6 2.4
xxi Works of art, etc 0.0 0.0 0.0 0.0 0.0 Total 100 100 100 100 100 Value of Imports ($ 000) 1745471 1382366 1347451 1384878 1694239
Notes: Section i: HS chapters 01-05
Section viii: HS chapters 41-43
Section xv : HS chapters 72-83
Section ii: HS chapters 06-14
Section ix : HS chapters 44-46
Section xvi : HS chapters 84-85
Section iii: HS chapter 15
Section x : HS chapters 47-49
Section xvii : HS chapters 86-89
Section iv: HS chapters 16-24
Section xi : HS chapters 50-63
Section xviii : HS chapters 90-92
Section v : HS chapters Section xii : HS chapters Section xx : HS chapters
14
25-27 64-67 94-96 Section vi: HS chapters 28-38
Section xiii: HS chapters 68-70
Section xxi : HS chapters 97-99
Section vii: HS chapters 39-40
Section xiv: HS chapter 71
Source: Compiled from data provided by UNCTAD
15

Table 2 Imports to the US from Sri Lanka by HS Section-wise
(as a percentage of total imports from Sri Lanka), 2000-04 Section Description 2000 2001 2002 2003 2004
i Live animals & products 0.8 0.5 0.4 0.9 0.9ii Vegetable products 1.1 1.0 1.3 1.3 1.3iii Fats and oils 0.0 0.0 0.0 0.0 0.0
iv Prepared foodstuffs,beverages,etc. 0.1 0.1 0.1 0.1 0.1
v Mineral products 0.0 0.0 0.0 0.1 0.1vi Chemical products 0.5 0.4 0.6 0.5 0.5vii Plastics & rubber 4.2 4.2 5.3 6.2 7.4viii Hides and skins, leather, etc. 5.3 5.1 3.0 1.1 0.3ix Wood & articles of wood 0.1 0.1 0.2 0.2 0.2x Pulp of wood, paper, books, etc. 0.0 0.0 0.0 0.0 0.0xi Textile & textile articles 78.6 80.7 81.7 82.3 81.7
xii Footwear, headgear, umbrellas,etc. 2.2 2.2 1.8 1.6 1.0
xiii Articles of stone, cement, etc. 1.1 1.0 1.0 0.9 0.8xiv Precious stones, etc 2.2 2.1 1.9 2.5 2.7xv Base metals & products 0.0 0.0 0.0 0.1 0.1
xvi Machinery & electrical equipment 0.9 0.7 0.8 1.0 1.4
xvii Transport equipment 0.0 0.0 0.3 0.0 0.0xviii Optical & precision instruments 0.5 0.4 0.0 0.0 0.1
xx Miscellaneous manufact. Articles 1.5 1.3 1.3 1.1 0.9
xxi Works of art, etc 0.0 0.0 0.0 0.0 0.0xxii Special uses 0.6 0.1 0.1 0.5
Total 100 100 100 100 100 Value of Imports ($ 000) 2001721 1966851 1921443 1921512 2075071 Notes:
Section i: HS chapters 01-05
Section viii: HS chapters 41-43
Section xv : HS chapters 72-83
Section ii: HS chapters 06-14
Section ix : HS chapters 44-46
Section xvi : HS chapters 84-85
Section iii: HS chapter 15
Section x : HS chapters 47-49
Section xvii : HS chapters 86-89
Section iv: HS chapters 16-24
Section xi : HS chapters 50-63
Section xviii : HS chapters 90-92
Section v : HS chapters 25-27
Section xii : HS chapters 64-67
Section xx : HS chapters 94-96
Section vi: HS chapters 28-38
Section xiii: HS chapters 68-70
Section xxi : HS chapters 97-99
Section vii: HS chapters 39-40
Section xiv: HS chapter 71
Source: Compiled from data provided by UNCTAD
16
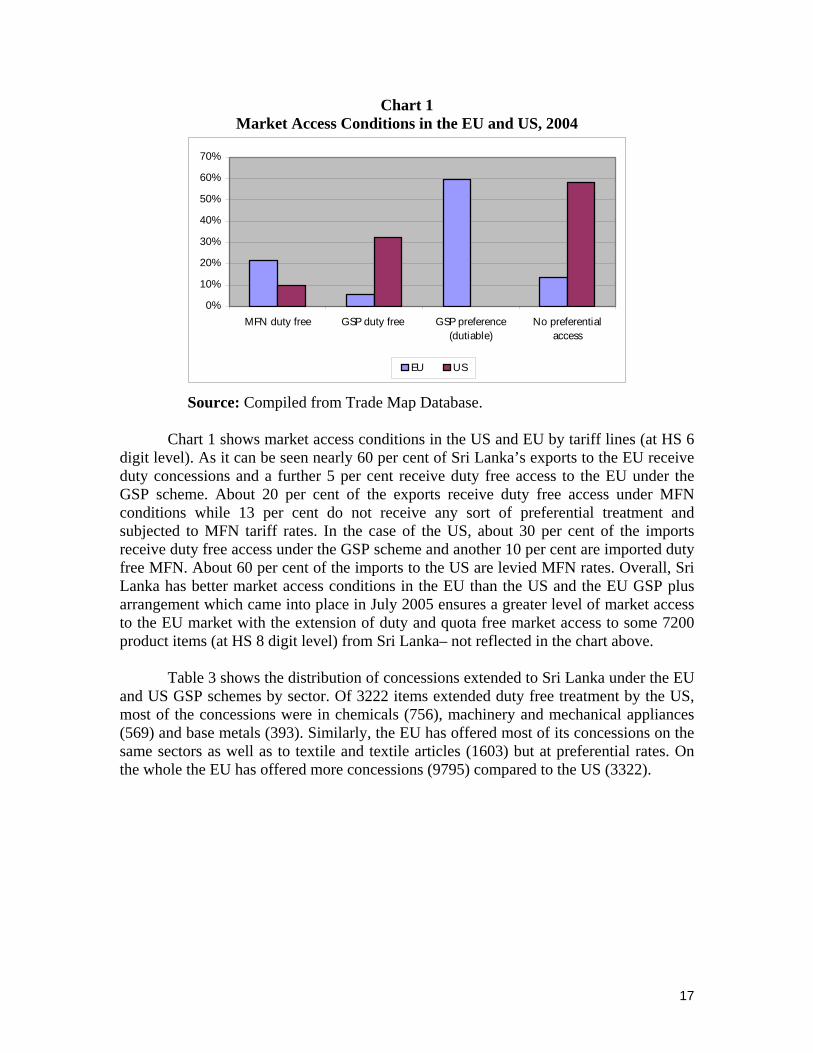
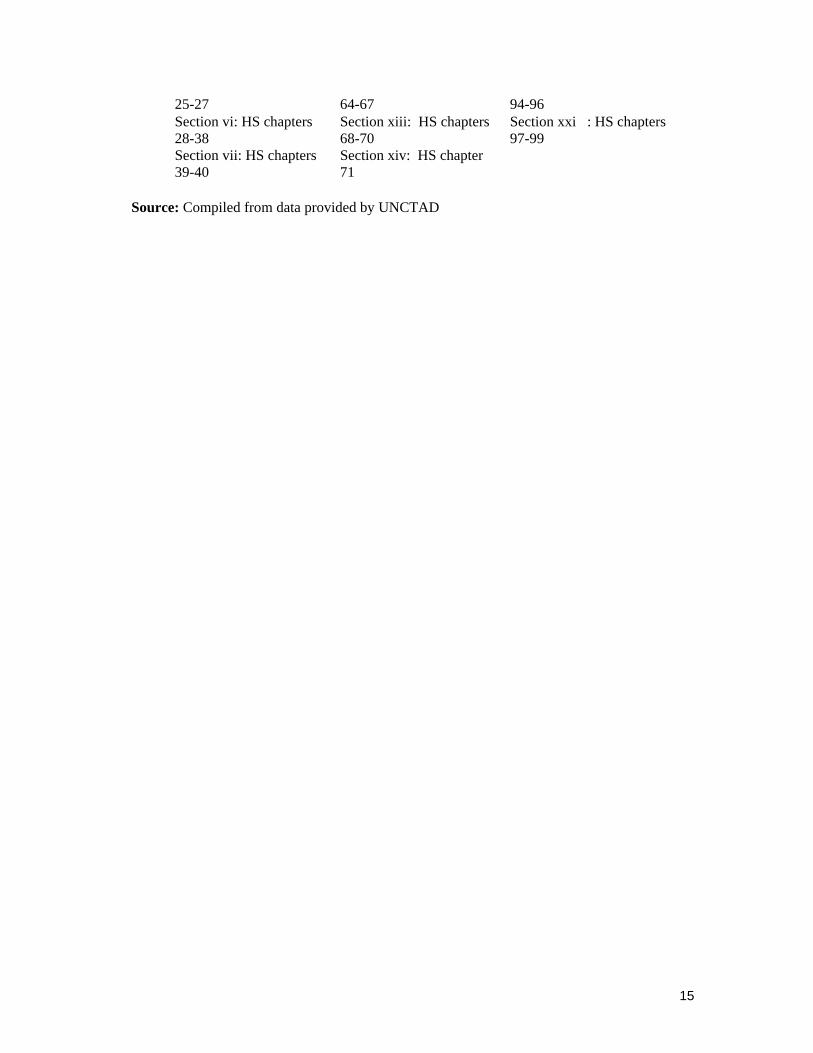
Chart 1 Market Access Conditions in the EU and US, 2004
0%
10%
20%
30%
40%
50%
60%
70%
MFN duty free GSP duty free GSP preference(dutiable)
No preferentialaccess
EU US
Source: Compiled from Trade Map Database.
Chart 1 shows market access conditions in the US and EU by tariff lines (at HS 6 digit level). As it can be seen nearly 60 per cent of Sri Lanka’s exports to the EU receive duty concessions and a further 5 per cent receive duty free access to the EU under the GSP scheme. About 20 per cent of the exports receive duty free access under MFN conditions while 13 per cent do not receive any sort of preferential treatment and subjected to MFN tariff rates. In the case of the US, about 30 per cent of the imports receive duty free access under the GSP scheme and another 10 per cent are imported duty free MFN. About 60 per cent of the imports to the US are levied MFN rates. Overall, Sri Lanka has better market access conditions in the EU than the US and the EU GSP plus arrangement which came into place in July 2005 ensures a greater level of market access to the EU market with the extension of duty and quota free market access to some 7200 product items (at HS 8 digit level) from Sri Lanka– not reflected in the chart above.
Table 3 shows the distribution of concessions extended to Sri Lanka under the EU and US GSP schemes by sector. Of 3222 items extended duty free treatment by the US, most of the concessions were in chemicals (756), machinery and mechanical appliances (569) and base metals (393). Similarly, the EU has offered most of its concessions on the same sectors as well as to textile and textile articles (1603) but at preferential rates. On the whole the EU has offered more concessions (9795) compared to the US (3322).
17

Table 3 Distribution of Products Offered Concessions by the US and EU
under the GSP Scheme (HS 6 digit level)
Section Description US EU Duty
free Prefer. duty
Duty Free
i Live animals, animal products 42 569 33 ii Vegetable products 209 602 28
iii Animal/Vegetable fats and oils 20 109 2 iv Prepared foodstuffs 227 696 214 v Mineral products 15 61
vi Chemical products 756 1645 vii Plastics and articles 252 629
viii Leather products 107 113 ix Wood products 60 111 x Paper products 0 0
xi Textile articles 64 1603 xii Footwear 27 145
xiii Stone, plaster cement 121 279 xiv Pearls 55 18 xv Base metals 393 644
xvi Machinery and mechanical appliances 569 1526 xvii Transport equipment 77 269
xviii Optical, photographic equipment 194 308 xix Arms and ammunition 10 0 xx Misc. manufactured articles 124 191
xxi Works of art 0 0 Total 3322 9518 277
Notes: Section i: HS chapters 01-05
Section viii: HS chapters 41-43
Section xv : HS chapters 72-83
Section ii: HS chapters 06-14
Section ix : HS chapters 44-46
Section xvi : HS chapters 84-85
Section iii: HS chapter 15
Section x : HS chapters 47-49
Section xvii : HS chapters 86-89
Section iv: HS chapters 16-24
Section xi : HS chapters 50-63
Section xviii : HS chapters 90-92
Section v : HS chapters 25-27
Section xii : HS chapters 64-67
Section xx : HS chapters 94-96
Section vi: HS chapters 28-38
Section xiii: HS chapters 68-70
Section xxi : HS chapters 97-99
Section vii: HS chapters 39-40
Section xiv: HS chapter 71
Source: Compiled from data provided by UNCTAD
18
Before proceeding, it may be useful to describe some measures that are
commonly used in policy literature to assess the value of preferences extended under the EU and US GSP schemes. These indicators have been used by the UNCTAD for many years and will be utilized in this paper to examine the value of trade preferences of the GSP schemes:18 These indicators include: 1) product coverage, 2) utilization rate, and 3) utility rate.
Product coverage is given by the ratio between products covered by the scheme and the dutiable imports from beneficiary countries. The higher the percentage, the more generous the preferences may appear. However, a higher coverage rate does not necessarily mean that preferences are being actually used. It only gives an idea of the eligibility of the products.
Preferences are granted subject to meeting a number of requirements/conditions stipulated by a scheme which beneficiary countries have to comply such as rules of origin. Although preferential schemes may appear to provide a wide coverage of products, the actual utilization of preferences is usually less than 100 per cent in most schemes. A clear indication of the effectiveness of trade preferences is given by the utilization rate.
Utilization rate is defined as the ratio between imports that actually receive preferential treatment and those that are covered by the scheme. This indicator gives an idea of how much of tariff concessions is actually used. The value of a preference scheme increases with the extent to which it is actually utilized. As mentioned above, utilization depends on the stringency/complexity of the rules of origin, recipient’s capacity to handle the administrative requirements and supply the goods, exporters’ awareness of the preference scheme, and depth of preference offered under the scheme.19
Utility rate is defined as the ratio of the value of imports that get preferences to all dutiable imports (covered or not). High utilization rates do not necessarily mean better market access since high utilization rates can be recorded even if the majority of the products are excluded by the scheme. Thus an additional measure such a utility rate can be used to assess the value of trade preferences in combination with the utilization rate. The utility rate indicates how much of the imports pay the preferential rate as supposed to MFN rate.
18 These indicators at most provide a partial analysis of the value of preferences (Hoekman, Martin and Braga, 2005).
To get a broader view one has to also take into account other factors such as costs related to documentary requirements and rules of origin, other limitations and constraints which are part of the preferential scheme, distribution of rents from the preferences.
19 The depth of a preference is given by the difference between the Most Favoured Nation (MFN) rate and preferential rate (preference margin). The depth of preferential margin varies depending on the scheme. Intuitively, one would expect the larger the preference margin, the greater the usefulness of the scheme to exporters. Nonetheless, a small preference margin could be valuable to an exporter in a highly competitive market which is characterized by small profit margins such as in textiles and textile articles trade (EU, 2003).
19

4.1 Imports to the EU under GSP Scheme In 2004, the EU imported USD1.6 bn. of goods from Sri Lanka. Of the total
imports, USD 540mn were imported under the EU GSP scheme and qualified for duty preferences. Imports under preferential treatment has increased steadily from 2000, as shown in Chart 2 though total imports to the EU fell in 2001 before recovering in 2004. The sectors which are the largest beneficiaries of preferential treatment are: textile and textile articles (45 per cent), plastics and rubber (25 per cent), miscellaneous manufactured articles (5 per cent), which altogether accounted for 75 per cent of preferential imports into the EU from Sri Lanka.
Chart 2 Total and Preferential Imports from Sri Lanka to the EU, 2000-04
fro– atheutirecin (7
0
200
400
600
800
1000
1200
1400
1600
1800
2000
2000 2001 2002 2003 2004
Mn
0
100
200
300
400
500
600
Mn
Total imports (left-axis) Preferential imports (right-axis)
Source: Compiled from data provided by UNCTAD.
The coverage offered under the EU GSP scheme is quite extensive for imports m Sri Lanka - almost 98 per cent of imports (dutiable) are eligible for GSP preferences nd the rate has been high over time (Chart 3). Despite the overall high coverage rate, utilization rate has been much lower – about 40 per cent in 2004. Though the lization rate has improved over time, it is still comparatively low. In fact, Sri Lanka ords the lowest rate in South Asia. As it can be seen from Chart 4, the utilization rate 2004 was much higher in Bangladesh (60%), India (59%), Pakistan (58%), and Nepal 4%). On average, the region as a whole recorded a rate of 58 per cent.
20

Table 4 EU GSP Imports and Utilization, 2000-04
Value of Imports ($ 000) Year Total Dutiable Covered
by the scheme
Receiving pref.
Treatment
Potential Coverage
Rate (%)
Utilization Rate (%)
Utility Rate (%)
2000 1745471 1121495 1104408 313711 98.5 28.4 28.0 2001 1382366 1027642 1016305 339986 98.9 33.5 33.1 2002 1347451 1041708 1029927 392278 98.9 38.1 37.7 2003 1384878 1053774 1039795 430488 98.7 41.4 40.9 2004 1694239 1312556 1281969 540124 97.7 42.1 41.2 Source: Compiled from data provided by UNCTAD
Chart 3 Coverage, Utilization and Utility rates of EU-GSP Scheme
0
20
40
60
80
100
2000 2001 2002 2003 2004
Coverage Rate Utilization Rate Utility Rate
Source: Compiled from data provided by UNCTAD.
The low utilization rate reflects the low utility rate as most imports from Sri Lanka are imported under MFN rates and as such do not qualify for preferential duties – that is, only 40 per cent of imports into the EU enter under preferential rates. As explained below, this is due to exports of textile and textile articles, which constitute a bulk of Sri Lanka’s exports to the EU do not qualify for duty preferences though this sector is covered by the scheme. Following the GSP-plus arrangement coming into effect on 1 April 2005, the utilization rate seems to have improved, with the utilization rate increasing to 51 per cent in 2005 according to statistics provided by the EU
21

Commission.20 Under the GSP-plus scheme Sri Lanka is currently allowed to export some 7200 items (at 8 digit HS level) to the EU under duty free and quota free conditions. The GSP plus scheme came at a crucial time with the phase out of the MFA in end 2004 and was considered an important development receiving much publicity and attention.
Chart 4 Utilization Rate (%) under the EU GSP Scheme, 2004
0102030405060708090
100
Bang
lade
sh
Indi
a
Pak
ista
n
Nep
al
Sri L
anka
Source: Compiled from data provided by UNCTAD.
Whilst the overall utilization rate for Sri Lanka is low (41 per cent) in 2004, one can observe that rates vary across sectors, with industrial products (excluding textiles) recording a higher utilization rate of over 70 per cent while agriculture products have a utilization rate of around 40 per cent. Textiles and textile articles which are the most important imports from Sri Lanka, accounting for 55 per cent of total imports to the EU have a utilization rate of 28 per cent in 2004.21 Table 5 shows the respective rates across HS sections (1-22). Apart from textiles and textile articles, other main exports include, precious stones, and plastic and rubber, which account for 11 per cent of total imports, record higher utilization rates of 78 per cent.
20 This is further corroborated by officials at the Department of Commerce in terms of substantial increase in the
issuance of certificate of origins (Form A) to qualify for duty concessions following the GSP-plus arrangement coming into effect on 1 July 2005.
21 According to data provided by the EU Commission, the utilization rate for agricultural, industrial and textiles products in 2005 were 50, 78 and 40 per cent, respectively.
22

Table 5 EU: GSP Imports and Utilization for Sri Lanka (by HS section) 2004
HS Section Value of Imports ($ 000)
Section
Description Total Dutiable
Covered by the
scheme
Receiving pref.
Treatment
Potential Coverage
Rate (%)
Utiliza-tion Rate (%)
Utility Rate (%)
i Live animals & products 32198 28771 5451 4885 19 90 17ii Vegetable products 106878 17392 16565 13827 95 84 80
iii Fats and oils 135 135 135 116 100 86 86
iv Prepared foodstuffs,beverages,etc. 47313 46950 46475 11952 99 26 26
v Mineral products 3468 127 127 0 100 vi Chemical products 6168 3222 3179 2728 99 86 85
vii Plastics & rubber 192656 177150 176721 137685 100 78 78
viii Hides and skins, leather, etc. 14006 13898 13838 12358 100 89 89
ix Wood & articles of wood 8387 2938 2938 2558 100 87 87
x Pulp of wood, paper, books, etc. 12801 0 0 0 .
xi Textile & textile articles 886593 872527 868136 240962 100 28 28
xii Footwear, headgear, umbrellas,etc. 20583 20510 20422 15432 100 76 75
xiii Articles of stone, cement, etc. 18989 18849 18849 15380 100 82 82
xiv Precious stones, etc 201245 5849 5849 4522 100 77 77xv Base metals & products 11083 10392 10349 8912 100 86 86
xvi Machinery & electrical equipment 63193 34634 33763 19411 98 58 56
xvii Transport equipment 19477 19115 19079 15698 100 82 82
xviii Optical & precision instruments 8758 8317 8313 6512 100 78 78
xx Miscellaneous manufact. articles 40191 31780 31780 27186 100 86 86
xxi Works of art, etc 117 0 0 0 .
169423
9131255
6128196
9 540124 98 42 41
Notes:
Section i: HS chapters 01-05
Section viii: HS chapters 41-43
Section xv : HS chapters 72-83
Section ii: HS chapters Section ix : HS chapters 44- Section xvi : HS chapters 84-
23

06-14 46 85 Section iii: HS chapter 15
Section x : HS chapters 47-49
Section xvii : HS chapters 86-89
Section iv: HS chapters 16-24
Section xi : HS chapters 50-63
Section xviii : HS chapters 90-92
Section v : HS chapters 25-27
Section xii : HS chapters 64-67
Section xx : HS chapters 94-96
Section vi: HS chapters 28-38
Section xiii: HS chapters 68-70
Section xxi : HS chapters 97-99
Section vii: HS chapters 39-40 Section xiv: HS chapter 71
Source: Compiled from data provided by UNCTAD
These sectors are further disaggregated into products and Table 6 lists the top ten export products from Sri Lanka to the EU and their respective rates (at HS 2 digit level). Clothing sector (HS 61 and 62) as a whole records a low utilization rate. Other top exports with low rate of utilization include tobacco and manufactured tobacco substitutes (HS 24), which has a utilization rate of less than 2 per cent. Although the utilization rate is high for fish and fish products (HS 03), most of the products are exported under MFN rate of 12.1 per cent than the preferential rate of 4.6 per cent due to low coverage of the product category under the EU GSP scheme. Other top exports record a high utilization rate which suggests that utilizing the GSP scheme is not a problem.
Table 6 Top Ten Products to the EU, Chapter-wise (at HS 2 digit level), 2004
HS
Description MFN
GSP*
% of total imports
Coverage
Rate (%)
Utilization Rate
(%)
Utility rate (%)
61 Art of apparel & clothing access, knitted or crocheted.
12 9.6 26.5 100 37.8 37.8
62 Art of apparel & clothing access, not knitted/crocheted
11.8
9.5 24.0 98.9 15.6 15.5
71 Natural/cultured pearls, prec stones & metals, coin etc
0.0 0.0 11.9 100.0 77.3 77.3
40 Rubber and articles thereof. 0.1 0.0 10.9 100.0 77.6 77.6 09 Coffee, tea, matï and spices. 0.6 0.0 4.2 100.0 66.3 66.3 85 Electrical mchy equip parts thereof; sound
recorder etc 1.4 0.0 2.9 96.7 62.0 60.0
24 Tobacco and manufactured tobacco substitutes
. . 1.9 100.0 1.3 1.3
03 Fish & crustacean, mollusc & other aquatic invertebrate
12.1
4.6 1.9 18.9 89.6 17.0
95 Toys, games & sports requisites; parts & 2.1 0.1 1.5 100.0 87.5 87.5
24

access thereof 69 Ceramic products. 11.
4 7.8 1.0 100.0 87.7 87.7
Notes: * GSP rate is now zero (duty free) following the GSP plus scheme coming into place after July 2005.
Source: Compiled from data provided by UNCTAD 4.2 Imports to the US under GSP Scheme
Sri Lanka exported goods valued at USD 2bn to the US in 2004, recovering from the drop in exports experienced since 2000 (Chart 5). Reflecting the movements in total exports to the US, preferential imports from Sri Lanka to the US improved by 2004 to USD 12 mn. The sectors that are the largest beneficiaries of preferential trade are: plastics and rubber (60 per cent of preferential imports), articles of stone, cement, etc (8 per cent), chemical products (7 per cent), textile and textile articles (5 per cent).
Compared to the EU GSP scheme, the coverage rate of the US is very low (Chart 6)– the US scheme covers less than 10 per cent of Sri Lanka’s total (dutiable) imports. The rate has been consistently low over the last five years. This largely is due to textile and textile articles, which account for the bulk of Sri Lanka’s exports to the US (80 per cent in 2004) are not included in the US GSP scheme. Thus, the coverage rate for textile and textile articles under the US scheme is less than 1 per cent, as can be seen from Table 8.
Chart 5 Total and Preferential Imports from Sri Lanka to the US, 2000-04
1800
1850
1900
1950
2000
2050
2100
2000 2001 2002 2003 20040
20
40
60
80
100
120
140
Total imports (left-axis) Preferential imports (right-axis)
Mn.
Mn.
Source: Compiled from data provided by UNCTAD.
25

The coverage is also low in the case of other sensitive sectors such as hides and skins, leather (13 per cent) and footwear, headgear, umbrellas, etc (11 per cent). Interestingly, the utilization of the preferences by Sri Lanka under the US scheme is quite high – almost 90 per cent of the preferences are being utilized. Sector-wise the utilization is high across various exports including textile and textile articles with a utilization rate of 76 per cent. As in the case of the EU, utilization rates for agriculture and industrial goods are high. The utilization rates in 2004 for agricultural and industrial products are 93 and 89 per cent, respectively. However, the utilization rate may be a misleading indicator due to the low coverage rate of the scheme, and this is reflected by the utility rate, which is about 7 per cent in 2004. The coverage and utility rates are the same in the case of the US as the scheme does not extend preferences to products of export interest to Sri Lanka, which means in effect most of the products from Sri Lanka into the US do not receive preferences but pay the MFN rate. The utility rate for textile and textiles articles is low (less than one per cent) which means that these products are imported under MFN rates. Other sectors with low coverage/utility include hides and skins, and footwear, headgear, umbrellas, which are also excluded from the US GSP scheme. But these exports account for less than 2 per cent of Sri Lanka’s exports to the US and as such not as important as the textile and textile articles which account for the bulk of Sri Lanka’s total exports (82 per cent). Nevertheless, a high utilization rate across sectors indicates that rules of origin are not a constraining factor in the US GSP scheme, not as much as it appears to be in the case of the EU GSP scheme. The main constraining factor in the US scheme appears to be the lack of product coverage of products of export interest to Sri Lanka, namely textiles and textile articles. Despite the low coverage rate for Sri Lanka’s main export sector, other exports from the country such as plastics and rubber, and precious stones record high coverage and utility rates of over 90 per cent and are benefiting under the US GSP scheme. Table 9 lists the top 10 import products from Sri Lanka to the US and their respective rates.
Table 7 US GSP Imports and Utilization, 2000-04
Value of Imports ($ 000) Trade
Year Total Dutiable Covered by the scheme
Receiving pref.
Treatment
Potential Coverage
Rate (%)
Utilization Rate (%)
Utility Rate (%)
2000 2001721 1857179 138623 122305 7.5 88.2 6.6 2001 1966851 1837457 124252 106481 6.8 85.7 5.8 2002 1921443 1756645 110382 97231 6.3 88.1 5.5
2003 1921512 1732320 118259 105867 6.8 89.5 6.1
2004 2075071 1843501 141780 126349 7.7 89.1 6.9
Source: Compiled from data provided by UNCTAD.
26

Chart 6 Coverage, Utilization and Utility Rates of US-GSP Scheme
0
20
40
60
80
100
2000 2001 2002 2003 2004
Year
Utilization Rates Utility Rates Coverage Rates
Source: Compiled from data provided by UNCTAD.
Table 8 US: GSP Imports and Utilization for Sri Lanka (by HS section, 2004)
HS Section Value of Imports ($ 000)
Section
Description
Total
Dutiable
Covered by the scheme
Receiving pref.
Treatment
Potential
Coverage
Rate (%)
Utiliza-
tion Rate (%)
Utility Rate (%)
i Live animals & products 18774 73 73 73 100 100 100
ii Vegetable products 26943 1088 999 913 92 91 84iii Fats and oils 66 15 15 15 100 100 100
iv Prepared foodstuffs, beverages, etc. 2057 1218 1179 1122 97 95 92
v Mineral products 1619 0 0 0 . . .vi Chemical products 11401 9327 9327 9261 100 99 99vii Plastics & rubber 153710 82731 82632 74433 100 90 90
viii Hides and skins, leather, etc. 5567 5566 715 696 13 97 13
ix Wood & articles of wood 4441 3917 3902 3667 100 94 94
x Pulp of wood, paper, 374 0 0 0 . . .
27

books, etc.
xi Textile & textile articles 1695213 1682514 8926 6775 1 76 0
xii Footwear, headgear, umbrellas,etc. 20287 19472 2147 1907 11 89 10
xiii Articles of stone, cement, etc. 15949 14549 10472 10048 72 96 69
xiv Precious stones, etc 57026 5125 5120 4908 100 96 96xv Base metals & products 1873 708 708 513 100 73 73
xvi Machinery & electrical equipment 28466 8657 8657 5881 100 68 68
xvii Transport equipment 942 505 505 211 100 42 42
xviii Optical & precision instruments 1119 588 573 517 97 90 88
xx Miscellaneous manufact. Articles 18685 7271 5830 5409 80 93 74
xxi Works of art, etc 144 0 0 0 . . .xxii Special uses 10415 177 0 0 0 . 0
2075071 1843501 141780 126349 8 89 7
Notes:
Section i: HS chapters 01-05
Section viii: HS chapters 41-43 Section xv : HS chapters 72-83
Section ii: HS chapters 06-14
Section ix : HS chapters 44-46 Section xvi : HS chapters 84-85
Section iii: HS chapter 15
Section x : HS chapters 47-49 Section xvii : HS chapters 86-89
Section iv: HS chapters 16-24
Section xi : HS chapters 50-63 Section xviii : HS chapters 90-92
Section v : HS chapters 25-27
Section xii : HS chapters 64-67 Section xx : HS chapters 94-96
Section vi: HS chapters 28-38
Section xiii: HS chapters 68-70 Section xxi : HS chapters 97-99
Section vii: HS chapters 39-40 Section xiv: HS chapter 71
Source: Compiled from data provided by UNCTAD.
Table 9
Top Ten Products to the US, Chapter-wise (at HS 2 digit level), 2004
HS Code
Description MFN GSP % of total imports
Coverage Rate (%)
Utilization Rate (%)
Utility Rate (%)
62 Art of apparel & clothing access, not knitted/crocheted
15.6 56.2 0.7 96.5 0.6
61 Art of apparel & clothing access, knitted or crocheted.
18.0 22.9 0.3 79.7 0.3
28

40 Rubber and articles thereof. 0.0 0.0 6.2 99.9 94.4 94.3
71 Natural/cultured pearls, prec stones & metals, coin etc
0.8 0.0 2.7 99.9 95.9 95.8
63 Other made up textile articles; sets; worn clothing etc
7.6 1.5 8.5 38.0 3.2
39 Plastics and articles thereof. 3.2 0.0 1.2 99.9 80.3 80.2
09 Coffee, tea, matï and spices. 0.0 0.0 1.2 100.0 89.2 89.2
84 Nuclear reactors, boilers, mchy & mech appliance; parts
0.3 0.0 1.2 100.0 56.0 56.0
03 Fish & crustacean, mollusc & other aquatic invertebrate
0.0 0.0 0.9 100.0 100.0 00.0
69 Ceramic products. 12.9 0.0 0.7 71.8 96.1 69.0 Source: Compiled from data provided by UNCTAD. 4.3 Utilization Rates of the EU and US GSP Schemes: A Comparison
Low utilization rates appear to be a crosscutting problem affecting all schemes to a different degree depending on the product category (UNCTAD, 2003). This is true of the EU GSP in the case of Sri Lanka. But this is not equally applicable in the case of the US scheme, which records a high utilization rate.
As it can be seen from Chart 7 the overall utilization is quite low in the EU compared to the US. The US has a higher utilization rate of 89 per cent compared to a low rate of 42 per cent which was recorded in the case of the EU in 2004. Sectoral breakdowns (agriculture, industrial and textile and textile articles) also show that US records higher utilization across sectors, with significant differences between utilization rates for textiles and textile articles under the US and EU GSP schemes.
However, the relative high utilization rates of the US scheme may be misleading since a large amount of Sri Lanka’s exports, namely textile and textile articles are currently excluded by the scheme and do not receive preferences -- the coverage rate for textile and textile articles is less than 1 per cent. Nevertheless, a high utilization rate combined with a low coverage indicates that Sri Lanka is making the most of the few preferences it receives under the US scheme. Thus, utilization of the preferences extended under the US scheme does not appear to be a problem per se. However, the overall impact of the two schemes appears to be the same as both schemes have not
29

delivered effective market access to products of export interest to Sri Lanka (ie) textile and textile articles.
Chart 7 Utilization Rate of EU and US GSP Scheme, by Sector, 2004
0102030405060708090
100
Overall Agricultural products Industrial products Textiles & articles
perc
enta
ge
EU US
Notes: Agricultural products include HS01-24, industrial products
include HS25-97 except HS50-63, textile and textile articles include HS50-63.
Source: Compiled from data provided by UNCTAD.
5. What are the Main Reasons for the Low Utilization of Trade Preferences under the EU and US GSP Schemes?
The data and information for this section was gathered through conducting face-to-face interviews and distributing questionnaires through electronic mail. The interviews were conducted with key stakeholders such as officials from government departments like the Department of Commerce, Export Development Board; representatives of trade associations and selected exporters among others. Main exporters from the top 10 product categories to the EU and US from Sri Lanka under the GSP schemes were selected for the questionnaire from a list of exporters made available from the Department of Commerce and Export Development Board. The list of people interviewed and the questionnaire which was distributed, are attached as Appendix 1 and 2. Table 10 provides a summary of the main reasons to explain for low utilization of the EU and US GSP schemes by sector.
30

Table 10 Summary of the Main Reasons Identified for Low Utilization of EU and
US GSP Schemes, Top Export Sector
Res
tric
tive
and
high
R
oO
Low
pr
oduc
t co
vera
ge
Lac
k of
aw
aren
ess
Adm
in. &
is
suan
ce
of
Ctif
it Reasons
Product category
EU US EU US EU US EU USArt of apparel & clothing access, knitted or crocheted. (HS61) Art of apparel & clothing access, not knitted/crocheted (HS62), & Other made up textile articles; sets; worn clothing etc (HS63)
x x
Natural/cultured pearls, prec stones & metals, coin etc (HS71)
x x x x
Rubber and articles thereof. (HS40) Coffee, tea, matï and spices. (HS09)
Electrical mchy equip parts thereof; sound recorder etc (HS85) Nuclear reactors, boilers, mchy & mech appliance; parts (HS84)
x x x
Tobacco and manufactured tobacco substitutes (HS24)
x
Fish & crustacean, mollusc & other aquatic invertebrate (HS03)
x x
Toys, games & sports requisites; parts & access thereof (HS95)
x
Ceramic products. (HS69)
Plastics and articles thereof. (HS39)
x
5.1 Rules of Origin
As discussed above the reasons for low utilization rates are many but the most important constraining factor appears to be strict and high rules of origin criteria, which are binding constraints in better utilization of the GSP scheme. Rules of origin are particularly a problem for the clothing sector, which is the main export item from Sri Lanka to the EU, as indicated by the low utilization rates for textile and textile articles (HS61 and HS62) under the EU scheme. Currently, the clothing industry is unable to meet the rules of origin criteria laid down under the GSP scheme22. For clothing made of 22 ‘Sri Lankan apparel industry whilst welcoming the EU’s gesture (of providing duty free market access to Sri Lanka)
…described the 50 per cent threshold as high, and limiting fabric source to SAARC as impractical’ (Daily Mirror, Financial Times, 24/02/2005).
31
woven/knitted fabric, the current criteria requires that two processing stages are undertaken in the country eligible to benefit from the tariff preference (i.e.,) the weaving of the fabric and the making up of the clothing (‘double transformation’) as well as meeting the stipulated value addition criteria, in the case of woven clothing (Table 11).
Sri Lanka like many other developing countries does not produce fabrics or in sufficient amounts required by the clothing industry and thus has to source fabrics (as well as accessories) from abroad.23 The high dependence of the industry on inputs from abroad can be gathered from import and export statistics – imports of fabrics and accessories account for almost half of total exports of the industry.24 Moreover, the value addition in the industry is usually below 40 per cent while the value of imported fabric alone can account for 60 per cent on average of the export product at times, which means that it is unable to meet the value addition requirement stipulated under the EU GSP scheme. Due to the lack of backward linkages in the country, the clothing industry in Sri Lanka has not been able to meet the rules of origin criteria and utilize the preferences extended under the scheme, as indicated by the low utilization rates.25 Currently, most of the fabric requirements of the clothing industry is being imported from abroad, consisting of Hong Kong, China, and Taiwan, which together account for over 50 per cent of total fabrics imported to the island (Table 12).
23 The lack of adequate protection to the local industry, the heavy capital cost, non-availability of raw material and high
cost of electricity have resulted in a very small fabric industry. The only area where some fabric can be locally sourced is in knitted textiles where there are a few mills operated by the private sector such as Hayleys, Ocean Lanka, Textile Jersey, South Asia Textiles. There are fewer companies producing woven fabrics in Sri Lanka. Weaving is very capital intensive and only certain developing countries, namely China, India and Pakistan have competitive textile industries to provide such backward linkages (EU, 2006).
24 ‘At the moment total export earnings from garments is around USD3bn but import about USD1.5bn worth of fabrics and accessories’, Turnoy Mohamed, The Island, Financial Review’ Fabric and Accessory Suppliers Exhibition in November’, 23/09/2006.
25 This seems to be a more of a constraining factor for woven clothing than knitted clothing, indicated by the lower utilization rate for HS62 compared to HS61.
32
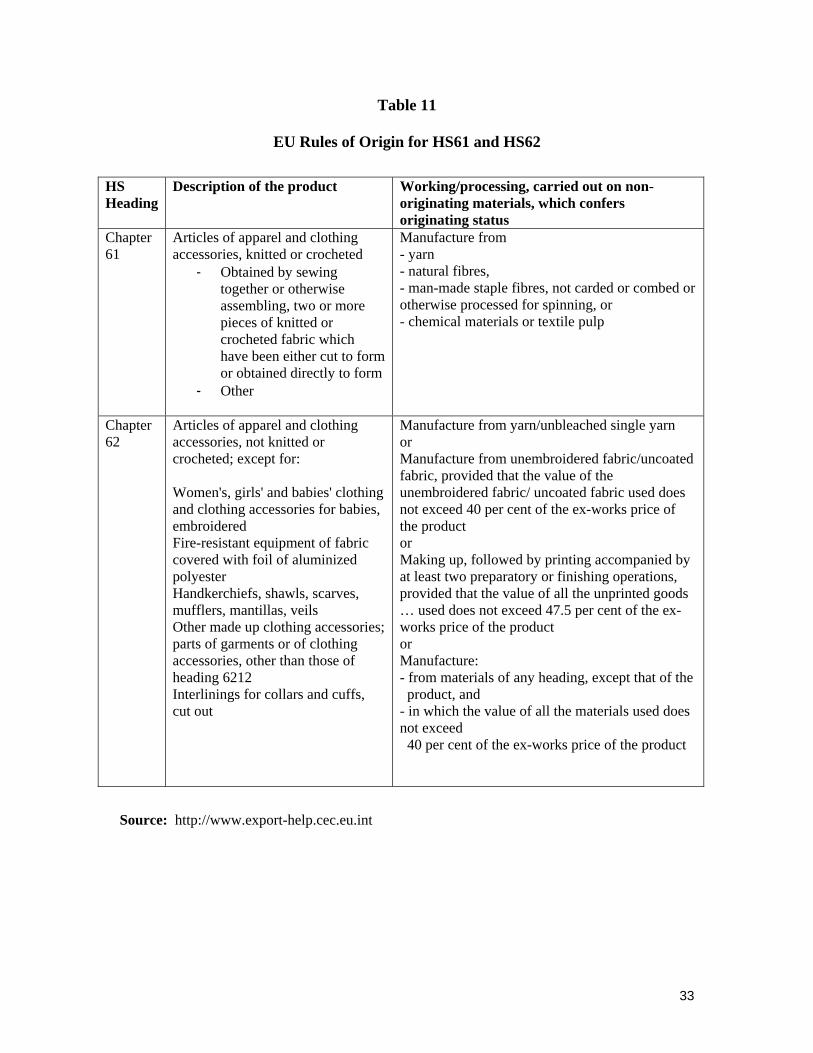
Table 11
EU Rules of Origin for HS61 and HS62
HS Heading
Description of the product Working/processing, carried out on non-originating materials, which confers originating status
Chapter 61
Articles of apparel and clothing accessories, knitted or crocheted
- Obtained by sewing together or otherwise assembling, two or more pieces of knitted or crocheted fabric which have been either cut to form or obtained directly to form
- Other
Manufacture from - yarn - natural fibres, - man-made staple fibres, not carded or combed or otherwise processed for spinning, or - chemical materials or textile pulp
Chapter Articles of apparel and clothing Manufacture from yarn/unbleached single yarn
Source: http://www.export-help.cec.eu.int62 accessories, not knitted or crocheted; except for: Women's, girls' and babies' clothing and clothing accessories for babies, embroidered Fire-resistant equipment of fabric covered with foil of aluminized polyester Handkerchiefs, shawls, scarves, mufflers, mantillas, veils Other made up clothing accessories; parts of garments or of clothing accessories, other than those of heading 6212 Interlinings for collars and cuffs, cut out
or Manufacture from unembroidered fabric/uncoated fabric, provided that the value of the unembroidered fabric/ uncoated fabric used does not exceed 40 per cent of the ex-works price of the product or Making up, followed by printing accompanied by at least two preparatory or finishing operations, provided that the value of all the unprinted goods … used does not exceed 47.5 per cent of the ex-works price of the product or Manufacture: - from materials of any heading, except that of the product, and - in which the value of all the materials used does not exceed 40 per cent of the ex-works price of the product
33

Table 12 Fabric Imports by Sri Lanka, by Source, 2005
Rs (mn) Countries
Woven Knitted Other Total %
of total HG KONG 19195.71 15111.7 4019.66 38327.07 30.19 CHINA 12212.66 6645.011 861.5096 19719.18 15.53 TAIWAN 8383.919 5321.713 1046.878 14752.51 11.62 INDIA 6791.451 1361.849 397.1072 8550.407 6.73 S.KOREA 6008.625 1132.429 497.4085 7638.463 6.02 ITALY 2230.476 3413.944 994.8242 6639.244 5.23 PAKISTN 6065.912 242.0079 7.718058 6315.638 4.97 U.S.A. 3525.671 1017.171 563.6761 5106.518 4.02 U.KING. 1729.497 653.1748 802.0466 3184.718 2.51 INDNSIA 2121.866 242.5834 113.8127 2478.263 1.95 Sub total 68265.79 35141.58 9304.641 112712 88.78
Notes: Woven includes HS codes 5007, 5111, 5112, 5201, 5208, 5209, 5210, 5211, 5212, 5309, 5310, 5311, 5407, 5408, 5512, 5513, 5514, 5515, 5516, 5801,5,802
Knitted includes HS codes 6001, 6002, 6003, 6004, 6005, 6006 Other includes HS codes 5803, 5804, 5805, 5806, 5807, 5808,
5809, 5810, 5811
The option of using fabrics from SAARC which is allowed under the Regional Cumulation rules of origin criteria in the EU scheme has been available since October 2001 to foster regional integration but this has not much helped Sri Lanka. In fact the share of fabric imports from South Asia has fallen from 20 per cent in 2000 to 12 per cent by 2005 (Chart 8).
In South Asia, India and Pakistan are the largest suppliers of fabrics from the region. Sri Lanka currently source most of its fabric requirements from outside the region due to several reasons. These include: buyer’s specification of where to source fabrics; unavailability of fabrics required; and unreliability of delivery from the South Asian region. Currently, regional cumulation facility has been used mostly by the clothing industry to source fabrics such as cottons and grey clothes from India and Pakistan. Bilateral Cumulation also has not helped much as EU fabrics are higher in terms of costs (material and transportation time) compared to fabrics sourced from East Asia. Currently Sri Lanka sources 11 per cent of fabric imports from the EU (up from 8 per cent recorded in 2000). Given the low utilization by the industry of the GSP scheme, most of Sri Lanka’s exports of HS61 and HS62 to the EU are subject to MFN tariff of 12 and 11.8 per cent, respectively and do not benefit from duty preferences under the EU GSP scheme.
34

Chart 8
Value of Fabric Imports from SAARC, ASEAN and EU (per cent)
SAARC12%
ASEAN6%
EU11%
Other Regions71%
Source: Department of Customs.
In addition to the textile and textile articles, some of the other top export sectors such as prepared foodstuffs, beverages, and machinery & electrical equipment record low utilization rates as they are unable to meet the current rules of origin criteria under the EU GSP scheme (Table 5). The current utilization rates of these two sectors are 26 and 58 per cent, respectively. The raw materials and inputs required for both these sectors are not available in the country or even if available do not meet the requirements of the sector, and as such domestic sourcing is minimal or none. Most of the materials required for these sectors are imported from the Far East in the case of machinery & electrical equipment and source little, if any from the South Asia region or EU.
There seems to be a need for simplification and relaxation of the rules or origin criteria, especially those under the EU GSP scheme.26 The EU has acknowledged that the current rules of origin requirements under the EU scheme exceed the industrial capacity and development of developing countries (see Box 3). EU’s rules of origin criteria are currently under review, with a proposition to move to a value added criteria for assessing origin and to a more simplified set of rules. From Sri Lanka’s point of view this would be welcomed as this would simplify the scheme and thereby contribute to an improvement in its utilization. Moreover, Sri Lanka is interested in reducing the value addition component in the scheme to about 30-35 per cent to match the industrial development of the country and to permit greater use of imported inputs such that the clothing industry for example can better make use of the GSP scheme. Moreover, Sri Lanka is also interested in extending regional cumulation beyond the SAARC to include other regional groupings such as the ASEAN – to have a ‘super regional cumulation’ between the
26 In contrast, the rules of origin of the US Scheme are simple and straight-forward, based on the value added criteria
(35 per cent).
35
SAARC and ASEAN. Some of the other top export sectors which would benefit from super regional cumulation include HS 24, 39, 84, 85. However, this has not been favourably received by other SAARC members including Bangladesh. Super cumulation would be possible only if members of both regional organizations agree on it with a request from the Secretariats of both ASEAN and SAARC. Nevertheless, the usefulness of super regional cumulation may be somewhat limited depending on the sector in question. As shown above most of the fabric imports originate from Hong Kong, China and Taiwan which are not members the ASEAN. This means that Sri Lanka’s main export would not necessarily gain much under super-cumulation rule between SAARC and ASEAN due to current sourcing patterns of the clothing industry. However this does not necessarily mean the situation would remain as it is in the future or it would not benefit other sectors (such as machinery & electrical equipment). With duty free and quota free access to the EU and greater sourcing opportunities beyond the SAARC region, the GSP scheme would prove more useful for exporters and could lead to an improvement in the utilization of preferences.
In light of opposition against super-regional cumulation from other members of the SAARC and time consuming process it would involve to obtain the consent of members of two regional groups, Sri Lanka in the meanwhile has proposed derogation under Article 76, which is currently available to LDCs, to be extended to GSP-plus countries. While there is a need for simplification and relaxation of RoO, there is also a need to encourage backward linkages in the country – a very liberal rules of origin criteria would merely encourage transshipment through the beneficiary country with little value addition done. Thus there is a need to strike a balance between relaxing rules of origin to increase exports from the beneficiary country as well as ensuring a sufficient level of value addition in the country to encourage backward integration.
36

Box 3 Summary of the Key Findings of the EU Green Paper on the ‘Future of Rules
of Origin in Preferential Trade Arrangements’ The present origin rules do not fit current economic reality for the following reasons:
- they do not correspond to the global production model of the market - they reflect past defensive policy aims - they do not correspond to the new manufacturing and processing operations which are
currently taking place - they do not reflect technological advances - they should take more into consideration actual market, trade, industry and agriculture
conditions The current origin rules are seen as too complex, restrictive and they lack transparency There is a clear call for rationalization and simplification of the origin rules The current system should be changed in order to provide an adequate level of assurance
that the products for which preferential treatment is claimed do actually satisfy the origin rules
The system of paper based certificates should be replaced by an electronic document There is a need for increased Community monitoring and greater coordination and
cooperation to ensure compliance with the rules of origin There was support for the introduction into preferential agreements of clauses on
suspensions of preferences and financial liability
Source: European Commission, 2004. 5.2 Product Coverage
While the issue of utilization is mainly relevant in the case of the EU market, low product coverage seems to be the problem in the case of the US GSP scheme, as products relevant to Sri Lanka such as textile and textile articles, which accounts for 82 per cent of total exports to the US, are not covered. Thus there is substantial scope for expansion of preferences in the case of the US - about 92 per cent of the imports are not covered by the scheme. Including textile and textile articles alone in the US GSP scheme would increase Sri Lanka’s coverage rate from 0.5 per cent to 98.5 per cent! This would in turn have a significant impact given the already high utilization by Sri Lanka of the preferences it currently receives. Therefore, if any improvements are to be achieved under the US GSP scheme, future expansion of market access for Sri Lanka would need to cover products which are currently excluded. Currently, the US only extends duty and quota free access to textile articles for 30 African LDCs under the African Growth and Opportunity Act (AGOA).
There have been a number of initiatives to obtain duty free access to the US in the past. Sri Lanka was the first South Asian country to start FTA talks with the US in 2002 by signing a Trade Investment Framework Agreement (TIFA) but negotiations stalled after elections and political and administrative changes in both countries last year. The initial push for FTA with the US was to obtain some tariff concessions on clothing exports before the phasing out of the MFA by the end of 2004 in order to better compete
37

with other countries that have duty free and quota free access to the US market. However, the prospects of a free trade agreement between Sri Lanka and the US in the foreseeable future is uncertain and unlikely given the economic realities – the US Congress may not see any benefits from signing a FTA with Sri Lanka.
A bill known as the Tariff Relief Assistance for Developing Economies Act of 2005 (or Trade Act of 2005) was proposed in February 2005 under which benefits would be extended to 14 Asian LDCs27 and Sri Lanka under the AGOA. The proposal also includes extending duty-free access to textiles and clothing and allows these countries to use fabrics from any other countries, albeit under limits. The Trade Act of 2005 would be effective until 31 December 2014 but due to strong opposition from US textile industry associations, the bill was not expected to be approved by the US Congress (EmergingTextiles.com, 2005).
Subsequently a Sri Lanka Tsunami Temporary Economic Relief Act of 2006 was proposed in February 2006 to provide temporary duty suspension on products from Sri Lanka, including textiles and apparel. Upon enactment, it will be valid for a period of 5 years unless the US and Sri Lanka enters into a free trade agreement. Neither Bill has passed through the Congress to date. In the event, Sri Lanka does obtain any preferential treatment from the US, access would be conditional upon meeting additional eligibility requirements such as those under AGOA.28 Thus, this should be borne in mind when negotiating for greater market access as it would come at a loss of policy space for Sri Lanka. 5.3 Awareness or Knowledge amongst Exporters
Awareness or knowledge amongst exporters of the GSP schemes does not seem to be a particular issue in the case of Sri Lanka. While large exporters are generally aware of the opportunities offered under various schemes, small and medium enterprises especially those based outside the Western province in rural areas generally tend to have lack of access to information and may not be making most out of the scheme. For example, lack of awareness has been identified as an issue for exports of the precious stones sector, which is dominated by small and medium scale exporters. Nonetheless, this does seem to have an adverse effect on the utilization rate, which is quite high in the case of the EU and US GSP scheme. The rates are 77 and 96 per cent, respectively. However, lack of awareness is not generally and necessarily confined to small and medium
27 Afghanistan, Bangladesh, Bhutan, Cambodia, Kiribati, Lao PDR, Maldives, Nepal, Samoa, Solomon Islands, East
Timor, Tuvalu, Vanatu and Yemen (UNCTAD, 2005). 28 Additional eligibility requirements under AGOA include the following. Firstly, the country must have established, or
be in the process of establishing a number of dimensions (a market based economy that protects private property rights, incorporates an open rule-based trading system and minimizes government interference in the economy; the rule of law, political pluralism and the right to due process, a fair trial and equal protection under the law; elimination of barriers to US trade and investment; protection of intellectual property rights and the resolution of bilateral trade and investment disputes; economic policies to reduce poverty, increase the availability of health care and recognized workers rights; a system to combat corruption and bribery; protection of internationally recognized workers rights). Secondly, the country must not engage in activities that undermine US national security/foreign policy interests. Thirdly, the country must not engage in gross violations of internationally recognized human rights. Fourthly, the country must have implemented its commitments to eliminate the worst form of child labour (Inama, 2003).
38

exporters. Awareness seems to depend on export sector. Sector-wise, awareness of the EU GSP scheme is quite extensive amongst the clothing industry, which is dominated by a few large players that account for a substantial share of production of the industry.
Towards building awareness, the Department of Commerce (DoC) and other government institutions like the Export Development Board (EDB) as well as private associations and chambers have been conducting workshops and seminars to educate exporters about the GSP schemes, especially the GSP-plus scheme which came into place in July 2006 and the benefits they could obtain under the scheme. However, there is still room to build awareness amongst the exporters and further assistance in this regard could better help exporters exploit the opportunities to export under the GSP schemes. An important point to bear in mind here is that importers in the EU and US are the immediate beneficiaries of lower duties under the GSP scheme and as such it is also their responsibility to be aware of tariff concessions available and request them when importing from the GSP beneficiary countries.
5.4 Administration and Issuance of Certificates Administration and issuance of certificates of origin do not seem to impose
additional costs on exporters and undermine the utilization of trade preferences. Department of Commerce (DoC) under the Ministry of Commerce and Consumer Affairs has been the issuing authority in Sri Lanka since the inception of the GSP system.
The GSP rules of origin under different schemes require that exporters provide together with other documents, the Certificate of Origin Form A which is to be filled by the exporter and certified by the Department of Commerce. The process of the issuance of the GSP form has been greatly facilitated and the certificate is issued within the same day or a day after it is handed over by the exporter – the process tends to be longer if inputs are sourced from abroad. With respect to some export sectors completion of the Form A with the required information to qualify for GSP concessions seems to be a difficult process. For example, exporters of precious stones find it difficult to satisfy the data requirements of the form. The form requires an accurate account of materials used in the product, which the exporters are unable to provide in detail as the materials used in the final product vary from one product to another product depending on the export consignment.
Technical verification process is carried out after the issuance of the certificate to enable the Department of Commerce to ensure that all the Origin Criteria stipulated are complied. The process seems to be working effectively and efficiently for the most part and does not seem to constrain the ability of exporters to use the scheme. In fact, the DoC has been doing a commendable job with limited resources (both financial and manpower) at their disposal though at times technical knowledge seems to be lacking in certain export products. But this is not a problem for most products. Currently, the DoC charges for the issuance of certificate of origin: Rs.4500 (plus VAT) for initial registration of companies for certificate of origin, which is a one time payment, and Rs. 400/- plus value
39

added tax (VAT ) per certificate for the issuance of certificate of origin, which does not seem to be high or a deterrent in using the scheme.29
5.5 Other Problems Other problems affecting utilization rates due to non-GSP factors include:
- High domestic production costs due to high cost of utilities (electricity, telecommunication, internal transport), high labour costs (comparatively higher than its South Asian counterparts) coupled with low productivity, high port charges and local taxes. High energy costs were identified as one of the main problems facing the export sectors, especially those which are energy intensive like ceramics and plastics
- lack of cargo space (mainly a problem for perishables such as fruits and vegetables and fisheries products)
- lack of finance and high local interest rates for restructuring and strengthening industries
- lack of marketing abroad due to exorbitant costs involved for exporters
- stringent health and safety standards/regulations mainly affecting food products (i.e.) tea and fish exports from Sri Lanka, and compliance with environmental requirements set by importing countries and international labour laws
- long lead times due to geographical distance away from the main markets
- less favourable preferential treatment provided by the EU and US for Sri Lankan products compared to other competing countries which have more favourable market access to the same markets under bilateral/regional preferential arrangements such as EBA, Cotonou Agreement, AGOA, CBI, etc. Recently this was addressed with the GSP-plus scheme, which gave Sri Lanka the same market access conditions to the EU market as LDCs under the EBA initiative. However, Sri Lanka still faces discrimination in the US market.30
29 http://www.doc.gov.lk 30 More than 70 countries enjoy generous trade preferences in the US market but comparable access is not extended to
South Asia, even to its LDCs members like Bangladesh, Maldives and Nepal (SWATEE, 2005).
40

6. Conclusion Sri Lanka has been a beneficiary of the EU and US GSP schemes since the
inception of the programme in the 1970s. However the usefulness of both schemes has been limited for a number of reasons. While in the case of the EU, the coverage of products under the scheme has been high, the utilization and utility rates have been low, limiting the usefulness of the scheme. This has been mainly due to the restrictive nature of the EU’s current rules of origin, which has effectively constrained the export of Sri Lanka’s main export, textiles and textile articles under the EU GSP scheme. On the other hand, the utilization rates are quite high under the US scheme, while the coverage and utility record low rates. Utilization of preferences does not seem to be an issue in the case of the US scheme given high rates recorded but the usefulness of the scheme is limited due to exclusion of sensitive products such as textiles and textile articles, which are the main exports from Sri Lanka to the US, accounting for 82 per cent of Sri Lanka’s total exports to the US. Consequently both the US and EU GS schemes have been ineffective in providing market access to Sri Lanka’s major export product. Nonetheless, the schemes have benefited many other export sectors but these sectors do not account for a substantial share of Sri Lanka’s total exports, except for plastic and rubber and precious stones, in the case of the EU, and plastic and rubber in the case of the US, which have benefited under the scheme.
In view of these constraints, one way to increase the real benefits of the US scheme is to improve the product coverage of the scheme to include products which are relevant to Sri Lanka’s export interest like textiles and textile articles, which are already covered under other non-reciprocal schemes such as AGOA. Product coverage is a not an issue in the case of the EU scheme with a high coverage rate of over 90 per cent. In the case of the EU, there is an obvious need to simplify its current rules of origin criteria and reduce the domestic value addition requirement to reflect the industrial capacity of the country for Sri Lanka to better utilize the scheme.31 This need for change has been duly acknowledged by granting derogations to LDCs such as Bangladesh, Nepal, Cambodia on a limited basis in the past and the EU’s Green Paper on the ‘Future or Rules of Origin in Preferential Trade Arrangements’ which came out recently. Regional cumulation extended to the SAARC region has not assisted greatly but has been useful to a limited extent. Further extension of this concept to include other regional groupings such as ASEAN coupled with simplification of rules of origin requirements and relaxation of the value addition criteria (i.e.) to 35 per cent, would improve the current low levels of utilization rates recorded by Sri Lanka. Such a development would be beneficial to Sri Lanka, namely the textile and clothing industry but ultimately depends on the part of the EU given the unilateral and autonomous nature of the GSP scheme. Awareness of the schemes, and administration and issuance of certificates do not pose as significant problems in the utilization of preferences though there is always room for
31 A closely linked issue is the lack of harmonization of requirements across various preferential schemes, which
impose additional burden on exporters who have to deal with different sets of conditions in exporting to different markets. However, the progress on harmonization has been limited over the 30 years and has been restricted to aspects such as certification, control, verification, sanctions. The situation is unlikely to change.
41

improvement (i.e.) to electronically process declaration forms as well as to educate exporters especially small and medium scale from outside the Western province on the schemes and existing benefits available, if they are not already being exploited. While it is important to address the above problems to better utilize the GSP schemes, it is equally important to address non-GSP related problems which affect exports in general, which relate to supply side capacities of a country. Inability to make use of preferences indicates the need to build supply side capacities to trade, an issue which has gained increasing recognition and attention in international policy circles. This is not surprising as providing market access alone is not sufficient for developing countries to benefit from increased market opportunities abroad. Improved market access should be accompanied by other measures (i.e.) trade related technical assistance if these preferences are to be exploited by the beneficiary countries.
42

References Breton, P. (2003), ‘Integrating the Least Developed Economies into the World Trading
System: The Current Impact of EU Preferences under Everything but Arms’: Journal of World Trade, 37,623-46.
Breton, P. and M. Manchin (2003), ‘Making EU Trade Agreements Work: The Role of
Rules of Origin’. Candau F., L. Fontagné, and S. Jean. (2004), ‘The Utilization Rate of Preferences in
the EU’, Paper presented at 7th Global Economic Analysis Conference, CEPII working paper.
Daily Mirror (2005), ‘JAAF lauds Govt., Europe for winning GSP + duty free access to
EU’, 7 July 2005. Daily Mirror (2005), ‘Lanka seeks fresh support for apparel from EU’, 24 February
2005. ECOSOC (2004), Trade and market access preferences – commitments, achievements,
challenges and prospects, High-Level Segment Preparatory Roundtable, Paper E, March 18.
EU (2006), Preferential Trade in the EU- Making Trade Policy work for Development.’,
Report on EU Market access of developing countries and the potential for preference erosion 2003-2005, Report from DG Trade of European Commission to the European Parliament.
EU (2005a), GSP: The new EU preferential market access system for developing
countries, Brussels, June 23. EU (2005b), The Rules of Origin in Preferential trade Agreements: Orientation for the
future, Brussels, March 16. EU (2004a), Developing countries, international trade and sustainable development: the
function of the Community’s generalized system of preferences (GSP) for the ten year period from 2006-2015, COM(2004) 461 FINAL, Brussels, 7.7.2004.
EU (2004b), The future of Rules of Origin in the Preferential Trade Agreements, Green
paper, COM(2003)787 final of 18 December 2003, Brussels, 24.8.2004. EU (2003), The European Community’s Rules of Origin for the Generalized System of
Preferences, A Guide for Users, European Commission. H.R.4680 (2006), ‘A Bill’, 109th Congress 2nd session, February 1, 2006.
43

H.R.886 (2005), ‘A Bill’, 109th Congress 1st session, February 17, 2005. Hoekman, B. ,W.Martin and C.P. Braga (2005) ‘Preference Erosion: The Terms of
the Debate’ in Trade, Doha and Development: A Window into the Issues, ed. R. Newfarmer, Washington, DC, World Bank.
Inama, S (2006), Erosion of trade preferences and Aid for Trade initiative: towards a
new paradigm?, FES Briefing Paper, January 2006. Inama, S (2003), ’Trade preferences and world trade organization negotiations on market
access’, Journal of World Trade 37(5): 959-976,2003. Jones, C. Vivian (2006), Generalized System of Preferences: Background and Renewal
Debate, CRS Report for Congress. Lippoldt, D. and P. Kowalski (2005), Trade Preference Erosion: Potential Economic
Impacts, OECD Trade Policy Working Paper No. 17, TD/TC/WP(2004)30/Final.
Low, P., R. Piermartini, and J. Richtering (2005), ‘Multilateral Solutions to Preference
Erosion’, Paper prepared for the International Symposium on Preference Erosion: Impacts and Policy Responses, Geneva, June 13-14, 2005.
Razi, Z(2003), ‘EU GSP: The Rules of Origin issue’, The Daily Star, Vol. 4 Num 123,
September 27, 2003. SAWTEE (2005), Making Trade Preferences Work for South Asian LDCs, Briefing
Paper, No.2, 2005. USTR, (2006), U.S. Generalized System of Preferences Guidebook, Office of the United
States Trade Representatives Executive Office of the President Washington, D.C., January 2006.
UNCTAD (2005a), Erosion of preferences foe the leased developed countries:
assessment of effects and mitigating options, TD/B/52/4, 4 August 2005. UNCTAD (2005b), UNCTAD GSP Newsletter, Number 7,
UNCTAD/DITC/TNCD/MISC/2005/6, November 2005. UNCTAD (2005), UNCTAD GSP Newsletter, Number 8,
UNCTAD/DITC/TNCD/Misc/2005/7, December 2005. UNCTAD (2003), Trade preferences for LDCs: An early assessment of benefits and
impossible improvement, UNCTAD/ITCD/TSB/2003/8. UNCTAD (2002), UNCTAD GSP Newsletter, Number 5, UNCTAD/ITCD/TSB/Misc.65,
February 2002.
44

UNCTAD (2001), Improving Market Acess for Least Developed Countries,
UNCTAD/DITC/TNCD/4, May 2001. UNCTAD (1999), Quantifying the benefits obtained by developing countries from the
Generalized System of Preferences, UNCTAD/ITCD/TSB/Misc.52, 7 October 1999.
Weeraratne, B. (2005), Labour Standards and International Trade: The case of EU GSP
Concessions to Sri Lanka, Institute of Policy Studies Working Paper No. 8. Wijmenga, P. and L. Fernando (2002), EC-Sri Lanka Joint Study on Sri Lanka Trade,
GreenTech Consultants Pvt. Ltd, Rotterdam. WTO (2004), Market Access Issues Related to Products of Export Interest Originating
from LDCs, WT/COMTD/LDC/W/35, 13 October 2004.
45

Appendices Appendix 1: List of Interviewees T.G. Ariyarathne Secretary General, Joint Apparel Association Forum Menike Chandrasiri Director, Macro Policy Division, Ministry of Industrial
Development Ajith Dias Subcommittee Chairman, Joint Apparel Association Forum D.M.P.B. Dissanayake General Manager, Jay Sea Foods Processing (Pvt) Ltd W.T. Ellawala Chairman, Society for Rubber in Sri Lanka Chanaka Ellawala Chairman, Sri Lanka Gem and Jewellery Association Robert R. Gabor Head of Economics and Commercial Affairs, Embassy of the USA H.D. Hemaratna Director General, Ministry of Plantation Industries, Sri Lanka Tea Board Stanley Jayawardhana Head of Trade Information and Economic Research,
National Chamber of Commerce of Sri Lanka Sidath Kumar Deputy Director of Commerce, Department of Commerce Ravi Kumarajeewa Exports Manager, Ceramic World Roshan Lyman Economic and Trade Advisor, Delegation of the
European Commission to Sri Lanka and the Maldives D.M. Rathanayake Deputy Director of Commerce, Department of Commerce Lalith Madappulli General Manager/Chief Executive Officer, Lanka Hiqu Ltd. Saman Maldeni Deputy Director, Sri Lanka Export Development Board Srilal Samarasekara Director, ORNA Fish Jagath C. Savanadasa Senior Consultant (Economic Affairs), Federation of Chambers of Commerce and Industry of Sri Lanka U. Sirisena Factory Manager, Aqua Packaging Ltd
46

M. Inthilam Sufiyan Deputy Director, Sri Lanka Export Development Board S.J. Thalagala Accounts Executive, Alankara SKR L.S.G. Thilakeratna Director Projects and Member Services, National Chamber of Exporters Aruni Weerasiri Asst. Manager Imports and Exports, Global Sports Lanka Sonali Wijeratha Deputy Director of Commerce, Department of Commerce
47

Appendix 2: Questionnaire
Questionnaire on the EU and US GSP scheme (Please highlight the relevant answer)
1. Company
Name:……………………………………………………………………………. 2. Name of Interviewee and
Title…………………………………………………………….
3. Contact Number……………………………………………………………………………
4. Please state the relevant HS code (at 6 digits) of your export product/s…………..
………………………………………………………………………………………………
5. Do you export to the EU and US? Please tick the boxes and indicate how much these markets account for your total export.
US ( per cent) EU ( per cent) Both ( per cent) 6. Are you aware of the GSP Scheme of the US and EU?
US scheme: Yes/No EU scheme: Yes/No
7. Are other exporters in your industry aware of the EU and US GSP schemes? US scheme: Most/some/few EU scheme: Most/some/few
8. Do you export under the US and EU GSP Scheme? US scheme: Yes/No EU scheme: Yes/No
9. If no, please state the reasons US: …………………………….………..………………………………………………….. EU:…………………………………………………………………………………………… 10. If yes, how long have you been exporting under the US and EU schemes?
US (month/year): E U(month/year):
11. What are the main constraints in exporting under the EU GSP scheme? Please tick the relevant boxes and/or state below other constraints which you have encountered in exporting under the scheme.
48

Restrictive rules of origin Low preferential duty
Product is not covered by the scheme
Administrative burden in obtaining and processing of certificate of origin (Form
A)
Lack of export capacity or supply
Quantitative restrictions (quotas) High health and safety standards
Others………………………………………………………………………………… …..
12. What are the main constraints in exporting under the US GSP scheme? Please tick the relevant boxes and/or state below other constraints which you have encountered in exporting under the scheme.
Restrictive rules of origin Low preferential duty
Product is not coverage by the scheme
Administrative burden of obtaining and processing of certificate of origin (Form
A)
Lack of export capacity or supply
Quantitative restrictions (quotas) High health and safety standards
Others. ………………………………………………………………………………… .
13. Are you aware of the EU GSP plus scheme? Yes/No 14. Are you now exporting more after July 2005 because of the EU GSP plus scheme?
Yes/No
15. If yes, why…………………………………………………………...
16. If no, why……………………………………………………………. 17. How long does it take you to process a certificate of origin Form A to qualify for
GSP preferences?................................................................................................. 18. Do you source inputs from abroad for export production? Yes/No 19. If yes, where do you source inputs for export production. Please list according to
their importance …………………………………………………………………………………………… 20. What per centage of your inputs are:
49

Imported: per cent Sourced domestically: per cent 21. Do you source inputs from SAARC countries for your exports to the EU market? Yes/No 22. If yes, from which SAARC countries? And how much per cent do they account of
total inputs imported ? ........................................................................ 23. Are you currently making use of regional cumulation for the SAARC region
allowed under the EU GSP scheme? Yes/No 24. If yes, how long have you been using this facility
for?............................................... 25. If no, please state the reason why you are not using this facility
………………………………………………………………………….………… 26. Do you use inputs from the EU/US in your manufacturing for re-export to the
EU/US? EU: Yes/No US: Yes/No
27. If no, please state the reasons………………….……………………………… ………………………………………………………………………………………. 28. Are you currently making use of the bilateral cumulation allowed under the EU
and US GSP scheme ? EU: Yes/No US: Yes/No 29. What are the domestic constraints, if any that are preventing you from utilizing
the EU/US GSP Scheme? Pls list………………………………………….. …………………………………………………………………………………........ 30. What are the constraints in the EU/US (ie non-tariff barriers) if any that are
preventing you from utilizing the EU/US GSP Scheme? Pls list EU:…………………………………………………………………………………… US:…………………………………………………………………………………… 31. Do you have any suggestions on how to improve the effectiveness of EU GSP
scheme? Please list and explain your suggestions
………………………………………………………………………………………
32. Do you have any suggestions on how to improve the effectiveness of the US GSP scheme? Please list and explain your suggestions
50

………………………………………………………………………………………
51