Embed Size (px)
Citation preview
Defense Threat Reduction Agency 8725 John J. Kingman Road, MS-6201
Fort Belvoir, VA 22060-6201
Utilization of ICU Data to Improve 30 and 60-Day HENRE Mortality Models, Revision 1
DISTRIBUTION A. Approved for public release; distribution is unlimited.
May 2017
HDTRA1-14-D-0003; 0005
Prepared by:
Applied Research Associates, Inc. 801 N. Quincy Street
Suite 700 Arlington, VA 22203
DTRA-TR-17-019 (R1)
TEC
HN
ICA
L R
EPO
RT

������������� ������ �� �����������
�� ��������������
�������������������������� ����������������
������������������� �������������������
������������
�������������������������������������������
�������������!����������������������������������
"�����������������������
�����������������
�#���������!�������$�����������
�%��������������������
���������������!&�����������������
� ��������
�������'���������
�"��������
���������
����������
� �����������������������������
������������ (�������� )����������
����������������
������������
�*�+,�-,��.-/�� "����������������������� � ���������
������������������������������������������� ������ ����������� ����� !�� ������������������" ���������������������!��#���������������"�� �������$������� � �������"� ������� ��� ��� ��������� � ������" ������������ ����!��#������������������������ ����� �������������� �������������������� ���� ������ ����������������������� ������ ����" ��������� ����������� ��� �������� ��� ������" �� %�� ������ �� %������" & �������� '� �(� ����� ��!����" %������� �� ��� ������ ���� )��� ����� �� *������+,-,./,���0"�1�23��������% !��'���# " �����1,."���������"4�111,1/.�,1�*������������������ # ���� ����#����� ����� ���������!�������� #"���������� �������5����� ���� ������ ������������#��� ������������������ �������������������� ��������! ���)67��������������
���������������������������������������&���������
%���������&���������������
�(��������������
�)������������������������
�,������'����������
�0�����1�������
�2���3��1������������
�����������!�������$���������
���������������
����������������������������4
� (���������������������������������
12-05-2017 Technical Report
Utilization of ICU Data to Improve 30 and 60-Day HENRE Mortality Models,Revision 1
HDTRA1-14-D-0003/0005
Bellman, JacobPirone, JasonCrary, DaveBeaulieu, Stephen
Applied Research Associates, Inc.801 N. Quincy Street, Suite 700Arlington, VA 22203
Nuclear Technologies Department, Attn: Dr. BlakeDefense Threat Reduction Agency8725 John J. Kingman Road, Mail Stop 6201Fort Belvoir, VA 22060-6201
DTRA J9NTSN
DTRA-TR-17-019 (R1)
DISTRIBUTION A. Approved for public release: distribution is unlimited.
This report presents the use of available ICU data to extend the capabilities of 30 and 60-day mortality models in the Health Effectsfrom Nuclear and Radiological Environments (HENRE) software. These models relate levels of molecular and cellular biomarkerscurrently modeled in HENRE to mortality using data from the medical literature. A small intestine injury model predicts theprobability of 30-day mortality after radiation and burn combined injuries using the biomarker citrulline, and a platelet reductionmodel predicts the probability of 60-day mortality after burn. These models have been developed to predict mortality of casualtieswith access to standard medical care. A review of the literature on the use of the neutrophil to lymphocyte ratio (NLR) as a biomarkerof inflammation and mortality is presented. The NLR may be used in future work to further extend the capabilities of the mortalitymodels in HENRE.
Acute Radiation Syndrome, Mortality, Burn Combined Injury, Lethality, Small Intestine, Ordinary Differential Equations Model,Thrombopoiesis, Granulopoiesis, Lymphopoiesis
U U U U 41
Dr. Paul Blake, Ph.D.
703-767-3433

UNIT CONVERSION TABLE
U.S. customary units to and from international units of measurement*
U.S. Customary Units Multiply by
International Units
Divide by†
Length/Area/Volume
inch (in) 2.54 × 10⁻² meter (m)
foot (ft) 3.048 × 10⁻¹ meter (m)
yard (yd) 9.144 × 10⁻¹ meter (m)
mile (mi, international) 1.609 344 × 103 meter (m)
mile (nmi, nautical, U.S.) 1.852 × 10³ meter (m)
barn (b) 1 × 10–28 square meter (m2)
gallon (gal, U.S. liquid) 3.785 412 × 10–3 cubic meter (m3)
cubic foot (ft3) 2.831 685 × 10–2 cubic meter (m3)
Mass/Density
pound (lb) 4.535 924 × 10–1 kilogram (kg)
atomic mass unit (AMU) 1.660 539 × 10–27 kilogram (kg)
pound-mass per cubic foot (lb ft–3) 1.601 846 × 101 kilogram per cubic meter (kg m–3)
Pound-force (lbf avoirdupois) 4.448 222 Newton (N)
Energy/Work/Power
electron volt (eV) 1.602 177 × 10–19 joule (J)
erg 1 × 10⁻⁷ joule (J)
kiloton (kT) (TNT equivalent) 4.184 × 10¹² joule (J)
British thermal unit (Btu) (thermochemical) 1.054 350 × 103 joule (J)
foot-pound-force (ft lbf) 1.355 818 joule (J)
calorie (cal) (thermochemical) 4.184 joule (J)
Pressure
atmosphere (atm) 1.013 250 × 105 pascal (Pa)
pound force per square inch (psi) 6.984 757 × 103 pascal (Pa)
Temperature
degree Fahrenheit (oF) [T(oF) − 32]/1.8 degree Celsius (oC)
degree Fahrenheit (oF) [T(oF) + 459.67]/1.8 kelvin (K)
Radiation
activity of radionuclides [curie (Ci)] 3.7 × 10¹⁰ per second (s–1‡)
air exposure [roentgen (R)] 2.579 760 × 10–4 coulomb per kilogram (C kg–1) absorbed dose (rad) 1 × 10⁻² joule per kilogram (J kg–1§)
equivalent and effective dose (rem) 1 × 10⁻² joule per kilogram (J kg–1**) *Specific details regarding the implementation of SI units may be viewed at http://www.bipm.org/en/si/. †Multiply the U.S. customary unit by the factor to get the international unit. Divide the international unit by the factor to get the U.S.
customary unit. ‡The special name for the SI unit of the activity of a radionuclide is the becquerel (Bq). (1 Bq = 1 s–1). §The special name for the SI unit of absorbed dose is the gray (Gy). (1 Gy = 1 J kg–1). **The special name for the SI unit of equivalent and effective dose is the sievert (Sv). (1 Sv = 1 J kg–1).

This page is intentionally left blank.

Table of ContentsTable of Contents . . . . . . . . . . . . . . . . . . . . . . . . . . . . . . . . . . . i
List of Figures . . . . . . . . . . . . . . . . . . . . . . . . . . . . . . . . . . . . . ii
List of Tables . . . . . . . . . . . . . . . . . . . . . . . . . . . . . . . . . . . . . iii
Acknowledgements . . . . . . . . . . . . . . . . . . . . . . . . . . . . . . . . . . iv
Executive Summary . . . . . . . . . . . . . . . . . . . . . . . . . . . . . . . . . 1
1 Introduction . . . . . . . . . . . . . . . . . . . . . . . . . . . . . . . . . . . . 2
2 Purpose . . . . . . . . . . . . . . . . . . . . . . . . . . . . . . . . . . . . . . . 4
3 Background . . . . . . . . . . . . . . . . . . . . . . . . . . . . . . . . . . . . 5
4 Methods . . . . . . . . . . . . . . . . . . . . . . . . . . . . . . . . . . . . . . 64.1 Small Intestine Damage as a Predictor of 30-Day Mortality . . . . . . . . . . 6
4.1.1 Background . . . . . . . . . . . . . . . . . . . . . . . . . . . . . . . . 64.1.2 30-Day Mortality . . . . . . . . . . . . . . . . . . . . . . . . . . . . . 9
4.2 Platelet Levels as a Predictor of 60-Day Mortality . . . . . . . . . . . . . . . 104.2.1 Background . . . . . . . . . . . . . . . . . . . . . . . . . . . . . . . . 104.2.2 60-Day Mortality . . . . . . . . . . . . . . . . . . . . . . . . . . . . . 13
4.3 Neutrophil to Lymphocyte Ratio . . . . . . . . . . . . . . . . . . . . . . . . 144.3.1 Background . . . . . . . . . . . . . . . . . . . . . . . . . . . . . . . . 144.3.2 NLR Studies . . . . . . . . . . . . . . . . . . . . . . . . . . . . . . . 15
5 Results . . . . . . . . . . . . . . . . . . . . . . . . . . . . . . . . . . . . . . . 21
6 Discussion . . . . . . . . . . . . . . . . . . . . . . . . . . . . . . . . . . . . . 23
7 Future Work . . . . . . . . . . . . . . . . . . . . . . . . . . . . . . . . . . . . 25
References . . . . . . . . . . . . . . . . . . . . . . . . . . . . . . . . . . . . . . . 26
8 Abbreviations, Acronyms and Symbols . . . . . . . . . . . . . . . . . . . . 31
Appendix A Small Intestine Model Update . . . . . . . . . . . . . . . . . . . 32
i

List of Figures1.1 Modeling capabilities of HENRE. . . . . . . . . . . . . . . . . . . . . . . . . . . 3
2.1 Mortality models based on small intestine and thrombocyte cell kinetics. . . . . 4
4.1 Small intestine cell kinetic model. . . . . . . . . . . . . . . . . . . . . . . . . . . 74.2 Small intestine combined injury example. . . . . . . . . . . . . . . . . . . . . . . 84.3 30-Day probability of mortality predicted from citrulline nadir. . . . . . . . . . . 94.4 Thrombopoiesis cell kinetic model. . . . . . . . . . . . . . . . . . . . . . . . . . 114.5 Platelet counts of a burn patient. . . . . . . . . . . . . . . . . . . . . . . . . . . 124.6 60-Day probability of mortality predicted from platelet nadir. . . . . . . . . . . 134.7 Interactions of tissue injury with physiological and immunological disturbances
that lead to post-injury morbidity and mortality (Valparaiso et al., 2015). . . . . 154.8 Activation of the inflammatory response in response to trauma, tissue damage,
and infection (Lord et al., 2014). . . . . . . . . . . . . . . . . . . . . . . . . . . 164.9 Receiver operating characteristic curve of NLR to predict mortality (Akilli et al.,
2014). . . . . . . . . . . . . . . . . . . . . . . . . . . . . . . . . . . . . . . . . . 174.10 Kaplan-Meier survival curves for NLR quartiles determined in Akilli et al., 2014. 184.11 Kaplan-Meier survival curves for 1-year mortality based on NLR quartiles deter-
mined in Salciccioli et al., 2015. . . . . . . . . . . . . . . . . . . . . . . . . . . . 194.12 ROC curves for (A) the NLR on hospital day 2 and (B) hospital day 5 (Dilektasli
et al., 2016). . . . . . . . . . . . . . . . . . . . . . . . . . . . . . . . . . . . . . . 194.13 Kaplan Meier survival curves for (A) the day 2 cutoff of 8.19 and (B) the day 2
cutoff of 7.92 (Dilektasli et al., 2016). . . . . . . . . . . . . . . . . . . . . . . . 20
5.1 Probability of 30-day mortality predicted by the SIMM. . . . . . . . . . . . . . 215.2 Probability of 60-day mortality predicted from platelet reduction. . . . . . . . . 22
6.1 Domain of applicability for the small intestine and platelet mortality models. . . 24
A.1 Small intestine combined injury villus response with updated burn parameters(Table A.1). . . . . . . . . . . . . . . . . . . . . . . . . . . . . . . . . . . . . . . 33
ii

List of TablesA.1 Biological descriptions, parameters and variables for burn response in the small
intestine mathematical model. . . . . . . . . . . . . . . . . . . . . . . . . . . . . 32
iii

AcknowledgementsThe authors of this modeling work acknowledge the technical developments by Dr. Olga
Smirnova, who dedicated years of research and modeling efforts to develop the original struc-ture for the cell kinetic models in this research, and the many experimentalists who collectedthe data that has been crucial for this modeling effort. We would also like to acknowledgeDr. John Gilstad and Dr. Glen Reeves for their invaluable feedback in reviewing this report.Finally, we gratefully acknowledge Dr. Paul Blake of DTRA/J9 for programmatic support.The work was performed under DTRA contract HDTRA1-14-D-0003; 005.
iv

Executive SummaryThis report presents models based on biomarker data associated with small intestine
epithelial kinetics and thrombopoiesis to predict mortality. These models improve the capa-bilities of the 30 and 60-day mortality models in HENRE by providing:
• The Small Intestine Mortality Model (SIMM) that uses small intestine epithelial cellkinetics and the amino acid biomarker, citrulline, to predict 30-day mortality. Thismodel predicts the probability of mortality of an individual receiving treatment afterbeing exposed to combined radiation and burn injury.
• The Platelet Attenuation Mortality Model (PAMM) that simulates thrombocyte cellkinetics to predict 60-day mortality. This model currently predicts the probability ofmortality of an individual receiving treatment after being exposed to a burn injury.Lethality of radiation and combined injuries is not yet predicted with this model,although this is a goal for the future.
This report also provides a comprehensive literature review of the neutrophil to lym-phocyte ratio (NLR), a biomarker of inflammatory response that describes the potentialpredictive power of the NLR for various health effects, including mortality. We will discussthe benefits of including an NLR-based mortality model with DTRA and, as appropriate,develop options for a future version of HENRE.
1

1 IntroductionApplied Research Associates (ARA) has been tasked by the Defense Threat ReductionAgency (DTRA) to support their mission to safeguard the United States against weaponsof mass destruction (WMD). ARA is supporting this effort by developing state-of-the-artmathematical models that predict health effects and provide risk assessment of individualsexposed to harmful environments produced by a nuclear weapon. These models are builtinto DTRA’s Health Effects from Nuclear and Radiological Environments (HENRE) model-ing software. A crucial capability of HENRE is to predict lethality of various combinationsof radiation, thermal, and blast insults.
In the event of an improvised nuclear device (IND) detonation, there would be a broadspectrum of casualties with various types of injuries. Probability of mortality for eachindividual will vary by the degree of exposure to radiation, burn and blast environmentsand the availability of medical treatment. In order to estimate mortality for this type ofscenario, ARA is developing models to estimate 48-hour, 30-day, and 60-day mortality, aswell as models to estimate serious injury as a function of time and exposure.
There are limitations for each of the mortality models currently in HENRE. For instance,the 30-day mortality model only accepts burn insults, and assumes the casualty receives notreatment following exposure (Stricklin, 2013a). The 60-day mortality model estimates theprobability of mortality following a combined radiation and burn insult (Stricklin, 2013b).When radiation is the only insult provided, this model predicts mortality based on age,gender and available medical treatment (Stricklin, 2016). However, when burn is included,this model does not consider individual demographic differences, and only predicts mortalityunder the assumption that medical treatment is unavailable. A comprehensive list of lethalitymodels in the latest version of HENRE are reviewed in detail in Oldson et al., 2015 andStricklin, 2015.
The majority of the models previously developed for HENRE have assumed that a casu-alty receives no treatment. In this report, ICU data is used to develop models representativeof casualties receiving standard care. The Small Intestine Mortality Model (SIMM) and thePlatelet Attenuation Mortality Model (PAMM), both introduced in this report, are shown inthe shaded cells of Figure 1.1. In this diagram, check marks represent available capabilitiesof HENRE, and empty squares represent scenarios that will be modeled in the future.
2

1
Radiation
Thermal Burn
Trauma
48-HourMortality
30-DayMortality
60-DayMortality
No Treatment
Radiation Small Intestine
Mortality Model
Thermal Burn
Small Intestine Mortality
Model
Platelet Attenuation
Mortality Model
Trauma
48-HourMortality
30-DayMortality
60-DayMortality
Standard Care
Figure 1.1: Modeling capabilities of HENRE.
3

2 PurposeTo improve the predictive capabilities of the mortality models in HENRE, we developedmodels to supplement the 30 and 60-day combined injury mortality models. The new versionof the 30-day lethality model (SIMM) couples the small intestine cell kinetics model witha biomarker (citrulline) to predict mortality due to the combined effects of radiation andthermal injury. The new version of the 60-day lethality model (PAMM) uses the thrombocytecell kinetic model to simulate a biomarker (platelets) to predict 60-day mortality as a functionof burn size. The new models (SIMM and PAMM) were developed using intensive care unit(ICU) patient data to represent the standard care scenario shown in Figure 1.1. Figure 2.1illustrates the overall structure of the two mortality models presented in this report.Models Outcomes
New Combined Injury Lethality Models
SIMM
PAMM
Small Intestine Cell Kinetic
Model
Citrulline Concentration Nadir
Probability of 30-Day
Mortality
Insults
Thrombocyte Cell Kinetic Model
Platelet Count Nadir
Burn Size (% TBSA)
Radiation Dose (Gy)
Burn Size (% TBSA)
Probability of 60-Day
Mortality
Figure 2.1: Mortality models based on small intestine and thrombocyte cell kinetics.
4

3 BackgroundExposure to a large dose of radiation in a short period of time (high dose rate) causes acuteradiation syndrome (ARS). Depending on the radiation dose, an individual may experiencethe hematopoietic acute radiation syndrome (H-ARS) or the gastrointestinal acute radiationsyndrome (GI-ARS) (reviewed in Maciàă I Garau et al., 2011). For acute radiation doseslarger than 1 Gray (Gy), damage to stem cell progenitors of hematopoietic cells weakensthe immune system and leaves the exposed individual susceptible to infection and bleeding.For radiation doses greater than 6 Gy, damage to small intestine epithelial clonogenic cellsleads to a reduction in small intestine epithelial lining. Because the epithelial lining providesan essential barrier for defense against bacterial invasion in the bloodstream, damage toepithelial cells can cause diarrhea, bacterial translocation, and sepsis. Due to the recoverytime of the different cell systems, these acute radiation sub-syndromes can remain life-threatening for up to 30 days in the case of GI-ARS, and up to 60 days for H-ARS.
Combinations of injuries from radiation, thermal and blast environments cause complexphysiological responses that can significantly complicate health risks. Animal studies havequantified the increased effects on the hematopoietic and gastrointestinal systems from com-bining thermal and blast-related injuries to irradiation (Kiang et al., 2014; Carter et al.,2016; Baker and Valeriote, 1968; Palmer et al., 2011). However, there is minimal humandata on combined injuries, making it difficult to develop models that directly predict mor-tality from combined injury scenarios. As an alternative approach, we have evaluated theliterature for biomarkers that we can model and use to predict mortality.
Clinical studies of ICU patients have assessed the prognostic power of various biologicalmeasurements as predictive biomarkers of mortality. In Piton et al., 2013, for instance, theamino acid citrulline was determined to be a predictive biomarker of 28-day mortality forcritically ill ICU patients. In addition to citrulline, other noteworthy biomarkers of mortalityinclude platelet levels (Vanderschueren et al., 2000; Strauss et al., 2002; Moreau et al., 2007;Marck et al., 2013; Guo et al., 2012; Akca et al., 2002) and the neutrophil-lymphocyte ratio(NLR) (Salciccioli et al., 2015; Akilli et al., 2014; Dilektasli et al., 2016). Biomarkers wereevaluated in this study and used to model probability of 30 and 60-day mortality.
5

4 Methods4.1 Small Intestine Damage as a Predictor of 30-Day
Mortality
4.1.1 BackgroundSmall intestine damage induced by radiation and burn injuries leads to the death of epithelialcells. Here we present pertinent data used to create our model of small intestine damage asa predictor of 30-day mortality.
There is limited human data on the small intestine response to radiation and burn.However, it has been well-established through animal studies that the primary effect ofradiation on the small intestine is the death of proliferating crypt cells (Lesher, 1967; Bondet al., 1965; Potten, 2004). Much less is known about small intestine epithelial responseto burn, but rodent studies have revealed that burns induce premature death of villus cellsand dampen crypt cell proliferation (Wolf et al., 1999; Carter et al., 2014; Jeschke et al.,2007). We have developed a cell kinetics model (see Figure 4.1) that predicts time-dependentproliferating crypt cell counts, maturing crypt cell counts, and villus cell counts followingradiation and burn (Bellman and Stricklin, 2016). Human data was available to parameterizeradiation response in this model, while normalized murine data was used to parameterizethe burn response (Bellman and Stricklin, 2016). More details of the model are provided inAppendix A.
The amino acid citrulline is produced in enterocytes in the small intestine. Accordingly,plasma citrulline concentration has been correlated with small intestine epithelial cell massin humans (Guoyao and Morris, 1998; Curis et al., 2005; Crenn et al., 2000; Jianfeng etal., 2005; Luo et al., 2007; Rhoads et al., 2005), and used as a biomarker of bacterialtranslocation, sepsis and death (Crenn et al., 2014 Wijnands et al., 2015; Su et al., 2015;Piton et al., 2010; Piton et al., 2013; Piton et al., 2011). Specifically, thresholds of 10 µmol/L(Piton et al., 2010) and 12.2 µmol/L (Piton et al., 2013) have been identified as statisticallysignificant predictors of 28-day mortality for ICU patients, compared to a normal citrullineconcentration range of 20-50 µmol/L (Pappas et al., 2002).
Low levels of citrulline can be indicative of bacterial translocation, a potentially lethalcondition that allows the passage of bacteria from the gastrointestinal tract to various organs(e.g. liver, kidney, spleen) and the bloodstream (Berg, 1999; Vaishnavi, 2013). Bacterialtranslocation can promote the progression of sepsis, especially in conjunction with a com-promised immune system. In order for bacterial translocation to occur, at least one of thefollowing three pathophysiological factors must be present: host immune deficiencies and im-munosuppression, disruption of ecologic GI equilibrium, and increased permeability of theintestinal mucosal barrier (Berg, 1999; Vaishnavi, 2013; Magnotti and Deitch, 2005; Deitch,1990; Gosain and Gamelli, 2005). The model in the present study focuses on increasedpermeability of the gut mucosal barrier due to a loss of small intestine epithelial cells.
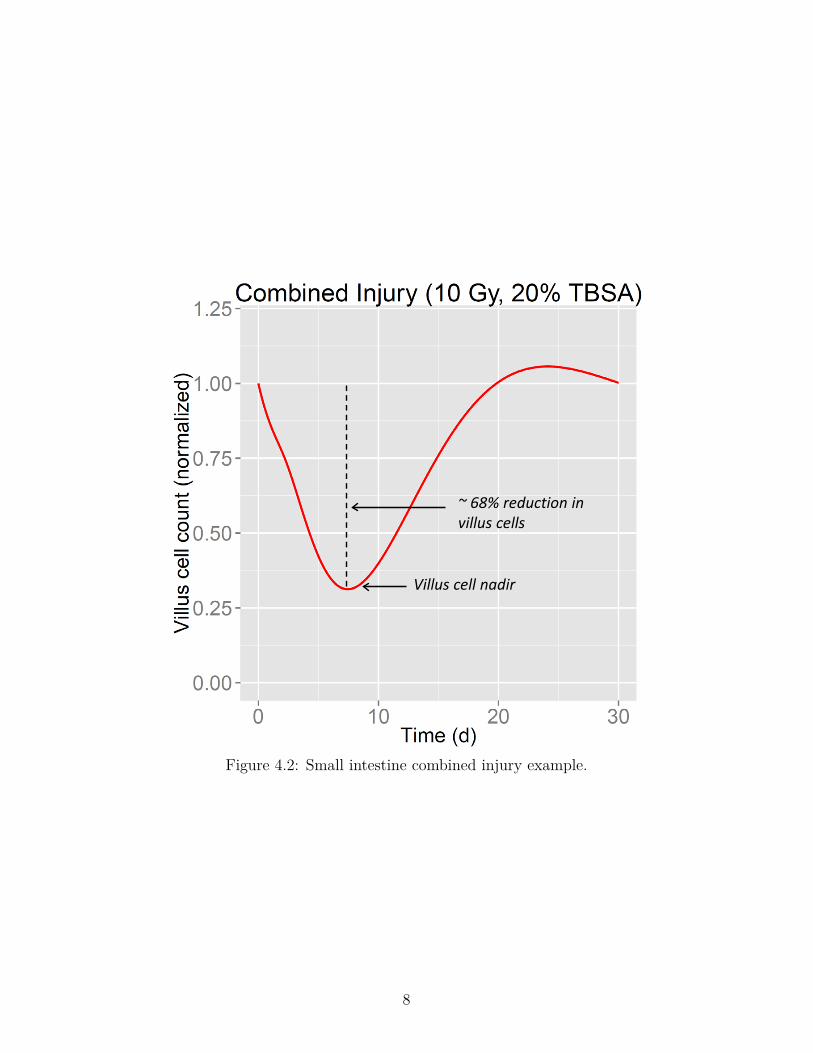
Figure 4.2 provides time-dependent villus cell counts (normalized to pre-insult levels)
6

Undamaged Proliferating Crypt Cells
Villus Cells Maturing Crypt Cells
Damaged Proliferating Crypt Cells
Cell Death
Crypt Lumen Villus
Repopulation regulation
Increases Rate
Increases Rate
Cell transitions
Transitions affected by radiation
Transitions affected by burn
Feedback Effects
Healthy cells
Cells affected by radiation
Key
Cell Proliferation
Early Cell
Death
Early Cell
Death
Cell Loss
Figure 4.1: Small intestine cell kinetic model.
predicted by the small intestine model in the event of a 10 Gy midline tissue (MLT) radiationdose combined with a 20% total body surface area (TBSA) burn. The figure identifies thevillus cell nadir, which can be used to quantify epithelial damage in the small intestine. Inthis case, an approximate 68% reduction in villus cells is predicted from the combined injuryapproximately 8 days after exposure.
7
Villus cell nadir
~ 68% reduction in villus cells
Figure 4.2: Small intestine combined injury example.
8
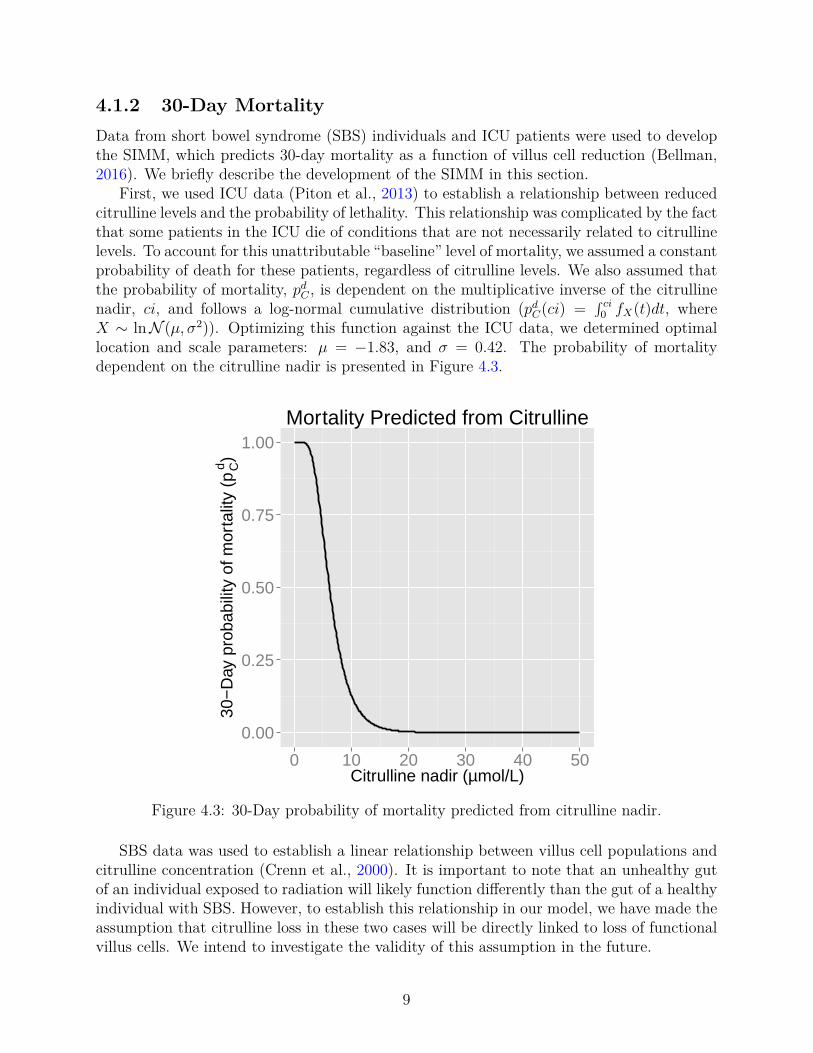
4.1.2 30-Day MortalityData from short bowel syndrome (SBS) individuals and ICU patients were used to developthe SIMM, which predicts 30-day mortality as a function of villus cell reduction (Bellman,2016). We briefly describe the development of the SIMM in this section.
First, we used ICU data (Piton et al., 2013) to establish a relationship between reducedcitrulline levels and the probability of lethality. This relationship was complicated by the factthat some patients in the ICU die of conditions that are not necessarily related to citrullinelevels. To account for this unattributable “baseline” level of mortality, we assumed a constantprobability of death for these patients, regardless of citrulline levels. We also assumed thatthe probability of mortality, pd
C , is dependent on the multiplicative inverse of the citrullinenadir, ci, and follows a log-normal cumulative distribution (pd
C(ci) =∫ ci
0 fX(t)dt, whereX ∼ lnN (µ, σ2)). Optimizing this function against the ICU data, we determined optimallocation and scale parameters: µ = −1.83, and σ = 0.42. The probability of mortalitydependent on the citrulline nadir is presented in Figure 4.3.
0.00
0.25
0.50
0.75
1.00
0 10 20 30 40 50Citrulline nadir (µmol/L)
30−
Day
pro
babi
lity
of m
orta
lity
(pCd)
Mortality Predicted from Citrulline
Figure 4.3: 30-Day probability of mortality predicted from citrulline nadir.
SBS data was used to establish a linear relationship between villus cell populations andcitrulline concentration (Crenn et al., 2000). It is important to note that an unhealthy gutof an individual exposed to radiation will likely function differently than the gut of a healthyindividual with SBS. However, to establish this relationship in our model, we have made theassumption that citrulline loss in these two cases will be directly linked to loss of functionalvillus cells. We intend to investigate the validity of this assumption in the future.
9

4.2 Platelet Levels as a Predictor of 60-Day Mortality
4.2.1 BackgroundBurn insults result in a drop in circulating platelet levels, which leads to thrombocytopenia,increasing the risk of hemorrhage, hypovolemic shock, sepsis, septic shock and death. Theminimum platelet count for burn patients, which is generally reached 3-4 days after ICUadmission, has been shown to be predictive of mortality (Vanderschueren et al., 2000; Akcaet al., 2002; Moreau et al., 2007; Guo et al., 2012; Marck et al., 2013). Following thedrop in platelets, cell count recovery overshoots normal values before a period of prolongedthrombocytosis. This trajectory has consistently been reported in burn patients as well asICU patients (Marck et al., 2013; Moreau et al., 2007).
Radiation injuries yield a different response for circulating platelets, where prolongedthromobcytopenia causes platelets to slowly reach a minimum about 30 days after exposurebefore returning to normal levels (Bond et al., 1965; Hempelmann et al., 1952; Howland etal., 1961; Mettler, 2001; Stavem et al., 1985). Mortality predicted from a radiation-inducednadir is not consistent with mortality predicted from a burn-induced nadir, so we decided toonly focus on burn in this study. In future studies, we will consider alternative biomarkers,such as the duration of thrombocytopenia, that may be more reliable in predicting mortalityfrom combined radiation and burn injuries.
Our model of thrombopoiesis (Figure 4.4) predicts time-dependent cell counts of mitoticprogenitors, megakaryocytes and platelets after burn insults (Wentz et al., 2014a; Wentzet al., 2014b; Wentz et al., 2015a; Wentz et al., 2015b) (Figure 4.4). A sample run of thethrombopoiesis model is provided in Figure 4.5, where circulating platelets respond andrecover from a 20% TBSA burn. In this case, an approximate 50% reduction in platelets ispredicted at the nadir, about four days following the insult.
10

Bone Marrow Circulating Blood
Undamaged Mitotic
Progenitors
Undamaged Immature
Megakaryocytes
Undamaged Mature
Megakaryocytes
Platelets
Normal Cell
Death
Cell Consumption
Repopulation regulation
Cell transitions
Transitions affected by burn
Feedback Effects
Healthy cells
Cells affected by radiation
Key
Cell Proliferation
Cell Loss
Decreases maturation rate
Figure 4.4: Thrombopoiesis cell kinetic model.
11
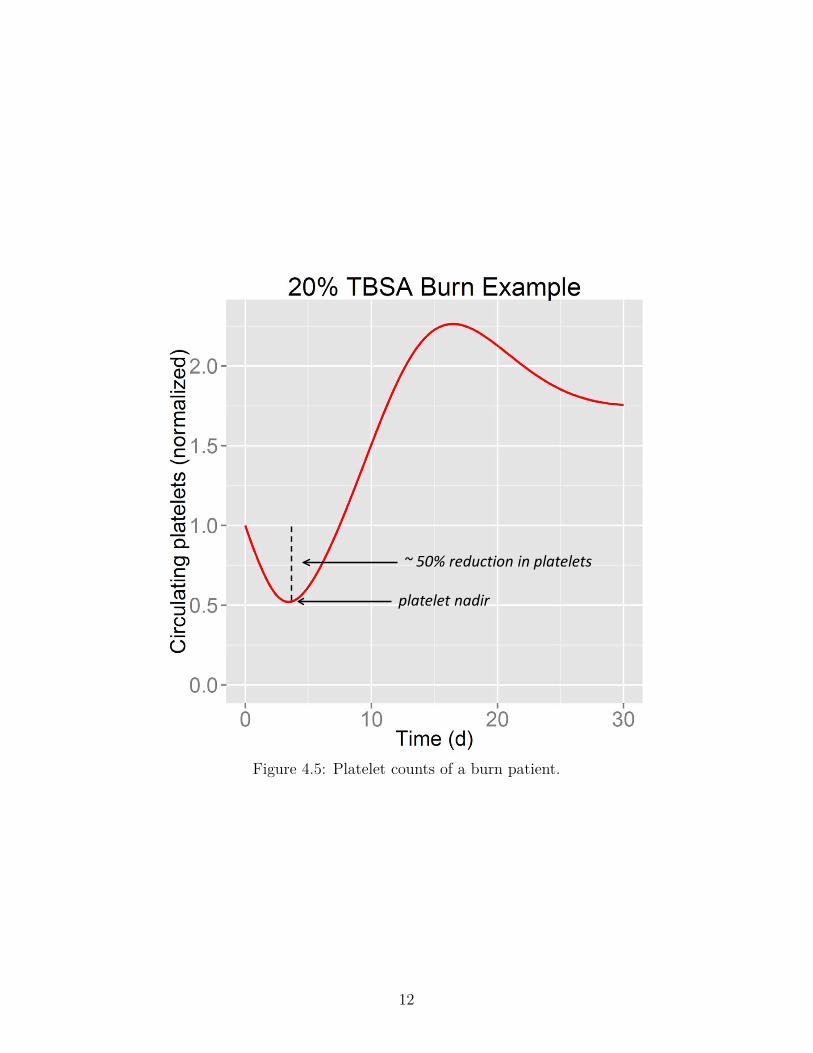
~ 50% reduction in platelets
platelet nadir
Figure 4.5: Platelet counts of a burn patient.
12

4.2.2 60-Day MortalityBurn ICU data was used in the development of the PAMM, which predicts the probabilityof 60-day mortality, pd
P , given the percent reduction in platelets at the nadir of the platelettrajectory, pr (Crary, 2016). Similar to the SIMM, pd
P follows a log-normal cumulativedistribution (pd
P (pr) =∫ pr
0 fX(t)dt, where X ∼ lnN (µ, σ2)), with the following location andscale parameters: µ = 1.83, and σ = 0.43. pd
P is provided in Figure 4.6. Due to datalimitations (see Crary, 2016 for details), and the fact that patients can survive after losingover 80% of their platelets (Guo et al., 2012), the fit of this data does not exceed a probabilityof mortality of 0.66. The impact of this limitation is discussed in more detail in Section 6with respect to the domain of applicability of the model.
0.0
0.2
0.4
0.6
0 25 50 75 100Platelet reduction (%)
60−
Day
pro
babi
lity
of m
orta
lity
(pPd )
Mortality Predicted from Platelets
Figure 4.6: 60-Day probability of mortality predicted from platelet nadir.
13
4.3 Neutrophil to Lymphocyte Ratio
4.3.1 BackgroundTissue damage from injury induces a localized inflammatory response involving componentsof the innate and adaptive immune systems. Soon after injury, the inflammatory responseresults in changes in the local vasculature that lead to vasodilation, increased vascular per-meability, and increased blood flow (Serhan et al., 2010). These changes contribute to therecruitment of leukocytes (white blood cells), plasma proteins, and fluids into the damagedtissue (Ashley et al., 2012). Normally, the perturbations in neutrophil and lymphocyte levelsthat occur following injury rapidly return to normal. Resolution of inflammation occurs byleucocyte removal by apoptosis or the lymphatic system (Serhan et al., 2010).
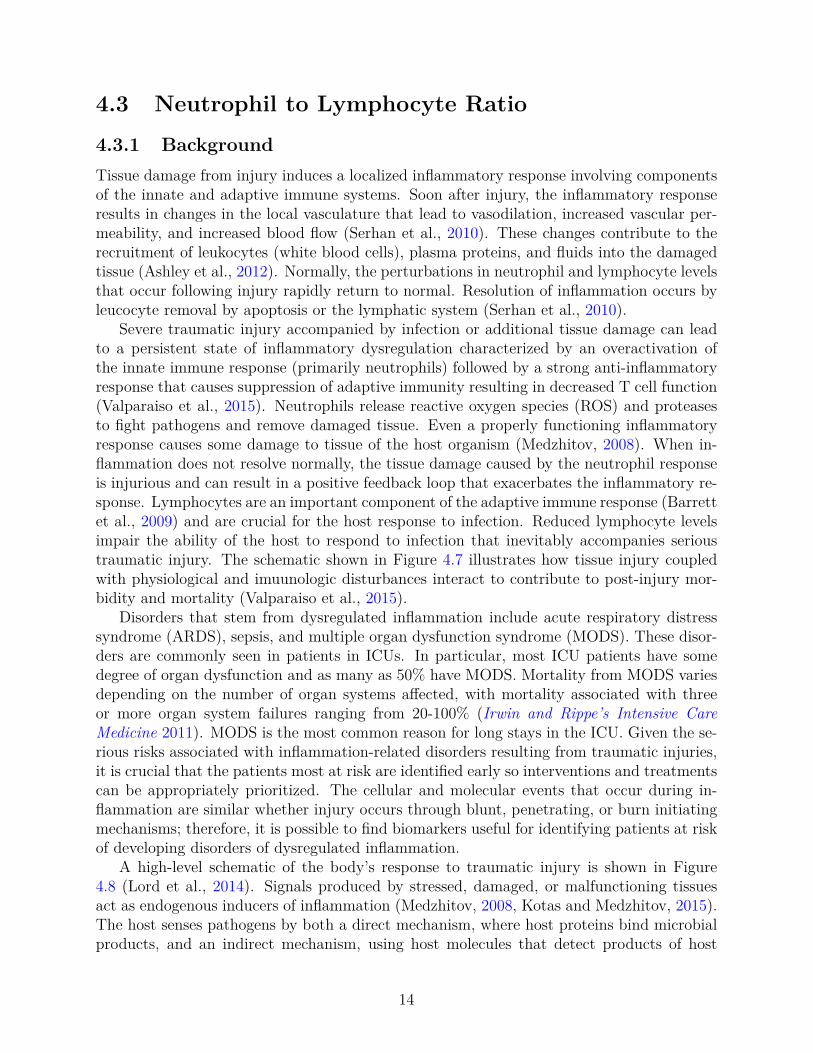
Severe traumatic injury accompanied by infection or additional tissue damage can leadto a persistent state of inflammatory dysregulation characterized by an overactivation ofthe innate immune response (primarily neutrophils) followed by a strong anti-inflammatoryresponse that causes suppression of adaptive immunity resulting in decreased T cell function(Valparaiso et al., 2015). Neutrophils release reactive oxygen species (ROS) and proteasesto fight pathogens and remove damaged tissue. Even a properly functioning inflammatoryresponse causes some damage to tissue of the host organism (Medzhitov, 2008). When in-flammation does not resolve normally, the tissue damage caused by the neutrophil responseis injurious and can result in a positive feedback loop that exacerbates the inflammatory re-sponse. Lymphocytes are an important component of the adaptive immune response (Barrettet al., 2009) and are crucial for the host response to infection. Reduced lymphocyte levelsimpair the ability of the host to respond to infection that inevitably accompanies serioustraumatic injury. The schematic shown in Figure 4.7 illustrates how tissue injury coupledwith physiological and imuunologic disturbances interact to contribute to post-injury mor-bidity and mortality (Valparaiso et al., 2015).
Disorders that stem from dysregulated inflammation include acute respiratory distresssyndrome (ARDS), sepsis, and multiple organ dysfunction syndrome (MODS). These disor-ders are commonly seen in patients in ICUs. In particular, most ICU patients have somedegree of organ dysfunction and as many as 50% have MODS. Mortality from MODS variesdepending on the number of organ systems affected, with mortality associated with threeor more organ system failures ranging from 20-100% (Irwin and Rippe’s Intensive CareMedicine 2011). MODS is the most common reason for long stays in the ICU. Given the se-rious risks associated with inflammation-related disorders resulting from traumatic injuries,it is crucial that the patients most at risk are identified early so interventions and treatmentscan be appropriately prioritized. The cellular and molecular events that occur during in-flammation are similar whether injury occurs through blunt, penetrating, or burn initiatingmechanisms; therefore, it is possible to find biomarkers useful for identifying patients at riskof developing disorders of dysregulated inflammation.
A high-level schematic of the body’s response to traumatic injury is shown in Figure4.8 (Lord et al., 2014). Signals produced by stressed, damaged, or malfunctioning tissuesact as endogenous inducers of inflammation (Medzhitov, 2008, Kotas and Medzhitov, 2015).The host senses pathogens by both a direct mechanism, where host proteins bind microbialproducts, and an indirect mechanism, using host molecules that detect products of host
14
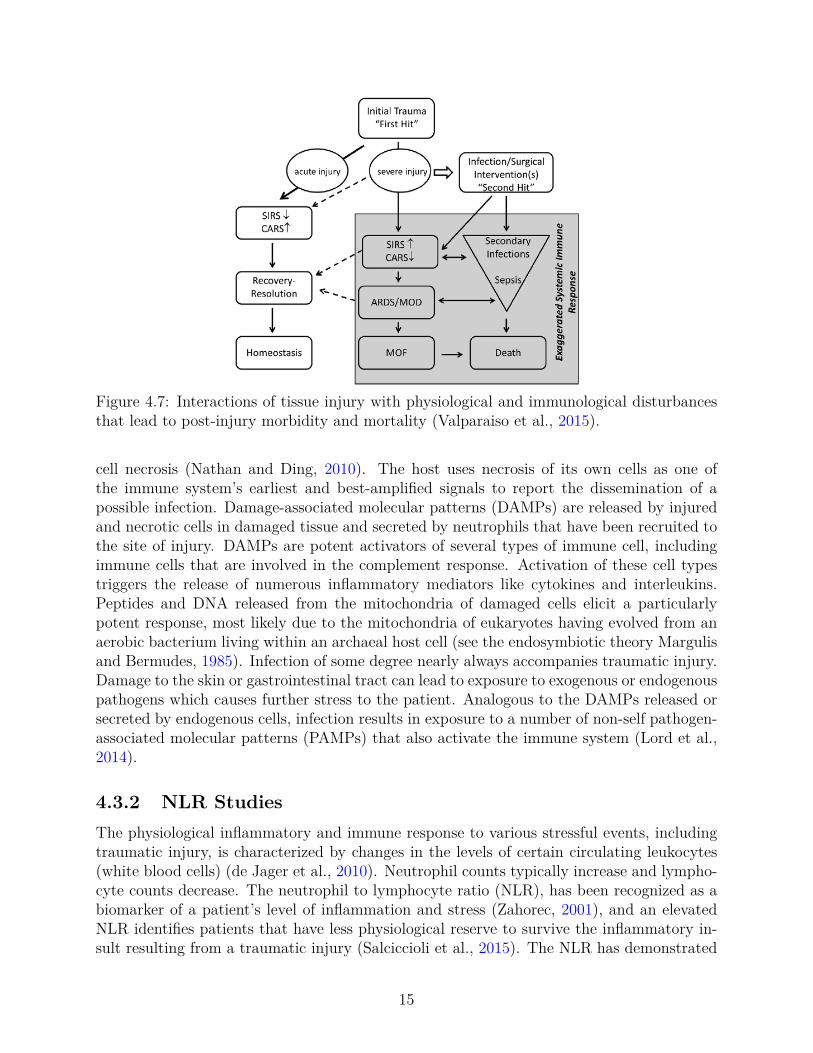
Figure 4.7: Interactions of tissue injury with physiological and immunological disturbancesthat lead to post-injury morbidity and mortality (Valparaiso et al., 2015).
cell necrosis (Nathan and Ding, 2010). The host uses necrosis of its own cells as one ofthe immune system’s earliest and best-amplified signals to report the dissemination of apossible infection. Damage-associated molecular patterns (DAMPs) are released by injuredand necrotic cells in damaged tissue and secreted by neutrophils that have been recruited tothe site of injury. DAMPs are potent activators of several types of immune cell, includingimmune cells that are involved in the complement response. Activation of these cell typestriggers the release of numerous inflammatory mediators like cytokines and interleukins.Peptides and DNA released from the mitochondria of damaged cells elicit a particularlypotent response, most likely due to the mitochondria of eukaryotes having evolved from anaerobic bacterium living within an archaeal host cell (see the endosymbiotic theory Margulisand Bermudes, 1985). Infection of some degree nearly always accompanies traumatic injury.Damage to the skin or gastrointestinal tract can lead to exposure to exogenous or endogenouspathogens which causes further stress to the patient. Analogous to the DAMPs released orsecreted by endogenous cells, infection results in exposure to a number of non-self pathogen-associated molecular patterns (PAMPs) that also activate the immune system (Lord et al.,2014).
4.3.2 NLR StudiesThe physiological inflammatory and immune response to various stressful events, includingtraumatic injury, is characterized by changes in the levels of certain circulating leukocytes(white blood cells) (de Jager et al., 2010). Neutrophil counts typically increase and lympho-cyte counts decrease. The neutrophil to lymphocyte ratio (NLR), has been recognized as abiomarker of a patient’s level of inflammation and stress (Zahorec, 2001), and an elevatedNLR identifies patients that have less physiological reserve to survive the inflammatory in-sult resulting from a traumatic injury (Salciccioli et al., 2015). The NLR has demonstrated
15

Figure 4.8: Activation of the inflammatory response in response to trauma, tissue damage,and infection (Lord et al., 2014).
prognostic value with trauma patients (Akilli et al., 2014, Dilektasli et al., 2016, Salciccioliet al., 2015), but has also been useful clinically with patients experiencing different typesof cancer (Absenger et al., 2013, Rimando et al., 2016, Salman et al., 2016), sepsis (Richéet al., 2015, Salciccioli et al., 2015, Liu et al., 2016), radiation poisoning (Hérodin et al.,2012, Blakely et al., 2014, Ossetrova et al., 2014, Valente et al., 2015), mushroom poisoning(Koylu et al., 2014), and suicide risk in patients with bipolar disorder (Ivković et al., 2016).The NLR is easily obtained using standard clinical measures, and is a fast and efficientmeans for identifying patients at high risk of potentially deadly complications. The prog-nostic value of the NLR is a consequence of the centrality and function of these cell types inthe inflammatory response.
The NLR has been used as an indicator for a large number of disease groups. Unfortu-nately, no manuscripts could be found associating NLR with mortality due solely to burnsor radiation exposure, the diseases most relevant for use with HENRE. Although, the NLRhas been reported as a biomarker of radiation exposure (The medical aspects of radiationincidents 2013), detailed information on the derivation of cuttoff values was not provided.Three manuscripts were found that discuss the prognostic value of the NLR in critically ill(Akilli et al., 2014, Salciccioli et al., 2015) or trauma patients (Dilektasli et al., 2016). Thereare no patients with burn or radiation injuries in these studies; however, the generality ofthe inflammatory response makes the reasonable assumption that the levels of the NLR as-sociated with mortality will be relevant for different disease groups. This claim is supported
16
by recent work that found very high correlations among the human transcriptional responsesof inflammation-related genes in response to trauma, burns, and endotoxemia (Seok et al.,2013).
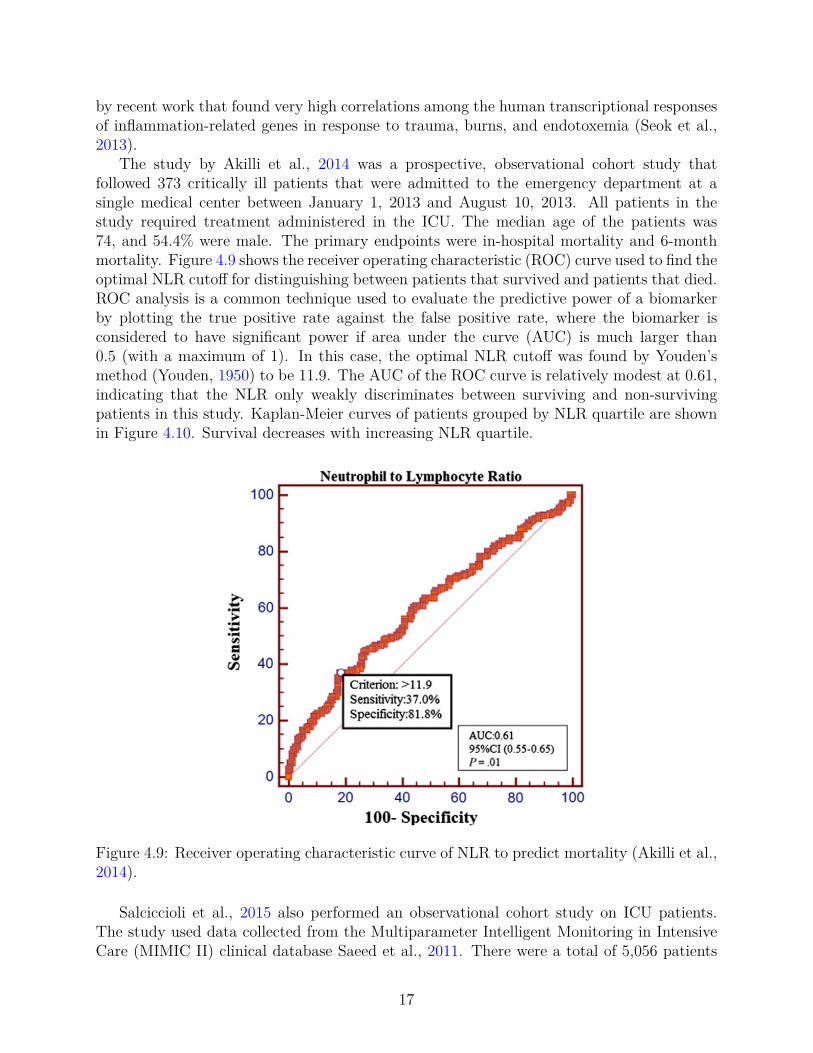
The study by Akilli et al., 2014 was a prospective, observational cohort study thatfollowed 373 critically ill patients that were admitted to the emergency department at asingle medical center between January 1, 2013 and August 10, 2013. All patients in thestudy required treatment administered in the ICU. The median age of the patients was74, and 54.4% were male. The primary endpoints were in-hospital mortality and 6-monthmortality. Figure 4.9 shows the receiver operating characteristic (ROC) curve used to find theoptimal NLR cutoff for distinguishing between patients that survived and patients that died.ROC analysis is a common technique used to evaluate the predictive power of a biomarkerby plotting the true positive rate against the false positive rate, where the biomarker isconsidered to have significant power if area under the curve (AUC) is much larger than0.5 (with a maximum of 1). In this case, the optimal NLR cutoff was found by Youden’smethod (Youden, 1950) to be 11.9. The AUC of the ROC curve is relatively modest at 0.61,indicating that the NLR only weakly discriminates between surviving and non-survivingpatients in this study. Kaplan-Meier curves of patients grouped by NLR quartile are shownin Figure 4.10. Survival decreases with increasing NLR quartile.
Figure 4.9: Receiver operating characteristic curve of NLR to predict mortality (Akilli et al.,2014).
Salciccioli et al., 2015 also performed an observational cohort study on ICU patients.The study used data collected from the Multiparameter Intelligent Monitoring in IntensiveCare (MIMIC II) clinical database Saeed et al., 2011. There were a total of 5,056 patients
17
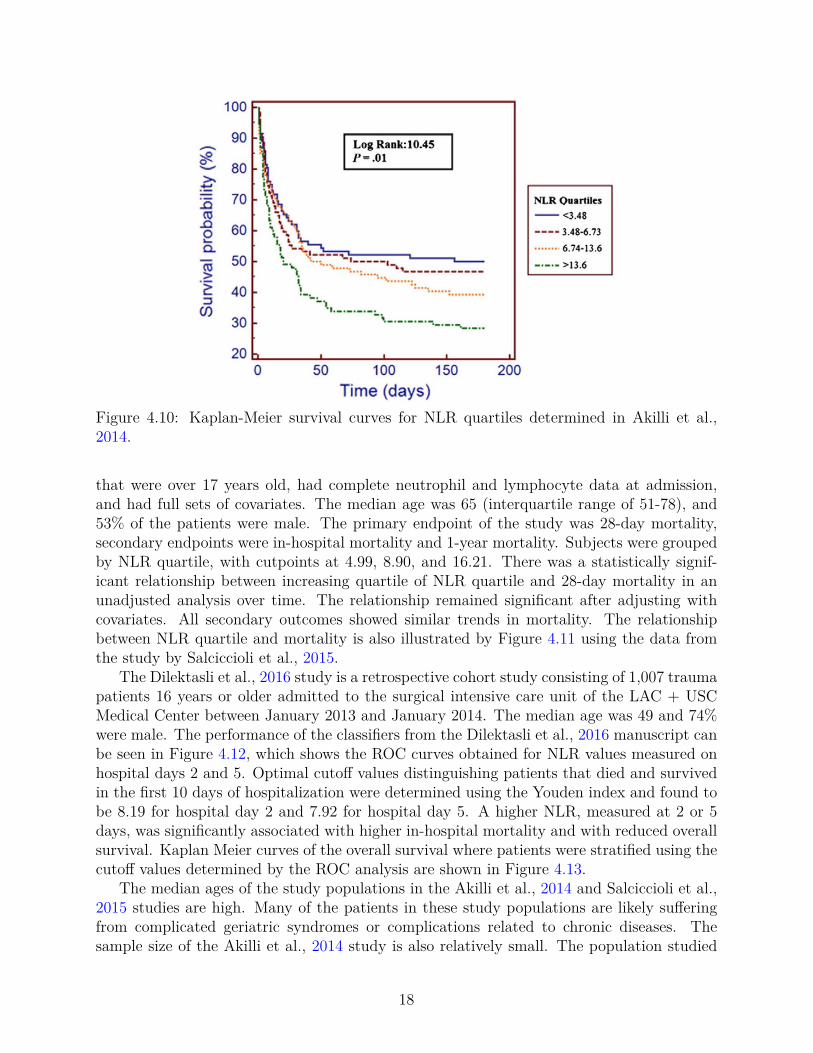
Figure 4.10: Kaplan-Meier survival curves for NLR quartiles determined in Akilli et al.,2014.
that were over 17 years old, had complete neutrophil and lymphocyte data at admission,and had full sets of covariates. The median age was 65 (interquartile range of 51-78), and53% of the patients were male. The primary endpoint of the study was 28-day mortality,secondary endpoints were in-hospital mortality and 1-year mortality. Subjects were groupedby NLR quartile, with cutpoints at 4.99, 8.90, and 16.21. There was a statistically signif-icant relationship between increasing quartile of NLR quartile and 28-day mortality in anunadjusted analysis over time. The relationship remained significant after adjusting withcovariates. All secondary outcomes showed similar trends in mortality. The relationshipbetween NLR quartile and mortality is also illustrated by Figure 4.11 using the data fromthe study by Salciccioli et al., 2015.
The Dilektasli et al., 2016 study is a retrospective cohort study consisting of 1,007 traumapatients 16 years or older admitted to the surgical intensive care unit of the LAC + USCMedical Center between January 2013 and January 2014. The median age was 49 and 74%were male. The performance of the classifiers from the Dilektasli et al., 2016 manuscript canbe seen in Figure 4.12, which shows the ROC curves obtained for NLR values measured onhospital days 2 and 5. Optimal cutoff values distinguishing patients that died and survivedin the first 10 days of hospitalization were determined using the Youden index and found tobe 8.19 for hospital day 2 and 7.92 for hospital day 5. A higher NLR, measured at 2 or 5days, was significantly associated with higher in-hospital mortality and with reduced overallsurvival. Kaplan Meier curves of the overall survival where patients were stratified using thecutoff values determined by the ROC analysis are shown in Figure 4.13.
The median ages of the study populations in the Akilli et al., 2014 and Salciccioli et al.,2015 studies are high. Many of the patients in these study populations are likely sufferingfrom complicated geriatric syndromes or complications related to chronic diseases. Thesample size of the Akilli et al., 2014 study is also relatively small. The population studied
18

Figure 4.11: Kaplan-Meier survival curves for 1-year mortality based on NLR quartilesdetermined in Salciccioli et al., 2015. Quartile cutpoints were NLR values of 4.99, 8.90, and16.21. Patients in the fourth NLR quartile (NLR>16.21 had the lowest survival probabilityat one year.
Figure 4.12: ROC curves for (A) the NLR on hospital day 2 and (B) hospital day 5 (Dilektasliet al., 2016).
in Dilektasli et al., 2016 consists primarily of patients admitted to the ICU for blunt orpenetrating injuries. The median age of the study population is considerably lower than
19

Figure 4.13: Kaplan Meier survival curves for (A) the day 2 cutoff of 8.19 and (B) the day2 cutoff of 7.92 (Dilektasli et al., 2016).
those of the Akilli et al., 2014 and Salciccioli et al., 2015 populations.HENRE contains models that describe the dynamics of lymphocyte and granulocyte
populations in response to burn or radiation injury (Wentz et al., 2014a, Wentz et al.,2015a). Currently, these models represent part of the complex biology associated withinflammation; for example, they do not simulate the processes associated with dysregulatedinflammation that would be expected to be seen on the pathway to ARDS, sepsis, andMODS. A quantitative model relating the NLR to mortality would not be useful at thistime given the limited biological domain of the existing models and state of the availabledata. However, this section demonstrates the centrality of the inflammatory process in thecombined-injury scenario and suggests directions for further development of the capabilitiesof HENRE.
20
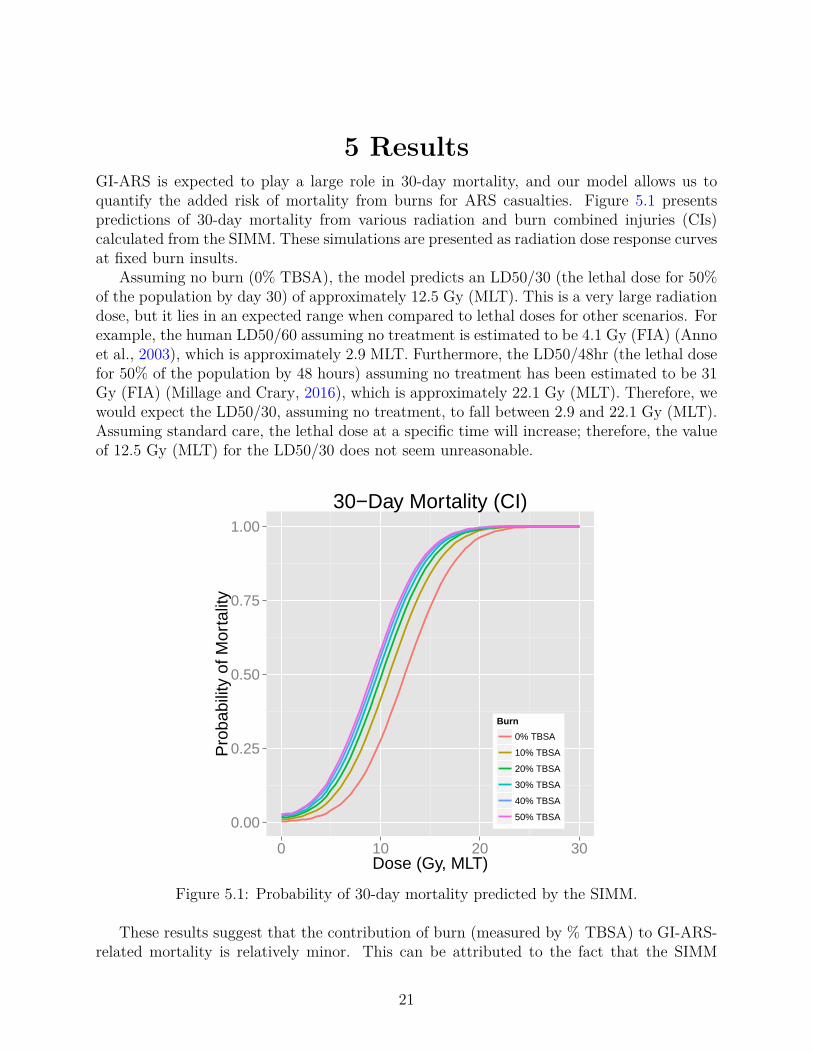
5 ResultsGI-ARS is expected to play a large role in 30-day mortality, and our model allows us toquantify the added risk of mortality from burns for ARS casualties. Figure 5.1 presentspredictions of 30-day mortality from various radiation and burn combined injuries (CIs)calculated from the SIMM. These simulations are presented as radiation dose response curvesat fixed burn insults.
Assuming no burn (0% TBSA), the model predicts an LD50/30 (the lethal dose for 50%of the population by day 30) of approximately 12.5 Gy (MLT). This is a very large radiationdose, but it lies in an expected range when compared to lethal doses for other scenarios. Forexample, the human LD50/60 assuming no treatment is estimated to be 4.1 Gy (FIA) (Annoet al., 2003), which is approximately 2.9 MLT. Furthermore, the LD50/48hr (the lethal dosefor 50% of the population by 48 hours) assuming no treatment has been estimated to be 31Gy (FIA) (Millage and Crary, 2016), which is approximately 22.1 Gy (MLT). Therefore, wewould expect the LD50/30, assuming no treatment, to fall between 2.9 and 22.1 Gy (MLT).Assuming standard care, the lethal dose at a specific time will increase; therefore, the valueof 12.5 Gy (MLT) for the LD50/30 does not seem unreasonable.
0.00
0.25
0.50
0.75
1.00
0 10 20 30Dose (Gy, MLT)
Pro
babi
lity
of M
orta
lity
Burn
0% TBSA
10% TBSA
20% TBSA
30% TBSA
40% TBSA
50% TBSA
30−Day Mortality (CI)
Figure 5.1: Probability of 30-day mortality predicted by the SIMM.
These results suggest that the contribution of burn (measured by % TBSA) to GI-ARS-related mortality is relatively minor. This can be attributed to the fact that the SIMM
21

only accounts for death from bacterial translocation through the breakdown of the smallintestine epithelial lining. Because the small intestine model was initially developed withthe intention of modeling ARS, the SIMM does not account for mortality from risks suchas wound infections associated with burns. Although bacterial translocation is a primarycontributing factor to death for GI-ARS, infection through burn wounds is particularly lethalwhen burns exceed 40% TBSA (Gang et al., 1999; Taneja et al., 2004). For this reason, weassume the model is appropriate for low to medium burn sizes.
Results from the PAMM are provided in Figure 5.2. The LA50/60 (the percentage ofthe body surface area burned in which 50% mortality results by day 60) from this model isapproximately 37%, which is slightly lower than the LA50/60 of 45% predicted by our 60-day mortality model assuming no treatment (Stricklin, 2013b). Although we would expectto see a higher LA50/60 here, it is encouraging to see that these numbers are fairly similar.We intend to revisit this inconsistency in future studies.
0.0
0.2
0.4
0.6
0 20 40 60 80Burn size (% TBSA)
60−
Day
Pro
babi
lity
of m
orta
lity
60−day Mortality from Burn
Figure 5.2: Probability of 60-day mortality predicted from platelet reduction.
Together, the SIMM and PAMM provide new capabilities for the 30 and 60-day mortal-ity models currently in HENRE. The SIMM is a first step in developing combined injurycapabilities of the 30-day mortality model, and the PAMM is a first step in predicting 60-daymortality with treatment.
22

6 DiscussionThe purpose of this study was to develop models that predict the probability of death ofan individual through the use of predictive biomarkers. We used relevant hospital patientdata to correlate biomarker levels with the probability of 30 and 60-day mortality. Modelsthat represent cell kinetics were used to predict biomarker levels, which in turn were usedto predict mortality.
The SIMM and PAMM continue to build capabilities in HENRE to predict mortalitydue to combined injury. These models consider the health outcomes for individuals receivingstandard care, and represent significant steps in capturing critical physiological processes andsystems affected by radiation and burn. The majority of the models previously developedfor this effort assume that no treatment is available. Previously the only model in HENREcapable of taking treatment into account was the 60-day mortality model. For this effort, wehave added standard care to the models of 60-day mortality from burns and 30-day mortalityfrom radiation and burns (see Figure 1.1).
As with all models, there are limitations to the SIMM and PAMM, most notably, withrespect to the domain of applicability suggested by the underlying data. The SIMM, forexample, predicts the probability of mortality due to GI-ARS for combined radiation andburn injury. However, we recognize that the model development was driven primarily bystudies on radiation effects. Burn complicates the physiological response considerably inways that are not currently well represented in the literature, particularly at lower radiationlevels. Consequently, we believe that the domain of applicability for the SIMM is limitedto radiation and burn environments as depicted in Figure 6.1 A. That is, the reliability ofthe model predictions is considered to be higher for environments in which the radiationexposure is relatively high, and the % TBSA is relatively low.
For the PAMM, we noted earlier that the maximum probability of mortality is 66%,even at 100% platelet loss. As with the SIMM, the PAMM is not considered reliable forsignificant burns (e.g., in excess of 60% TBSA) because it does not adequately capture thephysiological response and elevated risk for burns of this magnitude. However, we do notanticipate this limitation to have a large impact on casualty estimations for all scenarios.For instance, at Hiroshima and Nagasaki, over 90% of burns were flash burns, which rarelycover more than 50% TBSA (Oughterson and Warren, 1956). The domain of applicabilityfor the PAMM is represented by Figure 6.1 B.
Lastly, the research that we conducted on the NLR underscored the need for discussionregarding the utility of developing response-specific models that are not fully integratedwith other mechanistic models in HENRE. Although the research on NLR is promising,the benefit of adding an NLR model based on currently available data was considered tobe negligible. However, implicit in the discussion of inflammatory response physiology inSection 4.3, is the need to consider “next generation” capabilities for HENRE, namely, thefull integration of response-specific models within a framework that includes inflammationat its core. Ultimately, the fidelity of HENRE’s predictions on injury severity and thetime course of disease will depend on the ability of the model to integrate exposure andeffect through time for alternative treatment scenarios. The NLR discussion provides an
23

excellent basis for “next gen” discussions that will shape the future development of HENREcapabilities.
Domain of applicability for the 30-day mortality model
Radiation (Gy, MLT)
Bu
rn (
%TB
SA)
Applicable
70
6
Not Applicable
Small Intestine Mortality Model
Applicable
Not Applicable
Platelet Mortality Model
Bu
rn (
%TB
SA)
50
100
A B
Figure 6.1: Domain of applicability for the small intestine and platelet mortality models.
24

7 Future WorkWe continuously aim to improve each of the components of HENRE. The models in thisstudy were developed to expand the domain of applicability of the 30 and 60-day mortalitymodels in HENRE by accounting for treatment of individuals exposed to IND environments.We recognize that there are limitations for these models, and we aim to address these infuture studies. This can be accomplished by collecting more data to train and validate ourmodels, as well as performing sensitivity and uncertainty analysis to test the reliability ofthe models.
In order to continue to improve the capability of the mortality models in HENRE, we alsoaim to expand the context with which our mortality models are defined. For instance, themortality models only account for demographics (age and gender) in the context of 60-dayradiation-induced mortality. In the future, we would like to account for demographics in the30-day and 48-hour models. We would also like to account for demographic modificationsin the context of combined injury. In addition, we would like to assess the use of the NLRto predict mortality with the granulocyte and lymphocyte cell kinetic models built intoHENRE.
25

ReferencesAbsenger, G et al. (2013). “Preoperative neutrophil-to-lymphocyte ratio predicts clinical out-
come in patients with stage II and III colon cancer.” In: Anticancer Res 33.10, pp. 4591–4594.
Akca, S et al. (2002). “Time course of platelet counts in critically ill patients”. In: Criticalcare medicine 30.4, pp. 753–756.
Akilli, NB et al. (2014). “Prognostic importance of neutrophil-lymphocyte ratio in criticallyill patients: short- and long-term outcomes.” In: Am J Emerg Med 32.12, pp. 1476–1480.
Anno, G. H. et al. (2003). “Dose response relationships for acute ionizing-radiation lethality”.In: Health Physics 84.5, pp. 565–575.
Ashley, NT, ZM Weil, and RJ Nelson (2012). “Inflammation: Mechanisms, costs, and naturalvariation”. In: Annu. Rev. Ecol. Evol. Syst. 43.1, pp. 385–406.
Baker, DG and FA Valeriote (1968). “The effect of x-irradiation and thermal burn on theintestinal mucosa”. In: Canadian journal of physiology and pharmacology 46.3, pp. 533–536.
Barrett, KE et al. (2009). Ganong’s review of medical physiology (enhanced EB). McGraw-Hill Education.
Bellman, J (2016). Small intestine villus count decline as a prognostic indicator of 30-daymortality. Tech. rep. ARA/HS-TN-16-014. Applied Research Associates, Inc.
Bellman, J and D Stricklin (2016). A mathematical model of the human small intestinefollowing acute radiation and burn exposures. Tech. rep. DTRA-TR-16-059.
Berg, R (1999). “Bacterial translocation from the gastrointestinal tract”. In: Advances inExperimental Medicine and Biology 473, pp. 11–30.
Blakely, WF et al. (2014). “Further biodosimetry investigations using murine partial-bodyirradiation model.” In: Radiat Prot Dosimetry 159.1-4, pp. 46–51.
Bond, V, T Fliedner, and J Archambeau (1965). Mammalian radiation lethality. Academic.Carter, SR et al. (2016). “Neutrophil accumulation in the small intestine contributes to local
tissue destruction following combined radiation and burn injury:” in: Journal of BurnCare & Research 37.2, pp. 97–105.
Carter, Stewart R. et al. (2014). “Neutrophil Accumulation in the Small Intestine Contributesto Local Tissue Destruction Following Combined Radiation and Burn Injury”. In: Journalof Burn Care & Research 37.2, pp. 97–105.
Crary, D (2016). Platelet count decline as a prognostic indicator of lethality in ICU and burnpatients. Tech. rep. ARA/HS-TN-16-012.
Crenn, P et al. (2000). “Postabsorptive plasma citrulline concentration is a marker of ab-sorptive enterocyte mass and intestinal failure in humans”. In: Gastroenterology 119.6,pp. 1496–1505.
Crenn, P et al. (2014). “Plasma l-citrulline concentrations and its relationship with inflam-mation at the onset of septic shock: A pilot study”. In: Journal of Critical Care 29.2,315.e1–315.e6.
Curis, E et al. (2005). “Almost all about citrulline in mammals”. In: Amino Acids 29.3,pp. 177–205.
26
de Jager, CPC et al. (2010). “Lymphocytopenia and neutrophil-lymphocyte count ratiopredict bacteremia better than conventional infection markers in an emergency care unit.”In: Crit Care 14.5, R192.
Deitch, E (1990). “Bacterial translocation of the gut flora”. In: The Journal of Trauma 30,S184–189.
Dilektasli, E et al. (2016). “The prognostic value of neutrophil to lymphocyte ratio on mor-tality in critically Ill trauma patients.” In: J Trauma Acute Care Surg.
Gang, R et al. (1999). “Pseudomonas aeruginosa septicaemia in burns”. In: Burns 25.7,pp. 611–616.
Gosain, A and R Gamelli (2005). “Role of the gastrointestinal tract in burn sepsis”. In: TheJournal of Burn Care & Rehabilitation 26.1, pp. 85–91.
Guo, F et al. (2012). “Association of platelet counts decline and mortality in severely burntpatients”. In: Journal of Critical Care 27.5, 529.e1–529.e7.
Guoyao, WU and SM Morris (1998). “Arginine metabolism: nitric oxide and beyond”. In:Biochemical Journal 336.1, pp. 1–17.
Hempelmann, LH, H Lisco, and JG Hoffman (1952). “The acute radiation syndrome: astudy of nine cases and a review of the problem”. In: Annals of Internal Medicine 36.2:1,pp. 279–510.
Hérodin, F et al. (2012). “Assessment of total- and partial-body irradiation in a baboonmodel: preliminary results of a kinetic study including clinical, physical, and biologicalparameters.” In: Health Phys 103.2, pp. 143–149.
Howland, JW et al. (1961). Diagnosis and treatment of acute radiation injury: proceedingsof a scientific meeting jointly sponsored by the IAEA and the WHO, Geneva, 17-21 Oct1960. Columbia University Press, New York, pp. 11–26.
Irwin and Rippe’s Intensive Care Medicine (2011). Lippincott Williams & Wilki.Ivković, M et al. (2016). “Neutrophil-to-lymphocyte ratio predicting suicide risk in euthymic
patients with bipolar disorder: Moderatory effect of family history.” In: Compr Psychiatry66, pp. 87–95.
Jeschke, MG et al. (2007). “Gut Mucosal Homeostasis and Cellular Mediators after SevereThermal Trauma and the Effect of Insulin-Like Growth Factor-I in Combination withInsulin-Like Growth Factor Binding Protein-3”. In: Endocrinology 148.1, pp. 354–362.
Jianfeng, G et al. (2005). “Serum citrulline is a simple quantitative marker for small intestinalenterocytes mass and absorption function in short bowel patients”. In: Journal of SurgicalResearch 127.2, pp. 177–182.
Kiang, JG et al. (2014). “Ghrelin therapy improves survival after whole-body ionizing ir-radiation or combined with burn or wound: amelioration of leukocytopenia, thrombocy-topenia, splenomegaly, and bone marrow injury”. In: Oxidative Medicine and CellularLongevity 2014, pp. 1–12.
Kotas, ME and RMedzhitov (2015). “Homeostasis, inflammation, and disease susceptibility.”In: Cell 160 (5), pp. 816–827.
Koylu, R et al. (2014). “Influence of neutrophil/lymphocyte ratio on prognosis in mushroompoisoning”. In: Acta Med Mediterr 30, pp. 849–864.
Lesher, S (1967). “Compensatory Reactions in Intestinal Crypt Cells after 300 Roentgens ofCobalt-60 Gamma Irradiation”. In: Radiation Research 32.3, p. 510.
27
Liu, X et al. (2016). “Prognostic significance of neutrophil-to-lymphocyte ratio in patientswith sepsis: A prospective observational study.” In: Mediators Inflamm 2016.
Lord, JM et al. (2014). “The systemic immune response to trauma: an overview of patho-physiology and treatment.” In: Lancet (London, England) 384 (9952), pp. 1455–1465.
Luo, M et al. (2007). “Are plasma citrulline and glutamine biomarkers of intestinal absorptivefunction in patients with short bowel syndrome?” In: Journal of Parenteral and EnteralNutrition 31.1, pp. 1–7.
Maciàă I Garau, M, A Lucas Calduch, and EC López (2011). “Radiobiology of the acuteradiation syndrome.” In: Reports of practical oncology and radiotherapy : journal ofGreatpoland Cancer Center in Poznan and Polish Society of Radiation Oncology 16 (4),pp. 123–130.
Magnotti, L and E Deitch (2005). “Burns, bacterial translocation, gut barrier function, andfailure”. In: The Journal of Burn Care & Rehabilitation 26.5, pp. 383–391.
Marck, RE et al. (2013). “Time course of thrombocytes in burn patients and its predictivevalue for outcome”. In: Burns 39.4, pp. 714–722.
Margulis, L and D Bermudes (1985). “Symbiosis as a mechanism of evolution: status of cellsymbiosis theory.” In: Symbiosis (Philadelphia, Pa.) 1. Grant numbers: NGR 004-025,pp. 101–124.
Medzhitov, R (2008). “Origin and physiological roles of inflammation.” In: Nature 454 (7203),pp. 428–435.
Mettler, FA (2001). Medical management of radiation accidents. Ed. by IA Gusev, AKGuskova, and FA Mettler. 2nd. CRC Press, Boca Raton, pp. 211–222.
Millage, K and D Crary (2016). Probability of mortality within 48 hours from radiation alone.Tech. rep. DTRA-TR-16-011. Applied Research Associates, Inc.
Moreau, D et al. (2007). “Platelet count decline: an early prognostic marker in critically illpatients with prolonged ICU stays”. In: CHEST Journal 131.6, pp. 1735–1741.
Nathan, C and A Ding (2010). “Nonresolving inflammation.” In: Cell 140 (6), pp. 871–882.Oldson, D, J Wentz, and D Stricklin (2015). HENRE 2.0 technical reference manual. Tech.
rep. DTRA-TR-15-070.Ossetrova, NI et al. (2014). “Early-response biomarkers for assessment of radiation exposure
in a mouse total-body irradiation model.” In: Health Phys 106.6, pp. 772–786.Oughterson, A and S Warren (1956). Medical effects of the atomic bomb in Japan. (pp. 105).
National Nuclear Energy Series VIII-8. New York: McGraw-Hill.Palmer, JL et al. (2011). “Development of a combined radiation and burn injury model”. In:
Journal of Burn Care & Research 32.2, pp. 317–323.Pappas, PA et al. (2002). “Serum citrulline as a marker of acute cellular rejection for intesti-
nal transplantation”. In: Transplantation proceedings. Vol. 34. Elsevier, pp. 915–917.Piton, G et al. (2010). “Plasma citrulline kinetics and prognostic value in critically ill pa-
tients”. In: Intensive Care Medicine 36.4, pp. 702–706.Piton, G et al. (2011). “Acute intestinal failure in critically ill patients: is plasma citrulline
the right marker?” In: Intensive Care Medicine 37.6, pp. 911–917.Piton, G et al. (2013). “Enterocyte damage in critically ill patients is associated with shock
condition and 28-day mortality”. In: Critical Care Medicine 41.9, pp. 2169–2176.Potten, Christopher S. (2004). “Radiation, the ideal cytotoxic agent for studying the cell
biology of tissues such as the small intestine”. In: Radiation Research 161.2, pp. 123–136.
28

Rhoads, JM et al. (2005). “Serum citrulline levels correlate with enteral tolerance andbowel length in infants with short bowel syndrome”. In: The Journal of Pediatrics 146.4,pp. 542–547.
Riché, F et al. (2015). “Reversal of neutrophil-to-lymphocyte count ratio in early versus latedeath from septic shock.” In: Crit Care 19.
Rimando, J et al. (2016). “The pretreatment neutrophil/lymphocyte ratio is associated withall-cause mortality in black and white patients with non-metastatic breast cancer.” In:Front Oncol 6.
Saeed, M et al. (2011). “Multiparameter Intelligent Monitoring in Intensive Care II: A public-access intensive care unit database”. In: Critical Care Medicine 39.5, pp. 952–960.
Salciccioli, JD et al. (2015). “The association between the neutrophil-to-lymphocyte ratioand mortality in critical illness: an observational cohort study.” In: Crit Care 19.
Salman, T et al. (2016). “Prognostic value of the pretreatment neutrophil-to-lymphocyteratio and platelet-to-lymphocyte ratio for patients with neuroendocrine tumors: An IzmirOncology Group study.” In: Chemotherapy 61.6, pp. 281–286.
Seok, J et al. (2013). “Genomic responses in mouse models poorly mimic human inflamma-tory diseases.” In: Proceedings of the National Academy of Sciences of the United Statesof America 110 (9), pp. 3507–3512.
Serhan, CN, PA Ward, and DW Gilroy (2010). Fundamentals of inflammation. CambridgeUniversity Press.
Stavem, P et al. (1985). “Lethal acute gamma radiation accident at Kjeller, Norway: Reportof a case”. In: Acta Radiologica: Oncology 24.1, pp. 61–63.
Strauss, R et al. (2002). “Thrombocytopenia in patients in the medical intensive care unit:bleeding prevalence, transfusion requirements, and outcome”. In: Critical care medicine30.8, pp. 1765–1771.
Stricklin, D. (2013a). Estimation of radiation permeability parameters for integration intothe CSM model. Tech. rep. ARA/HS-TN-13-012. Applied Research Associates, Inc.
Stricklin, D (2013b). Estimation of radiation permeability parameters for integration into theCSM model. Tech. rep. ARA/HS-TN-13-012. Applied Research Associates, Inc.
— (2015). Selection of a dose response relationship for radiation lethality with treatment forimplementation in HENRE. Tech. rep. DTRA-TR-15-007. Applied Research Associates,Inc.
— (2016). Selection of demographic modification factors for radiation lethality for implemen-tation in HENRE: Age and Gender. Tech. rep. ARA/HS-TN-16-001. Applied ResearchAssociates, Inc.
Su, L et al. (2015). “Dynamic changes in amino acid concentration profiles in patients withsepsis”. In: PloS one 10.4, e0121933.
Taneja, N et al. (2004). “A prospective study of hospital-acquired infections in burn patientsat a tertiary care referral centre in North India”. In: Burns 30.7, pp. 665–669.
The medical aspects of radiation incidents (2013). Radiation Emergency Assistance Cen-ter/Training Site REACT/TS.
Vaishnavi, C (2013). “Translocation of gut flora and its role in sepsis”. In: Indian Journalof Medical Microbiology 31.4, pp. 334–342.
Valente, M et al. (2015). “Revisiting biomarkers of total-body and partial-body exposure ina baboon model of irradiation”. In: PLoS One 10.7, e0132194.
29

Valparaiso, A et al. (2015). “Modeling acute traumatic injury”. In: Journal of Surgical Re-search 194.1, pp. 220–232.
Vanderschueren, S et al. (2000). “Thrombocytopenia and prognosis in intensive care”. In:Critical care medicine 28.6, pp. 1871–1876.
Wentz, J, D Oldson, and D Stricklin (2014a). Mathematical models of human hematopoiesisfollowing acute radiation exposure. Tech. rep. DTRA01-03-D-0014. Applied Research As-sociates, Inc.
— (2014b). “Modeling the thrombopoietic effects of burn”. In: Letters in Biomathematics1.1, pp. 111–126.
— (2015a). Models of hematopoietic dynamics following burn for use in combined injurysimulations. Tech. rep. HDTRA1-14-D-003; 0005. Nuclear Survivability and ForensicsIntegrated Program Team.
Wentz, J. M. et al. (2015b). “Mathematical model of radiation effects on thrombopoiesis inrhesus macaques and humans”. In: Journal of Theoretical Biology 383, pp. 44–60.
Wijnands, K et al. (2015). “Arginine and citrulline and the immune response in sepsis”. In:Nutrients 7.3, pp. 1426–1463.
Wolf, SE et al. (1999). “Cutaneous burn increases apoptosis in the gut epithelium of mice”.In: Journal of the American College of Surgeons 188.1, pp. 10–16.
Youden, W (1950). “Index for rating diagnostic tests”. In: Cancer 3.1, pp. 32–35.Zahorec, R (2001). “Ratio of neutrophil to lymphocyte counts–rapid and simple parameter
of systemic inflammation and stress in critically ill.” In: Bratisl Lek Listy 102.1, pp. 5–14.
30

8 Abbreviations, Acronyms and Symbols
ARA Applied Research Associates, Inc.ARDS Acute respiratory distress syndromeARS Acute radiation syndromeAUC Area under the curveCI Combined injuryd DaysDAMP Damage-associated molecular patternDTRA Defense Threat Reduction AgencyGI-ARS Gastrointestinal acute radiation syndromeGy GrayH-ARS Hematopoietic acute radiation syndromeHENRE Health Effects from Nuclear and Radiological EnvironmentsICU Intensive care unitIND Improvised nuclear deviceMLT Midline tissueMIMIC Multiparameter Intelligent Monitoring in Intensive CareMODS Multiple organ dysfunction syndromeNLR Neutrophil:lymphocyte ratioPAMP Pathogen-associated molecular patternPAMM Platelet Attenuation Mortality ModelROC Receiver operating characteristicROS Reactive oxygen speciesSBS Short bowel syndromeSIMM Small Intestine Mortality ModelWMD Weapons of mass destruction% TBSA Percent of total body surface area
31
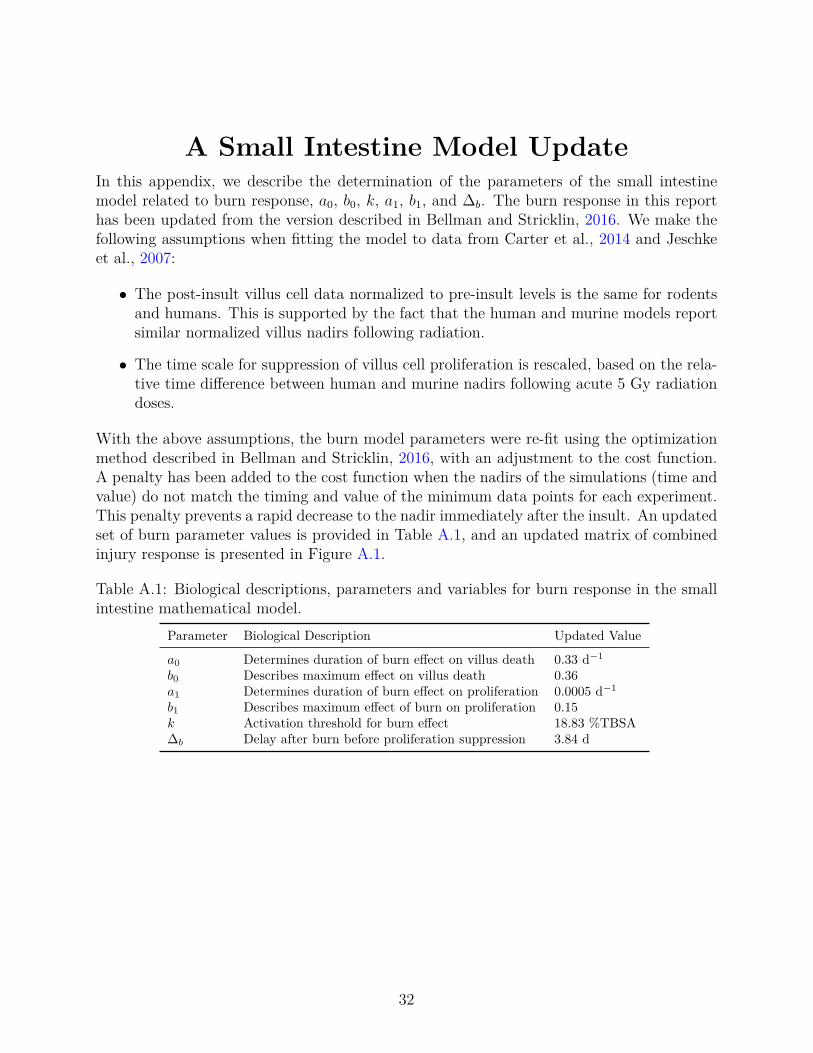
A Small Intestine Model UpdateIn this appendix, we describe the determination of the parameters of the small intestinemodel related to burn response, a0, b0, k, a1, b1, and ∆b. The burn response in this reporthas been updated from the version described in Bellman and Stricklin, 2016. We make thefollowing assumptions when fitting the model to data from Carter et al., 2014 and Jeschkeet al., 2007:
• The post-insult villus cell data normalized to pre-insult levels is the same for rodentsand humans. This is supported by the fact that the human and murine models reportsimilar normalized villus nadirs following radiation.
• The time scale for suppression of villus cell proliferation is rescaled, based on the rela-tive time difference between human and murine nadirs following acute 5 Gy radiationdoses.
With the above assumptions, the burn model parameters were re-fit using the optimizationmethod described in Bellman and Stricklin, 2016, with an adjustment to the cost function.A penalty has been added to the cost function when the nadirs of the simulations (time andvalue) do not match the timing and value of the minimum data points for each experiment.This penalty prevents a rapid decrease to the nadir immediately after the insult. An updatedset of burn parameter values is provided in Table A.1, and an updated matrix of combinedinjury response is presented in Figure A.1.
Table A.1: Biological descriptions, parameters and variables for burn response in the smallintestine mathematical model.
Parameter Biological Description Updated Value
a0 Determines duration of burn effect on villus death 0.33 d−1
b0 Describes maximum effect on villus death 0.36a1 Determines duration of burn effect on proliferation 0.0005 d−1
b1 Describes maximum effect of burn on proliferation 0.15k Activation threshold for burn effect 18.83 %TBSA∆b Delay after burn before proliferation suppression 3.84 d
32

0.6
0.7
0.8
0.9
1.0
0 10 20 30 40Time after insults (days)
Cel
ls p
er c
olum
n (n
orm
aliz
ed)
Villus cells (0 Gy)
0.50
0.75
1.00
0 10 20 30 40Time after insults (days)
Cel
ls p
er c
olum
n (n
orm
aliz
ed)
Villus cells (7.5 Gy)
0.25
0.50
0.75
1.00
1.25
0 10 20 30 40Time after insults (days)
Cel
ls p
er c
olum
n (n
orm
aliz
ed)
Villus cells (15 Gy)
0.6
0.7
0.8
0.9
1.0
0 10 20 30 40Time after insults (days)
Cel
ls p
er c
olum
n (n
orm
aliz
ed)
Villus cells (2.5 Gy)
0.25
0.50
0.75
1.00
1.25
0 10 20 30 40Time after insults (days)
Cel
ls p
er c
olum
n (n
orm
aliz
ed)
Villus cells (10 Gy)
0.5
1.0
0 10 20 30 40Time after insults (days)
Cel
ls p
er c
olum
n (n
orm
aliz
ed)
Villus cells (17.5 Gy)
0.6
0.8
1.0
0 10 20 30 40Time after insults (days)
Cel
ls p
er c
olum
n (n
orm
aliz
ed)
Burn
0% TBSA
20% TBSA
40% TBSA
60% TBSA
80% TBSA
Villus cells (5 Gy)
0.25
0.50
0.75
1.00
1.25
0 10 20 30 40Time after insults (days)
Cel
ls p
er c
olum
n (n
orm
aliz
ed)
Villus cells (12.5 Gy)
0.5
1.0
0 10 20 30 40Time after insults (days)
Cel
ls p
er c
olum
n (n
orm
aliz
ed)
Villus cells (20 Gy)
Figure A.1: Small intestine combined injury villus response with updated burn parameters(Table A.1).
33