Embed Size (px)
Citation preview

Copyright © 2013 Quintiles
Joint Analysis of Multiple Data Types in Electronic
Health Records
Joseph E. Lucas, Ph. D.
2
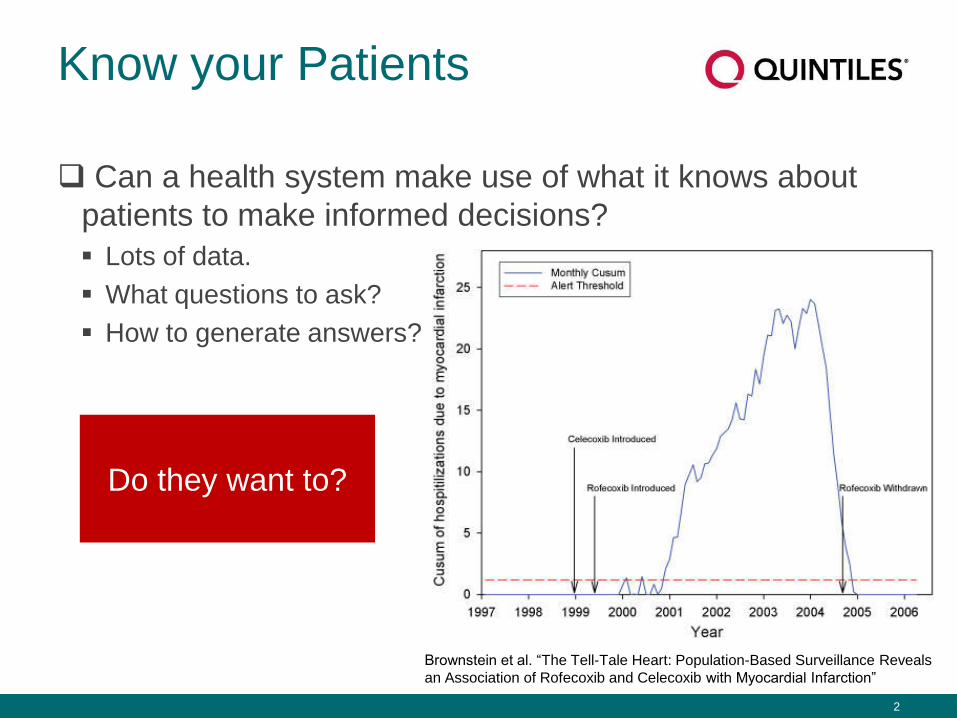
Know your Patients
Can a health system make use of what it knows about
patients to make informed decisions?
Lots of data.
What questions to ask?
How to generate answers?
Do they want to?
Brownstein et al. “The Tell-Tale Heart: Population-Based Surveillance Reveals
an Association of Rofecoxib and Celecoxib with Myocardial Infarction”
3
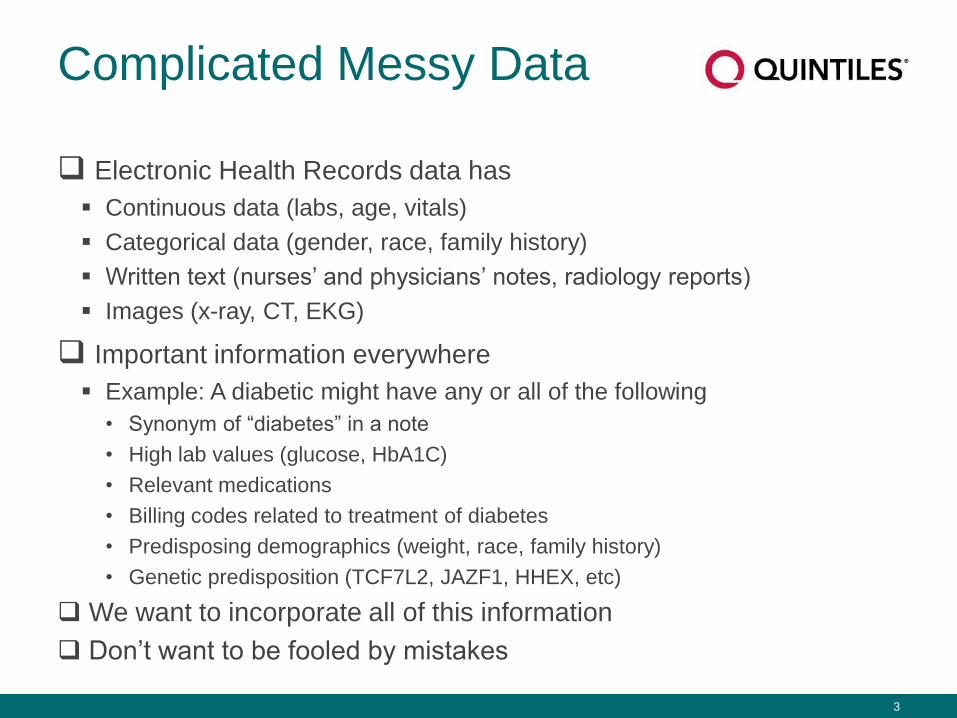
Complicated Messy Data
Electronic Health Records data has
Continuous data (labs, age, vitals)
Categorical data (gender, race, family history)
Written text (nurses’ and physicians’ notes, radiology reports)
Images (x-ray, CT, EKG)
Important information everywhere
Example: A diabetic might have any or all of the following
• Synonym of “diabetes” in a note
• High lab values (glucose, HbA1C)
• Relevant medications
• Billing codes related to treatment of diabetes
• Predisposing demographics (weight, race, family history)
• Genetic predisposition (TCF7L2, JAZF1, HHEX, etc)
We want to incorporate all of this information
Don’t want to be fooled by mistakes
4
Approach
Automated “Patients like me”
Create groups of homogeneous patients
This allows:
Automated generation of differential diagnosis
Novel comparative effectiveness studies
Listing of treatment options
Identification of Adverse drug events
Estimation of disease progression and prognosis
Assessment clinical utility of novel lab tests
Predict probable patient type from other data
Group patients through time
5
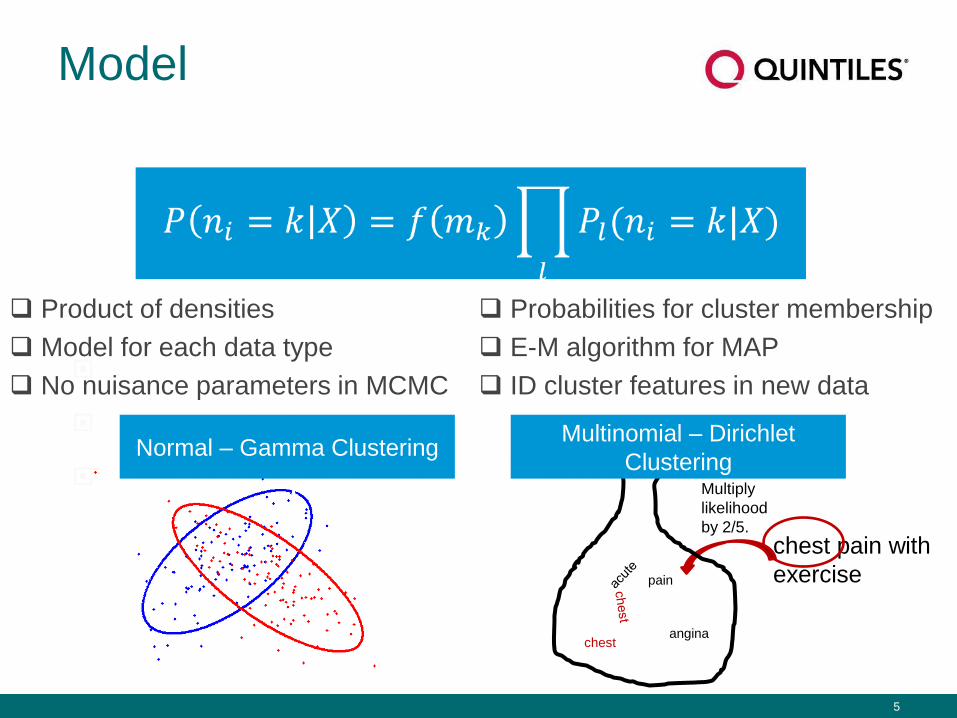
Model
Product of densities
Model for each data type
No nuisance parameters in MCMC
Probabilities for cluster membership
E-M algorithm for MAP
ID cluster features in new data
angina chest
pain
chest pain with
exercise
Multiply
likelihood
by 2/5.
Normal – Gamma Clustering Multinomial – Dirichlet
Clustering
6
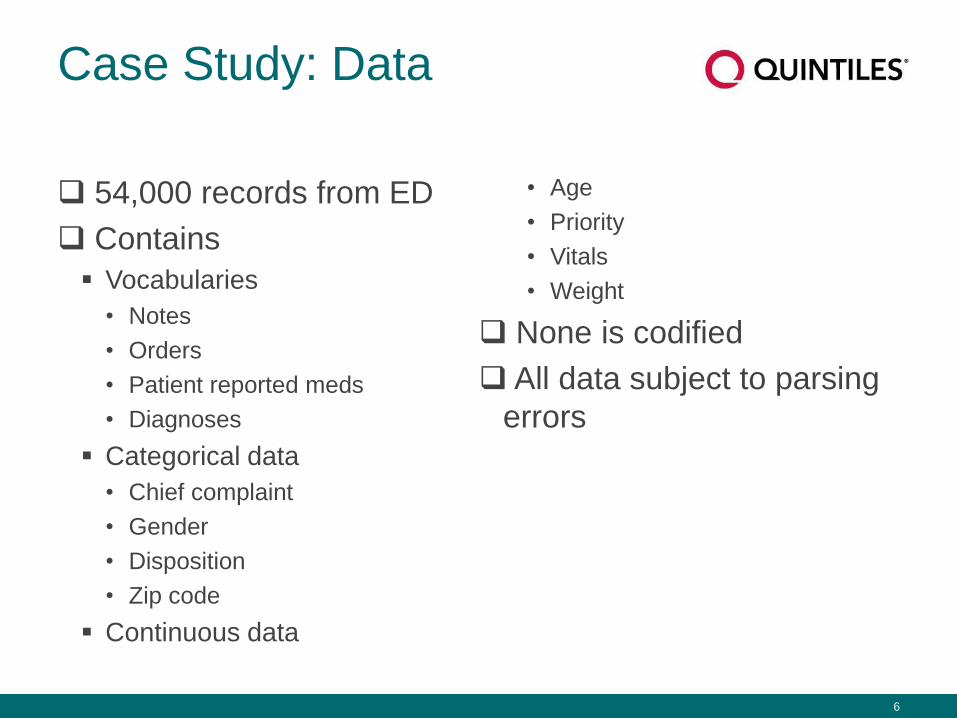
Case Study: Data
54,000 records from ED
Contains
Vocabularies
• Notes
• Orders
• Patient reported meds
• Diagnoses
Categorical data
• Chief complaint
• Gender
• Disposition
• Zip code
Continuous data
• Age
• Priority
• Vitals
• Weight
None is codified
All data subject to parsing
errors

7
Messy
weakness/aching/hea
daches
weakness/discomfort
weakness/dizziness
weakness/dizziness/re
cent
weakness/faintness/c
ongestion
weakness/fatigue
weakness/flaccid
weakness/heaviness
weakness/numbness
weakness/pain
weakness/shaking
weakness/tingling
weakness;
weaknessambulatory
weaknesscoughfeverl
wbswent
weaknesscoughing
weaknessdiahrrea
weaknessdizziness
weaknesses
weaknessfalling
weaknessfatigue
weaknessn\aloc
weaknessper
weaknesss
weaknesssob
weaknesssore
weaknessunstable
weaknessvison
weaknessx
weaknss
Over 50,000 unique “words”
with no copy editing. How to
clean up mistakes?
8
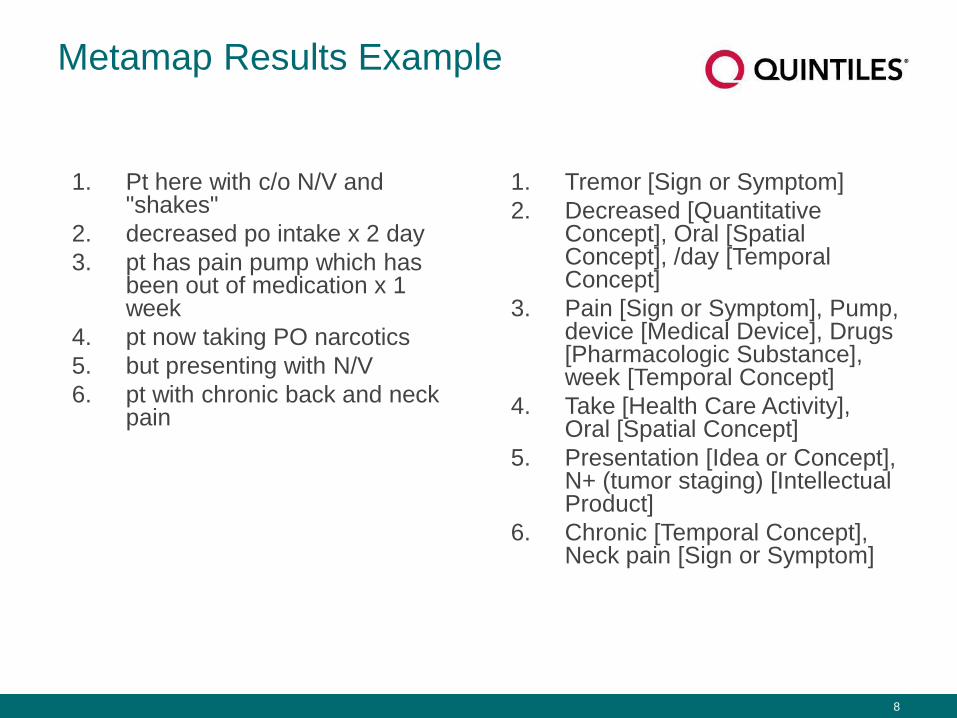
Metamap Results Example
1. Pt here with c/o N/V and "shakes"
2. decreased po intake x 2 day
3. pt has pain pump which has been out of medication x 1 week
4. pt now taking PO narcotics
5. but presenting with N/V
6. pt with chronic back and neck pain
1. Tremor [Sign or Symptom]
2. Decreased [Quantitative Concept], Oral [Spatial Concept], /day [Temporal Concept]
3. Pain [Sign or Symptom], Pump, device [Medical Device], Drugs [Pharmacologic Substance], week [Temporal Concept]
4. Take [Health Care Activity], Oral [Spatial Concept]
5. Presentation [Idea or Concept], N+ (tumor staging) [Intellectual Product]
6. Chronic [Temporal Concept], Neck pain [Sign or Symptom]
9
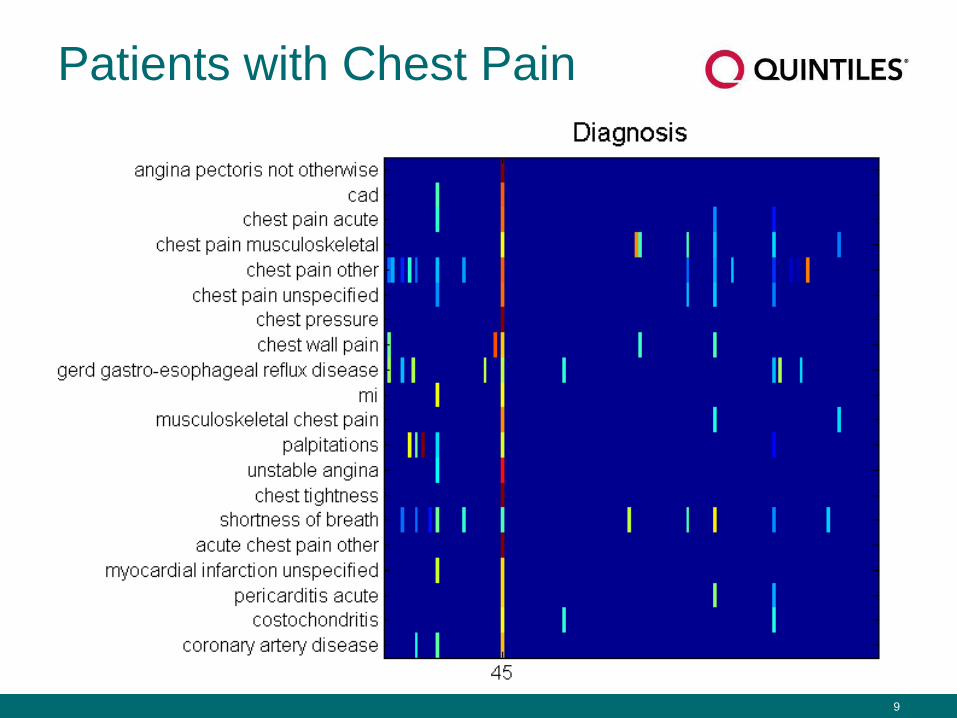
Patients with Chest Pain
10
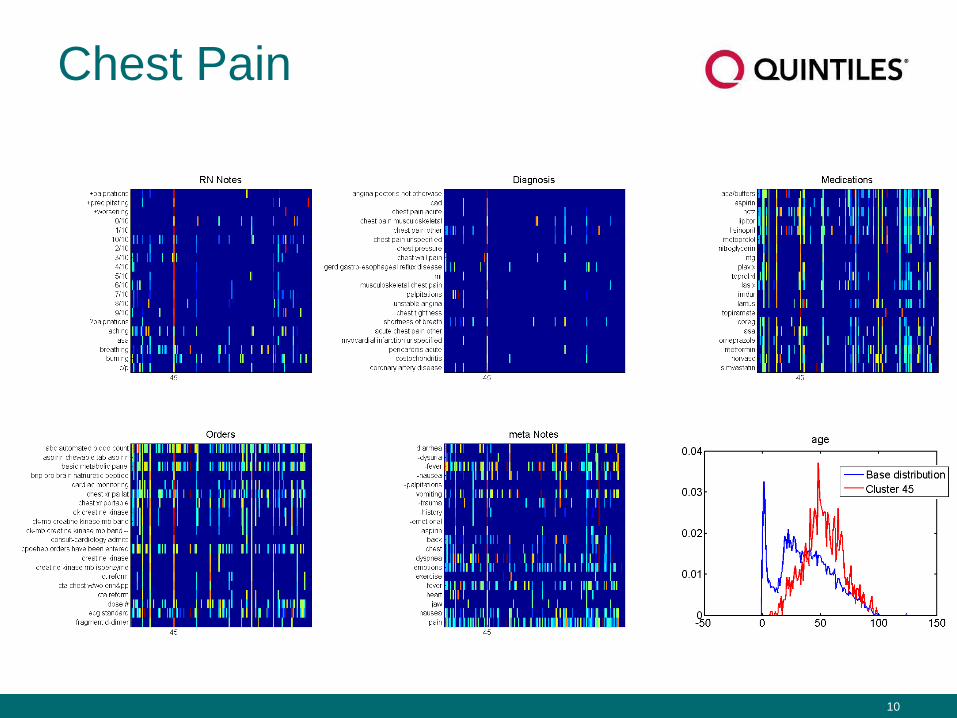
Chest Pain
11
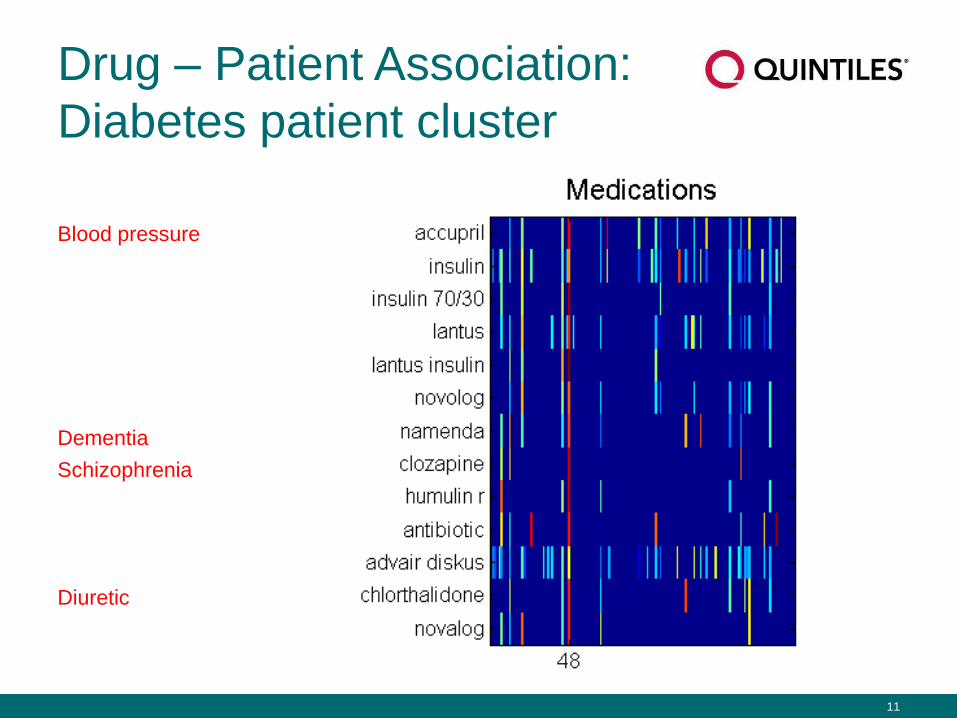
Drug – Patient Association:
Diabetes patient cluster
Blood pressure
Dementia
Schizophrenia
Diuretic
12
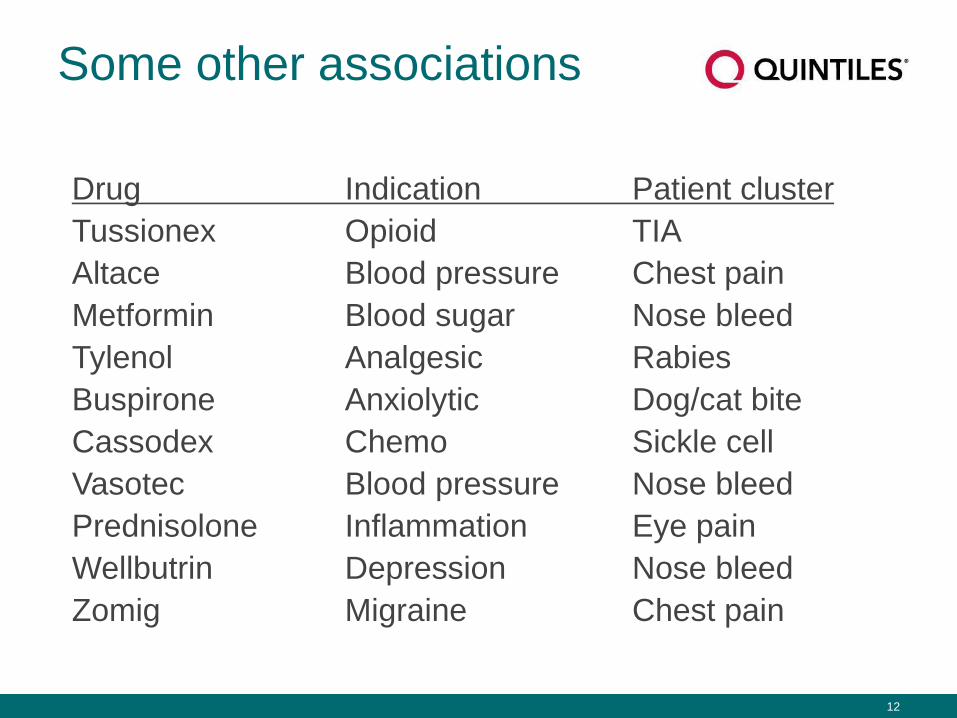
Some other associations
Drug Indication Patient cluster
Tussionex Opioid TIA
Altace Blood pressure Chest pain
Metformin Blood sugar Nose bleed
Tylenol Analgesic Rabies
Buspirone Anxiolytic Dog/cat bite
Cassodex Chemo Sickle cell
Vasotec Blood pressure Nose bleed
Prednisolone Inflammation Eye pain
Wellbutrin Depression Nose bleed
Zomig Migraine Chest pain
13
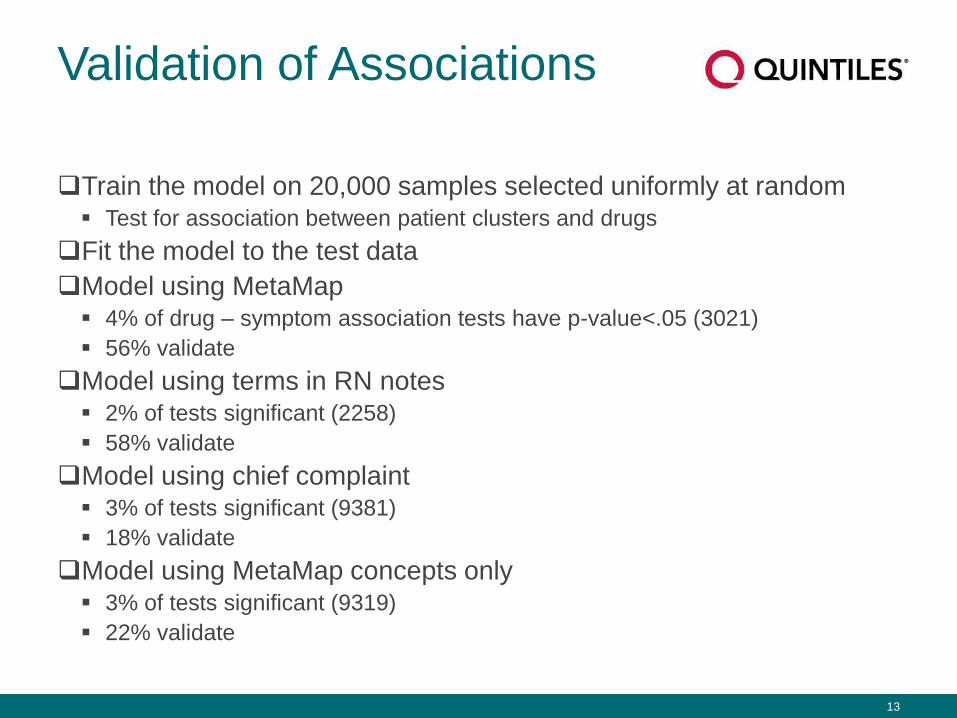
Validation of Associations
Train the model on 20,000 samples selected uniformly at random Test for association between patient clusters and drugs
Fit the model to the test data
Model using MetaMap 4% of drug – symptom association tests have p-value<.05 (3021)
56% validate
Model using terms in RN notes 2% of tests significant (2258)
58% validate
Model using chief complaint 3% of tests significant (9381)
18% validate
Model using MetaMap concepts only 3% of tests significant (9319)
22% validate
14
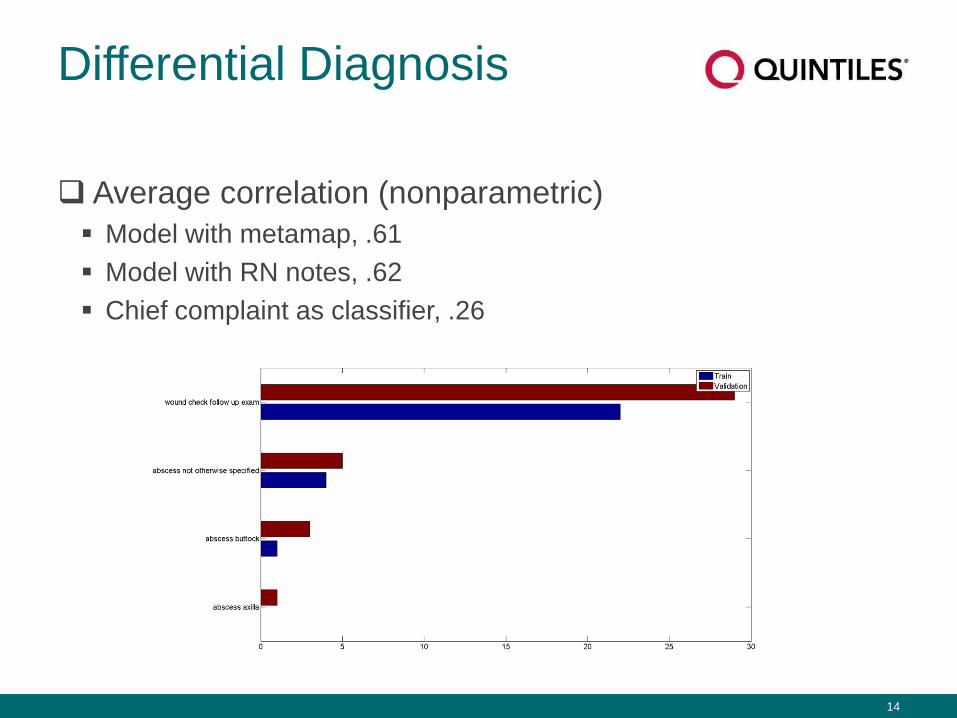
Differential Diagnosis
Average correlation (nonparametric)
Model with metamap, .61
Model with RN notes, .62
Chief complaint as classifier, .26
15
Just the Beginning
“Real World” Data Sources
EMR
Claims
Quantified self
Social media
High-throughput
molecular data
Job performance
Interested Industries
Patients
Care providers
Pharma
Clinical research
Insurance
Regulators
Your employer
16
Acknowledgments
Quintiles Payer / Provider
• Brian Kelly
• Jon Morris
Duke University
• Ricardo Henao
• Larry Carin
• Geoff Ginsburg
http://EHRanalytics.blogspot.com