Embed Size (px)
Citation preview
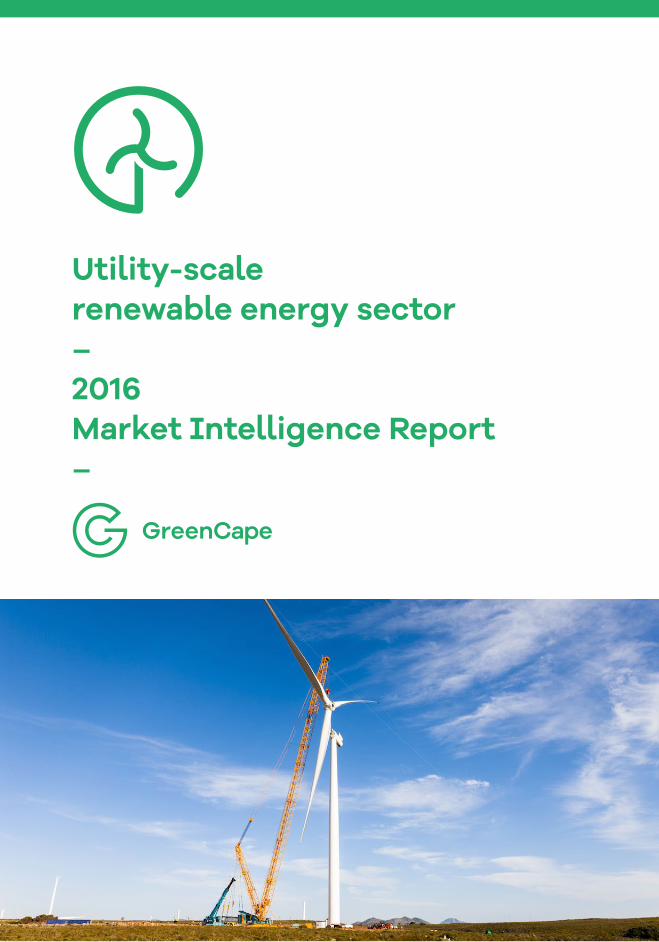
Utility-scale renewable energy sector – 2016Market Intelligence Report–

2 Renewable Energy Sector: Market Intelligence Report 2016
18 Roeland Street, Cape Town, 8001, South Africa
Editorial and review: Bruce RawImages: Jeff Barbee, GreenCapeCover: © Jeffreys Bay Wind Farm. This windfarm is one of the first and largest in South Africa, generating enough electrical energy every year to power 100,000 average South African households.Layout and design: Deep Design
GreenCapeGreenCape is a non-profit organisation that supports and promotes the green economy - low carbon, resource efficient and socially inclusive - in the Western Cape, South Africa. We assist businesses and investors focusing on green technologies and services to remove barriers to their establishment and growth.
AcknowledgementsWe thank Maloba Tshehla for the time and effort that went into compiling this Market Intelligence Report.
DisclaimerWhile every attempt was made to ensure that the information published in this report is accurate, no responsibility is accepted for any loss or damage that may arise out of the reliance of any person or entity upon any of the information this report contains.
Copyright © GreenCape 2016
This document may be downloaded at no charge from www.greencape.co.za. All rights reserved.
Subscribe to receive e-mail alerts or GreenCape news, events and publications by registering as a member on our website: www.greencape.co.za
Renewable Energy Sector: Market Intelligence Report 2016 3
List of acronyms 4 List of figures 6 List of tables 6 Executive summary 81. Introduction and purpose 102. Industry overview 112.1. Context 112.1.1. The REIPPPP 122.1.2. Local government power procurement 142.2. Market size 142.2.1. Current overview 142.2.2. Forecast growth 192.2.3. Other noteworthy trends 202.3. Key players 213. Policies and regulation 224. Opportunities and barriers 234.1. Local content 234.2. Socio-economic development in the REIPPPP 244.3. African market opportunities 244.3.1. SADC 244.3.2. Beyond SADC 254.4. Eskom capacity constraint challenges 255. Funding and incentives 285.1. Manufacturing incentives 316. The Western Cape: Africa’s growing greentech hub 347. GreenCape’s support to businesses and investors 368. References 39
Contents
CSIR Council of Scientific and Industrial ResearchCSP concentrated solar powerDEA Department of Environmental AffairsDED&T Department of Economic Development and TourismDG distributed generationDoE Department of EnergyDPE Department of Public Enterprisesdti Department of Trade and Industry
List of acronyms
4 Renewable Energy Sector: Market Intelligence Report 2016
ED enterprise developmentEG embedded generationEIA environment impact assessment EPC engineering, procurement and construction GRI Gestamp Renewable IndustriesGW gigawattIEP integrated energy planIPP independent power producerIRP integrated resource plankW kilowattkWp kilowatt peakMJ mega-jouleMW megawattMWp megawatt peakNDP national development planNEMA National Environmental Management ActNERC Nigerian Electricity Regulatory CommissionNERSA National Energy Regulator of South AfricaO&M operation and maintenanceOEM original equipment manufacturerPPA power purchase agreementPV photovoltaicR/kWh rand per kilowatt hourR c/kWh rand cent per kilowatt hourRE renewable energyREFIT renewable energy feed in tariffREIPPPP Renewable Energy Independent Power Producer Procurement ProgrammeREN21 Renewable Energy Network for the 21st centurySADC South African Development CommunitySAIREC South African International Renewable Energy ConferenceSAPP Southern African Power PoolSASEN Southern African Sustainable Energy NetworkSAPVIA South African Photovoltaic Industry AssociationSED socio-economic developmentSEZ Special Economic ZoneSOC State Owned CompanySSEG small-scale embedded generation SE4ALL United Nations Sustainable Energy 4 AllUSAID United States Agency for International DevelopmentWWF-SA World Wildlife Fund for Nature South Africa
Renewable Energy Sector: Market Intelligence Report 2016 5

Figure 1Average Eskom price trajectories versus utility scale wind and solar PV tariffs 12Figure 2Development of the REIPPPP 2011 – 2015 14Figure 3Committed investments into the REIPPPP thus far 16Figure 4 Distribution of foreign investment sources into the REIPPPP 18Figure 5 Breakdown of recent Ministerial determination for RE procurement 19Figure 6Predicted growth of procured wind energy and solar PV generation capacity 20Figure 7Increases in local content achieved over bidding rounds 21Figure 8Breakdown of key players in the REIPPPP 21Figure 9Map of SADC member states 24Figure 10Major market opportunities in the Western Cape (2015 – 2020) 34Figure 11GreenCape’s focus areas 38
Table 1Typical facility sizes in different RE sub-markets 11Table 2Small IPP preferred bidders 14Table 3Capacity allocations per technology over bidding rounds 15Table 4Actual capacity procured per round (MW) 15Table 5Average bid prices per technology over all complete bidding rounds 16Table 6Highlight of renewable energy opportunities in some SADC member states 25Table 7Renewable energy opportunities on the rest of the African continent 26Table 8List of funding solutions 28
List of figures & tables
6 Renewable Energy Sector: Market Intelligence Report 2016
Renewable Energy Sector: Market Intelligence Report 2016 7
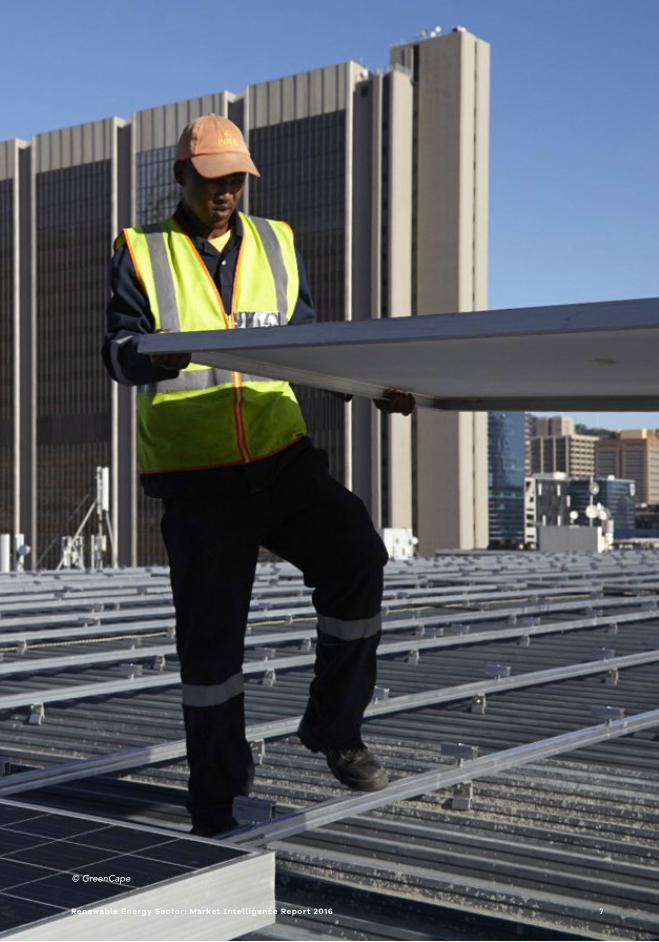
© GreenCape
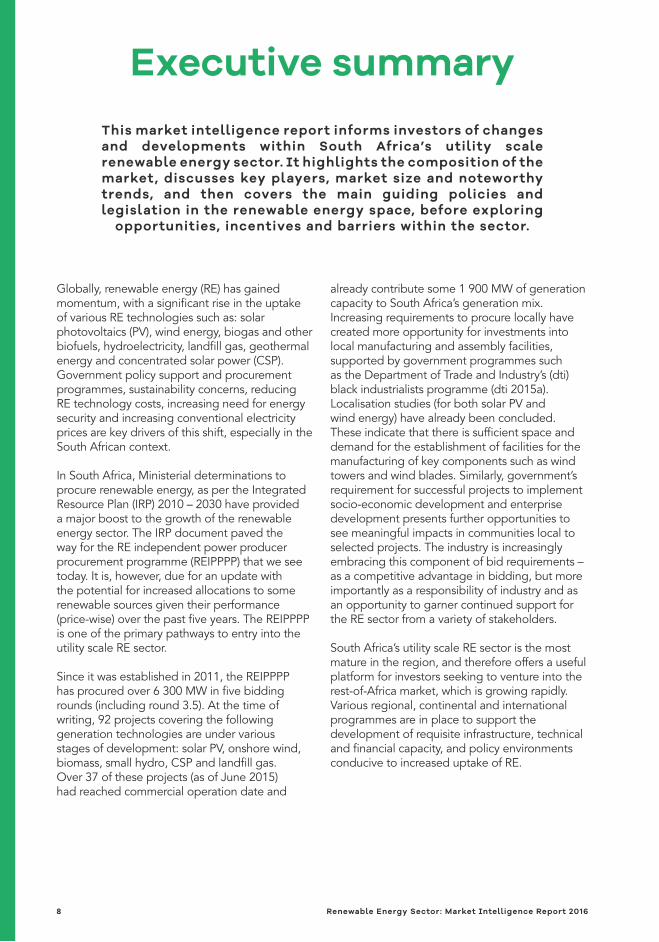
This market intelligence report informs investors of changes and developments within South Africa’s utility scale renewable energy sector. It highlights the composition of the market, discusses key players, market size and noteworthy trends, and then covers the main guiding policies and legislation in the renewable energy space, before exploring
opportunities, incentives and barriers within the sector.
Executive summary
Globally, renewable energy (RE) has gained momentum, with a significant rise in the uptake of various RE technologies such as: solar photovoltaics (PV), wind energy, biogas and other biofuels, hydroelectricity, landfill gas, geothermal energy and concentrated solar power (CSP). Government policy support and procurement programmes, sustainability concerns, reducing RE technology costs, increasing need for energy security and increasing conventional electricity prices are key drivers of this shift, especially in the South African context.
In South Africa, Ministerial determinations to procure renewable energy, as per the Integrated Resource Plan (IRP) 2010 – 2030 have provided a major boost to the growth of the renewable energy sector. The IRP document paved the way for the RE independent power producer procurement programme (REIPPPP) that we see today. It is, however, due for an update with the potential for increased allocations to some renewable sources given their performance (price-wise) over the past five years. The REIPPPP is one of the primary pathways to entry into the utility scale RE sector.
Since it was established in 2011, the REIPPPP has procured over 6 300 MW in five bidding rounds (including round 3.5). At the time of writing, 92 projects covering the following generation technologies are under various stages of development: solar PV, onshore wind, biomass, small hydro, CSP and landfill gas. Over 37 of these projects (as of June 2015) had reached commercial operation date and
already contribute some 1 900 MW of generation capacity to South Africa’s generation mix.Increasing requirements to procure locally have created more opportunity for investments into local manufacturing and assembly facilities, supported by government programmes such as the Department of Trade and Industry’s (dti) black industrialists programme (dti 2015a). Localisation studies (for both solar PV and wind energy) have already been concluded. These indicate that there is sufficient space and demand for the establishment of facilities for the manufacturing of key components such as wind towers and wind blades. Similarly, government’s requirement for successful projects to implement socio-economic development and enterprise development presents further opportunities to see meaningful impacts in communities local to selected projects. The industry is increasingly embracing this component of bid requirements – as a competitive advantage in bidding, but more importantly as a responsibility of industry and as an opportunity to garner continued support for the RE sector from a variety of stakeholders.
South Africa’s utility scale RE sector is the most mature in the region, and therefore offers a useful platform for investors seeking to venture into the rest-of-Africa market, which is growing rapidly. Various regional, continental and international programmes are in place to support the development of requisite infrastructure, technical and financial capacity, and policy environments conducive to increased uptake of RE.
8 Renewable Energy Sector: Market Intelligence Report 2016
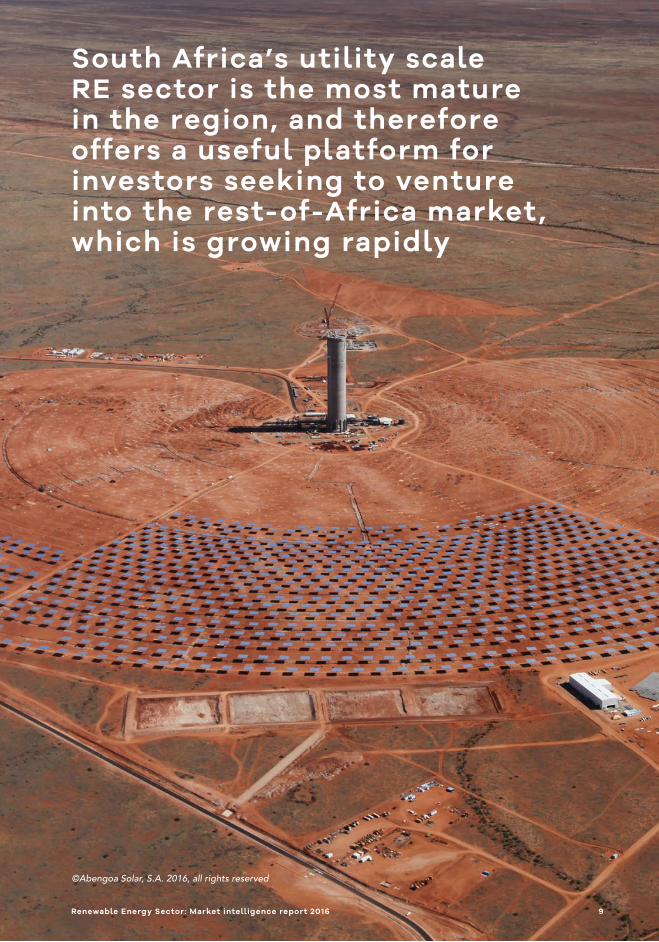
South Africa’s utility scale RE sector is the most mature in the region, and therefore offers a useful platform for investors seeking to venture into the rest-of-Africa market, which is growing rapidly
©Abengoa Solar, S.A. 2016, all rights reserved
Renewable Energy Sector: Market intelligence report 2016 9
South Africa’s renewable energy market is segmented into utility scale RE, distributed generation (DG) and embedded generation (EG). This market intelligence report focuses on the utility scale RE market. Insights into the DG and EG markets, together with energy efficiency, are covered in a
separate Energy Services market intelligence report.
1 –Introduction and purpose
This report was compiled by GreenCape’s renewable energy sector desk. It aims to provide potential investors and businesses with a greater understanding of the utility scale renewable energy (RE) market in the Western Cape and in the broader South African market.
The report gives an overview of the market, describes market size, key players, changes to legislation and regulation, and highlights opportunities and barriers in the market.
This is followed by an overview of the Western Cape as Africa’s growing greentech hub, and more about the free services provided by GreenCape to its members – businesses and investors in the green economy.
For queries or to access our services contact our Renewable Energy Sector Desk at [email protected]
10 Renewable Energy Sector: Market Intelligence Report 2016
South Africa’s energy market, and specifically its electricity market, is significantly larger than those of its neighbours. South Africa’s national utility, Eskom, supplies over 45% of
Africa’s electricity demand (Eskom 2014).
The country’s generation capacity is dominated by coal fired generation stations with a net output of 35.6 GWp
1 , which represents over 85% of the country’s total installed capacity of over 44 GWp. Nuclear generation capacity comprises 5% of generation capacity, which comes from the only nuclear generation facility on the African continent: Koeberg power station. Renewable energy is a fairly new sector within generation and has seen rapid growth, though still representing a fairly small portion of the generation mix.
With total procured renewable energy to date standing at just over 1 900 MWp, representing another 5% of the generation mix, the industry has a lot of space to flourish and contribute. The categorisation of the RE market is primarily based on the size of generation facilities, and the typical sizes per market sub-sector are outlined in Table 1.
Table 1: Typical facility sizes in different RE sub-markets
The South African utility scale RE market consists almost completely of the South African government Department of Energy’s (DoE) renewable energy independent power producer procurement programme (REIPPPP). More detail on the programme is available in the REIPPPP section, 2.1.1.
2.1. ContextSouth Africa’s RE industry has seen significant growth in recent years. This has been a result of several factors, namely:
■ Increases in electricity tariffs charged by the national utility, Eskom;
■ Electricity supply constraints that have led to the introduction of load shedding (rolling blackouts);
■ Global decreases in RE technology prices.
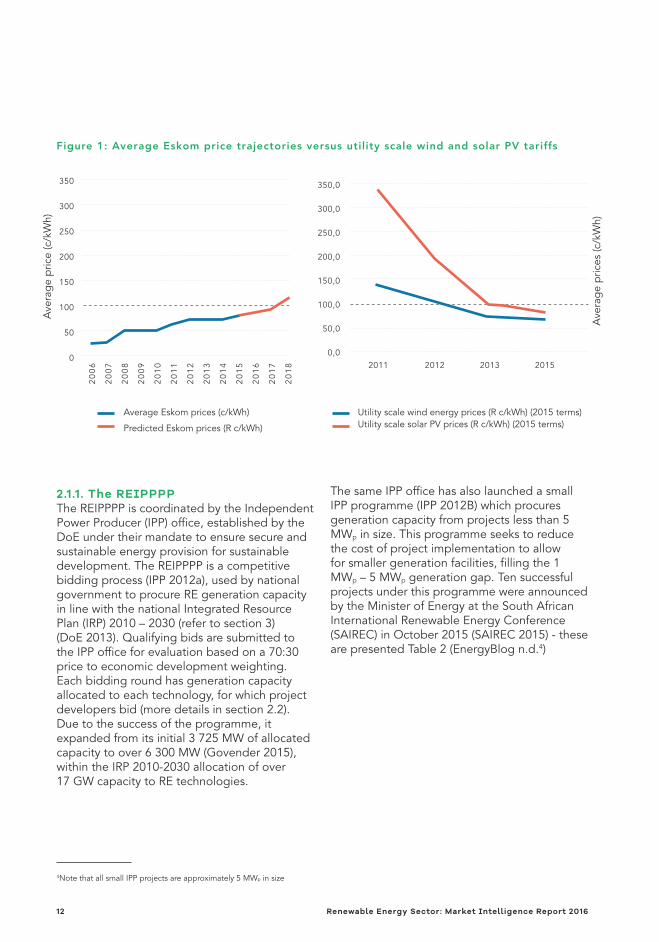
As demonstrated in Figure 1 (Nersa 20142), tariffs charged by utility scale solar photovoltaic (PV) and wind energy, in the REIPPPP, are increasingly competitive with average tariffs from Eskom, having both gone below the R1/kWh mark. On the other hand, the average Eskom tariff is fast approaching this mark (it is worth noting that utility scale wind, at 62c/kWh, is directly competitive with the Eskom average tariff)3. Decreases in tariffs from RE technologies have been a result of increases in global RE generation capacity and South Africa’s own successes through its REIPPPP.
2 –Industry overview
Market segment Typical installation size
Utility scale installations >5 MWp
Distributed and embedded generation market
Commercial and industrial scale DG+EG ~ 10 kWp – 1 MWp
Residential EG ~ <10 kWp
1 The subscript “p” denotes installed peak capacity.2 Prices all in 2015 terms, Eskom predicted prices as per yearly tariff increases granted by the National Energy Regulator of South Africa (NERSA).3Note that tariffs from the REIPPPP are generation tariffs, while Eskom tariffs quoted are selling prices, to the consumer. It is therefore worth comparing the expected price of generation from newly-built capacity from Eskom and the REIPPPP.
Renewable Energy Sector: Market Intelligence Report 2016 11
2.1.1. The REIPPPPThe REIPPPP is coordinated by the Independent Power Producer (IPP) office, established by the DoE under their mandate to ensure secure and sustainable energy provision for sustainable development. The REIPPPP is a competitive bidding process (IPP 2012a), used by national government to procure RE generation capacity in line with the national Integrated Resource Plan (IRP) 2010 – 2030 (refer to section 3) (DoE 2013). Qualifying bids are submitted to the IPP office for evaluation based on a 70:30 price to economic development weighting. Each bidding round has generation capacity allocated to each technology, for which project developers bid (more details in section 2.2). Due to the success of the programme, it expanded from its initial 3 725 MW of allocated capacity to over 6 300 MW (Govender 2015), within the IRP 2010-2030 allocation of over 17 GW capacity to RE technologies.
The same IPP office has also launched a small IPP programme (IPP 2012B) which procures generation capacity from projects less than 5 MWp in size. This programme seeks to reduce the cost of project implementation to allow for smaller generation facilities, filling the 1 MWp – 5 MWp generation gap. Ten successful projects under this programme were announced by the Minister of Energy at the South African International Renewable Energy Conference (SAIREC) in October 2015 (SAIREC 2015) - these are presented Table 2 (EnergyBlog n.d.4)
Ave
rag
e p
rices
(c/k
Wh)
2011 2012 2013 2015
Figure 1: Average Eskom price trajectories versus utility scale wind and solar PV tariffs
350,0
300,0
250,0
200,0
150,0
100,0
50,0
0,0
Ave
rag
e p
rice
(c/k
Wh)
Average Eskom prices (c/kWh)
Predicted Eskom prices (R c/kWh)
Utility scale wind energy prices (R c/kWh) (2015 terms)Utility scale solar PV prices (R c/kWh) (2015 terms)
2006
2007
2008
2009
2010
2011
2012
2013
2014
2015
2016
2017
2018
350
300
250
200
150
100
50
0
4Note that all small IPP projects are approximately 5 MWp in size
12 Renewable Energy Sector: Market Intelligence Report 2016
Renewable Energy Sector: Market Intelligence Report 2016 13
© GreenCape
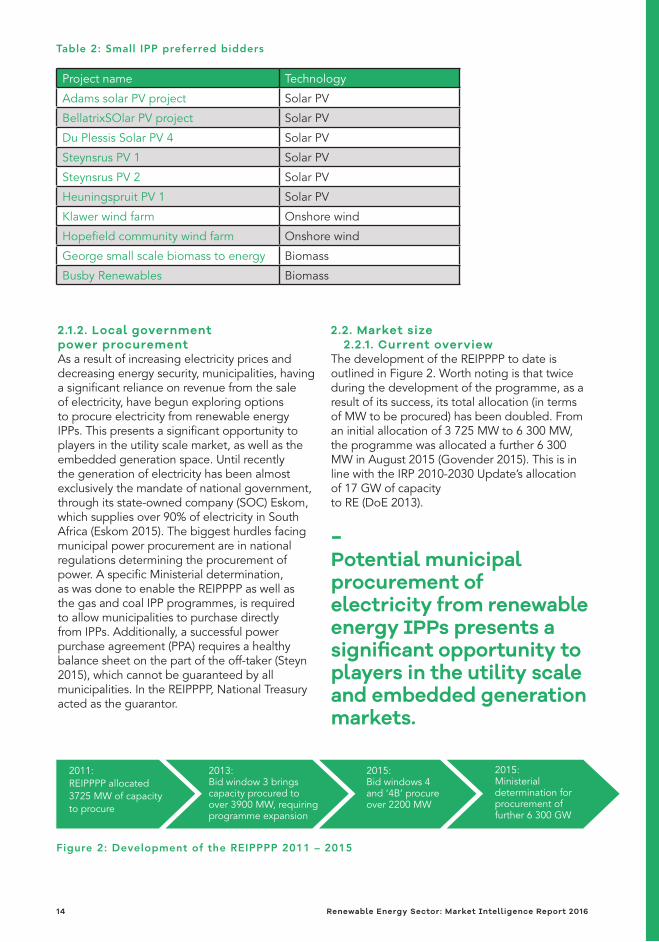
2.1.2. Local government power procurementAs a result of increasing electricity prices and decreasing energy security, municipalities, having a significant reliance on revenue from the sale of electricity, have begun exploring options to procure electricity from renewable energy IPPs. This presents a significant opportunity to players in the utility scale market, as well as the embedded generation space. Until recently the generation of electricity has been almost exclusively the mandate of national government, through its state-owned company (SOC) Eskom, which supplies over 90% of electricity in South Africa (Eskom 2015). The biggest hurdles facing municipal power procurement are in national regulations determining the procurement of power. A specific Ministerial determination, as was done to enable the REIPPPP as well as the gas and coal IPP programmes, is required to allow municipalities to purchase directly from IPPs. Additionally, a successful power purchase agreement (PPA) requires a healthy balance sheet on the part of the off-taker (Steyn 2015), which cannot be guaranteed by all municipalities. In the REIPPPP, National Treasury acted as the guarantor.
2.2. Market size 2.2.1. Current overviewThe development of the REIPPPP to date is outlined in Figure 2. Worth noting is that twice during the development of the programme, as a result of its success, its total allocation (in terms of MW to be procured) has been doubled. From an initial allocation of 3 725 MW to 6 300 MW, the programme was allocated a further 6 300 MW in August 2015 (Govender 2015). This is in line with the IRP 2010-2030 Update’s allocation of 17 GW of capacity to RE (DoE 2013).
–Potential municipal procurement of electricity from renewable energy IPPs presents a significant opportunity to players in the utility scale and embedded generation markets.
Table 2: Small IPP preferred bidders
Figure 2: Development of the REIPPPP 2011 – 2015
Project name Technology
Adams solar PV project Solar PV
BellatrixSOlar PV project Solar PV
Du Plessis Solar PV 4 Solar PV
Steynsrus PV 1 Solar PV
Steynsrus PV 2 Solar PV
Heuningspruit PV 1 Solar PV
Klawer wind farm Onshore wind
Hopefield community wind farm Onshore wind
George small scale biomass to energy Biomass
Busby Renewables Biomass
2011:REIPPPP allocated 3725 MW of capacity to procure
2013:Bid window 3 brings capacity procured to over 3900 MW, requiring programme expansion
2015:Bid windows 4 and ‘4B’ procure over 2200 MW
2015:Ministerial determination for procurement of further 6 300 GW
14 Renewable Energy Sector: Market Intelligence Report 2016
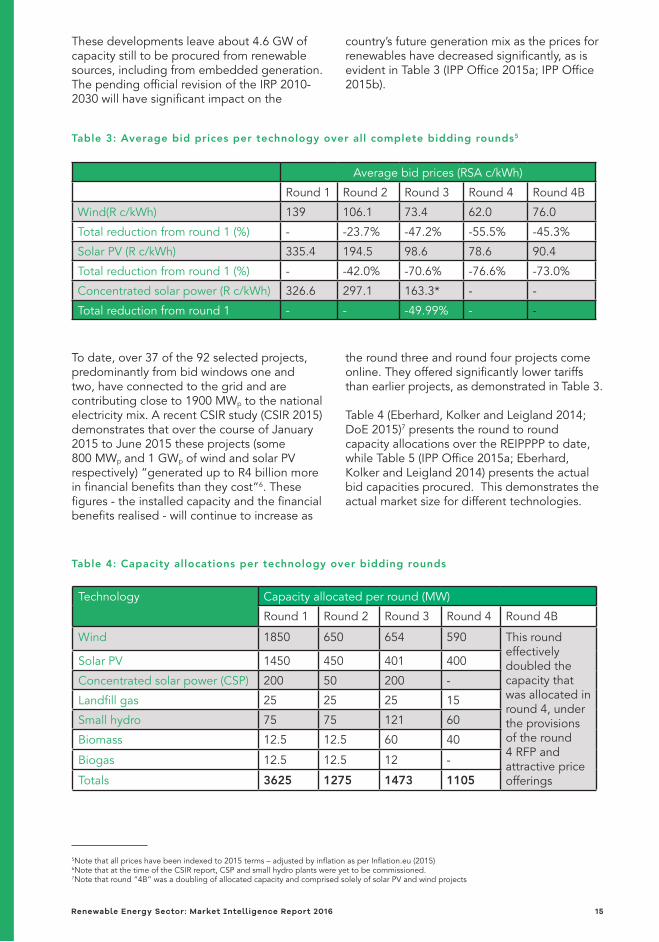
These developments leave about 4.6 GW of capacity still to be procured from renewable sources, including from embedded generation. The pending official revision of the IRP 2010-2030 will have significant impact on the
country’s future generation mix as the prices for renewables have decreased significantly, as is evident in Table 3 (IPP Office 2015a; IPP Office 2015b).
Table 3: Average bid prices per technology over all complete bidding rounds5
Table 4: Capacity allocations per technology over bidding rounds
To date, over 37 of the 92 selected projects, predominantly from bid windows one and two, have connected to the grid and are contributing close to 1900 MWp to the national electricity mix. A recent CSIR study (CSIR 2015) demonstrates that over the course of January 2015 to June 2015 these projects (some 800 MWp and 1 GWp of wind and solar PV respectively) “generated up to R4 billion more in financial benefits than they cost”6. These figures - the installed capacity and the financial benefits realised - will continue to increase as
the round three and round four projects come online. They offered significantly lower tariffs than earlier projects, as demonstrated in Table 3.
Table 4 (Eberhard, Kolker and Leigland 2014; DoE 2015)7 presents the round to round capacity allocations over the REIPPPP to date, while Table 5 (IPP Office 2015a; Eberhard, Kolker and Leigland 2014) presents the actual bid capacities procured. This demonstrates the actual market size for different technologies.
Average bid prices (RSA c/kWh)
Round 1 Round 2 Round 3 Round 4 Round 4B
Wind(R c/kWh) 139 106.1 73.4 62.0 76.0
Total reduction from round 1 (%) - -23.7% -47.2% -55.5% -45.3%
Solar PV (R c/kWh) 335.4 194.5 98.6 78.6 90.4
Total reduction from round 1 (%) - -42.0% -70.6% -76.6% -73.0%
Concentrated solar power (R c/kWh) 326.6 297.1 163.3* - -
Total reduction from round 1 - - -49.99% - -
Technology Capacity allocated per round (MW)
Round 1 Round 2 Round 3 Round 4 Round 4B
Wind 1850 650 654 590 This round effectively doubled the capacity that was allocated in round 4, under the provisions of the round 4 RFP and attractive price offerings
Solar PV 1450 450 401 400
Concentrated solar power (CSP) 200 50 200 -
Landfill gas 25 25 25 15
Small hydro 75 75 121 60
Biomass 12.5 12.5 60 40
Biogas 12.5 12.5 12 -
Totals 3625 1275 1473 1105
5Note that all prices have been indexed to 2015 terms – adjusted by inflation as per Inflation.eu (2015)6Note that at the time of the CSIR report, CSP and small hydro plants were yet to be commissioned.7Note that round “4B” was a doubling of allocated capacity and comprised solely of solar PV and wind projects
Renewable Energy Sector: Market Intelligence Report 2016 15
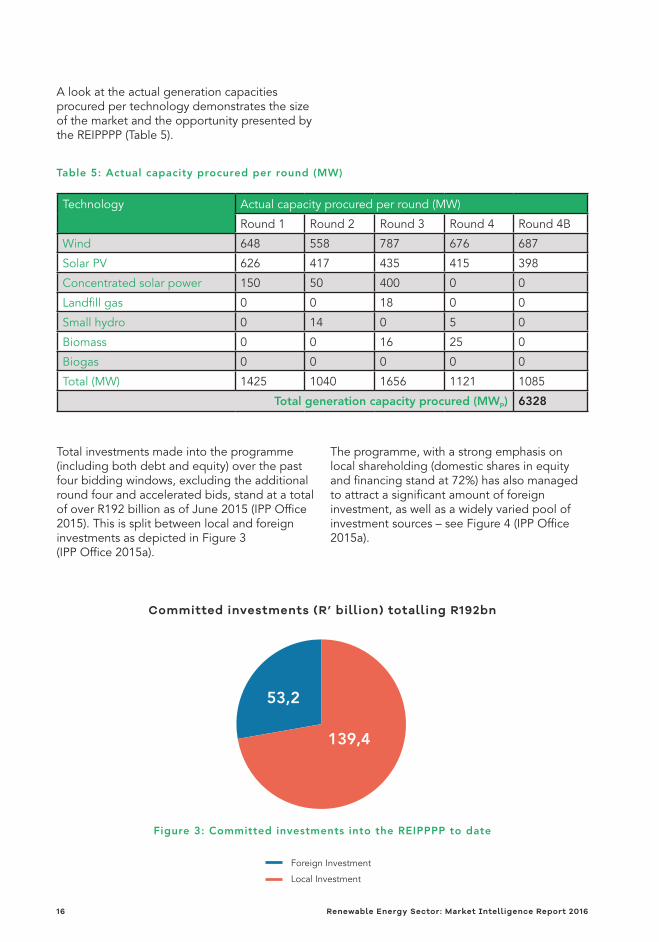
Total investments made into the programme (including both debt and equity) over the past four bidding windows, excluding the additional round four and accelerated bids, stand at a total of over R192 billion as of June 2015 (IPP Office 2015). This is split between local and foreign investments as depicted in Figure 3 (IPP Office 2015a).
The programme, with a strong emphasis on local shareholding (domestic shares in equity and financing stand at 72%) has also managed to attract a significant amount of foreign investment, as well as a widely varied pool of investment sources – see Figure 4 (IPP Office 2015a).
A look at the actual generation capacities procured per technology demonstrates the size of the market and the opportunity presented by the REIPPPP (Table 5).
Table 5: Actual capacity procured per round (MW)
Technology Actual capacity procured per round (MW)
Round 1 Round 2 Round 3 Round 4 Round 4B
Wind 648 558 787 676 687
Solar PV 626 417 435 415 398
Concentrated solar power 150 50 400 0 0
Landfill gas 0 0 18 0 0
Small hydro 0 14 0 5 0
Biomass 0 0 16 25 0
Biogas 0 0 0 0 0
Total (MW) 1425 1040 1656 1121 1085
Total generation capacity procured (MWp) 6328
Committed investments (R’ billion) totalling R192bn
Foreign Investment
Local Investment
53,2
139,4
Figure 3: Committed investments into the REIPPPP to date
16 Renewable Energy Sector: Market Intelligence Report 2016
Renewable Energy Sector: Market Intelligence Report 2016 17
© Jeffrey Barbee, allianceearth.org/GreenCape
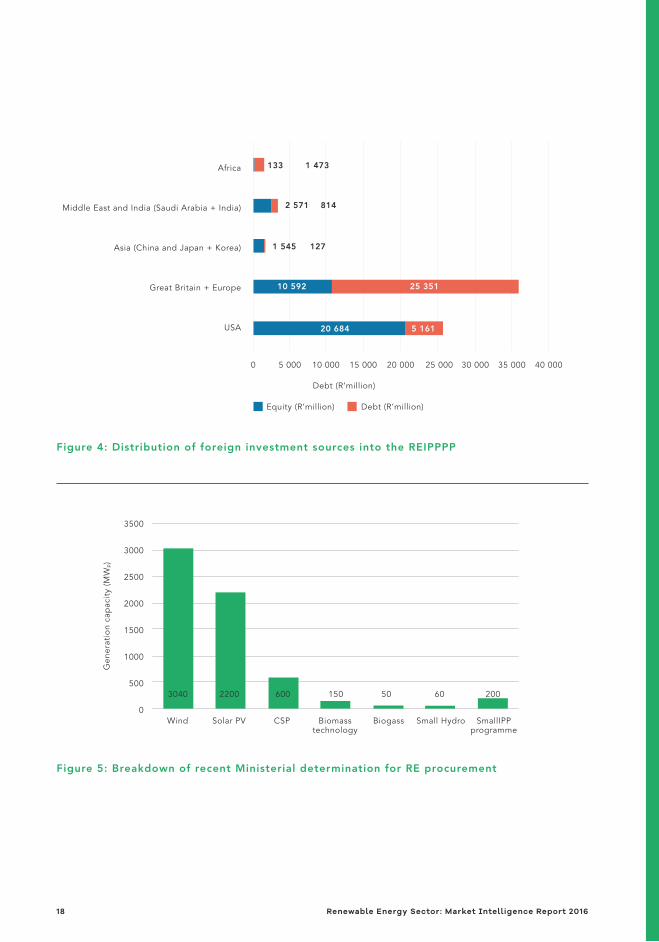
Figure 4: Distribution of foreign investment sources into the REIPPPP
Figure 5: Breakdown of recent Ministerial determination for RE procurement
Africa
Middle East and India (Saudi Arabia + India)
Asia (China and Japan + Korea)
Great Britain + Europe
USA
0
Equity (R’million) Debt (R’million)
Debt (R’million)
133 1 473
2 571 814
1271 545
5 000 10 000 15 000 20 000 25 000 30 000 35 000 40 000
10 592
20 684 5 161
25 351
3500
3000
2500
2000
1500
1000
500
0
15060022003040 50 60 200
Wind
Gen
erat
ion
cap
acit
y (M
Wp)
Solar PV CSP Biomasstechnology
Biogass Small Hydro SmallIPPprogramme
18 Renewable Energy Sector: Market Intelligence Report 2016
Other significant benefits from this programme are flowing into local communities (which are entitled to a percentage of project ownership) and into local businesses through local procurement. Predicted community benefits and project spend on local companies include:
■ R49.9 billion in gross income earned over projects’ lifetimes (from round 1 – 4 projects), with a net income of over R29 billion.
■ Over R140 billion in planned spending of which R72 billion will be on construction, while R69 billion will be on operations (over the lifetime of projects selected in the completed bid windows to date, and so these figures should increase year on year as more capacity is rolled out) (IPP Office 2015).
2.2.2. Forecast growthThe Ministerial determination to procure a further 6 300 MWp to this programme reinforces the government’s commitment to transform the country’s generation mix and employ RE technologies to do so. It also goes a long way towards ensuring the longevity of the programme, allowing investors looking at the South African RE market to make decisions based on longer-term market availability. This additional allocation will be divided up among the various technologies as shown in Figure 5 (Republic of South Africa 2015; Govender 2015).
-The Ministerial determination to procure a further 6 300 MWp to this programme reinforces the government’s commitment to transform the country’s generation mix and employ RE technologies to do so.
Renewable Energy Sector: Market Intelligence Report 2016 19
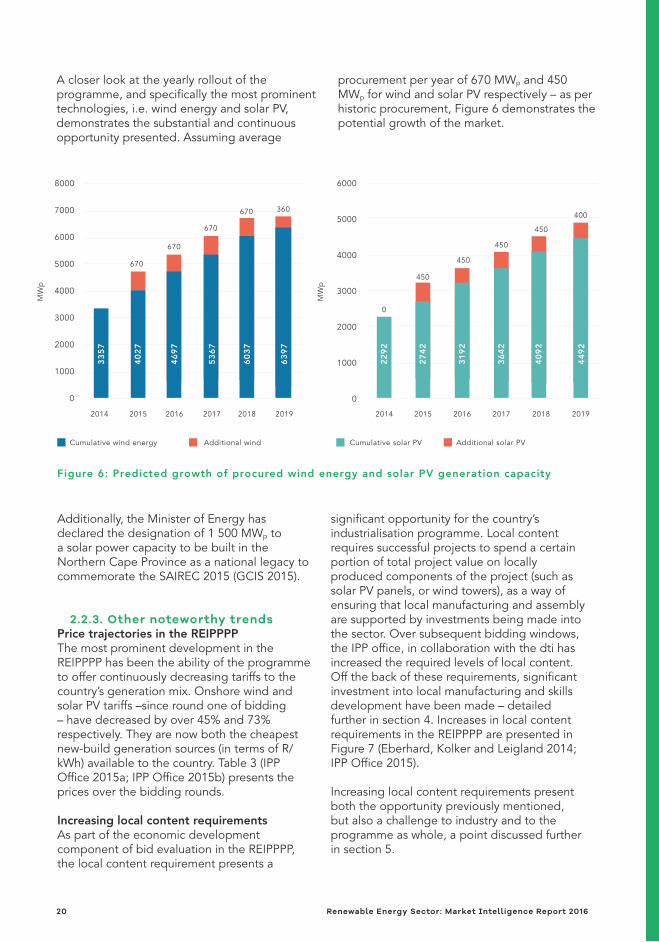
Figure 6: Predicted growth of procured wind energy and solar PV generation capacity
Additionally, the Minister of Energy has declared the designation of 1 500 MWp to a solar power capacity to be built in the Northern Cape Province as a national legacy to commemorate the SAIREC 2015 (GCIS 2015).
2.2.3. Other noteworthy trendsPrice trajectories in the REIPPPPThe most prominent development in the REIPPPP has been the ability of the programme to offer continuously decreasing tariffs to the country’s generation mix. Onshore wind and solar PV tariffs –since round one of bidding – have decreased by over 45% and 73% respectively. They are now both the cheapest new-build generation sources (in terms of R/kWh) available to the country. Table 3 (IPP Office 2015a; IPP Office 2015b) presents the prices over the bidding rounds.
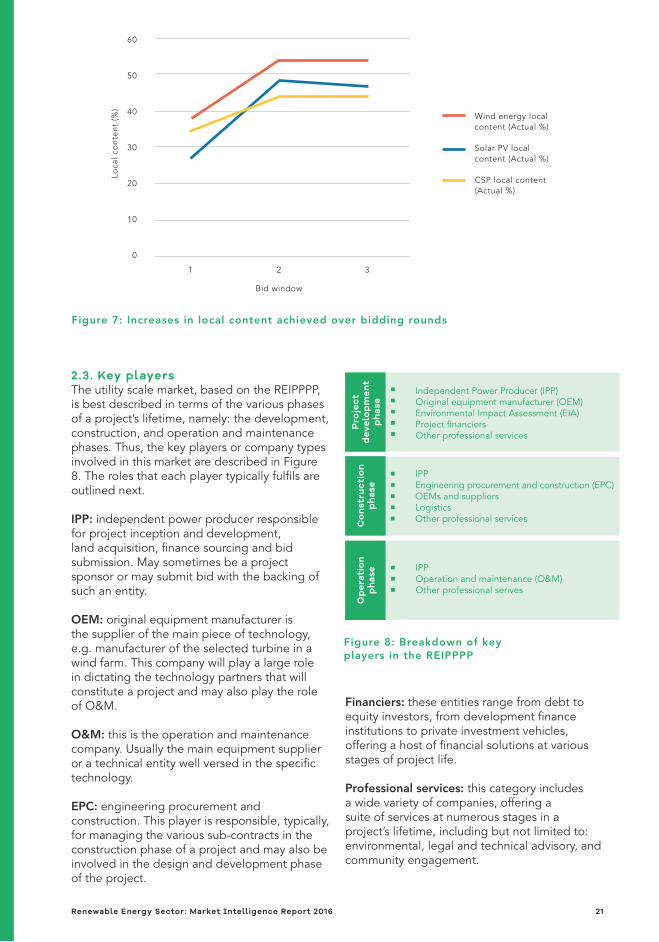
Increasing local content requirementsAs part of the economic development component of bid evaluation in the REIPPPP, the local content requirement presents a
significant opportunity for the country’s industrialisation programme. Local content requires successful projects to spend a certain portion of total project value on locally produced components of the project (such as solar PV panels, or wind towers), as a way of ensuring that local manufacturing and assembly are supported by investments being made into the sector. Over subsequent bidding windows, the IPP office, in collaboration with the dti has increased the required levels of local content. Off the back of these requirements, significant investment into local manufacturing and skills development have been made – detailed further in section 4. Increases in local content requirements in the REIPPPP are presented in Figure 7 (Eberhard, Kolker and Leigland 2014; IPP Office 2015).
Increasing local content requirements present both the opportunity previously mentioned, but also a challenge to industry and to the programme as whole, a point discussed further in section 5.
A closer look at the yearly rollout of the programme, and specifically the most prominent technologies, i.e. wind energy and solar PV, demonstrates the substantial and continuous opportunity presented. Assuming average
procurement per year of 670 MWp and 450 MWp for wind and solar PV respectively – as per historic procurement, Figure 6 demonstrates the potential growth of the market.
6000
5000
4000
3000
2000
1000
0
8000
7000
6000
5000
4000
3000
2000
1000
0
2014
Cumulative wind energy Additional wind Cumulative solar PV Additional solar PV
670
670
670
670 360
0
450
450
450
450
400
MW
p
MW
p
2015 2016 2017 2018 2019 2014 2015 2016 2017 2018 2019
33
57
40
27
46
97
53
67
60
37
63
97
22
92
27
42
31
92
36
42
40
92
44
92
20 Renewable Energy Sector: Market Intelligence Report 2016
60
50
40
30
20
10
0
Loca
l co
nten
t (%
)
Bid window
Wind energy localcontent (Actual %)
Solar PV localcontent (Actual %)
CSP local content(Actual %)
1 2 3
Figure 7: Increases in local content achieved over bidding rounds
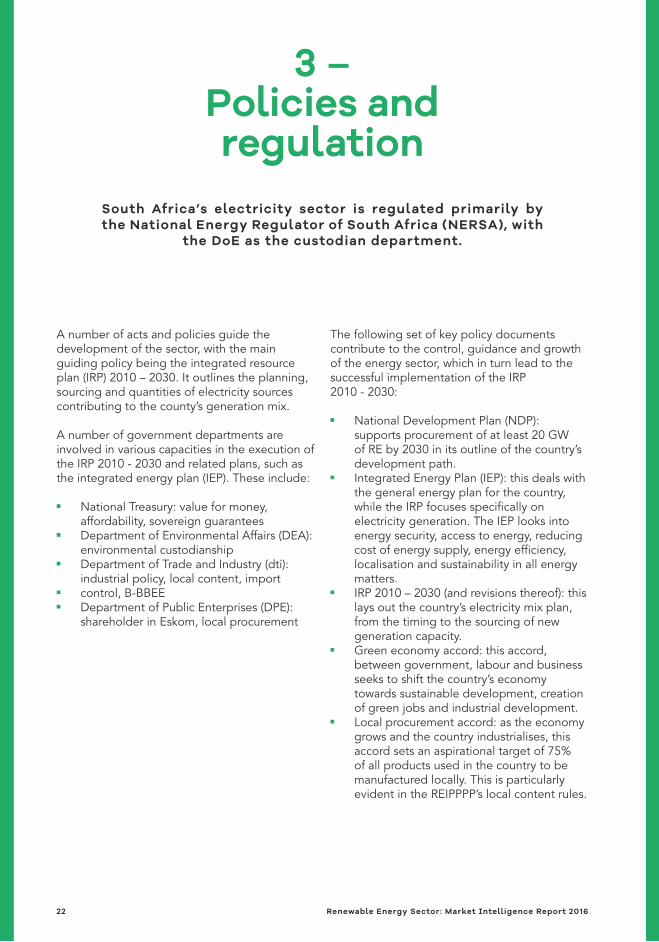
Figure 8: Breakdown of key players in the REIPPPP
2.3. Key players The utility scale market, based on the REIPPPP, is best described in terms of the various phases of a project’s lifetime, namely: the development, construction, and operation and maintenance phases. Thus, the key players or company types involved in this market are described in Figure 8. The roles that each player typically fulfils are outlined next.
IPP: independent power producer responsible for project inception and development, land acquisition, finance sourcing and bid submission. May sometimes be a project sponsor or may submit bid with the backing of such an entity.
OEM: original equipment manufacturer is the supplier of the main piece of technology, e.g. manufacturer of the selected turbine in a wind farm. This company will play a large role in dictating the technology partners that will constitute a project and may also play the role of O&M.
O&M: this is the operation and maintenance company. Usually the main equipment supplier or a technical entity well versed in the specific technology.
EPC: engineering procurement and construction. This player is responsible, typically, for managing the various sub-contracts in the construction phase of a project and may also be involved in the design and development phase of the project.
Financiers: these entities range from debt to equity investors, from development finance institutions to private investment vehicles, offering a host of financial solutions at various stages of project life.
Professional services: this category includes a wide variety of companies, offering a suite of services at numerous stages in a project’s lifetime, including but not limited to: environmental, legal and technical advisory, and community engagement.
■ Independent Power Producer (IPP) ■ Original equipment manufacturer (OEM) ■ Environmental Impact Assessment (EIA) ■ Project financiers ■ Other professional services
■ IPP ■ Engineering procurement and construction (EPC) ■ OEMs and suppliers ■ Logistics ■ Other professional services
■ IPP ■ Operation and maintenance (O&M) ■ Other professional serives
Pro
ject
d
evel
op
men
t p
has
e
Co
nst
ruct
ion
ph
ase
Op
erat
ion
ph
ase
Renewable Energy Sector: Market Intelligence Report 2016 21
South Africa’s electricity sector is regulated primarily by the National Energy Regulator of South Africa (NERSA), with
the DoE as the custodian department.
A number of acts and policies guide the development of the sector, with the main guiding policy being the integrated resource plan (IRP) 2010 – 2030. It outlines the planning, sourcing and quantities of electricity sources contributing to the county’s generation mix.
A number of government departments are involved in various capacities in the execution of the IRP 2010 - 2030 and related plans, such as the integrated energy plan (IEP). These include:
■ National Treasury: value for money, affordability, sovereign guarantees
■ Department of Environmental Affairs (DEA): environmental custodianship
■ Department of Trade and Industry (dti): industrial policy, local content, import
■ control, B-BBEE ■ Department of Public Enterprises (DPE):
shareholder in Eskom, local procurement
The following set of key policy documents contribute to the control, guidance and growth of the energy sector, which in turn lead to the successful implementation of the IRP 2010 - 2030:
■ National Development Plan (NDP): supports procurement of at least 20 GW of RE by 2030 in its outline of the country’s development path.
■ Integrated Energy Plan (IEP): this deals with the general energy plan for the country, while the IRP focuses specifically on electricity generation. The IEP looks into energy security, access to energy, reducing cost of energy supply, energy efficiency, localisation and sustainability in all energy matters.
■ IRP 2010 – 2030 (and revisions thereof): this lays out the country’s electricity mix plan, from the timing to the sourcing of new generation capacity.
■ Green economy accord: this accord, between government, labour and business seeks to shift the country’s economy towards sustainable development, creation of green jobs and industrial development.
■ Local procurement accord: as the economy grows and the country industrialises, this accord sets an aspirational target of 75% of all products used in the country to be manufactured locally. This is particularly evident in the REIPPPP’s local content rules.
3 –Policies and regulation
22 Renewable Energy Sector: Market Intelligence Report 2016
This section covers key opportunities and barriers to their achievement. These include opportunities arising from local content and socio-economic development requirements, market opportunities emerging in the rest of the continent, and barriers
arising from Eskom connection issues.
4 –Opportunities and barriers
These insights are the culmination of a continuous market research process based heavily on interactions with key industry stakeholders ranging from successful IPPs, economic development managers involved in socio-economic development work, original equipment manufacturers (OEMs), to a host of related government departments such as the dti, the IPP office and National Treasury.
4.1. Local contentThe REIPPPP’s local content requirements present a significant investment opportunity of R65 billion8 for both local and international players that include, amongst others:
■ OEMs ■ Contract manufacturers ■ Local equipment suppliers ■ Local and international investors ■ Local skills base (in terms of skills transfer) ■ Academic and research institutions
(in terms of skills and technology transfer)
–Local content requirements present an investment opportunity of R65 billion, ensuring that c.45% of spend on project construction and operation is captured nationally.
The inclusion of a local content requirement in the REIPPPP has ensured that the country will capture an estimated 45% of spend on project construction and operation. To date, c.R21.7 billion has actually been spent on local content in the construction and operation of mostly round 1 – 3 projects (IPP Office 2015).
The need to procure locally manufactured or assembled goods plays well into other government industrialisation programmes such as the dti’s black industrialists programme and the SEZs mentioned in section 5.1.
A wind localisation study commissioned by the dti (2014) indicates that there is potential to localise wind energy technology, which could result in the setting up of:
■ Between one and five wind tower manufacturing facilities. Two have already been established
■ One blade manufacturing facility and one facility to assemble nacelles and hubs
Were these components to be manufactured locally, they would assist many successful projects within the REIPPPP to easily achieve their local content targets. This would ensure that a larger portion of investments being made into the programme are captured by the South African economy. A similar localisation study for solar PV has been done and evidence for the feasibility lies in the presence of at least five solar PV component manufacturing facilities in South Africa, predominantly in the Western Cape.
8 For rounds 1 – 4 preferred bids
Renewable Energy Sector: Market Intelligence Report 2016 23
The opportunity for investors in local manufacturing is not limited to the South African RE market alone, but also encompasses regional RE markets – such as the Southern African Development Community (SADC) - detailed in section 4.3.
Increasing local content requirements, however, also present a challenge to OEMs and EPCs that are often in charge of ensuring that local content targets are met. Numerous players have expressed concerns about the ability of the market to actually achieve the committed amounts. Such a failure in the programme would jeopardize the REIPPPP’s legitimacy. The ability of the programme to demonstrate the investment it has captured is paramount to its continued support from private and public sector, and so it is essential to ensure that the targets set are feasible and commitments made are honoured. There is an increasing risk of non-compliance with local content commitments by selected bidders, challenging the programme to implement its termination system. This is more relevant now, given the Ministerial determination allowing for the procurement of a further 6 300 MWp.
4.2. Socio-economic development in the REIPPPPSocio-economic development (SED) and enterprise development (ED) requirements present opportunities to local community projects (who may receive support from REIPPPP projects), for local economies and to IPPs. The latter stand to benefit at bidding stages by offering a competitive bidding strategy, while at the implementation stage, benefit from improved community goodwill. Community goodwill is increasingly important as there is greater community awareness of the potential benefits that may be accrued from successful projects.
A higher level opportunity is also presented to the renewable energy industry as a whole. Depending on how this community development is executed, it garners continued support for itself from the community and government. The challenge to successful projects is ensuring that visible and meaningful benefits flow into surrounding communities. To this end, both the wind energy and solar PV industry associations have formed a joint working group focusing on this very matter.
The opportunity that SED and ED present to the RE sector, beyond appeasing expectations from communities and other stakeholders, is to further develop itself. If, in fulfilling their enterprise and socio-economic development obligations, IPPs can support green economy-related businesses, such
as embedded generation and energy efficiency businesses for example, then the sector as a whole sees more economic growth. An example of this is the home improvement and job creation programme being conducted in the community of Hopefield, as part of the Hopefield wind farm SED-ED initiative. The ultimate opportunity here lies in the ability for the renewable energy industry as a whole to support its own value chain through the procurement, for example, of solar PV systems (for embedded generation and off-grid applications in communities), solar water heaters and energy efficiency lighting.
4.3. African market opportunitiesInvestors and businesses already active in South Africa have access to opportunities in the South African Development Community (SADC) region and beyond. This is the case for all players in the value chain highlighted in section 2.2 that have presence in South Africa.
The insights that follow should allow investors to take a view on a larger market, ideally improving the business case for a move into the region – increasingly true given the various regional efforts being made to develop the energy infrastructure sector, with a keen focus on RE.
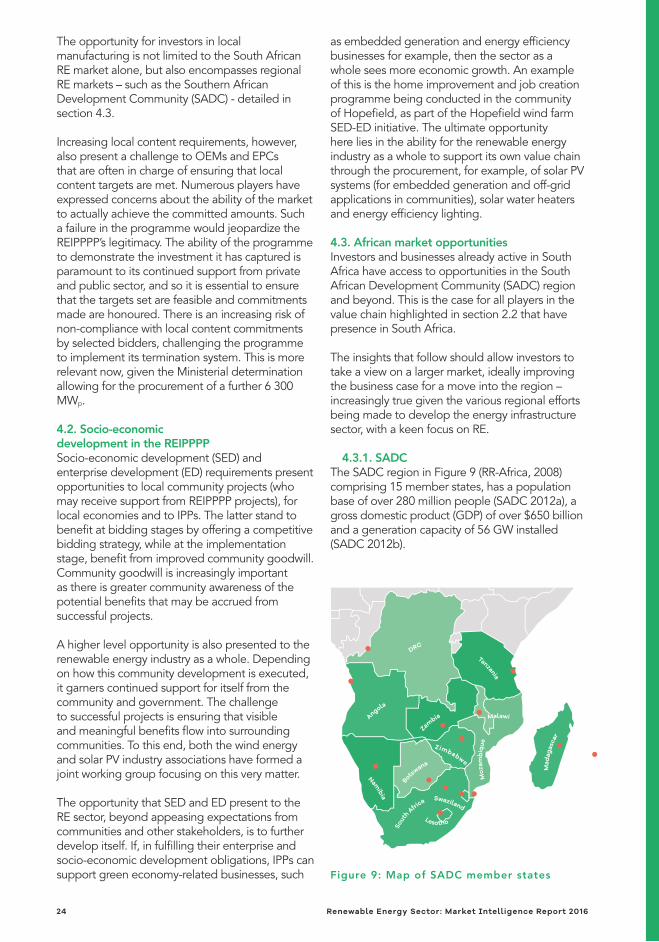
4.3.1. SADCThe SADC region in Figure 9 (RR-Africa, 2008) comprising 15 member states, has a population base of over 280 million people (SADC 2012a), a gross domestic product (GDP) of over $650 billion and a generation capacity of 56 GW installed (SADC 2012b).
Figure 9: Map of SADC member states
Lesotho
South
Afri
ca Swaziland
Namibia
Botswana
Angola
Zambia
Zimbabwe
DRC
Mad
agas
car
Moz
amb
ique
Tanzania
Malawi
24 Renewable Energy Sector: Market Intelligence Report 2016
SADC member state
Opportunity maturity Size of opportunity or resource availability
Botswana
■ Energy policy in drafting process – due in 2015 ■ Botswana solar resource: ■ 3 200 hours of sunshine ■ average insulation of 21
MJ/m2 (World Bank 2015)
Namibia
■ Country has introduced a renewable energy Feed-In-Tariff (REFIT) for projects up to 5 MW (Nampower 2015)
■ Various power purchase agreements (PPAs) allocated to solar PV IPPs
■ Interest in concentrated solar power (CSP)
■ At least one 5 MW solar PV installation in place
■ 70 MW of solar PV projects under consideration
Tanzania
■ Experience with IPPs in numerous technologies ■ Standardised power purchase agreements in
place ■ FITs for solar PV and wind in place since
2008 (AHK 2013), with a competitive bidding component
■ Market covers off-grid rural systems, to utility scale projects
■ First utility scale project, 50 MW wind farm, recently agreed upon (located in Singida region) (REN21 2015)
■ The government has set up a small power producer framework for facilities up to 10 MWp (REN21 2015)
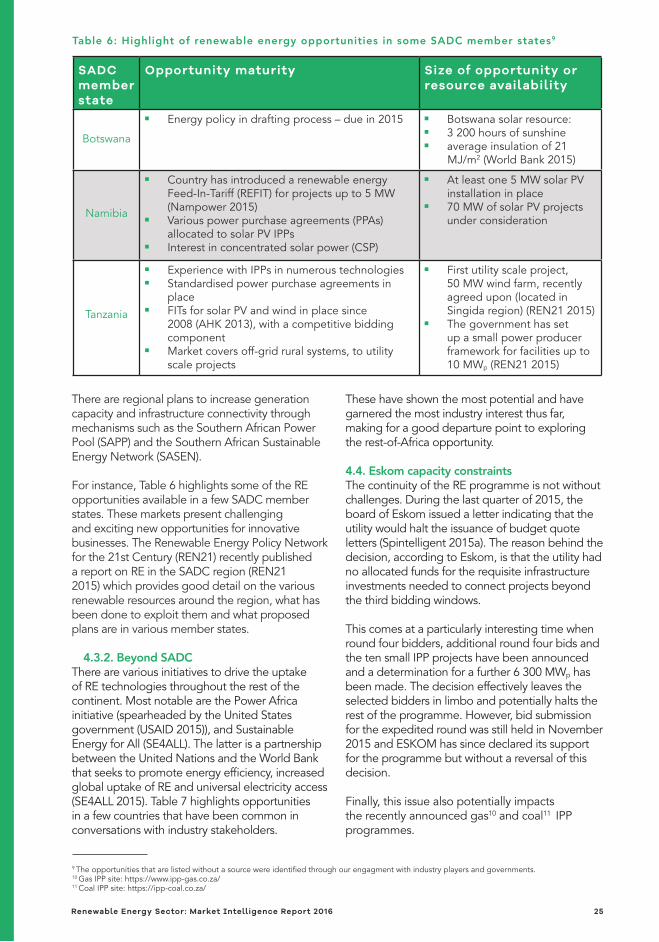
Table 6: Highlight of renewable energy opportunities in some SADC member states9
9 The opportunities that are listed without a source were identified through our engagment with industry players and governments.10 Gas IPP site: https://www.ipp-gas.co.za/11 Coal IPP site: https://ipp-coal.co.za/
There are regional plans to increase generation capacity and infrastructure connectivity through mechanisms such as the Southern African Power Pool (SAPP) and the Southern African Sustainable Energy Network (SASEN).
For instance, Table 6 highlights some of the RE opportunities available in a few SADC member states. These markets present challenging and exciting new opportunities for innovative businesses. The Renewable Energy Policy Network for the 21st Century (REN21) recently published a report on RE in the SADC region (REN21 2015) which provides good detail on the various renewable resources around the region, what has been done to exploit them and what proposed plans are in various member states.
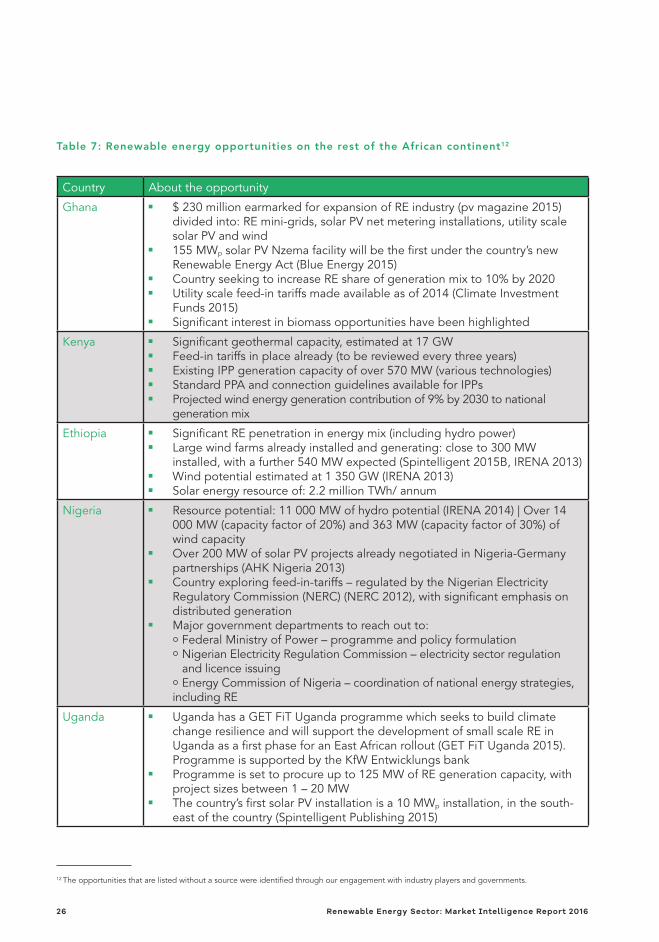
4.3.2. Beyond SADCThere are various initiatives to drive the uptake of RE technologies throughout the rest of the continent. Most notable are the Power Africa initiative (spearheaded by the United States government (USAID 2015)), and Sustainable Energy for All (SE4ALL). The latter is a partnership between the United Nations and the World Bank that seeks to promote energy efficiency, increased global uptake of RE and universal electricity access (SE4ALL 2015). Table 7 highlights opportunities in a few countries that have been common in conversations with industry stakeholders.
These have shown the most potential and have garnered the most industry interest thus far, making for a good departure point to exploring the rest-of-Africa opportunity.
4.4. Eskom capacity constraintsThe continuity of the RE programme is not without challenges. During the last quarter of 2015, the board of Eskom issued a letter indicating that the utility would halt the issuance of budget quote letters (Spintelligent 2015a). The reason behind the decision, according to Eskom, is that the utility had no allocated funds for the requisite infrastructure investments needed to connect projects beyond the third bidding windows.
This comes at a particularly interesting time when round four bidders, additional round four bids and the ten small IPP projects have been announced and a determination for a further 6 300 MWp has been made. The decision effectively leaves the selected bidders in limbo and potentially halts the rest of the programme. However, bid submission for the expedited round was still held in November 2015 and ESKOM has since declared its support for the programme but without a reversal of this decision.
Finally, this issue also potentially impacts the recently announced gas10 and coal11 IPP programmes.
Renewable Energy Sector: Market Intelligence Report 2016 25
Country About the opportunity
Ghana ■ $ 230 million earmarked for expansion of RE industry (pv magazine 2015) divided into: RE mini-grids, solar PV net metering installations, utility scale solar PV and wind
■ 155 MWp solar PV Nzema facility will be the first under the country’s new Renewable Energy Act (Blue Energy 2015)
■ Country seeking to increase RE share of generation mix to 10% by 2020 ■ Utility scale feed-in tariffs made available as of 2014 (Climate Investment
Funds 2015) ■ Significant interest in biomass opportunities have been highlighted
Kenya ■ Significant geothermal capacity, estimated at 17 GW ■ Feed-in tariffs in place already (to be reviewed every three years) ■ Existing IPP generation capacity of over 570 MW (various technologies) ■ Standard PPA and connection guidelines available for IPPs ■ Projected wind energy generation contribution of 9% by 2030 to national
generation mix
Ethiopia ■ Significant RE penetration in energy mix (including hydro power) ■ Large wind farms already installed and generating: close to 300 MW
installed, with a further 540 MW expected (Spintelligent 2015B, IRENA 2013) ■ Wind potential estimated at 1 350 GW (IRENA 2013) ■ Solar energy resource of: 2.2 million TWh/ annum
Nigeria ■ Resource potential: 11 000 MW of hydro potential (IRENA 2014) | Over 14 000 MW (capacity factor of 20%) and 363 MW (capacity factor of 30%) of wind capacity
■ Over 200 MW of solar PV projects already negotiated in Nigeria-Germany partnerships (AHK Nigeria 2013)
■ Country exploring feed-in-tariffs – regulated by the Nigerian Electricity Regulatory Commission (NERC) (NERC 2012), with significant emphasis on distributed generation
■ Major government departments to reach out to: Federal Ministry of Power – programme and policy formulation Nigerian Electricity Regulation Commission – electricity sector regulation and licence issuing Energy Commission of Nigeria – coordination of national energy strategies,
including RE
Uganda ■ Uganda has a GET FiT Uganda programme which seeks to build climate change resilience and will support the development of small scale RE in Uganda as a first phase for an East African rollout (GET FiT Uganda 2015). Programme is supported by the KfW Entwicklungs bank
■ Programme is set to procure up to 125 MW of RE generation capacity, with project sizes between 1 – 20 MW
■ The country’s first solar PV installation is a 10 MWp installation, in the south-east of the country (Spintelligent Publishing 2015)
Table 7: Renewable energy opportunities on the rest of the African continent12
12 The opportunities that are listed without a source were identified through our engagement with industry players and governments.
26 Renewable Energy Sector: Market Intelligence Report 2016

© Jeffrey Barbee, allianceearth.org/GreenCape
Renewable Energy Sector: Market Intelligence Report 2016 27
A range of funding solutions are either focused on, or available to, greentech manufacturers and service companies, as well as those who use such services. This range covers Development Finance Institutions, local public and private sector financiers
and investors, and a considerable range of tax incentives.
5 –Funding and incentives
According to the KPMG Green Tax Index, South Africa ranks 13th out of 21 countries to use tax as an incentive to drive the green growth agenda (ahead of Australia, Singapore and Finland). As well as understanding the various incentive and funding options available to them, investors and suppliers of greentech solutions can also benefit from understanding those available to their customers or clients, as these can influence the viability and attractiveness of their products and projects.
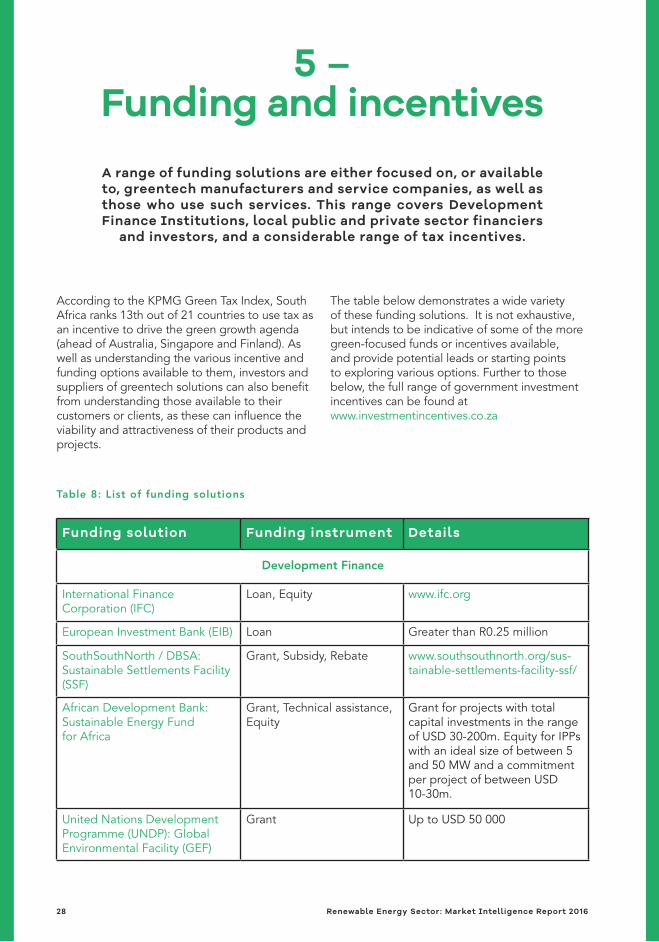
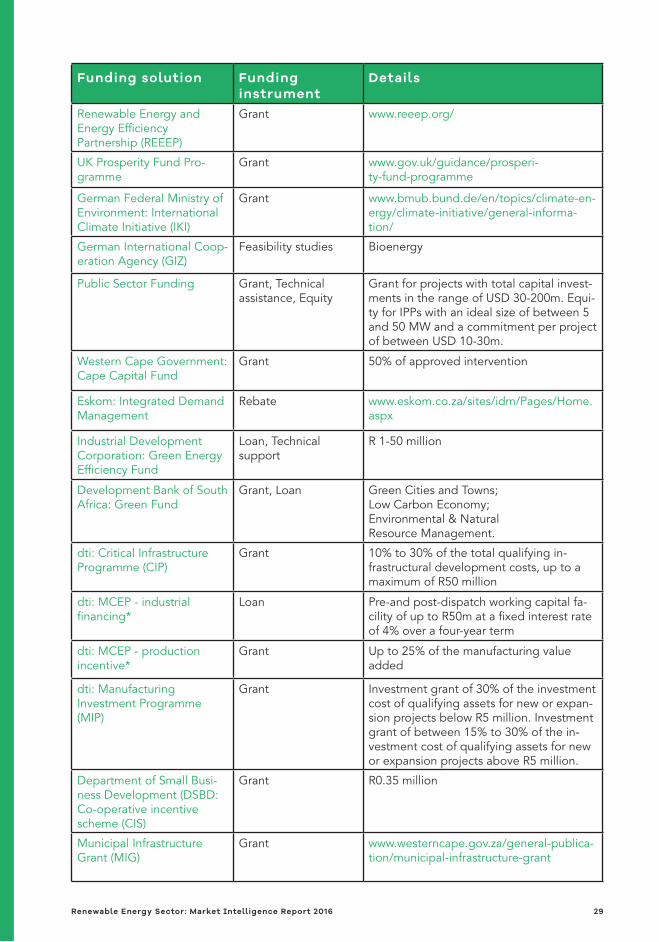
The table below demonstrates a wide variety of these funding solutions. It is not exhaustive, but intends to be indicative of some of the more green-focused funds or incentives available, and provide potential leads or starting points to exploring various options. Further to those below, the full range of government investment incentives can be found at www.investmentincentives.co.za
Funding solution Funding instrument Details
Development Finance
International Finance Corporation (IFC)
Loan, Equity www.ifc.org
European Investment Bank (EIB) Loan Greater than R0.25 million
SouthSouthNorth / DBSA: Sustainable Settlements Facility (SSF)
Grant, Subsidy, Rebate www.southsouthnorth.org/sus-tainable-settlements-facility-ssf/
African Development Bank: Sustainable Energy Fund for Africa
Grant, Technical assistance, Equity
Grant for projects with total capital investments in the range of USD 30-200m. Equity for IPPs with an ideal size of between 5 and 50 MW and a commitment per project of between USD 10-30m.
United Nations Development Programme (UNDP): Global Environmental Facility (GEF)
Grant Up to USD 50 000
Table 8: List of funding solutions
28 Renewable Energy Sector: Market Intelligence Report 2016
Funding solution Fundinginstrument
Details
Renewable Energy and Energy Efficiency Partnership (REEEP)
Grant www.reeep.org/
UK Prosperity Fund Pro-gramme
Grant www.gov.uk/guidance/prosperi-ty-fund-programme
German Federal Ministry of Environment: International Climate Initiative (IKI)
Grant www.bmub.bund.de/en/topics/climate-en-ergy/climate-initiative/general-informa-tion/
German International Coop-eration Agency (GIZ)
Feasibility studies Bioenergy
Public Sector Funding Grant, Technical assistance, Equity
Grant for projects with total capital invest-ments in the range of USD 30-200m. Equi-ty for IPPs with an ideal size of between 5 and 50 MW and a commitment per project of between USD 10-30m.
Western Cape Government: Cape Capital Fund
Grant 50% of approved intervention
Eskom: Integrated Demand Management
Rebate www.eskom.co.za/sites/idm/Pages/Home.aspx
Industrial Development Corporation: Green EnergyEfficiency Fund
Loan, Technical support
R 1-50 million
Development Bank of South Africa: Green Fund
Grant, Loan Green Cities and Towns; Low Carbon Economy; Environmental & Natural Resource Management.
dti: Critical Infrastructure Programme (CIP)
Grant 10% to 30% of the total qualifying in-frastructural development costs, up to a maximum of R50 million
dti: MCEP - industrial financing*
Loan Pre-and post-dispatch working capital fa-cility of up to R50m at a fixed interest rate of 4% over a four-year term
dti: MCEP - production incentive*
Grant Up to 25% of the manufacturing value added
dti: Manufacturing Investment Programme (MIP)
Grant Investment grant of 30% of the investment cost of qualifying assets for new or expan-sion projects below R5 million. Investment grant of between 15% to 30% of the in-vestment cost of qualifying assets for new or expansion projects above R5 million.
Department of Small Busi-ness Development (DSBD: Co-operative incentive scheme (CIS)
Grant R0.35 million
Municipal Infrastructure Grant (MIG)
Grant www.westerncape.gov.za/general-publica-tion/municipal-infrastructure-grant
Renewable Energy Sector: Market Intelligence Report 2016 29
Funding solution Funding instrument
Details
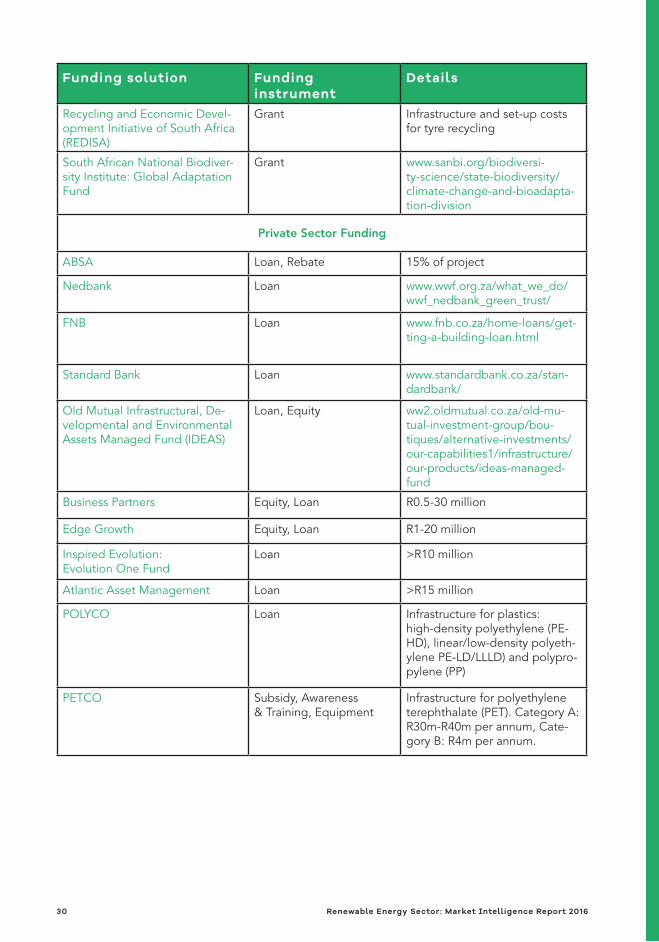
Recycling and Economic Devel-opment Initiative of South Africa (REDISA)
Grant Infrastructure and set-up costs for tyre recycling
South African National Biodiver-sity Institute: Global Adaptation Fund
Grant www.sanbi.org/biodiversi-ty-science/state-biodiversity/climate-change-and-bioadapta-tion-division
Private Sector Funding
ABSA Loan, Rebate 15% of project
Nedbank Loan www.wwf.org.za/what_we_do/wwf_nedbank_green_trust/
FNB Loan www.fnb.co.za/home-loans/get-ting-a-building-loan.html
Standard Bank Loan www.standardbank.co.za/stan-dardbank/
Old Mutual Infrastructural, De-velopmental and Environmental Assets Managed Fund (IDEAS)
Loan, Equity ww2.oldmutual.co.za/old-mu-tual-investment-group/bou-tiques/alternative-investments/our-capabilities1/infrastructure/our-products/ideas-managed-fund
Business Partners Equity, Loan R0.5-30 million
Edge Growth Equity, Loan R1-20 million
Inspired Evolution: Evolution One Fund
Loan >R10 million
Atlantic Asset Management Loan >R15 million
POLYCO Loan Infrastructure for plastics: high-density polyethylene (PE-HD), linear/low-density polyeth-ylene PE-LD/LLLD) and polypro-pylene (PP)
PETCO Subsidy, Awareness & Training, Equipment
Infrastructure for polyethylene terephthalate (PET). Category A: R30m-R40m per annum, Cate-gory B: R4m per annum.
30 Renewable Energy Sector: Market Intelligence Report 2016
Funding solution Funding instrument
Details
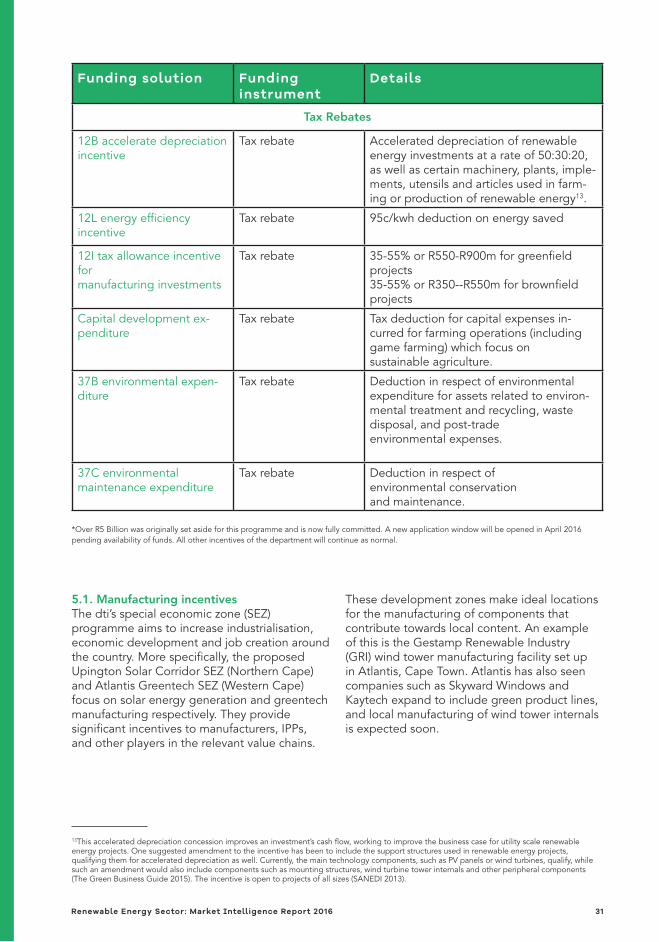
Tax Rebates
12B accelerate depreciation incentive
Tax rebate Accelerated depreciation of renewable energy investments at a rate of 50:30:20, as well as certain machinery, plants, imple-ments, utensils and articles used in farm-ing or production of renewable energy13.
12L energy efficiency incentive
Tax rebate 95c/kwh deduction on energy saved
12I tax allowance incentive for manufacturing investments
Tax rebate 35-55% or R550-R900m for greenfield projects35-55% or R350--R550m for brownfield projects
Capital development ex-penditure
Tax rebate Tax deduction for capital expenses in-curred for farming operations (including game farming) which focus on sustainable agriculture.
37B environmental expen-diture
Tax rebate Deduction in respect of environmental expenditure for assets related to environ-mental treatment and recycling, waste disposal, and post-trade environmental expenses.
37C environmental maintenance expenditure
Tax rebate Deduction in respect of environmental conservation and maintenance.
13This accelerated depreciation concession improves an investment’s cash flow, working to improve the business case for utility scale renewable energy projects. One suggested amendment to the incentive has been to include the support structures used in renewable energy projects, qualifying them for accelerated depreciation as well. Currently, the main technology components, such as PV panels or wind turbines, qualify, while such an amendment would also include components such as mounting structures, wind turbine tower internals and other peripheral components (The Green Business Guide 2015). The incentive is open to projects of all sizes (SANEDI 2013).
*Over R5 Billion was originally set aside for this programme and is now fully committed. A new application window will be opened in April 2016 pending availability of funds. All other incentives of the department will continue as normal.
5.1. Manufacturing incentivesThe dti’s special economic zone (SEZ) programme aims to increase industrialisation, economic development and job creation around the country. More specifically, the proposed Upington Solar Corridor SEZ (Northern Cape) and Atlantis Greentech SEZ (Western Cape) focus on solar energy generation and greentech manufacturing respectively. They provide significant incentives to manufacturers, IPPs, and other players in the relevant value chains.
These development zones make ideal locations for the manufacturing of components that contribute towards local content. An example of this is the Gestamp Renewable Industry (GRI) wind tower manufacturing facility set up in Atlantis, Cape Town. Atlantis has also seen companies such as Skyward Windows and Kaytech expand to include green product lines, and local manufacturing of wind tower internals is expected soon.
Renewable Energy Sector: Market Intelligence Report 2016 31

© Jeffrey Barbee, allianceearth.org/GreenCape
32 Renewable Energy Sector: Market Intelligence Report 2016
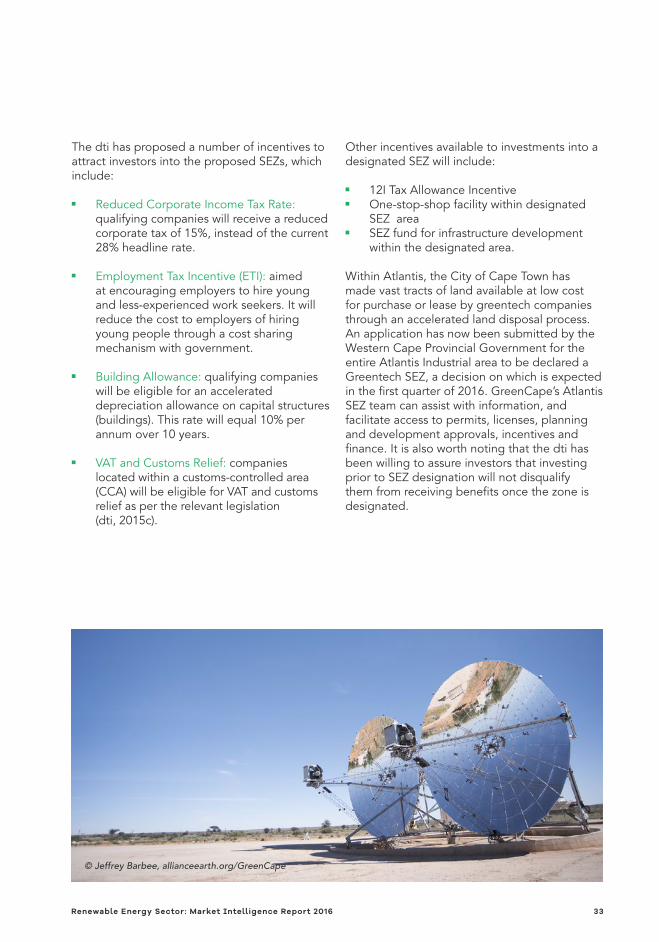
© Jeffrey Barbee, allianceearth.org/GreenCape
The dti has proposed a number of incentives to attract investors into the proposed SEZs, which include:
■ Reduced Corporate Income Tax Rate: qualifying companies will receive a reduced corporate tax of 15%, instead of the current 28% headline rate.
■ Employment Tax Incentive (ETI): aimed at encouraging employers to hire young and less-experienced work seekers. It will reduce the cost to employers of hiring young people through a cost sharing mechanism with government.
■ Building Allowance: qualifying companies will be eligible for an accelerated depreciation allowance on capital structures (buildings). This rate will equal 10% per annum over 10 years.
■ VAT and Customs Relief: companies located within a customs-controlled area (CCA) will be eligible for VAT and customs relief as per the relevant legislation (dti, 2015c).
Other incentives available to investments into a designated SEZ will include:
■ 12I Tax Allowance Incentive ■ One-stop-shop facility within designated
SEZ area ■ SEZ fund for infrastructure development
within the designated area.
Within Atlantis, the City of Cape Town has made vast tracts of land available at low cost for purchase or lease by greentech companies through an accelerated land disposal process. An application has now been submitted by the Western Cape Provincial Government for the entire Atlantis Industrial area to be declared a Greentech SEZ, a decision on which is expected in the first quarter of 2016. GreenCape’s Atlantis SEZ team can assist with information, and facilitate access to permits, licenses, planning and development approvals, incentives and finance. It is also worth noting that the dti has been willing to assure investors that investing prior to SEZ designation will not disqualify them from receiving benefits once the zone is designated.
Renewable Energy Sector: Market Intelligence Report 2016 33
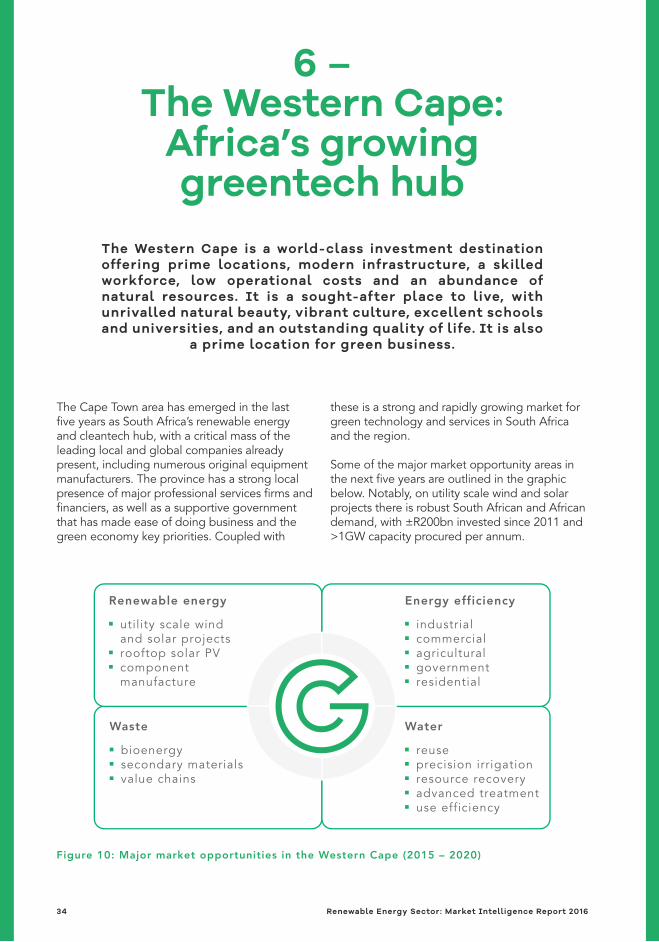
Renewable energy
■ utility scale wind and solar projects
■ rooftop solar PV ■ component
manufacture
Waste
■ bioenergy ■ secondary materials ■ value chains
Water
■ reuse ■ precision irrigation ■ resource recovery ■ advanced treatment ■ use efficiency
Energy efficiency
■ industrial ■ commercial ■ agricultural ■ government ■ residential
The Western Cape is a world-class investment destination offering prime locations, modern infrastructure, a skilled workforce, low operational costs and an abundance of natural resources. It is a sought-after place to live, with unrivalled natural beauty, vibrant culture, excellent schools and universities, and an outstanding quality of life. It is also
a prime location for green business.
6 –The Western Cape:
Africa’s growing greentech hub
The Cape Town area has emerged in the last five years as South Africa’s renewable energy and cleantech hub, with a critical mass of the leading local and global companies already present, including numerous original equipment manufacturers. The province has a strong local presence of major professional services firms and financiers, as well as a supportive government that has made ease of doing business and the green economy key priorities. Coupled with
these is a strong and rapidly growing market for green technology and services in South Africa and the region.
Some of the major market opportunity areas in the next five years are outlined in the graphic below. Notably, on utility scale wind and solar projects there is robust South African and African demand, with ±R200bn invested since 2011 and >1GW capacity procured per annum.
Figure 10: Major market opportunities in the Western Cape (2015 – 2020)
34 Renewable Energy Sector: Market Intelligence Report 2016
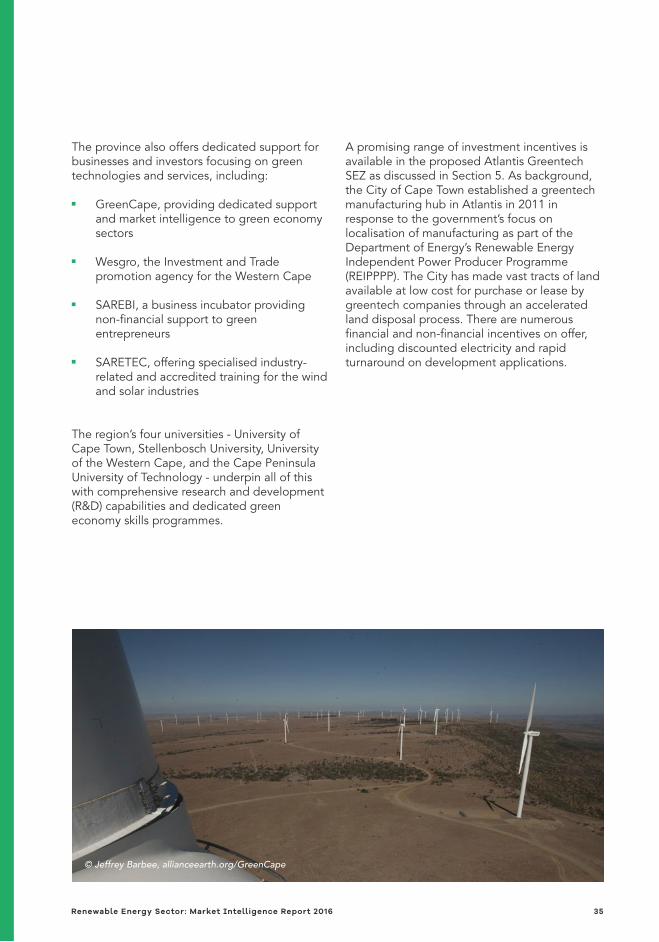
The province also offers dedicated support for businesses and investors focusing on green technologies and services, including:
■ GreenCape, providing dedicated support and market intelligence to green economy sectors
■ Wesgro, the Investment and Trade promotion agency for the Western Cape
■ SAREBI, a business incubator providing non-financial support to green entrepreneurs
■ SARETEC, offering specialised industry-related and accredited training for the wind and solar industries
The region’s four universities - University of Cape Town, Stellenbosch University, University of the Western Cape, and the Cape Peninsula University of Technology - underpin all of this with comprehensive research and development (R&D) capabilities and dedicated green economy skills programmes.
A promising range of investment incentives is available in the proposed Atlantis Greentech SEZ as discussed in Section 5. As background, the City of Cape Town established a greentech manufacturing hub in Atlantis in 2011 in response to the government’s focus on localisation of manufacturing as part of the Department of Energy’s Renewable Energy Independent Power Producer Programme (REIPPPP). The City has made vast tracts of land available at low cost for purchase or lease by greentech companies through an accelerated land disposal process. There are numerous financial and non-financial incentives on offer, including discounted electricity and rapid turnaround on development applications.
© Jeffrey Barbee, allianceearth.org/GreenCape
Renewable Energy Sector: Market Intelligence Report 2016 35
GreenCape is a non-profit organisation that was established by the Western Cape Government and City of Cape Town to support the accelerated development of the local green economy – low carbon, resource efficient and socially inclusive – and help position the Western Cape as the green economic hub of Africa.
7 –GreenCape’s support
to businesses and investors
We assist businesses in this space to remove barriers to their establishment and growth by providing our members with:
■ Free, credible and impartial market information and insights.
■ Access to networks of key players in government, industry, finance and academia.
■ An advocacy platform to help create an enabling policy and regulatory environment for green business.
Since inception in 2010, GreenCape has grown to a multi-disciplinary team of over 40 staff members, covering finance, engineering, environmental science and economics. We have facilitated and supported R13.7bn of investments in renewable energy projects and manufacturing. From these investments, more than 10 000 jobs have been created.
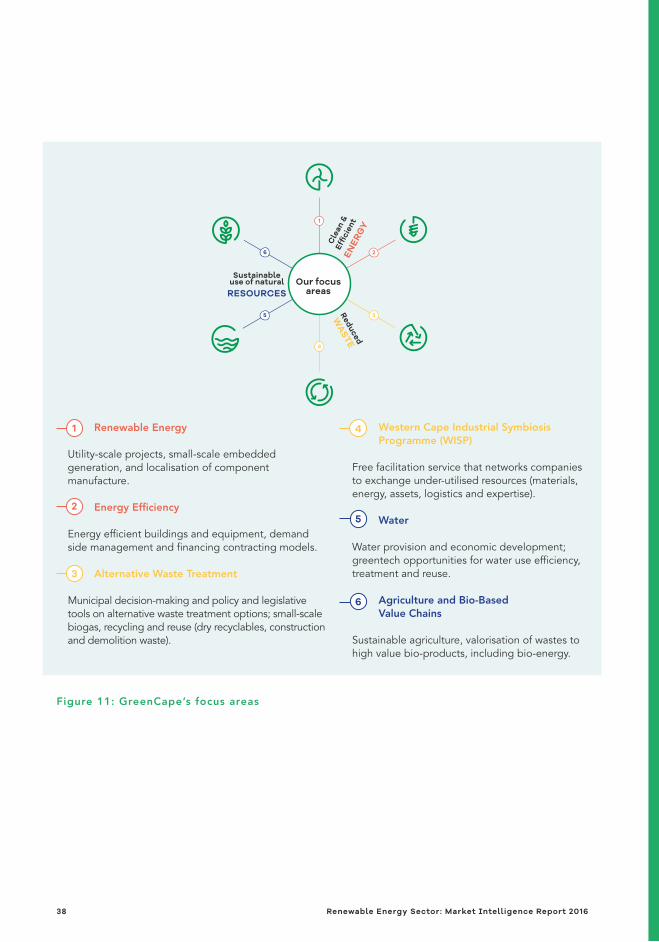
Our Market Intelligence Reports form part of a working body of information generated by sector desks and projects within GreenCape’s three main programmes – energy, waste and resources. Figure 11 below shows the different focus areas within each of our programmes.
More about GreenCape’s work in the renewable energy sectorThe Renewable Energy sector desk is part of GreenCape’s Energy Programme. The programme aims to encourage economic development and job creation through the transformation of the energy sector – both by increasing energy efficiency and the supply of cleaner energy. These two paths towards a lower carbon energy economy form the basis of GreenCape’s work in this space.
Information sharing and networking platformThroughout the year GreenCape hosts networking functions which provide a unique platform for industry to engage experts and government on issues affecting their sector. These are typically hosted at a neutral, accessible facility, free of charge to GreenCape members14, providing easy access to good quality information and great networking opportunities. Topics covered in 2015 include: clarification on changes to the dti’s codes of good practice of broad based black economic empowerment (B-BBEE) and a discussion on alternative methods to achieve more impactful socio-economic development in the REIPPPP. GreenCape presented and participated.
14 To register as a member visit our website www.greencape.co.za
36 Renewable Energy Sector: Market Intelligence Report 2016
Socio-economic development and enterprise development in the REIPPPPHaving noted various expressions of concern about the actual ability of IPPs to deliver impact in communities and therefore concerns about the ‘success’ of the REIPPPP in contributing to national developmental agenda, a discussion around the success, to date, of the SED-ED programme was launched in early 2015. Through liaising with numerous stakeholders, in conjunction with the WWF-SA, from IPPs to development practitioners to the IPP office itself, consensus was reached, on: what can actually be done through SED-ED, how it can be done and who needs to do what. This led to a workshop co-hosted by GreenCape and the WWF-SA in September 2015 where stakeholders engaged on lessons in doing SED from other sectors, best practices within the REIPPPP and what can feasibly be expected from the REIPPPP. A précis of the workshop proceedings is available online (WWF-SA 2015)
AdvocacyGreenCape is also involved in advocacy at both national and provincial government levels. Prime examples are GreenCape’s contribution to both the wind energy and solar PV localisation studies commissioned by the dti; and submission of comments on NERSA’s discussion papers and on amendments to the National Environmental Management Act (NEMA).
Benefits of becoming a GreenCape member
We currently have over 600 members, and offer free membership. Becoming a member of GreenCape will give you access to the latest information regarding developments in the various sectors; access to tools, reports, and project information; and offer you the opportunity – through our networking events – to meet and interact with various stakeholders in the green economy.
To register as a member, please visit our website, www.greencape.co.za
© Jeffrey Barbee, allianceearth.org/GreenCape
Renewable Energy Sector: Market Intelligence Report 2016 37
1
5
6 2
4
Our focus areas
3Reduced
WA
STE
Cle
an &
Effic
ient
EN
ERG
Y
Sustainableuse of naturalRESOURCES
Western Cape Industrial Symbiosis Programme (WISP)
Free facilitation service that networks companies to exchange under-utilised resources (materials, energy, assets, logistics and expertise).
Water
Water provision and economic development; greentech opportunities for water use efficiency, treatment and reuse.
Agriculture and Bio-Based Value Chains
Sustainable agriculture, valorisation of wastes to high value bio-products, including bio-energy.
Renewable Energy
Utility-scale projects, small-scale embedded generation, and localisation of component manufacture.
Energy Efficiency
Energy efficient buildings and equipment, demand side management and financing contracting models.
Alternative Waste Treatment
Municipal decision-making and policy and legislative tools on alternative waste treatment options; small-scale biogas, recycling and reuse (dry recyclables, construction and demolition waste).
1
2
3
4
5
6
Figure 11: GreenCape’s focus areas
38 Renewable Energy Sector: Market Intelligence Report 2016
8– References
AHK 2013. Target market study Tanzania: solar PV and wind power. Available from: <http://www.africansolardesigns.com/resources_32_493092621.pdf> [Accessed on 22/10/2015]
AHK Nigeria 2013. Overview on Renewable Energy Proj-ects, Feed in Regulations and Solar Energy in Nigeria. 2013. Available from: <http://nigeria.ahk.de/fileadmin/ahk_nigeria/Veranstaltungen/Renewable/Dr._Jeremy_Gaines_Renew-ables_Nigeria.pdf> [Accessed on 26/10/2015]
Blue Energy 2015. Africa’s largest solar PV power plant. Available from: <http://www.blue-energyco.com/africas-largest-solar-pv-power-plant/> [Accessed on 22/10/2015]
Climate Investment Funds 2015. SREP Investment plan for Ghana. Available from: <http://www.climateinvest-mentfunds.org/cif/sites/climateinvestmentfunds.org/files/SREP_13_4_SREP_Invest-ment_Plan_for_Ghana.pdf> [Accessed on 22/10/2015]Council of Scientific and In-dustrial Research (CSIR) 2015. Financial benefits of renew-ables in South Africa in 2015. Available from: <http://www.csir.co.za/media_releases/docs/Financial%20benefits%20of%20Wind%20and%20PV%202015.pdf> [Accessed on 16/10/2015]
Department of Trade and In-dustry (dti) 2015a. Black Indus-trialist programme. Available from: <https://www.thedti.gov.za/economic_empowerment/
Black_Industrialist.jsp> [Ac-cessed on 19/10/2015]
Department of Trade and Industry (dti) 2015b. Special economic zone (SEZ). Available from: <http://www.thedti.gov.za/industrial_development/sez.jsp> [Accessed on 20/10/2015]
Department of Trade and Industry (dti) 2015c. Industrial Development Financial Assis-tance (Incentives). Available from: <https://www.thedti.gov.za/financial_assistance/finan-cial_incentive.jsp?id=59&sub-themeid=25> [Accessed on 10/11/2015]
Department of Trade and Industry (dti) 2014. The wind energy localisation roadmap in support of large-scale roll-out in South Africa. Pretoria. South African government.
Department of Energy (DoE) 2015. Department of Ener-gy, Renewable energy IPP procurement programme: bid window 4 preferred bidders announcement, 16 April 2015. Pretoria. South African Govern-ment.
Department of Energy (DoE) 2013. Integrated Resource Plan for Electricity (IRP) 2010 -2030 Update report 2013. Available from: <http://www.doe-irp.co.za/content/IRP2010_updatea.pdf> [Ac-cessed on 27/10/2015]
Eberhard, Anton, Kolker, Joel and Leigland, James 2014. South Africa’s renew-able energy IPP procurement programme: success factors
and lessons. Available from: <http://www.gsb.uct.ac.za/files/PPIAFReport.pdf> [Ac-cessed on 16/10/2015]
Energy Blog, n.d. SA’s small scale IPP programme sees the light of day. Available from: <http://energy.org.za/reipppp/233-sa-s-small-scale-ipp-programme-sees-the-light-of-day> [Accessed on 19/10/2015]
Eskom 2015. Supply status. Available from: <http://www.eskom.co.za/Whatweredoing/SupplyStatus/Pages/Supply_Status2.aspx> [Accessed on 17/10/2015]
Eskom 2014. Generation plant mix. Available from: <http://www.eskom.co.za/AboutElectricity/FactsFigures/Documents/GX_0001Gen-erationPlantMixRev14.pdf> [Accessed 17/11/2015]
GET FiT Uganda 2015. GET FiT Uganda annual report 2014. Available from: <http://www.getfit-uganda.org/> [Ac-cessed 26/10/2015]
Govender, Jay 2015. New Ministerial determinations issues by South Africa’s Min-ister of Energy. 31 August. Available from: <https://www.cliffedekkerhofmeyr.com/en/news/publications/2015/projects/projects-and-in-frastructure-alert-31-au-gust-new-ministerial-determi-nations-issued-by-south-af-ricas-minister-of-energy.html> [Accessed 17/11/2015]
Renewable Energy Sector: Market Intelligence Report 2016 39

Government Communica-tion and Information Sys-tem (GCIS) 2015. Minister announces new 1500 MW solar project. Available from: <http://www.sanews.gov.za/south-africa/minister-announc-es-new-1500mw-solar-project> [Accessed on 20/10/2015]
Independent Power Producer (IPP) office 2015a. An over-view. Available from: <https://www.ipp-projects.co.za/Home/Publications> [Accessed on 20/10/2015]
Independent Power Producer (IPP) office 2015b. Renewable IPPPP – Bid window 4 pre-ferred bidders.
Independent Power Producer (IPP) office 2012a. Renew-able energy independent power producer procurement programme. Available from: <http://www.ipprenew-ables.co.za/> [Accessed on 16/10/2015]
Independent Power Produc-er (IPP) office 2012b. Small projects renewable energy independent power producer procurement programme. Available from: <http://www.ipp-smallprojects.co.za/> [Ac-cessed 17/10/2015]
International Renewable Energy Agency (IRENA) 2014. Renewable energy investor guide: Nigeria. Available from: <http://community.irena.org/t5/The-Market/Renew-able-Energy-Generation-Inves-tor-Guide-Nigeria/td-p/455> [Accessed on 26/10/2015]
International Renewable Energy Agency (IRENA) 2013. Ethiopian Ministry of Water and Energy, Ethiopia’s renewable energy power potential and development opportunities. Available from: <https://irena.org/Document-Downloads/events/2013/
July/Africa%20CEC%20ses-sion%203_Ministry%20of%20Water%20and%20Energy%20Ethiopia_Beyene_220613.pdf> [Accessed on 22/10/2015]
Inflation.eu 2015. Inflation South Africa 2015. Available from: <http://www.inflation.eu/inflation-rates/south-africa/historic-inflation/cpi-infla-tion-south-africa-2015.aspx> [Accessed on 9/11/2015]Nampower 2015. Namibian renewable energy feed-in-tar-iffs. Available from: <http://www.nampower.com.na/refit> [Accessed on 27/10/2015]
Noupoort Wind Farm 2015. Transportation schedule. Available from: <http://noupoortwind.co.za/construc-tion-transportation/transporta-tion-schedule/> [Accessed on 20/10/2015]
Nigerian Electricity Regulatory Commission (NERC) 2012. Multi year tariff order for the determination of the cost of electricity generation for the period 1 June 2012 to 31 May 2017. Available from: <http://www.ecowrex.org/system/files/documents/2012_mul-tiyear-tariff-order-genera-tion_nerc.pdf> [Accessed on 26/10/2015]
pv magazine 2015. Solar to play key role in Ghana’s US$230 million renewable en-ergy program. Available from: <http://www.pv-magazine.com/news/details/beitrag/so-lar-to-play-key-role-in-ghanas-us230-million-renewable-ener-gy-program_100019480/#ax-zz3pIYzcTsQ> [Accessed 22/10/2015]
Renewable Energy Network of the 21st Century (REN21) 2015. SADC renewable energy and energy efficiency status report. Available from: <http://www.ren21.net/wp-content/uploads/2015/10/REN21_
webfile.pdf> [Accessed on 2/11/2015]
Republic of South Africa (RSA) 2015. Minister Tina Joematt-Pettersson: Briefing on expansion and acceler-ation of the Independent Power Producer Procurement Programme. Available from: <http://www.gov.za/speeches/minister-tina-joemat-petters-son-briefing-expansion-and-ac-celeration-independent-pow-er> [Accessed on 16/10/2015]
RR-Africa 2008. Map of SADC region. Available from: <http://www.rr-africa.oie.int/images/sadc_map_colour_4.gif> [Ac-cessed on 22/10/2015]
SAIREC 2015. Ten more inde-pendent power bidders get the nod. Business Day. Avail-able from: <http://www.sairec.org.za/ten-more-indepen-dent-power-bidders-get-the-nod/#more-2163> [Accessed on 17/10/2015]
South African National En-ergy Development Institute (SANEDI) 2013. 12L EE TAX Incentive. Available from: http://www.sanedi.org.za/12l-ee-tax-incentive/ [Accessed on 2/09/2015].
South African National Energy Development Institute (SANE-DI) 2013. Tax incentive – 12B RE Depreciation Incentive. Available from: <http://www.sanedi.org.za/energy%20finan-ciers/tax-incentive-12b-re-de-preciation-incentive/> [Ac-cessed on 18/11/2015]
Southern African Development Community (SADC) 2012a. Documents and publications: selected indicators 2011. Available from: <http://www.sadc.int/documents-publica-tions/show/1855> [Accessed 22/10/2015]
40 Renewable Energy Sector: Market Intelligence Report 2016
Southern African Development Community (SADC) 2012b. SADC Regional Infrastructure Development Master Plan, Energy Sector Plan. Available from: <http://www.sadc.int/files/5413/5293/3528/Region-al_Infrastructure_Develop-ment_Master_Plan_Energy_Sector_Plan.pdf> [Accessed on 23/10/2015]
Spintelligent 2015a. Eskom says it fully supports REIPPPP. Available from: <http://www.esi-africa.com/eskom-says-it-fully-supports-reippp/> [Accessed on 20/10/2015]
Steyn, Lisa 2015. Metros wake up to energy shifts. Mail & Guardian. Available from: <http://mg.co.za/article/2015-05-07-metros-wake-up-to-energy-shifts> [Accessed on 16/10/2015]
Sustainable Energy for All (SE4ALL) 2015. Country level actions. Available from: <http://www.se4all.org/flag-ship-programmes/country-lev-el-actions/> [Accessed on 22/10/2015]
Urban Energy Support, n.d. Policy review of municipal renewable energy frame-work. Available from <www.cityenergy.org.za/uploads/resource_34.docx> [Accessed on 16/10/2015]
The Green Business Guide 2015. Environmental finan-cial incentives in South Africa 2013. Available from: <http://www.greenbusinessguide.co.za/environmental-financial-in-centives-in-south-africa-2013/> [Accessed on 18/11/2015]
United States Agency for Inter-national Development (USAID) 2015. Power Africa. Available from: <https://www.usaid.gov/powerafrica> [Accessed on 22/10/2015]
World Bank 2015. Renewable energy: The case for Botswa-na. Available from: <http://www.worldbank.org/en/news/feature/2014/08/11/renew-able-energy-the-case-of-bo-tswana> [Accessed 22/10/2015]
World Wide Fund for Nature South Africa (WWF-SA) 2015. WWF-SA and GreenCape workshop on improving socio-economic development and enterprise development in the REIPPPP. Available from: <http://www.wwf.org.za/what_we_do/energy/?15121/SED-workshop> [Accessed 27/10/2015]
Renewable Energy Sector: Market Intelligence Report 2016 41

42 Renewable Energy Sector: Market Intelligence Report 2016

Renewable Energy Sector: Market Intelligence Report 2016 43